Embed Size (px)
Citation preview
Financial statements and ratiosFinancial statements and ratios
PreamblePreamble
The overview of Financial Statements reveals information about past and current performance of the firm.
When combining this information with other sources, we might be able to form expectations about the firm’s future cash flows.
OutlineOutline
• The Balance Sheet
• The Income Statement
• The Statement of Cash Flows
• On ratio analysis
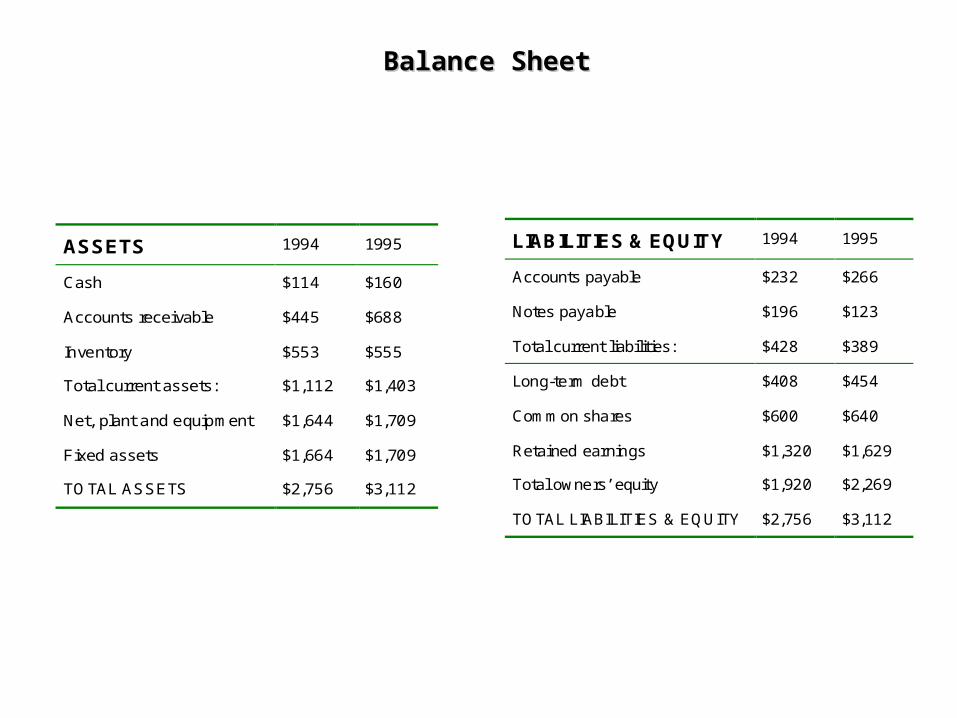
Balance SheetBalance Sheet
Financial Statement showing a firm’s accounting value on a particular date.
Balance SheetBalance Sheet
ASSETS 1994 1995
Cash
Accounts receivable
Inventory
Total current assets:
$114
$445
$553
$1,112
$160
$688
$555
$1,403
Net, plant and equipment
Fixed assets
$1,644
$1,664
$1,709
$1,709
TOTAL ASSETS $2,756 $3,112
LIABILITIES & EQUITY 1994 1995
Accounts payable
Notes payable
Total current liabilities:
$232
$196
$428
$266
$123
$389
Long-term debt $408 $454
Common shares
Retained earnings
Total owners’ equity
$600
$1,320
$1,920
$640
$1,629
$2,269
TOTAL LIABILITIES & EQUITY $2,756 $3,112
ReminderReminder
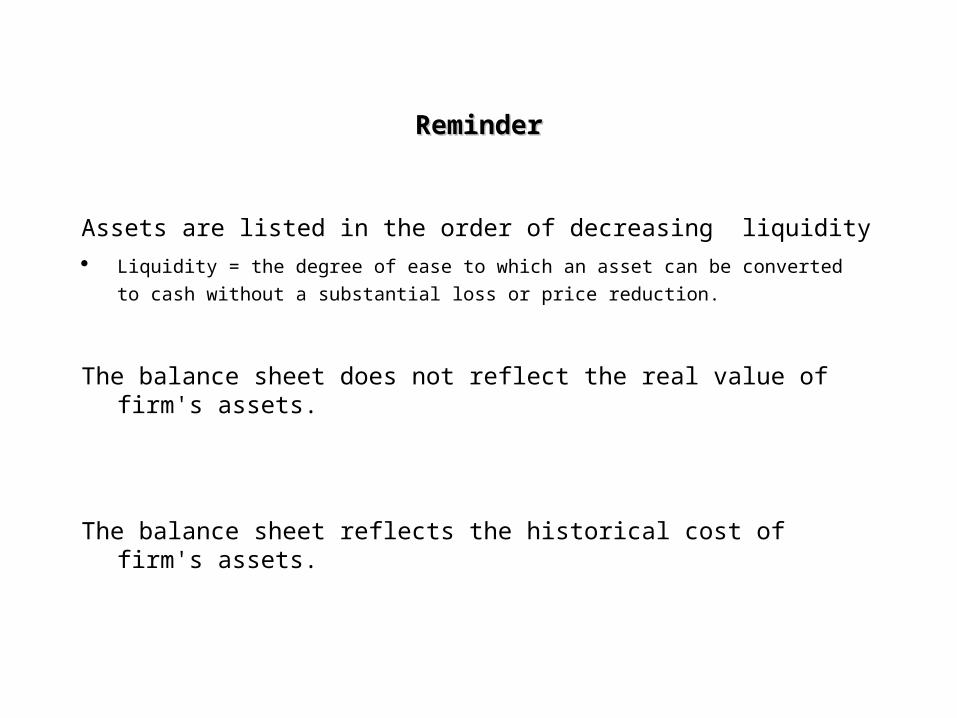
Assets are listed in the order of decreasing liquidity
Liquidity = the degree of ease to which an asset can be converted to cash without a
substantial loss or price reduction.
The balance sheet does not reflect the real value of firm's assets.
The balance sheet reflects the historical cost of firm's assets.
The Income StatementThe Income Statement
Reveals how profitable the firm is over a certain period of time.
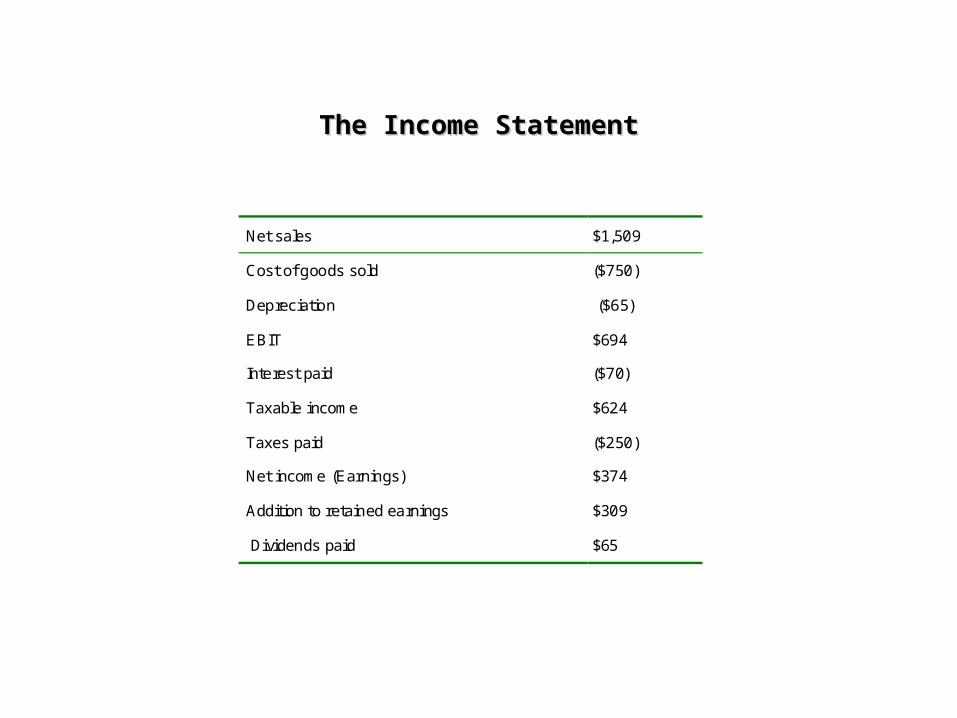
The Income StatementThe Income Statement
Net sales $1,509
Cost of goods sold ($750)
Depreciation ($65)
EBIT $694
Interest paid ($70)
Taxable income $624
Taxes paid ($250)
Net income (Earnings) $374
Addition to retained earnings $309
Dividends paid $65
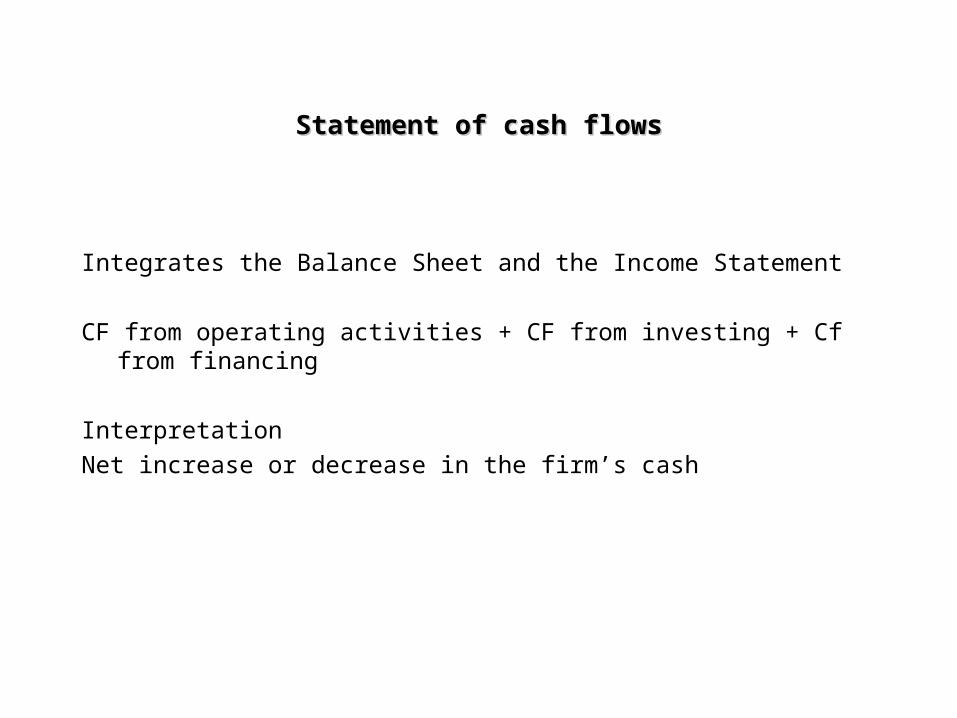
Statement of cash flowsStatement of cash flows
Integrates the Balance Sheet and the Income Statement
CF from operating activities + CF from investing + Cf from financing
Interpretation
Net increase or decrease in the firm’s cash
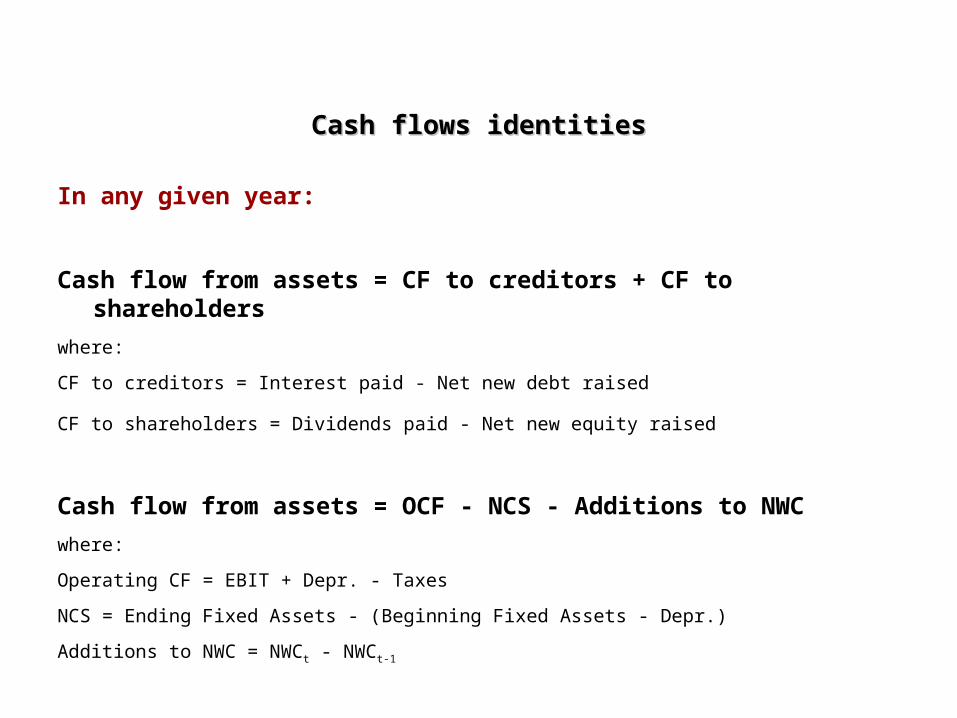
Cash flows identitiesCash flows identities
In any given year:
Cash flow from assets = CF to creditors + CF to shareholders
where:
CF to creditors = Interest paid - Net new debt raised
CF to shareholders = Dividends paid - Net new equity raised
Cash flow from assets = OCF - NCS - Additions to NWC
where:
Operating CF = EBIT + Depr. - Taxes
NCS = Ending Fixed Assets - (Beginning Fixed Assets - Depr.)
Additions to NWC = NWCt - NWCt-1
Cash flows identitiesCash flows identities
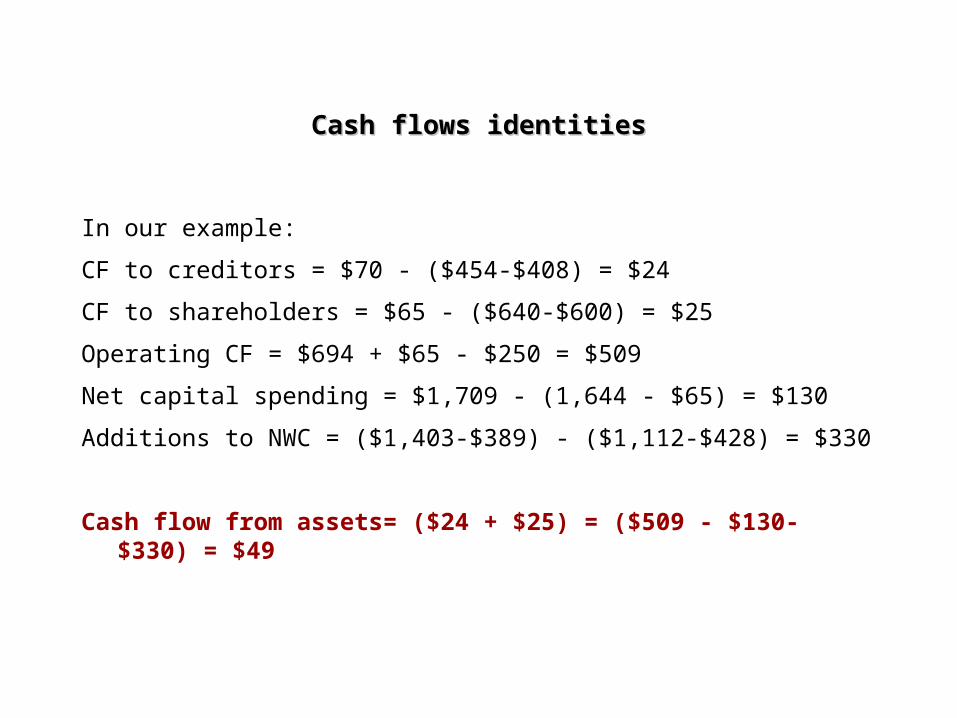
In our example:
CF to creditors = $70 - ($454-$408) = $24
CF to shareholders = $65 - ($640-$600) = $25
Operating CF = $694 + $65 - $250 = $509
Net capital spending = $1,709 - (1,644 - $65) = $130
Additions to NWC = ($1,403-$389) - ($1,112-$428) = $330
Cash flow from assets= ($24 + $25) = ($509 - $130- $330) = $49
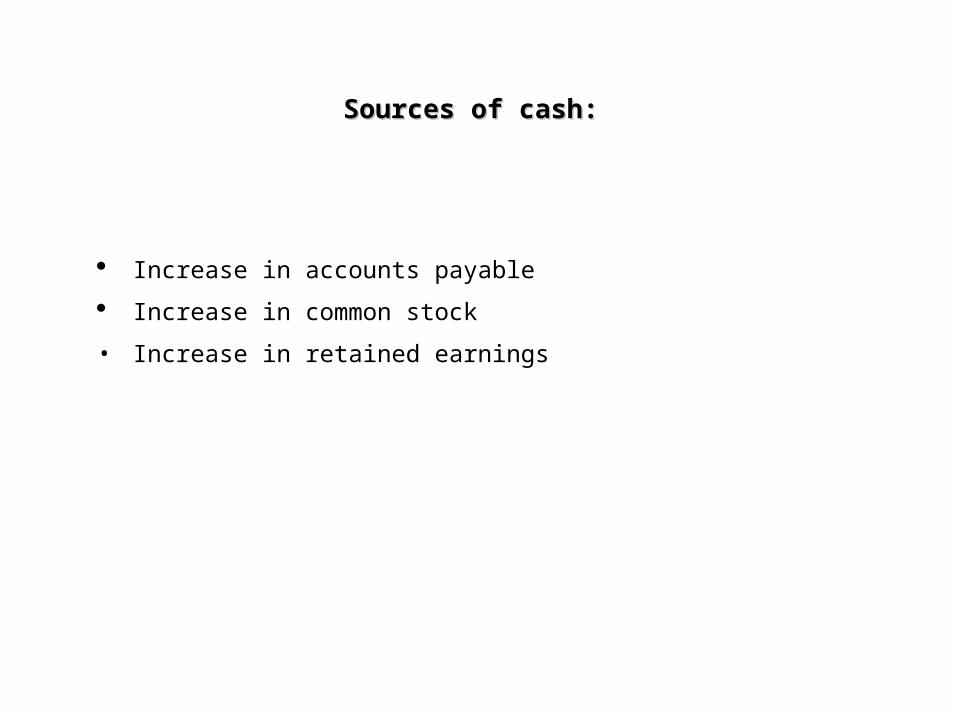
Sources of cash: Sources of cash:
Increase in accounts payable
Increase in common stock
• Increase in retained earnings
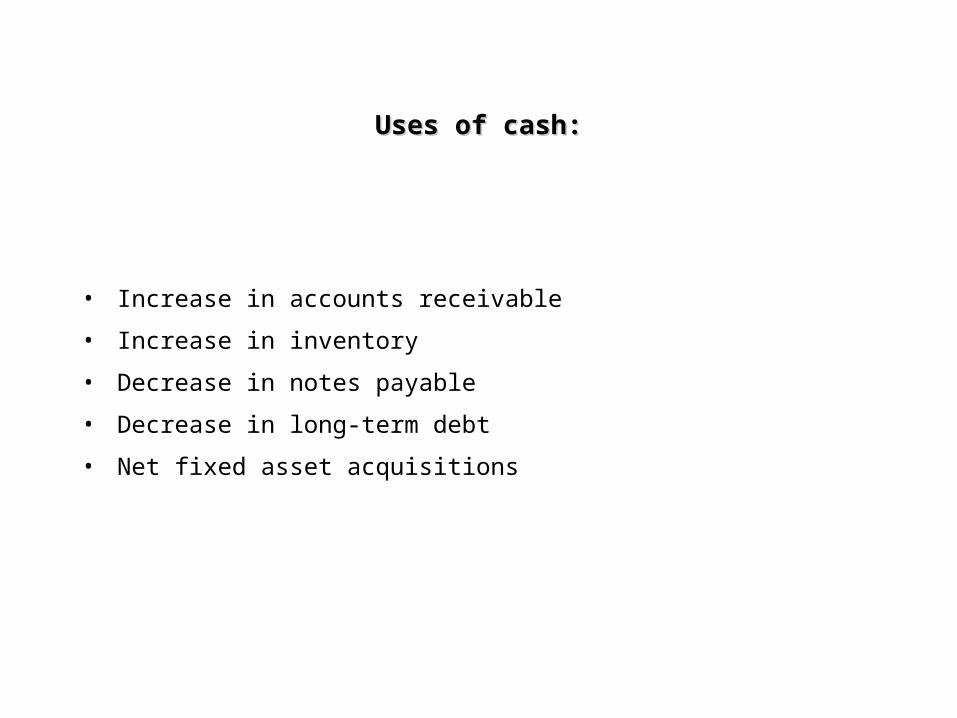
Uses of cash:Uses of cash:
• Increase in accounts receivable
• Increase in inventory
• Decrease in notes payable
• Decrease in long-term debt
• Net fixed asset acquisitions
Ratio analysisRatio analysis
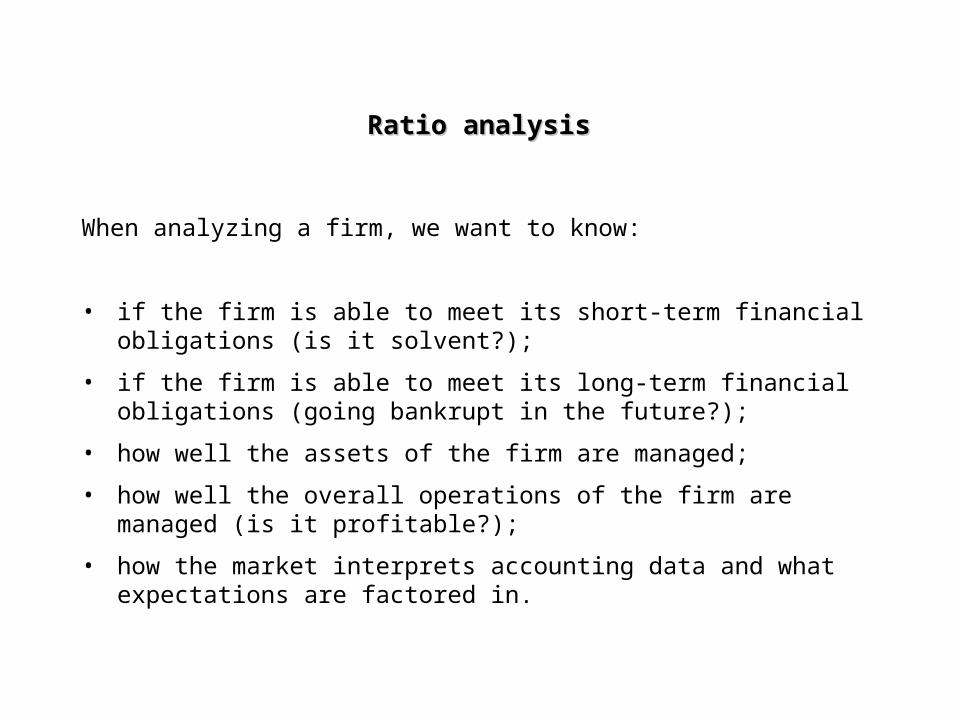
When analyzing a firm, we want to know:
• if the firm is able to meet its short-term financial obligations (is it solvent?);
• if the firm is able to meet its long-term financial obligations (going bankrupt in the future?);
• how well the assets of the firm are managed;
• how well the overall operations of the firm are managed (is it profitable?);
• how the market interprets accounting data and what expectations are factored in.
Ratio analysisRatio analysis
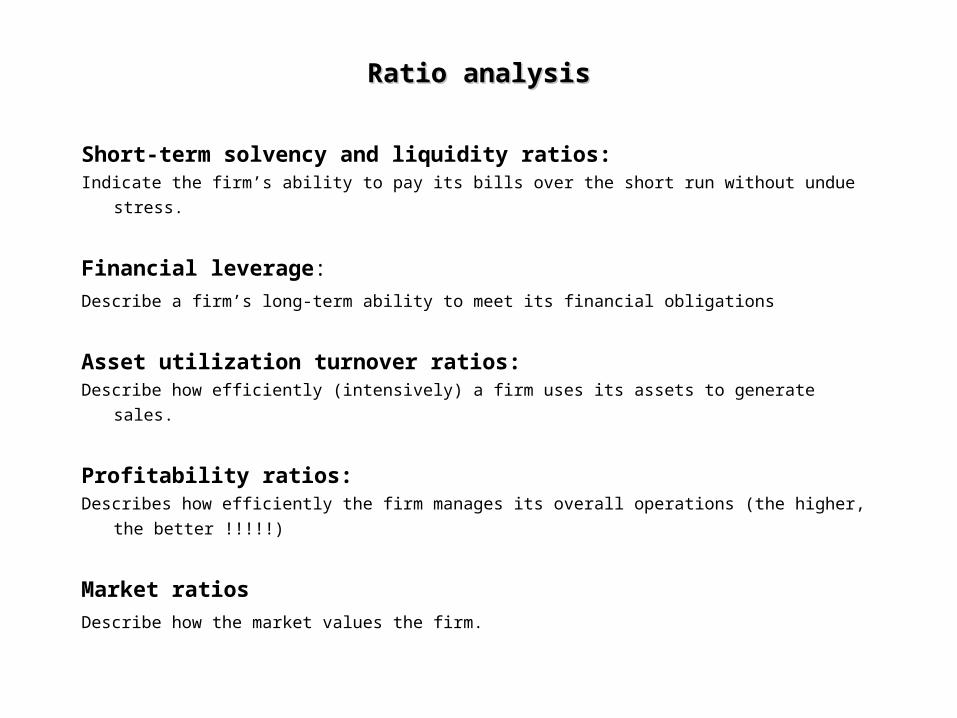
Short-term solvency and liquidity ratios:
Indicate the firm’s ability to pay its bills over the short run without undue stress.
Financial leverage:
Describe a firm’s long-term ability to meet its financial obligations
Asset utilization turnover ratios:
Describe how efficiently (intensively) a firm uses its assets to generate sales.
Profitability ratios:
Describes how efficiently the firm manages its overall operations (the higher, the better !!!!!)
Market ratios
Describe how the market values the firm.
Short-term solvency and liquidity ratiosShort-term solvency and liquidity ratios
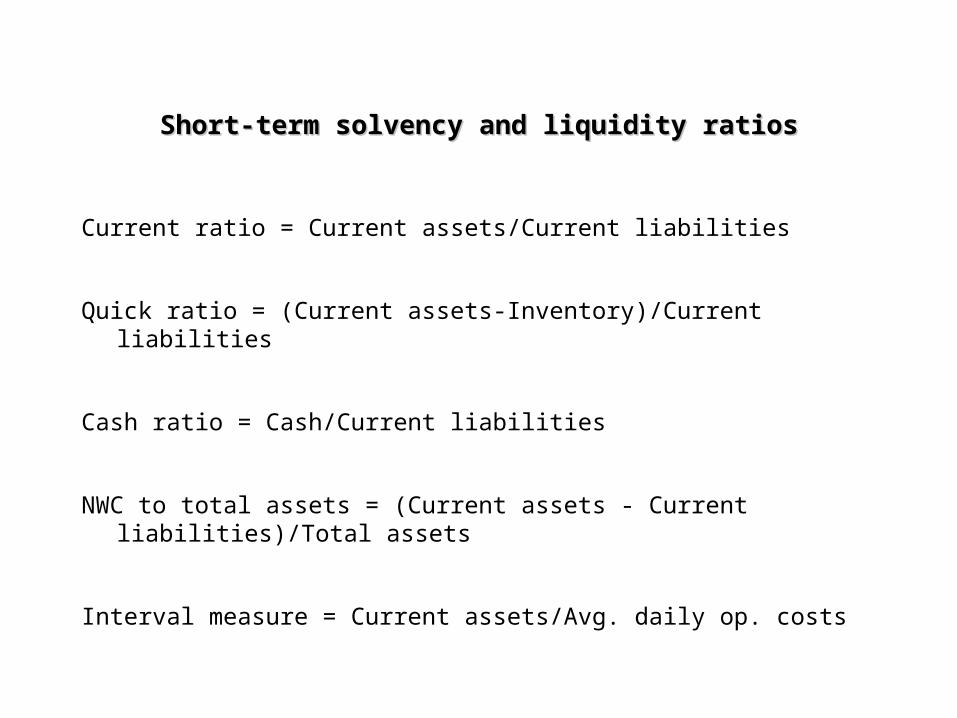
Current ratio = Current assets/Current liabilities
Quick ratio = (Current assets-Inventory)/Current liabilities
Cash ratio = Cash/Current liabilities
NWC to total assets = (Current assets - Current liabilities)/Total assets
Interval measure = Current assets/Avg. daily op. costs
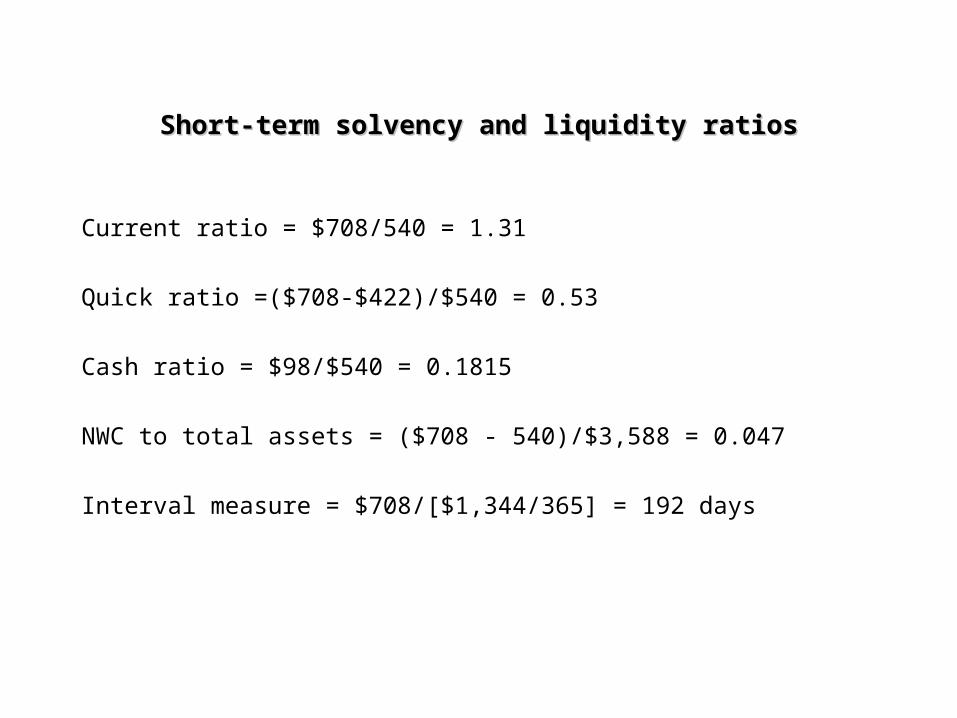
Short-term solvency and liquidity ratiosShort-term solvency and liquidity ratios
Current ratio = $708/540 = 1.31
Quick ratio =($708-$422)/$540 = 0.53
Cash ratio = $98/$540 = 0.1815
NWC to total assets = ($708 - 540)/$3,588 = 0.047
Interval measure = $708/[$1,344/365] = 192 days
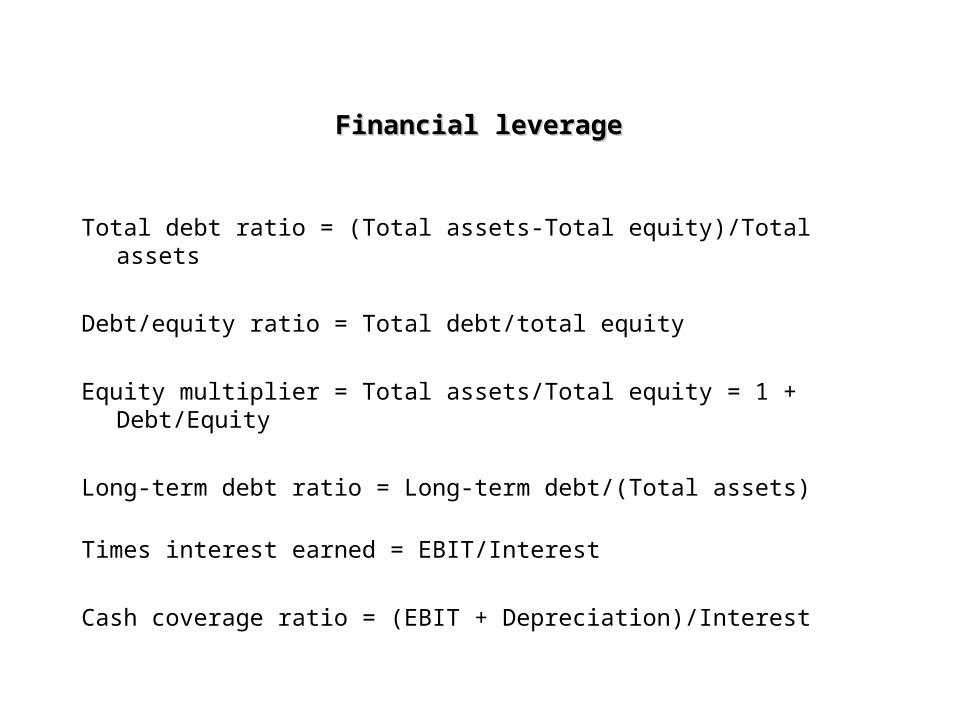
Financial leverageFinancial leverage
Total debt ratio = (Total assets-Total equity)/Total assets
Debt/equity ratio = Total debt/total equity
Equity multiplier = Total assets/Total equity = 1 + Debt/Equity
Long-term debt ratio = Long-term debt/(Total assets)
Times interest earned = EBIT/Interest
Cash coverage ratio = (EBIT + Depreciation)/Interest
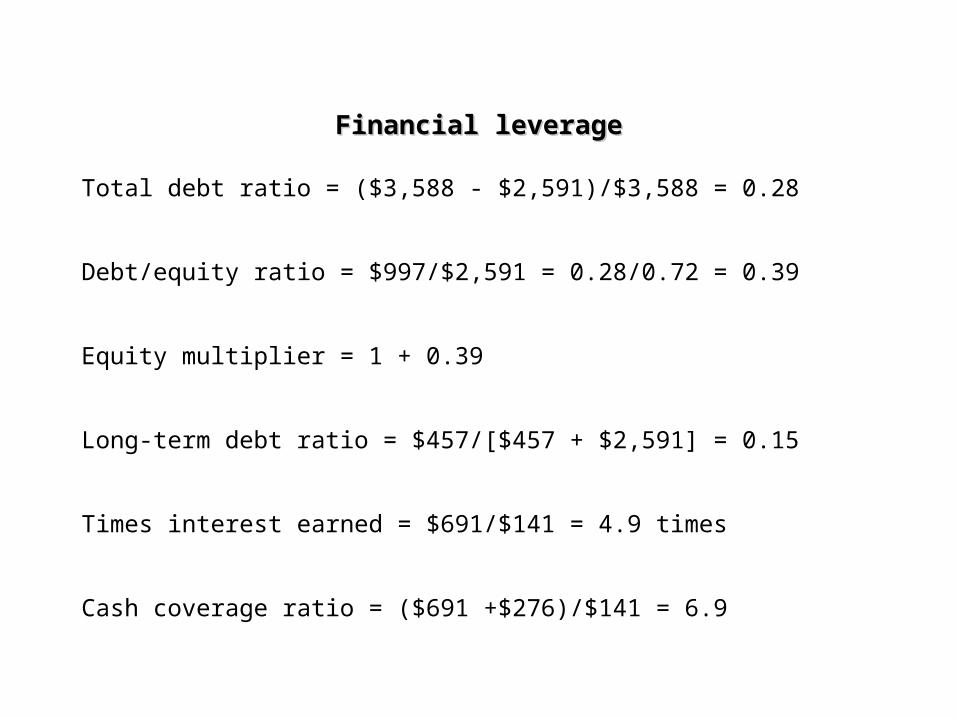
Financial leverageFinancial leverage
Total debt ratio = ($3,588 - $2,591)/$3,588 = 0.28
Debt/equity ratio = $997/$2,591 = 0.28/0.72 = 0.39
Equity multiplier = 1 + 0.39
Long-term debt ratio = $457/[$457 + $2,591] = 0.15
Times interest earned = $691/$141 = 4.9 times
Cash coverage ratio = ($691 +$276)/$141 = 6.9
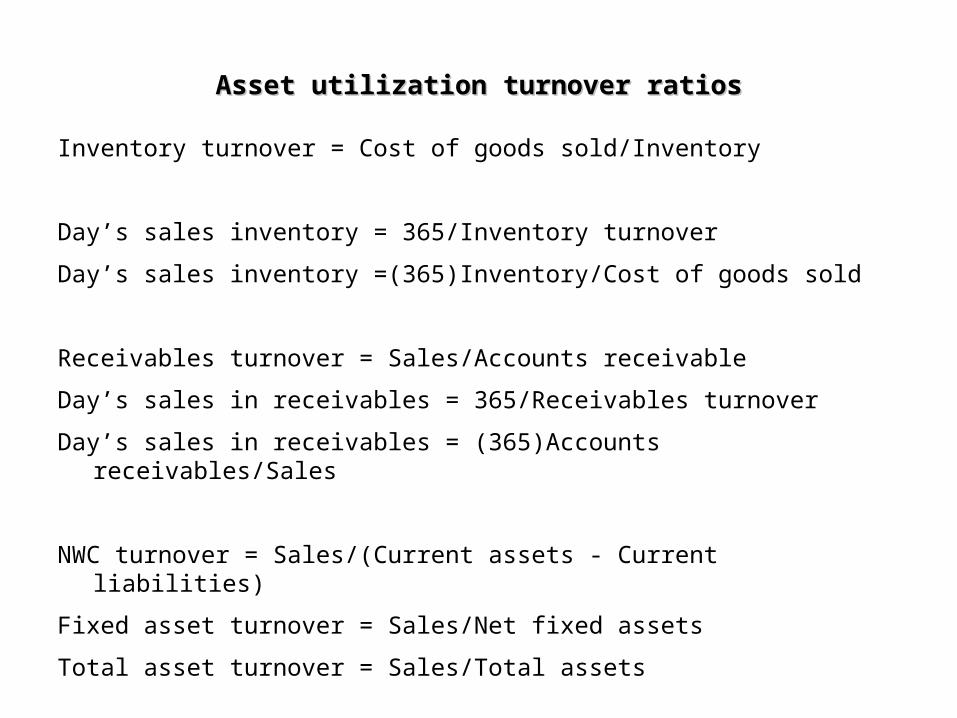
Asset utilization turnover ratiosAsset utilization turnover ratios
Inventory turnover = Cost of goods sold/Inventory
Day’s sales inventory = 365/Inventory turnover
Day’s sales inventory =(365)Inventory/Cost of goods sold
Receivables turnover = Sales/Accounts receivable
Day’s sales in receivables = 365/Receivables turnover
Day’s sales in receivables = (365)Accounts receivables/Sales
NWC turnover = Sales/(Current assets - Current liabilities)
Fixed asset turnover = Sales/Net fixed assets
Total asset turnover = Sales/Total assets
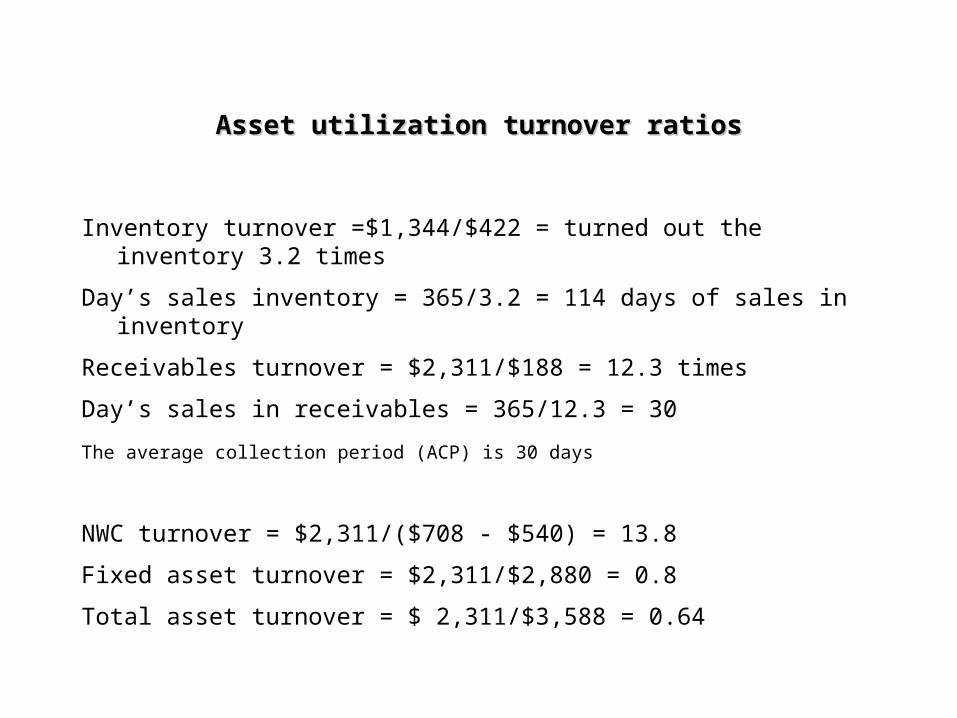
Asset utilization turnover ratiosAsset utilization turnover ratios
Inventory turnover =$1,344/$422 = turned out the inventory 3.2 times
Day’s sales inventory = 365/3.2 = 114 days of sales in inventory
Receivables turnover = $2,311/$188 = 12.3 times
Day’s sales in receivables = 365/12.3 = 30
The average collection period (ACP) is 30 days
NWC turnover = $2,311/($708 - $540) = 13.8
Fixed asset turnover = $2,311/$2,880 = 0.8
Total asset turnover = $ 2,311/$3,588 = 0.64
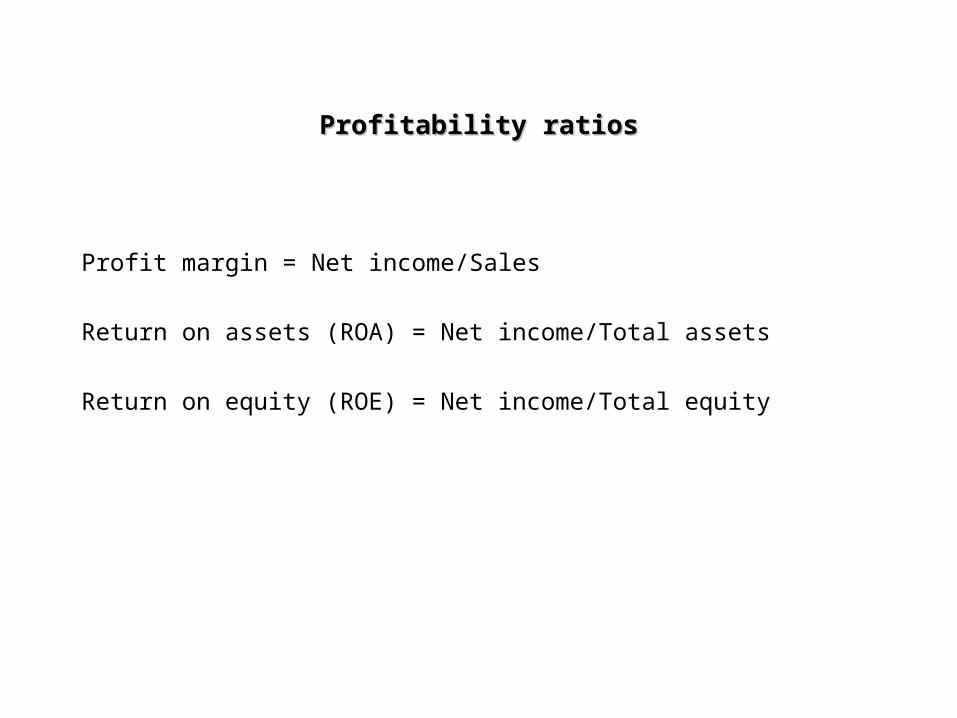
Profitability ratiosProfitability ratios
Profit margin = Net income/Sales
Return on assets (ROA) = Net income/Total assets
Return on equity (ROE) = Net income/Total equity
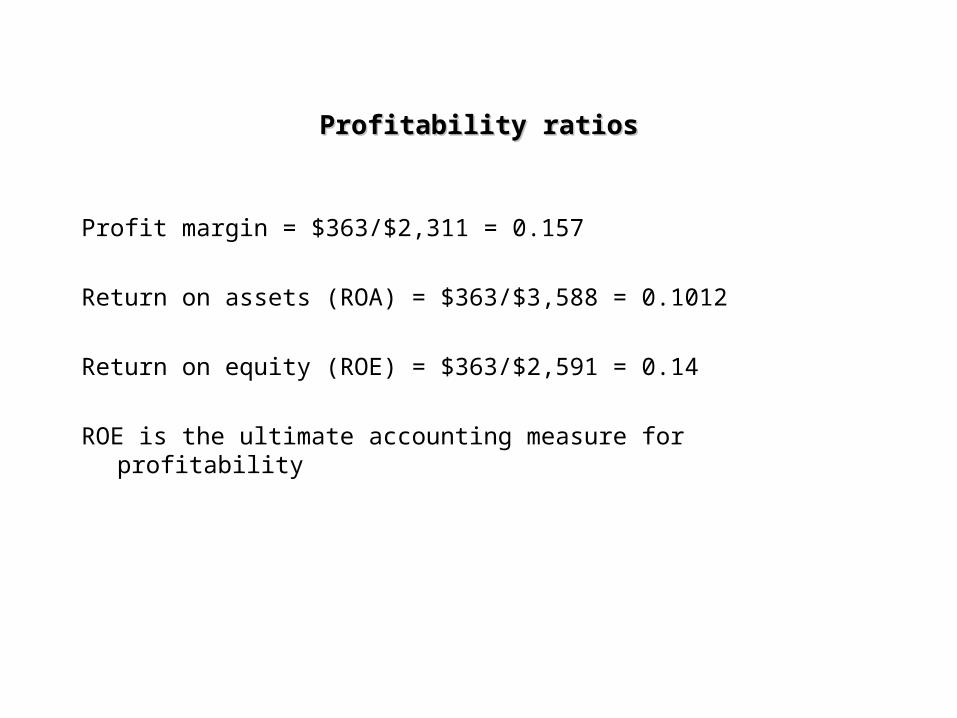
Profitability ratiosProfitability ratios
Profit margin = $363/$2,311 = 0.157
Return on assets (ROA) = $363/$3,588 = 0.1012
Return on equity (ROE) = $363/$2,591 = 0.14
ROE is the ultimate accounting measure for profitability
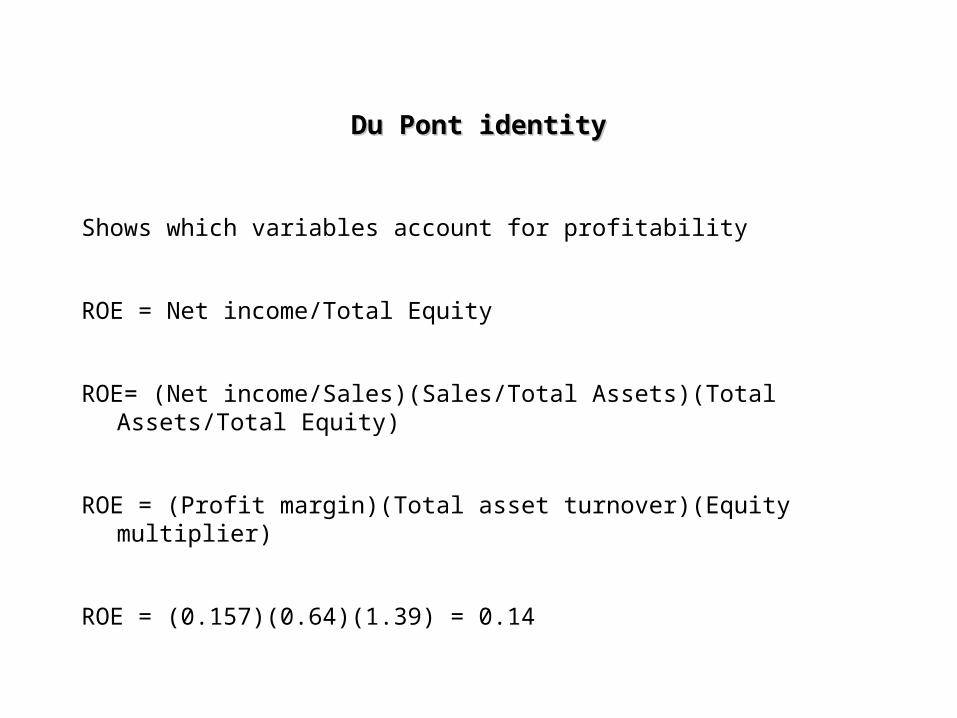
Du Pont identityDu Pont identity
Shows which variables account for profitability
ROE = Net income/Total Equity
ROE= (Net income/Sales)(Sales/Total Assets)(Total Assets/Total Equity)
ROE = (Profit margin)(Total asset turnover)(Equity multiplier)
ROE = (0.157)(0.64)(1.39) = 0.14

Extended DuPont Equality
ROE = NI/E = (EBT/TA)(TA/E)(NI/EBT)
ROE = [EBIT/TA – I/TA](TA/E)(EBT/EBT – Tax/EBT)
ROE = [(EBIT/S)(S/TA) – I/TA](TA/E)(1- Tax/EBT)
ROE = [(Operating margin) (TAT) – Interest expense rate]
(Equity multiplier)
(Tax retention rate)
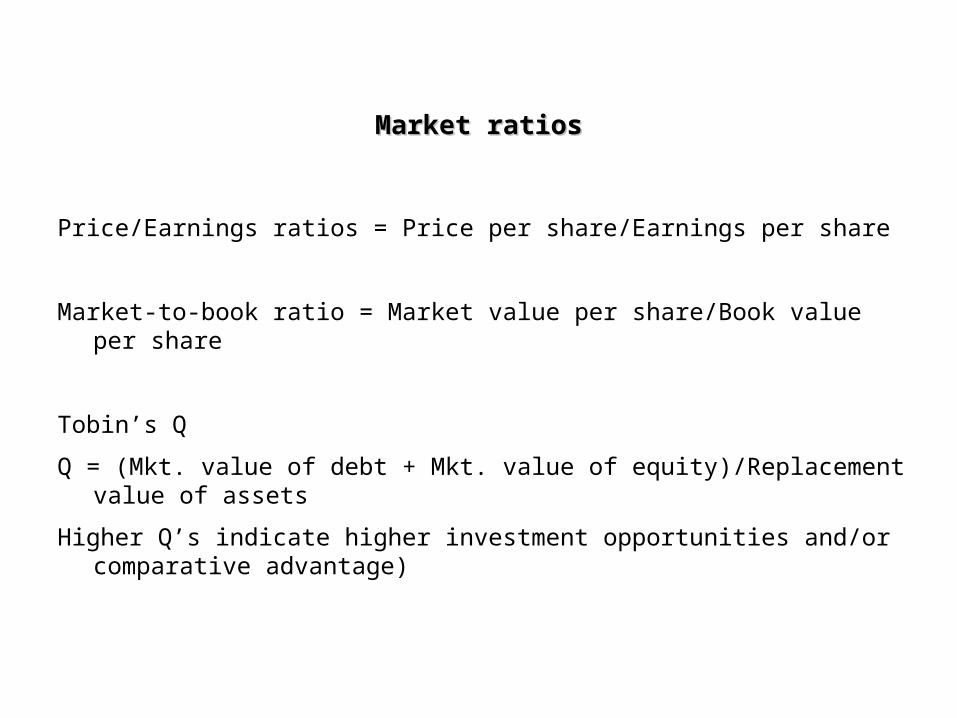
Market ratiosMarket ratios
Price/Earnings ratios = Price per share/Earnings per share
Market-to-book ratio = Market value per share/Book value per share
Tobin’s Q
Q = (Mkt. value of debt + Mkt. value of equity)/Replacement value of assets
Higher Q’s indicate higher investment opportunities and/or comparative advantage)
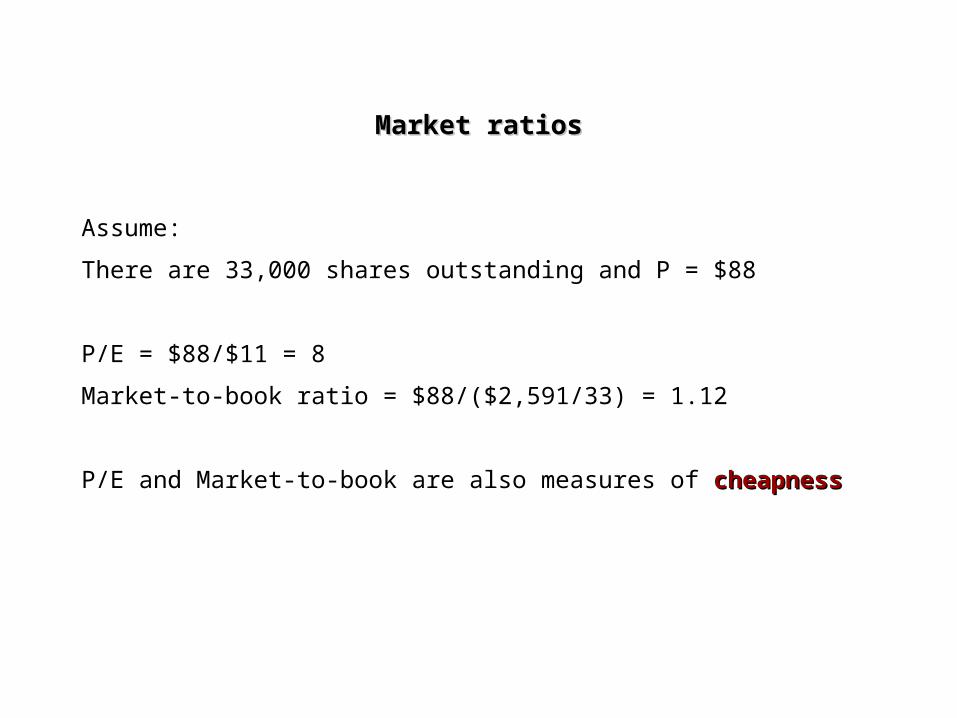
Market ratiosMarket ratios
Assume:
There are 33,000 shares outstanding and P = $88
P/E = $88/$11 = 8
Market-to-book ratio = $88/($2,591/33) = 1.12
P/E and Market-to-book are also measures of cheapnesscheapness