Embed Size (px)
DESCRIPTION
Chapter 3. Financial Statements Analysis and Long-Term Planning. Questions. What are important financial ratios? What are the major categories of financial ratios? What is Du Pont Identity? How can we do the financial planning?. 3.1 Financial Statements Analysis. Common-Size Balance Sheets - PowerPoint PPT Presentation
Citation preview
Financial Statements Analysis and Long-Term Planning
Chapter 3
3-2
Questions
What are important financial ratios? What are the major categories of financial
ratios? What is Du Pont Identity? How can we do the financial planning?
3-3
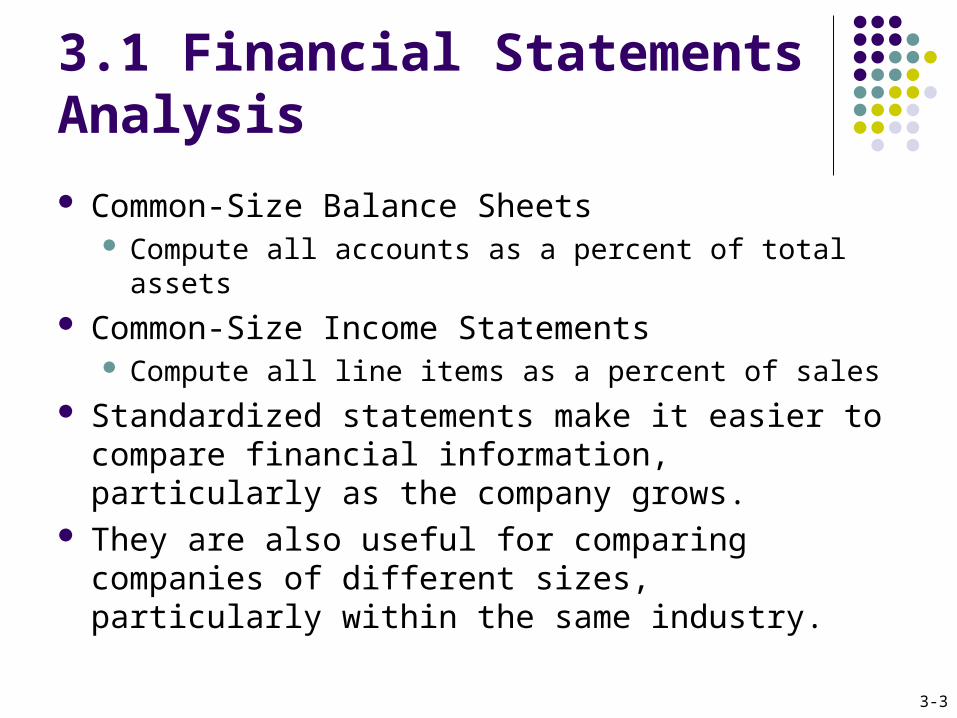
3.1 Financial Statements Analysis
Common-Size Balance Sheets Compute all accounts as a percent of total assets
Common-Size Income Statements Compute all line items as a percent of sales
Standardized statements make it easier to compare financial information, particularly as the company grows.
They are also useful for comparing companies of different sizes, particularly within the same industry.
3-4
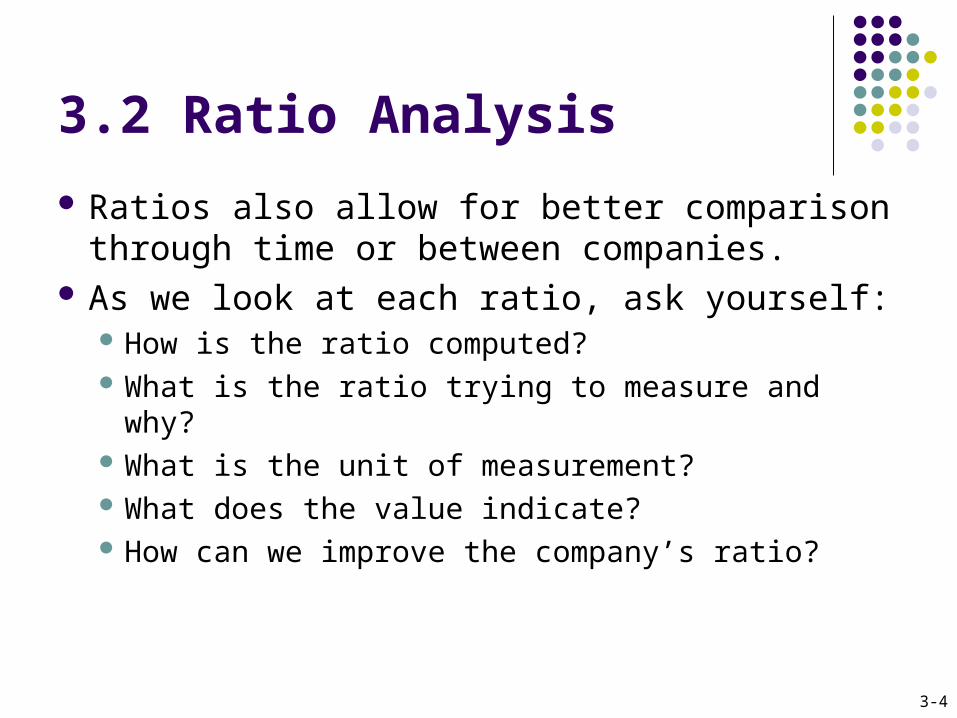
3.2 Ratio Analysis
Ratios also allow for better comparison through time or between companies.
As we look at each ratio, ask yourself: How is the ratio computed? What is the ratio trying to measure and why? What is the unit of measurement? What does the value indicate? How can we improve the company’s ratio?
3-5
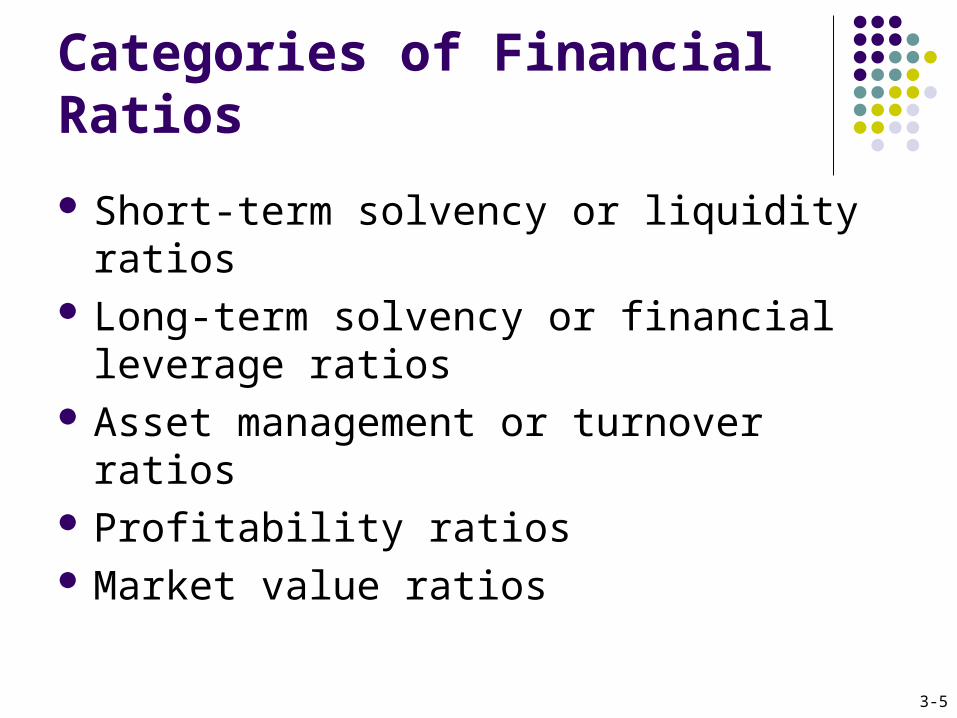
Categories of Financial Ratios
Short-term solvency or liquidity ratios Long-term solvency or financial leverage
ratios Asset management or turnover ratios Profitability ratios Market value ratios
3-6
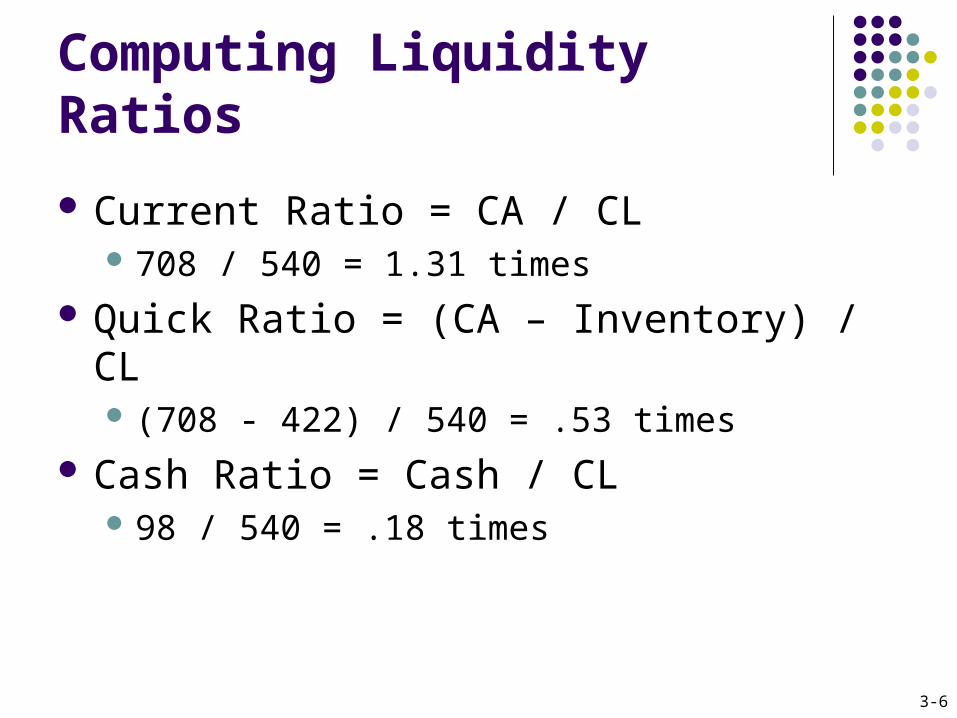
Computing Liquidity Ratios
Current Ratio = CA / CL 708 / 540 = 1.31 times
Quick Ratio = (CA – Inventory) / CL (708 - 422) / 540 = .53 times
Cash Ratio = Cash / CL 98 / 540 = .18 times
3-7
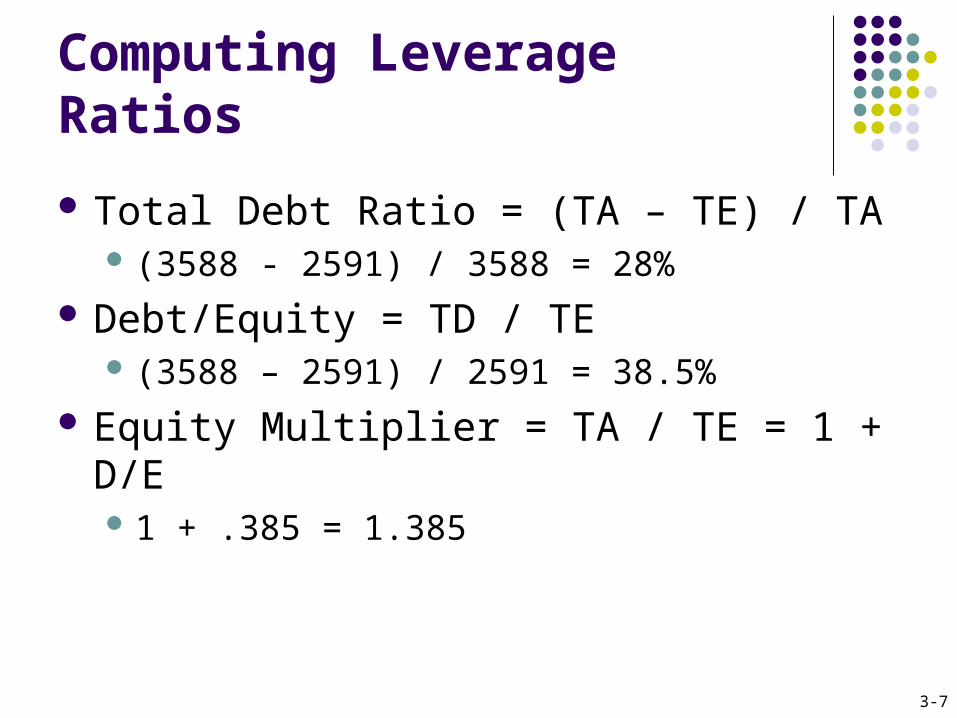
Computing Leverage Ratios
Total Debt Ratio = (TA – TE) / TA (3588 - 2591) / 3588 = 28%
Debt/Equity = TD / TE (3588 – 2591) / 2591 = 38.5%
Equity Multiplier = TA / TE = 1 + D/E 1 + .385 = 1.385
3-8
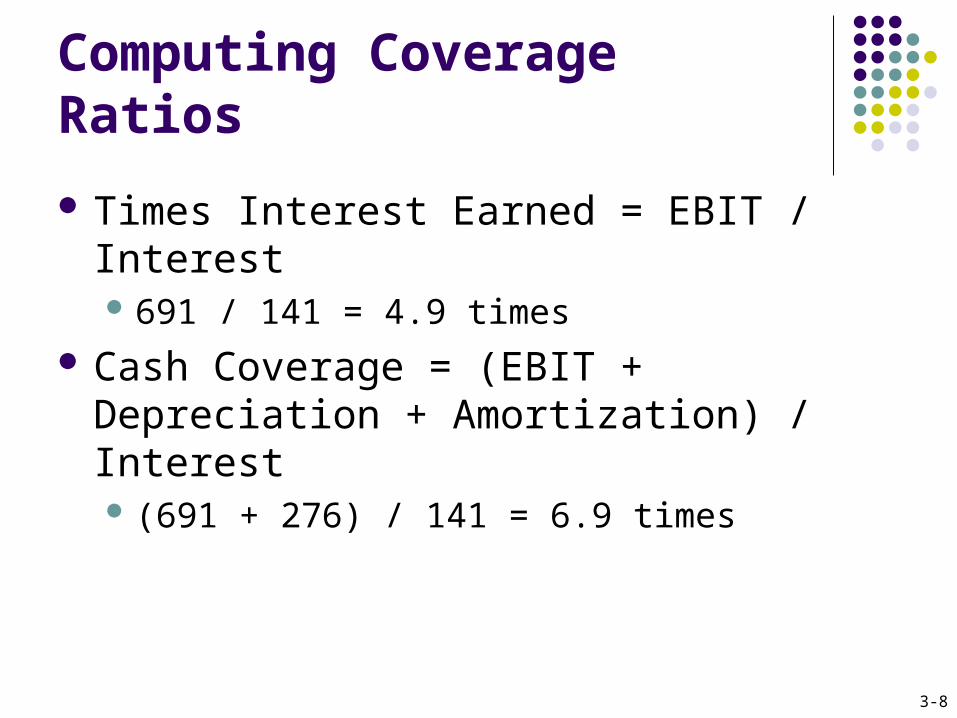
Computing Coverage Ratios
Times Interest Earned = EBIT / Interest 691 / 141 = 4.9 times
Cash Coverage = (EBIT + Depreciation + Amortization) / Interest (691 + 276) / 141 = 6.9 times
3-9
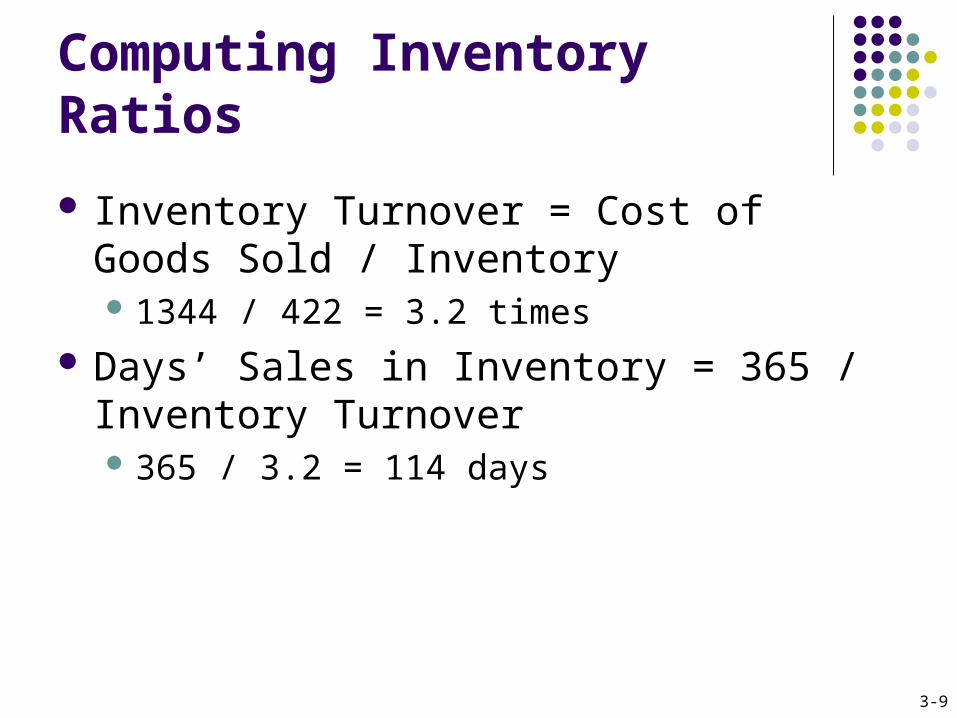
Computing Inventory Ratios
Inventory Turnover = Cost of Goods Sold / Inventory 1344 / 422 = 3.2 times
Days’ Sales in Inventory = 365 / Inventory Turnover 365 / 3.2 = 114 days
3-10
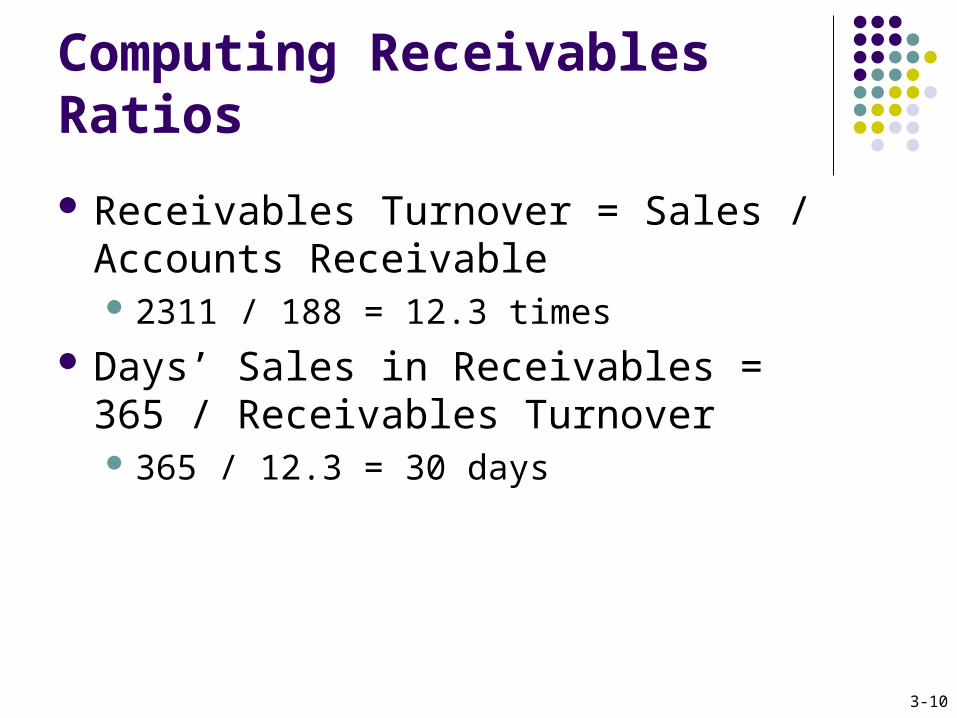
Computing Receivables Ratios
Receivables Turnover = Sales / Accounts Receivable 2311 / 188 = 12.3 times
Days’ Sales in Receivables = 365 / Receivables Turnover 365 / 12.3 = 30 days
3-11
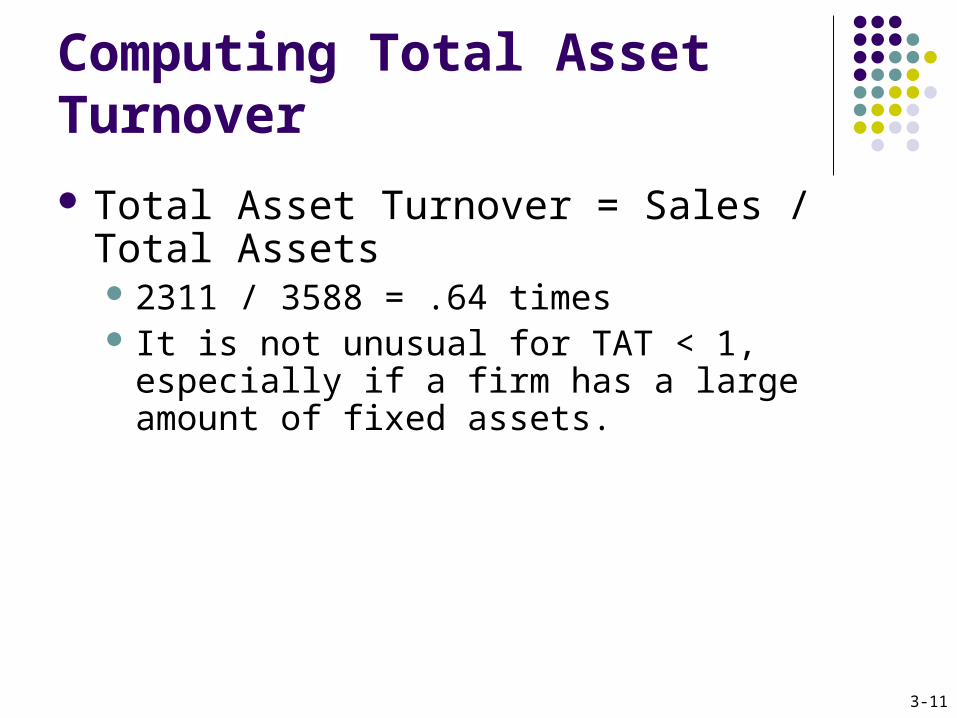
Computing Total Asset Turnover
Total Asset Turnover = Sales / Total Assets 2311 / 3588 = .64 times It is not unusual for TAT < 1, especially if a firm
has a large amount of fixed assets.
3-12
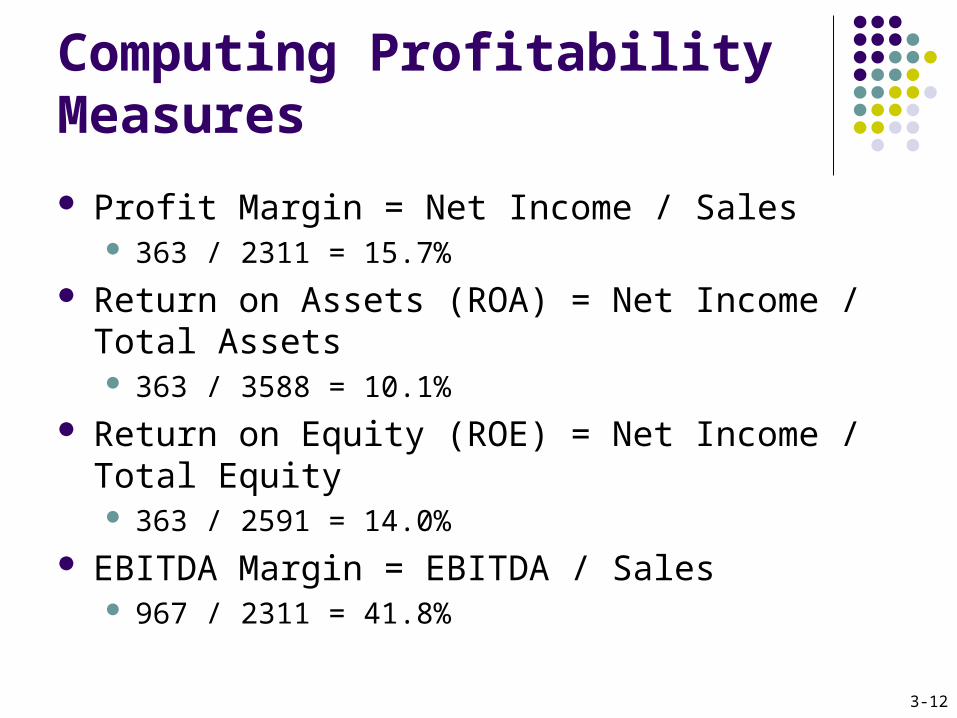
Computing Profitability Measures
Profit Margin = Net Income / Sales 363 / 2311 = 15.7%
Return on Assets (ROA) = Net Income / Total Assets 363 / 3588 = 10.1%
Return on Equity (ROE) = Net Income / Total Equity 363 / 2591 = 14.0%
EBITDA Margin = EBITDA / Sales 967 / 2311 = 41.8%
3-13
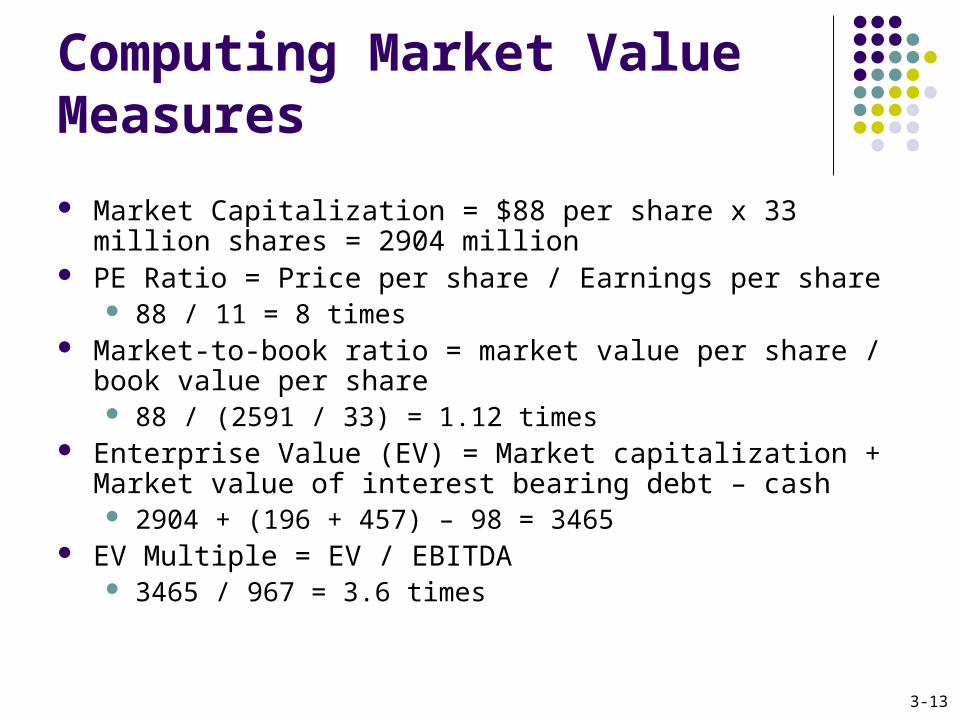
Computing Market Value Measures
Market Capitalization = $88 per share x 33 million shares = 2904 million
PE Ratio = Price per share / Earnings per share 88 / 11 = 8 times
Market-to-book ratio = market value per share / book value per share 88 / (2591 / 33) = 1.12 times
Enterprise Value (EV) = Market capitalization + Market value of interest bearing debt – cash 2904 + (196 + 457) – 98 = 3465
EV Multiple = EV / EBITDA 3465 / 967 = 3.6 times
3-14
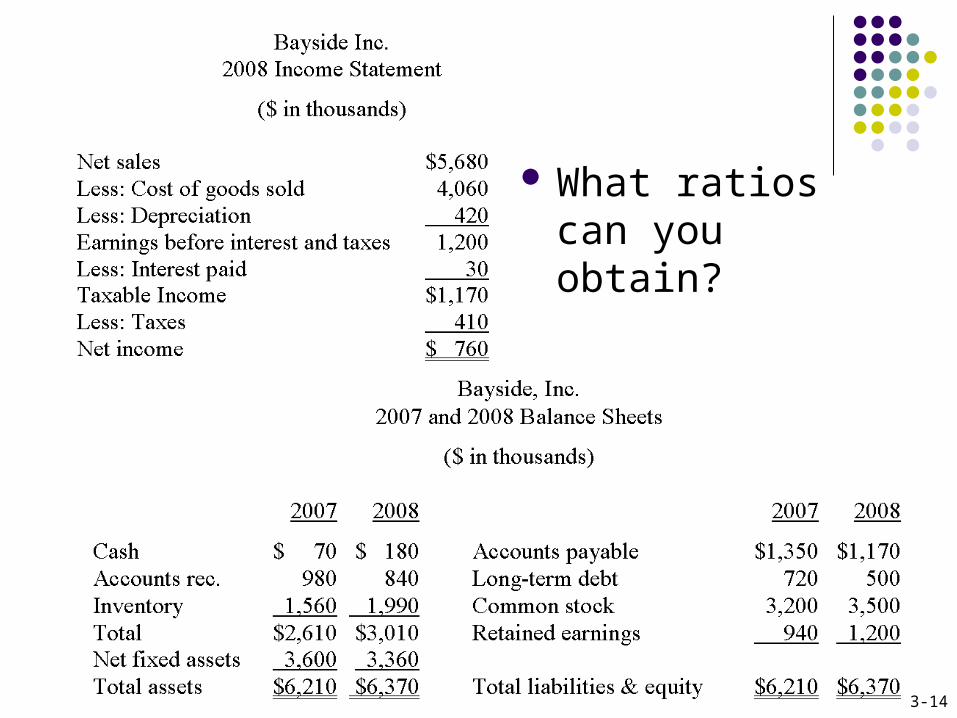
What ratios can you obtain?
3-15
Using Financial Statements
Ratios are not very helpful by themselves: they need to be compared to something
Time-Trend Analysis Used to see how the firm’s performance is
changing through time Peer Group Analysis
Compare to similar companies or within industries SIC and NAICS codes
3-16
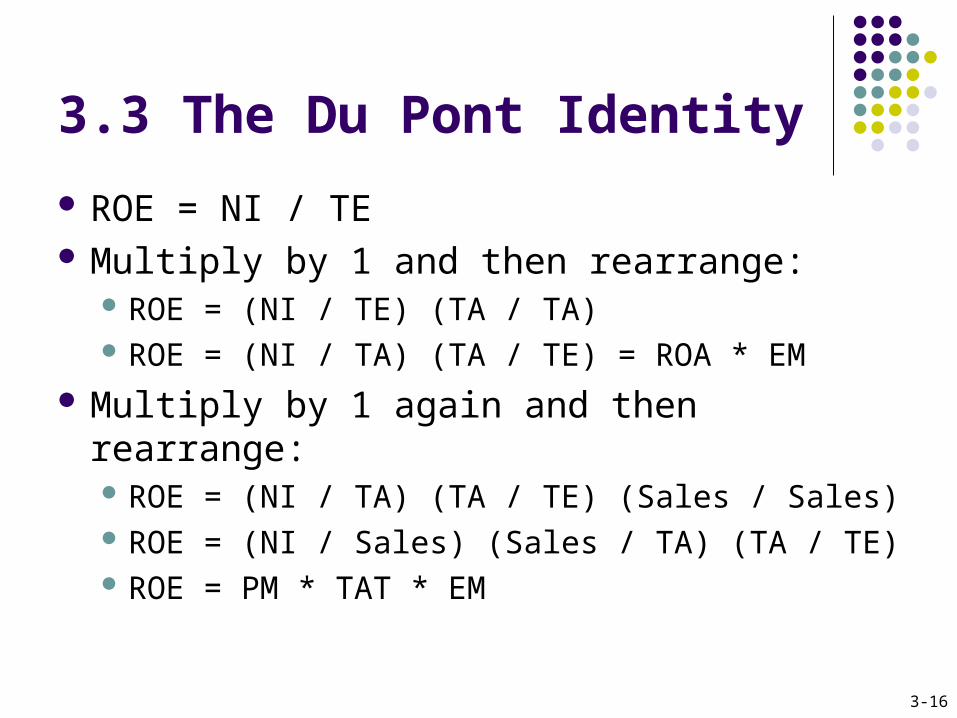
3.3 The Du Pont Identity
ROE = NI / TE Multiply by 1 and then rearrange:
ROE = (NI / TE) (TA / TA) ROE = (NI / TA) (TA / TE) = ROA * EM
Multiply by 1 again and then rearrange: ROE = (NI / TA) (TA / TE) (Sales / Sales) ROE = (NI / Sales) (Sales / TA) (TA / TE) ROE = PM * TAT * EM
3-17
Using the Du Pont Identity
ROE = PM * TAT * EM Profit margin is a measure of the firm’s operating
efficiency – how well it controls costs. Total asset turnover is a measure of the firm’s
asset use efficiency – how well it manages its assets.
Equity multiplier is a measure of the firm’s financial leverage.
3-18
Calculating the Du Pont Identity
ROA = 10.1% and EM = 1.39 ROE = 10.1% * 1.385 = 14.0%
PM = 15.7% and TAT = 0.64 ROE = 15.7% * 0.64 * 1.385 = 14.0%
3-19
Potential Problems
There is no underlying theory, so there is no way to know which ratios are most relevant.
Benchmarking is difficult for diversified firms. Globalization and international competition makes
comparison more difficult because of differences in accounting regulations.
Firms use varying accounting procedures. Firms have different fiscal years. Extraordinary, or one-time, events
3-20
3.4 Financial Models
Investment in new assets – determined by capital budgeting decisions
Degree of financial leverage – determined by capital structure decisions
Cash paid to shareholders – determined by dividend policy decisions
Liquidity requirements – determined by net working capital decisions
3-21
Financial Planning Ingredients Sales Forecast – many cash flows depend directly on the level of
sales (often estimate sales growth rate) Pro Forma Statements – setting up the plan as projected (pro
forma) financial statements allows for consistency and ease of interpretation
Asset Requirements – the additional assets that will be required to meet sales projections
Financial Requirements – the amount of financing needed to pay for the required assets
Plug Variable – determined by management decisions about what type of financing will be used (makes the balance sheet balance)
Economic Assumptions – explicit assumptions about the coming economic environment
3-22
Percent of Sales Approach
Some items vary directly with sales, others do not. Income Statement
Costs may vary directly with sales - if this is the case, then the profit margin is constant
Depreciation and interest expense may not vary directly with sales – if this is the case, then the profit margin is not constant
Dividends are a management decision and generally do not vary directly with sales – this affects additions to retained earnings
3-23
Percent of Sales Approach
Balance Sheet Initially assume all assets, including fixed, vary directly
with sales. Accounts payable also normally vary directly with sales. Notes payable, long-term debt, and equity generally do not
vary with sales because they depend on management decisions about capital structure.
The change in the retained earnings portion of equity will come from the dividend decision.
External Financing Needed (EFN) The difference between the forecasted increase in assets
and the forecasted increase in liabilities and equity.
3-24
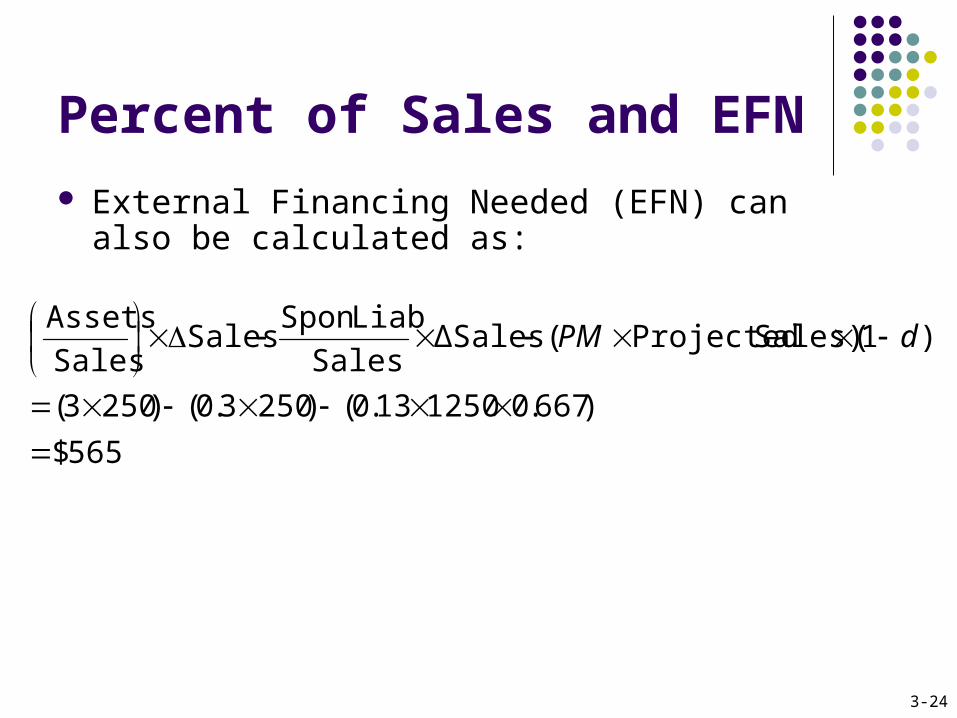
Percent of Sales and EFN
External Financing Needed (EFN) can also be calculated as:
565$
)667.0125013.0()2503.0()2503(
)1(Sales) Projected(ΔSalesSales
LiabSpon Sales
Sales
Assets
dPM
3-25
3.5 External Financing and Growth
At low growth levels, internal financing (retained earnings) may exceed the required investment in assets.
As the growth rate increases, the internal financing will not be enough, and the firm will have to go to the capital markets for financing.
Examining the relationship between growth and external financing required is a useful tool in financial planning.
3-26
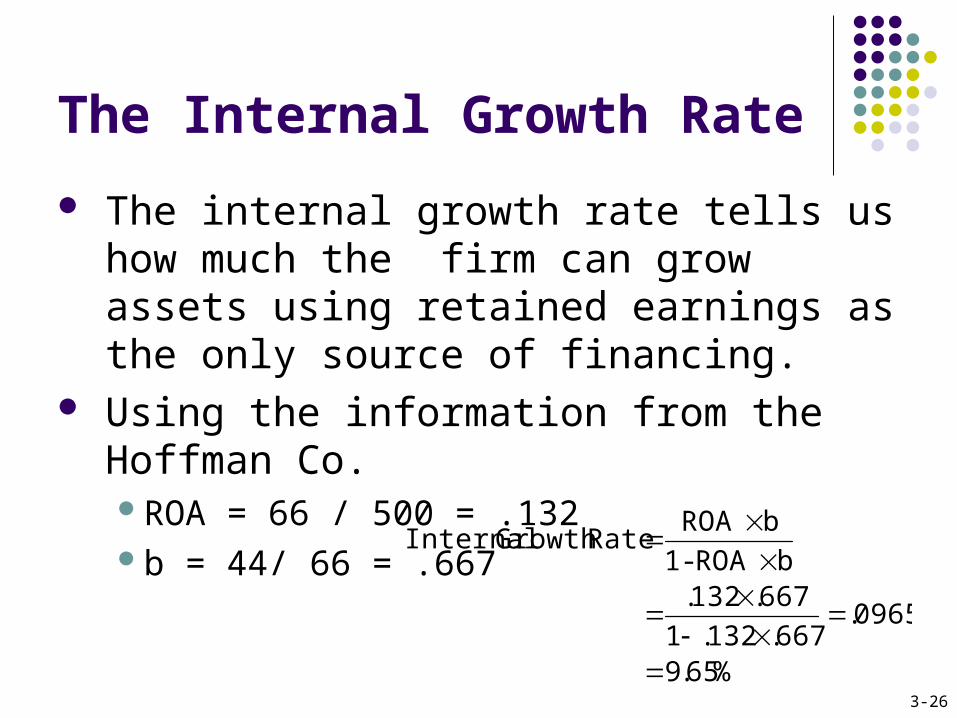
The Internal Growth Rate
The internal growth rate tells us how much the firm can grow assets using retained earnings as the only source of financing.
Using the information from the Hoffman Co.ROA = 66 / 500 = .132b = 44/ 66 = .667
%65.9
0965.667.132.1
667.132.bROA - 1
bROA RateGrowth Internal
3-27
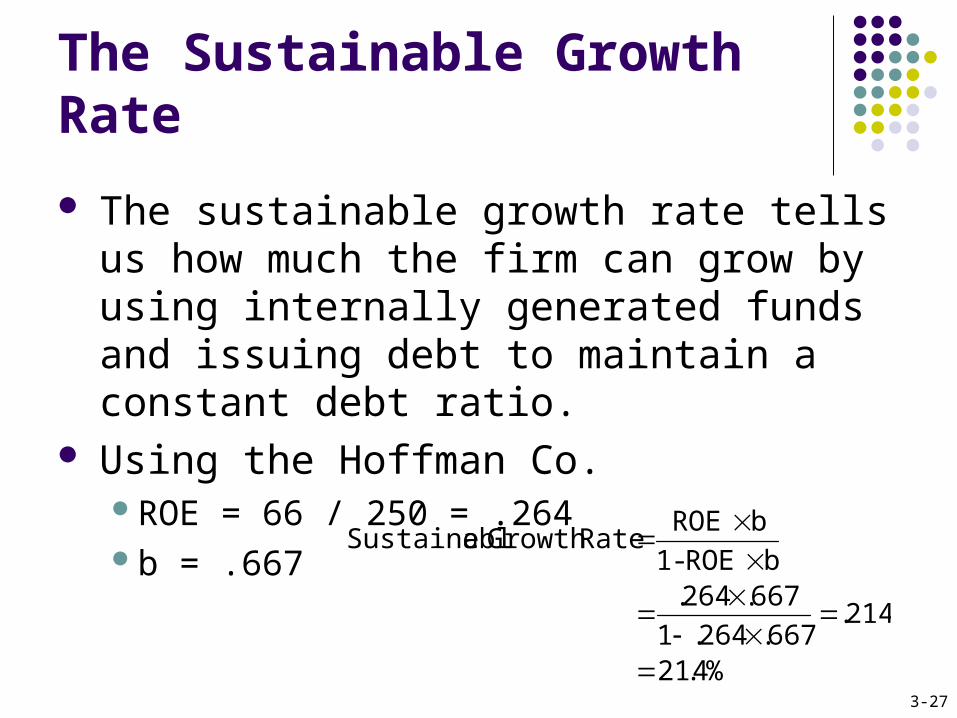
The Sustainable Growth Rate
The sustainable growth rate tells us how much the firm can grow by using internally generated funds and issuing debt to maintain a constant debt ratio.
Using the Hoffman Co.ROE = 66 / 250 = .264b = .667
%4.21
214.667.264.1
667.264.bROE-1
bROE RateGrowth eSustainabl
3-28
Determinants of Growth
Profit margin – operating efficiency Total asset turnover – asset use efficiency Financial leverage – choice of optimal debt
ratio Dividend policy – choice of how much to pay
to shareholders versus reinvesting in the firm
3-29
3.6 Some Caveats
Financial planning models do not indicate which financial polices are the best.
Models are simplifications of reality, and the world can change in unexpected ways.
Without some sort of plan, the firm may find itself adrift in a sea of change without a rudder for guidance.
3-30
Exercise 1
Jessica's Boutique has cash of $50, accounts receivable of $60, accounts payable of $200, and inventory of $150. What is the value of the quick ratio?
Quick ratio = ($50 + $60) $200 = .55
3-31
Exercise 2
Syed's Industries has accounts receivable of $700, inventory of $1,200, sales of $4,200, and cost of goods sold of $3,400. How long does it take Syed's to both sell its inventory and then collect the payment on the sale? Inventory turnover = $3,400/$1,200 = 2.83; Days
in inventory = 365/2.83 = 128.98; Accounts receivable turnover = $4,200/$700 = 6; Days' sales in receivables = 365/6 = 60.83; Total days in inventory and receivables = 128.98 + 60.83 = 189.81 days = 190 days (rounded)
3-32
Exercise 3
A firm has a return on equity of 15 percent. The debt-equity ratio is 50 percent. The total asset turnover is 1.25 and the profit margin is 8 percent. The total equity is $3,200. What is the amount of the net income? Using the Du Pont identity: Total assets = (1
+ .50) x $3,200 = $4,800; Total sales = $4,800 x 1.25 = $6,000; Net income = $6,000 x .08 = $480