Embed Size (px)
Citation preview
8/3/2019 Financial Services Webinar - Feb 2011
http://slidepdf.com/reader/full/financial-services-webinar-feb-2011 1/39
February 15, 2011
Display Advertising Trends in the Financial ServicesIndustry
Susan Engleson Kleinman, Director
8/3/2019 Financial Services Webinar - Feb 2011
http://slidepdf.com/reader/full/financial-services-webinar-feb-2011 2/39
2 © comScore, Inc. Proprietary.
Webinar Housekeeping Items
These slides will be sent to all attendees within 48 hours
Please submit questions using the question feature in GoToWebinar
8/3/2019 Financial Services Webinar - Feb 2011
http://slidepdf.com/reader/full/financial-services-webinar-feb-2011 3/39
3 © comScore, Inc. Proprietary.
Agenda
Top financial services display advertisers in 2010
Growth in financial services display advertising
New techniques in campaign optimization
Measuring the effectiveness of financial services campaigns
8/3/2019 Financial Services Webinar - Feb 2011
http://slidepdf.com/reader/full/financial-services-webinar-feb-2011 4/39
4 © comScore, Inc. Proprietary.
Top Display Advertisers in 2010
Overall and in Financial Services
8/3/2019 Financial Services Webinar - Feb 2011
http://slidepdf.com/reader/full/financial-services-webinar-feb-2011 5/39
5 © comScore, Inc. Proprietary.
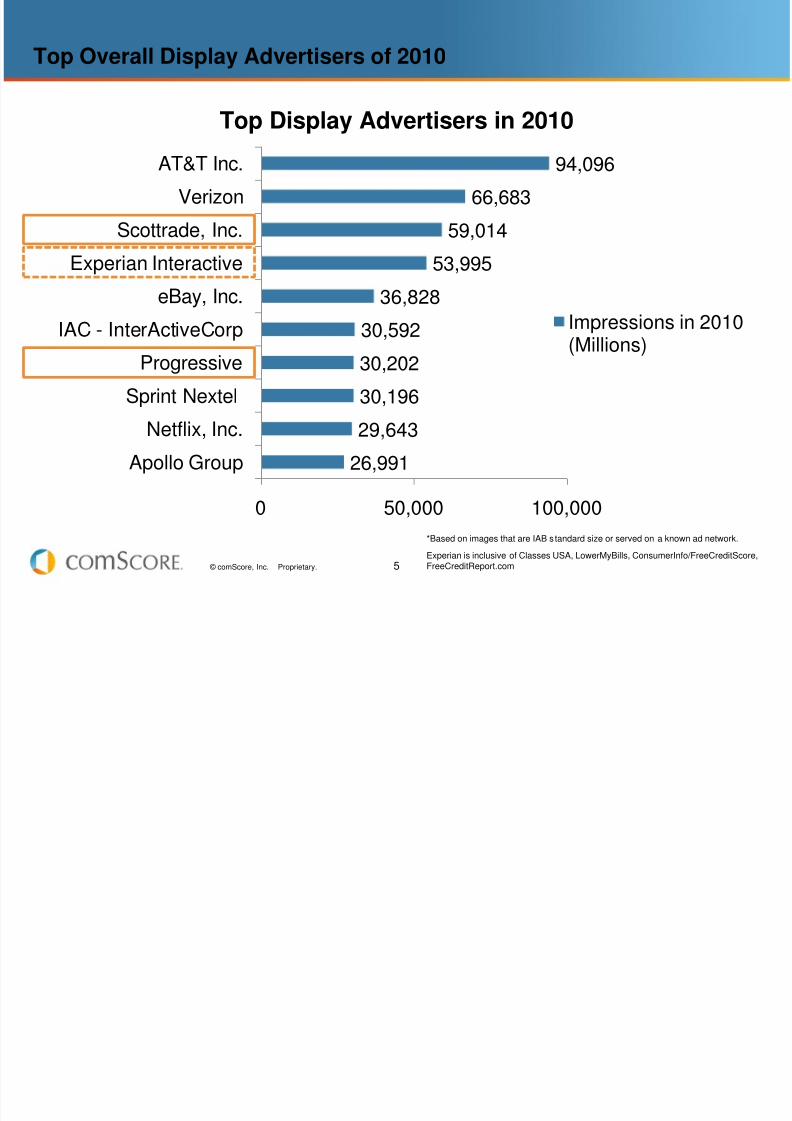
Top Overall Display Advertisers of 2010
*Based on images that are IAB standard size or served on a known ad network.
Experian is inclusive of Classes USA, LowerMyBills, ConsumerInfo/FreeCreditScore,FreeCreditReport.com
26,991
29,643
30,196
30,202
30,592
36,828
53,995
59,014
66,683
94,096
0 50,000 100,000
Apollo Group
Netflix, Inc.
Sprint Nextel
Progressive
IAC - InterActiveCorp
eBay, Inc.
Experian Interactive
Scottrade, Inc.
Verizon
AT&T Inc.
Top Display Advertisers in 2010
Impressions in 2010(Millions)
8/3/2019 Financial Services Webinar - Feb 2011
http://slidepdf.com/reader/full/financial-services-webinar-feb-2011 6/39
6 © comScore, Inc. Proprietary.
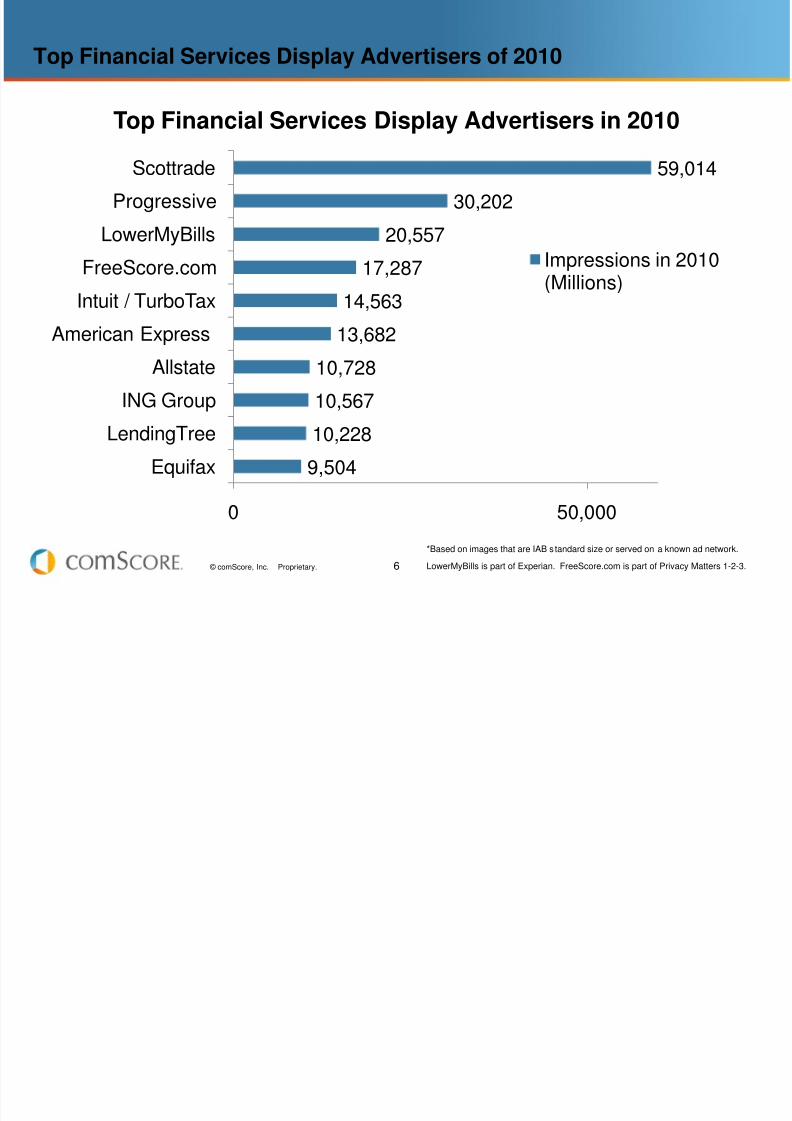
Top Financial Services Display Advertisers of 2010
*Based on images that are IAB standard size or served on a known ad network.LowerMyBills is part of Experian. FreeScore.com is part of Privacy Matters 1-2-3.
9,504
10,228
10,567
10,728
13,682
14,56317,287
20,557
30,202
59,014
0 50,000
Equifax
LendingTree
ING Group
Allstate
American Express
Intuit / TurboTaxFreeScore.com
LowerMyBills
Progressive
Scottrade
Top Financial Services Display Advertisers in 2010
Impressions in 2010
(Millions)
8/3/2019 Financial Services Webinar - Feb 2011
http://slidepdf.com/reader/full/financial-services-webinar-feb-2011 7/39
7 © comScore, Inc. Proprietary.
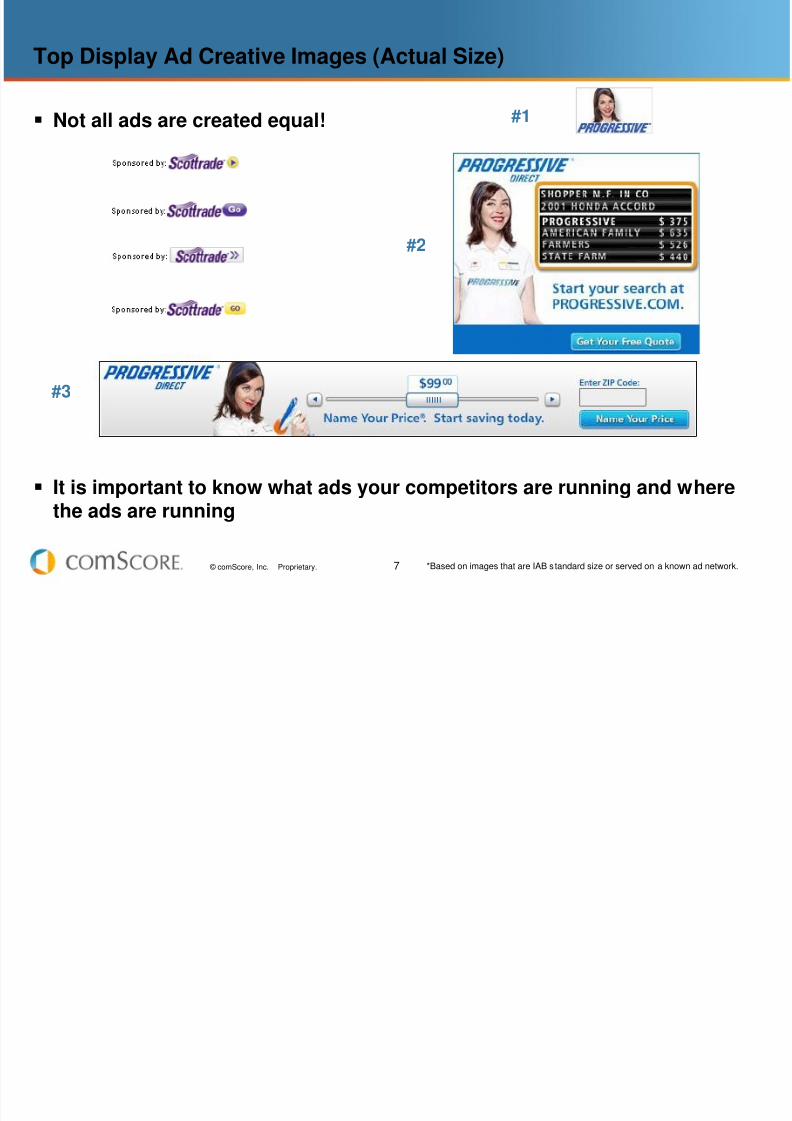
Top Display Ad Creative Images (Actual Size)
Not all ads are created equal!
It is important to know what ads your competitors are running and wherethe ads are running
*Based on images that are IAB standard size or served on a known ad network.
#1
#2
#3
8/3/2019 Financial Services Webinar - Feb 2011
http://slidepdf.com/reader/full/financial-services-webinar-feb-2011 8/39
8 © comScore, Inc. Proprietary.
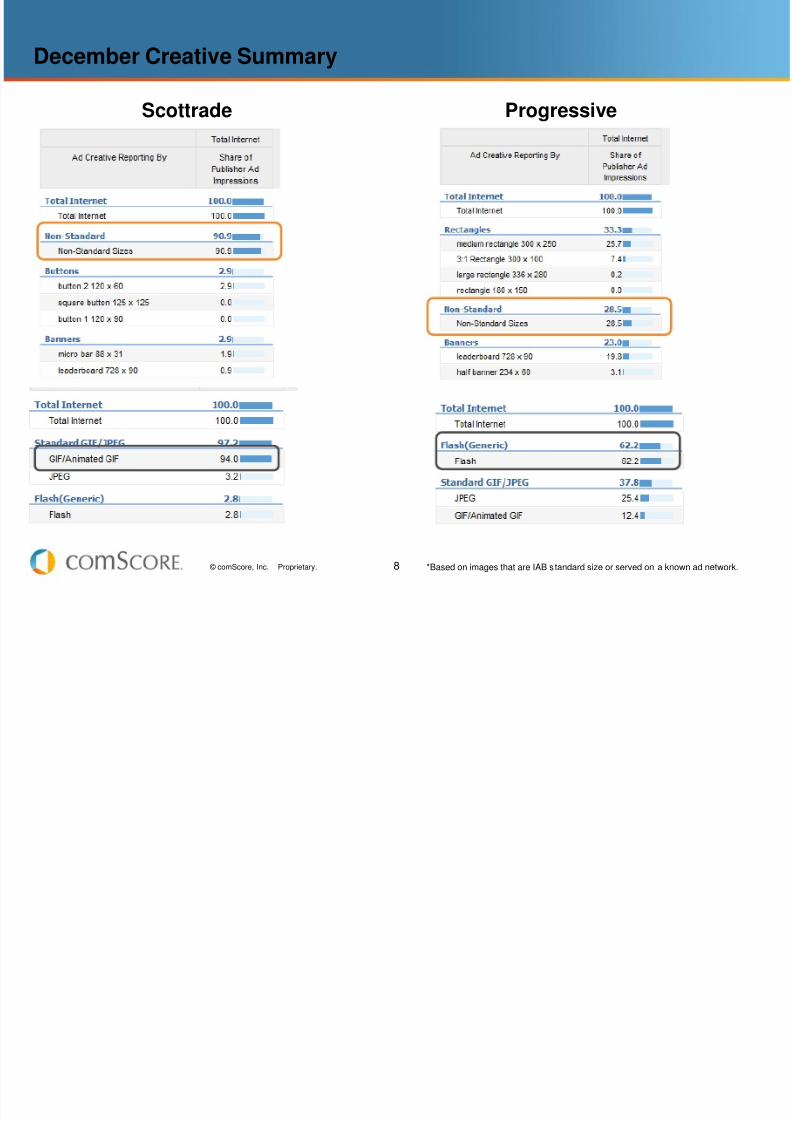
December Creative Summary
Scottrade Progressive
*Based on images that are IAB standard size or served on a known ad network.
8/3/2019 Financial Services Webinar - Feb 2011
http://slidepdf.com/reader/full/financial-services-webinar-feb-2011 9/39
9 © comScore, Inc. Proprietary.
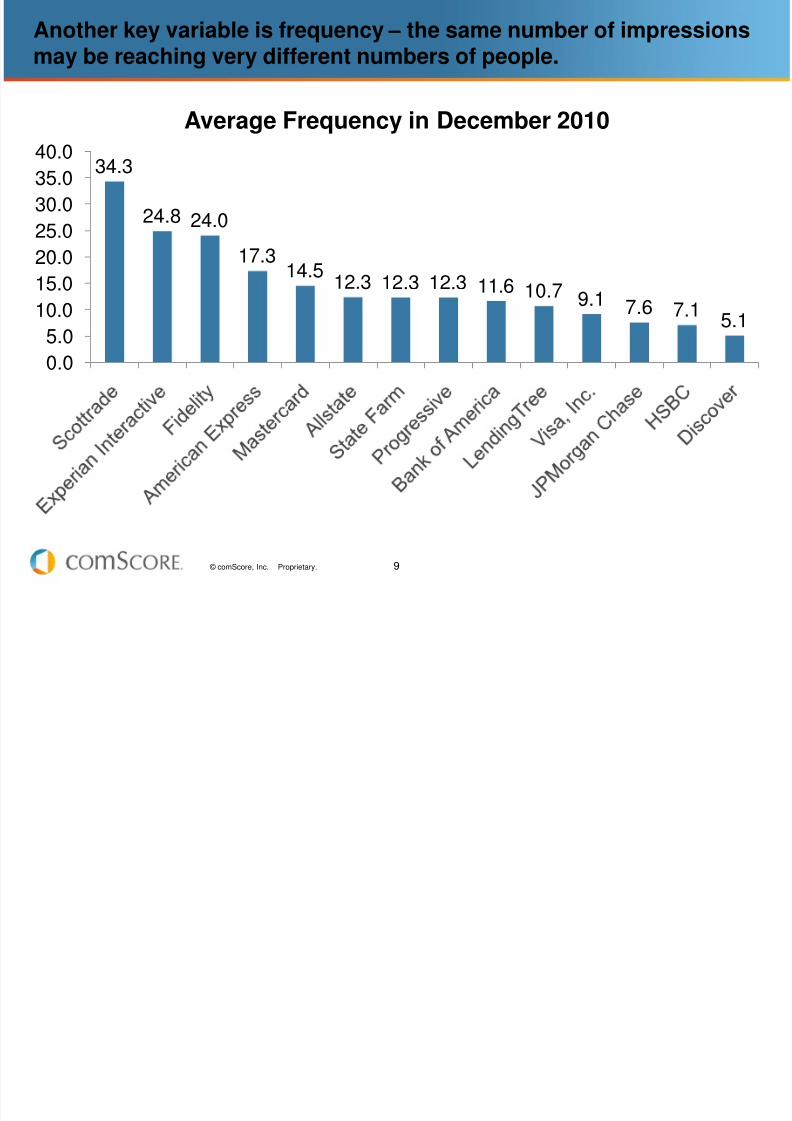
Another key variable is frequency – the same number of impressionsmay be reaching very different numbers of people.
34.3
24.8 24.0
17.3
14.5 12.3 12.3 12.3 11.6 10.7 9.1 7.6 7.15.1
0.0
5.0
10.0
15.0
20.0
25.0
30.0
35.0
40.0
Average Frequency in December 2010
8/3/2019 Financial Services Webinar - Feb 2011
http://slidepdf.com/reader/full/financial-services-webinar-feb-2011 10/39
10 © comScore, Inc. Proprietary. *Based on images that are IAB standard size or served on a known ad network.
Growth In Financial Services Display Advertising
8/3/2019 Financial Services Webinar - Feb 2011
http://slidepdf.com/reader/full/financial-services-webinar-feb-2011 11/39
11 © comScore, Inc. Proprietary.
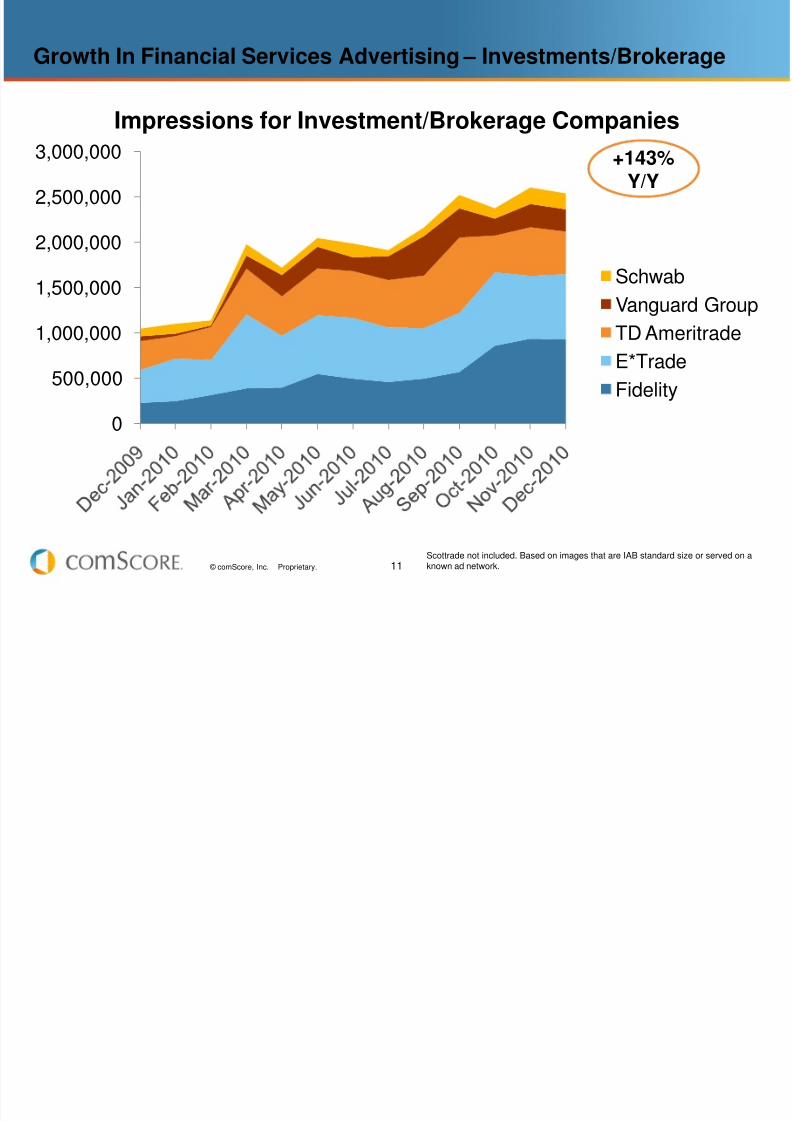
Growth In Financial Services Advertising – Investments/Brokerage
0
500,000
1,000,000
1,500,000
2,000,000
2,500,000
3,000,000
Impressions for Investment/Brokerage Companies
SchwabVanguard Group
TD Ameritrade
E*Trade
Fidelity
Scottrade not included. Based on images that are IAB standard size or served on aknown ad network.
+143%Y/Y
8/3/2019 Financial Services Webinar - Feb 2011
http://slidepdf.com/reader/full/financial-services-webinar-feb-2011 12/39
12 © comScore, Inc. Proprietary.
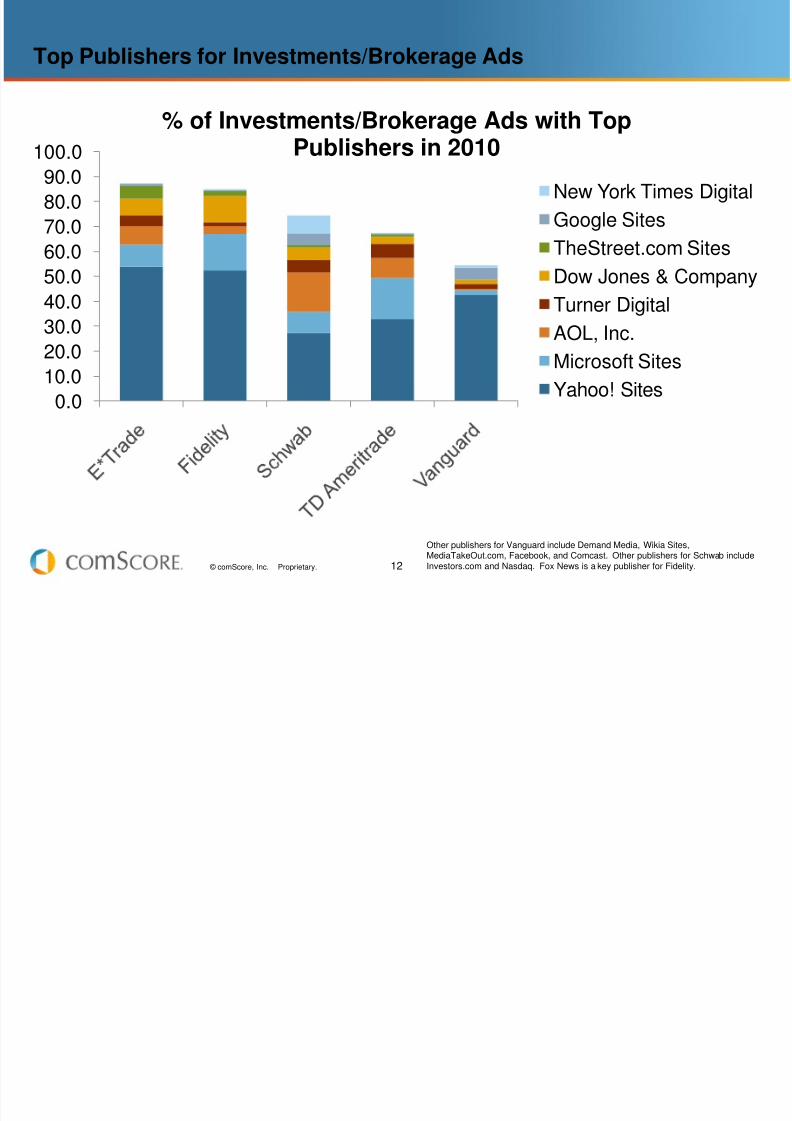
Top Publishers for Investments/Brokerage Ads
0.0
10.0
20.0
30.0
40.050.0
60.0
70.0
80.0
90.0
100.0
% of Investments/Brokerage Ads with Top
Publishers in 2010
New York Times Digital
Google Sites
TheStreet.com Sites
Dow Jones & CompanyTurner Digital
AOL, Inc.
Microsoft Sites
Yahoo! Sites
Other publishers for Vanguard include Demand Media, Wikia Sites,
MediaTakeOut.com, Facebook, and Comcast. Other publishers for Schwab includeInvestors.com and Nasdaq. Fox News is a key publisher for Fidelity.
8/3/2019 Financial Services Webinar - Feb 2011
http://slidepdf.com/reader/full/financial-services-webinar-feb-2011 13/39
13 © comScore, Inc. Proprietary.
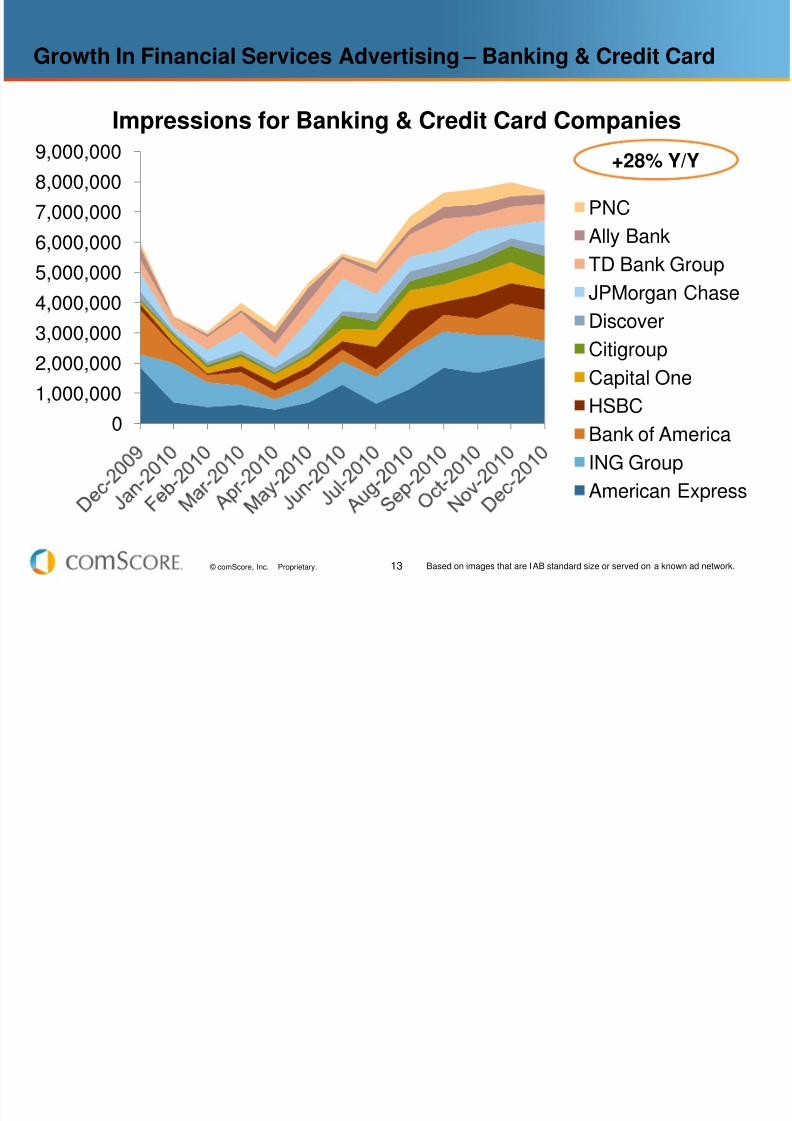
Growth In Financial Services Advertising – Banking & Credit Card
0
1,000,000
2,000,000
3,000,000
4,000,0005,000,000
6,000,000
7,000,000
8,000,000
9,000,000
Impressions for Banking & Credit Card Companies
PNC
Ally Bank
TD Bank Group
JPMorgan Chase
Discover
Citigroup
Capital One
HSBCBank of America
ING Group
American Express
Based on images that are IAB standard size or served on a known ad network.
+28% Y/Y
Amex and ING had the most ads among banking and credit card companies
8/3/2019 Financial Services Webinar - Feb 2011
http://slidepdf.com/reader/full/financial-services-webinar-feb-2011 14/39
14 © comScore, Inc. Proprietary.
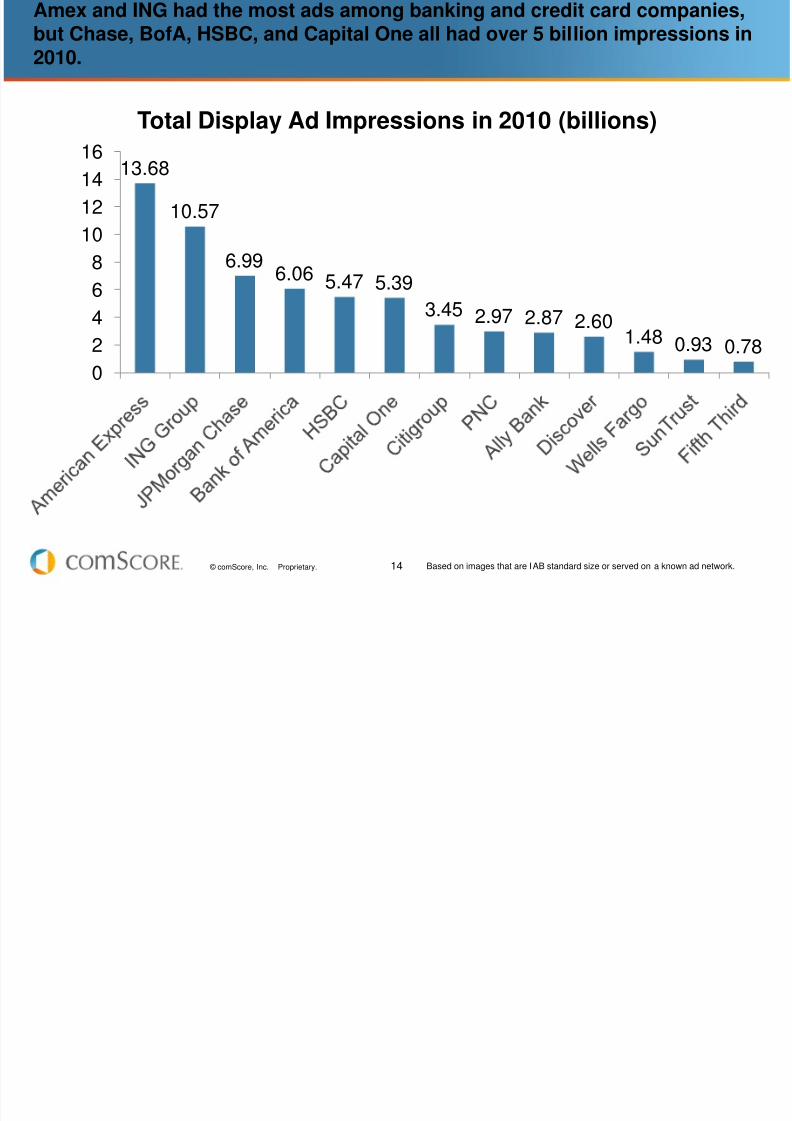
Amex and ING had the most ads among banking and credit card companies,but Chase, BofA, HSBC, and Capital One all had over 5 billion impressions in2010.
13.68
10.57
6.99
6.06 5.47 5.393.45 2.97 2.87 2.60
1.48 0.93 0.78
0
2
4
6
8
10
12
14
16
Total Display Ad Impressions in 2010 (billions)
Based on images that are IAB standard size or served on a known ad network.
8/3/2019 Financial Services Webinar - Feb 2011
http://slidepdf.com/reader/full/financial-services-webinar-feb-2011 15/39
15 © comScore, Inc. Proprietary.
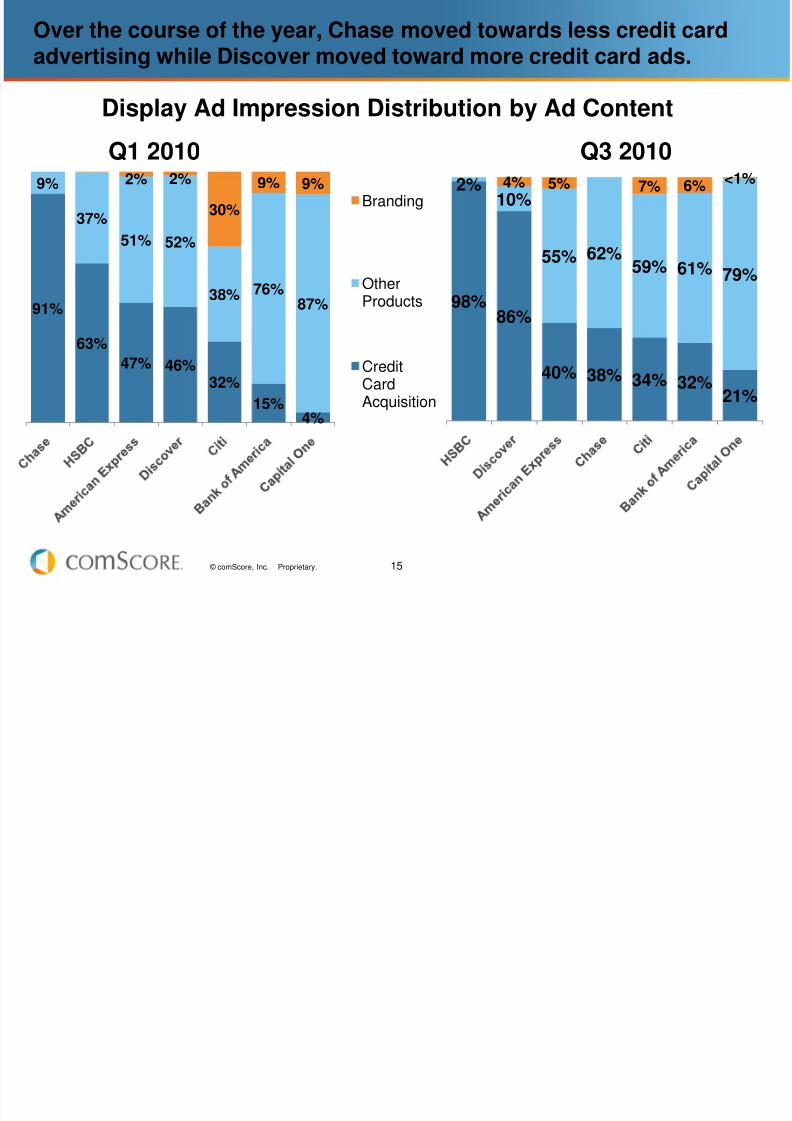
Over the course of the year, Chase moved towards less credit cardadvertising while Discover moved toward more credit card ads.
91%
63%
47% 46%32%
15%
4%
9%
37%
51% 52%
38% 76%87%
2% 2%
30%
9% 9%Branding
OtherProducts
CreditCardAcquisition
Display Ad Impression Distribution by Ad Content
Q1 2010 Q3 2010
98%86%
40% 38% 34% 32%21%
2%10%
55% 62%59%
61% 79%
4% 5% 7% 6% <1%
8/3/2019 Financial Services Webinar - Feb 2011
http://slidepdf.com/reader/full/financial-services-webinar-feb-2011 16/39
16 © comScore, Inc. Proprietary.
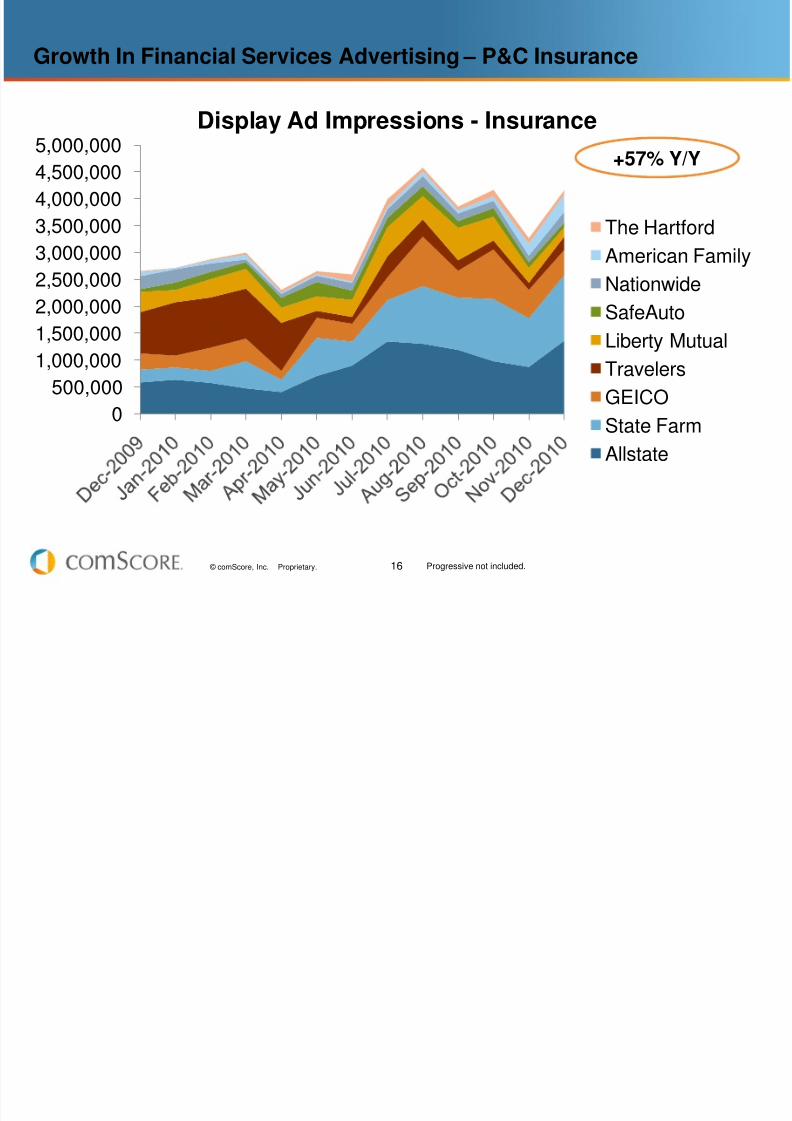
Growth In Financial Services Advertising – P&C Insurance
0
500,000
1,000,000
1,500,000
2,000,0002,500,000
3,000,000
3,500,000
4,000,000
4,500,000
5,000,000
Display Ad Impressions - Insurance
The Hartford
American Family
Nationwide
SafeAuto
Liberty Mutual
Travelers
GEICO
State Farm
Allstate
Progressive not included.
+57% Y/Y
8/3/2019 Financial Services Webinar - Feb 2011
http://slidepdf.com/reader/full/financial-services-webinar-feb-2011 17/39
17 © comScore, Inc. Proprietary.
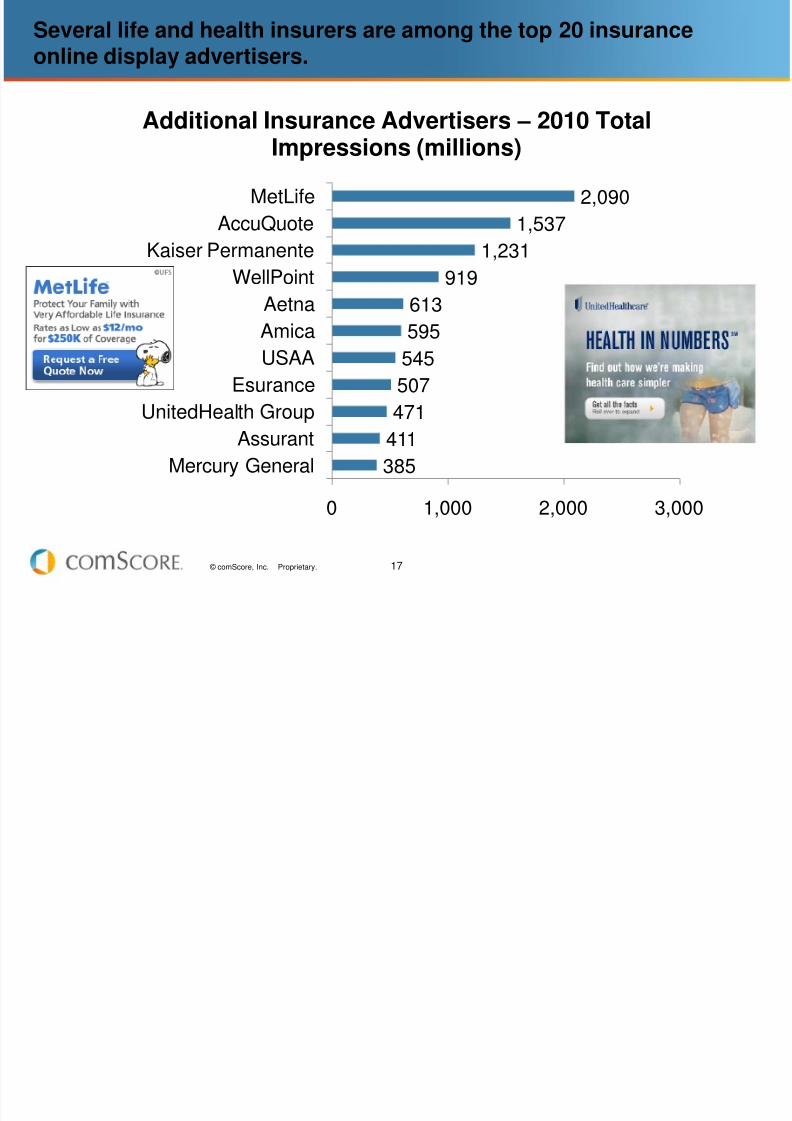
Several life and health insurers are among the top 20 insuranceonline display advertisers.
385
411471
507
545
595
613919
1,231
1,537
2,090
0 1,000 2,000 3,000
Mercury General
AssurantUnitedHealth Group
Esurance
USAA
Amica
AetnaWellPoint
Kaiser Permanente
AccuQuote
MetLife
Additional Insurance Advertisers – 2010 Total
Impressions (millions)
8/3/2019 Financial Services Webinar - Feb 2011
http://slidepdf.com/reader/full/financial-services-webinar-feb-2011 18/39
18 © comScore, Inc. Proprietary.
New Techniques in Campaign Optimization &
Measuring the Effectiveness of Financial ServicesCampaigns
8/3/2019 Financial Services Webinar - Feb 2011
http://slidepdf.com/reader/full/financial-services-webinar-feb-2011 19/39
19 © comScore, Inc. Proprietary.
How do I measure the effectiveness of and optimize my display adcampaign?
Campaign Delivery Measurement
– Measure: Who saw the campaign?
– Optimize: Which publishers are hitting my target best?
Behavioral Measurement
– Not clicks!
– Measure latent impacts in behavior versus a matched control group
Attitudinal Measurement
– Measure awareness, favorability, intent, and other attitudinal metrics
Creative Testing
– Know before an ad ever runs whether it will be successful
8/3/2019 Financial Services Webinar - Feb 2011
http://slidepdf.com/reader/full/financial-services-webinar-feb-2011 20/39
20 © comScore, Inc. Proprietary.
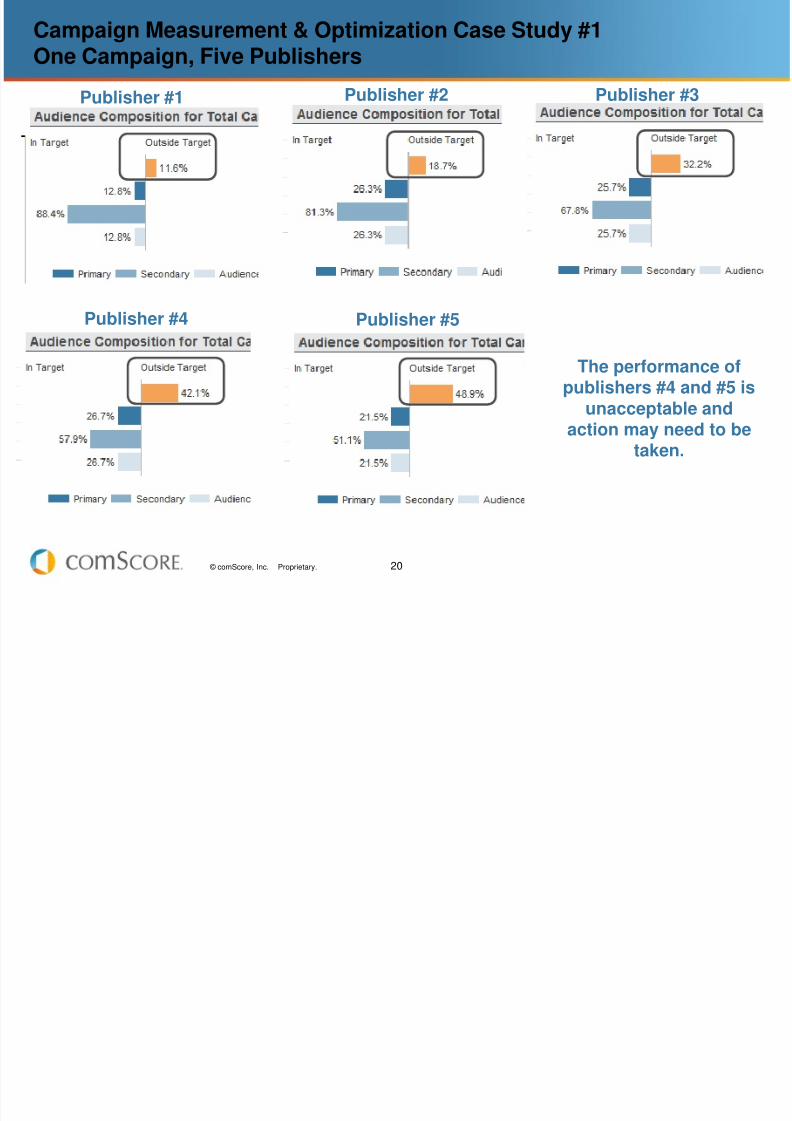
Campaign Measurement & Optimization Case Study #1One Campaign, Five Publishers
Publisher #1 Publisher #2 Publisher #3
Publisher #4 Publisher #5
The performance ofpublishers #4 and #5 is
unacceptable andaction may need to betaken.
8/3/2019 Financial Services Webinar - Feb 2011
http://slidepdf.com/reader/full/financial-services-webinar-feb-2011 21/39
21 © comScore, Inc. Proprietary.
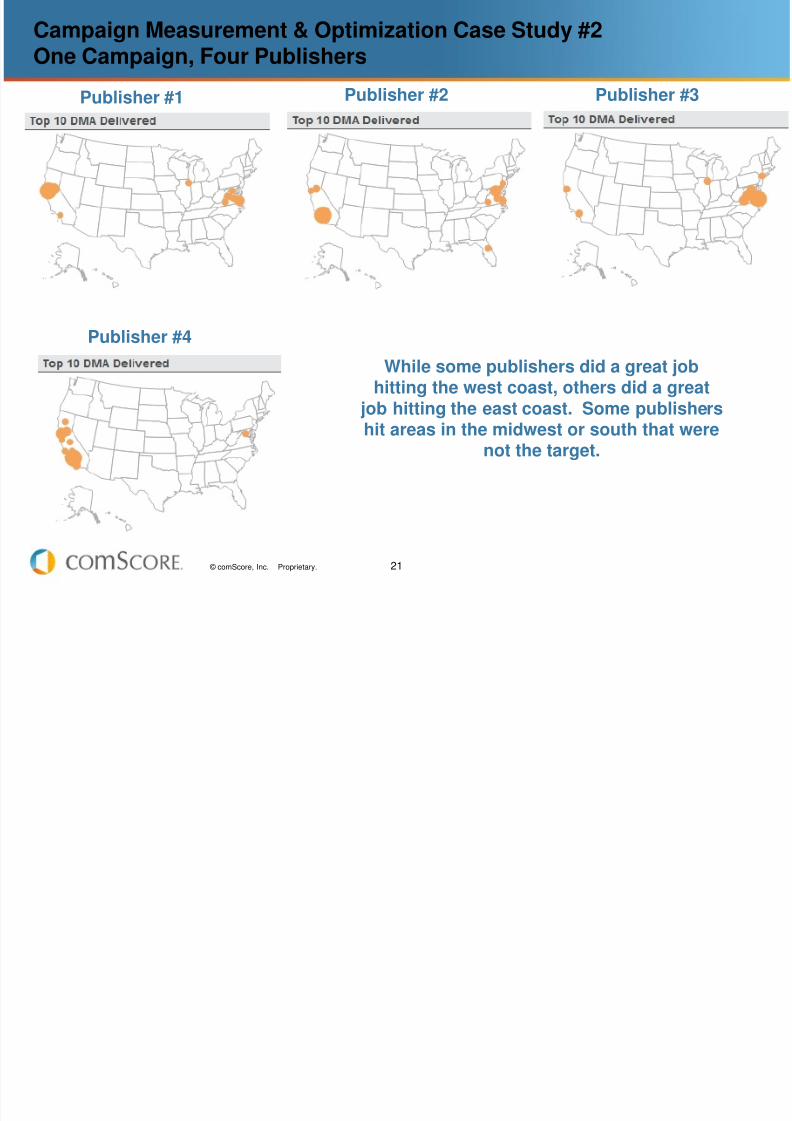
Campaign Measurement & Optimization Case Study #2One Campaign, Four Publishers
Publisher #1 Publisher #2 Publisher #3
Publisher #4
While some publishers did a great jobhitting the west coast, others did a great
job hitting the east coast. Some publishershit areas in the midwest or south that werenot the target.
8/3/2019 Financial Services Webinar - Feb 2011
http://slidepdf.com/reader/full/financial-services-webinar-feb-2011 22/39
22 © comScore, Inc. Proprietary.
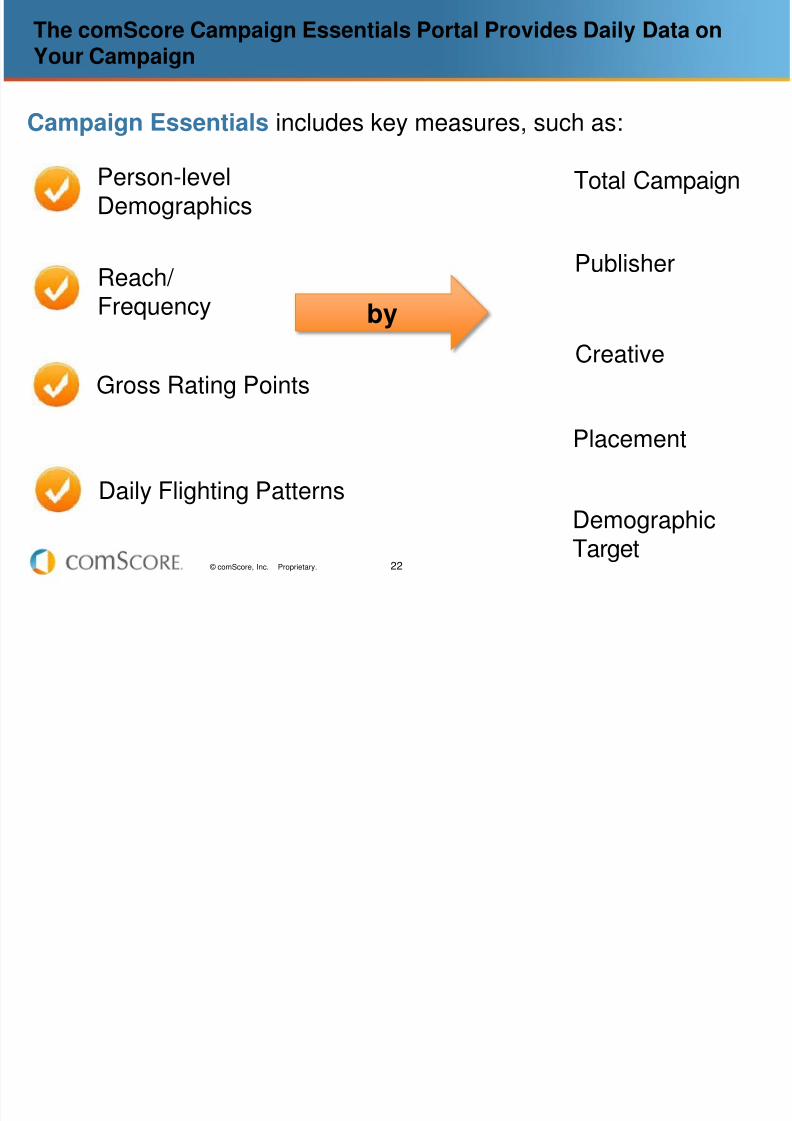
The comScore Campaign Essentials Portal Provides Daily Data onYour Campaign
Campaign Essentials includes key measures, such as:
Total Campaign
Publisher
Person-levelDemographics
Reach/ Frequency
Gross Rating Points
Daily Flighting Patterns
Creative
Placement
by
Demographic
Target
8/3/2019 Financial Services Webinar - Feb 2011
http://slidepdf.com/reader/full/financial-services-webinar-feb-2011 23/39
23 © comScore, Inc. Proprietary.
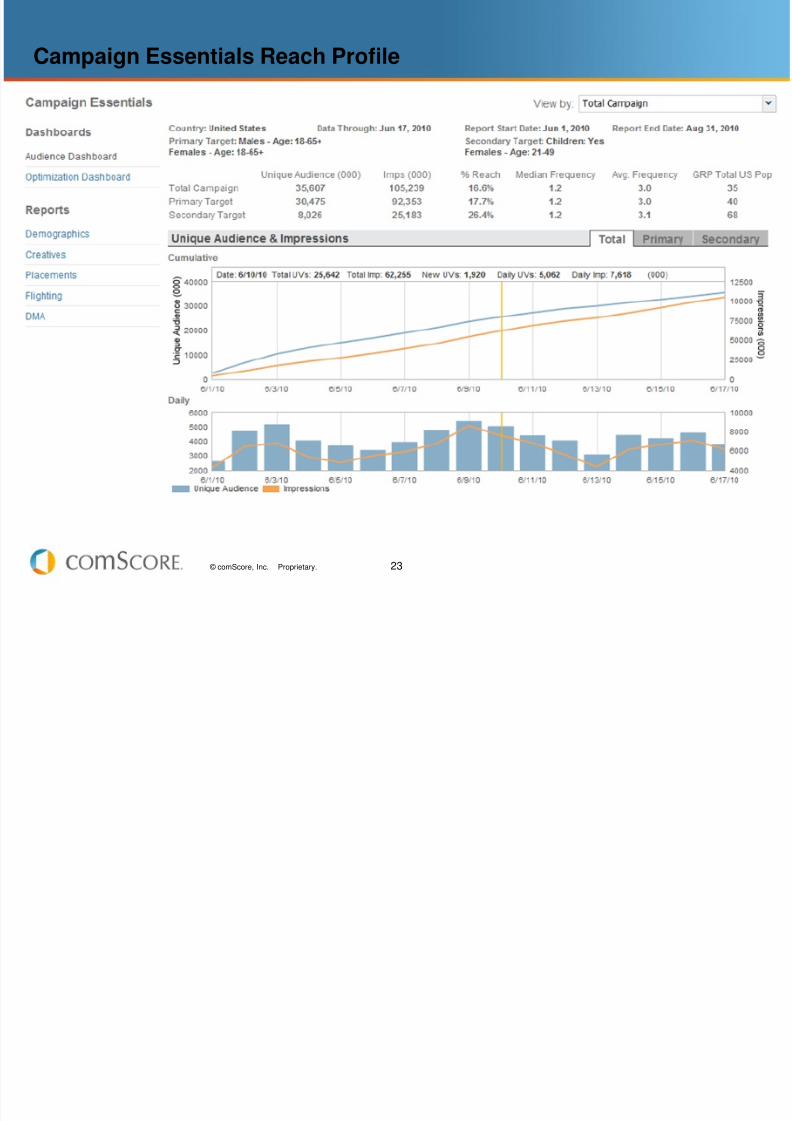
Campaign Essentials Reach Profile
8/3/2019 Financial Services Webinar - Feb 2011
http://slidepdf.com/reader/full/financial-services-webinar-feb-2011 24/39
24 © comScore, Inc. Proprietary.
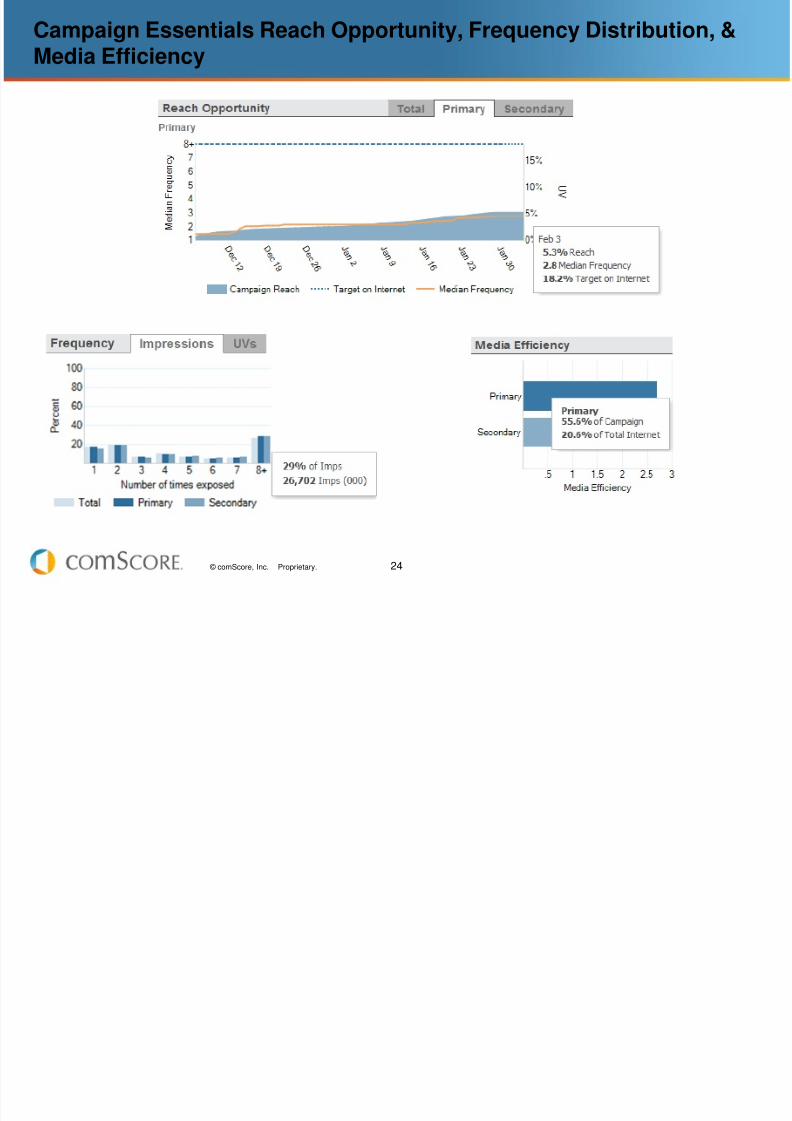
Campaign Essentials Reach Opportunity, Frequency Distribution, &Media Efficiency
8/3/2019 Financial Services Webinar - Feb 2011
http://slidepdf.com/reader/full/financial-services-webinar-feb-2011 25/39
25 © comScore, Inc. Proprietary.
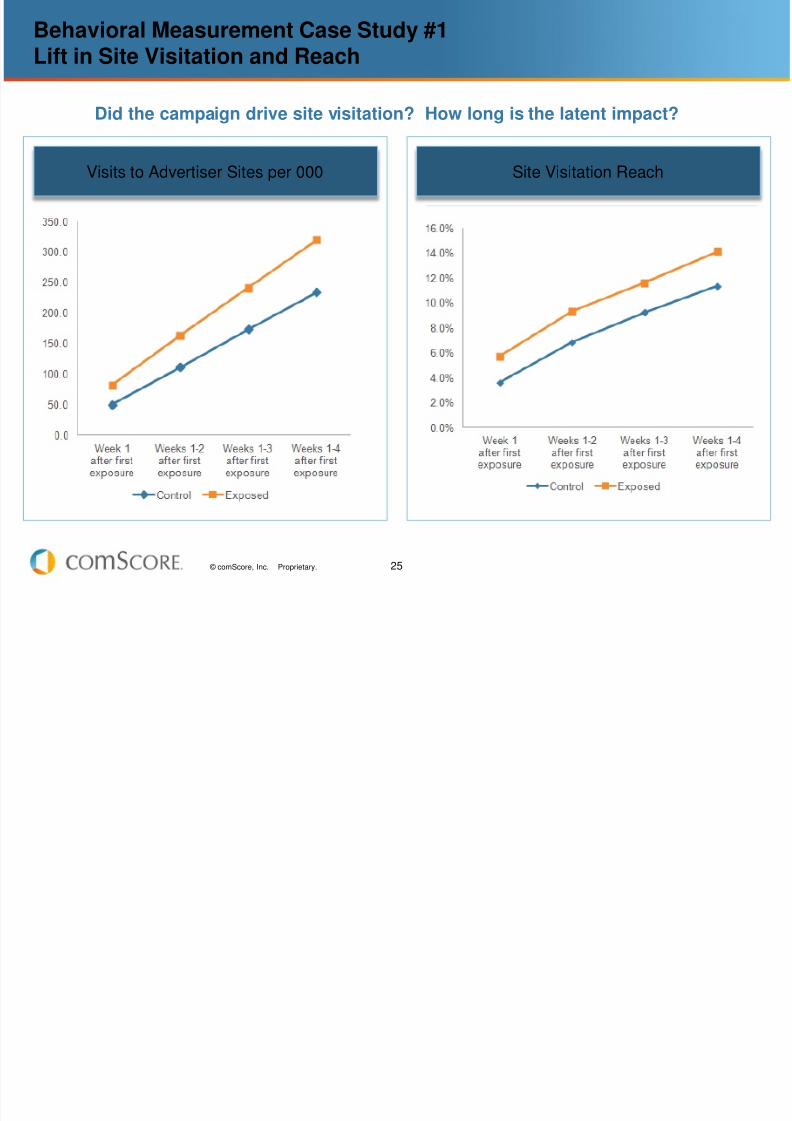
Behavioral Measurement Case Study #1Lift in Site Visitation and Reach
Visits to Advertiser Sites per 000 Site Visitation Reach
Did the campaign drive site visitation? How long is the latent impact?
8/3/2019 Financial Services Webinar - Feb 2011
http://slidepdf.com/reader/full/financial-services-webinar-feb-2011 26/39
26 © comScore, Inc. Proprietary.
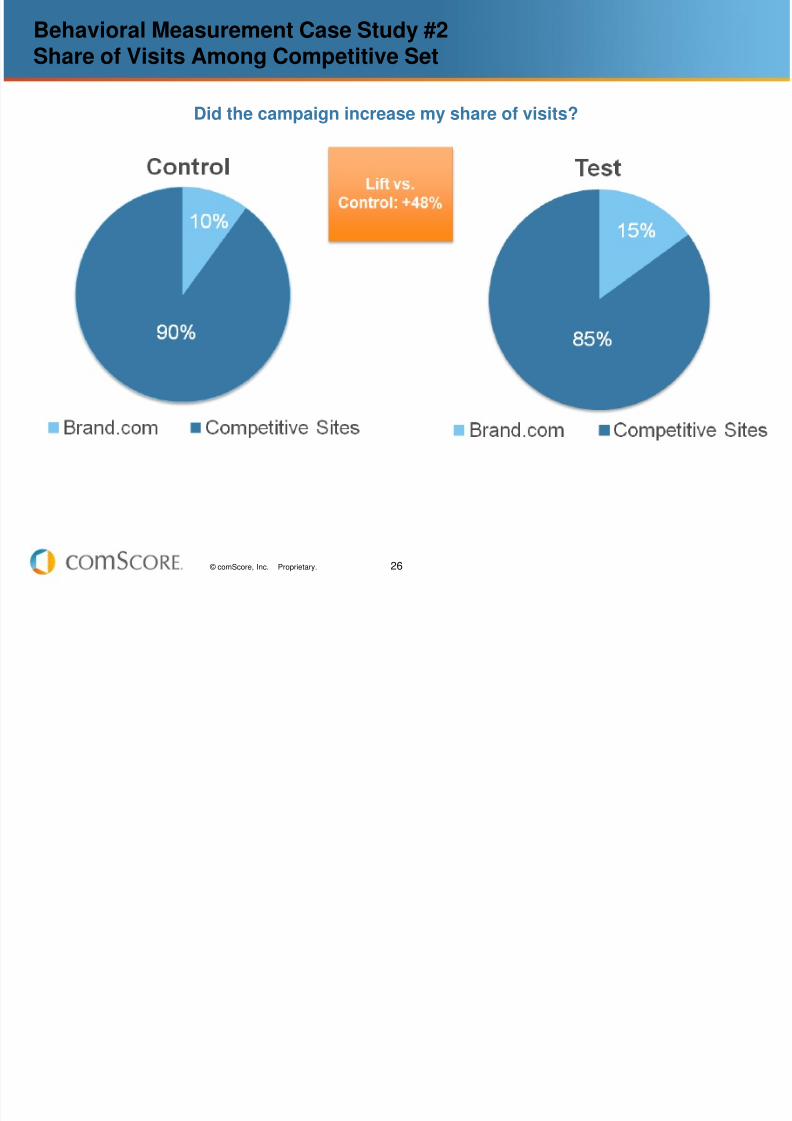
Behavioral Measurement Case Study #2Share of Visits Among Competitive Set
Did the campaign increase my share of visits?
8/3/2019 Financial Services Webinar - Feb 2011
http://slidepdf.com/reader/full/financial-services-webinar-feb-2011 27/39
27 © comScore, Inc. Proprietary.
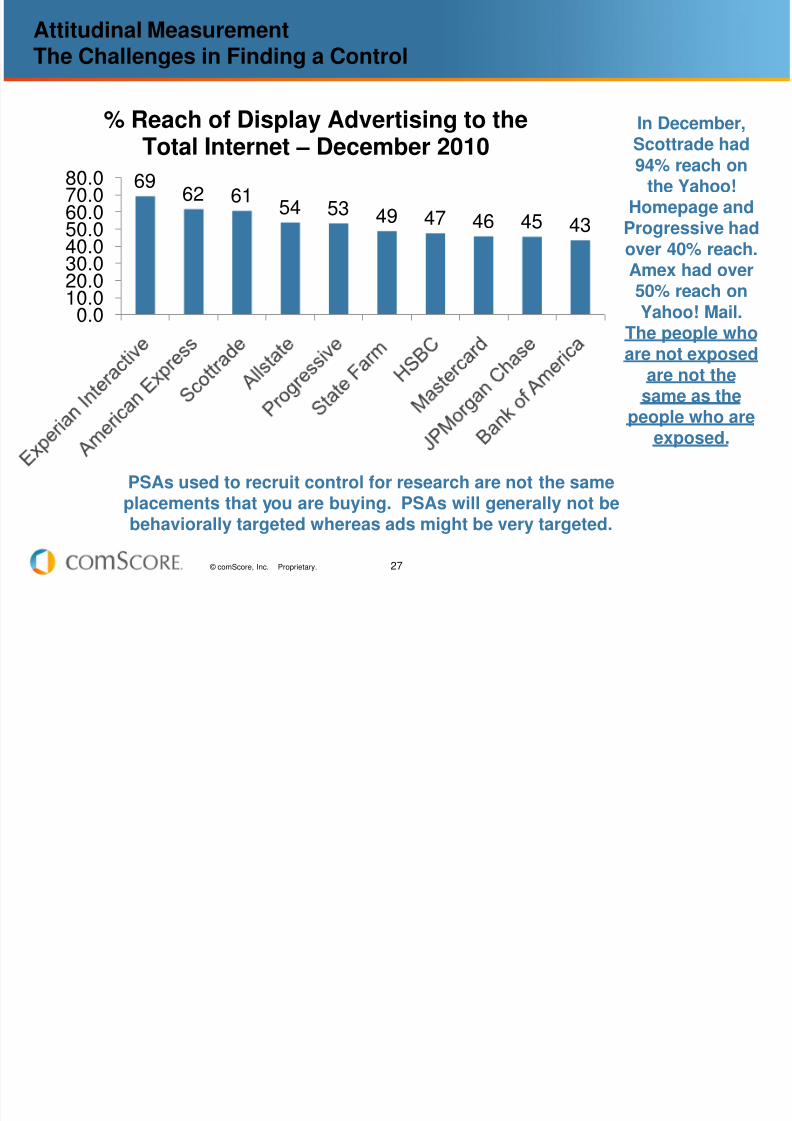
Attitudinal MeasurementThe Challenges in Finding a Control
6962 61
54 53 49 47 46 45 43
0.010.020.0
30.040.050.060.070.080.0
% Reach of Display Advertising to the
Total Internet – December 2010
In December,
Scottrade had94% reach on
the Yahoo!Homepage and
Progressive hadover 40% reach.Amex had over50% reach onYahoo! Mail.
The people whoare not exposed
are not thesame as the
people who areexposed.
PSAs used to recruit control for research are not the sameplacements that you are buying. PSAs will generally not bebehaviorally targeted whereas ads might be very targeted.
8/3/2019 Financial Services Webinar - Feb 2011
http://slidepdf.com/reader/full/financial-services-webinar-feb-2011 28/39
28 © comScore, Inc. Proprietary.
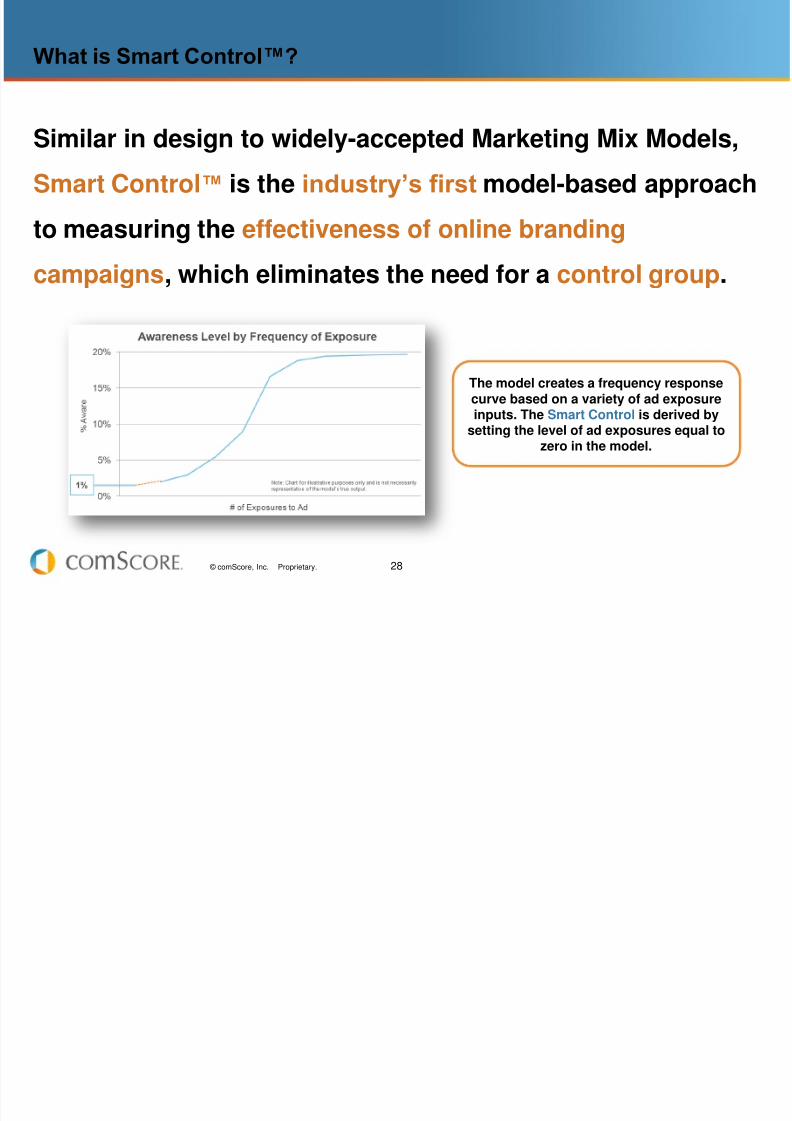
What is Smart Control™?
Similar in design to widely-accepted Marketing Mix Models,
Smart Control™ is the industry’s first model-based approach
to measuring the effectiveness of online branding
campaigns, which eliminates the need for a control group.
The model creates a frequency responsecurve based on a variety of ad exposure
inputs. The Smart Control is derived bysetting the level of ad exposures equal to
zero in the model.
8/3/2019 Financial Services Webinar - Feb 2011
http://slidepdf.com/reader/full/financial-services-webinar-feb-2011 29/39
29 © comScore, Inc. Proprietary.
Why Smart Control™?
Money saved
Greater efficiency
More accuracy
Deeper insights
No control means…
8/3/2019 Financial Services Webinar - Feb 2011
http://slidepdf.com/reader/full/financial-services-webinar-feb-2011 30/39
30 © comScore, Inc. Proprietary.
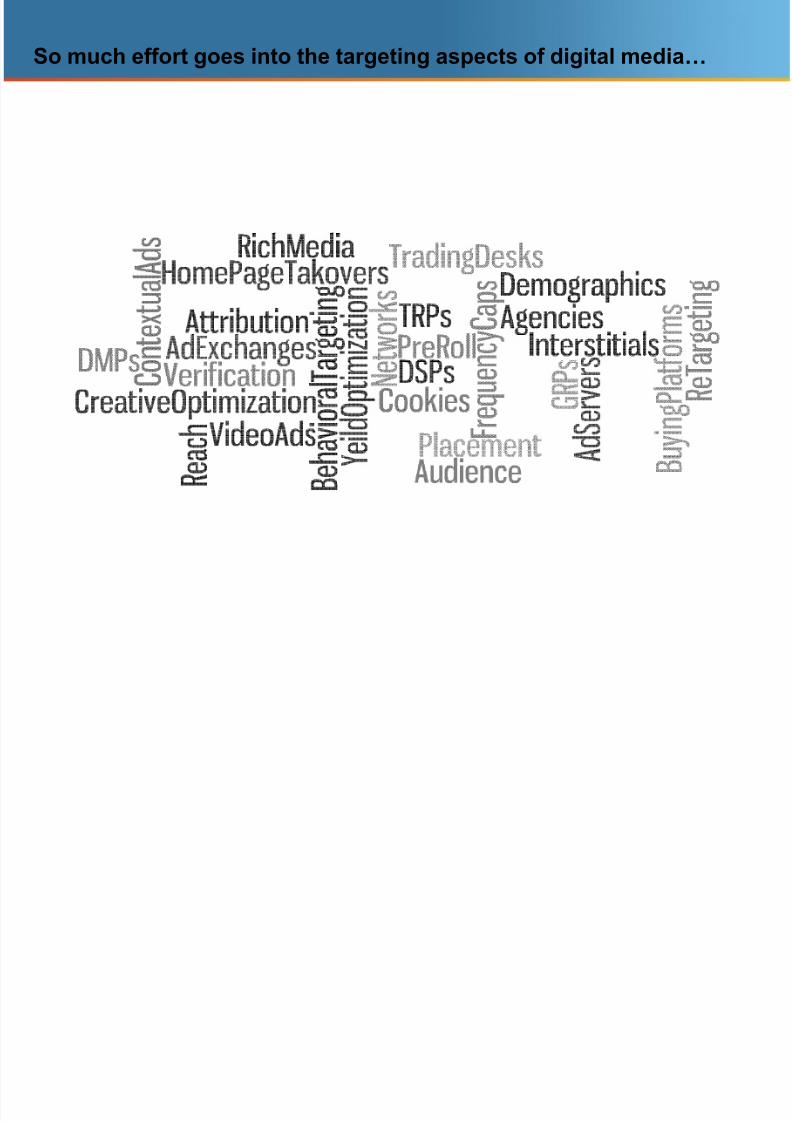
So much effort goes into the targeting aspects of digital media…
8/3/2019 Financial Services Webinar - Feb 2011
http://slidepdf.com/reader/full/financial-services-webinar-feb-2011 31/39
31 © comScore, Inc. Proprietary.
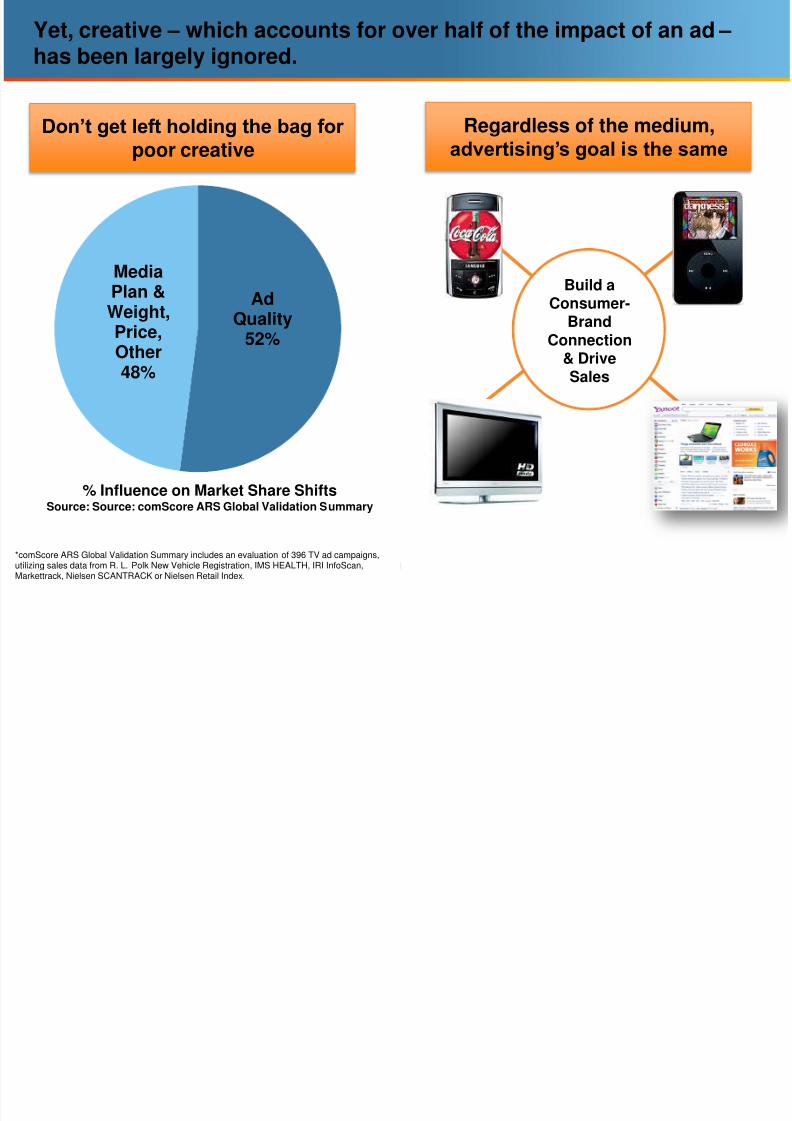
Yet, creative – which accounts for over half of the impact of an ad –
has been largely ignored.
AdQuality
52%
MediaPlan &Weight,Price,Other48%
% Influence on Market Share ShiftsSource: Source: comScore ARS Global Validation Summary
*comScore ARS Global Validation Summary includes an evaluation of 396 TV ad campaigns,utilizing sales data from R. L. Polk New Vehicle Registration, IMS HEALTH, IRI InfoScan,Markettrack, Nielsen SCANTRACK or Nielsen Retail Index.
Regardless of the medium,
advertising’s goal is the same
Don’t get left holding the bag for
poor creative
Build aConsumer-
BrandConnection
& DriveSales
8/3/2019 Financial Services Webinar - Feb 2011
http://slidepdf.com/reader/full/financial-services-webinar-feb-2011 32/39
32 © comScore, Inc. Proprietary.
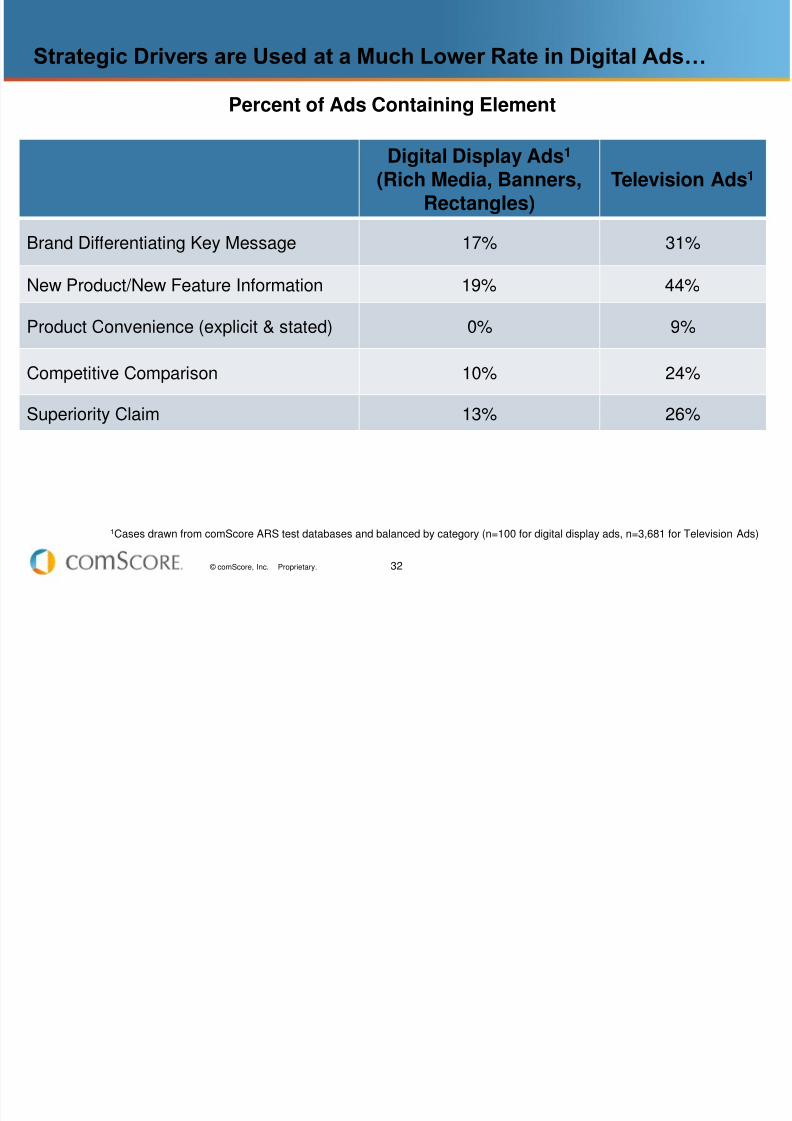
1Cases drawn from comScore ARS test databases and balanced by category (n=100 for digital display ads, n=3,681 for Television Ads)
Strategic Drivers are Used at a Much Lower Rate in Digital Ads…
Digital Display Ads1
(Rich Media, Banners,Rectangles)
Television Ads1
Brand Differentiating Key Message 17% 31%
New Product/New Feature Information 19% 44%
Product Convenience (explicit & stated) 0% 9%
Competitive Comparison 10% 24%
Superiority Claim 13% 26%
Percent of Ads Containing Element
8/3/2019 Financial Services Webinar - Feb 2011
http://slidepdf.com/reader/full/financial-services-webinar-feb-2011 33/39
33 © comScore, Inc. Proprietary.
Elementspresent
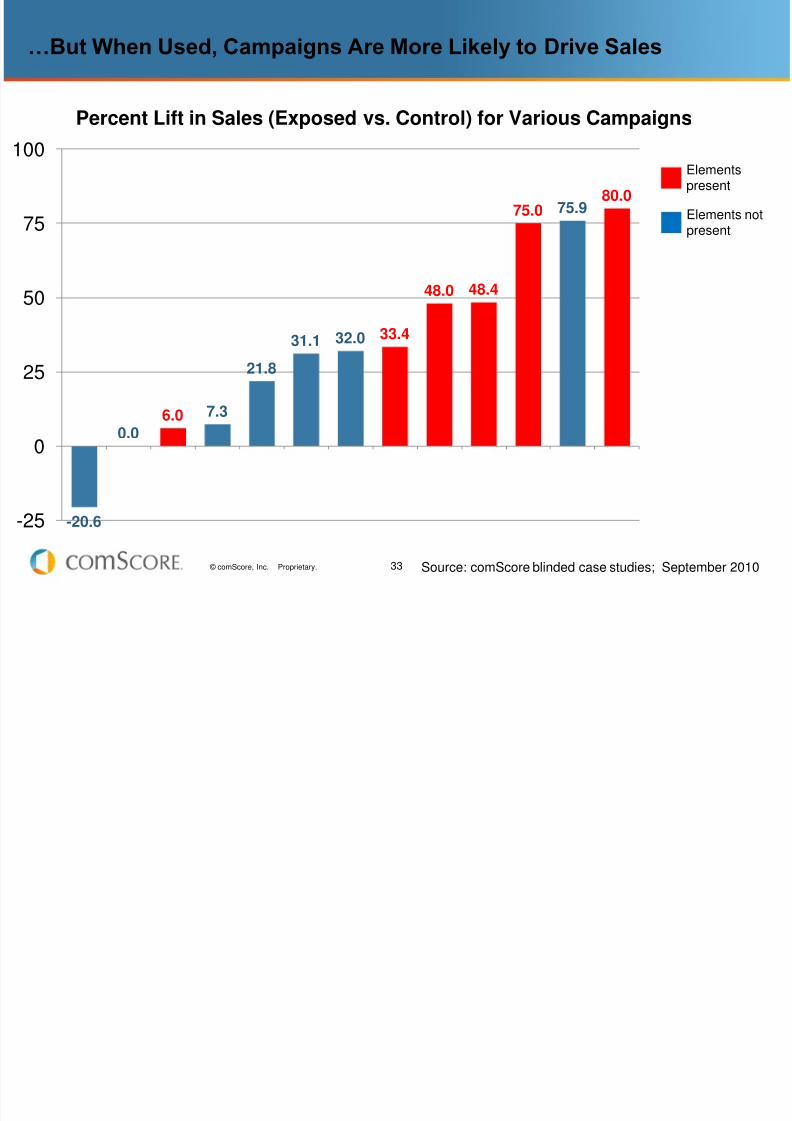
…But When Used, Campaigns Are More Likely to Drive Sales
-20.6
0.06.0 7.3
21.8
31.1 32.0 33.4
48.0 48.4
75.0 75.980.0
-25
0
25
50
75
100
Percent Lift in Sales (Exposed vs. Control) for Various Campaigns
Elements notpresent
Source: comScore blinded case studies; September 2010
R li Th F ll I t Of Di it l Ad ti i Th h P t ti
8/3/2019 Financial Services Webinar - Feb 2011
http://slidepdf.com/reader/full/financial-services-webinar-feb-2011 34/39
34 © comScore, Inc. Proprietary.
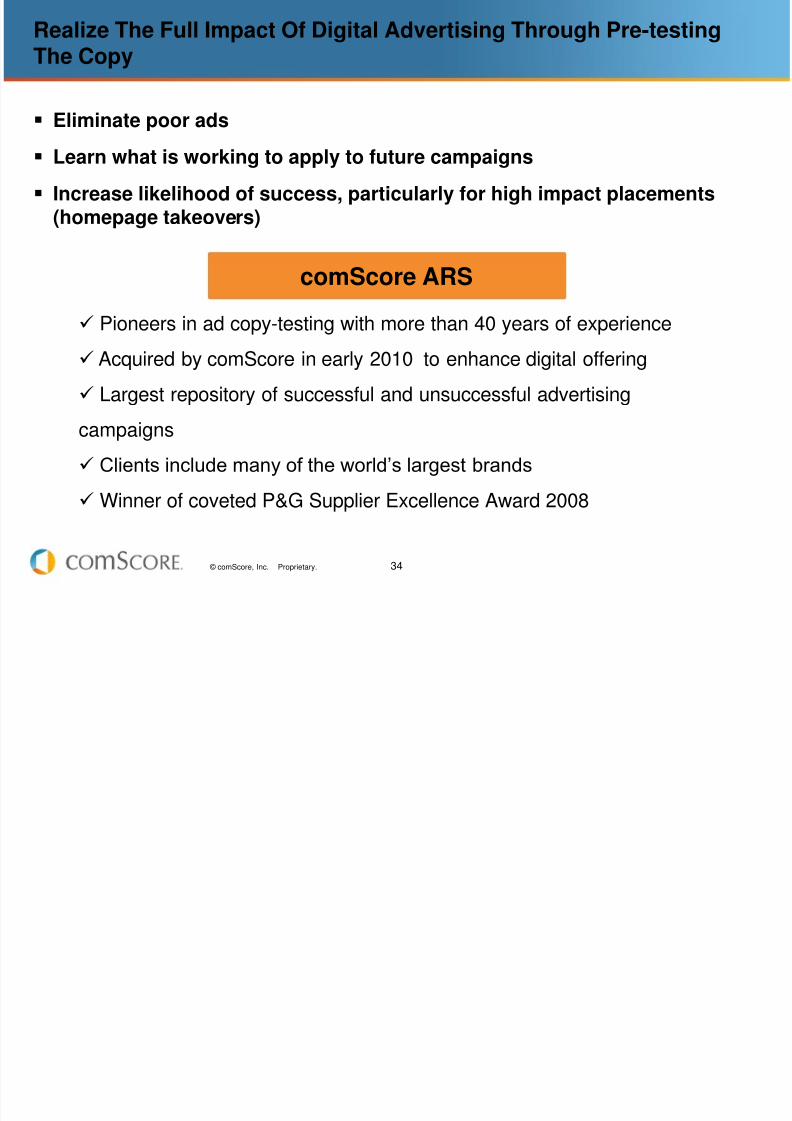
Realize The Full Impact Of Digital Advertising Through Pre-testingThe Copy
Eliminate poor ads
Learn what is working to apply to future campaigns
Increase likelihood of success, particularly for high impact placements(homepage takeovers)
comScore ARS
Pioneers in ad copy-testing with more than 40 years of experience
Acquired by comScore in early 2010 to enhance digital offering
Largest repository of successful and unsuccessful advertising
campaigns
Clients include many of the world’s largest brands
Winner of coveted P&G Supplier Excellence Award 2008
8/3/2019 Financial Services Webinar - Feb 2011
http://slidepdf.com/reader/full/financial-services-webinar-feb-2011 35/39
35 © comScore, Inc. Proprietary.
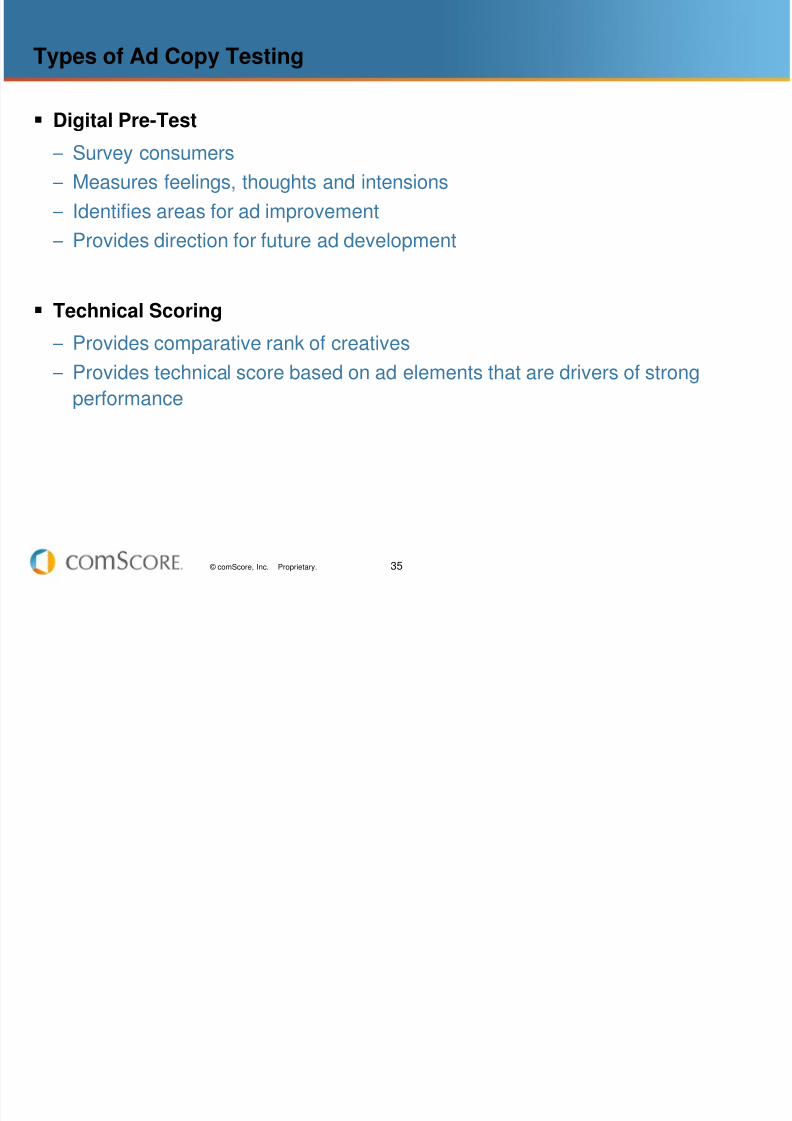
Types of Ad Copy Testing
Digital Pre-Test
– Survey consumers
– Measures feelings, thoughts and intensions
– Identifies areas for ad improvement
– Provides direction for future ad development
Technical Scoring
– Provides comparative rank of creatives
– Provides technical score based on ad elements that are drivers of strong
performance
8/3/2019 Financial Services Webinar - Feb 2011
http://slidepdf.com/reader/full/financial-services-webinar-feb-2011 36/39
36 © comScore, Inc. Proprietary.
In Summary
8/3/2019 Financial Services Webinar - Feb 2011
http://slidepdf.com/reader/full/financial-services-webinar-feb-2011 37/39
37 © comScore, Inc. Proprietary.
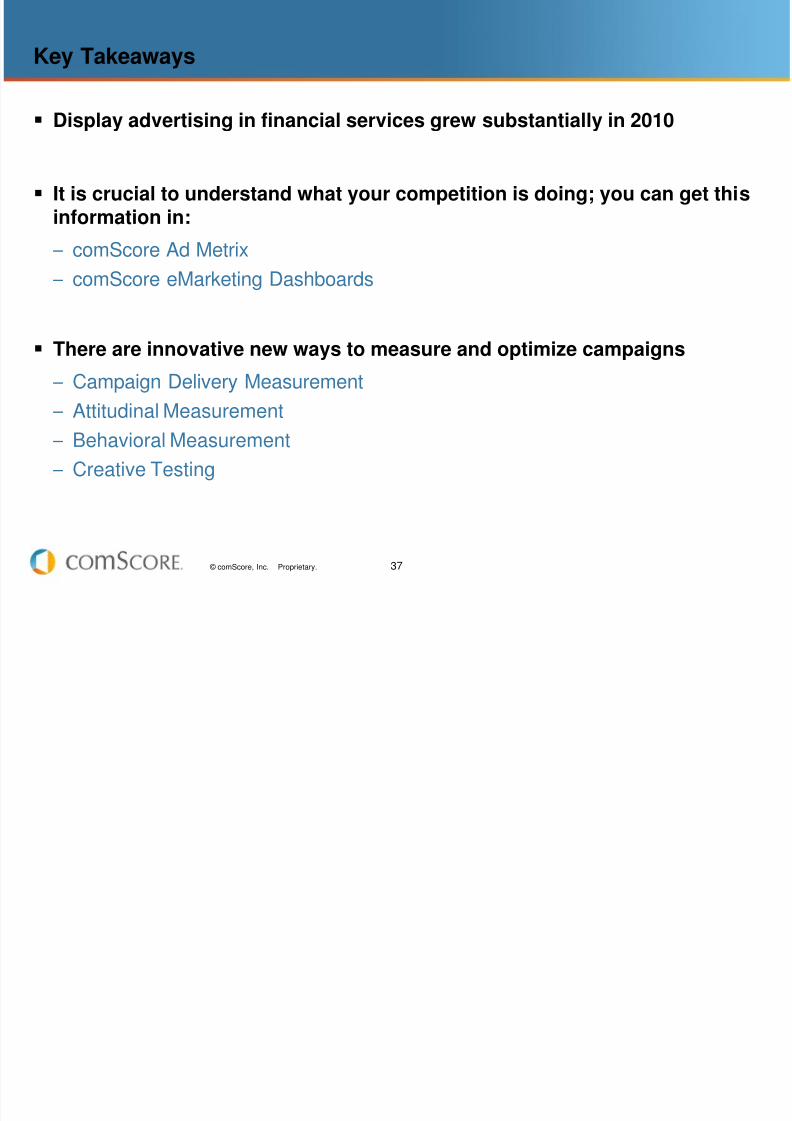
Key Takeaways
Display advertising in financial services grew substantially in 2010
It is crucial to understand what your competition is doing; you can get thisinformation in:
– comScore Ad Metrix
– comScore eMarketing Dashboards
There are innovative new ways to measure and optimize campaigns
– Campaign Delivery Measurement
– Attitudinal Measurement – Behavioral Measurement
– Creative Testing
8/3/2019 Financial Services Webinar - Feb 2011
http://slidepdf.com/reader/full/financial-services-webinar-feb-2011 38/39
38 © comScore, Inc. Proprietary.
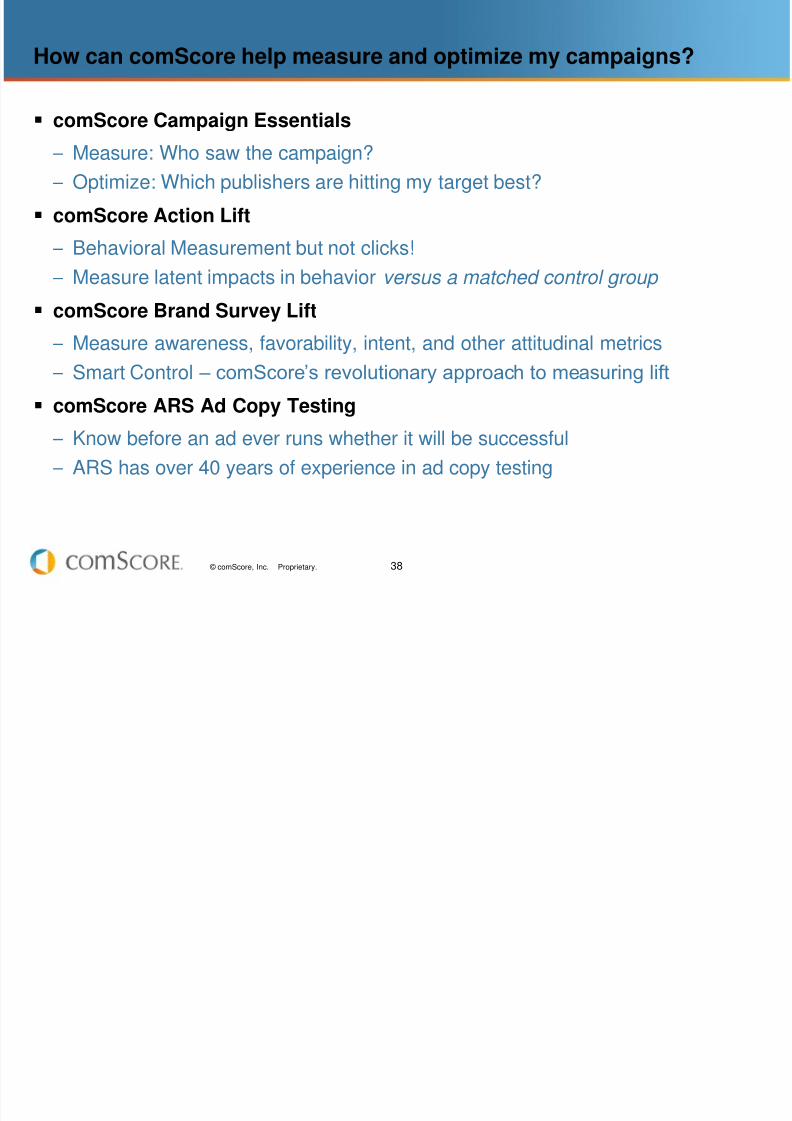
How can comScore help measure and optimize my campaigns?
comScore Campaign Essentials
– Measure: Who saw the campaign?
– Optimize: Which publishers are hitting my target best?
comScore Action Lift
– Behavioral Measurement but not clicks!
– Measure latent impacts in behavior versus a matched control group comScore Brand Survey Lift
– Measure awareness, favorability, intent, and other attitudinal metrics
– Smart Control – comScore’s revolutionary approach to measuring lift
comScore ARS Ad Copy Testing
– Know before an ad ever runs whether it will be successful
– ARS has over 40 years of experience in ad copy testing

8/3/2019 Financial Services Webinar - Feb 2011
http://slidepdf.com/reader/full/financial-services-webinar-feb-2011 39/39
For more information: Susan Engleson Kleinman,[email protected]
Questions?Thank You!