Embed Size (px)
Citation preview

THE QUARTERLY REPORT ON THE RESULTS OF THE LONG-TERM INSURANCE INDUSTRY FOR THE PERIOD ENDED 30 SEPTEMBER 2015 .
Pag
e1
FINANCIAL SERVICES BOARD Insurance Division
THE QUARTERLY REPORT ON THE RESULTS OF THE LONG-TERM INSURANCE INDUSTRY FOR THE PERIOD ENDED 30 SEPTEMBER 2015

THE QUARTERLY REPORT ON THE RESULTS OF THE LONG-TERM INSURANCE INDUSTRY FOR THE PERIOD ENDED 30 SEPTEMBER 2015 .
Pag
e2
CONTENTS
SUMMARY OF RESULTS – PRIMARY INDUSTRY ................................................................ 3
INDUSTRY RESULTS – TYPICAL INSURERS ....................................................................... 6
INDUSTRY RESULTS – NICHE INSURERS ........................................................................... 9
INDUSTRY RESULTS –CELL CAPTIVE INSURERS ............................................................ 12
INDUSTRY RESULTS – LINKED INVESTMENT INSURERS ............................................... 15
INDUSTRY RESULTS – REINSURERS ................................................................................ 18
INDUSTRY RESULTS – ASSISTANCE INSURERS ............................................................. 21

THE QUARTERLY REPORT ON THE RESULTS OF THE LONG-TERM INSURANCE INDUSTRY FOR THE PERIOD ENDED 30 SEPTEMBER 2015 .
Pag
e3
SPECIAL REPORT ON THE RESULTS OF THE LONG-TERM INSURANCE INDUSTRY
** Expressed as a percentage of the number of new policies issued during the period.
12 months
ended
December
2013
12 months
ended
December
2014
9 months
ended
September
2014
9 months
ended
September
2015
Gross premium R’m 429 703 438 848 320 560 335 236
Reinsurance R’m 22 325 25 079 18 935 9 960
Net premiums- Recurring R'm 139 540 143 170 105 087 113 304
Net premiums- Non-recurring R'm 267 838 270 599 196 538 211 972
Net claims paid R’m 353 862 386 231 272 890 316 759
Total assets R’m 2 278 148 2 504 650 2 445 879 2 608 165
Total liabilities R’m 2 150 072 2 362 901 2 312 871 2 457 740
CAR amount (after management action) R’m 38 021 41 086 39 301 42 499
Number of policies at the end of period 48 123 128 45 416 275 47 015 296 45 417 261
Number of schemes at the end of period 50 724 58 845 57 849 59 358
Performance indicators:
Net premium increase (year to year) % 20 2 -2 8
Claims (as % of net premiums) 87 93 90 97
Commission (as % of net premiums) 4 4 4 4
Management Expenses (as % of net premiums) 9 9 9 10
Number of policies increase (yr to yr) % -3 -6 -1 -3
Individual lapse %** 54 76 75 68
Individual lapse % (in-force policies) 17 21 16 14
Individual termination %** 12 10 9 13
Individual termination % (in-force policies) 4 3 2 3
Individual contractual termination %** 13 14 14 12
Individual expiry %** 13 4 4 7
Fund & group schemes termination %** 111 66 72 88
CAR cover ratio (median) 2.7 2.5 2.5 2.5
SUMMARY OF RESULTS – PRIMARY INDUSTRY

THE QUARTERLY REPORT ON THE RESULTS OF THE LONG-TERM INSURANCE INDUSTRY FOR THE PERIOD ENDED 30 SEPTEMBER 2015 .
Pag
e4
Classes of policies
This diagram indicates the net premiums according to the classes of policies of primary insurers (excluding reinsurers) for the period ended September 2015 as well as comparative figures for the period ended September 2014:

THE QUARTERLY REPORT ON THE RESULTS OF THE LONG-TERM INSURANCE INDUSTRY FOR THE PERIOD ENDED 30 SEPTEMBER 2015 .
Pag
e5
Investment composition
The spread and categories of assets for primary insurers for the calendar years of 2013 to 2014 as well as period ended September 2015 and comparative period of September 2014:
CAR cover ratios - primary insurers
Free Assets to capital adequacy requirement (CAR) of primary insurers excluding the run-off business.
R’mill ion % R’mill ion % R’mill ion % R’mill ion %
Cash and deposits 193 901 9 186 022 7 207 708 8 217 882 8
Government and semi-government 178 194 8 190 478 8 186 442 8 194 305 7
Equities and collective investment schemes 1 470 533 65 1 637 469 65 1 572 081 64 1 659 025 64
Debentures and loan stock 215 743 9 257 257 10 238 967 10 287 133 11
Immovable properties 49 571 2 49 473 2 47 928 2 51 512 2
Fixed assets 2 367 0 2 153 0 2 029 0 1 889 0
Debtors 133 930 6 147 790 6 156 700 6 160 650 7
Other Assets 33 909 1 34 007 1 34 024 1 35 767 1
Total 2 278 148 100 2 504 650 100 2 445 879 100 2 608 165 100
Kinds of assets
As at
December 2013
As at
December 2014
As at
September 2014
As at
September 2015
December 2013 December 2014 September 2014 September 2015
Covered 0-1 times 0 2 1 0
Covered 1-2 times 19 23 22 25
Covered 2-5 times 32 30 30 29
Covered 5-10 times 11 6 10 8
Covered 10+ times 3 6 4 6
CAR cover ratio

THE QUARTERLY REPORT ON THE RESULTS OF THE LONG-TERM INSURANCE INDUSTRY FOR THE PERIOD ENDED 30 SEPTEMBER 2015 .
Pag
e6
rs1
1
Typical insurers, for the purpose of this report, are those insurers who offer most of the six classes of business as defined in the Act, in the primary market. * Return on investment is calculated according to the formula R=2i/A+B-i where i is all investment income plus realised and unrealised surplus on sale of investments, A is initial value of investments and B is end value of investments. ** Expressed as a percentage of the number of new policies issued during the period.
12 months
ended
December
2013
12 months
ended
December
2014
9 months
ended
September
2014
9 months
ended
September
2015
Gross premium R’m 267 760 289 441 206 973 219 454
Reinsurance R’m 18 805 21 254 16 992 8 534
Net premiums- Recurring R'm 131 092 130 222 95 166 104 158
Net premiums- Non-recurring R'm 117 863 137 966 94 816 106 762
Net claims paid R’m 213 841 223 741 163 118 200 306
Total assets R’m 1 648 275 1 846 479 1 753 988 1 928 283
Total liabilities R’m 1 526 219 1 716 718 1 632 904 1 789 888
CAR amount (after management action) R’m 35 883 38 403 36 637 39 802
Number of policies at the end of period 42 028 147 37 567 120 37 739 135 37 136 192
Number of schemes at the end of period 50 649 49 396 48 625 50 886
Performance indicators:
Net premium increase (year to year) % 14 8 4 11
Claims (as % of net premiums) 86 83 86 95
Commission (as % of net premiums) 6 5 5 5
Management Expenses (as % of net premiums) 14 13 13 14
Investment yield %* 16 10 7 4
Number of policies increase (yr to yr) % -5 -11 -9 -2
Individual lapse %** 61 76 76 70
Individual lapse % (in-force policies) 17 20 15 13
Individual termination %** 9 9 9 11
Individual termination % (in-force policies) 3 2 2 2
Individual contractual termination %** 16 7 7 7
Individual expiry %** 12 1 1 1
Fund & group schemes termination %** 115 67 75 63
CAR cover ratio (median) 2.8 2.2 2.3 2.6
INDUSTRY RESULTS – TYPICAL INSURERS1

THE QUARTERLY REPORT ON THE RESULTS OF THE LONG-TERM INSURANCE INDUSTRY FOR THE PERIOD ENDED 30 SEPTEMBER 2015 .
Pag
e7
Classes of policies
This diagram indicates the net premiums according to the classes of policies of typical insurers for the period ended September 2015 as well as comparative figures for the period ended September 2014:

THE QUARTERLY REPORT ON THE RESULTS OF THE LONG-TERM INSURANCE INDUSTRY FOR THE PERIOD ENDED 30 SEPTEMBER 2015 .
Pag
e8
Investment composition
The spread and categories of assets for typical insurers for the calendar years of 2013 to 2014 as well
as period ended September 2015 and comparative period of September 2014:
CAR cover ratios - Typical insurers
The following table indicates the ratio of free assets to capital adequacy requirement (CAR) of the typical insurance companies.
R’mill ion % R’mill ion % R’mill ion % R’mill ion %
Cash and deposits 125 846 8 120 950 7 136 310 8 147 130 8
Government and semi-government 111 038 7 120 349 7 115 449 7 121 826 6
Equities and collective investment schemes 1 071 350 65 1 214 140 66 1 144 359 65 1 219 767 63
Debentures and loan stock 187 716 11 226 752 12 208 282 12 256 296 13
Immovable properties 48 702 3 48 051 3 46 567 3 50 178 3
Fixed assets 2 348 0 2 130 0 2 009 0 1 870 0
Debtors 99 031 6 111 742 6 98 756 6 125 603 7
Other Assets 2 243 0 2 366 0 2 255 0 5 612 0
Total 1 648 275 100 1 846 479 100 1 753 988 100 1 928 283 100
Kinds of assets
As at
December 2013
As at
December 2014
As at
September 2014
As at
September 2015
December 2013 December 2014 September 2014 September 2015
Covered 0-1 times 0 2 1 0
Covered 1-2 times 7 9 8 9
Covered 2-5 times 16 13 15 15
Covered 5-10 times 2 1 2 2
Covered 10+ times 1 1 0 1
CAR cover ratio
THE QUARTERLY REPORT ON THE RESULTS OF THE LONG-TERM INSURANCE INDUSTRY FOR THE PERIOD ENDED 30 SEPTEMBER 2015 .
Pag
e9
C e ll captives2
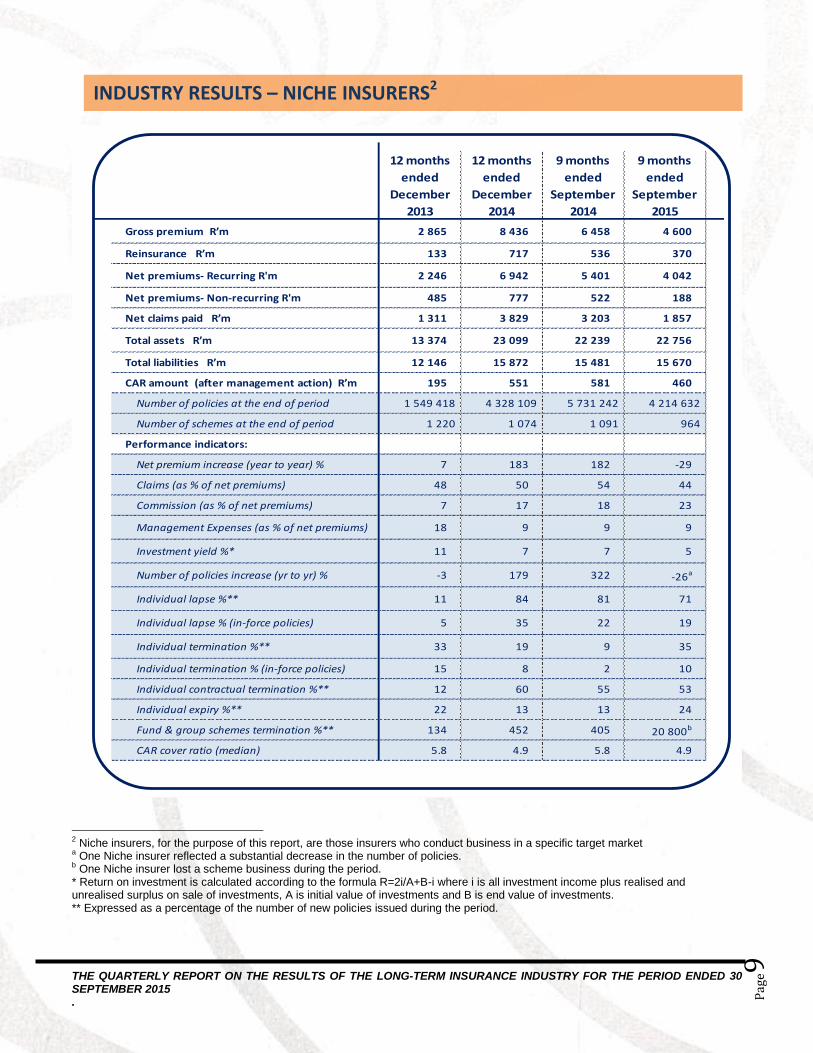
2 Niche insurers, for the purpose of this report, are those insurers who conduct business in a specific target market a One Niche insurer reflected a substantial decrease in the number of policies. b One Niche insurer lost a scheme business during the period. * Return on investment is calculated according to the formula R=2i/A+B-i where i is all investment income plus realised and unrealised surplus on sale of investments, A is initial value of investments and B is end value of investments. ** Expressed as a percentage of the number of new policies issued during the period.
12 months
ended
December
2013
12 months
ended
December
2014
9 months
ended
September
2014
9 months
ended
September
2015
Gross premium R’m 2 865 8 436 6 458 4 600
Reinsurance R’m 133 717 536 370
Net premiums- Recurring R'm 2 246 6 942 5 401 4 042
Net premiums- Non-recurring R'm 485 777 522 188
Net claims paid R’m 1 311 3 829 3 203 1 857
Total assets R’m 13 374 23 099 22 239 22 756
Total liabilities R’m 12 146 15 872 15 481 15 670
CAR amount (after management action) R’m 195 551 581 460
Number of policies at the end of period 1 549 418 4 328 109 5 731 242 4 214 632
Number of schemes at the end of period 1 220 1 074 1 091 964
Performance indicators:
Net premium increase (year to year) % 7 183 182 -29
Claims (as % of net premiums) 48 50 54 44
Commission (as % of net premiums) 7 17 18 23
Management Expenses (as % of net premiums) 18 9 9 9
Investment yield %* 11 7 7 5
Number of policies increase (yr to yr) % -3 179 322 -26a
Individual lapse %** 11 84 81 71
Individual lapse % (in-force policies) 5 35 22 19
Individual termination %** 33 19 9 35
Individual termination % (in-force policies) 15 8 2 10
Individual contractual termination %** 12 60 55 53
Individual expiry %** 22 13 13 24
Fund & group schemes termination %** 134 452 405 20 800b
CAR cover ratio (median) 5.8 4.9 5.8 4.9
INDUSTRY RESULTS – NICHE INSURERS2

THE QUARTERLY REPORT ON THE RESULTS OF THE LONG-TERM INSURANCE INDUSTRY FOR THE PERIOD ENDED 30 SEPTEMBER 2015 .
Pag
e10
Classes of policies
This diagram indicates the net premiums according to the classes of policies of niche insurers for the period ended September 2015 as well as comparative figures for the period ended September 2014:

THE QUARTERLY REPORT ON THE RESULTS OF THE LONG-TERM INSURANCE INDUSTRY FOR THE PERIOD ENDED 30 SEPTEMBER 2015 .
Pag
e11
Investment composition
The spread and categories of assets for niche insurers for the calendar years of 2013 to 2014 as well as period ended September 2015 and comparative period of September 2014:
CAR cover ratios - Niche insurers
The following table indicates the ratio of free assets to capital adequacy requirement (CAR) of the niche insurance companies.
R’mill ion % R’mill ion % R’mill ion % R’mill ion %
Cash and deposits 1 862 14 4 667 20 3 823 17 6 071 27
Government and semi-government 5 561 42 6 687 29 6 434 29 4 555 20
Equities and collective investment schemes 4 134 31 7 218 31 7 470 34 8 720 38
Debentures and loan stock 51 0 1 024 4 1 147 5 1 881 8
Immovable properties 0 0 344 1 344 2 344 2
Fixed assets 2 0 4 0 4 0 3 0
Debtors 556 4 1 416 6 1 287 6 932 4
Other Assets 1 208 9 1 739 8 1 728 8 249 1
Total 13 374 100 23 099 100 22 239 100 22 756 100
Kinds of assets
As at
December 2013
As at
December 2014
As at
September 2014
As at
September 2015
December 2013 December 2014 September 2014 September 2015
Covered 0-1 times 0 0 0 0
Covered 1-2 times 0 0 2 1
Covered 2-5 times 4 7 4 6
Covered 5-10 times 5 2 3 2
Covered 10+ times 1 4 4 4
CAR cover ratio
THE QUARTERLY REPORT ON THE RESULTS OF THE LONG-TERM INSURANCE INDUSTRY FOR THE PERIOD ENDED 30 SEPTEMBER 2015 .
Pag
e12
Captives3
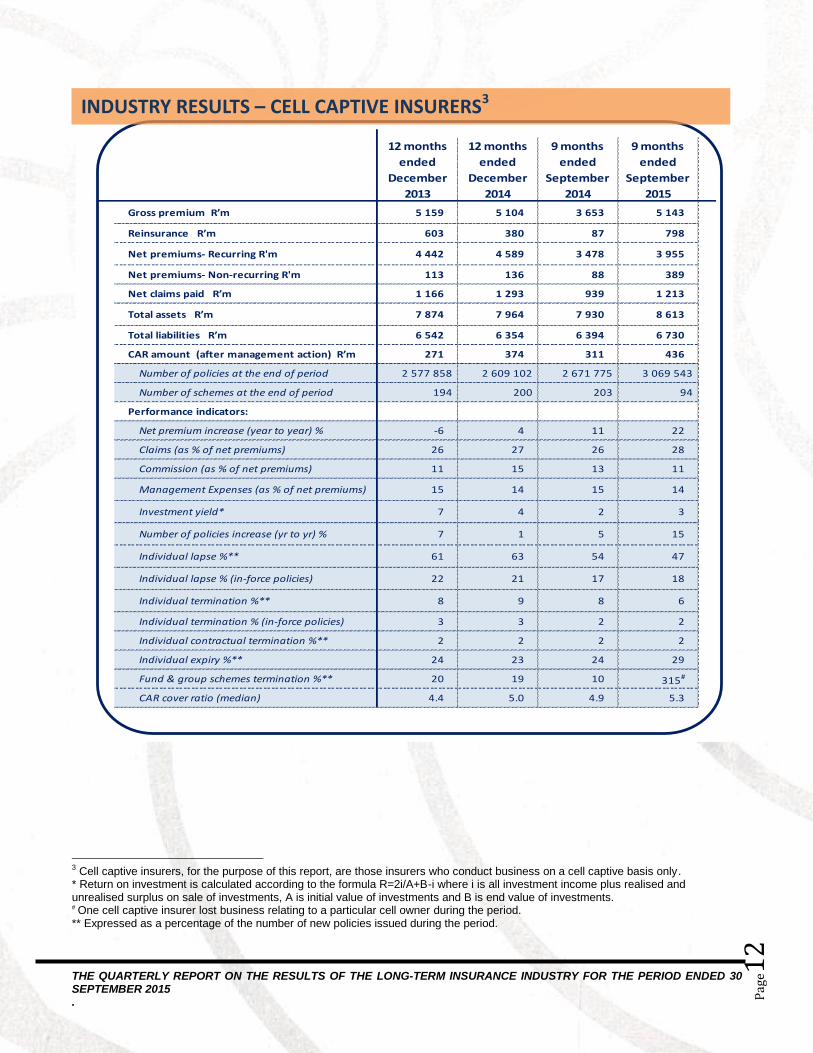
3 Cell captive insurers, for the purpose of this report, are those insurers who conduct business on a cell captive basis only. * Return on investment is calculated according to the formula R=2i/A+B-i where i is all investment income plus realised and unrealised surplus on sale of investments, A is initial value of investments and B is end value of investments. # One cell captive insurer lost business relating to a particular cell owner during the period.
** Expressed as a percentage of the number of new policies issued during the period.
12 months
ended
December
2013
12 months
ended
December
2014
9 months
ended
September
2014
9 months
ended
September
2015
Gross premium R’m 5 159 5 104 3 653 5 143
Reinsurance R’m 603 380 87 798
Net premiums- Recurring R'm 4 442 4 589 3 478 3 955
Net premiums- Non-recurring R'm 113 136 88 389
Net claims paid R’m 1 166 1 293 939 1 213
Total assets R’m 7 874 7 964 7 930 8 613
Total liabilities R’m 6 542 6 354 6 394 6 730
CAR amount (after management action) R’m 271 374 311 436
Number of policies at the end of period 2 577 858 2 609 102 2 671 775 3 069 543
Number of schemes at the end of period 194 200 203 94
Performance indicators:
Net premium increase (year to year) % -6 4 11 22
Claims (as % of net premiums) 26 27 26 28
Commission (as % of net premiums) 11 15 13 11
Management Expenses (as % of net premiums) 15 14 15 14
Investment yield* 7 4 2 3
Number of policies increase (yr to yr) % 7 1 5 15
Individual lapse %** 61 63 54 47
Individual lapse % (in-force policies) 22 21 17 18
Individual termination %** 8 9 8 6
Individual termination % (in-force policies) 3 3 2 2
Individual contractual termination %** 2 2 2 2
Individual expiry %** 24 23 24 29
Fund & group schemes termination %** 20 19 10 315#
CAR cover ratio (median) 4.4 5.0 4.9 5.3
INDUSTRY RESULTS – CELL CAPTIVE INSURERS3

THE QUARTERLY REPORT ON THE RESULTS OF THE LONG-TERM INSURANCE INDUSTRY FOR THE PERIOD ENDED 30 SEPTEMBER 2015 .
Pag
e13
Classes of policies
This diagram indicates the net premiums according to the classes of policies of cell captive insurers for the period ended September 2015 as well as comparative figures for the period ended September 2014:
4.3%
6.1%
0.0%
33.5%
56.2%
0.0%
5.0%
8.5%
0.0%
16.8%
69.7%
0.0%
Assistance
Disability
Fund
Health
Life
Sinking fund
Sep 14 Sep 15

THE QUARTERLY REPORT ON THE RESULTS OF THE LONG-TERM INSURANCE INDUSTRY FOR THE PERIOD ENDED 30 SEPTEMBER 2015 .
Pag
e14
Investment composition
The spread and categories of assets for cell captive insurers for the calendar years of 2013 to 2014 as well as period ended September 2015 and comparative period of September 2014:
CAR cover ratios – Cell captive insurers
The following table indicates the ratio of free assets to capital adequacy requirement (CAR) of the cell captive insurance companies.
R’mill ion % R’mill ion % R’mill ion % R’mill ion %
Cash and deposits 4 673 60 4 664 59 4 513 57 4 992 58
Government and semi-government 1 099 14 1 069 13 1 048 13 1 089 13
Equities and collective investment schemes 1 285 16 1 154 14 1 296 16 1 464 17
Debentures and loan stock 0 0 281 4 285 4 245 3
Immovable properties 0 0 0 0 0 0 0 0
Fixed assets 0 0 2 0 0 0 1 0
Debtors 562 7 556 7 522 7 616 7
Other Assets 254 3 238 3 266 3 205 2
Total 7 874 100 7 964 100 7 930 100 8 613 100
Kinds of assets
As at
December 2013
As at
December 2014
As at
September 2014
As at
September 2015
December 2013 December 2014 September 2014 September 2015
Covered 0-1 times 0 0 0 0
Covered 1-2 times 3 1 1 1
Covered 2-5 times 1 2 3 2
Covered 5-10 times 3 3 3 3
Covered 10+ times 0 0 0 0
CAR cover ratio

THE QUARTERLY REPORT ON THE RESULTS OF THE LONG-TERM INSURANCE INDUSTRY FOR THE PERIOD ENDED 30 SEPTEMBER 2015 .
Pag
e15
Niche4
4 Linked investment insurers, for the purpose of this report, are those insurers who underwrite policies whereby the value of the policy
is directly linked to the value of the assets invested in, and no guarantees are offered. * Return on investment is calculated according to the formula R=2i/A+B-i where i is all investment income plus realised and unrealised surplus on sale of investments, A is initial value of investments and B is end value of investments. ** Expressed as a percentage of the number of new policies issued during the period.
12 months
ended
December
2013
12 months
ended
December
2014
9 months
ended
September
2014
9 months
ended
September
2015
Gross premium R’m 151 257 133 650 101 739 104 408
Reinsurance R’m 2 685 2 707 1 305 240
Net premiums- Recurring R'm 109 71 49 88
Net premiums- Non-recurring R'm 148 463 130 872 100 385 104 081
Net claims paid R’m 136 727 156 673 102 438 112 754
Total assets R’m 605 914 623 597 658 380 644 507
Total liabilities R’m 602 944 620 862 655 134 641 862
CAR amount (after management action) R’m 1 558 1 653 1 666 1 679
Number of policies at the end of period 127 164 141 561 137 578 150 301
Number of schemes at the end of period 4 717 5 306 5 108 4 921
Performance indicators:
Net premium increase (year to year) % 29 -12 -14 4
Claims (as % of net premiums) 92 120 102 108
Commission (as % of net premiums) 0 0 0 0
Management Expenses (as % of net premiums) 2 2 2 2
Investment yield* 17 10 9 5
Number of policies increase (yr to yr) % 13 11 10 9
Individual lapse %** 3 0 0 0
Individual lapse % (in-force policies) 1 0 0 0
Individual termination %** 21 30 32 23
Individual termination % (in-force policies) 4 5 4 3
Individual contractual termination %** 13 17 17 16
Individual expiry %** 0 0 0 0
Fund & group schemes termination %** 106 43 43 100
CAR cover ratio (median) 1.7 1.8 1.7 1.9
INDUSTRY RESULTS – LINKED INVESTMENT INSURERS4

THE QUARTERLY REPORT ON THE RESULTS OF THE LONG-TERM INSURANCE INDUSTRY FOR THE PERIOD ENDED 30 SEPTEMBER 2015 .
Pag
e16
Classes of policies
This diagram indicates the net premiums according to the classes of policies of linked investment insurers for the period ended September 2015 as well as comparative figures for the period ended September 2014:

THE QUARTERLY REPORT ON THE RESULTS OF THE LONG-TERM INSURANCE INDUSTRY FOR THE PERIOD ENDED 30 SEPTEMBER 2015 .
Pag
e17
Investment composition
The spread and categories of assets for linked insurers for the calendar years of 2013 to 2014 as well as period ended September 2015 and comparative period of September 2014:
CAR cover ratios – Linked investment insurers
The following table indicates the ratio of free assets to capital adequacy requirement (CAR) of the linked investment insurers.
R’mill ion % R’mill ion % R’mill ion % R’mill ion %
Cash and deposits 61 228 9 55 510 9 62 871 10 59 435 9
Government and semi-government 60 462 10 62 330 10 63 468 10 66 816 10
Equities and collective investment schemes 392 171 65 412 613 66 416 719 63 426 371 66
Debentures and loan stock 27 363 5 28 415 5 28 485 4 27 811 4
Immovable properties 839 0 1 073 0 1 011 0 985 0
Fixed assets 12 0 6 0 9 0 5 0
Debtors 33 643 6 33 986 5 56 041 9 33 385 6
Other Assets 30 195 5 29 664 5 29 775 5 29 701 5
Total 605 914 100 623 597 100 658 380 100 644 507 100
Kinds of assets
As at
December 2013
As at
December 2014
As at
September 2014
As at
September 2015
December 2013 December 2014 September 2014 September 2015
Covered 0-1 times 0 0 0 0
Covered 1-2 times 9 12 10 11
Covered 2-5 times 5 3 4 3
Covered 5-10 times 1 0 1 1
Covered 10+ times 0 0 0 0
CAR cover ratio

THE QUARTERLY REPORT ON THE RESULTS OF THE LONG-TERM INSURANCE INDUSTRY FOR THE PERIOD ENDED 30 SEPTEMBER 2015 .
Pag
e18
Reinsurers5
5
Reinsurers, for the purpose of this report, are those insurers who offer specialised cover, only to primary insurers. * Return on investment is calculated according to the formula R=2i/A+B-i where i is all investment income plus realised and unrealised surplus on sale of investments, A is initial value of investments and B is end value of investments.
12 months
ended
December
2013
12 months
ended
December
2014
9 months
ended
September
2014
9 months
ended
September
2015
Gross premium R’m 8 823 9 722 7 242 7 944
Reinsurance R’m 1 422 1 680 1 240 1 346
Net premiums- Recurring R'm 5 784 6 150 4 622 4 992
Net premiums- Non-recurring R'm 1 617 1 892 1 380 1 606
Net claims paid R’m 5 652 5 755 4 096 4 717
Total assets R’m 13 966 15 808 15 457 16 772
Total liabilities R’m 11 869 13 322 13 143 14 227
CAR amount (after management action) R’m 713 693 657 823
Performance indicators:
Net premium increase (year to year) % 9 9 8 10
Claims (as % of net premiums) 76 72 54 71
Commission (as % of net premiums) 9 11 12 10
Management Expenses (as % of net premiums) 7 7 6 7
Investment yield* 4 5 4 3
CAR cover ratio (median) 2.8 2.9 2.8 2.4
INDUSTRY RESULTS – REINSURERS5

THE QUARTERLY REPORT ON THE RESULTS OF THE LONG-TERM INSURANCE INDUSTRY FOR THE PERIOD ENDED 30 SEPTEMBER 2015 .
Pag
e19
Classes of policies
This diagram indicates the net premiums according to the classes of policies of reinsurers for the period ended September 2015 as well as comparative figures for the period ended September 2014:
6
* During the period under review one insurer reclassified its policies resulting in a move from fund to life business.

THE QUARTERLY REPORT ON THE RESULTS OF THE LONG-TERM INSURANCE INDUSTRY FOR THE PERIOD ENDED 30 SEPTEMBER 2015 .
Pag
e20
Investment composition
The spread and categories of assets for reinsurers for the calendar years of 2013 to 2014 as well as period ended September 2015 and comparative period of September 2014:
CAR cover ratios –reinsurers
The following table indicates the ratio of free assets to capital adequacy requirement (CAR) of the reinsurers.
R’mill ion % R’mill ion % R’mill ion % R’mill ion %
Cash and deposits 1 653 12 2 880 18 1 606 10 1 811 11
Government and semi-government 6 757 48 7 340 46 7 680 50 7 531 45
Equities and collective investment schemes 25 0 33 0 28 0 282 2
Debentures and loan stock 461 3 424 3 472 3 465 3
Immovable properties 0 0 0 0 0 0 0 0
Fixed assets 15 0 17 0 36 0 25 0
Debtors 1 839 14 2 144 14 2 052 13 2 814 17
Other Assets 3 215 23 2 970 19 3 582 23 3 844 22
Total 13 966 100 15 808 100 15 457 100 16 772 100
Kinds of assets
As at
December 2013
As at
December 2014
As at
September 2014
As at
September 2015
December 2013 December 2014 September 2014 September 2015
Covered 0-1 times 0 0 0 0
Covered 1-2 times 2 1 1 1
Covered 2-5 times 5 4 4 4
Covered 5-10 times 0 2 2 2
Covered 10+ times 0 0 0 0
CAR cover ratio

THE QUARTERLY REPORT ON THE RESULTS OF THE LONG-TERM INSURANCE INDUSTRY FOR THE PERIOD ENDED 30 SEPTEMBER 2015 .
Pag
e21
6
Assistance insurers, for the purpose of this report, are those insurers who offer life policies where the sum assured does not exceed R30 000 (whereby the assistance policy class is the major policy class that this type insurer underwrites). * Return on investment is calculated according to the formula R=2i/A+B-i where i is all investment income plus realised and unrealised income. ** Expressed as a percentage of the number of new policies issued during the period.
12 months
ended
December
2013
12 months
ended
December
2014
9 months
ended
September
2014
9 months
ended
September
2015
Gross premium R’m 2 663 2 217 1 736 1 631
Reinsurance R’m 98 22 16 18
Net premiums- Recurring R'm 1 651 1 346 993 1 062
Net premiums- Non-recurring R'm 914 849 728 552
Net claims paid R’m 818 695 519 629
Total assets R’m 2 712 3 510 3 343 4 007
Total liabilities R’m 2 221 3 095 2 958 3 590
CAR amount (after management action) R’m 114 104 105 123
Number of policies at the end of period 1 840 541 770 383 735 566 846 593
Number of schemes at the end of period 4 183 2 869 2 822 4 428
Performance indicators:
Net premium increase (year to year) % 64 -14 -11 -6
Claims (as % of net premiums) 32 32 30 39
Commission (as % of net premiums) 11 9 9 9
Management Expenses (as % of net premiums) 20 18 17 19
Investment yield* 13 8 7 3
Number of policies increase (yr to yr) % 62 -58 -59 15
Individual lapse %** 20 89 97 90
Individual lapse % (in-force policies) 18 31 27 22
Individual termination %** 22 1 1 3
Individual termination % (in-force policies) 19 0 0 1
Individual contractual termination %** 1 5 5 5
Individual expiry %** 13 0 0 0
Fund & group schemes termination %** 80 79 89 38
CAR cover ratio (median) 2.7 2.5 2.4 2.5
INDUSTRY RESULTS – ASSISTANCE INSURERS 6

THE QUARTERLY REPORT ON THE RESULTS OF THE LONG-TERM INSURANCE INDUSTRY FOR THE PERIOD ENDED 30 SEPTEMBER 2015 .
Pag
e22
Classes of policies
This diagram indicates the net premiums according to the classes of policies of assistance insurers for the period ended September 2015 as well as comparative figures for the period ended September 2014:

THE QUARTERLY REPORT ON THE RESULTS OF THE LONG-TERM INSURANCE INDUSTRY FOR THE PERIOD ENDED 30 SEPTEMBER 2015 .
Pag
e23
Investment composition
The spread and categories of assets for assistance insurers for the calendar years of 2013 to 2014 as well as period ended September 2015 and comparative period of September 2014:
CAR cover ratios – assistance insurers
The following table indicates the ratio of free assets to capital adequacy requirement (CAR) of the assistance insurance companies.
R’mill ion % R’mill ion % R’mill ion % R’mill ion %
Cash and deposits 291 11 231 7 190 6 254 6
Government and semi-government 33 1 42 1 43 1 20 0
Equities and collective investment schemes 1 593 59 2 343 67 2 237 67 2 703 69
Debentures and loan stock 613 23 786 22 768 23 901 22
Immovable properties 30 1 6 0 6 0 5 0
Fixed assets 5 0 11 0 6 0 9 0
Debtors 139 5 91 3 93 3 114 3
Other Assets 9 0 0 0 0 0 0 0
Total 2 712 100 3 510 100 3 343 100 4 007 100
Kinds of assets
As at
December 2013
As at
December 2014
As at
September 2014
As at
September 2015
December 2013 December 2014 September 2014 September 2015
Covered 0-1 times 0 0 0 0
Covered 1-2 times 0 1 1 3
Covered 2-5 times 6 5 5 3
Covered 5-10 times 0 0 1 0
Covered 10+ times 1 1 0 1
CAR cover ratio