Embed Size (px)
Citation preview

1. Basis of Presenting Consolidated Financial StatementsThe accompanying consolidated financial statements of CASIO COMPUTER CO., LTD. (“the Company”) and its consolidated
subsidiaries have been prepared in accordance with the provisions set forth in the Japanese Financial Instruments and
Exchange Law and its related accounting regulations, and in conformity with accounting principles generally accepted in
Japan (“Japanese GAAP”), which are different in certain respects as to application and disclosure requirements from Interna-
tional Financial Reporting Standards.
The accompanying consolidated financial statements have been restructured and translated into English (with certain
expanded disclosure) from the consolidated financial statements of the Company prepared in accordance with Japanese
GAAP and filed with the appropriate Local Finance Bureau of the Ministry of Finance as required by the Financial Instruments
and Exchange Law. Certain supplementary information included in the statutory Japanese language consolidated financial
statements, but not required for fair presentation, is not presented in the accompanying consolidated financial statements.
The translation of the Japanese yen amounts into U.S. dollars is included solely for the convenience of readers outside
Japan, using the prevailing exchange rate at March 31, 2019, which was ¥111 to U.S.$1. The convenience translation should
not be construed as a representation that the Japanese yen amounts have been, could have been, or could in the future be,
converted into U.S. dollars at this or any other rate of exchange.
2. Significant Accounting PoliciesConsolidation
The accompanying consolidated financial statements include the accounts of the Company and significant subsidiaries
(together with the Company, “the Group”) which the Company controls through majority voting rights or existence of certain
conditions. Shares of associates of which the Company has the ability to exercise significant influence over operating and
financial policies are accounted for using the equity method.
In the elimination of investments in subsidiaries, the portion of assets and liabilities of a subsidiary attributable to the
subsidiary’s shares acquired by the Company are recorded based on the fair value as of the respective dates when such
shares are acquired. The amounts of assets and liabilities attributable to non–controlling interests of the subsidiary are
determined using the financial statements of the subsidiary.
Material intercompany balances, transactions and profits have been eliminated in consolidation.
The difference between the cost and underlying fair value of the net assets of investments in subsidiaries at acquisition is
included in other assets and is amortized on a straight–line basis over five years.
Cash flow statements
In preparing the consolidated statements of cash flows, cash on hand, readily available deposits and short–term highly liquid
investments with maturities not exceeding three months at the time of purchase are considered to be cash and cash
equivalents.
Foreign currency translation
All monetary assets and liabilities denominated in foreign currencies are translated at the current exchange rates at the
balance sheet date, and the translation gains and losses are credited or charged to income (loss).
Assets and liabilities of consolidated overseas subsidiaries are translated into yen at the current exchange rate at the
balance sheet date while their revenue and expenses are translated at the average exchange rate for the period. Differences
arising from such translation are included in net assets as foreign currency translation adjustment.
Securities and investment securities
Debt securities designated as held–to–maturity are carried at amortized cost using the straight–line method. Available–for–
sale securities for which fair value is readily determinable, are stated at fair value as of the end of the period with unrealized
Financial Section
Years ended March 31, 2019 and 2018 Casio Computer Co., Ltd. and Consolidated Subsidiaries
Notes to Consolidated Financial Statements
60 CASIO Integrated Report 2019

gains and losses, net of applicable deferred tax assets or liabilities, not reflected in earnings but directly reported as a sepa-
rate component under net assets. The cost of such securities sold is determined primarily by the moving–average method.
Available–for–sale securities for which fair value is not readily determinable are stated primarily at moving–average cost.
Derivatives and hedge accounting
The accounting standards for financial instruments require companies to state derivative financial instruments at fair value
and to recognize changes in the fair value as gains or losses unless derivative financial instruments meet the criteria for
hedge accounting.
If derivative financial instruments are used as hedges and meet certain hedging criteria, the Group defers recognition of
gains or losses resulting from changes in the fair value of derivative financial instruments until the related losses or gains on
the hedged items are recognized.
Also, if interest rate swap contracts are used as hedges and meet certain hedging criteria, the net amount to be paid or
received under the interest rate swaps is added to or deducted from the interest on the assets or liabilities for which the swap
contract is executed.
The Group uses forward foreign currency contracts and interest rate swaps as derivative financial instruments primarily
for the purpose of mitigating future risks of fluctuations of foreign currency exchange rates with respect to foreign currency
assets and liabilities and of interest rate changes with respect to cash management.
Forward foreign currency contracts and interest rate swaps are subject to risks of foreign currency exchange rate changes
and interest rate changes, respectively.
The derivative transactions are executed and managed by the Company’s Finance Department in accordance with the
established policies and within the specified limits on the amounts of derivative transactions allowed.
Allowance for doubtful accounts
The allowance for doubtful accounts is provided at an amount sufficient to cover probable losses on the collection of
receivables.
The amount of the allowance is determined by an estimated amount of probable bad debt that is based on past write–off
experience and a review of the collectability of individual receivables.
Inventories
Inventories are stated primarily at the lower of cost (first–in, first–out) or net realizable values at year–end.
Property, plant and equipment, except leased assets
Property, plant and equipment is stated at cost. For the Company and its consolidated subsidiaries in Japan, depreciation is
principally determined by the declining–balance method at rates based on estimated useful lives except for the following
items. Buildings, excluding facilities attached to buildings, acquired on or after April 1, 1998, the building and structures of
the head office of the Company, and facilities attached to buildings and structures acquired on or after April 1, 2016, are
depreciated using the straight–line method. For overseas subsidiaries, depreciation is principally determined by the straight–
line method. The depreciation period ranges from 2 years to 50 years for buildings and structures, from 2 years to 17 years for
machinery, equipment and vehicles, and from 1 year to 20 years for tools, furniture and fixtures.
Software, except leased assets
Software is categorized by the following purposes and amortized using the following two methods.
Software for market sales: The production costs for the master product are capitalized and amortized over no more than 3
years on a projected revenue basis.
Software for internal use: The acquisition costs of software for internal use are amortized over 5 years using the straight–
line method.
61CASIO Integrated Report 2019

The amount of software costs capitalized is included in Other under Investments and other assets in the consolidated
balance sheets.
Leased assets
(Finance leases which do not transfer ownership of the leased property to the lessee)
Leased assets are divided into the two principal categories of property, plant and equipment and intangible assets included
in Other under Investments and other assets. The former consists primarily of facilities (machinery and equipment, tools,
furniture and fixtures) while the latter consists of software. The assets are depreciated on a straight–line basis on the
assumption that the lease term is the useful life and the residual value is zero.
Retirement benefits
Under the terms of the employees’ severance and retirement plan, eligible employees are entitled under most circumstances,
upon mandatory retirement or earlier voluntary severance, to severance payments based on compensation at the time of
severance and years of service.
For employees’ severance and retirement benefits, the Company and its consolidated subsidiaries in Japan provide a
defined benefit plan and have established and are participating in the Casio corporate pension fund, which is a system with
multiple business proprietors.
The Company and its consolidated subsidiaries in Japan received permission from the Minister of Health, Labour and Wel-
fare, for release from the obligation of paying benefits for employees’ prior services relating to the substitutional portion of the
Welfare Pension Insurance Scheme. Afterwards, the welfare pension insurance plan was changed to the defined benefit plan.
The Company and a part of its consolidated subsidiaries in Japan also provide a defined contribution plan. On April 1, 2012,
the Company and certain consolidated subsidiaries transferred part of the defined benefit plan to the defined contribution
plan. In addition, the Company has established an employee retirement benefit trust.
The liabilities and expenses for retirement benefits are determined based on the amounts actuarially calculated using
certain assumptions. The liability and expenses for the retirement benefit plan subject to some of the consolidated subsidiar-
ies are calculated by a simplified method.
Income taxes
Taxes on income consist of corporation, inhabitants’ and enterprise taxes.
The Company and certain consolidated subsidiaries in Japan apply the consolidated tax payment system.
The Group recognizes tax effects of temporary differences between carrying amounts for financial reporting purposes and
amounts for tax purposes. The provision for income taxes is computed based on the profit before income taxes included in the
statements of income of each company of the Group. The asset and liability approach is used to recognize deferred tax assets
and liabilities for the expected future tax consequences of temporary differences.
Appropriations of retained earnings
Appropriations of retained earnings are accounted for and reflected in the accompanying consolidated financial statements
when approved by the shareholders.
Amounts per share of common shares
Earnings per share of common shares is computed based on the weighted average number of common shares outstanding
during each fiscal year (less the treasury shares).
Cash dividends per share represent the actual amount applicable to the respective years.
62 CASIO Integrated Report 2019

Reclassifications
Certain reclassifications have been made in the 2018 consolidated financial statements to conform to the 2019 presentation.
Accounting standards and guidance issued but not yet adopted
The following new standard and guidance have been issued but are not effective for the fiscal year ended March 31, 2019 and
have not been adopted early.
1. “Accounting Standard for Revenue Recognition” (ASBJ Statement No. 29, March 30, 2018)
“Implementation Guidance on Accounting Standard for Revenue Recognition” (ASBJ Guidance No. 30, March 30, 2018)
(1) Overview
The above standard and guidance provide comprehensive principles for revenue recognition. Under the standard and guid-
ance, revenue is recognized by applying the following 5 steps:
Step 1: Identify contract(s) with customers.
Step 2: Identify the performance obligations in the contract.
Step 3: Determine the transaction price.
Step 4: Allocate the transaction price to the performance obligation in the contract.
Step 5: Recognize revenue when (or as) the entity satisfies a performance obligation.
(2) Effective date
Effective from the beginning of the fiscal year ending March 31, 2022.
(3) Effects of the application of the standard and guidance
The Company and its consolidated domestic subsidiaries are currently in the process of determining the effects of these new
standard and guidance on the consolidated financial statements.
2. Consolidated overseas subsidiaries
•”Leases” [IFRS 16]
(1) Overview
In accordance with IFRS 16, a lessee is required to recognize assets or liabilities for all leases on the balance sheet in principle.
(2) Effective date
Effective from the beginning of the fiscal year ending March 31, 2020.
(3) Effects of the application of the standard
The Company and its consolidated subsidiaries are currently in the process of determining the effects of the standard on the
consolidated financial statements.
(Changes in presentation method)
(Changes due to adoption of “Partial Amendments to Accounting Standard for Tax Effect Accounting”)
Upon application of “Partial Amendments to Accounting Standard for Tax Effect Accounting” (ASBJ Statement No. 28,
February 16, 2018 (hereinafter, “Statement No. 28”)) from the beginning of the current fiscal year, the Company and its
domestic subsidiaries changed the presentation and related notes of deferred tax assets and deferred tax liabilities, such that
deferred tax assets and deferred tax liabilities are classified as part of ‘investments and other assets’ and ‘non-current
liabilities’, respectively.
63CASIO Integrated Report 2019

As a result, ¥6,293 million ($56,694 thousand) of deferred tax assets classified as “current assets” and ¥195 million ($1,757
thousand) of deferred tax liabilities classified as “non-current liabilities” have been included in deferred tax assets (¥8,914
million ($80,306 thousand)) in “investments and other assets”, and deferred tax liabilities classified as non-current liabilities
have been restated to ¥1,349 million ($12,153 thousand) in the balance sheet as of the end of the previous fiscal year.
The notes related to tax effect accounting additionally included those described in notes 8 (excluding total amount of
valuation reserves) and 9 of “Accounting Standard for Tax Effect Accounting”, which are required in paragraphs 3 to 5 of
Statement No.28. However, this additional information corresponding to the previous fiscal year is not disclosed, in accor-
dance with the transitional treatments prescribed in paragraph 7 of Statement No. 28.
3. Cash and Cash Equivalents(1) Cash and cash equivalents at March 31, 2019 and 2018:
Millions of YenThousands of
U.S. Dollars (Note 1)
2019 2018 2019
Cash and deposits ¥ 73,714 ¥ 66,441 $ 664,090
Time deposits over three months (406) (387) (3,657)
Debt securities within three months to maturity 50,000 48,500 450,450
Short-term loans receivable with resale agreement 8,900 20,000 80,180
Cash and cash equivalents ¥132,208 ¥134,554 $1,191,063
(2) Significant non-cash transactions
1) Assets and obligations relating to finance lease transactions
Millions of YenThousands of
U.S. Dollars (Note 1)
2019 2018 2019
Assets relating to finance lease transactions ¥344 ¥436 $3,099
Obligations relating to finance lease transactions 373 473 3,360
4. Inventories
Millions of YenThousands of
U.S. Dollars (Note 1)
2019 2018 2019
Finished goods ¥39,061 ¥36,450 $351,901
Work in process 5,836 5,582 52,577
Raw materials and supplies 9,377 7,649 84,477
Total ¥54,274 ¥49,681 $488,955
5. Financial Instruments(1) Qualitative information on financial instruments
1) Policies for using financial instruments
The Group invests surplus funds in highly secure financial assets, and funds required for working capital and capital invest-
ments are raised through the issuance of bonds or loans from financial institutions such as banks. Derivatives are used to
avoid the risks described hereinafter and no speculative transactions are entered into.
64 CASIO Integrated Report 2019

2) Details of financial instruments used and risks involved, and how they are managed
Notes and accounts receivable–trade are exposed to customers’ credit risk. To minimize that risk, the Group periodically
monitors the due date and the balance of the accounts.
Securities and investment securities are primarily highly secure and highly rated debt securities and shares of companies
with which the Group has business relations, and are exposed to market price fluctuation risk. The Group periodically moni-
tors the market price and reviews the status of these holdings.
Operating payables comprising notes and accounts payable–trade, accounts payable–other and income taxes payable have
a due date of within one year.
Operating payables, loans payable, and bonds with share acquisition rights are subject to liquidity risk (the risk of an
inability to pay by the due date). However, the Group manages liquidity risk by maintaining short–term liquidity in excess of a
certain level of consolidated sales or by other means.
The Group uses derivative transactions of forward foreign currency contracts to hedge currency fluctuation risks arising
from debts and credits denominated in foreign currencies, as well as interest rate swap contracts to fix the cash flows associ-
ated with loans payable. The Group utilizes and manages derivative transactions following the internal regulations for them,
which stipulate policy, objective, scope, organization, procedures and financial institutions to deal with, and has an implemen-
tation and reporting system for derivative transactions reflecting proper internal control functions.
3) Supplemental information on fair values
The fair value of financial instruments is calculated based on quoted market price or, in the case where there is no market
price, by making a reasonable estimation. Because the preconditions applied include a floating element, estimation of fair
value may vary. The contract amounts, as presented in Note 7 “Derivative Transactions,” do not reflect market risk.
(2) Fair values of financial instruments
The following table summarizes book value and fair value of the financial instruments, and the difference between them as of
March 31, 2019 and 2018. Items for which fair value is difficult to estimate are not included in the following table (see Note 2
on P.47).Millions of Yen
For 2019 Book value Fair value Difference
Assets
[1] Cash and deposits ¥ 73,714 ¥ 73,714 ¥ –
[2] Notes and accounts receivable-trade 44,141 44,141 –
[3] Securities and investment securities
a. Held-to-maturity debt securities 20,000 20,000 –
b. Available-for-sale securities 57,855 57,855 –
Total assets ¥195,710 ¥195,710 ¥ –
Liabilities
[1] Notes and accounts payable-trade ¥ 28,522 ¥ 28,522 ¥ –
[2] Accounts payable-other 19,784 19,784 –
[3] Income taxes payable 3,584 3,584 –
[4] Bonds with share aquisition rights 10,003 9,984 (19)
[5] Long-term loans payable 58,988 59,113 125
Total liabilities ¥120,881 ¥120,987 ¥106
Derivative transactions * ¥ (58) ¥ (58) ¥ –
65CASIO Integrated Report 2019
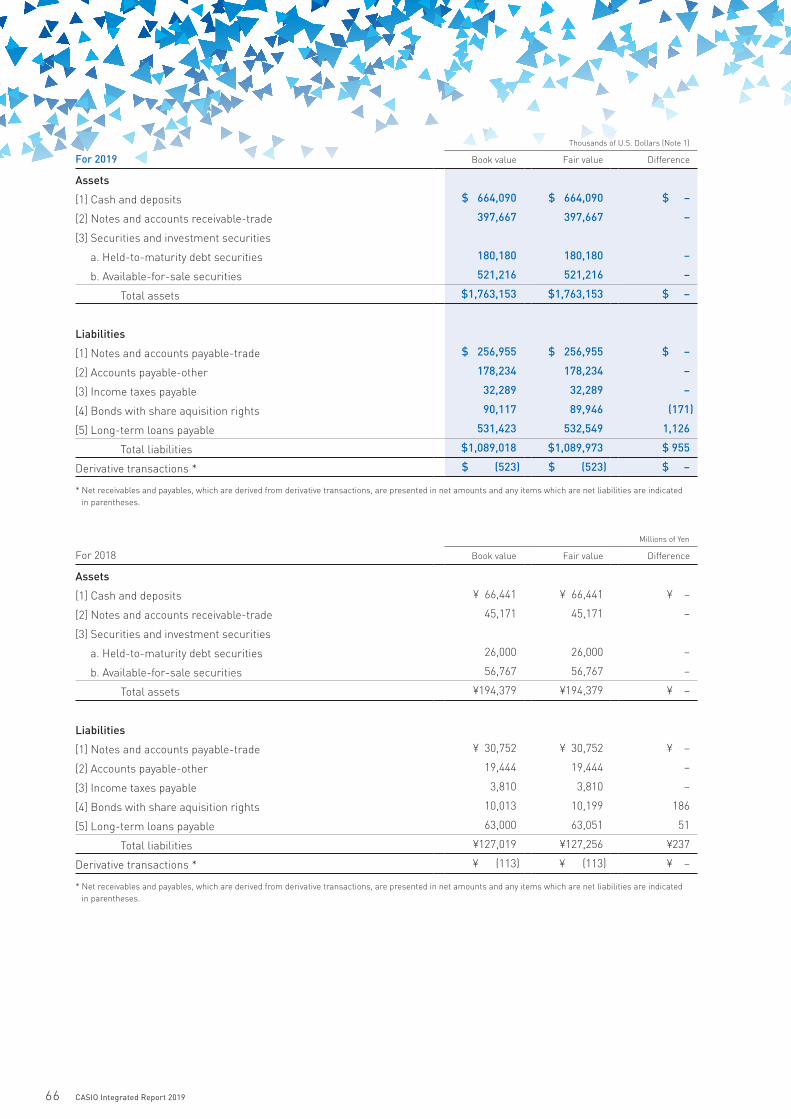
Thousands of U.S. Dollars (Note 1)
For 2019 Book value Fair value Difference
Assets
[1] Cash and deposits $ 664,090 $ 664,090 $ –
[2] Notes and accounts receivable-trade 397,667 397,667 –
[3] Securities and investment securities
a. Held-to-maturity debt securities 180,180 180,180 –
b. Available-for-sale securities 521,216 521,216 –
Total assets $1,763,153 $1,763,153 $ –
Liabilities
[1] Notes and accounts payable-trade $ 256,955 $ 256,955 $ –
[2] Accounts payable-other 178,234 178,234 –
[3] Income taxes payable 32,289 32,289 –
[4] Bonds with share aquisition rights 90,117 89,946 (171)
[5] Long-term loans payable 531,423 532,549 1,126
Total liabilities $1,089,018 $1,089,973 $ 955
Derivative transactions * $ (523) $ (523) $ –
* Net receivables and payables, which are derived from derivative transactions, are presented in net amounts and any items which are net liabilities are indicated in parentheses.
Millions of Yen
For 2018 Book value Fair value Difference
Assets
[1] Cash and deposits ¥ 66,441 ¥ 66,441 ¥ –
[2] Notes and accounts receivable-trade 45,171 45,171 –
[3] Securities and investment securities
a. Held-to-maturity debt securities 26,000 26,000 –
b. Available-for-sale securities 56,767 56,767 –
Total assets ¥194,379 ¥194,379 ¥ –
Liabilities
[1] Notes and accounts payable-trade ¥ 30,752 ¥ 30,752 ¥ –
[2] Accounts payable-other 19,444 19,444 –
[3] Income taxes payable 3,810 3,810 –
[4] Bonds with share aquisition rights 10,013 10,199 186
[5] Long-term loans payable 63,000 63,051 51
Total liabilities ¥127,019 ¥127,256 ¥237
Derivative transactions * ¥ (113) ¥ (113) ¥ –
* Net receivables and payables, which are derived from derivative transactions, are presented in net amounts and any items which are net liabilities are indicated in parentheses.
66 CASIO Integrated Report 2019

(Note) 1: Method for calculating the fair value of financial instruments and matters related to securities and investment
securities and derivative transactions
Assets
[1] Cash and deposits, [2] Notes and accounts receivable-trade
Since these items are short-term and the fair value approximates the book value, the book value is used as fair value.
[3] Securities and investment securities
The fair value of equity securities is the market price, while the fair value of debt securities is the market price or the price
quoted by the correspondent financial institution. Since certificates of deposit are short-term, and the fair value approximates
the book value, the book value is used as fair value.
See Note 6 “Securities and Investment Securities” for information on securities categorized by holding purpose.
Liabilities
[1] Notes and accounts payable-trade, [2] Accounts payable-other, [3] Income taxes payable
Since these items are short-term, and the fair value approximates the book value, the book value is used as fair value.
[4] Bonds with share acquisition rights
The fair value of bonds with share acquisition rights is the price quoted by the correspondent financial institution.
Bonds with share acquisition rights include current portion of bonds with share acquisition rights.
[5] Long-term loans payable
The fair value of long-term loans payable with fixed interest rates is the sum of the principal and total interest discounted by
the rate that is applied if a new loan is made.
Since long-term loans payable with floating interest rates reflect market interest rates over the short term, and the fair
value approximates the book value, the book value is used as fair value. However, those that are subject to special treatment
interest rate swaps are measured by taking the sum of the principal and total interest associated with the interest rate swaps
and discounting it by the rate that is reasonably estimated and applied if a new loan is made (see Note 7 “Derivative
Transactions”).
Long-term loans payable include current portion of long-term loans payable.
Derivative transactions
See Note 7 “Derivative Transactions.”
(Note) 2: Financial instruments of which fair value is difficult to estimate
Millions of YenThousands of
U.S. Dollars (Note 1)
2019 2018 2019
Book value Book value Book value
Unlisted shares ¥2,775 ¥2,762 $25,000
The market price of the above shares is not available, therefore the fair value is difficult to estimate. Hence, these are not
included in “[3] Securities and investment securities” on P.45-46.
In the fiscal years ended March 31, 2019 and 2018, there were no unlisted shares declared as an impairment loss.
67CASIO Integrated Report 2019

(Note) 3: Monetary claims and securities and investment securities with repayment due dates after March 31, 2019
and 2018:Millions of Yen
For 2019 Within one year Within five years Within ten years Over ten years
Cash and deposits ¥ 73,714 ¥– ¥– ¥–
Notes and accounts receivable—trade 44,141 – – –
Securities and investment securities
1. Held-to-maturity debt-securities
(1) Government bonds – – – –
(2) Corporate bonds – – – –
(3) Others 20,000 – – –
2. Available-for-sale securities with maturities
(1) Debt securities
a. Government bonds – – – –
b. Corporate bonds 10,000 – – –
c. Other – – – –
(2) Other 20,000 – – –
Total ¥167,855 ¥– ¥– ¥–
Thousands of U.S. dollars (Note 1)
For 2019 Within one year Within five years Within ten years Over ten years
Cash and deposits $ 664,090 $– $– $–
Notes and accounts receivable-trade 397,667 – – –
Securities and investment securities
1. Held-to-maturity debt-securities
(1) Government bonds – – – –
(2) Corporate bonds – – – –
(3) Others 180,180 – – –
2. Available-for-sale securities with maturities
(1) Debt securities
a. Government bonds – – – –
b. Corporate bonds 90,090 – – –
c. Other – – – –
(2) Other 180,180 – – –
Total $1,512,207 $– $– $–
Millions of Yen
For 2018 Within one year Within five years Within ten years Over ten years
Cash and deposits ¥ 66,441 ¥– ¥– ¥–
Notes and accounts receivable—trade 45,171 – – –
Securities and investment securities
1. Held-to-maturity debt-securities
(1) Government bonds – – – –
(2) Corporate bonds – – – –
(3) Other 26,000 – – –
2. Available-for-sale securities with maturities
(1) Debt securities
a. Government bonds – – – –
b. Corporate bonds 10,000 – – –
c. Other – – – –
(2) Other 12,500 – – –
Total ¥160,112 ¥– ¥– ¥–
68 CASIO Integrated Report 2019

(Note) 4: Bonds with share aquisition rights and long-term loans payable with due dates after March 31, 2019 and 2018Millions of Yen
For 2019Within one
yearWithin two
yearsWithin three
yearsWithin four
yearsWithin five
yearsOver five
years
Bonds with share aquisition rights ¥10,000 ¥ – ¥ – ¥ – ¥ – ¥ –
Long-term loans payable – 25,000 3,488 8,000 21,500 1,000
Total ¥10,000 ¥25,000 ¥3,488 ¥8,000 ¥21,500 ¥1,000
Thousands of Dollars (Note 1)
For 2019Within one
yearWithin two
yearsWithin three
yearsWithin four
yearsWithin five
yearsOver five
years
Bonds with share aquisition rights $90,090 $ – $ – $ – $ – $ –
Long-term loans payable – 225,225 31,423 72,072 193,694 9,009
Total $90,090 $225,225 $31,423 $72,072 $193,694 $9,009
Millions of Yen
For 2018Within one
yearWithin two
yearsWithin three
yearsWithin four
yearsWithin five
yearsOver five
years
Bonds with share aquisition rights ¥ – ¥10,000 ¥ – ¥– ¥– ¥ –
Long-term loans payable 16,500 – 25,000 – – 21,500
Total ¥16,500 ¥10,000 ¥25,000 ¥– ¥– ¥21,500
6. Securities and Investment Securities(1) Held-to-maturity debt securities
Millions of Yen
2019 Book value Fair value Difference
Securities with fair values exceeding book values ¥20,000 ¥20,000 ¥–
Securities other than the above – – –
Total ¥20,000 ¥20,000 ¥–
Thousands of U.S. Dollars (Note 1)
2019 Book value Fair value Difference
Securities with fair values exceeding book values $180,180 $180,180 $–
Securities other than the above – – –
Total $180,180 $180,180 $–
Millions of Yen
2018 Book value Fair value Difference
Securities with fair values exceeding book values ¥26,000 ¥26,000 ¥–
Securities other than the above – – –
Total ¥26,000 ¥26,000 ¥–
69CASIO Integrated Report 2019

(2) Available-for-sale securities
Securities with book values exceeding acquisition costs:Millions of Yen
2019 Book value Acquisition cost Difference
Equity securities ¥21,538 ¥ 9,476 ¥12,062
Debt securities 10,000 10,000 –
Other 20,000 20,000 –
Total ¥51,538 ¥39,476 ¥12,062
Thousands of U.S. Dollars (Note 1)
2019 Book value Acquisition cost Difference
Equity securities $194,036 $ 85,370 $108,666
Debt securities 90,090 90,090 –
Other 180,180 180,180 –
Total $464,306 $355,640 $108,666
Millions of Yen
2018 Book value Acquisition cost Difference
Equity securities ¥29,260 ¥13,558 ¥15,702
Debt securities 10,000 10,000 –
Other 12,500 12,500 –
Total ¥51,760 ¥36,058 ¥15,702
Securities other than the above:Millions of Yen
2019 Book value Acquisition cost Difference
Equity securities ¥1,336 ¥1,476 ¥(140)
Debt securities – – –
Other 4,981 5,017 (36)
Total ¥6,317 ¥6,493 ¥(176)
Thousands of U.S. Dollars (Note 1)
2019 Book value Acquisition cost Difference
Equity securities $12,036 $13,297 $(1,261)
Debt securities – – –
Other 44,874 45,198 (324)
Total $56,910 $58,495 $(1,585)
Millions of Yen
2018 Book value Acquisition cost Difference
Equity securities ¥ – ¥ – ¥ –
Debt securities – – –
Other 5,007 5,020 (13)
Total ¥5,007 ¥5,020 ¥(13)
(Notes): 1. Acquisition cost is presented based on book values after posting of impairment loss. 2. The market price of unlisted shares is not available, therefore the fair value is difficult to estimate. Hence, the amounts of unlisted shares, which are
¥2,775 million ($25,000 thousand) and ¥2,762 million on the consolidated balance sheets as of March 31, 2019 and 2018, respectively, are not included in available-for-sale securities above.
70 CASIO Integrated Report 2019

(3) Available-for-sale securities sold for the years ended March 31, 2019 and 2018Millions of Yen
2019 Sales amount Gross realized gains Gross realized losses
Equity securities ¥7,482 ¥4,864 ¥–
Debt securities – – –
Other – – –
Total ¥7,482 ¥4,864 ¥–
Thousands of U.S. Dollars (Note 1)
2019 Sales amount Gross realized gains Gross realized losses
Equity securities $67,405 $43,820 $–
Debt securities – – –
Other – – –
Total $67,405 $43,820 $–
Millions of Yen
2018 Sales amount Gross realized gains Gross realized losses
Equity securities ¥1,173 ¥519 ¥–
Debt securities – – –
Other – – –
Total ¥1,173 ¥519 ¥–
(4) Securities and investment securities impaired
No impairment of securities and investment securities was recorded for the years ended March 31, 2019 and 2018.
With respect to impairment loss, securities with a fair value that has declined by 50% or more against their acquisition
costs are impaired. Among securities that have declined by 30% or more, but less than 50% against their acquisition costs,
those that have been comprehensively assessed and deemed as unlikely to recover their value are also impaired.
7. Derivative TransactionsDerivative transactions not subject to hedge accounting
(1) Currency-related derivativesMillions of Yen
Contract amount
2019 Total Due after one year Fair value Realized gain (loss)
Forward contracts:
To sell:
Euros ¥ – ¥– ¥ – ¥ –
Chinese yuan 2,786 – (58) (58)
Total ¥2,786 ¥– ¥(58) ¥(58)
Thousands of U.S. Dollars (Note 1)
Contract amount
2019 Total Due after one year Fair value Realized gain (loss)
Forward contracts:
To sell:
Euros $ – $– $ – $ –
Chinese yuan 25,099 – (523) (523)
Total $25,099 $– $(523) $(523)
71CASIO Integrated Report 2019

Millions of Yen
Contract amount
2018 Total Due after one year Fair value Realized gain (loss)
Forward contracts:
To sell:
Euros ¥2,383 ¥– ¥(113) ¥(113)
Chinese yuan – – – –
Total ¥2,383 ¥– ¥(113) ¥(113)
(Notes): 1. Fair values of derivative transactions are determined by forward exchange rates. 2. Transactions are transactions other than market transactions.
(2) Interest rate-related derivatives
Not applicable at March 31,2019 and 2018.
Derivative transactions subject to hedge accounting
(1) Currency-related derivatives
Not applicable at March 31, 2019 and 2018.
(2) Interest rate-related derivatives
2019 Millions of Yen
Contract amount
Hedge accounting method Type Main hedged item Total Due after one year Fair value
Interest rate swaps that are subject to special treatment
Interest rate swaps: Receive float/ Pay fix
Long-term loans payable ¥2,000 ¥2,000 (Note) 2
Total ¥2,000 ¥2,000 ¥–
2019 Thousands of U.S. Dollars (Note1)
Contract amount
Hedge accounting method Type Main hedged item Total Due after one year Fair value
Interest rate swaps that are subject to special treatment
Interest rate swaps: Receive float/ Pay fix
Long-term loans payable $18,018 $18,018 (Note) 2
Total $18,018 $18,018 $–
2018 Millions of Yen
Contract amount
Hedge accounting method Type Main hedged item Total Due after one year Fair value
Interest rate swaps that are subject to special treatment
Interest rate swaps: Receive float/ Pay fix
Long-term loans payable ¥2,000 ¥2,000 (Note) 2
Total ¥2,000 ¥2,000 ¥–
(Notes): 1. Fair values of derivative transactions are determined by prices principally reported by the financial institutions with which the Group engages in derivative transactions.
2. Since interest rate swaps that are subject to special treatment are accounted for with long-term loans payable, which are hedged items, their fair value is included in the fair value of the said long-term loans payable.
72 CASIO Integrated Report 2019

8. Short-term Loans Payable, Bonds and Long-term Loans Payable and Lease ObligationShort-term loans payable, bonds and long-term loans payable and lease obligation at March 31, 2019 and 2018:
Millions of YenThousands of
U.S. Dollars (Note 1)
Average interest rates (%)** 2019 2018 2019
Euro-yen convertible bond-type bonds with share acquisition rights due in 2019* – ¥10,003 ¥10,013 $ 90,117
Short-term loans payable 0.1 232 205 2,090
Long-term loans payable due within one year – – 16,500 –
Lease obligations due within one year 3.3 538 594 4,847
Long-term loans payable due over one year 0.2 58,988 46,500 531,423
Lease obligations due over one year 3.2 859 1,115 7,739
Other – – – –
Total - ¥70,620 ¥74,927 $636,216
* Details of bonds with share acquisition rights (“warrants”)
Type of shares involved common shares
Price of warrants gratis
Share issue price ¥2,051.8 ($18.48)
Total issue amount ¥10,050 million ($90,541 thousand)
Total value of new shares issued upon exercise of warrants
–
Warrant–linked 100%
Period of exercise of warrants August 6, 2014 to July 9, 2019
Upon request to exercise warrants in question, payments usually required for the issuance of the corresponding number of shares shall be exempted as the issuer of bonds in question, in return, will be automatically exempted from obligation of redemption of the bonds in a lump-sum. Exercise of warrants in question shall be regarded as an eligible request for exercise of share aquisition rights. The conversion price of the euro-yen convertible bond-type bonds with share acquisition rights due in 2019 was adjusted to ¥2,051.8 ($18.48) from ¥2,055.7 retroactive to April 1, 2016 pursuant to the terms and conditions of the bonds due to the payment of a year-end dividend of ¥22.5 per share and an annual dividend of ¥40.00 per share. The General Meeting of Shareholders held on June 29, 2016 approved the payment of these dividends. The balance of 2019 is the amount that will be redeemed within one year.
** The average interest rate is the weighted average rate on the year-end balance.
The annual maturities of bonds and long-term loans payable within five years:
Year ending March 31 Millions of YenThousands of
U.S. Dollars (Note 1)
2020 ¥10,000 $ 90,090
2021 25,000 225,225
2022 3,488 31,423
2023 8,000 72,072
2024 21,500 193,694
The annual maturities of lease obligations within five years:
Year ending March 31 Millions of YenThousands of
U.S. Dollars (Note 1)
2020 ¥538 $4,847
2021 412 3,712
2022 240 2,162
2023 105 946
2024 46 414
73CASIO Integrated Report 2019

The lines of credit with the main financial institutions agreed as of March 31, 2019 and 2018:
Millions of YenThousands of
U.S. Dollars (Note 1)
2019 2018 2019
Line of credit ¥56,860 ¥56,900 $512,252
Unused 56,860 56,900 512,252
9. Income Taxes(1) The following table summarizes the significant differences between the statutory tax rate and the Group’s actual income
tax rate for financial statement purposes for the years ended March 31, 2019 and 2018.2019 2018
Statutory tax rate 30.6% 30.9%
Increase (reduction) in tax resulting from:
Difference in statutory tax rate (including overseas subsidiaries) (3.5) (3.0)
Valuation allowance (0.8) (10.4)
Foreign tax 1.5 1.4
Tax credit (1.0) (1.2)
Other (2.2) 2.8
Actual income tax rate 24.6% 20.5 %
(2) Significant components of deferred tax assets and liabilities as of March 31, 2019 and 2018:
Millions of YenThousands of
U.S. Dollars (Note 1)
2019 2018 2019
Deferred tax assets:
Carryforward tax loss** ¥ 7,421 ¥ 8,965 $ 66,856
Inventories 1,582 1,932 14,252
Accrued expenses (bonuses to employees) 1,495 1,544 13,469
Property, plant and equipment 1,243 1,012 11,198
Other 4,987 4,928 44,928
Gross deferred tax assets 16,728 18,381 150,703
Valuation reserve for carryforward tax loss** (2,078) – (18,721)
Valuation reserve for deductible temporary differences (625) – (5,631)
Total valuation reserve* (2,703) (2,932) (24,352)
Total deferred tax assets 14,025 15,449 126,351
Deferred tax liabilities:
Valuation difference on available-for-sale securities (3,694) (4,808) (33,279)
Retained earnings of overseas subsidiaries (1,785) (1,665) (16,081)
Unrealized holding gain (1,287) (1,287) (11,595)
Other (128) (124) (1,153)
Total deferred tax liabilities (6,894) (7,884) (62,108)
Net deferred tax assets ¥ 7,131 ¥ 7,565 $ 64,243
* Valuation reserve decreased by ¥ 229 million ($2,063 thousand), because valuation reserve for carryforward tax loss increased by ¥ 438 million ($ 3,946 thousand), and valuation reserve for deductible temporary differences decreased by ¥ 612 million ($5,514 thousand) at the Company in the fisical year.
74 CASIO Integrated Report 2019

** Carryforward tax loss and its deferred tax assets by expiration periods:
Millions of Yen
For 2019Within one
yearWithin two
yearsWithin three
yearsWithin four
yearsWithin five
yearsOver five
years Total
Carryforward tax loss (a) ¥ 24 ¥ 4,820 ¥2,015 ¥ 63 ¥ 108 ¥ 391 ¥ 7,421
Valuation reserve (15) (1,483) (35) (50) (104) (391) (2,078)
Net deferred tax assets (b) ¥ 9 ¥ 3,337 ¥1,980 ¥ 13 ¥ 4 ¥ 0 ¥ 5,343
Thousands of Dollars (Note 1)
For 2019Within one
yearWithin two
yearsWithin three
yearsWithin four
yearsWithin five
yearsOver five
years Total
Carryforward tax loss (a) $ 216 $ 43,423 $18,153 $ 568 $ 973 $ 3,523 $ 66,856
Valuation reserve (135) (13,360) (315) (451) (937) (3,523) (18,721)
Net deferred tax assets (b) $ 81 $ 30,063 $17,838 $ 117 $ 36 $ 0 $ 48,135
(a) Carryforward tax loss shown in the above table is calculated using the effective statutory tax rate.(b) Deferred tax asset of ¥5,343 million ($48,135 thousand) was recognized for carryforward tax loss of ¥7,421 million ($66,856 thousand) (amount calculated using
the effective statutory tax rate.). The deferred tax asset of ¥5,343 million ($48,135 thousand) was mainly recognized for a part of carryforward tax loss of ¥6,750 million ($60,811 thousand) (amount calculated using the effective statutory tax rate) by the Company. The part of valuation reserve which was determined to be recoverable based on expected future taxable income is not recognized for the carryforward tax loss.
10. Retirement Benefits(1) Defined benefit plan (Defined benefit plans, including multi-employer pension plans)
1) Movement in projected benefit obligation (except plans applying the simplified method)
Millions of YenThousands of
U.S. Dollars (Note 1)
2019 2018 2019
Projected benefit obligation at beginning of period ¥50,038 ¥52,395 $450,793
Service cost 1,559 1,595 14,045
Interest cost 557 562 5,018
Actuarial differences accrued (494) (359) (4,451)
Benefits paid (3,044) (2,499) (27,423)
Decrease due to the change from the principle method to the simplified method – (1,412) –
Other 202 (244) 1,820
Projected benefit obligation at end of period ¥48,818 ¥50,038 $439,802
2) Movement in pension plan assets (except plans applying the simplified method)
Millions of YenThousands of
U.S. Dollars (Note 1)
2019 2018 2019
Pension plan assets at beginning of period ¥62,271 ¥64,489 $561,000
Expected return on pension plan assets 2,040 2,097 18,378
Actuarial differences accrued (3,054) (1,393) (27,514)
Contributions paid by the employer 1,122 1,145 10,108
Benefits paid (3,041) (2,310) (27,396)
Decrease due to the change from the principle method to the simplified method – (1,511) –
Other 202 (246) 1,820
Pension plan assets at end of period ¥59,540 ¥62,271 $536,396
75CASIO Integrated Report 2019
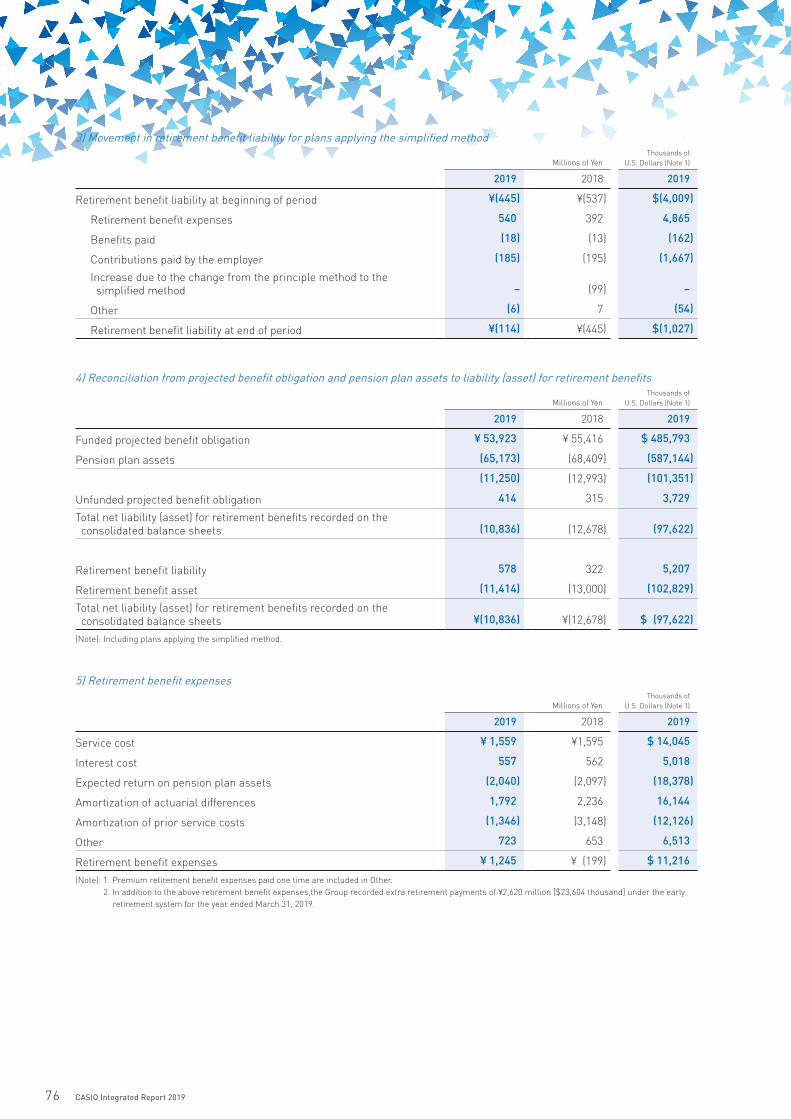
3) Movement in retirement benefit liability for plans applying the simplified method
Millions of YenThousands of
U.S. Dollars (Note 1)
2019 2018 2019
Retirement benefit liability at beginning of period ¥(445) ¥(537) $(4,009)
Retirement benefit expenses 540 392 4,865
Benefits paid (18) (13) (162)
Contributions paid by the employer (185) (195) (1,667)
Increase due to the change from the principle method to the simplified method – (99) –
Other (6) 7 (54)
Retirement benefit liability at end of period ¥(114) ¥(445) $(1,027)
4) Reconciliation from projected benefit obligation and pension plan assets to liability (asset) for retirement benefits
Millions of YenThousands of
U.S. Dollars (Note 1)
2019 2018 2019
Funded projected benefit obligation ¥ 53,923 ¥ 55,416 $ 485,793
Pension plan assets (65,173) (68,409) (587,144)
(11,250) (12,993) (101,351)
Unfunded projected benefit obligation 414 315 3,729
Total net liability (asset) for retirement benefits recorded on the consolidated balance sheets (10,836) (12,678) (97,622)
Retirement benefit liability 578 322 5,207
Retirement benefit asset (11,414) (13,000) (102,829)
Total net liability (asset) for retirement benefits recorded on the consolidated balance sheets ¥(10,836) ¥(12,678) $ (97,622)
(Note): Including plans applying the simplified method.
5) Retirement benefit expenses
Millions of YenThousands of
U.S. Dollars (Note 1)
2019 2018 2019
Service cost ¥ 1,559 ¥1,595 $ 14,045
Interest cost 557 562 5,018
Expected return on pension plan assets (2,040) (2,097) (18,378)
Amortization of actuarial differences 1,792 2,236 16,144
Amortization of prior service costs (1,346) (3,148) (12,126)
Other 723 653 6,513
Retirement benefit expenses ¥ 1,245 ¥ (199) $ 11,216
(Note): 1. Premium retirement benefit expenses paid one time are included in Other. 2. In addition to the above retirement benefit expenses,the Group recorded extra retirement payments of ¥2,620 million [$23,604 thousand] under the early retirement system for the year ended March 31, 2019.
76 CASIO Integrated Report 2019

6) Remeasurements of defined benefit plans (before income tax effects)
Millions of YenThousands of
U.S. Dollars (Note 1)
2019 2018 2019
Actuarial differences ¥ (727) ¥ 1,238 $ (6,550)
Prior service costs (1,346) (3,148) (12,126)
Total ¥(2,073) ¥(1,910) $(18,676)
7) Accumulated remeasurements for retirement benefit (before income tax effects)
Millions of YenThousands of
U.S. Dollars (Note 1)
2019 2018 2019
Unrecognized actuarial differences ¥ 2,270 ¥ 1,543 $ 20,450
Unrecognized prior service costs (5,248) (6,594) (47,279)
Total ¥(2,978) ¥(5,051) $(26,829)
8) Pension plan assets
(i) Pension plan assets comprise:2019 2018
Equity securities 39% 17%
Debt securities 15% 2%
General account 22% 23%
Cash and deposits 19% 53%
Other 5% 5%
Total 100% 100%
(Note): The employee retirement benefit trust set up for corporate pension plans represents 17% and 16% of total pension assets, as of March 31, 2019 and 2018, respectively.
(ii) Long-term expected rate of return
Current and target asset allocations, as well as current and expected returns on various categories of pension plan assets
have been considered in determining the long-term expected rate of return.
9) Actuarial assumptions
The principal actuarial assumptions at the end of the period are as follows:2019 2018
Discount rate mainly 0.8% mainly 0.8%
Long-term expected rate of return mainly 3.0% mainly 3.0%
(2) Defined contribution plan
At March 31, 2019 and 2018, the required contributions to the defined contribution plans of the Company and its consolidated
subsidiaries were ¥1,121 million ($10,099 thousand) and ¥993 million, respectively.
77CASIO Integrated Report 2019

11. Net AssetsUnder the Japanese Corporation Law (“the Law”) and regulations, the entire amount paid for new shares is required to be
designated as capital stock. However, a company may, by a resolution of the board of directors, designate an amount not
exceeding one-half of the price of the new shares as legal capital surplus, which is included in capital surplus.
In cases where dividend distribution of surplus is made, the smaller of an amount equal to 10% of the dividend or the
excess, if any, of 25% of capital stock over the total of legal capital surplus and legal retained earnings must be set aside as
legal capital surplus or legal retained earnings. Legal retained earnings are included in retained earnings in the accompany-
ing consolidated balance sheets.
Legal capital surplus and legal retained earnings may not be distributed as dividends. However, all legal capital surplus
and all legal retained earnings may be transferred to other capital surplus and retained earnings, respectively, which are
potentially available for dividends.
The maximum amount that the Company can distribute as dividends is calculated based on the nonconsolidated financial
statements of the Company in accordance with the Law.
12. Lease Transactions(1) Finance lease transactions which do not transfer the ownership of the leased property to the lessee, and that were
concluded prior to the year that began on April 1, 2008 for which the new accounting standards were applied
The assumed outstanding future lease payments as of March 31, 2019 and 2018:
Millions of YenThousands of
U.S. Dollars (Note 1)
2019 2018 2019
Future lease payments:
Due within one year ¥6 ¥12 $54
Due over one year – 8 –
Total ¥6 ¥20 $54
Total lease expenses, total assumed depreciation cost and total assumed interest cost as lessee for the years ended March
31, 2019 and 2018:
Millions of YenThousands of
U.S. Dollars (Note 1)
2019 2018 2019
Total lease expenses ¥11 ¥14 $99
Total assumed depreciation cost 8 10 72
Total assumed interest cost 1 1 9
Assumed acquisition cost, accumulated depreciation and net book value of the leased assets under the finance lease
contracts as lessee as of March 31, 2019 and 2018:Millions of Yen
2019 Acquisition costAccumulated depreciation Net book value
Machinery, equipment and vehicles ¥104 ¥99 ¥5
Total ¥104 ¥99 ¥5
Thousands of U.S. Dollars (Note 1)
2019 Acquisition costAccumulated depreciation Net book value
Machinery, equipment and vehicles $937 $892 $45
Total $937 $892 $45
78 CASIO Integrated Report 2019

Millions of Yen
For 2018 Acquisition costAccumulated depreciation Net book value
Machinery, equipment and vehicles ¥155 ¥139 ¥16
Total ¥155 ¥139 ¥16
(Notes) 1. In calculating assumed depreciation cost, the leased assets are depreciated on a straight-line basis on the assumption that the lease term is the useful life and residual value is zero.
2. In calculating the assumed interest cost, the difference between the total lease amount and the assumed acquisition cost is taken as the assumed interest cost. The method of distribution over each period depends on the interest method.
(2) Finance leases
See Note 2 on P. 42
(3) Operating leases
Outstanding future noncancellable lease payments as of March 31, 2019 and 2018:
Millions of YenThousands of
U.S.Dollars (Note 1)
2019 2018 2019
Future lease payments:
Due within one year ¥164 ¥169 $1,478
Due over one year 457 557 4,117
Total ¥621 ¥726 $5,595
13. Segment Information(1) Overview of reportable segments
The Group’s reportable segments consist of the Group’s constituent units for which separate financial information is available
and which are subject to periodic examination in order for the board of directors to determine the allocation of management
resources and evaluate financial results.
The Group has designated three areas of segment reporting, which are the “Consumer,” “System Equipment,” and
“Others” segments, based on the type of products and services, and the market and consumer categories.
The categories of the main products and services belonging to each reportable segment are as follows:
Consumer ................................Watches, Clocks, Electronic dictionaries, Electronic calculators,
Label printers, Electronic musical instruments, Digital cameras, etc.
System Equipment ..................Handheld terminals, Electronic cash registers, Management support systems,
Data projectors, etc.
Others ......................................Formed parts, Molds, etc.
(2) Basis of measurement for net sales, income or loss, assets and others for each reportable segment
The accounting method for the reportable segments is largely in line with the descriptions in Notes 1-2 on p.40-44 Interseg-
ment profits are based on the market price.
79CASIO Integrated Report 2019

(3) Information on net sales, profit or loss, assets and others for each reportable segmentMillions of Yen
Reportable segments
Adjustments*
Amounts on consolidated
financial statements**For 2019 Consumer
System Equipment Others Total
Net sales:
External customers ¥257,354 ¥33,821 ¥ 6,986 ¥298,161 ¥ – ¥298,161
Intersegment 4 168 6,782 6,954 (6,954) –
Total 257,358 33,989 13,768 305,115 (6,954) 298,161
Segment profit (loss) 38,232 (910) 336 37,658 (7,396) 30,262
Segment assets 196,340 37,903 15,820 250,063 107,467 357,530
Other:
Depreciation 6,746 2,044 376 9,166 518 9,684
Amortization of goodwill 65 11 – 76 – 76
Investment to entities accounted for using equity method – – 2,719 2,719 – 2,719
Increase in property, plant and equipment and intangible assets 7,682 2,856 539 11,077 969 12,046
Thousands of U.S. Dollars (Note 1)
Reportable segments
Adjustments*
Amounts on consolidated
financial statements**For 2019 Consumer
System Equipment Others Total
Net sales:
External customers $2,318,505 $304,693 $ 62,937 $2,686,135 $ – $2,686,135
Intersegment 36 1,514 61,099 62,649 (62,649) –
Total 2,318,541 306,207 124,036 2,748,784 (62,649) 2,686,135
Segment profit (loss) 344,432 (8,198) 3,027 339,261 (66,630) 272,631
Segment assets 1,768,829 341,468 142,523 2,252,820 968,171 3,220,991
Other:
Depreciation 60,775 18,414 3,387 82,576 4,667 87,243
Amortization of goodwill 586 99 – 685 – 685
Investment to entities accounted for using equity method – – 24,496 24,496 – 24,496
Increase in property, plant and equipment and intangible assets 69,207 25,730 4,856 99,793 8,730 108,523
80 CASIO Integrated Report 2019

Millions of Yen
Reportable segments
Adjustments*
Amounts on consolidated
financial statements**For 2018 Consumer
System Equipment Others Total
Net sales:
External customers ¥268,905 ¥38,302 ¥ 7,583 ¥314,790 ¥ – ¥314,790
Intersegment 1 20 6,733 6,754 (6,754) –
Total 268,906 38,322 14,316 321,544 (6,754) 314,790
Segment profit 35,028 583 570 36,181 (6,613) 29,568
Segment assets 192,580 37,225 17,924 247,729 116,474 364,203
Other:
Depreciation 7,209 1,563 378 9,150 244 9,394
Amortization of goodwill 81 11 – 92 – 92
Investment to entities accounted for using equity method – – 2,706 2,706 – 2,706
Increase in property, plant and equipment and intangible assets 9,438 1,817 328 11,583 392 11,975
* Adjustments are as shown below:(1) Downward adjustments to segment profit (loss) for the years ended March 31, 2019 and 2018 are ¥7,396 million ($66,630 thousand) and ¥6,613 million,
respectively. These amounts include corporate expenses that are not allocated to any reportable segments of ¥7,396 million ($66,630 thousand) and ¥6,613 million, respectively. Corporate expenses principally consist of administrative expenses of the parent company and R&D expenses for fundamental research, which are not attributable to any reportable segments.
(2) Adjustments to segment assets for the years ended March 31, 2019 and 2018 are ¥107,467 million ($968,171 thousand) and ¥ 116,474 million, respectively. These amounts include corporate assets that are not allocated to any reportable segments of ¥107,536 million ($968,793 thousand) and ¥116,550 million, respectively.
(3) Adjustments to depreciation for the years ended March 31, 2019 and 2018 are ¥518 million ($4,667 thousand) and¥ 244 million, respectively. These amounts consist of depreciation of assets related to administrative divisions that are not attributable to any reportable segments.
(4) Adjustments to the increase in property, plant and equipment and intangible assets for the years ended March 31, 2019 and 2018 are ¥969 million ($8,730 thousand) and ¥392 million, respectively. These amounts consist of capital expenditures in administrative divisions that are not attributable to any reportable segments.
** Segment profit (loss) is reconciled with operating profit in the consolidated financial statements.
(4) Information about geographic areasMillions of Yen
For 2019 Japan North America Europe Asia Others Total
Net sales ¥94,512 ¥37,922 ¥50,822 ¥82,071 ¥32,834 ¥298,161
Thousands of U.S. Dollars (Note 1)
For 2019 Japan North America Europe Asia Others Total
Net sales $851,459 $341,640 $457,856 $739,378 $295,802 $2,686,135
Millions of Yen
For 2018 Japan North America Europe Asia Others Total
Net sales ¥100,360 ¥39,326 ¥53,774 ¥87,124 ¥34,206 ¥314,790
(Notes): 1. Sales are classified by country or region where customers are located. 2. Net sales of North America include ¥31,856 million ($286,991 thousand) in 2019 and ¥33,638 million in 2018 in the US,
while those of Asia include ¥30,093 million ($271,108 thousand) in 2019 and ¥35,369 million in 2018 in China.
81CASIO Integrated Report 2019

Millions of Yen
For 2019 Japan North America Europe Asia Others Total
Property, plant and equipment ¥49,239 ¥959 ¥407 ¥6,084 ¥116 ¥56,805
Thousands of U.S. Dollars (Note 1)
For 2019 Japan North America Europe Asia Others Total
Property, plant and equipment $443,594 $8,640 $3,667 $54,811 $1,045 $511,757
Millions of Yen
For 2018 Japan North America Europe Asia Others Total
Property, plant and equipment ¥49,670 ¥1,072 ¥466 ¥6,722 ¥102 ¥58,032
(5) Information on impairment loss of non-current assets for each reportable segmentMillions of Yen
For 2019 ConsumerSystem
Equipment Others
Elimination or unallocated
amount Total
Impairment loss ¥991 ¥251 ¥– ¥– ¥1,242
Thousands of U.S. Dollars (Note 1)
For 2019 ConsumerSystem
Equipment Others
Elimination or unallocated
amount Total
Impairment loss $8,928 $2,261 $– $– $11,189(Note): The above impairment loss is included in the amount indicated as “Business structure improvement expenses”.
Millions of Yen
For 2018 ConsumerSystem
Equipment Others
Elimination or unallocated
amount Total
Impairment loss ¥485 ¥– ¥– ¥– ¥485
(Note): The above impairment loss includes the impairment loss amount indicated as “Business structure improvement expenses.”
(6) Information on amortization of goodwill and unamortized balance in each reportable segmentMillions of Yen
For 2019 ConsumerSystem
Equipment Others
Elimination or unallocated
amount Total
Goodwill Balance at the end of the reporting year ¥172 ¥11 ¥– ¥– ¥183
Thousands of U.S. Dollars (Note 1)
For 2019 ConsumerSystem
Equipment Others
Elimination or unallocated
amount Total
Goodwill Balance at the end of the reporting year $1,550 $99 $– $– $1,649
Millions of Yen
For 2018 ConsumerSystem
Equipment Others
Elimination or unallocated
amount Total
Goodwill Balance at the end of the reporting year ¥251 ¥23 ¥– ¥– ¥274
(Note): Disclosure of the amount of goodwill amortization has been omitted as it is disclosed in the segment information above.
82 CASIO Integrated Report 2019

14. Contingent LiabilitiesAt March 31, 2019 and 2018, the Group was contingently liable for trade notes and export drafts discounted with banks in the
amount of ¥452 million ($4,072 thousand) and ¥422 million, respectively.
15. Impairment LossFor 2019
The Group recognized impairment loss.
Use Type of assets Location
Business assets Tools, furniture and fixtures, machinery, equipment and vehicles, software etc.
Zhongshan City, Guangdong Prov. China and others
With respect to business assets, the Group carries out asset grouping principally according to its management accounting
categories, which are employed to enable continuous monitoring of the Group’s earnings situation.
The Group has applied impairment accounting to business assets whose values are deemed to have significantly declined
due to deteriorating business environment. Book value of these assets has been reduced to recoverable amounts and the
reduced amounts of ¥1,242 million ($11,189 thousand) are recognized as “Business structure improvement expenses.”
The breakdown of the losses is : ¥779 million ($7,018 thousand) for tools, furniture and fixtures, ¥345 million ($3,108 thousand)
for machinery, equipment and vehicles, ¥64 million ($577 thousand) for software, and ¥54 million ($486 thousand) for others.
Recoverable amounts are estimated disposal values using net selling prices which are reasonably estimated.
For 2018
The Group recognized impairment loss.
Use Type of assets Location
Business assets Tools, furniture and fixtures, software etc. Higashine City, Yamagata Pref. and others
With respect to business assets, the Group carries out asset grouping principally according to its management accounting
categories, which are employed to enable continuous monitoring of the Group’s earnings situation.
The Group has applied impairment accounting to business assets whose values are deemed to have significantly declined
due to deteriorating business environment. Book value of these assets has been reduced to recoverable amounts and the
reduced amounts of ¥485 million is recognized as “Business structure improvement expenses.”
The breakdown of the losses is : ¥237 million for tools, furniture and fixtures, ¥173 million for software, and ¥75 million
for others.
Recoverable amounts are estimated disposal values using net selling prices which are reasonably estimated.
16. Business structure improvement expensesFor 2019
These expenses include the following:
• Impairment losses on non-current assets (following the restructuring of the musical instrument business)
• Expenses associated with closing business offices (following the restructuring of Japan-based operations
and services)
• Other expenses related to the above
For 2018
These expenses include loss on abandonment of assets, impairment loss of non-current assets and other related expenses
related to Digital Camera business structural reforms.
83CASIO Integrated Report 2019

17. Subsequent Events(1) Appropriation of retained earnings
At the annual shareholders’ meeting held on June 27, 2019, the Company’s shareholders approved the payment of a cash
dividend of ¥25.00 ($0.23) per share aggregating ¥6,158 million ($55,477 thousand) to registered shareholders as of March
31, 2019.
(2) Change in capital reserve
At a meeting on May 14, 2019, the Board of Directors resolved upon a plan to reduce the Company’s capital reserve. The plan
was proposed at the 63rd General Meeting of Shareholders held on June 27 of that year, and approved at the meeting.
1) Purpose of Reducing Capital Reserve
The Company reduced the capital reserve pursuant to Article 448, Paragraph 1, of the Corporation Law to enable it to plan its
capital strategy dynamically and flexibly.
2) Outline of Reduction
i) Amount reduced
The capital reserve of ¥64,565,597,149 ($581,672 thousand) was reduced by ¥50,000,000,000 ($450,450 thousand), leav-
ing ¥14,565,597,149 ($131,222 thousand).
ii) Method of Reduction
The ¥50,000,000,000 ($450,450 thousand) portion stated above was allocated to other capital surplus.
3) Timeline
i) May 14, 2019: Reduction resolved by Board of Directors
ii) June 27, 2019: Reduction approved by General Meeting of Shareholders
iii) August 31, 2019: Date when reduction took effect
84 CASIO Integrated Report 2019

(3) Purchase of Treasury Shares
At a meeting on June 3, 2019, the Board of Directors resolved upon a plan to acquire treasury shares pursuant to Article 156
of the Companies Act, applied with the modification stipulated in Article 165, Paragraph 3.
1) Purpose of Treasury Acquisition
To enhance shareholder returns and capital efficiency.
2) Outline of Acquisition
i) Class of shares acquired: Common stock
ii) Number of acquirable shares: Up to 4,000,000
iii) Total value of acquisition: Up to ¥5,000 million ($45,045 thousand)
iv) Period of acquisition: June 4 to July 4, 2019
v) Method of acquisition: The shares were purchased on the Tokyo Stock Exchange through on-floor trading
(4) Introduction of Restricted Stock Awards
At a meeting on May 14, 2019, the Board of Directors resolved to introduce a restricted stock awards plan (the “plan”). The
plan was proposed at the 63rd General Meeting of Shareholders held on June 27 of that year, and approved at the meeting.
1) Purpose of Introducing the Plan
One aim is to motivate eligible directors (outside directors and directors who serve on the Audit & Supervisory Board are not
eligible) to run the Company with a view to improving earnings and corporate value sustainably. Another aim is to more
closely align the interests of eligible directors with those of shareholders.
2) Outline of the Restricted Stock Awards
The eligible directors will make an in-kind contribution of the entirety of the monetary receivables the Company pays them
under the plan. The Company will then issue shares of common stock to the eligible directors, either by issuing new shares or
by disposing of treasury shares.
85CASIO Integrated Report 2019

i) Cap on total monetary receivables paid under the plan, cap shares to be issued
The total monetary receivables to be paid to eligible directors under the plan is capped at ¥100 million ($901 thousand)
per year (this does not include the portion paid for services as an employee). The total shares of common stock that the
Company may issue (either by issuing new shares or by disposing of treasury shares) is capped at 80,000 per year. The
Company may reasonably adjust the total amount of common shares that it newly issues or disposes from treasury
shares for the purpose of restricted stock awards if, after the date the shareholders approve the plan, it undertakes a
stock split (or allocation of shares without contribution) or reverse stock split, or if there is some other compelling
reason.
ii) Timing of payout, allotment
The Board of Directors will decide when the Company will issue the shares to the eligible directors. The board will also
decide how much eligible directors contribute per restricted share. This amount will be at a level that gives no particu-
lar advantage to the eligible directors. It will be based on the closing price of the Company’s common stock on the
Tokyo Stock Exchange for the business day preceding the day on which the board resolves for the Company to issue new
shares or dispose of treasury shares (or, if there is no trading on that day, the day preceding that).
iii) Other
Before issuing new shares or disposing of treasury shares under the plan, the Company will sign an agreement with
each eligible director providing for the allotment of the restricted shares as follows:
-The eligible director must not transfer, hypothecate, or otherwise dispose of the allotted shares for a fixed period.
-Under certain circumstances, the Company may acquire the shares from the eligible director for no consideration.
The Company will keep the shares in a trust for the transfer-restriction period to ensure that the eligible directors
do not transfer, hypothecate, or otherwise dispose of the shares during that time. The trust will be managed by
SMBC Nikko Securities.
3) How the Plan Applies to Executive officers
The plan equally applies to executive officers who do not serve on the Board of Directors.
86 CASIO Integrated Report 2019


