Embed Size (px)
Citation preview


1 Financial Results Summary
2 Consolidated Statement of Financial Position
3Consolidated Statement of Profit or Loss and Other Comprehensive Income
4 Consolidated Statement of Changes in Equity
5 Consolidated Statement of Cash Flows
6 Notes to the Consolidated Financial Statements
46 Non-consolidated Balance Sheet
48 Non-consolidated Statement of Income
Contents
Financial Results Summary
1. Basis of Presenting Consolidated
Financial Statements
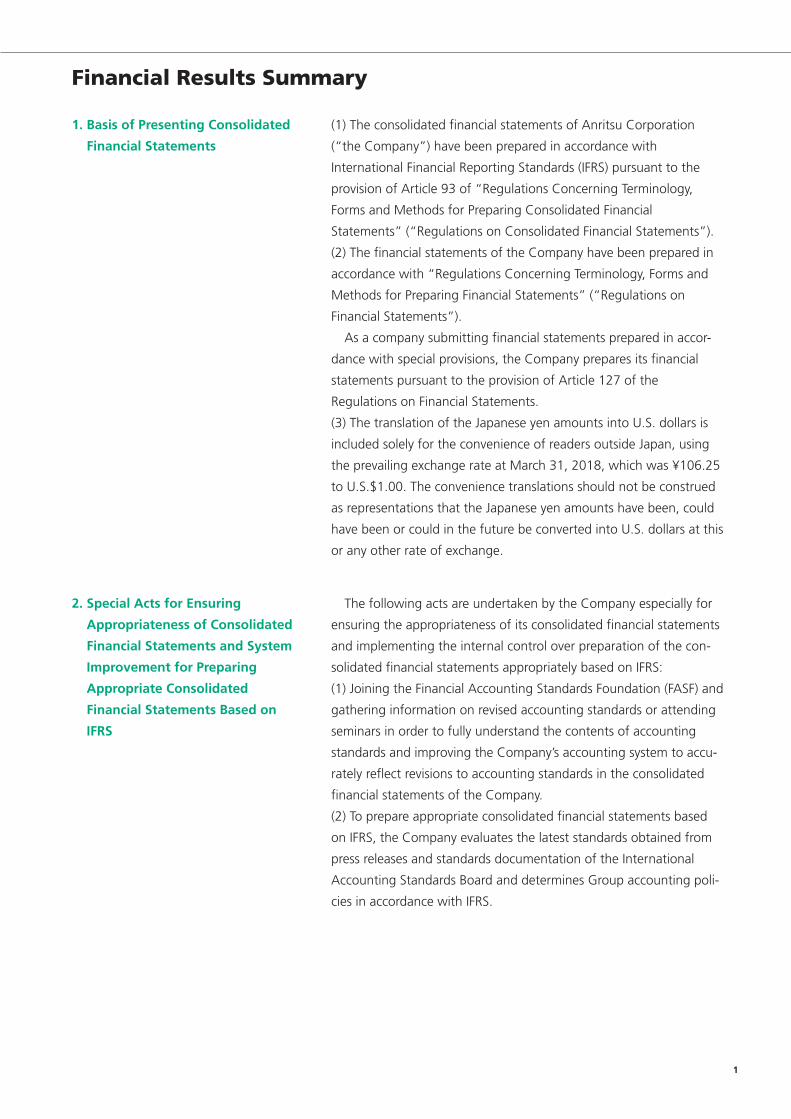
(1) The consolidated financial statements of Anritsu Corporation
(“the Company”) have been prepared in accordance with
International Financial Reporting Standards (IFRS) pursuant to the
provision of Article 93 of “Regulations Concerning Terminology,
Forms and Methods for Preparing Consolidated Financial
Statements” (“Regulations on Consolidated Financial Statements”).
(2) The financial statements of the Company have been prepared in
accordance with “Regulations Concerning Terminology, Forms and
Methods for Preparing Financial Statements” (“Regulations on
Financial Statements”).
As a company submitting financial statements prepared in accor-
dance with special provisions, the Company prepares its financial
statements pursuant to the provision of Article 127 of the
Regulations on Financial Statements.
(3) The translation of the Japanese yen amounts into U.S. dollars is
included solely for the convenience of readers outside Japan, using
the prevailing exchange rate at March 31, 2018, which was ¥106.25
to U.S.$1.00. The convenience translations should not be construed
as representations that the Japanese yen amounts have been, could
have been or could in the future be converted into U.S. dollars at this
or any other rate of exchange.
2. Special Acts for Ensuring
Appropriateness of Consolidated
Financial Statements and System
Improvement for Preparing
Appropriate Consolidated
Financial Statements Based on
IFRS
The following acts are undertaken by the Company especially for
ensuring the appropriateness of its consolidated financial statements
and implementing the internal control over preparation of the con-
solidated financial statements appropriately based on IFRS:
(1) Joining the Financial Accounting Standards Foundation (FASF) and
gathering information on revised accounting standards or attending
seminars in order to fully understand the contents of accounting
standards and improving the Company’s accounting system to accu-
rately reflect revisions to accounting standards in the consolidated
financial statements of the Company.
(2) To prepare appropriate consolidated financial statements based
on IFRS, the Company evaluates the latest standards obtained from
press releases and standards documentation of the International
Accounting Standards Board and determines Group accounting poli-
cies in accordance with IFRS.
1

Consolidated Statement of Financial PositionMarch 31, 2018 and 2017
Millions of yenThousands of U.S. dollars*
End of FY2016 as of
March 31, 2017
End of FY2017 as of
March 31, 2018
End of FY2017 as of
March 31, 2018
AssetsCurrent assets: Cash and cash equivalents (Notes 8 and 36) ¥ 39,682 ¥ 35,452 $ 333,665 Trade and other receivables (Notes 9 and 36) 21,561 21,474 202,108 Other financial assets (Notes 11 and 36) 1,152 1,164 10,955 Inventories (Note 10) 16,606 18,236 171,632 Income tax receivables 459 128 1,204 Other assets 2,960 3,120 29,364 Total current assets 82,421 79,576 748,950
Non-current assets: Property, plant and equipment (Note 12) 26,441 25,947 244,207 Goodwill and intangible assets (Note 13) 3,721 3,993 37,581 Investment property (Note 14) 1,664 1,463 13,769 Trade and other receivables (Notes 9 and 36) 330 326 3,068 Other financial assets (Notes 11 and 36) 2,481 2,747 25,854 Deferred tax assets (Note 16) 7,979 7,125 67,058 Other assets 14 9 84 Total non-current assets 42,632 41,613 391,651 Total ¥125,054 ¥121,190 $1,140,611
Liabilities and EquityLiabilitiesCurrent liabilities: Trade and other payables (Notes 17 and 36) ¥ 7,060 ¥ 7,998 $ 75,275 Bonds and borrowings (Notes 18 and 36) 7,565 4,467 42,042 Other financial liabilities (Notes 19, 20, and 36) 73 73 687 Income tax payables 1,608 2,352 22,136 Employee benefits (Note 21) 5,427 5,254 49,449 Provisions (Note 22) 273 323 3,040 Other liabilities (Note 23) 6,385 6,333 59,604 Total current liabilities 28,394 26,803 252,263
Non-current liabilities: Trade and other payables (Notes 17 and 36) 465 500 4,705 Bonds and borrowings (Notes 18 and 36) 14,460 11,477 108,018 Other financial liabilities (Notes 19, 20, and 36) 142 153 1,440 Employee benefits (Note 21) 3,188 2,247 21,148 Provisions (Note 22) 106 108 1,016 Deferred tax liabilities (Note 16) 256 185 1,741 Other liabilities (Note 23) 1,554 1,400 13,176 Total non-current liabilities 20,174 16,073 151,275 Total liabilities 48,568 42,876 403,538 Equity: Common stock (Note 24) 19,052 19,064 179,425 Additional paid-in capital (Note 24) 28,169 28,137 264,818 Retained earnings (Note 24) 24,394 26,254 247,096 Treasury stock (Note 24) (1,012) (987) (9,289) Other components of equity (Note 24) 5,794 5,761 54,221 Total equity attributable to owners of parent 76,398 78,230 736,282 Non-controlling interests 87 83 781 Total equity 76,485 78,313 737,063 Total ¥125,054 ¥121,190 $1,140,611
* The U.S. dollar amounts in this report represent translations of Japanese yen, for convenience only, at the rate of ¥106.25 to U.S. $1.00, the approximate exchange rate on March 31, 2018.
2

Consolidated Statement of Profit or Loss and Other Comprehensive IncomeYears ended March 31, 2018 and 2017
Millions of yenThousands of U.S. dollars*
FY2016From April 1, 2016 to March 31, 2017
FY2017From April 1, 2017 to March 31, 2018
FY2017From April 1, 2017 to March 31, 2018
Continuing operations
Revenue (Notes 6 and 26) ¥87,638 ¥85,967 $809,101
Cost of sales (Note 29) 45,168 44,023 414,334
Gross profit 42,469 41,943 394,757
Other revenue and expenses
Selling, general and administrative expenses (Notes 27 and 29) 27,198 26,563 250,004
Research and development expense (Notes 28 and 29) 10,906 10,156 95,585
Other income (Note 30) 205 224 2,108
Other expenses (Note 30) 336 535 5,035
Operating profit (loss) (Note 6) 4,234 4,912 46,230
Finance income (Note 31) 193 332 3,124
Finance costs (Note 31) 798 642 6,042
Profit (loss) before tax 3,628 4,602 43,312
Income tax expense (Note 16) 893 1,703 16,028
Profit (loss) from continuing operations 2,734 2,898 27,275
Profit (loss) 2,734 2,898 27,275
Other comprehensive income
Items that will never be reclassified to profit or loss
Change of financial assets measured at fair value (Note 32) 63 181 1,703
Remeasurements of defined benefit plans (Note 32) 1,129 988 9,298
Total 1,192 1,169 11,002
Items that may be reclassified subsequently to profit or loss
Exchange differences on translation (Note 32) (653) (213) (2,004)
Total (653) (213) (2,004)
Total of other comprehensive income 539 955 8,988
Comprehensive income (loss) ¥ 3,274 ¥ 3,854 $ 36,272
Profit (loss), attributable to:
Owners of parent ¥ 2,698 ¥ 2,880 $ 27,105
Non-controlling interests 36 18 169
Total ¥ 2,734 ¥ 2,898 $ 27,275
Comprehensive income (loss) attributable to:
Owners of parent ¥ 3,237 ¥ 3,836 $ 36,103
Non-controlling interests 36 18 169
Total ¥ 3,274 ¥ 3,854 $ 36,272
Yen U.S. dollars*
Earnings per share
Basic earnings per share (Note 33) ¥19.65 ¥20.97 $0.19
Diluted earnings per share (Note 33) 19.65 20.97 0.19
* The U.S. dollar amounts in this report represent translations of Japanese yen, for convenience only, at the rate of ¥106.25 to U.S. $1.00, the approximate exchange rate on March 31, 2018.
3

Consolidated Statement of Changes in EquityYears ended March 31, 2018 and 2017
FY2016 (From April 1, 2016 to March 31, 2017)
Commonstock
Additionalpaid-incapital
Retainedearnings
Treasurystock
Othercomponents
of equity
Total equityattributable
to ownersof parent
Non-controlling
interestsTotal
equity
Balance at April 1, 2016 ¥19,052 ¥28,220 ¥23,193 ¥(1,040) ¥6,385 ¥75,811 ¥51 ¥75,862
Profit (loss) — — 2,698 — — 2,698 36 2,734
Other comprehensive income (Note 32) — — 1,129 — (590) 539 — 539
Total comprehensive income (loss) — — 3,827 — (590) 3,237 36 3,274
Share-based payments (Note 35) — (51) 49 28 — 26 — 26
Dividends paid (Note 25) — — (2,677) — — (2,677) — (2,677)
Purchase of treasury stock (Note 24) — — — (0) — (0) — (0)
Dividends to non-controlling interests — — — — — — (0) (0)
Transfer from other components of equity to retained earnings — — 1 — (1) — — —
Total transactions with owners and other transactions — (51) (2,626) 28 (1) (2,650) (0) (2,651)
Balance at March 31, 2017 ¥19,052 ¥28,169 ¥24,394 ¥(1,012) ¥5,794 ¥76,398 ¥87 ¥76,485
FY2017 (From April 1, 2017 to March 31, 2018)
Balance at April 1, 2017 ¥19,052 ¥28,169 ¥24,394 ¥(1,012) ¥5,794 ¥76,398 ¥87 ¥76,485
Profit (loss) — — 2,880 — — 2,880 18 2,898 Other comprehensive income
(Note 32) — — 988 — (32) 955 — 955
Total comprehensive income (loss) — — 3,868 — (32) 3,836 18 3,854
Share-based payments (Note 35) 11 (32) 51 25 — 56 — 56
Dividends paid (Note 25) — — (2,059) — — (2,059) — (2,059)
Purchase of treasury stock (Note 24) — — — (0) — (0) — (0)
Disposal of treasury stock (Note 24) — 0 — 0 — 0 — 0
Dividends to non-controlling interests — — — — — — (0) (0) Changes in ownership interests
in subsidiaries that result in a loss of control — — — — — — (21) (21)
Total transactions with owners and other transactions 11 (32) (2,008) 25 — (2,003) (22) (2,026)
Balance at March 31, 2018 ¥19,064 ¥28,137 ¥26,254 ¥ (987) ¥5,761 ¥78,230 ¥83 ¥78,313
Thousands of U.S. dollars*
FY2017 (From April 1, 2017 to March 31, 2018)
Balance at April 1, 2017 $179,312 $265,120 $229,590 $(9,524) $54,531 $719,040 $818 $719,858 Profit (loss) — — 27,105 — — 27,105 169 27,275 Other comprehensive income
(Note 32) — — 9,298 — (301) 8,988 — 8,988 Total comprehensive income (loss) — — 36,404 — (301) 36,103 169 36,272 Share-based payments (Note 35) 103 (301) 480 235 — 527 — 527 Dividends paid (Note 25) — — (19,378) — — (19,378) — (19,378) Purchase of treasury stock (Note 24) — — — (0) — (0) — (0) Disposal of treasury stock (Note 24) — 0 — 0 — 0 — 0 Dividends to non-controlling interests — — — — — — (0) (0) Changes in ownership interests
in subsidiaries that result in a loss of control — — — — — — (197) (197)
Total transactions with owners and other transactions 103 (301) (18,898) 235 — (18,851) (207) (19,068)
Balance at March 31, 2018 $179,425 $264,818 $247,096 $(9,289) $54,221 $736,282 $781 $737,063
* The U.S. dollar amounts in this report represent translations of Japanese yen, for convenience only, at the rate of ¥106.25 to U.S. $1.00, the approximate exchange rate on March 31, 2018.Note: Details of Common stock, Additional paid-in capital, Retained earnings, Treasury stock and Other components of equity are described in Note 24, “Total Equity and Other Capital Items.”
4

Consolidated Statement of Cash FlowsYears ended March 31, 2018 and 2017
Millions of yenThousands of U.S. dollars*
FY2016 (12 months)
From April 1, 2016 to March 31, 2017
FY2017 (12 months)
From April 1, 2017 to March 31, 2018
FY2017 (12 months)
From April 1, 2017 to March 31, 2018
Cash flows from (used in) operating activities
Profit (loss) before tax ¥ 3,628 ¥ 4,602 $ 43,312
Depreciation and amortization expense 4,197 4,285 40,329
Interest and dividends income (188) (238) (2,240)
Interest expenses 158 128 1,204
Loss (gain) on disposal of property, plant and equipment 18 9 84
Decrease (increase) in trade and other receivables (1,932) (11) (103)
Decrease (increase) in inventories 1,775 (1,973) (18,569)
Increase (decrease) in trade and other payables 503 882 8,301
Increase (decrease) in employee benefits 401 376 3,538
Other, net 1,501 (47) (442)
Subtotal 10,063 8,014 75,425
Interest received 136 179 1,684
Dividends received 52 58 545
Interest paid (135) (109) (1,025)
Income taxes paid (1,169) (484) (4,555)
Income taxes refund 298 287 2,701
Net cash flows from (used in) operating activities 9,246 7,946 74,785
Cash flows from (used in) investing activities (Note 34)
Payments into time deposits (1,100) (1,215) (11,435)
Proceeds from withdrawal of time deposits 1,108 1,200 11,294
Purchase of property, plant and equipment (2,042) (2,444) (23,002)
Proceeds from sale of property, plant and equipment 27 2 18
Purchase of other financial assets (2) (2) (18)
Proceeds from sale of other financial assets 7 0 0
Other, net (1,663) (1,473) (13,863)
Net cash flows from (used in) investing activities (3,665) (3,932) (37,007)
Cash flows from (used in) financing activities (Note 34)
Net increase (decrease) in short-term borrowings (20) (100) (941)
Redemption of bonds — (6,000) (56,470)
Dividends paid (2,677) (2,059) (19,378)
Other, net (61) (42) (395)
Net cash flows from (used in) financing activities (2,758) (8,201) (77,185)
Effect of exchange rate change on cash and cash equivalents (532) (41) (385)
Net increase (decrease) in cash and cash equivalents 2,290 (4,229) (39,802)
Cash and cash equivalents at beginning of period 37,391 39,682 373,477
Cash and cash equivalents at end of period (Note 8) ¥39,682 ¥35,452 $333,665
* The U.S. dollar amounts in this report represent translations of Japanese yen, for convenience only, at the rate of ¥106.25 to U.S. $1.00, the approximate exchange rate on March 31, 2018.
5
Notes to the Consolidated Financial Statements
1. Reporting Entity Anritsu Corporation is an incorporated company located in
Japan. The registrated address of headquarters is disclosed in
Anritsu’s website (http://www.anritsu.com). The Company’s
reporting date is March 31, 2018. The consolidated financial
statements of the Company comprise the Company and its sub-
sidiaries (“the Anritsu Group”). The Anritsu Group is engaged
primarily in the Test and Measurement and PQA (Products
Quality Assurance) business. Main activities for each business are
stated under 6. Segment Information.
2. Basis of Preparation(1) Accounting Standards Adopted
The consolidated financial statements of the Anritsu Group
have been prepared in accordance with International Financial
Reporting Standards (IFRS) pursuant to the provision of Article
93 of the “Regulations Concerning Terminology, Forms and
Methods for Preparing Financial Statements” (“Regulations on
Consolidated Financial Statements”).
The Company meets the requirements of Article 1-2 of the
“Regulations on Consolidated Financial Statements.” The
Company is a qualified company for filing its financial state-
ments in IFRS in accordance with this article.
The consolidated financial statements of the Anritsu Group
have been approved by Hirokazu Hashimoto, Representative
Director and Group CEO, and Akifumi Kubota, Chief Financial
Officer of the Company.
(2) Basis of Measurement
The consolidated financial statements have been prepared on
a historical cost basis except for the following significant items:
• Derivatives are measured at fair value;
• Non-derivative financial assets at fair value through other com-
prehensive income are measured at fair value; and
• Defined benefit assets (liabilities) are recognized at the present
value of the defined benefit obligation less the fair value of the
plan assets.
(3) Functional and Presentation Currency
The consolidated financial statements are presented in
Japanese yen which is the Company’s functional currency. All
financial information presented in Japanese yen has been round-
ed down to the nearest million.
3. Significant Accounting Policies The significant accounting policies applied in the preparation
of the consolidated financial statements are summarized below:
Note: The Anritsu Group has early adopted IFRS 9 (Financial
Instruments, revised in October 2010).
(1) Basis of Consolidation
1. Subsidiaries
Subsidiaries are corporate entities that are controlled by the
Anritsu Group. Control exists when an investor is exposed to, or
has rights to, variable returns from its involvement with an
investee and has the ability to affect those returns through its
power over the investee.
The financial statements of all subsidiaries are included in the
consolidated financial statements from the date when control is
obtained by the Anritsu Group until the date when it is lost. All
inter-company transactions, and any unrealized gains/losses and
claims/obligations arising from them, are eliminated in the
preparation of the consolidated financial statements.
Among all of the subsidiaries, Anritsu Eletronica Ltda., Anritsu
Company S.A. de C.V., Anritsu (China) Co., Ltd., Anritsu
Electronics (Shanghai) Co., Ltd., Anritsu Industrial Solutions
(Shanghai) Co., Ltd. and Anritsu Industrial Systems (Shanghai)
Co., Ltd. set the reporting period-end date as December 31.
Thus, for these subsidiaries, additional financial statements as of
the end of the parent’s reporting period are prepared for consoli-
dation purposes. The reporting period-end date for other consol-
idated subsidiaries is the same as that of the parent.
The Anritsu Group applies the acquisition method as its meth-
od of accounting for business combinations. Goodwill is mea-
sured at the fair value of the consideration transferred, including
the recognized amount of any non-controlling interests in the
acquiree at the date of acquisition, less the net recognized
amount of the identifiable assets acquired and the liabilities
assumed at the acquisition date (ordinarily measured at fair
value). For each business combination, the Anritsu Group mea-
sures at the acquisition date components of non-controlling
interests in the acquiree that are present ownership interests and
entitle their holders to a proportionate share of the entity’s net
assets in the event of liquidation at either (a) fair value or (b) the
present ownership instruments’ proportionate share in the rec-
ognized amounts of the acquiree’s identifiable net assets.
Transaction expenses arising in relation to business combinations
are expensed as incurred.
Additional acquisitions of non-controlling interests are
accounted for as equity transactions, and no goodwill is recog-
nized.
Changes in equity interests in subsidiaries, if the Anritsu
Group retains control over the subsidiaries, are accounted for as
equity transactions. The carrying amounts of the Anritsu Group’s
interests and the non-controlling interests are adjusted to reflect
the change in interests in the subsidiary, and any difference
between the adjustment to the non-controlling interests and the
fair value of the consideration received is recognized directly in
equity as “Equity attributable to owners of the parent.” If the
Anritsu Group loses control over a subsidiary, profits and losses
that arise from the loss of control are recognized as profit or
loss.
6

Notes to the Consolidated Financial Statements
Business combinations of entities under common control, or
business combinations in which all the combining entities or
businesses are ultimately controlled by the same party or parties
both before and after the business combinations, when that
control is not transitory, are accounted for based on carrying
amounts.
2. Associates
Associates are entities over which the Anritsu Group has sig-
nificant influence but do not have control to govern the financial
and operating policies. Investments in associates are recognized
at acquisition cost and subsequently accounted for using the
equity method.
3. Joint Ventures
A joint venture is a joint arrangement whereby the parties that
have joint control of the arrangement have rights to the net
assets of the arrangement. The Anritsu Group accounts for its
share in a jointly controlled entity under a joint venture in the
same way as it accounts for associates using the equity method.
(2) Business Combinations
The acquisition method is applied as the method of account-
ing for business combinations. The acquisition consideration is
measured as the sum of the acquisition-date fair values of the
transferred assets exchange from control of the acquiree, liabili-
ties assumed, and the equity instruments issued by the acquirer.
If the acquisition consideration is more than the fair values of
the identifiable assets and liabilities, the excess amount is recog-
nized as goodwill in the consolidated statement of financial posi-
tion. Transaction expenses arising in relation to business
combinations are expensed as incurred.
(3) Foreign Currency Translation
1. Foreign Currency Transactions
Foreign currency transactions are translated into functional
currencies of individual companies of the Anritsu Group using
the spot exchange rate at the date of the transaction. At the end
of the reporting period, monetary assets and liabilities denomi-
nated in foreign currencies are retranslated into functional cur-
rencies using the spot exchange rate at the reporting date.
Non-monetary assets and liabilities measured at fair value and
denominated in foreign currencies are retranslated into function-
al currencies using the spot exchange rate at the date that the
fair value was determined. Non-monetary items that are mea-
sured at cost are translated using the spot exchange rate on the
date of the transaction.
Exchange differences arising from retranslation or settlement
of accounts are recognized in profit or loss for the relevant peri-
od.
2. Financial Statements of Foreign Subsidiaries
Assets and liabilities of foreign subsidiaries are translated into
Japanese yen using the spot exchange rate at the reporting date.
Income and expenses of foreign subsidiaries are translated into
Japanese yen at average exchange rates for the period.
Exchange differences arising from the translation of financial
statements of foreign subsidiaries are recognized in “Other
comprehensive income” in the consolidated statement of profit
or loss and other comprehensive income, and cumulative
exchange differences are presented in “Other components of
equity” in the consolidated statement of financial position.
On disposal of the entire interest in foreign operations, and on
the partial disposal of an interest involving loss of control, signifi-
cant influence or joint control, the cumulative amount of the
exchange differences is reclassified to profit or loss as a part of
gain or loss on disposal.
(4) Inventories
Inventories are measured at the lower of cost and net realiz-
able value. Cost is calculated primarily by the moving average
method for raw materials and primarily by the specific identifica-
tion method for finished goods and work in progress.
Net realizable value represents the estimated selling price for
the inventories in the ordinary course of business, less all esti-
mated costs of completion and estimated selling expenses.
(5) Property, Plant and Equipment
The cost model is applied to property, plant and equipment.
Property, plant and equipment are measured at historical cost,
net of accumulated depreciation and accumulated impairment
losses. Cost includes the expenses directly attributable to the
acquisition of the assets, the costs related to dismantling and
removal of the assets and restoration of the site on which the
assets are located to its original condition as well as borrowing
costs attributable to the assets.
Depreciation of these assets commences when the assets are
available for use, and the straight-line method is applied over
the following estimated useful lives:
• Buildings and Structures: 3–50 years
• Machinery, Equipment and Vehicles: 2–15 years
• Tools, Furniture and Fixtures: 2–20 years
Land and construction in progress are not depreciated.
Depreciation for assets held under finance leases, other than
those that can reasonably be expected to transfer the ownership
of the leased property at the end of the lease period, is comput-
ed over the lease period or the economic useful life of the assets,
whichever is shorter.
The depreciation methods, useful lives and residual values are
reviewed at the end of each reporting period, and revised when
necessary.
7

Notes to the Consolidated Financial Statements
(6) Goodwill and Intangible Assets
The cost model is applied to intangible assets and these assets
are measured at acquisition cost, net of accumulated amortiza-
tion and accumulated impairment loss.
Acquisition costs from business combinations are measured at
fair value at the date of intangible assets’ acquisition. After
being recognized, these assets are measured at acquisition cost,
net of accumulated amortization and accumulated impairment
loss.
1. Goodwill
Goodwill arising on the acquisition of a subsidiary is recog-
nized as an intangible asset. Measurement of goodwill on initial
recognition is described in Note 3(1)1.
Goodwill is measured at cost less accumulated impairment
loss. Goodwill is not amortized, but tested annually for impair-
ment and presented in impairment loss when necessary.
Impairment losses recognized for goodwill are not reversed in
subsequent periods.
2. Development Assets
Expenses arising from development activities are recognized as
assets only if the Anritsu Group has demonstrated all of the fol-
lowing conditions:
• The technical feasibility of completing the intangible asset so
that it will be available for use or sale;
• Its intention to complete the intangible asset and use or sell it;
• Its ability to use or sell the intangible asset;
• How the intangible asset will generate probable future eco-
nomic benefits;
• The availability of adequate technical, financial, and other
resources to complete the development and to use or sell the
intangible asset; and
• Its ability to measure reliably the expenditure attributable to
the intangible asset during its development.
Amortization of development assets commences when the rel-
evant project has ended using the straight-line method over the
estimated useful life ranging from 3 to 5 years during which the
relevant development asset is expected to generate net cash
inflows. The development expenditure that does not meet the
above requirements for capitalization as well as the expenditure
on research activities are expensed as incurred.
The amortization method and the amortization period are
reviewed at the end of each reporting period and revised when
necessary.
3. Other Intangible Assets
Other intangible assets primarily consist of computer software.
Amortization for other intangible assets commences when the
related assets are available for use based on the straight-line
method over the estimated useful life ranging from 3 to 7 years.
Amortization for assets held under finance leases, other than
those that can reasonably be expected to transfer the ownership
of the leased property at the end of the lease period, is comput-
ed over the lease period or the economic useful life of the assets,
whichever is shorter.
The depreciation methods, useful lives and residual values are
reviewed at the end of each reporting period and revised when
necessary.
(7) Investment Property
Investment property is primarily commercial facilities held for
the purpose of earning rental income. The cost model is applied
to investment property in which related assets are measured at
acquisition cost less accumulated depreciation and accumulated
impairment losses. Cost includes the expenditure that is directly
attributable to the acquisition of the assets, the costs related to
dismantling and removal of the assets and restoration of the site
on which the assets are located to its original condition as well
as borrowing costs attributable to the assets.
Depreciation of these assets commences when the assets are
available for use based on the straight-line method over the esti-
mated useful life ranging from 3 to 50 years.
Land is not depreciated.
The depreciation methods, useful lives and residual values are
reviewed at the end of each reporting period and revised when
necessary.
(8) Leases
Leases are classified as finance leases when all risks and
rewards associated with the leases are substantially transferred
to the Anritsu Group. All other leases are classified as operating
leases.
Finance leases are recognized as assets based on the fair value
of the leased property at the commencement of the lease or the
present value of the minimum lease payments, whichever is
lower. Lease obligations are presented as current liabilities and
non-current liabilities in the consolidated statements of financial
position. Finance costs are allocated to each period during the
term of the lease so as to produce a constant rate of interest on
the unamortized balance of liabilities.
Operating lease payments are treated as an expense using the
straight-line method over the lease period.
Variable lease payments are expensed as incurred.
(9) Derivatives
The Anritsu Group utilizes derivatives, including interest rate
swaps and foreign exchange forward contracts, as a hedge to
manage interest rate risk and foreign currency risk. However,
hedge accounting is not applied to these derivatives as the
requirements to qualify for hedge accounting are not met. These
derivatives are initially recognized at fair value at the date the
derivative contract is entered into and are subsequently remea-
sured at fair value, with gains and losses arising from changes in
fair value recognized in profit or loss.
8

Notes to the Consolidated Financial Statements
(10) Non-derivative Financial Assets
The Anritsu Group recognizes trade and other receivables
when they arise. Other financial assets are recognized at con-
tract dates when the Anritsu Group becomes a party to the con-
tractual provisions of the instrument.
1. Financial Assets Measured at Amortized Cost
Financial assets that meet the two conditions below are mea-
sured at amortized cost (less impairment losses) using the effec-
tive interest method.
• Under the Anritsu Group’s business model, the relevant finan-
cial asset is held with the objective of collecting contractual
cash flows.
• The contracted terms of the financial asset give rise to cash
flows on specified dates that are solely payments of principal
and interest on the principal outstanding.
2. Financial Assets Measured at Fair Value
through Other Comprehensive Income
Financial assets, other than those measured at amortized cost,
are measured at fair value and all changes in fair value are recog-
nized as profit or loss. However, on initial recognition, IFRS 9
permits an election to record all changes in fair value for an
investment in an equity instrument that is not for trading pur-
poses in other comprehensive income (“Financial Assets
Measured at FVTOCI”).
The Anritsu Group has elected to classify equity investments
that are held for the purpose of maintaining and strengthening
business relationships with investees as Financial Assets
Measured at FVTOCI.
Amounts recognized in other comprehensive income related
to Financial Assets Measured at FVTOCI are not transferred to
profit or loss, and impairment losses are not recognized.
However, dividends on such investments are recognized in profit
or loss as finance income, except in cases when it is evident that
the dividends are considered return of investment principal.
Changes in the fair value of Financial Assets Measured at
FVTOCI recorded in other comprehensive income on the consoli-
dated statement of profit or loss and other comprehensive
income are recognized in “Other components of equity” in the
consolidated statement of financial position. The balance of
“Other components of equity” is reclassified directly to
“Retained earnings” when the equity investment is derecog-
nized.
3. Derecognition of Financial Assets
The Anritsu Group derecognizes a financial asset when the
contractual rights to the cash flows from the asset expire or
when the Anritsu Group transfers the contractual right to receive
cash flows from financial assets in transactions in which substan-
tially all the risks and rewards of ownership of the asset are
transferred to another entity.
4. Cash and Cash Equivalents
Cash and cash equivalents are cash and highly liquid invest-
ments that are readily convertible to certain amounts of cash
with only a slight risk of fluctuation in value, including short-
term time deposits with original maturities of three months or
less.
(11) Non-derivative Financial Liabilities
Debt securities issued by the Anritsu Group are initially recog-
nized on the issue date. Other non-derivative financial liabilities
are recognized at contract dates when the Anritsu Group
becomes a party to the contractual provisions of the instrument.
The Anritsu Group derecognizes financial liabilities when they
are extinguished, i.e., when the obligation specified in the con-
tract is discharged, cancelled or expired.
The Anritsu Group has trade payables and other payables,
borrowings and bonds and other financial liabilities as non-deriv-
ative financial liabilities and initially measures them at fair value
(net after directly attributable transaction costs). After initial rec-
ognition, they are measured at amortized cost using the effective
interest method.
(12) Equity
1. Common Stock
Proceeds from issuance of equity instruments by the Company
are included in “Common stock” and “additional paid-in
capital.” The direct issue costs are deducted from “Additional
paid-in capital.”
2. Treasury Stock
When the Anritsu Group reacquires treasury stock, the consid-
eration paid, net of direct transaction costs, is recognized as a
deduction from equity. When the treasury stock is sold, the con-
sideration received is recognized as an increase in equity. When a
loss is incurred, it is reclassified to “Retained earnings.” When
the treasury stock is retired, the amount of retired treasury stock
is deducted from “Other additional paid-in capital” included in
“Additional paid-in capital.” If the amount of retired treasury
stock is more than the balance of “Other additional paid-in capi-
tal,” the excess amount is deducted from “Retained earnings.”
(13) Compound Instruments
The compound instruments issued by the Company include
corporate bonds with subscription rights to new shares that can
be converted to equity at the option of the holder and for which
the number of new shares to be issued is not affected by chang-
es in fair value. The liability element of a compound instrument
is initially recognized at the fair value of a similar liability that
does not have an equity conversion option. The equity element
of a compound instrument is initially recognized at the differ-
ence between the fair value of the compound instrument as a
whole and the fair value of the liability element. Any directly
9

Notes to the Consolidated Financial Statements
attributable transaction costs are allocated to each element in
proportion to the initial carrying amounts. After initial recogni-
tion, the liability element of a compound instrument is measured
at amortized cost using the effective interest method. The equity
element of a compound instrument is not remeasured after ini-
tial recognition.
(14) Impairment
1. Non-derivative Financial Assets
Financial assets measured at amortized cost are assessed at
each reporting date as to whether there is objective evidence
that the asset may be impaired. A financial asset is considered to
be impaired when there is objective evidence which indicates
that one or more loss events have occurred after the initial rec-
ognition of the asset and when it is reasonably anticipated that
the loss events have an impact on the estimated future cash
flows of the asset.
Objective evidence of impairment for financial assets mea-
sured at amortized cost includes default or delinquency of the
borrower, extension of the due date for the claim and indications
of bankruptcy of the borrower.
The Anritsu Group assesses whether evidence of impairment
exists individually and collectively for financial assets measured at
amortized cost. All individually significant financial assets are
individually assessed for impairment. Individually significant
financial assets found not to be impaired individually are then
collectively assessed for any impairment that has been incurred
but not yet recognized. Financial assets that are not individually
significant are collectively assessed for impairment in a group of
financial assets with similar risk characteristics. In assessing col-
lective impairment, the Anritsu Group evaluates historical trends
for the probability of default, timing of recoveries and the
amount of loss incurred. Adjustments are added to reflect judg-
ments on whether current economic and credit conditions are
such that the actual losses are likely to be greater or less than
those suggested by historical trends.
Impairment loss for financial assets measured at amortized
cost is measured as the difference between the asset’s carrying
amount and the present value of estimated future cash flows
discounted at the asset’s original effective interest rate. The
impairment loss is recognized through profit or loss for the peri-
od, and included in the allowance for doubtful accounts. If there
are events which decrease the amount of impairment after the
recognition of the impairment, the reversal of the impairment
loss is recognized in profit or loss.
2. Non-financial Assets
The carrying amounts of non-financial assets, excluding inven-
tories and deferred tax assets, are assessed whether there is any
indication of impairment at the end of each reporting period. If
any such indication exists, the recoverable amount of the non-
financial asset is estimated. Goodwill is tested for impairment
annually.
The recoverable amount of an asset or a cash-generating unit
is the higher of its value in use and its fair value less cost to sell.
In assessing value in use, the estimated future cash flows are dis-
counted to their present value using a pre-tax discount rate that
reflects the time value of money and the risks specific to the
asset. A cash-generating unit is the smallest group of assets
which generates cash inflows from continuing use that are large-
ly independent of the cash inflows from other assets or groups
of assets.
A cash-generating unit of goodwill is determined based on
the unit by which the goodwill is monitored for internal man-
agement purposes and does not exceed an operating segment
before aggregation.
If there is an indication that corporate assets may be impaired,
the recoverable amount is determined for the cash generating
unit to which the corporate assets belong, because the corpo-
rate assets do not generate independent cash inflows.
If the carrying amount of an asset or a cash-generating unit
exceeds the recoverable amount of it, an impairment loss is rec-
ognized in profit or loss. The impairment loss recognized related
to a cash-generating unit is allocated first to reduce the carrying
amount of any goodwill allocated to the unit and then to reduce
the other assets of the unit on a pro-rata basis based on the car-
rying amount of each asset in the unit.
An impairment loss recognized for goodwill is not reversed in
subsequent periods. Assets other than goodwill are reviewed to
determine whether there is any indication that an impairment
loss recognized in prior years may no longer exist or may have
decreased. An impairment loss recognized in prior years for an
asset is reversed to profit or loss if an event occurs to change the
estimates used to determine the asset’s recoverable amount. A
reversal of impairment loss does not exceed the carrying
amount, net of depreciation and amortization, that would have
been determined if no impairment loss had been recognized for
the asset for prior years.
(15) Assets Held for Sale
Non-current assets (or disposal groups) not in continuing use
for which the value is anticipated to be recovered through sale
are classified as “Assets held for sale.” Classification as “Assets
held for sale” is made when the asset meets the following two
conditions: (1) it can be sold immediately in its current state; and
(2) the probability of sale is extremely high.
“Assets held for sale” are measured at the carrying amount or
fair value less costs to sell, whichever is lower. Depreciation or
amortization is not applied to property, plant and equipment
and intangible assets that have been classified as “Assets held
for sale.”
Non-current assets (or disposal groups) that cease to be classi-
fied as held for sale are measured at the lower of (a) their carry-
ing amounts, adjusted for any depreciation or amortization that
would have been recognized if the impairment loss had not
been recognized for the assets, or (b) the recoverable amounts
10

Notes to the Consolidated Financial Statements
at the date that the assets are decided not to be classified as
held for sale. Adjustments of the carrying amounts arising from
ceases of reclassification to the non-current assets held for sale
are recognized in profit or loss.
(16) Employee Benefits
1. Defined Benefit Plans
A retirement lump-sum payment plan and a cash-balance pen-
sion plan (market interest reflecting type) have been adopted as
defined benefit plans to cover the employees of the Company
and some of its subsidiaries. Net defined benefit obligations are
calculated separately for each plan by estimating the amount of
future benefits that employees have earned in exchange for their
service for the prior and current years. The estimated benefits
are discounted to determine the present value, and the fair value
of plan assets is deducted.
The discount rates are the yields of high quality corporate
bonds that have maturity terms approximating those of the
Company’s obligations. Retirement benefit obligations are calcu-
lated using the projected unit credit method with adjustments
made using the straight-line method when a very high benefit
level is incurred in the latter half of the number of years of ser-
vice.
The Anritsu Group recognizes remeasurements of the net
defined benefit plans in “Other comprehensive income” in the
consolidated statement of profit or loss and other comprehen-
sive income as incurred and records cumulative remeasurements
of the net defined benefit plans in “Retained earnings” in the
consolidated statement of financial position.
2. Defined Contribution Plans
The employees of the Company and certain subsidiaries are
provided with defined contribution plans.
Defined contribution plans are postemployment benefit plans
in which an entity pays fixed contributions into a separate entity
and will have no legal or constructive obligation to pay further
contributions.
The contribution payable to defined contribution plans is
recognized as an expense during the period when the service
is rendered.
3. Short-term Employee Benefits
Short-term employee benefits are measured on an undis-
counted basis and are recognized as an expense during the
period when the service is rendered.
Bonuses and paid leave accruals are recognized as liabilities for
the amount estimated to be paid based on the bonus and paid
leave systems, when the Anritsu Group has present legal or con-
structive obligations to pay, and when reliable estimates of the
obligation can be made.
4. Other Long-term Employee Benefits
In addition to its pension plans, the Anritsu Group has special
leave and bonus systems awarded in accordance with a defined
number of years of service. Obligations for other long-term
employee benefits are recorded at an amount calculated by
estimating the future amount of benefits that employees have
earned in exchange for their service for the previous and current
years discounted to determine the present value.
The discount rates are the yields of high quality corporate
bonds that have maturity terms approximating those of the
Company’s obligations.
5. Share-based Payment
The Anritsu Group has stock option plans and Performance-
Related Stock Compensation Programs as incentive plans for
directors and certain employees.
Under the stock option plans, rights to share-based payments
are vested at the grant date of the share-based payment.
Consequently, the fair value of stock options at the grant date is
recognized as a lump-sum expense at the grant date, and the
same amount is recognized as a corresponding increase in equi-
ty. The fair value of the stock options is measured using the
Black-Scholes model, taking into account the terms of the
options granted.
The Performance-Related Stock Compensation Program is a
program to distribute a certain number of the Company’s shares,
which is determined based on the number of evaluation points
granted taking into consideration the degree of attainment of
the numeral target for the management indicator. An expense is
recognized over the vesting period which is from the date when
the measurement of degree of attainment starts until the date
on which a right to receive the Company’s shares is vested, and
the same amount is recognized as a corresponding increase in
equity. The amounts recognized in expense and the correspond-
ing increase in equity are measured by reference to the fair value
of the equity instruments granted. The recognized increase in
equity is reversed when the Company’s shares are distributed
after the date on which a right to receive the Company’s shares
was vested.
(17) Provisions
Provisions are recognized when, as a result of past events the
Anritsu Group has legal or constructive obligations that can be
estimated reliably and it is probable that outflows of economic
resources will be required to settle the obligations.
Provisions are determined by discounting the expected future
cash flows at a pre-tax rate that reflects the time value of money
and the risks specific to the liability. The unwinding of the dis-
count with the passage of time is recorded as “Finance Costs.”
11

Notes to the Consolidated Financial Statements
1. Provision for Decommissioning, Restoration
and Rehabilitation Costs
Estimated amounts for the costs of removing hazardous sub-
stances related to property, plant and equipment and restoring
rented offices to the original condition are recorded in the provi-
sion for decommissioning, restoration and rehabilitation costs.
2. Provision for Product Warranties
The provision for product warranties is calculated to provide
for anticipated service expenses arising within the warranty peri-
od of products sold and includes future warranty forecasts based
on the actual results of past years.
(18) Government Grants
Government grants are recognized at fair value, once the col-
lateral conditions for the grants are met and the receipt of such
grants is reasonably assured.
Government grants in respect of expenses are recognized in
profit or loss in the period in which expenses intended to be cov-
ered by such grants are incurred. Government grants in respect
of assets are recognized by the method in which such grants are
recorded as deferred income and recognized in profit or loss on
a systematic basis over the useful lives of the assets concerned.
(19) Revenue
The Anritsu Group measures revenue at the fair value of the
consideration received, less discounts, rebates and taxes, includ-
ing consumption tax.
1. Sale of Goods
Revenue from the sale of goods is recognized when: (1) the
significant risks and rewards of ownership of the goods have
been transferred to the buyer; (2) there is no continuing mana-
gerial involvement with the goods; (3) it is probable that the
economic benefits associated with the transaction will flow to
the Anritsu Group; and (4) the costs and amount of revenue
associated with the transaction can be measured reliably.
The timing of the transfer of the risks and rewards of owner-
ship of the goods varies according to the terms of individual
sales agreements, and revenue is normally recognized at the
time of delivery to the customer or on the shipment date.
2. Rendering of Services
Rendering of services at the Anritsu Group consists mainly of
repair and support services that arise in connection with the sale
of goods. Revenue from these transactions is recognized at the
time when the service is rendered or over the contract period.
3. Multi-element Transactions
A multi-element transaction under which a number of deliver-
ables are furnished, including goods, software and support ser-
vices, is separated into its individual elements if it meets both of
the following requirements.
• The elements have standalone value to the customer; and
• The fair value of the elements can be reliably measured.
When it is necessary to allocate the agreed consideration for a
multi-element transaction between the delivered and undeliv-
ered elements, the allocation is based on the fair value of the
undelivered elements. In other words, under the residual meth-
od, the amount of consideration allocated to the delivered
elements is equal to the total agreed consideration less the
aggregate fair value of the undelivered elements.
(20) Finance Income and Costs
Finance income comprises mainly interest income and divi-
dend income. Finance costs comprise mainly interest payments
on borrowings and corporate bonds calculated using the effec-
tive interest method. Foreign exchange gains and losses are
recorded in “Finance Income” or “Finance Costs” on a net basis.
Interest income is recognized when incurred using the effec-
tive interest method. Dividend income is recognized on the date
when the right to receive payment is assured. Borrowing costs
that are not directly attributable to the acquisition, construction
or production of qualifying assets are recognized as an expense
using the effective interest method.
(21) Income Tax Expense
Income tax expense comprises current tax expense and
deferred tax expense. These are recognized in profit or loss,
except for taxes which arise from business combinations or that
are recognized either in other comprehensive income or directly
in equity.
Current tax expense is the expected tax payables and receiv-
ables on the taxable profit for the year using the tax rates enact-
ed or substantially enacted by the end of the reporting period
adjusted by tax payables or receivables in prior fiscal years.
Deferred tax assets and liabilities are recognized on temporary
differences between the carrying amounts of assets and liabilities
for accounting purposes and their tax bases. Deferred tax assets
and liabilities are not recognized for the temporary differences
below:
• Future temporary differences arising from initial recognition of
goodwill;
• Temporary differences relating to initial recognition of an asset
or liability in a transaction which is not a business combination
and, at the time of transaction, affects neither accounting
profit nor taxable profit;
• Future temporary differences associated with investments in
subsidiaries when the Company is in a position to control the
timing of the reversal of the temporary differences and it is
probable that such differences will not reverse in the foresee-
able future; and
• Future temporary differences associated with investments in
subsidiaries when it is probable that such differences will not
reverse in the foreseeable future.
Deferred tax assets and liabilities are measured at the tax rates
that are expected to apply in the period when the temporary dif-
ferences will reverse, based on tax laws that have been enacted
or substantively enacted by the end of the reporting period.
12

Notes to the Consolidated Financial Statements
Deferred tax assets and deferred tax liabilities are offset when:
(1) there is a legally enforceable right to offset current tax assets
against current tax liabilities; and (2) income taxes are levied by
the same taxation authority on either the same taxable entity or
different taxable entities which intend either to settle current tax
assets and liabilities on a net basis or to realize the assets and
settle the liabilities simultaneously.
Deferred tax assets are recognized for unused tax losses, tax
credits and deductible temporary differences to the extent that it
is probable that future taxable profits will be available against
which they can be utilized. Deferred tax assets are reviewed at
the end of each reporting period and recognized to the extent
that it is probable that the related tax benefits will be realized.
(22) Earnings Per Share (attributable to owners of parent)
Basic earnings per share is calculated by dividing the profit
attributable to owners of the parent by the weighted average
number of shares in issue during the fiscal year excluding shares
purchased by the Company and held as treasury stock. Diluted
earnings per share are calculated by adjusting for the effect of all
dilutive potential common stock.
4. Significant Accounting Estimates and Judgements The preparation of consolidated financial statements based on
IFRS requires management to make judgments, estimates and
assumptions that affect the application of account policies and
the reported amounts of assets, liabilities, income and expenses.
Actual results could differ from these estimates. The estimates
and underlying assumptions are reviewed on an ongoing basis.
The influence from revisions to accounting estimates are recog-
nized in the period in which the estimates are revised and in
future periods in which the revision has an effect.
Items requiring judgment by management that have signifi-
cant effects in the consolidated financial statements are as
follows:
• Impairment of Non-financial Assets (Note 15. Impairment Loss
on Non-financial Assets)
• Recoverability of Deferred Tax Assets (Note 16. Income Tax
Expense)
• Measurement of Defined Benefit Obligation (Note 21.
Employee Benefits)
• Provisions in Accounting Method and Evaluation (Note 22.
Provisions)
• Contingencies (Note 40. Contingencies)
5. New Standards and Interpretations not yet Applied
Except for IFRS 9 “Financial Instruments (revised in October
2010),” the Anritsu Group has not early applied new standards
nor revised standards and interpretations for its consolidated
financial statements before the fiscal year ended in March 31
2018.
At the date of approval of the consolidated financial state-
ments, the main standards and interpretations that were
released but not early applied by the Anritsu Group are set out
below. The impact of the adoption of IFRS 9 (revised in July
2014) and IFRS 15 has no material impact. IFRS 16 is currently
being assessed but has not yet been determined. Except for
these standards, the following standards and interpretations will
have no material impact on its consolidated financial statements.
Standard Title
Mandatory effective date (from the fiscal period that begins on or after)
To be adopted by the Anritsu Group (from the fiscal period ending) Subject of new standards/amendment
IFRS 2 Shared-based Payment January 1, 2018 March 31, 2019 Amendment on classification and measurement on shared-based payment transactions
IFRS 7 Financial Instruments: Disclosures
January 1, 2018 March 31, 2019 Amendment to include financial assets and liabilities designated as those to be measured at fair value through profit or loss after the initial recognition in the existing disclosure of the carrying amounts, profits and losses of the financial assets and liabilities measured at fair value through profit or loss, as well as deletion of existing disclosure rules and addition of new disclosure rules in association with the introduction of new hedge accounting
IFRS 9 Financial Instruments January 1, 2018 March 31, 2019 Limited changes of classification of financial assets and introduction of an expected credit loss impairment model
IFRS 15 Revenue from Contracts with Customers
January 1, 2018 March 31, 2019 Provision of principles and guidance along with the expansion of disclosure items in respect of revenues from contracts with customers as well as associated issues
IFRS 16 Leases January 1, 2019 March 31, 2020 Amendment to the accounting treatment for leases
IFRS 10 Consolidated Financial Statements
Undetermined Undetermined Clarification of the accounting treatment for sale or contribution of assets between an investor and its associate or joint venture
IAS 28 Investments in Associates and Joint Ventures
Undetermined Undetermined Clarification of the accounting treatment for sale or contribution of assets between an investor and its associate or joint venture
13

Notes to the Consolidated Financial Statements
6. Segment Information(1) Outline of Reportable Segment
The reportable segments of the Anritsu Group are business
segments which are classified based on products and services.
Each business segment operates its business activities with a
comprehensive domestic and overseas strategic business plan.
The Board of Directors meeting periodically makes decisions on
allocation of operating resources and evaluates business perfor-
mance based on segment financial information. The Anritsu
Group’s reportable segments are composed of “Test and
Measurement” and “PQA” (Products Quality Assurance).
Main products and services by segment are as follows:
1. Test and Measurement: Measuring instruments for Digital
communications and IP network, Optical communications
equipment, Mobile communications equipment, RF / micro-
wave and millimeter wave communications equipment /
systems, Service assurance
2. PQA: Checkweighers, Automatic combination weighers,
Inspection equipment, Comprehensive production manage-
ment system
2) Information regarding Revenue, Profit or Loss, Assets and Others by Reportable Segment
Reportable segment information of the Anritsu Group is included below.
Accounting policies for reportable segments are the same as the accounting policies for the Anritsu Group described in Note 3.
Inter-segment revenue is measured based on market price.
Millions of yen
Reportable segment
Year ended March 31, 2017(From April 1, 2016 to March 31, 2017)
Test and Measurement PQA Subtotal Others (Note 1) Total
Adjustment (Notes 2, 3) Consolidated
Outside customers ¥59,333 ¥19,588 ¥ 78,921 ¥ 8,716 ¥ 87,638 ¥ — ¥ 87,638
Inter-segment 58 3 61 4,295 4,356 (4,356) —
Total 59,391 19,591 78,982 13,012 91,995 (4,356) 87,638
Cost of sales, Other revenue and expenses (57,261) (18,288) (75,550) (12,020) (87,570) 4,165 (83,404)
Operating profit (loss) 2,130 1,302 3,432 992 4,425 (190) 4,234
Finance income — — — — — — 193
Finance costs — — — — — — 798
Profit (loss) before tax — — — — — — 3,628
Income tax expense — — — — — — 893
Profit (loss) for the year — — — — — — 2,734
Assets 89,651 16,822 106,473 11,674 118,147 6,906 125,054
Capital expenditures 2,207 273 2,481 416 2,897 (3) 2,894
Depreciation and amortization 3,445 235 3,681 527 4,209 (11) 4,197
Notes: 1. Others: Information and Communications, Devices, Logistics, Welfare-related service, Leases on real estate, Corporate administration, Parts manufacturing and others 2. Adjustment of operating profit includes elimination of inter-segment transactions (11 million yen) and company-wide expenses not allocated to business segments (-202 million yen).
Company-wide expenses are composed mainly of basic research expense as well as selling, general and administrative expenses not attributable to business segments. 3. Adjustment of segment assets includes excess investment capital not attributable to business segments (cash and cash equivalents), long-term investment capital (other financial
assets (non-current assets)) and assets related to basic research.
Millions of yen
Reportable segment
Year ended March 31, 2018(From April 1, 2017 to March 31, 2018)
Test and Measurement PQA Subtotal Others (Note 1) Total
Adjustment (Notes 2, 3) Consolidated
Outside customers ¥54,433 ¥22,549 ¥ 76,982 ¥ 8,984 ¥ 85,967 ¥ — ¥ 85,967
Inter-segment 75 3 78 4,484 4,562 (4,562) —
Total 54,508 22,553 77,061 13,468 90,530 (4,562) 85,967
Cost of sales, Other revenue and expenses (52,682) (20,583) (73,265) (12,165) (85,431) 4,376 (81,055)
Operating profit (loss) 1,825 1,969 3,795 1,302 5,098 (186) 4,912
Finance income — — — — — — 332
Finance costs — — — — — — 642
Profit (loss) before tax — — — — — — 4,602
Income tax expense — — — — — — 1,703
Profit (loss) for the year — — — — — — 2,898
Assets 84,456 17,117 101,573 9,813 111,387 9,803 121,190
Capital expenditures 3,287 385 3,672 324 3,997 (5) 3,992
Depreciation and amortization 3,484 271 3,756 539 4,296 (10) 4,285
Notes: 1. Others: Information and Communications, Devices, Logistics, Welfare-related service, Leases on real estate, Corporate administration, Parts manufacturing and others 2. Adjustment of operating profit includes elimination of inter-segment transactions (5 million yen) and company-wide expenses not allocated to business segments (-191 million yen).
Company-wide expenses are composed mainly of basic research expense as well as selling, general and administrative expenses not attributable to business segments. 3. Adjustment of segment assets includes excess investment capital not attributable to business segments (cash and cash equivalents), long-term investment capital (other financial
assets (non-current assets)) and assets related to basic research.14

Notes to the Consolidated Financial Statements
(3) Information regarding Products and Service
Revenue of products and service from external customers in the previous and current fiscal years are as described in (2). The Anritsu
Group does not manage business segmentation by products and services of each reporting segment.
(4) Information regarding Geographical Areas
Revenue and non-current assets (excluding financial instruments and deferred tax assets) by geographic area are indicated below.
Revenue is based on geographical location of customers. Non-current assets (excluding financial instruments and deferred tax assets)
are based on geographical location of the assets.
Millions of yen
FY2016 (From April 1, 2016 to March 31, 2017) Revenue Non-current assets
Japan ¥29,338 ¥27,201
Americas 19,633 3,014
(United States) (16,646) —
EMEA 12,520 1,374
Asia and others 26,145 606
(China) (12,007) —
Eliminations and corporate — (356)
Total ¥87,638 ¥31,841
Notes: 1. The principal countries in geographical area are as follows: (1) Americas: United States, Canada, Mexico and Brazil (2) EMEA: United Kingdom, France, Germany, Italy, Sweden, Spain, Denmark, Romania, Middle East and Africa (3) Asia and others: China, Korea, Taiwan, Singapore, Australia, Thailand and India
2. The Anritsu Group has not disclosed non-current assets (excluding financial instruments and deferred tax assets) for the United States and China as the amounts are immaterial.
Millions of yen
FY2017 (From April 1, 2017 to March 31, 2018) Revenue Non-current assets
Japan ¥29,753 ¥26,163
Americas 17,419 2,496
(United States) (13,833) —
EMEA 12,781 2,534
Asia and others 26,012 596
(China) (10,666) —
Eliminations and corporate — (376)
Total ¥85,967 ¥31,414
Notes: 1. The principal countries in geographical area are as follows: (1) Americas: United States, Canada, Mexico and Brazil (2) EMEA: United Kingdom, France, Germany, Italy, Sweden, Spain, Denmark, Romania, Middle East and Africa (3) Asia and others: China, Korea, Taiwan, Singapore, Australia, Thailand, India and the Philippines.
2. The Anritsu Group has not disclosed non-current assets (excluding financial instruments and deferred tax assets) for the United States and China as the amounts are immaterial.
(5) Information regarding Key Customers
The Anritsu Group has no revenue from transactions with a single external customer that amounts to 10% or more of revenue of the
Anritsu Group.
7. Business Combinations There are no significant business combinations to be disclosed.
8. Cash and Cash Equivalents The balances of cash and cash equivalents in the consolidated statement of financial position as of the previous fiscal year-end and
the current fiscal year-end agree to the respective balances in the consolidated statement of cash flows.
15

Notes to the Consolidated Financial Statements
9. Trade and Other Receivables Details of trade and other receivables are as follows:
Millions of yen
End of FY2016as of March 31, 2017
End of FY2017as of March 31, 2018
Accounts receivable–trade ¥19,296 ¥18,773
Notes receivable–trade 2,257 2,655
Accounts receivable–other 42 64
Others 455 456
Less: Allowance for doubtful accounts (161) (147)
Total ¥21,891 ¥21,801
Current assets ¥21,561 ¥21,474
Non-current assets 330 326
Total ¥21,891 ¥21,801
10. Inventories Details of inventories are as follows:
Millions of yen
End of FY2016as of March 31, 2017
End of FY2017as of March 31, 2018
Raw materials ¥ 5,900 ¥ 7,388
Work in process 3,983 4,197
Finished goods 6,721 6,650
Total ¥16,606 ¥18,236
Notes: 1. The losses on valuation of inventories is included in “Cost of sales.” Amounts of valuation loss included in the “Cost of sales” are 1,155 million yen in FY2016 and 1,038 million yen in FY2017.
2. Inventories recorded in “Cost of sales” as expenses were 40,759 million yen in FY2016 and 39,699 million yen in FY2017 (including the above losses on valuation). 3. The Company has not pledged any inventories as collateral.
11. Other Financial Assets Details of other financial assets classified as current or non-current assets are shown below.
In this section, financial assets measured at fair value through profit or loss are presented as “Financial Assets Measured at FVTPL,”
while financial assets measured at fair value through other comprehensive income are presented as “Financial Assets Measured at
FVTOCI.”
• Current assets
Millions of yen
End of FY2016as of March 31, 2017
End of FY2017as of March 31, 2018
Time deposits with a maturity of more than 3 months (Financial assets measured at amortized cost) ¥1,137 ¥1,158
Derivatives (Financial assets measured at FVTPL) 14 6
Total ¥1,152 ¥1,164
• Non-current assets
Millions of yen
End of FY2016as of March 31, 2017
End of FY2017as of March 31, 2018
Marketable securities (Financial assets measured at FVTOCI) ¥2,481 ¥2,747
Total ¥2,481 ¥2,747
16

Notes to the Consolidated Financial Statements
12. Property, Plant and Equipment(1) Acquisition Cost, Accumulated Depreciation and Accumulated Impairment Loss on Property, Plant and Equipment
Millions of yen
Acquisition costBuildings
and structuresMachinery
and vehicles
Tools, equipment
and fixtures LandConstruction
in progress Total
Balance at April 1, 2016 ¥46,423 ¥11,410 ¥14,912 ¥3,817 ¥134 ¥76,699
Acquisition 492 539 852 — 18 1,902
Business combinations 0 12 0 — — 13
Disposal (75) (218) (1,609) — — (1,904)
Effect of foreign currency exchange differences (51) (111) (56) (19) 0 (237)
Others 133 53 (5) — (148) 33
Balance at March 31, 2017 46,923 11,686 14,094 3,798 4 76,507
Acquisition 659 1,165 798 — 10 2,633
Loss of control (15) — (14) — — (30)
Disposal (110) (233) (738) — — (1,083)
Effect of foreign currency exchange differences (177) (214) (20) (40) (0) (453)
Others 18 — (45) — — (26)
Balance at March 31, 2018 ¥47,297 ¥12,403 ¥14,073 ¥3,757 ¥ 14 ¥77,547
Millions of yen
Accumulated depreciation and accumulated impairment lossBuildings
and structuresMachinery
and vehicles
Tools, equipment
and fixtures LandConstruction
in progress Total
Balance at April 1, 2016 ¥(27,748) ¥ (9,767) ¥(11,445) ¥— ¥— ¥(48,961)
Depreciation expense (1,264) (548) (1,225) — — (3,038)
Disposal 72 207 1,482 — — 1,762
Effect of foreign currency exchange differences 33 105 33 — — 172
Others 1 0 (2) — — (1)
Balance at March 31, 2017 (28,904) (10,003) (11,157) — — (50,066)
Depreciation expense (1,297) (615) (1,052) — — (2,965)
Loss of control 1 — 3 — — 5
Disposal 106 232 668 — — 1,007
Effect of foreign currency exchange differences 140 249 21 — — 411
Others — — 8 — — 8
Balance at March 31, 2018 ¥(29,954) ¥(10,136) ¥(11,509) ¥— ¥— ¥(51,599)
Millions of yen
Carrying amountBuildings
and structuresMachinery
and vehicles
Tools, equipment
and fixtures LandConstruction
in progress Total
Balance at April 1, 2016 ¥18,675 ¥1,643 ¥3,466 ¥3,817 ¥134 ¥27,738
Balance at March 31, 2017 18,018 1,683 2,936 3,798 4 26,441
Balance at March 31, 2018 17,343 2,267 2,564 3,757 14 25,947
Notes: 1. Depreciation expense is recorded in “Cost of sales,” “Selling, general and administrative expenses” and “Research and development expense.” 2. Amounts for Property, plant and equipment under construction are presented in the construction in progress account.
(2) Leased Assets
The carrying amounts of leased assets included in property, plant and equipment were as follows.
Millions of yen
End of FY2016as of March 31, 2017
End of FY2017as of March 31, 2018
Machinery and vehicles ¥111 ¥103
Tools, equipment and fixtures 115 146
Total ¥226 ¥249
17

Notes to the Consolidated Financial Statements
(3) Mortgages and Collateral
End of FY2016 as of March 31, 2017: None
End of FY2017 as of March 31, 2018: None
13. Goodwill and Intangible Assets(1) Acquisition Cost, Accumulated Amortization and Accumulated Impairment Loss on Goodwill and Intangible Assets
Millions of yen
Acquisition cost GoodwillDevelopment
assets Software Others Total
Balance at April 1, 2016 ¥1,255 ¥2,469 ¥4,447 ¥199 ¥8,372
Acquisition — — 547 — 547
Increases from internal development — 305 138 — 444
Business combinations 178 — — 344 522
Disposal — (1,059) (231) — (1,291)
Effect of foreign currency exchange differences 20 (154) (29) 40 (122)
Others — — (3) — (3)
Balance at March 31, 2017 1,454 1,560 4,869 584 8,469
Acquisition — — 667 2 669
Increases from internal development — 562 126 — 688
Loss of control — — (19) — (19)
Disposal — — (161) (0) (161)
Effect of foreign currency exchange differences (10) 146 (24) (6) 104
Others — — 13 — 13
Balance at March 31, 2018 ¥1,444 ¥2,268 ¥5,471 ¥580 ¥9,764
Millions of yen
Accumulated amortization and accumulated impairment loss GoodwillDevelopment
assets Software Others Total
Balance at April 1, 2016 ¥(1,255) ¥(1,515) ¥(2,248) ¥(144) ¥(5,162)
Amortization expense — (262) (690) (39) (992)
Disposal — 1,059 224 — 1,284
Effect of foreign currency exchange differences — 97 24 (2) 119
Others — — 3 — 3
Balance at March 31, 2017 (1,255) (620) (2,686) (185) (4,747)
Amortization expense — (320) (751) (81) (1,153)
Loss of control — — 2 — 2
Disposal — — 158 — 158
Effect of foreign currency exchange differences — (58) 30 5 (22)
Others — — (8) — (8)
Balance at March 31, 2018 ¥(1,255) ¥ (999) ¥(3,254) ¥(261) ¥(5,771)
Millions of yen
Carrying amount GoodwillDevelopment
assets Software Others Total
Balance at April 1, 2016 ¥ — ¥ 953 ¥2,199 ¥ 55 ¥3,209
Balance at March 31, 2017 199 940 2,182 398 3,721
Balance at March 31, 2018 188 1,269 2,216 318 3,993
Note: Development asset amortization is included in “Cost of sales,” while amortization of other intangible assets is included in “Cost of sales,” “Selling, general and administrative expenses,” and “Research and development expense.”
(2) Leased Assets
The carrying amounts of leased assets included in intangible assets were as follows:
Millions of yen
End of FY2016as of March 31, 2017
End of FY2017as of March 31, 2018
Software ¥10 ¥7
18

Notes to the Consolidated Financial Statements
14. Investment Property(1) Acquisition Cost, Accumulated Depreciation and Accumulated Impairment Loss on Investment Property
Millions of yen
Acquisition cost Buildings and structures Land Total
Balance at April 1, 2016 ¥9,970 ¥827 ¥10,797
Acquisition — — —
Disposal — — —
Others — — —
Balance at March 31, 2017 9,970 827 10,797
Acquisition — — —
Disposal — — —
Others — — —
Balance at March 31, 2018 ¥9,970 ¥827 ¥10,797
Millions of yen
Accumulated amortization and impairment loss Buildings and structures Land Total
Balance at April 1, 2016 ¥(8,949) ¥(17) ¥(8,966)
Depreciation expense (166) — (166)
Impairment loss — — —
Disposal — — —
Others — — —
Balance at March 31, 2017 (9,115) (17) (9,133)
Depreciation expense (166) — (166)
Impairment loss — (34) (34)
Disposal — — —
Others — — —
Balance at March 31, 2018 ¥(9,282) ¥(51) ¥(9,333)
Millions of yen
Carrying amount Buildings and structures Land Total
Balance at April 1, 2016 ¥1,021 ¥809 ¥1,830
Balance at March 31, 2017 854 809 1,664
Balance at March 31, 2018 688 775 1,463
Note: Depreciation expense is recorded in “Cost of sales.”
(2) Fair Value
Millions of yen
End of FY2016as of March 31, 2017
End of FY2017as of March 31, 2018
Fair value ¥17,799 ¥17,800
Note: The fair value of investment property is calculated by making necessary time adjustments based on valuations by real estate appraisers, which is categorized as level 3 of the fair value hierarchy.
(3) Amounts Recognized as Profit or Loss
Millions of yen
FY2016(From April 1, 2016to March 31, 2017)
FY2017(From April 1, 2017to March 31, 2018)
Rental income ¥2,045 ¥2,045
Operating expenses related to investment property 1,157 1,154
19

Notes to the Consolidated Financial Statements
15. Impairment Loss on Non-financial Assets No material impairment losses and reversal of impairment losses occurred, therefore it is being omitted.
16. Income Tax Expense(1) Deferred Tax Assets and Deferred Tax Liabilities
The balances of and changes in amounts recognized as deferred tax assets and deferred tax liabilities are as follows:
Millions of yen
Beginning of FY2016 as of April 1, 2016
Amounts recognized in profits or loss
Amounts recognized in other comprehensive
incomeAmounts recognized
directly in equity
End of FY2016 as of
March 31, 2017
Deferred tax assets:
Inventories ¥ 1,743 ¥ 40 ¥ — ¥— ¥ 1,784
Accrued expenses 1,059 (119) — — 940
Software 2,574 (377) — — 2,197
Property, plant and equipment 689 2 — — 692
Investment securities 377 0 1 — 378
Postretirement benefits 2,625 124 (510) — 2,239
Loss carried forward 260 1,009 — — 1,269
Research and development expenses 831 66 — — 897
Government grants 407 (27) — — 380
Others 718 117 — — 835
Total deferred tax assets ¥11,288 ¥ 835 ¥(508) ¥— ¥11,615
Deferred tax liabilities:
Property, plant and equipment ¥ 1,124 ¥ (181) ¥ — ¥— ¥ 943
Investment securities 557 57 (28) — 586
Others 1,362 999 — — 2,362
Total deferred tax liabilities ¥ 3,045 ¥ 875 ¥ (28) ¥— ¥ 3,892
Note: Foreign-currency translation differences are presented as amounts recognized in profit or loss.
Millions of yen
Beginning of FY2017 as of April 1, 2017
Amounts recognized in profits or loss
Amounts recognized in other comprehensive
incomeAmounts recognized
directly in equity
End of FY2017 as of
March 31, 2018
Deferred tax assets:
Inventories ¥ 1,784 ¥(142) ¥ — ¥— ¥ 1,642
Accrued expenses 940 (9) — — 930
Software 2,197 (339) — — 1,857
Property, plant and equipment 692 25 — — 717
Investment securities 378 0 (9) — 369
Postretirement benefits 2,239 106 (438) — 1,907
Loss carried forward 1,269 (214) — — 1,054
Research and development expenses 897 453 — — 1,351
Government grants 380 (27) — — 353
Others 835 (89) — — 745
Total deferred tax assets ¥11,615 ¥(238) ¥(447) ¥— ¥10,929
Deferred tax liabilities:
Property, plant and equipment ¥ 943 ¥(264) ¥ — ¥— ¥ 678
Investment securities 586 — 70 — 656
Others 2,362 291 — — 2,653
Total deferred tax liabilities ¥ 3,892 ¥ 26 ¥ 70 ¥— ¥ 3,989
Note: Foreign-currency translation differences are presented as Amounts recognized in profit or loss.
20

Notes to the Consolidated Financial Statements
Details of deferred tax assets and liabilities in the consolidated statement of financial position are as follows:
Millions of yen
End of FY2016as of March 31, 2017
End of FY2017as of March 31, 2018
Deferred tax assets ¥7,979 ¥7,125
Deferred tax liabilities 256 185
Although there are tax loss carry-forwards recognized as deferred tax assets as of the end of the previous fiscal year (March 31,
2017), and the end of the current fiscal year (March 31, 2018), the factors that caused these losses were transient and therefore unlike-
ly to reoccur. Based on forecasts of the future taxable profit derived from the business plan that was approved by the Board of
Directors, it was concluded that a tax benefit was very likely to be realized.
The amounts of future deductible temporary differences, tax loss carry-forwards, and tax credit carry-forwards for which no deferred
tax assets are recognized were as follows:
Millions of yen
End of FY2016as of March 31, 2017
End of FY2017as of March 31, 2018
Future deductible temporary differences ¥10,703 ¥ 8,813
Tax loss carry-forwards 7,948 8,881
Total ¥18,651 ¥17,694
Tax credit carry-forwards ¥ 1,084 ¥ 1,595
Unrecognized deferred tax assets related to the above are 5,266 million yen and 5,027 million yen at the end of the previous fiscal
year (March 31, 2017) and the end of the current fiscal year (March 31, 2018), respectively.
Future deductible temporary differences and tax loss carry-forwards are measured based on a taxable profit basis, while tax credit
carry-forwards are measured based on a tax basis.
The expiration period for tax loss carry-forwards for which no deferred tax assets are recognized is as follows:
Millions of yen
End of FY2016as of March 31, 2017
End of FY2017as of March 31, 2018
First year ¥ 27 ¥ —
Second year 5 —
Third year 21 —
Fourth year 62 —
Fifth and subsequent years 7,831 8,881
Total ¥7,948 ¥8,881
The above tax loss carry-forwards are mainly generated by
foreign subsidiaries.
Although the Anritsu Group applies the consolidated taxation
system in Japan, it is not applicable to regional taxes (inhabitant
tax and business tax); therefore, the above amounts do not
include future deductible temporary differences or tax loss carry-
forwards related to such regional taxes for which no deferred tax
assets are recognized. Future deductible temporary differences
for regional taxes (inhabitant tax and business tax) are 10,975
million yen and 10,262 million yen at the end of the previous fis-
cal year (March 31, 2017) and the end of the current fiscal year
(March 31, 2018), respectively. Tax loss carry-forwards related to
regional taxes are 2,095 million yen for inhabitant tax and 2,115
million yen for business tax as of the end of the previous fiscal
year (March 31, 2017) and 2,126 million yen for inhabitant tax
and 1,811 million yen for business tax as of the end of the cur-
rent fiscal year (March 31, 2018). Unrecognized deferred tax
assets related to these amounts are 1,049 million yen and 969
million yen at the end of the previous fiscal year (March 31,
2017) and the end of the current fiscal year (March 31, 2018),
respectively.
The expiration period for the loss carry-forwards related to
inhabitant tax and business tax is 10 years.
21

Notes to the Consolidated Financial Statements
(2) Income Tax Expense
Detailed information on Income Tax Expense is as follows:
Millions of yen
FY2016(From April 1, 2016to March 31, 2017)
FY2017(From April 1, 2017to March 31, 2018)
Current tax expense
Current fiscal year ¥924 ¥1,492
Adjustment for prior years (4) (62)
Total current tax expense 920 1,429
Deferred tax expense
Origination and reversal of temporary differences 86 (454)
Change in tax rates — 301
Recognition of previously unrecognized tax loss carry-forwards and temporary differences (113) 427
Total deferred tax expenses (26) 273
Total ¥893 ¥1,703
Reconciliations of the actual and applicable tax rates are as follows:
%
FY2016(From April 1, 2016to March 31, 2017)
FY2017(From April 1, 2017to March 31, 2018)
Applicable tax rate 30.8% 30.8%
Non-deductible expenses 1.2 1.4
Effect of the different tax rates at foreign subsidiaries (3.9) (4.0)
Effect of unrecognized tax loss carry-forwards or temporary differences 1.0 13.0
Effect of change in tax rates — 6.4
Tax credit (8.8) (11.6)
Uncertain tax position on income taxes for U.S. subsidiaries 3.0 1.2
Other 1.3 (0.2)
Actual tax rate 24.6% 37.0%
The Company is mainly subject to income tax, inhabitant tax and business tax. The applicable tax rates based on such were 30.8% in
both FY2016 and FY2017. Foreign subsidiaries, however, are subject to income taxes where they are located.
(3) Adjustment of Amount of Deferred Tax Assets and Deferred Tax Liabilities due to Change in Corporate Income Tax
The 2017 U.S. tax reform bill was signed into law on December 22, 2017 and a federal corporate income tax rate cut became effec-
tive from January 1, 2018. Due to the change in income tax rate, deferred tax assets (after deduction of tax deferred tax liabilities) was
reduced by 283 million yen, income tax deferred was increased by 296 million yen, and profit for FY2017 was decreased by 296 million
yen.
22

Notes to the Consolidated Financial Statements
17. Trade and Other Payables Details of trade and other payables are as follows:
Millions of yen
End of FY2016as of March 31, 2017
End of FY2017as of March 31, 2018
Accounts payable - trade ¥4,557 ¥4,830
Accounts payable - other 1,843 2,189
Accrued expenses 231 175
Others 893 1,304
Total ¥7,525 ¥8,499
Current liabilities ¥7,060 ¥7,998
Non-current liabilities 465 500
Total ¥7,525 ¥8,499
18. Bonds and Borrowings(1) Details of bonds and borrowings are as follows:
Current liabilities
Millions of yen
End of FY2016as of March 31, 2017
End of FY2017as of March 31, 2018
Short-term borrowings ¥1,570 ¥1,470
Long-term borrowings to be repaid within one year — 2,997
Bonds to be repaid within one year 5,995 —
Total ¥7,565 ¥4,467
Note: All of the above are financial liabilities measured at amortized cost.
Non-current liabilities
Millions of yen
End of FY2016as of March 31, 2017
End of FY2017as of March 31, 2018
Long-term borrowings ¥ 6,493 ¥ 3,500
Bonds 7,967 7,977
Total ¥14,460 ¥11,477
Note: All of the above are financial liabilities measured at amortized cost.
(2) The contracted terms and repayment schedule are as follows:
Millions of yen
Repayment deadline (average interest rates)
End of FY2016as of March 31, 2017
End of FY2017as of March 31, 2018
Short-term borrowings — (0.4% annually) ¥ 1,570 ¥ 1,470
Long-term borrowings to be repaid within one year 2018(0.3% annually) — 2,997
Long-term borrowings 2019 (0.5% annually) 6,493 3,500
Fifth unsecured bonds —(—) 5,995 —
Sixth unsecured bonds June 19, 2020(0.447% annually) 7,967 7,977
Total — ¥22,026 ¥15,944
Note: Maturity dates and average interest rates are as of the fiscal year ended March 31, 2018.
23
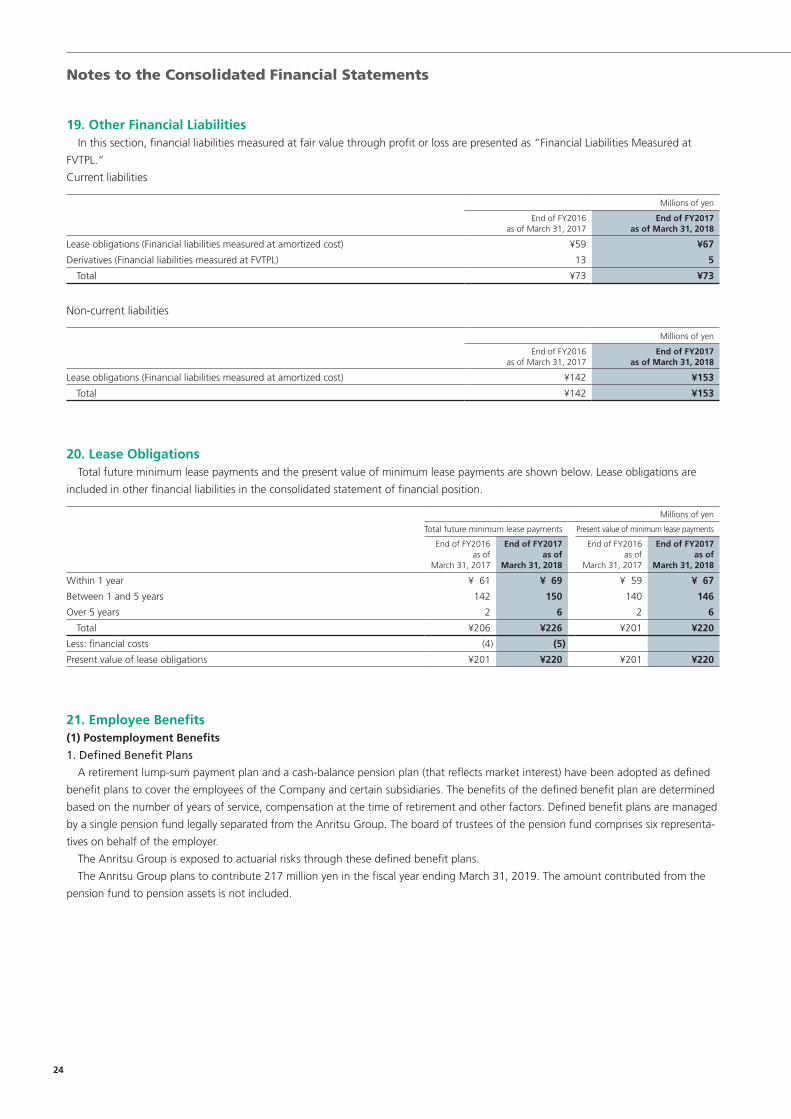
Notes to the Consolidated Financial Statements
19. Other Financial Liabilities In this section, financial liabilities measured at fair value through profit or loss are presented as “Financial Liabilities Measured at
FVTPL.”
Current liabilities
Millions of yen
End of FY2016as of March 31, 2017
End of FY2017as of March 31, 2018
Lease obligations (Financial liabilities measured at amortized cost) ¥59 ¥67
Derivatives (Financial liabilities measured at FVTPL) 13 5
Total ¥73 ¥73
Non-current liabilities
Millions of yen
End of FY2016as of March 31, 2017
End of FY2017as of March 31, 2018
Lease obligations (Financial liabilities measured at amortized cost) ¥142 ¥153
Total ¥142 ¥153
20. Lease Obligations Total future minimum lease payments and the present value of minimum lease payments are shown below. Lease obligations are
included in other financial liabilities in the consolidated statement of financial position.
Millions of yen
Total future minimum lease payments Present value of minimum lease payments
End of FY2016as of
March 31, 2017
End of FY2017as of
March 31, 2018
End of FY2016as of
March 31, 2017
End of FY2017as of
March 31, 2018
Within 1 year ¥ 61 ¥ 69 ¥ 59 ¥ 67
Between 1 and 5 years 142 150 140 146
Over 5 years 2 6 2 6
Total ¥206 ¥226 ¥201 ¥220
Less: financial costs (4) (5)
Present value of lease obligations ¥201 ¥220 ¥201 ¥220
21. Employee Benefits(1) Postemployment Benefits
1. Defined Benefit Plans
A retirement lump-sum payment plan and a cash-balance pension plan (that reflects market interest) have been adopted as defined
benefit plans to cover the employees of the Company and certain subsidiaries. The benefits of the defined benefit plan are determined
based on the number of years of service, compensation at the time of retirement and other factors. Defined benefit plans are managed
by a single pension fund legally separated from the Anritsu Group. The board of trustees of the pension fund comprises six representa-
tives on behalf of the employer.
The Anritsu Group is exposed to actuarial risks through these defined benefit plans.
The Anritsu Group plans to contribute 217 million yen in the fiscal year ending March 31, 2019. The amount contributed from the
pension fund to pension assets is not included.
24
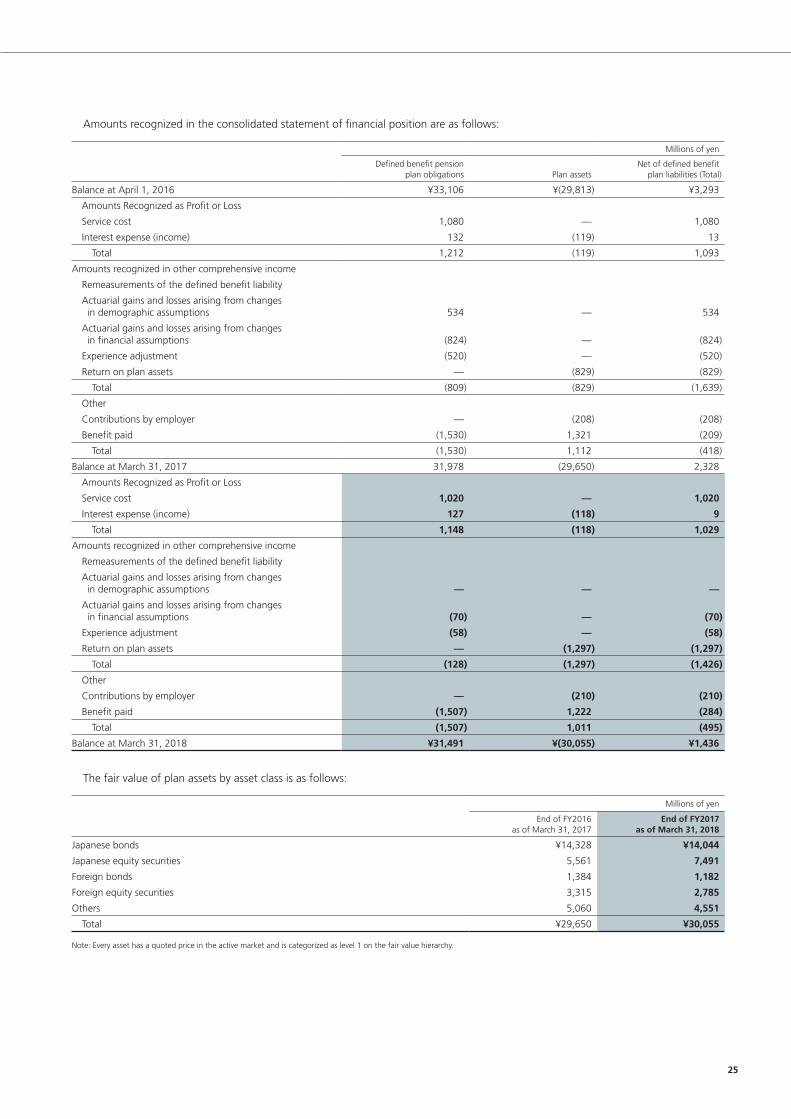
Notes to the Consolidated Financial Statements
Amounts recognized in the consolidated statement of financial position are as follows:
Millions of yen
Defined benefit pension plan obligations Plan assets
Net of defined benefit plan liabilities (Total)
Balance at April 1, 2016 ¥33,106 ¥(29,813) ¥3,293
Amounts Recognized as Profit or Loss
Service cost 1,080 — 1,080
Interest expense (income) 132 (119) 13
Total 1,212 (119) 1,093
Amounts recognized in other comprehensive income
Remeasurements of the defined benefit liability
Actuarial gains and losses arising from changes in demographic assumptions 534 — 534
Actuarial gains and losses arising from changes in financial assumptions (824) — (824)
Experience adjustment (520) — (520)
Return on plan assets — (829) (829)
Total (809) (829) (1,639)
Other
Contributions by employer — (208) (208)
Benefit paid (1,530) 1,321 (209)
Total (1,530) 1,112 (418)
Balance at March 31, 2017 31,978 (29,650) 2,328
Amounts Recognized as Profit or Loss
Service cost 1,020 — 1,020
Interest expense (income) 127 (118) 9
Total 1,148 (118) 1,029
Amounts recognized in other comprehensive income
Remeasurements of the defined benefit liability
Actuarial gains and losses arising from changes in demographic assumptions — — —
Actuarial gains and losses arising from changes in financial assumptions (70) — (70)
Experience adjustment (58) — (58)
Return on plan assets — (1,297) (1,297)
Total (128) (1,297) (1,426)
Other
Contributions by employer — (210) (210)
Benefit paid (1,507) 1,222 (284)
Total (1,507) 1,011 (495)
Balance at March 31, 2018 ¥31,491 ¥(30,055) ¥1,436
The fair value of plan assets by asset class is as follows:
Millions of yen
End of FY2016as of March 31, 2017
End of FY2017as of March 31, 2018
Japanese bonds ¥14,328 ¥14,044
Japanese equity securities 5,561 7,491
Foreign bonds 1,384 1,182
Foreign equity securities 3,315 2,785
Others 5,060 4,551
Total ¥29,650 ¥30,055
Note: Every asset has a quoted price in the active market and is categorized as level 1 on the fair value hierarchy.
25

Notes to the Consolidated Financial Statements
The principal actuarial assumptions are as follows:
%
End of FY2016as of March 31, 2017
End of FY2017as of March 31, 2018
Financial assumptions
Discount rate 0.4% 0.4%
The weighted average durations of the defined benefit pension plan obligations are 12.7 years and 12.3 years at the previous fiscal
year-end and the current fiscal year-end, respectively.
The sensitivity analysis against the Anritsu Group’s material actuarial assumptions is shown below. This analysis, based on an assump-
tion that all other variables as of the reporting period-end are constant, indicates the impact on the defined benefit pension plan obli-
gations in case of a 0.2% appreciation or depreciation of each assumption.
Millions of yen
End of FY2017as of March 31, 2018
0.2% increase 0.2% decrease
Financial assumptions
Discount rate ¥(761) ¥792
Note: Although the analysis does not take account of the full distribution of cash flows expected under the pension plans, it does provide an approximation of the sensitivity of the assumptions shown.
2. Defined Contribution Plans
The amount of expense on defined contribution plans recognized as profit or loss are as follows:
Millions of yen
FY2016(From April 1, 2016to March 31, 2017)
FY2017(From April 1, 2017to March 31, 2018)
Amount of expenses ¥646 ¥557
Note: The amount of expense on defined contribution plans recognized as profit or loss are recorded in “Cost of sales,” “Selling, general and administrative expenses” and “Research and development expense.”
(2) Other Employee Benefits
Short-term employee benefits and long-term employee benefits (other than ones related to defined benefit plans) presented in the
consolidated statement of financial position are as follows:
Millions of yen
End of FY2016as of March 31, 2017
End of FY2017as of March 31, 2018
Employee benefits (current liabilities) ¥5,427 ¥5,254
Employee benefits (non-current liabilities) 860 810
26

Notes to the Consolidated Financial Statements
22. Provisions Details of and changes in provisions are as follows:
Millions of yen
Provision for decommissioning, restoration
and rehabilitation costsProvision for
product warranties Total
Balance at April 1, 2017 ¥108 ¥271 ¥379
Increase during the year 1 160 162
Decrease due to intended use (2) (105) (107)
Increase due to passage of time 1 — 1
Exchange differences on translation (0) (3) (3)
Balance at March 31, 2018 ¥108 ¥323 ¥431
Details in the consolidated statement of financial position are as follows:
Millions of yen
End of FY2016as of March 31, 2017
End of FY2017as of March 31, 2018
Current liabilities ¥273 ¥323
Provision for decommissioning, restoration and rehabilitation costs 1 —
Provision for product warranties 271 323
Non-current liabilities 106 108
Provision for decommissioning, restoration and rehabilitation costs 106 108
Total ¥379 ¥431
23. Government Grants Details of government grants are as follows:
Millions of yen
End of FY2016as of March 31, 2017
End of FY2017as of March 31, 2018
Government grants for Koriyama 2nd Business Office (Note 1)
Other liabilities – Current ¥ 79 ¥ 79
Other liabilities – Non-current 1,056 977
Total 1,136 1,056
Other government grants
Other liabilities – Current 8 8
Other liabilities – Non-current 99 90
Total ¥ 107 ¥ 99
Notes: 1. The government grants for Koriyama 2nd Business Office are the grants on condition that a plant is to be acquired or established in a specified region. The recognized grants have been amortized over the useful life of each subject asset for which the grants are provided (not exceeding 38 years). Under the terms and conditions of the grants, the Anritsu Group is prohibited from disposing of the subject assets for which the grants are provided during the period scheduled in the Appended Table of the “Ministerial Ordinance Concerning the Useful Life of Depreciable Assets.”
2. Government grants are recorded in “Other liabilities - Current” and “Other liabilities - Non-current” in the consolidated statement of financial position.
27

Notes to the Consolidated Financial Statements
24. Total Equity and Other Capital Items(1) Number of Issued Shares and Treasury Stock
Balance at March 31, 2017 Balance at March 31, 2018
The classification of shares Ordinary shares with no par-value
Ordinary shares with no par-value
Number of authorized shares 400,000,000 400,000,000
Number of issued shares
Balance at beginning of fiscal year 138,115,294 138,115,294
Increase due to exercise of stock option — 19,500
Balance at end of fiscal year 138,115,294 138,134,794
Treasury stock
Balance at beginning of fiscal year 838,609 806,552
Purchase of treasury stock (Note 1) 343 597
Distribution of treasury stock (Note 2) (32,400) (29,490)
Balance at end of fiscal year 806,552 777,659
Notes: 1. The increase in the treasure stock purchased in the current and previous fiscal years is due to purchase of shares less than one unit. 2. Out of the treasury stock distributed in the current fiscal year, 29,400 shares are the purchase in the trust account concerning Trust for Distribution of Shares to Executive Officers in
accordance with the Performance-Related Stock Compensation Program. The remaining 90 shares are the increase due to purchase of shares less than one unit.
(2) Additional Paid-in Capital
The main components of additional paid-in capital are as
follows:
1. Capital Surplus
Japan’s Company Law requires at least a half of contributions
for the issuance of shares be classified as common stock, with
the remaining portion to be classified common stock as capital
surplus.
2. Equity Elements of Compound Financial Instruments
These are amounts classified as capital elements upon
issuance and redemption of bonds with subscription rights
to shares.
(3) Retained Earnings
Retained earnings comprise the following categories.
1. Legal Earnings Reserve
The Company Law provides that a 10% dividend of retained
earnings shall be appropriated as additional paid-in capital or
legal reserve until an aggregate amount of additional paid-in
capital and legal reserve equals 25% of common stock.
2. Cumulative Translation Differences at Transition Date
The cumulative translation differences of foreign operations at
the date of transition to IFRS are deemed zero as a result of the
exemption under the first-time adoption of IFRS.
3. Remeasurement of Defined Benefit Plans
Remeasurements of the defined benefit plans comprise actu-
arial gains (losses), the return on plan assets excluding the net
interest on the net defined benefit liabilities and any changes in
the effect of the asset ceiling. Actuarial gains (losses) are adjust-
ments resulting from the effects of changes in actuarial assump-
tions and experience adjustments (the effects of differences
between the previous actuarial assumptions and what has actu-
ally occurred). The return on plan assets refers to the income
derived from the plan assets, while changes in the effect of the
asset ceiling refer to the adjustments from changes in the pres-
ent value of the future economic benefit available to the entity
in the form of a refund from the plan or a reduction in future
contributions to the plan in the event of overfunding where the
fair value of the plan assets exceeds the present value of defined
benefit liabilities. The return on plan assets and changes in the
effect of the asset ceiling are recognized in a remeasurement of
the defined benefit plans after excluding amounts included in
net interest on the defined benefit liability, which is determined
based on the discount rate used to calculate the present value of
the defined benefit obligation and is recognized through profit
or loss.
In accordance with IAS 19 “Employee Benefits,” the Anritsu
Group recognizes all actuarial gains and losses in other compre-
hensive income in the period in which they are incurred and
immediately reclassifies them to retained earnings.
4. Other Retained Earnings
These include the general reserve and retained earnings
brought forward. These accounts represent the Anritsu Group’s
cumulative earnings.
28

Notes to the Consolidated Financial Statements
(4) Other Components of Equity
The details of other components of equity are as follows:
1. Translation Differences for Foreign Operations
These are translation differences arising from the translation of the financial statements of foreign operations.
The balances of translation differences for foreign operations at the beginning and end of previous and current periods are as
follows:
Millions of yen
End of FY2016as of March 31, 2017
End of FY2017as of March 31, 2018
Balance at beginning of fiscal year ¥5,606 ¥4,953
Balance at end of the fiscal year 4,953 4,739
2. Changes in Financial Assets Measured at Fair Value through Other Comprehensive Income
These are the differences between the acquisition costs and fair values of financial assets measured at FVTOCI, which are generated
until the relevant financial assets are derecognized.
The balances of changes in financial assets measured at fair value through other comprehensive income at the beginning and end of
previous and current periods are as follows:
Millions of yen
End of FY2016as of March 31, 2017
End of FY2017as of March 31, 2018
Balance at beginning of fiscal year ¥779 ¥ 841
Balance at end of the fiscal year 841 1,022
25. Dividends• Year ended March 31, 2017
(1) Amount of dividend paid
Millions of yen Yen
Resolution Classes of shares Total dividends Dividends per share Record date Effective date
June 28, 2016 Ordinary general meeting of shareholders Ordinary shares ¥1,649 ¥12.00 March 31, 2016 June 29, 2016
October 27, 2016 Board of Directors meeting Ordinary shares 1,031 7.50 September 30, 2016 December 2, 2016
Notes: Dividends approved at the ordinary general meeting of shareholders held on June 28, 2016 included dividends of 2 million yen paid to the treasury stock held by the trust account for distribution of shares to officers. Dividends approved at the Board of Directors meeting held on October 27, 2016 included dividends of 1 million yen paid to the treasury stock held by the trust account for distribution of shares to officers.
(2) Amount of dividends in which the record date belongs to the fiscal year ended March 31, 2017, whereas its effective date belongs
to the following fiscal year
Millions of yen Sources of dividends
Yen
Resolution Classes of shares Total dividends Dividends per share Record date Effective date
June 28, 2017 Ordinary general meeting of shareholders Ordinary shares ¥1,031
Retained earnings ¥7.50 March 31, 2017 June 29, 2017
Note: Dividends approved at the ordinary general meeting of shareholders held on June 28, 2017 included dividends of 1 million yen paid to the treasury stock held by the trust account for distribution of shares to officers.
29

Notes to the Consolidated Financial Statements
• Year ended March 31, 2018
(1) Amount of dividend paid
Millions of yen Yen
Resolution Classes of shares Total dividends Dividends per share Record date Effective date
June 28, 2017 Ordinary general meeting of shareholders Ordinary shares ¥1,031 ¥7.50 March 31, 2017 June 29, 2017
October 30, 2017 Board of Directors meeting Ordinary shares 1,031 7.50 September 30, 2017 December 4, 2017
Notes: Dividends approved at the ordinary general meeting of shareholders held on June 28, 2017 included dividends of 1 million yen paid to the treasury stock held by the trust account for distribution of shares to officers. Dividends approved at the Board of Directors meeting held on October 30, 2017 included dividends of 0 million yen paid to the treasury stock held by the trust account for distribution of shares to officers.
(2) Amount of dividends in which the record date belongs to the fiscal year ended March 31, 2018, whereas its effective date belongs
to the following fiscal year
Millions of yen Sources of dividends
Yen
Resolution Classes of shares Total dividends Dividends per share Record date Effective date
June 26, 2018 Ordinary general meeting of shareholders Ordinary shares ¥1,031
Retained earnings ¥7.50 March 31, 2018 June 27, 2018
Note: Dividends approved at the ordinary general meeting of shareholders held on June 26, 2018 included dividends of 0 million yen paid to the treasury stock held by the trust account for distribution of shares to officers.
26. Revenue Details of revenue are as follows:
Millions of yen
FY2016(From April 1, 2016to March 31, 2017)
FY2017(From April 1, 2017to March 31, 2018)
Revenue from products ¥70,529 ¥68,573
Revenue from services 17,108 17,393
Total ¥87,638 ¥85,967
27. Selling, General and Administrative Expenses Details of selling, general and administrative expenses are as follows:
Millions of yen
FY2016(From April 1, 2016to March 31, 2017)
FY2017(From April 1, 2017to March 31, 2018)
Personnel expenses ¥17,701 ¥17,423
Travel and transportation expenses 1,676 1,599
Advertising expenses 1,218 1,211
Depreciation and amortization expenses 1,262 1,276
Others 5,340 5,053
Total ¥27,198 ¥26,563
30

Notes to the Consolidated Financial Statements
28. Research and Development Expense Details of research and development expense are as follows:
Millions of yen
FY2016(From April 1, 2016to March 31, 2017)
FY2017(From April 1, 2017to March 31, 2018)
Material expenses ¥ 2,379 ¥ 2,389
Personnel expenses 7,365 6,786
Others 1,161 980
Total ¥10,906 ¥10,156
29. Personnel Expenses Details of personnel expenses are as follows:
Millions of yen
FY2016(From April 1, 2016to March 31, 2017)
FY2017(From April 1, 2017to March 31, 2018)
Wages and salaries ¥30,203 ¥30,350
Welfare expenses 6,372 6,366
Retirement benefit expense 1,740 1,587
Others 1,488 1,490
Total ¥39,804 ¥39,794
Note: Personnel expenses are recorded in “Cost of sales,” “Selling, general and administrative expenses,” and “Research and development expense.”
30. Other Income and Other Expenses Details of other income are omitted.
Details of other expenses are as follows:
Millions of yen
FY2016(From April 1, 2016to March 31, 2017)
FY2017(From April 1, 2017to March 31, 2018)
Business structure improvement expenses ¥237 ¥366
Loss on disposal or sale of property, plant and equipment 18 9
Others 79 159
Total ¥336 ¥535
31. Finance Income and Costs Details of finance income are shown below.
In this section, financial assets measured at fair value through other comprehensive income are referred to as “Financial Assets
Measured at FVTOCI.”
Millions of yen
FY2016(From April 1, 2016to March 31, 2017)
FY2017(From April 1, 2017to March 31, 2018)
Interest income:
Financial assets measured at amortized cost ¥136 ¥180
Dividends income:
Financial assets measured at FVTOCI 52 58
Other 4 93
Total ¥193 ¥332
31

Notes to the Consolidated Financial Statements
Details of finance costs are as follows:
Millions of yen
FY2016(From April 1, 2016to March 31, 2017)
FY2017(From April 1, 2017to March 31, 2018)
Interest expenses:
Financial liabilities measured at amortized cost ¥158 ¥128
Foreign exchange losses 413 403
Other 226 109
Total ¥798 ¥642
32. Other Comprehensive Income The components of other comprehensive income in the previous fiscal year and the current fiscal year are shown below.
In this section, financial assets measured at fair value through other comprehensive income are referred to as “Financial Assets
Measured at FVTOCI.”
Millions of yen
FY2016(From April 1, 2016to March 31, 2017)
FY2017(From April 1, 2017to March 31, 2018)
Items that will not be reclassified to profit or loss
Changes in financial assets measured at FVTOCI
Increase during the fiscal year ¥ 63 ¥ 181
Total changes in financial assets measured at FVTOCI 63 181
Remeasurements of defined benefit plans
Increase during the fiscal year 1,129 988
Total remeasurements of defined benefit plans 1,129 988
Total 1,192 1,169
Items that may be reclassified subsequently to profit or loss
Exchange differences on translation
Increase during the fiscal year (653) (213)
Total exchange differences on translation (653) (213)
Total (653) (213)
Total other comprehensive income ¥ 539 ¥ 955
Corporate income taxes relating to each component of other comprehensive income are as follows:
Millions of yen
FY2016(From April 1, 2016to March 31, 2017)
FY2017(From April 1, 2017to March 31, 2018)
Before taxesIncome tax
expense After taxes Before taxesIncome tax
expense After taxes
Items that will not be reclassified to profit or loss
Changes in financial assets measured at FVTOCI ¥ 90 ¥ (27) ¥ 63 ¥ 261 ¥ (79) ¥ 181
Remeasurements of defined benefit plans 1,639 (510) 1,129 1,426 (438) 988
Total 1,730 (538) 1,192 1,687 (517) 1,169
Items that may be reclassified subsequently to profit or loss
Exchange differences on transactions (653) — (653) (213) — (213)
Total (653) — (653) (213) — (213)
Total other comprehensive income ¥1,077 ¥(538) ¥ 539 ¥1,473 ¥(517) ¥ 955
32

Notes to the Consolidated Financial Statements
33. Earnings Per Share (attributable to owners of parent)
Millions of yen
FY2016(From April 1, 2016to March 31, 2017)
FY2017(From April 1, 2017to March 31, 2018)
Profit attributable to owners of parent ¥2,698 ¥2,880
Profit used in calculation of diluted earnings per share 2,698 2,880
Shares
Weighted average number of issued and outstanding shares 137,301,414 137,335,071
Increase in number of shares used in the calculation of diluted earnings per share
Increase due to stock options — 11,893
Weighted average number of issued and outstanding shares used in the calculation of diluted earnings per share 137,301,414 137,346,964
Yen
Basic earnings per share ¥19.65 ¥20.97
Diluted earnings per share 19.65 20.97
34. Cash Flow Information(1) Changes in Liabilities related to Financial Activities
Details of changes in liabilities related to financial activities are as follows:
Millions of yen
Changes come without Cash Flow
Year ended March 31, 2018 (From April 1, 2017 to March 31, 2018) April 1, 2017
Changes come with Cash Flow
Changes in Fair Value Others March 31, 2018
Short-term borrowings ¥ 1,570 ¥ (100) ¥— ¥— ¥ 1,470
Long-term borrowings 6,493 — 4 — 6,497
Bonds 13,963 (6,000) 14 — 7,977
Lease obligations 201 (59) — 78 220
Total ¥22,228 ¥(6,159) ¥18 ¥78 ¥16,165
(2) Non-cash Transactions
Details of non-cash transactions are as follows:
Millions of yen
FY2016(From April 1, 2016to March 31, 2017)
FY2017(From April 1, 2017to March 31, 2018)
Acquisition of assets through finance leases ¥127 ¥80
Total ¥127 ¥80
35. Share-based Payment The Anritsu Group has a stock option plan and a Performance-
Related Stock Compensation Program. The objectives of these
plans are to motivate the directors and employees of the
Company and its subsidiaries to improve business performances,
encourage management in keeping with the interests of share-
holders and stock prices and boost the Anritsu Group’s corporate
value.
(1) Details of the Stock Option Plan (Equity-settled,
Share-based Payment)
Under this plan, blocks of 100 ordinary shares (blocks of 1,000
shares for fiscal year ended March 31, 2013 or before) with sub-
scription warrants are granted at no charge to recipients as of
the grant date. The exercise price of these warrants is 1.05 mul-
tiplied by the average closing price (with fractions of less than
one yen rounded up) in regular trading of the Company’s ordi-
33

Notes to the Consolidated Financial Statements
nary shares on the Tokyo Stock Exchange on each day (excluding
days on which there are no transactions) of the month prior to
the allotment date of the subscription warrants. If, however, the
amount is less than the closing price (or if there are no trades,
the immediately preceding closing price) of regular trading of
the Company’s ordinary shares on the subscription warrant allot-
ment date, the exercise price shall be the relevant closing price.
The exercise period is determined in the allocation agreement.
The relevant options expire if not exercised during that period.
Grant recipients must be directors or employees of the Company
or its subsidiaries, including when exercising the options.
Recipients losing status by resigning or retiring during the
options’ exercise period may exercise the options for up to one
year after such loss of status. Recipients of No. 10 and No. 11
stock options granted on August 20, 2012, losing their positions
by resigning or retiring by August 20, 2015, may exercise the
options for up to one year from August 21, 2015. Recipients of
No. 12 and No. 13 stock options granted on August 21, 2013,
losing their positions by resigning or retiring by August 21,
2016, may exercise the options for up to one year from August
22, 2016. Recipients of No. 14 and No. 15 stock options granted
on September 1, 2014, losing their positions by resigning or
retiring by August 31, 2017, may exercise the options for up to
one year from September 1, 2017.
The Anritsu Group’s stock option plans for the current fiscal years are as follows:
Yen
Number of shares granted Grant date Exercise period Exercise price
No. 10 41,000 August 20, 2012 August 21, 2015 through August 20, 2017 ¥1,002
No. 11 110,000 August 20, 2012 August 21, 2015 through August 20, 2017 1,002
No. 12 42,000 August 21, 2013 August 22, 2016 through August 21, 2022 1,295
No. 13 190,000 August 21, 2013 August 22, 2016 through August 21, 2022 1,295
No. 14 42,000 September 1, 2014 September 1, 2017 through August 31, 2023 956
No. 15 85,500 September 1, 2014 September 1, 2017 through August 31, 2023 956
Total Number of Exercisable Shares and Average Exercise Price for the previous and current fiscal years are as follows:
Yen Yen
Number of sharesWeighted average
exercise price Number of sharesWeighted average
exercise price
FY2016(From April 1, 2016 to March 31, 2017)
FY2017(From April 1, 2017 to March 31, 2018)
Outstanding balance at beginning of fiscal year 680,500 ¥1,069 490,500 ¥1,128
Granted during year — — — —
Cancelled during year 20,000 1,002 31,000 1,295
Exercised during year — — 19,500 993
Matured and expired during year 170,000 908 130,000 1,002
Outstanding balance at end of fiscal year 490,500 1,128 310,000 1,173
Options exercisable at end of year 363,000 1,189 310,000 1,173
The exercise prices of stock options unexercised at the end of
the previous fiscal year ranged from 1,002 yen to 1,295 yen. The
weighted average remaining contractual period was 4.3 years.
There were no stock options exercised during the previous fiscal
year.
The exercise prices of stock options unexercised at the end of
the current fiscal year ranged from 956 yen to 1,295 yen. The
weighted average remaining contractual period was 4.8 years.
The weighted average share price as of the exercise dates for
stock options exercised during the current fiscal year was 1,290
yen.
The Company adopts the Black-Scholes model to assess the
fair value of stock options. The assumptions used to measure fair
value are shown below. The projected volatility is calculated by
collecting daily share price information based on the most recent
period corresponding to the expected length of time since the
grant date.
Yen
No. 10 and No. 11 No. 12 and No. 13 No. 14 and No. 15
Fair value at the grant date ¥ 292 ¥ 352 ¥ 199
Share price at the grant date 968 1,260 885
Exercise price 1,002 1,295 956
Projected volatility (%) 45.80 39.10 36.40
Expected remaining period (years) 3.9 4.8 4.8
Dividend yield (%) 1.55 1.59 2.26
Risk-free rate (%) 0.15 0.26 0.15
34

Notes to the Consolidated Financial Statements
(2) Details of Performance-Related Stock Compensation
Program (Equity-settled, Share-based Payment)
This is a performance-related stock compensation program to
distribute a certain number of the Company’s shares acquired
through a trust established based on underlying funds contribut-
ed by the Company to Directors, Vice Presidents and Executive
Officers of the Company through the trust from FY2015 to
FY2018. The number of the Company’s shares to be distributed
is based on the number of evaluation points granted in accor-
dance with the “Rules on Distribution of Shares to Officers”
established by the Board of Directors of the Company.
The evaluation points are granted in May every year (only for
the initial year, they are granted in July 2015) and the number
of evaluation points granted is calculated by dividing (a) the
amount obtained by multiplying (i) the base amount for
distribution by title granted in accordance with the “Rules on
Distribution of Shares to Officers” instituted by the Board of
Directors of the Company by (ii) a factor representing the degree
of contribution to the Company’s performance, consisting of the
degree of attainment of numeral targets regarding the manage-
ment indicator set by the Company and another degree of
attainment of managerial goals including non-financial aspects,
set in advance, by (b) the Base Stock Price.
Each Director, Vice President or Executive Officer who satisfies
the beneficiary requirements receives from the Trust a certain
number of Company Shares corresponding to the determined
evaluation points granted in May, in accordance with a pre-
scribed procedure for determination of beneficiary in June of the
year in which the evaluation points are granted (only for the ini-
tial year, such procedure is carried out in August 2015). There is
no exercise price since the program is to distribute the
Company’s shares.
In order to satisfy the beneficiary requirements under the
Program, the beneficiary must be a Director, Executive Officer or
Vice President of the Company and must not fall under either of
the conditions below.
1. Persons who have voluntarily resigned from the position of
Director, Executive Officer or Vice President of the Company
prior to the date on which his/her right to receive shares
was vested.
2. Persons who have been dismissed or who have resigned
from the position of Director, Executive Officer or Vice
President of the Company prior to the date on which his/
her right to receive shares was vested as a result of having
caused damage to the Company.
The Company accounts for the share-based payments under
the program as equity-settled, share-based payments and an
expense is recognized over the vesting period. The amount rec-
ognized in expenses is measured by reference to the fair value of
the equity instruments granted and the amounts recognized as
expenses for the Performance-Related Stock Compensation
Program is 26 million yen in the previous fiscal year (From April
1, 2016 to March 31, 2017), and 37 million yen in the current
fiscal year (From April 1, 2017 to March 31, 2018). (Of the
amounts recognized as expenses, 4 million yen is associated with
the shares distributed in the previous fiscal year and the remain-
ing 21 million yen is associated with the shares to be distributed
in the fiscal year ending March 31, 2018. Of the amounts recog-
nized as expenses, 6 million yen is associated with the shares dis-
tributed in the current fiscal year and the remaining 30 million
yen is associated with the shares to be distributed in the fiscal
year ending March 31, 2019.)
An outline of the Company Shares distributed to the Directors, Executive Officers and Vice Presidents of the Company is as follows:
FY2016(From April 1, 2016to March 31, 2017)
FY2017(From April 1, 2017to March 31, 2018)
Number of shares granted 32,400 29,400
Grant date May 20, 2016 May 19, 2017
Fair value at the grant date (Yen) ¥596 ¥962
Fair value is measured on the basis of observable market prices. Expected dividends are not taken into account due to the proximity
of the grant date to the exercise date.
Changes in the number of Evaluation Points that form the basis for the distribution of the Company Shares are as follows:
FY2016(From April 1, 2016to March 31, 2017)
FY2017(From April 1, 2017to March 31, 2018)
Balance at beginning of fiscal year — —
Granted during year 32,400 29,400
Exercised during year (32,400) (29,400)
Cancelled during year — —
Balance at end of fiscal year — —
35

Notes to the Consolidated Financial Statements
36. Financial Instruments In this section, financial assets measured at fair value through
profit or loss are referred to as “Financial Assets measured at
FVTPL,” financial assets measured at fair value through other
comprehensive income are referred to as “Financial Assets
Measured at FVTOCI,” and financial liabilities measured at fair
value through profit or loss are referred to as “Financial Liabilities
measured at FVTPL.”
(1) Capital Management
The Anritsu Group aims to maximize corporate value and
prioritizes cash flows in management using the proprietary
“ACE (see note)” metric to assess the results of each business
by evaluating the added value generated by capital invested.
The Anritsu Group prioritizes the following capital manage-
ment benchmarks.
• ACE improvements (see note) (Achievement of net operating
profit after tax less an adjustment for the cost of capital)
• Asset turnover improvements
• Cash management system to reduce interest-bearing debt
• Debt-to-equity ratio (see note) improvements
• Enhancing shareholders’ equity and the dividends on equity
(DOE)
Note: ACE (Anritsu Capital-cost Evaluation): Net operating profit after tax – Cost of capital (5%) Debt-to-equity ratio: Interest-bearing debt / Shareholders’ equity
The Anritsu Group is not subject to significant externally
imposed capital regulations.
(2) Market Risks
The Anritsu Group’s activities are exposed to market risks
stemming from fluctuations in the economic and financial envi-
ronments. These risks relate specifically to interest rates, foreign
currency exchange and changes in the prices of equity instru-
ments.
1. Interest Rate Risk
Some borrowings are subject to floating interest rates and
therefore exposed to interest rate fluctuation risks. The Anritsu
Group uses derivatives (interest rate swaps) as hedges to fix the
rate of interest and thereby manage risks.
• Sensitivity Analysis for Borrowings subject to Floating Rate
The Anritsu Group’s sensitivity analysis to interest rate expo-
sure is shown below. This analysis assumes that all other vari-
ables are constant and presents the impact on profit (loss) before
tax in the consolidated statement of profit or loss and other
comprehensive income in case of a 1% increase or decrease in
interest rates. The analysis below shows sensitivity with respect
to the outstanding balance of borrowings subject to the floating
rate after excluding portions for which interest rates are substan-
tially fixed as a result of interest rate swaps.
Millions of yen
End of FY2016 as of March 31, 2017 1% increase 1% decrease
Profit (loss) before tax ¥(45) ¥45
Millions of yen
End of FY2017 as of March 31, 2018 1% increase 1% decrease
Profit (loss) before tax ¥(44) ¥44
2. Foreign Currency Exchange Risk
The Anritsu Group operates globally and is therefore exposed
to foreign currency exchange risks on transactions that are
denominated in a currency other than the respective functional
currencies of group companies. The primary currencies in such
transactions are the Japanese yen, the U.S. dollar and the Euro.
Although trade receivables denominated in foreign currencies
are exposed to exchange rate fluctuations, the Company and
some consolidated subsidiaries generally use forward exchange
contracts to hedge the risk of currency fluctuations. The Anritsu
Group is also exposed to foreign currency exchange risk for trade
payables from transactions that are denominated in foreign
currencies for raw materials and other imports.
36

Notes to the Consolidated Financial Statements
The Anritsu Group’s exposures to foreign currency exchange risk is as follows.
Millions of yen
End of FY2016 as of March 31, 2017 Japanese yen U.S. dollar Euro
Net exposure ¥(220) ¥6,401 ¥747
(in thousands of units of relevant currency) (—) (US$57,061 thousand) ( 6,240 thousand)
Millions of yen
End of FY2017 as of March 31, 2018 Japanese yen U.S. dollar Euro
Net exposure ¥(255) ¥5,056 ¥558
(in thousands of units of relevant currency) (—) (US$47,586 thousand) ( 4,273 thousand)
• Sensitivity Analysis for Foreign Currency
The Anritsu Group’s sensitivity analysis to foreign currency
exchange exposure is shown below. This analysis assumes that
all other variables are constant and presents the foreign currency
exposure impact on profit (loss) before tax in the consolidated
statement of profit or loss and other comprehensive income in
case of a 1% appreciation of the Japanese yen as of the report-
ing date. The analysis below shows only the translation impact.
The projected revenue, goods purchases and other impacts are
not taken into consideration.
Millions of yen
End of FY2016as of March 31, 2017
End of FY2017as of March 31, 2018
Japanese yen ¥ (2) ¥ (2)
U.S. dollar (64) (50)
Euro (7) (5)
Note: The impact of the Japanese yen on profit or loss stems from the yen-denominated financial assets or liabilities held by foreign subsidiaries.
3. Risk of Equity Instrument Price Fluctuations
The Anritsu Group owns listed shares of companies with
which it has business relationships, and is exposed to the risk of
price fluctuations of the equity instruments. The Anritsu Group
regularly conducts financial evaluations of market prices and
issuers (companies with which it conducts transactions) and
conducts ongoing reviews of its holdings of these shares.
• Sensitivity Analysis for Equity Instruments
The Anritsu Group’s sensitivity analysis to fluctuations in equity
instrument prices is shown below. This analysis assumes that all
other variables are constant and presents the impact of a 10%
decline in the prices of listed shares on other comprehensive
income (after tax) in the consolidated statement of profit or loss
and other comprehensive income.
Millions of yen
End of FY2016as of March 31, 2017
End of FY2017as of March 31, 2018
Other comprehensive income ¥(89) ¥(100)
(3) Credit Risk
Credit risk is the Anritsu Group’s risk of financial losses if
a customer or financial instrument counterparty cannot fulfill
contractual obligations.
The credit risks for transactions in cash and cash equivalents
are limited because they are with financial institutions that have
high credit standings.
The Anritsu Group is exposed to credit risks from customers
for trade and other receivables. In keeping with its credit man-
agement regulations, the Company addresses the risks for trade
and other receivables by having its sales management depart-
ment regularly monitor situations with key business partners and
manage due dates and balances for each of these partners while
swiftly identifying and reducing recovery concerns stemming
from deteriorating financial positions. Consolidated subsidiaries
perform similar oversight in keeping with the Company’s credit
management rules.
The Anritsu Group is exposed to the credit risks of financial
institutions with which it has contracted for derivatives included
in other financial assets and other financial liabilities. The possi-
bility of breaches of contract is considered minimal because
agreements for these financial instruments are only with
financial institutions with high quality credit standings.
The Anritsu Group is exposed to the credit risks of parties for
which it makes loan guarantees, but these risks are limited to
the Anritsu Group’s employees and subsidiaries.
The carrying value of financial assets, net of impairment
losses, in the consolidated statement of financial position and
the amounts of guarantee obligations recorded in Note 40,
“Contingencies,” are the maximum exposure to credit risk, with-
out taking valuations of credit enhancements into consideration.
37
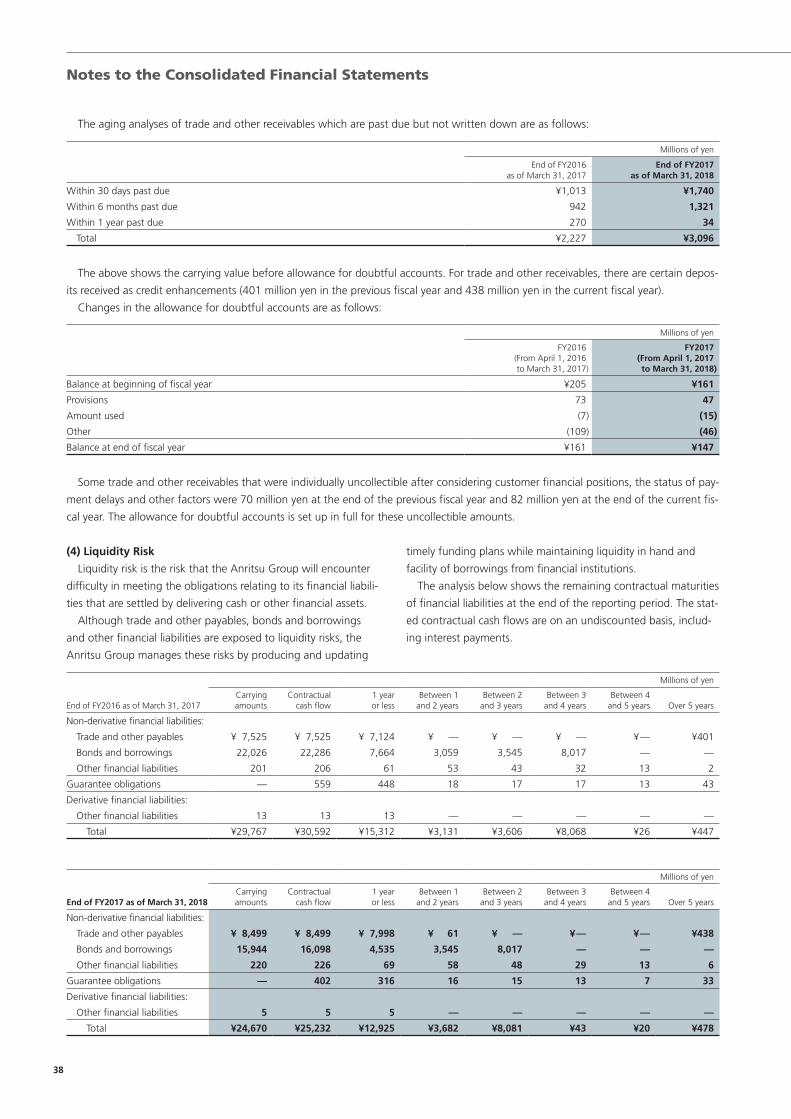
Notes to the Consolidated Financial Statements
The aging analyses of trade and other receivables which are past due but not written down are as follows:
Millions of yen
End of FY2016as of March 31, 2017
End of FY2017as of March 31, 2018
Within 30 days past due ¥1,013 ¥1,740
Within 6 months past due 942 1,321
Within 1 year past due 270 34
Total ¥2,227 ¥3,096
The above shows the carrying value before allowance for doubtful accounts. For trade and other receivables, there are certain depos-
its received as credit enhancements (401 million yen in the previous fiscal year and 438 million yen in the current fiscal year).
Changes in the allowance for doubtful accounts are as follows:
Millions of yen
FY2016(From April 1, 2016to March 31, 2017)
FY2017(From April 1, 2017to March 31, 2018)
Balance at beginning of fiscal year ¥205 ¥161
Provisions 73 47
Amount used (7) (15)
Other (109) (46)
Balance at end of fiscal year ¥161 ¥147
Some trade and other receivables that were individually uncollectible after considering customer financial positions, the status of pay-
ment delays and other factors were 70 million yen at the end of the previous fiscal year and 82 million yen at the end of the current fis-
cal year. The allowance for doubtful accounts is set up in full for these uncollectible amounts.
(4) Liquidity Risk
Liquidity risk is the risk that the Anritsu Group will encounter
difficulty in meeting the obligations relating to its financial liabili-
ties that are settled by delivering cash or other financial assets.
Although trade and other payables, bonds and borrowings
and other financial liabilities are exposed to liquidity risks, the
Anritsu Group manages these risks by producing and updating
timely funding plans while maintaining liquidity in hand and
facility of borrowings from financial institutions.
The analysis below shows the remaining contractual maturities
of financial liabilities at the end of the reporting period. The stat-
ed contractual cash flows are on an undiscounted basis, includ-
ing interest payments.
Millions of yen
End of FY2016 as of March 31, 2017
Carrying amounts
Contractual cash flow
1 year or less
Between 1 and 2 years
Between 2 and 3 years
Between 3 and 4 years
Between 4 and 5 years Over 5 years
Non-derivative financial liabilities:
Trade and other payables ¥ 7,525 ¥ 7,525 ¥ 7,124 ¥ — ¥ — ¥ — ¥— ¥401
Bonds and borrowings 22,026 22,286 7,664 3,059 3,545 8,017 — —
Other financial liabilities 201 206 61 53 43 32 13 2
Guarantee obligations — 559 448 18 17 17 13 43
Derivative financial liabilities:
Other financial liabilities 13 13 13 — — — — —
Total ¥29,767 ¥30,592 ¥15,312 ¥3,131 ¥3,606 ¥8,068 ¥26 ¥447
Millions of yen
End of FY2017 as of March 31, 2018
Carrying amounts
Contractual cash flow
1 year or less
Between 1 and 2 years
Between 2 and 3 years
Between 3 and 4 years
Between 4 and 5 years Over 5 years
Non-derivative financial liabilities:
Trade and other payables ¥ 8,499 ¥ 8,499 ¥ 7,998 ¥ 61 ¥ — ¥— ¥— ¥438
Bonds and borrowings 15,944 16,098 4,535 3,545 8,017 — — —
Other financial liabilities 220 226 69 58 48 29 13 6
Guarantee obligations — 402 316 16 15 13 7 33
Derivative financial liabilities:
Other financial liabilities 5 5 5 — — — — —
Total ¥24,670 ¥25,232 ¥12,925 ¥3,682 ¥8,081 ¥43 ¥20 ¥478
38

Notes to the Consolidated Financial Statements
(5) Presentation of Offsetting Financial Assets and
Financial Liabilities
Financial assets recognized in the consolidated statement of
financial position were 65,207 million yen in the previous fiscal
year and 61,166 million yen in the current fiscal year, while
financial liabilities recognized likewise were 29,767 million yen
in the previous fiscal year and 24,670 million yen in the current
fiscal year. These financial assets and financial liabilities are not
offset.
(6) Fair Value
1. Fair Value and Carrying Amounts
The fair values and carrying amounts in the consolidated statement of financial position of financial assets and liabilities are as
follows:
Millions of yen
End of FY2016 as of March 31, 2017
End of FY2017 as of March 31, 2018
Carrying amounts Fair value
Carrying amounts Fair value
Assets measured at fair value
Financial assets measured at FVTOCI:
Other financial assets ¥ 2,481 ¥ 2,481 ¥ 2,747 ¥ 2,747
Financial assets measured at FVTPL:
Other financial assets 14 14 6 6
Assets measured at amortized cost:
Cash and cash equivalents 39,682 39,682 35,452 35,452
Trade and other receivables 21,891 21,891 21,801 21,801
Other financial assets 1,137 1,137 1,158 1,158
Liabilities measured at fair value
Financial liabilities measured at FVTPL:
Other financial liabilities 13 13 5 5
Liabilities measured at amortized cost:
Trade and other payables 7,525 7,525 8,499 8,499
Bonds and borrowings 22,026 22,115 15,944 15,994
Other financial liabilities 201 203 220 222
2. Fair Value Calculation Method for Financial Instruments
• Cash and Cash Equivalents, Trade and Other Receivables, and
Trade and Other Payables
Current items of cash and cash equivalents, trade and other
receivables and trade and other payables are settled in a short
period, and non-current items are subject to a market interest
rate. Therefore, the carrying amounts of these financial instru-
ments are at approximate reasonable fair values.
• Other Financial Assets and Other Financial Liabilities
For time deposits with original maturities of over three
months, their carrying amounts reasonably approximate fair
value as they are settled in a short period.
Investment securities are treated as financial assets measured
at FVTOCI; listed shares are measured at market prices from the
stock exchange; and the value of unlisted shares is determined
based on comparable company valuation multiples (a method of
determining multiples of various financial figures against the
market stock price of similar listed companies, adjusted as neces-
sary).
Derivatives, as financial assets or liabilities measured at FVTPL,
are measured based on prices provided by correspondent finan-
cial institutions.
Lease obligations are measured by discounting the future cash
flows using a discount rate to be applied in the case where a
similar type of contract is newly entered into.
• Bonds and Borrowings
Borrowings are measured by discounting the future cash flows
using a discount rate to be applied in the case where a similar
type of contract is newly entered into.
Bonds are measured based on market prices as well as prices
provided by correspondent financial institutions.
3. Fair Value Measurements Recognized in the Financial Statements
Below is an analysis for financial instruments recognized at fair value by the levels of the fair value hierarchy. The different levels have
been defined as follows:
Level 1: Quoted prices in active markets for identical assets or liabilities.
Level 2: Inputs other than quoted prices included in Level 1 that are observable for assets or liabilities, either direct or indirectly.
Level 3: Inputs for assets and liabilities that are not based on observable market data.
39

Notes to the Consolidated Financial Statements
• Financial instruments measured at the fair value
Millions of yen
End of FY2016 as of March 31, 2017 Level 1 Level 2 Level 3 Total
Financial assets measured at FVTOCI:
Other financial assets ¥1,286 ¥— ¥1,195 ¥2,481
Financial assets measured at FVTPL:
Other financial assets — 14 — 14
Total assets ¥1,286 ¥14 ¥1,195 ¥2,496
Financial assets measured at FVTPL:
Other financial liabilities ¥ — ¥13 ¥ — ¥ 13
Total liabilities ¥ — ¥13 ¥ — ¥ 13
Note: During the previous fiscal year, there were no significant transfers between the Level 1 or Level 2 of the fair value hierarchy.
Millions of yen
End of FY2017 as of March 31, 2018 Level 1 Level 2 Level 3 Total
Financial assets measured at FVTOCI:
Other financial assets ¥1,448 ¥— ¥1,298 ¥2,747
Financial assets measured at FVTPL:
Other financial assets — 6 — 6
Total assets ¥1,448 ¥ 6 ¥1,298 ¥2,753
Financial assets measured at FVTPL:
Other financial liabilities ¥ — ¥ 5 ¥ — ¥ 5
Total liabilities ¥ — ¥ 5 ¥ — ¥ 5
Note: During the current fiscal year, there were no significant transfers between the Level 1 or Level 2 of the fair value hierarchy.
• Reconciliation from the beginning balances to the ending balances of financial instruments classified in Level 3 of the fair value hier-
archy.
Millions of yen
End of FY2016 as of March 31, 2017Financial assets
measured at FVTOCI
Balance at beginning of fiscal year ¥1,198
Other comprehensive income (3)
Acquisition —
Disposal —
Balance at end of fiscal year ¥1,195
Millions of yen
End of FY2017 as of March 31, 2018Financial assets
measured at FVTOCI
Balance at beginning of fiscal year ¥1,195
Other comprehensive income 102
Acquisition 1
Disposal (0)
Balance at end of fiscal year ¥1,298
Although the Anritsu Group uses comparable company valuation multiples to measure the fair values of unlisted shares, the result of
such measurements of fair value may differ from the one provided by other techniques such as valuation models based on undiscount-
ed future cash flows or net assets. In a calculation under the comparable company valuation multiples technique, multiple listed com-
panies are constantly selected for comparison. In addition, an illiquidity discount is taken into consideration in the calculation.
40

Notes to the Consolidated Financial Statements
(7) Details of Financial Assets measured at FVTOCI
The fair values of major stocks included in “Other Financial Assets measured at FVTOCI” held as of the end of the previous fiscal year
and the end of the current fiscal year were as follows:
Millions of yen
End of FY2016as of March 31, 2017
End of FY2017as of March 31, 2018
Listed shares
KDDI Corporation ¥ 543 ¥ 505
Kyowa Exeo Corporation 193 342
NEC Corporation 248 276
Others 300 323
Listed shares subtotal 1,286 1,448
Unlisted shares
Communication equipment industry 582 700
Leasing industry 249 291
Others 363 306
Unlisted shares subtotal 1,195 1,298
Total ¥2,481 ¥2,747
Dividends on investments held as of the fiscal year end were 52 million yen and 58 million yen in the previous fiscal year and current
fiscal year, respectively.
For fair value measurement in Level 3 of the fair value hierarchy, changing one or more reasonably possible alternative assumptions
could have some effects. The effect on other comprehensive income (after tax effect) resulting from changing the illiquidity discount
within the range of plus or minus 10% is as follows:
Millions of yen
End of FY2016 as of March 31, 2017
End of FY2017 as of March 31, 2018
Beneficial impact
Adverse impact
Beneficial impact
Adverse impact
Other comprehensive income ¥117 ¥(117) ¥127 ¥(127)
(8) Derecognition of Financial Assets measured at FVTOCI
“Other Financial Assets measured at FVTOCI” derecognized during the previous fiscal year and current fiscal year are as follows:
Millions of yen
FY2016 (From April 1, 2016 to March 31, 2017)Fair value at the time
of derecognition Cumulative gains or losses Dividend income
¥7 ¥2 ¥—
Note: During the previous fiscal year, the cumulative gain (after tax) of 1 million yen was reclassified from other components of equity to retained earnings.
Millions of yen
FY2017 (From April 1, 2017 to March 31, 2018)Fair value at the time
of derecognition Cumulative gains or losses Dividend income
¥0 ¥(0) ¥0
Note: During the current fiscal year, there was no cumulative gain (after tax) reclassified from other components of equity to retained earnings.
41

Notes to the Consolidated Financial Statements
37. Operating Leases• Leases as lessee
Lease payments under operating lease agreements recognized as expenses in each reporting period are as follows:
Millions of yen
FY2016(From April 1, 2016to March 31, 2017)
FY2017(From April 1, 2017to March 31, 2018)
Minimum lease payments ¥1,610 ¥1,504
Total lease payments ¥1,610 ¥1,504
Note: Minimum lease payments are recorded in “Cost of sales,” “Selling, general and administrative expenses,” and “Research and development expense” in the consolidated statement of profit or loss and other comprehensive income.
Future minimum lease payments for non-cancelable operating leases are as follows:
Millions of yen
End of FY2016as of March 31, 2017
End of FY2017as of March 31, 2018
Less than 1 year ¥ 492 ¥ 460
Between 1 and 5 years 640 729
Over 5 years 7 80
Total ¥1,140 ¥1,270
Note: Operating lease payments represent rent payments the Anritsu Group is obligated to pay for buildings and structures, tools, furniture and fixtures and machinery, equipment and vehicles. Although some agreements provide rights for renewal, there are no significant provisory clauses such as purchase options, sublease agreements or escalation clauses (provisions that require increases in lease payments).
38. Related Parties(1) Major Subsidiaries
Percentage ownership (%)
Name Business LocationEnd of FY2016
as of March 31, 2017End of FY2017
as of March 31, 2018
Anritsu Infivis Co., Ltd. PQA Atsugi-City, Kanagawa 100% 100%
Anritsu Networks Co., Ltd. Other Atsugi-City, Kanagawa 100 100
Anritsu U.S. Holding, Inc. Test and Measurement California, USA 100 100
Anritsu Company Test and Measurement California, USA 100 100
Anritsu EMEA Ltd. Test and Measurement Bedfordshire, UK 100 100
Anritsu Company Ltd. Test and Measurement Kowloon, Hong Kong 100 100
Anritsu A/S Test and Measurement Copenhagen, Denmark 100 100
(2) Transactions with Related Parties
• FY2016 (From April 1, 2016 to March 31, 2017)
There are no significant related party transactions (excluding those eliminated in the consolidated financial statements) to be
disclosed.
• FY2017 (From April 1, 2017 to March 31, 2018)
There are no significant related party transactions (excluding those eliminated in the consolidated financial statements) to be
disclosed.
(3) Payments to Key Executives
Millions of yen
FY2016(From April 1, 2016to March 31, 2017)
FY2017(From April 1, 2017to March 31, 2018)
Compensation and bonuses ¥211 ¥219
Share-based payments 12 13
Total ¥223 ¥233
42
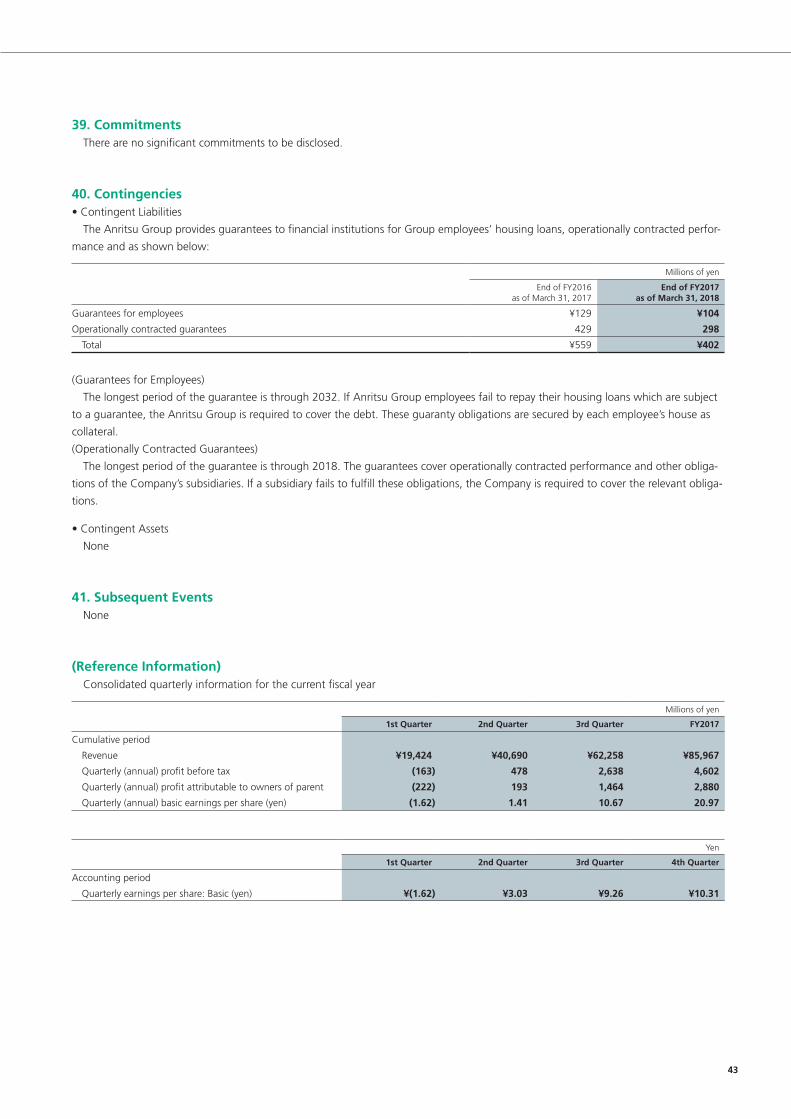
Notes to the Consolidated Financial Statements
39. Commitments There are no significant commitments to be disclosed.
40. Contingencies• Contingent Liabilities
The Anritsu Group provides guarantees to financial institutions for Group employees’ housing loans, operationally contracted perfor-
mance and as shown below:
Millions of yen
End of FY2016as of March 31, 2017
End of FY2017as of March 31, 2018
Guarantees for employees ¥129 ¥104
Operationally contracted guarantees 429 298
Total ¥559 ¥402
(Guarantees for Employees)
The longest period of the guarantee is through 2032. If Anritsu Group employees fail to repay their housing loans which are subject
to a guarantee, the Anritsu Group is required to cover the debt. These guaranty obligations are secured by each employee’s house as
collateral.
(Operationally Contracted Guarantees)
The longest period of the guarantee is through 2018. The guarantees cover operationally contracted performance and other obliga-
tions of the Company’s subsidiaries. If a subsidiary fails to fulfill these obligations, the Company is required to cover the relevant obliga-
tions.
• Contingent Assets
None
41. Subsequent Events None
(Reference Information) Consolidated quarterly information for the current fiscal year
Millions of yen
1st Quarter 2nd Quarter 3rd Quarter FY2017
Cumulative period
Revenue ¥19,424 ¥40,690 ¥62,258 ¥85,967
Quarterly (annual) profit before tax (163) 478 2,638 4,602
Quarterly (annual) profit attributable to owners of parent (222) 193 1,464 2,880
Quarterly (annual) basic earnings per share (yen) (1.62) 1.41 10.67 20.97
Yen
1st Quarter 2nd Quarter 3rd Quarter 4th Quarter
Accounting period
Quarterly earnings per share: Basic (yen) ¥(1.62) ¥3.03 ¥9.26 ¥10.31
43

Non-consolidated Balance Sheet
Millions of yenThousands of U.S. dollars*
FY2016 as of
March 31, 2017
FY2017as of
March 31, 2018
FY2017 as of
March 31, 2018
Assets
Current assets
Cash and deposits ¥ 19,585 ¥ 17,365 $ 163,435
Notes receivable–trade 405 524 4,931
Accounts receivable–trade 10,961 10,084 94,908
Finished goods 2,201 1,695 15,952
Work in process 31 27 254
Raw materials 2,844 3,860 36,329
Prepaid expenses 86 224 2,108
Deferred tax assets 1,013 993 9,345
Other 5,971 4,594 43,237
Allowance for doubtful accounts (88) (72) (677)
Total current assets 43,013 39,298 369,863
Non-current assets
Property, plant and equipment
Buildings 14,144 13,906 130,880
Structures 257 232 2,183
Machinery and equipment 112 105 988
Vehicles 0 0 0
Tools, furniture and fixtures 2,228 2,021 19,021
Land 2,010 2,010 18,917
Total property, plant and equipment 18,753 18,276 172,009
Intangible assets
Software 1,628 1,597 15,030
Other 0 0 0
Total intangible assets 1,628 1,598 15,040
Investments and other assets
Investment securities 1,130 1,296 12,197
Shares of subsidiaries and affiliates 46,280 46,312 435,877
Long-term loans receivable 5,651 5,501 51,774
Prepaid pension cost 2,699 2,622 24,677
Deferred tax assets 2,522 2,109 19,849
Other 79 74 696
Total investments and other assets 58,363 57,917 545,101
Total non-current assets 78,745 77,791 732,151
Total ¥121,758 ¥117,090 $1,102,023
* The U.S. dollar amounts in this report represent translations of Japanese yen, for convenience only, at the rate of ¥106.25 to U.S. $1.00, the approximate exchange rate on March 31, 2018.
44

Non-consolidated Balance Sheet
Millions of yenThousands of U.S. dollars*
FY2016 as of
March 31, 2017
FY2017 as of
March 31, 2018
FY2017 as of
March 31, 2018
Liabilities
Current liabilities
Notes and accounts payable–trade ¥ 4,768 ¥ 4,363 $ 41,063
Short-term loans payable 1,190 1,090 10,258
Current portion of long-term bonds payable 6,000 — —
Current portion of long-term loans payable — 3,000 28,235
Lease obligations 3 13 122
Accounts payable–other 1,837 2,105 19,811
Accrued expenses 1,058 1,374 12,931
Income taxes payable 131 807 7,595
Advances received 908 867 8,160
Deposits received 15,453 15,039 141,543
Provision for product warranties 40 46 432
Provision for directors’ bonuses 25 40 376
Other 109 31 292
Total current liabilities 31,526 28,781 270,880
Non-current liabilities
Bonds payable 8,000 8,000 75,294
Long-term loans payable 6,500 3,500 32,941
Lease obligations 2 41 385
Provision for directors’ retirement benefits 5 5 47
Other 291 287 2,701
Total non-current liabilities 14,800 11,834 111,378
Total liabilities 46,326 40,615 382,258
Net assets
Shareholders’ equity
Capital stock 19,052 19,064 179,425
Capital surplus
Legal capital surplus 28,002 28,014 263,661
Other capital surplus — 0 0
Total capital surplus 28,002 28,014 263,661
Retained earnings
Legal retained earnings 2,468 2,468 23,228
Other retained earnings 26,203 27,126 255,303
General reserve 21,719 21,719 204,414
Retained earnings brought forward 4,484 5,407 50,889
Treasury stock (1,012) (987) (9,289)
Total shareholders’ equity 74,713 75,685 712,329
Valuation and translation adjustments
Valuation difference on available-for-sale securities 572 696 6,550
Total valuation and translation adjustments 572 696 6,550
Subscription rights to shares 145 92 865
Total net assets 75,431 76,474 719,755
Total ¥121,758 ¥117,090 $1,102,023
* The U.S. dollar amounts in this report represent translations of Japanese yen, for convenience only, at the rate of ¥106.25 to U.S. $1.00, the approximate exchange rate on March 31, 2018.
45
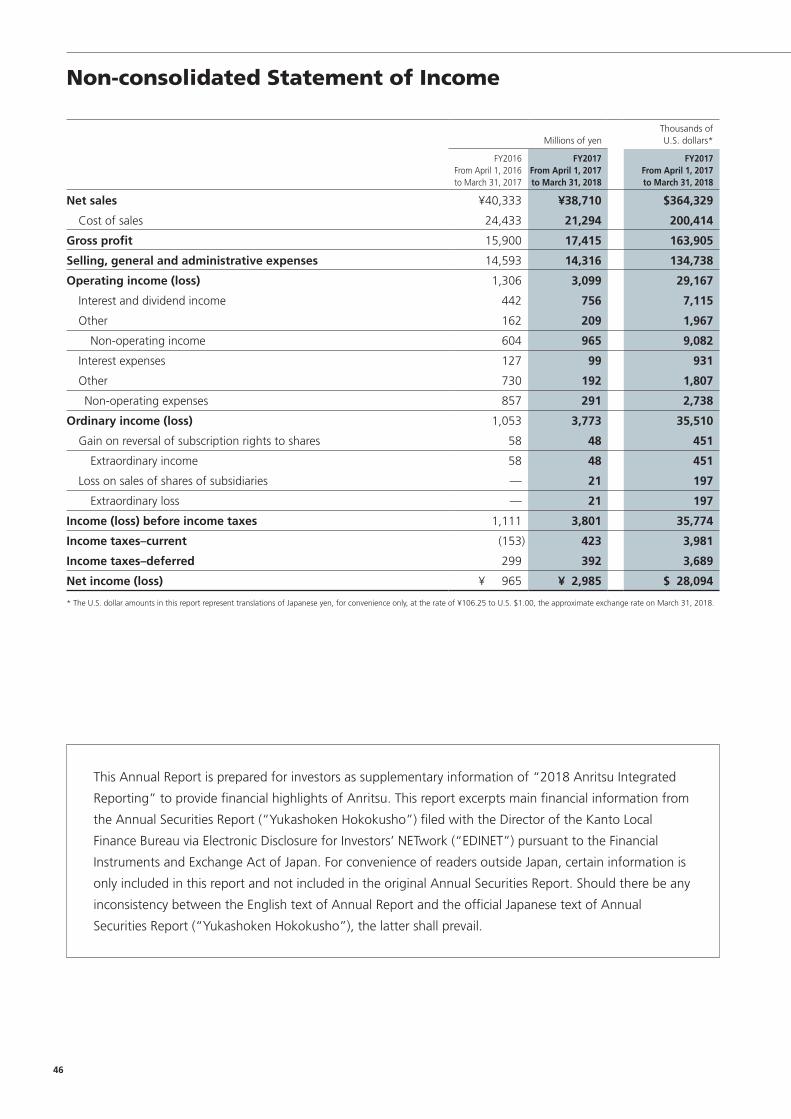
Non-consolidated Statement of Income
Millions of yenThousands of U.S. dollars*
FY2016From April 1, 2016 to March 31, 2017
FY2017From April 1, 2017 to March 31, 2018
FY2017From April 1, 2017to March 31, 2018
Net sales ¥40,333 ¥38,710 $364,329
Cost of sales 24,433 21,294 200,414
Gross profit 15,900 17,415 163,905
Selling, general and administrative expenses 14,593 14,316 134,738
Operating income (loss) 1,306 3,099 29,167
Interest and dividend income 442 756 7,115
Other 162 209 1,967
Non-operating income 604 965 9,082
Interest expenses 127 99 931
Other 730 192 1,807
Non-operating expenses 857 291 2,738
Ordinary income (loss) 1,053 3,773 35,510
Gain on reversal of subscription rights to shares 58 48 451
Extraordinary income 58 48 451
Loss on sales of shares of subsidiaries — 21 197
Extraordinary loss — 21 197
Income (loss) before income taxes 1,111 3,801 35,774
Income taxes–current (153) 423 3,981
Income taxes–deferred 299 392 3,689
Net income (loss) ¥ 965 ¥ 2,985 $ 28,094
* The U.S. dollar amounts in this report represent translations of Japanese yen, for convenience only, at the rate of ¥106.25 to U.S. $1.00, the approximate exchange rate on March 31, 2018.
This Annual Report is prepared for investors as supplementary information of “2018 Anritsu Integrated
Reporting” to provide financial highlights of Anritsu. This report excerpts main financial information from
the Annual Securities Report (“Yukashoken Hokokusho”) filed with the Director of the Kanto Local
Finance Bureau via Electronic Disclosure for Investors’ NETwork (“EDINET”) pursuant to the Financial
Instruments and Exchange Act of Japan. For convenience of readers outside Japan, certain information is
only included in this report and not included in the original Annual Securities Report. Should there be any
inconsistency between the English text of Annual Report and the official Japanese text of Annual
Securities Report (“Yukashoken Hokokusho”), the latter shall prevail.
46


Global Headquarters and Mt.OyamaThe city of Atsugi, where many companies are gathering and developing cutting-edge technology, is surrouded by the rich nature of the Tanzawa-Oyama Quasi-National Park. The Tanzawa Mountains, standing behind the company’s Global Headquarters, seem to make a statement about human coexistence with technology and nature.