Embed Size (px)
Citation preview

NYSE: RDN www.radian.biz
Financial Results Q4 2016
1
SAFE HARBOR STATEMENTS
2
All statements in this report that address events, developments or results that we expect or anticipate may occur in the future are “forward-looking statements” within the meaning of Section 27A of the Securities Act of 1933, Section 21E of the Exchange Act and the U.S. Private Securities Litigation Reform Act of 1995. In most cases, forward-looking statements may be identified by words such as “anticipate,” “may,” “will,” “could,” “should,” “would,” “expect,” “intend,” “plan,” “goal,” “contemplate,” “believe,” “estimate,” “predict,” “project,” “potential,” “continue,” “seek,” “strategy,” “future,” “likely” or the negative or other variations on these words and other similar expressions. These statements, which may include, without limitation, projections regarding our future performance and financial condition, are made on the basis of management’s current views and assumptions with respect to future events. Any forward-looking statement is not a guarantee of future performance and actual results could differ materially from those contained in the forward-looking statement. These statements speak only as of the date they were made, and we undertake no obligation to update or revise any forward-looking statements, whether as a result of new information, future events or otherwise. We operate in a changing environment. New risks emerge from time to time and it is not possible for us to predict all risks that may affect us. The forward-looking statements, as well as our prospects as a whole, are subject to risks and uncertainties that could cause actual results to differ materially from those set forth in the forward-looking statements including:
• changes in general economic and political conditions, including in
particular but without limitation, unemployment rates, interest rates and changes in housing and mortgage credit markets, that impact the size of the insurable market and the credit performance of our insured portfolio;
• changes in the way customers, investors, regulators or legislators perceive the performance and financial strength of private mortgage insurers;
• Radian Guaranty’s ability to remain eligible under the PMIERs and
other applicable requirements imposed by the Federal Housing Finance Agency and by the GSEs to insure loans purchased by the GSEs;
• our ability to successfully execute and implement our capital plans and to maintain sufficient holding company liquidity to meet our short- and long-term liquidity needs;
• our ability to successfully execute and implement our business plans and strategies, including in particular but without limitation, plans and strategies that require GSE and/or regulatory approvals;
• our ability to maintain an adequate level of capital in our insurance subsidiaries to satisfy existing and future state regulatory requirements;
• changes in the charters or business practices of, or rules or regulations imposed by or applicable to, the GSEs, including the GSEs’ interpretation and application of the PMIERs to our mortgage insurance business;
• changes in the current housing finance system in the U.S., including in particular but without limitation, the role of the FHA, the GSEs and private mortgage insurers in this system;
• any disruption in the servicing of mortgages covered by our insurance policies, as well as poor servicer performance;
• a significant decrease in the persistency rates of our mortgage insurance policies;
• competition in our mortgage insurance business, including in particular but without limitation, price competition and competition from the FHA, VA and other forms of credit enhancement;
• the effect of the Dodd-Frank Wall Street Reform and Consumer Protection Act on the financial services industry in general, and on our businesses in particular;
• the adoption of new laws and regulations, or changes in existing laws and regulations, or the way they are interpreted or applied;
• the outcome of legal and regulatory actions, reviews, audits, inquiries and investigations that could result in adverse judgments, settlements, fines, injunctions, restitutions or other relief that could
require significant expenditures or have other effects on our business;
• the amount and timing of potential payments or adjustments associated with federal or other tax examinations, including deficiencies assessed by the IRS resulting from its examination of our 2000 through 2007 tax years, which we are currently contesting;
• the possibility that we may fail to estimate accurately the likelihood, magnitude and timing of losses in connection with establishing loss reserves for our mortgage insurance business;
• volatility in our results of operations caused by changes in the fair value of our assets and liabilities, including a significant portion of our investment portfolio;
• changes in GAAP or SAPP rules and guidance, or their interpretation;
• our ability to attract and retain key employees; • legal and other limitations on dividends and other amounts we may
receive from our subsidiaries; and • the possibility that we may need to impair the carrying value of
goodwill established in connection with our acquisition of Clayton. For more information regarding these risks and uncertainties as well as certain additional risks that we face, you should refer to the Risk Factors detailed in Item 1A of Part I of our Annual Report on Form 10-K for the year ended December 31, 2015, and subsequent reports and registration statements filed from time to time with the U.S. Securities and Exchange Commission. We caution you not to place undue reliance on these forward-looking statements, which are current only as of the date on which we issued this presentation. We do not intend to, and we disclaim any duty or obligation to, update or revise any forward-looking statements to reflect new information or future events or for any other reason.
WHO IS RADIAN?
18%
82%
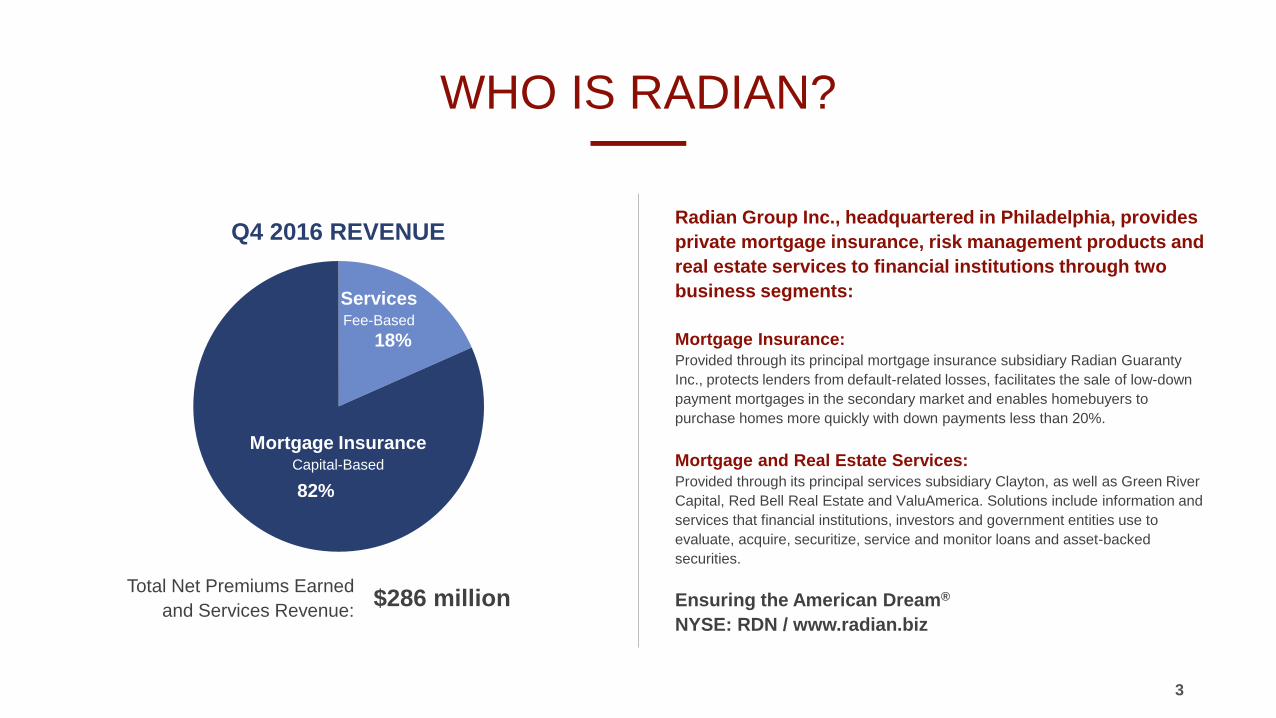
Radian Group Inc., headquartered in Philadelphia, provides private mortgage insurance, risk management products and real estate services to financial institutions through two business segments: Mortgage Insurance: Provided through its principal mortgage insurance subsidiary Radian Guaranty Inc., protects lenders from default-related losses, facilitates the sale of low-down payment mortgages in the secondary market and enables homebuyers to purchase homes more quickly with down payments less than 20%. Mortgage and Real Estate Services: Provided through its principal services subsidiary Clayton, as well as Green River Capital, Red Bell Real Estate and ValuAmerica. Solutions include information and services that financial institutions, investors and government entities use to evaluate, acquire, securitize, service and monitor loans and asset-backed securities. Ensuring the American Dream® NYSE: RDN / www.radian.biz
Q4 2016 REVENUE
Total Net Premiums Earned and Services Revenue:
Mortgage Insurance Capital-Based
Services Fee-Based
$286 million
3
FULL YEAR 2016 HIGHLIGHTS
4
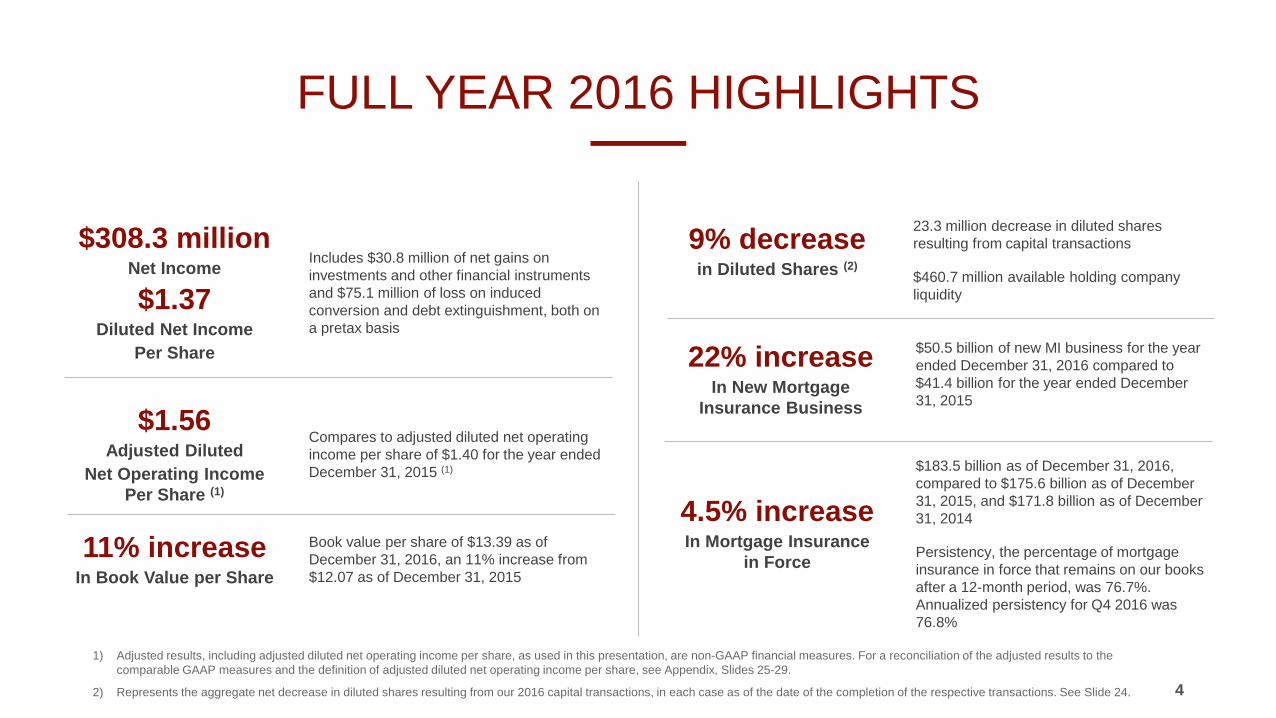
1) Adjusted results, including adjusted diluted net operating income per share, as used in this presentation, are non-GAAP financial measures. For a reconciliation of the adjusted results to the comparable GAAP measures and the definition of adjusted diluted net operating income per share, see Appendix, Slides 25-29.
2) Represents the aggregate net decrease in diluted shares resulting from our 2016 capital transactions, in each case as of the date of the completion of the respective transactions. See Slide 24.
$50.5 billion of new MI business for the year ended December 31, 2016 compared to $41.4 billion for the year ended December 31, 2015
22% increase In New Mortgage
Insurance Business
4.5% increase In Mortgage Insurance
in Force
$183.5 billion as of December 31, 2016, compared to $175.6 billion as of December 31, 2015, and $171.8 billion as of December 31, 2014
Persistency, the percentage of mortgage insurance in force that remains on our books after a 12-month period, was 76.7%. Annualized persistency for Q4 2016 was 76.8%
9% decrease in Diluted Shares (2)
23.3 million decrease in diluted shares resulting from capital transactions
$460.7 million available holding company liquidity
11% increase In Book Value per Share
Book value per share of $13.39 as of December 31, 2016, an 11% increase from $12.07 as of December 31, 2015
Includes $30.8 million of net gains on investments and other financial instruments and $75.1 million of loss on induced conversion and debt extinguishment, both on a pretax basis
$308.3 million Net Income
$1.37 Diluted Net Income
Per Share
$1.56 Adjusted Diluted
Net Operating Income Per Share (1)
Compares to adjusted diluted net operating income per share of $1.40 for the year ended December 31, 2015 (1)
Q4 HIGHLIGHTS
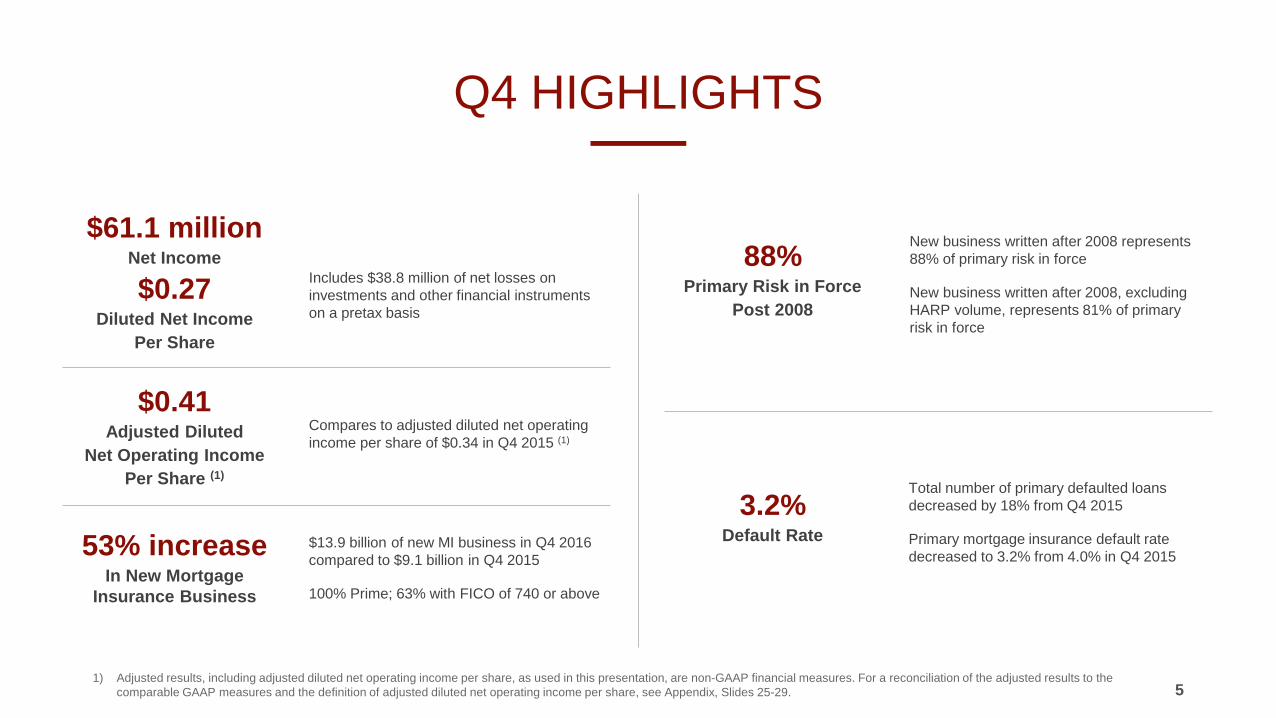
5 1) Adjusted results, including adjusted diluted net operating income per share, as used in this presentation, are non-GAAP financial measures. For a reconciliation of the adjusted results to the
comparable GAAP measures and the definition of adjusted diluted net operating income per share, see Appendix, Slides 25-29.
Includes $38.8 million of net losses on investments and other financial instruments on a pretax basis
$61.1 million Net Income
$0.27 Diluted Net Income
Per Share
$0.41 Adjusted Diluted
Net Operating Income Per Share (1)
$13.9 billion of new MI business in Q4 2016 compared to $9.1 billion in Q4 2015
100% Prime; 63% with FICO of 740 or above
53% increase In New Mortgage
Insurance Business
3.2% Default Rate
Total number of primary defaulted loans decreased by 18% from Q4 2015
Primary mortgage insurance default rate decreased to 3.2% from 4.0% in Q4 2015
88% Primary Risk in Force
Post 2008
New business written after 2008 represents 88% of primary risk in force
New business written after 2008, excluding HARP volume, represents 81% of primary risk in force
Compares to adjusted diluted net operating income per share of $0.34 in Q4 2015 (1)
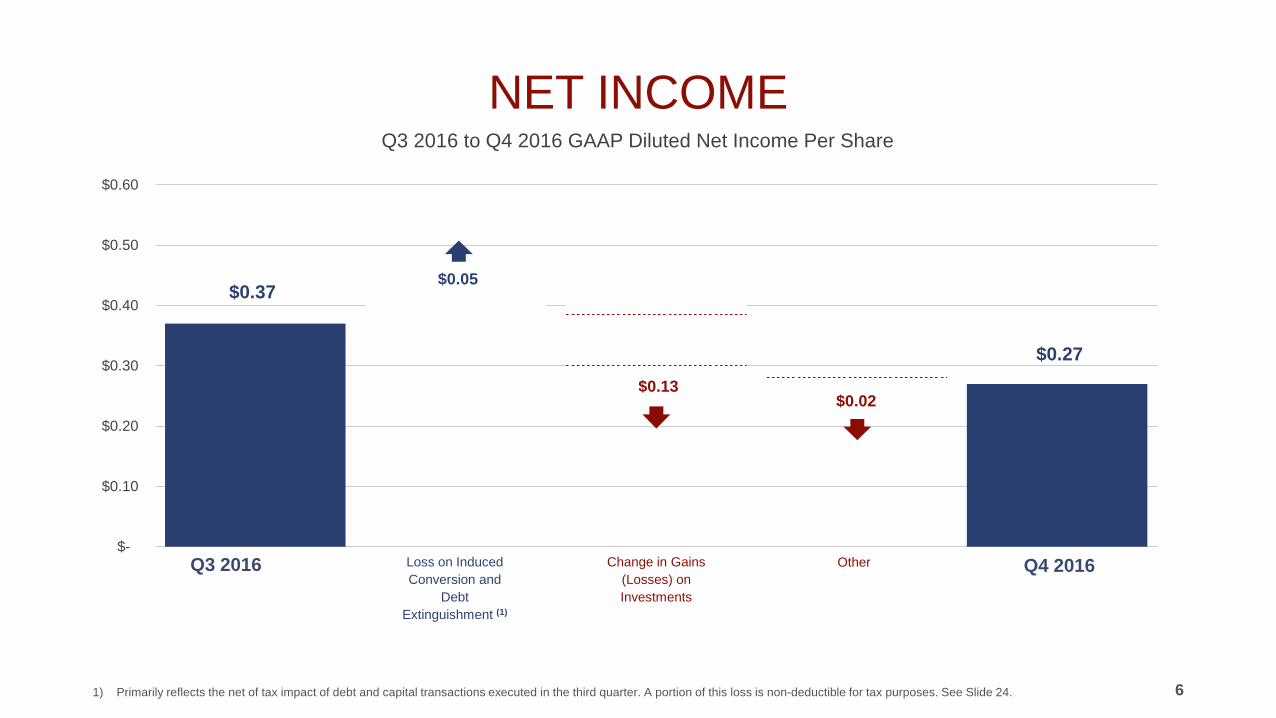
NET INCOME Q3 2016 to Q4 2016 GAAP Diluted Net Income Per Share
6
$0.37
$0.27
$0.05
$0.13 $0.02
$-
$0.10
$0.20
$0.30
$0.40
$0.50
$0.60
Q3 2016 Q4 2016 Loss on Induced Conversion and
Debt Extinguishment (1)
1) Primarily reflects the net of tax impact of debt and capital transactions executed in the third quarter. A portion of this loss is non-deductible for tax purposes. See Slide 24.
Other Change in Gains (Losses) on Investments
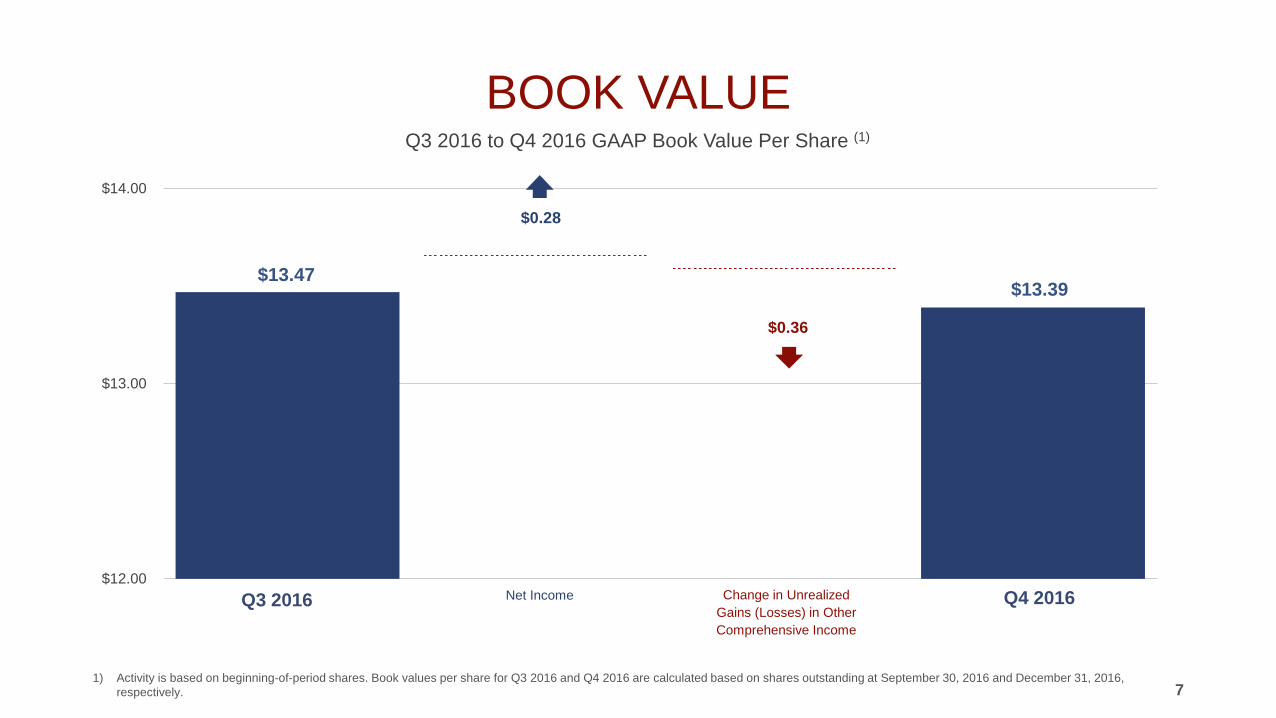
BOOK VALUE Q3 2016 to Q4 2016 GAAP Book Value Per Share (1)
7
$13.47 $13.39
$0.28
$0.36
$12.00
$13.00
$14.00
Q3 2016 Net Income Change in Unrealized Gains (Losses) in Other Comprehensive Income
Q4 2016
1) Activity is based on beginning-of-period shares. Book values per share for Q3 2016 and Q4 2016 are calculated based on shares outstanding at September 30, 2016 and December 31, 2016, respectively.
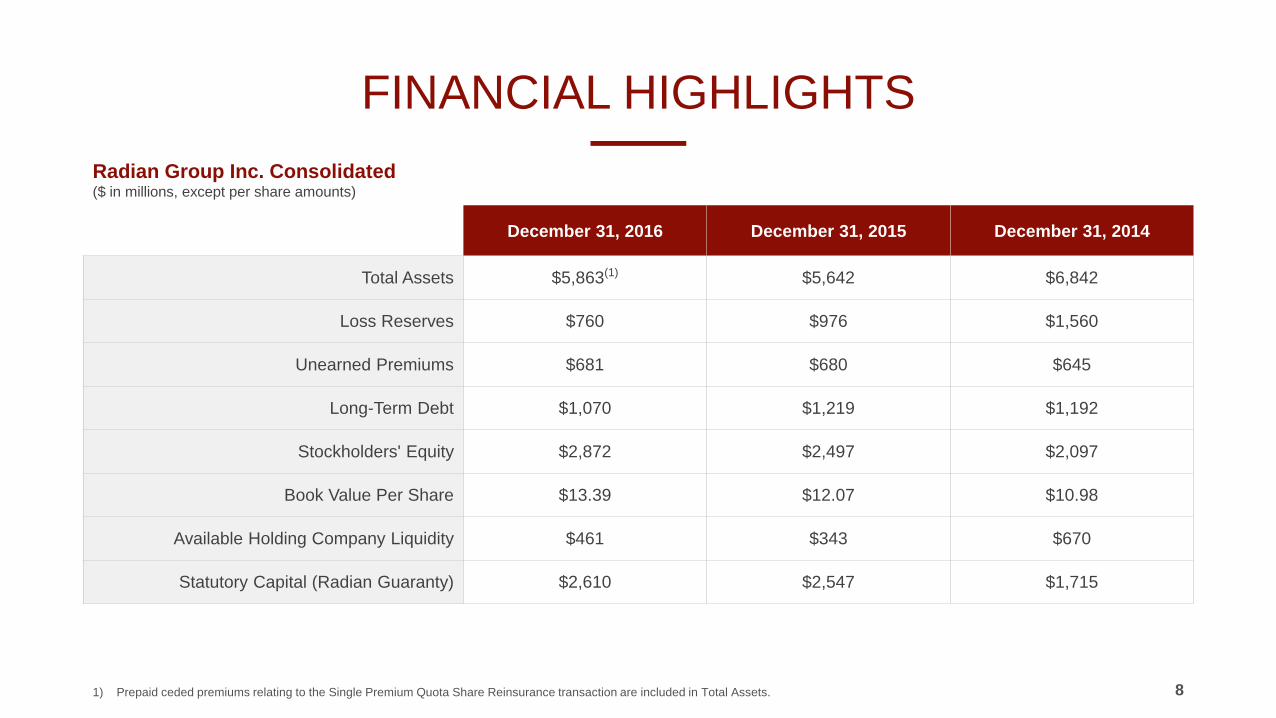
FINANCIAL HIGHLIGHTS
8
December 31, 2016 December 31, 2015 December 31, 2014
Total Assets $5,863(1) $5,642 $6,842
Loss Reserves $760 $976 $1,560
Unearned Premiums $681 $680 $645
Long-Term Debt $1,070 $1,219 $1,192
Stockholders' Equity $2,872 $2,497 $2,097
Book Value Per Share $13.39 $12.07 $10.98
Available Holding Company Liquidity $461 $343 $670
Statutory Capital (Radian Guaranty) $2,610 $2,547 $1,715
Radian Group Inc. Consolidated ($ in millions, except per share amounts)
1) Prepaid ceded premiums relating to the Single Premium Quota Share Reinsurance transaction are included in Total Assets.

MORTGAGE INSURANCE
9
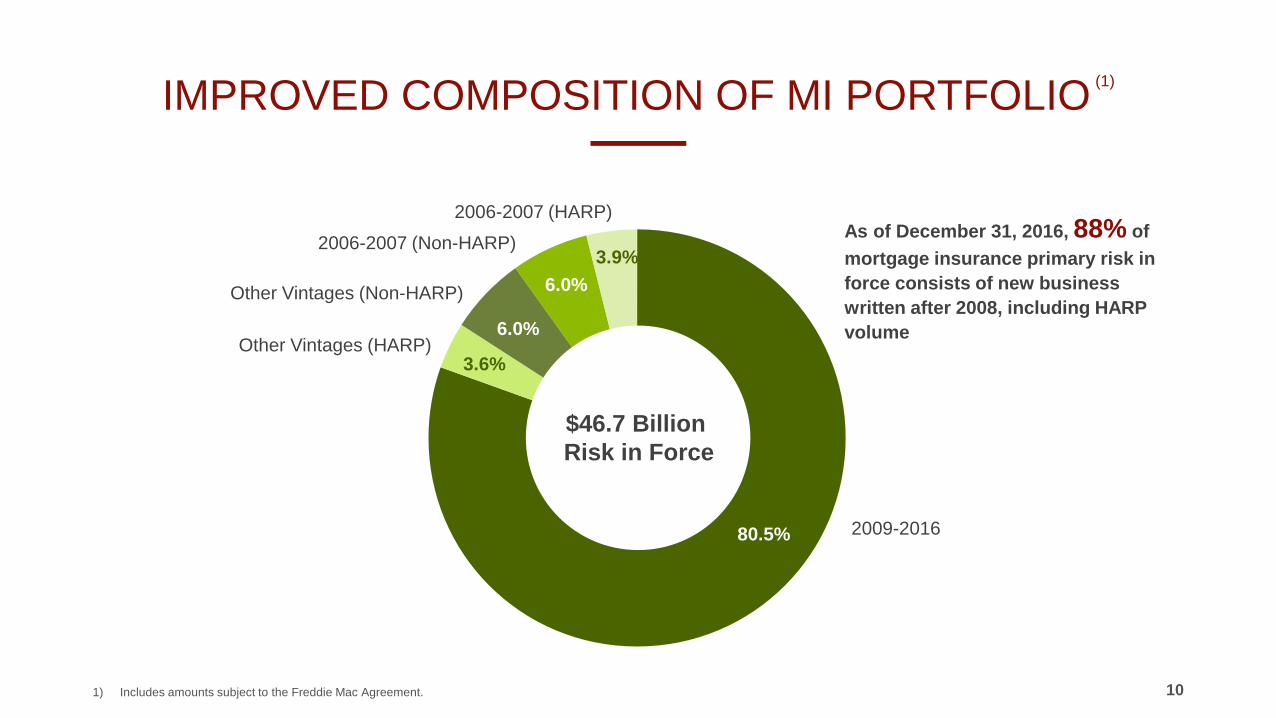
IMPROVED COMPOSITION OF MI PORTFOLIO (1)
80.5%
3.6%
6.0%
6.0% 3.9%
As of December 31, 2016, 88% of mortgage insurance primary risk in force consists of new business written after 2008, including HARP volume
10 1) Includes amounts subject to the Freddie Mac Agreement.
Other Vintages (HARP)
Other Vintages (Non-HARP)
2006-2007 (Non-HARP)
2006-2007 (HARP)
2009-2016
$46.7 Billion Risk in Force
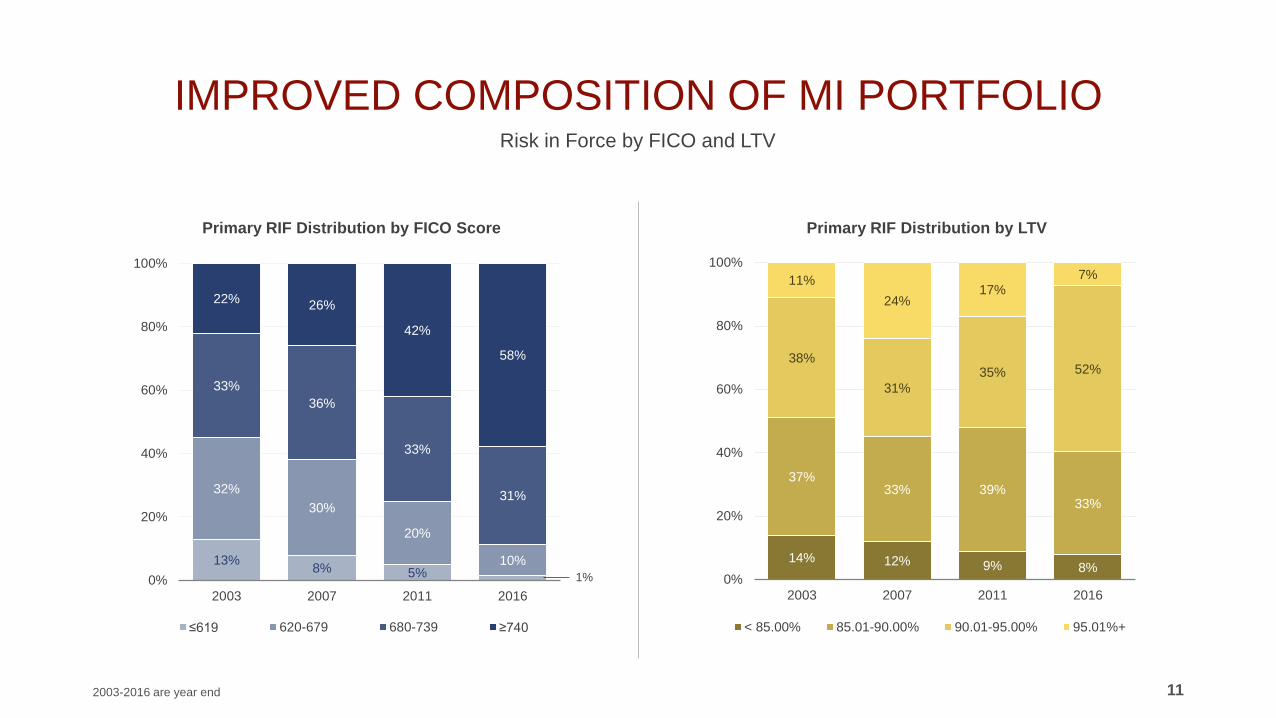
IMPROVED COMPOSITION OF MI PORTFOLIO Risk in Force by FICO and LTV
11
13% 8% 5%
32% 30%
20%
10%
33% 36%
33%
31%
22% 26%
42%
58%
0%
20%
40%
60%
80%
100%
2003 2007 2011 2016
≤619 620-679 680-739 ≥740
14% 12% 9% 8%
37% 33% 39%
33%
38%
31% 35% 52%
11% 24%
17% 7%
0%
20%
40%
60%
80%
100%
2003 2007 2011 2016
< 85.00% 85.01-90.00% 90.01-95.00% 95.01%+
Primary RIF Distribution by FICO Score Primary RIF Distribution by LTV
2003-2016 are year end
1%
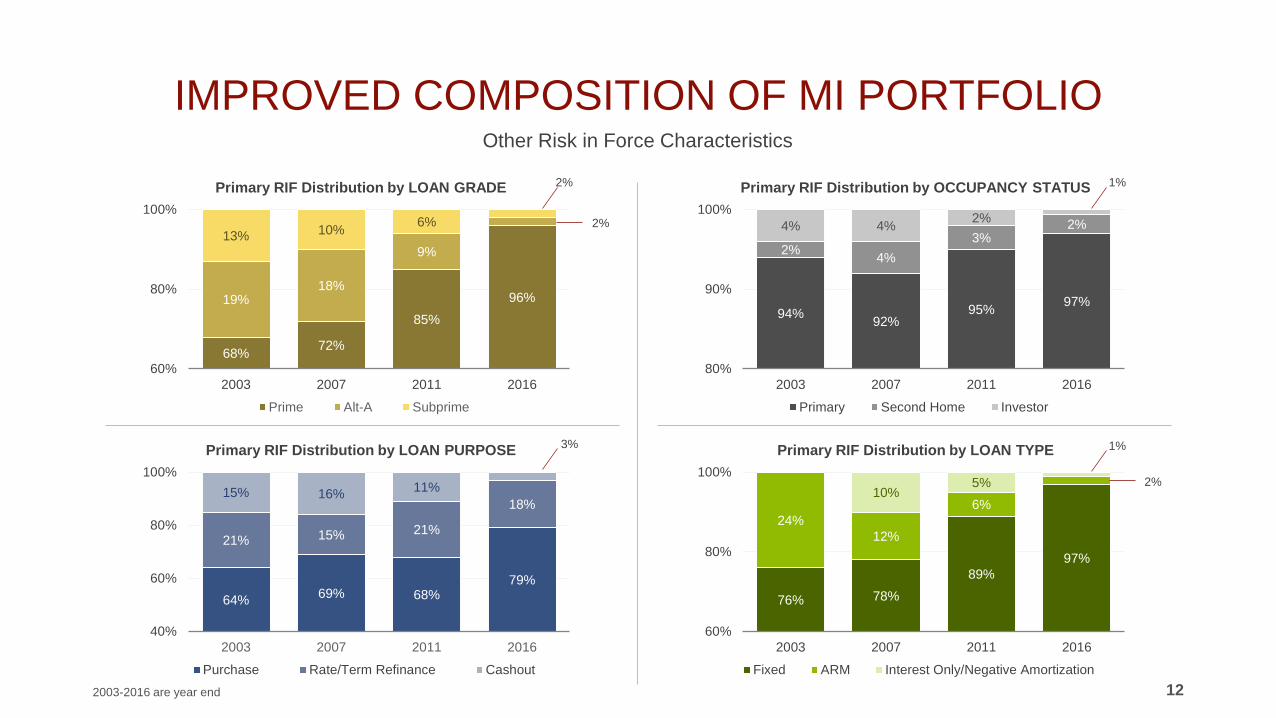
IMPROVED COMPOSITION OF MI PORTFOLIO Other Risk in Force Characteristics
12
68% 72%
85%
96% 19% 18%
9% 13% 10% 6%
60%
80%
100%
2003 2007 2011 2016
Prime Alt-A Subprime
Primary RIF Distribution by LOAN GRADE
2003-2016 are year end
94% 92% 95% 97%
2% 4% 3%
2% 4% 4% 2%
80%
90%
100%
2003 2007 2011 2016
Primary Second Home Investor
Primary RIF Distribution by OCCUPANCY STATUS
64% 69% 68% 79%
21% 15% 21%
18% 15% 16% 11%
40%
60%
80%
100%
2003 2007 2011 2016
Purchase Rate/Term Refinance Cashout
Primary RIF Distribution by LOAN PURPOSE
76% 78% 89%
97%
24% 12%
6% 10%
5%
60%
80%
100%
2003 2007 2011 2016
Fixed ARM Interest Only/Negative Amortization
Primary RIF Distribution by LOAN TYPE
2%
1% 3%
2%
2%
1%
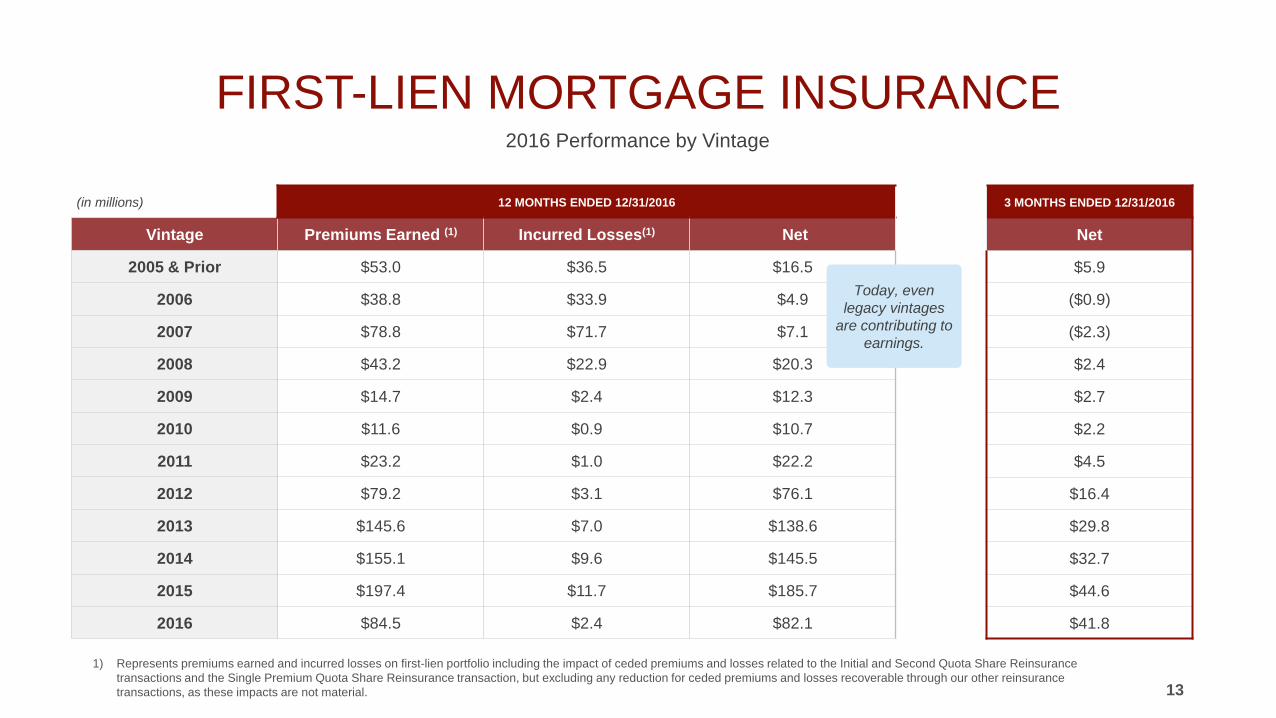
(in millions) 12 MONTHS ENDED 12/31/2016
Vintage Premiums Earned (1) Incurred Losses(1) Net
2005 & Prior $53.0 $36.5 $16.5
2006 $38.8 $33.9 $4.9
2007 $78.8 $71.7 $7.1
2008 $43.2 $22.9 $20.3
2009 $14.7 $2.4 $12.3
2010 $11.6 $0.9 $10.7
2011 $23.2 $1.0 $22.2
2012 $79.2 $3.1 $76.1
2013 $145.6 $7.0 $138.6
2014 $155.1 $9.6 $145.5
2015 $197.4 $11.7 $185.7
2016 $84.5 $2.4 $82.1
FIRST-LIEN MORTGAGE INSURANCE 2016 Performance by Vintage
13 1) Represents premiums earned and incurred losses on first-lien portfolio including the impact of ceded premiums and losses related to the Initial and Second Quota Share Reinsurance
transactions and the Single Premium Quota Share Reinsurance transaction, but excluding any reduction for ceded premiums and losses recoverable through our other reinsurance transactions, as these impacts are not material.
Today, even legacy vintages
are contributing to earnings.
3 MONTHS ENDED 12/31/2016
Net
$5.9
($0.9)
($2.3)
$2.4
$2.7
$2.2
$4.5
$16.4
$29.8
$32.7
$44.6
$41.8
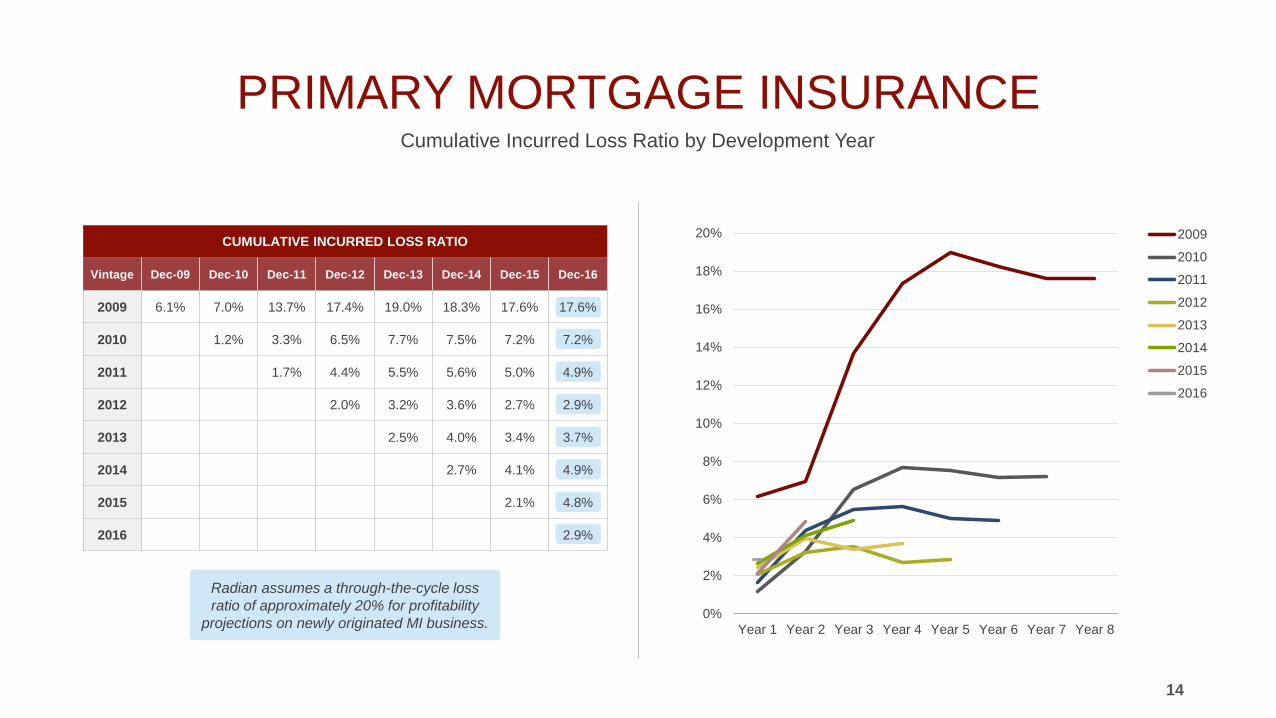
PRIMARY MORTGAGE INSURANCE Cumulative Incurred Loss Ratio by Development Year
14
CUMULATIVE INCURRED LOSS RATIO
Vintage Dec-09 Dec-10 Dec-11 Dec-12 Dec-13 Dec-14 Dec-15 Dec-16
2009 6.1% 7.0% 13.7% 17.4% 19.0% 18.3% 17.6% 17.6%
2010 1.2% 3.3% 6.5% 7.7% 7.5% 7.2% 7.2%
2011 1.7% 4.4% 5.5% 5.6% 5.0% 4.9%
2012 2.0% 3.2% 3.6% 2.7% 2.9%
2013 2.5% 4.0% 3.4% 3.7%
2014 2.7% 4.1% 4.9%
2015 2.1% 4.8%
2016 2.9%
Radian assumes a through-the-cycle loss ratio of approximately 20% for profitability
projections on newly originated MI business. 0%
2%
4%
6%
8%
10%
12%
14%
16%
18%
20%
Year 1 Year 2 Year 3 Year 4 Year 5 Year 6 Year 7 Year 8
2009
2010
2011
2012
2013
2014
2015
2016
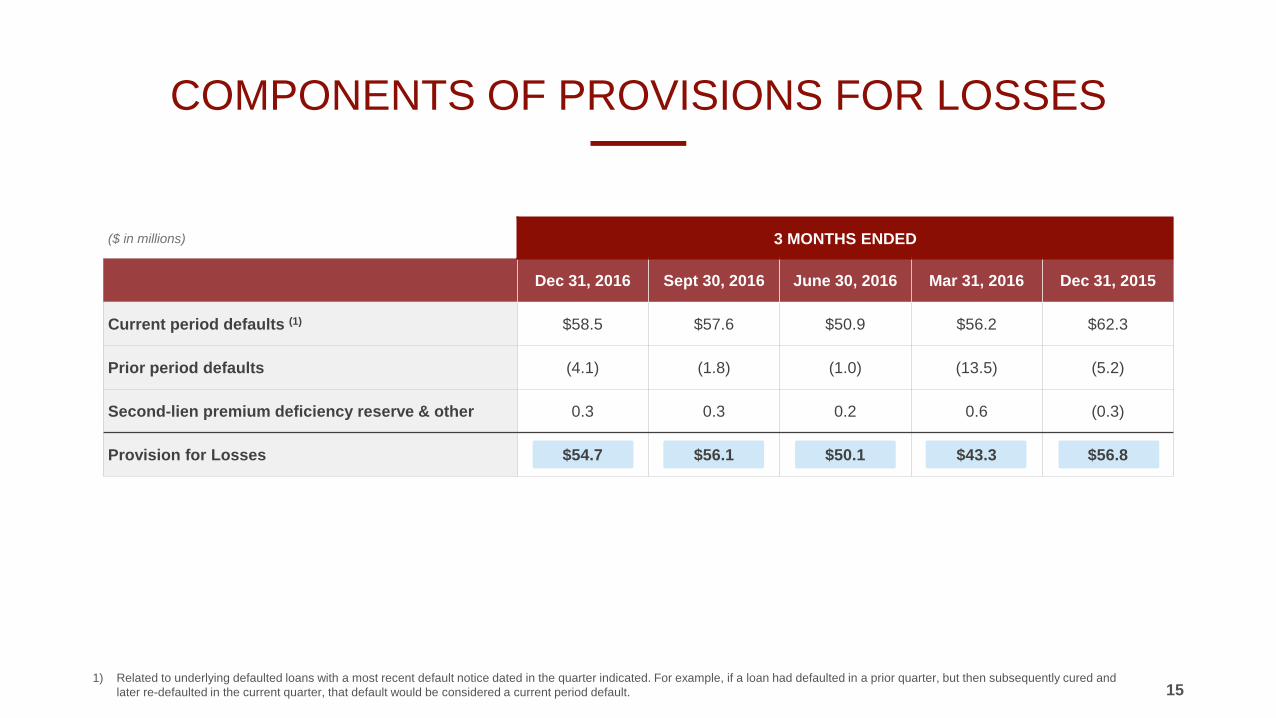
COMPONENTS OF PROVISIONS FOR LOSSES
15 1) Related to underlying defaulted loans with a most recent default notice dated in the quarter indicated. For example, if a loan had defaulted in a prior quarter, but then subsequently cured and
later re-defaulted in the current quarter, that default would be considered a current period default.
($ in millions) 3 MONTHS ENDED
Dec 31, 2016 Sept 30, 2016 June 30, 2016 Mar 31, 2016 Dec 31, 2015
Current period defaults (1) $58.5 $57.6 $50.9 $56.2 $62.3
Prior period defaults (4.1) (1.8) (1.0) (13.5) (5.2)
Second-lien premium deficiency reserve & other 0.3 0.3 0.2 0.6 (0.3)
Provision for Losses $54.7 $56.1 $50.1 $43.3 $56.8
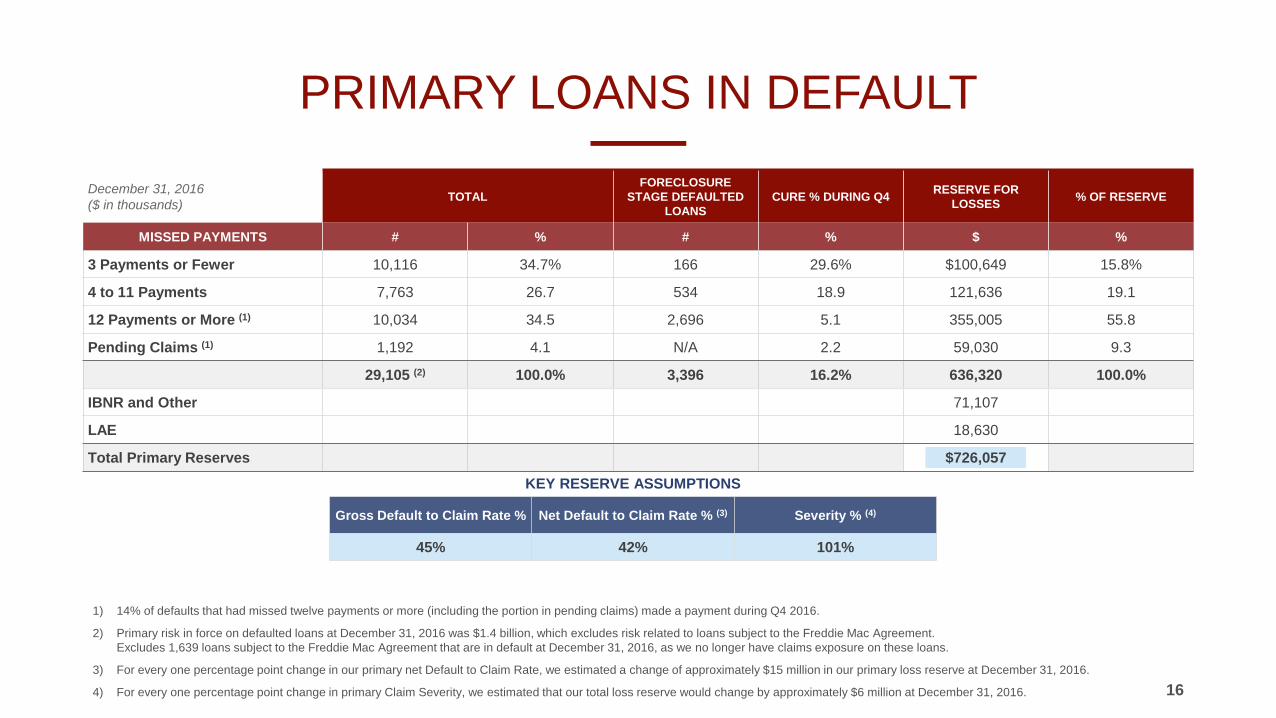
PRIMARY LOANS IN DEFAULT
16
1) 14% of defaults that had missed twelve payments or more (including the portion in pending claims) made a payment during Q4 2016.
2) Primary risk in force on defaulted loans at December 31, 2016 was $1.4 billion, which excludes risk related to loans subject to the Freddie Mac Agreement. Excludes 1,639 loans subject to the Freddie Mac Agreement that are in default at December 31, 2016, as we no longer have claims exposure on these loans.
3) For every one percentage point change in our primary net Default to Claim Rate, we estimated a change of approximately $15 million in our primary loss reserve at December 31, 2016.
4) For every one percentage point change in primary Claim Severity, we estimated that our total loss reserve would change by approximately $6 million at December 31, 2016.
December 31, 2016 ($ in thousands) TOTAL
FORECLOSURE STAGE DEFAULTED
LOANS CURE % DURING Q4 RESERVE FOR
LOSSES % OF RESERVE
MISSED PAYMENTS # % # % $ %
3 Payments or Fewer 10,116 34.7% 166 29.6% $100,649 15.8%
4 to 11 Payments 7,763 26.7 534 18.9 121,636 19.1
12 Payments or More (1) 10,034 34.5 2,696 5.1 355,005 55.8
Pending Claims (1) 1,192 4.1 N/A 2.2 59,030 9.3
29,105 (2) 100.0% 3,396 16.2% 636,320 100.0%
IBNR and Other 71,107
LAE 18,630
Total Primary Reserves $726,057
KEY RESERVE ASSUMPTIONS
Gross Default to Claim Rate % Net Default to Claim Rate % (3) Severity % (4)
45% 42% 101%
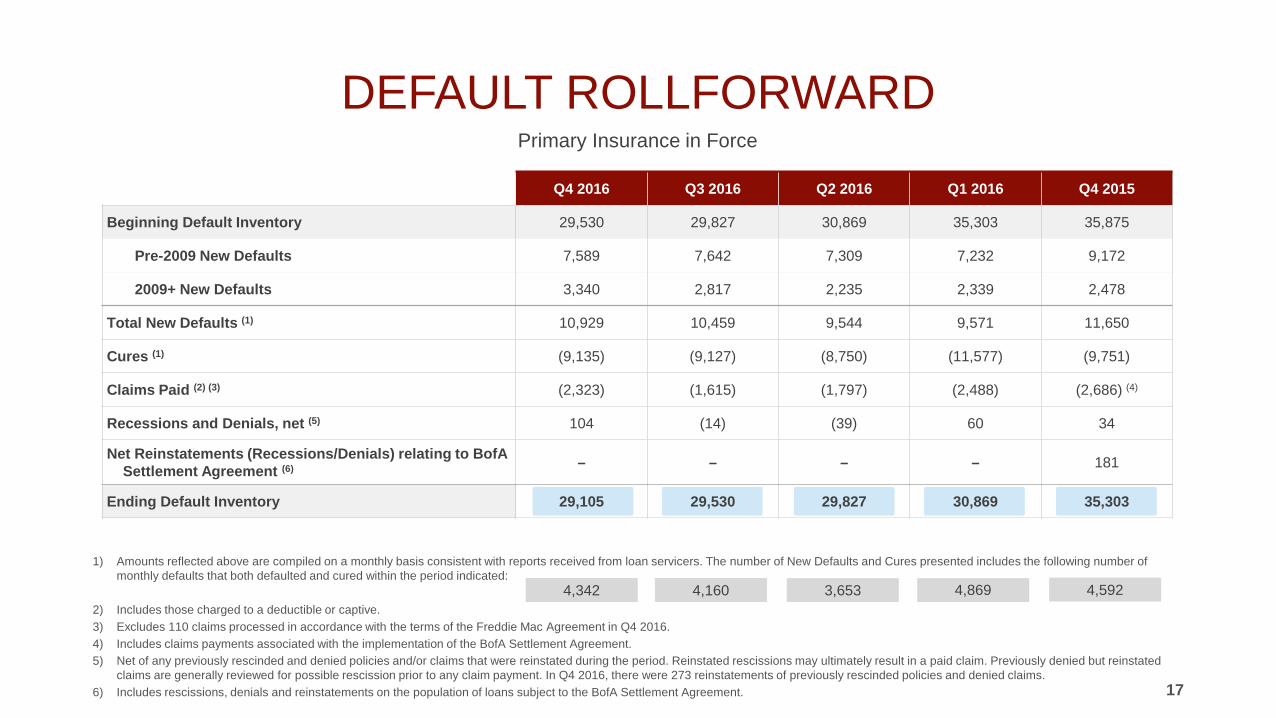
DEFAULT ROLLFORWARD Primary Insurance in Force
17
1) Amounts reflected above are compiled on a monthly basis consistent with reports received from loan servicers. The number of New Defaults and Cures presented includes the following number of monthly defaults that both defaulted and cured within the period indicated:
2) Includes those charged to a deductible or captive. 3) Excludes 110 claims processed in accordance with the terms of the Freddie Mac Agreement in Q4 2016. 4) Includes claims payments associated with the implementation of the BofA Settlement Agreement. 5) Net of any previously rescinded and denied policies and/or claims that were reinstated during the period. Reinstated rescissions may ultimately result in a paid claim. Previously denied but reinstated
claims are generally reviewed for possible rescission prior to any claim payment. In Q4 2016, there were 273 reinstatements of previously rescinded policies and denied claims. 6) Includes rescissions, denials and reinstatements on the population of loans subject to the BofA Settlement Agreement.
Q4 2016 Q3 2016 Q2 2016 Q1 2016 Q4 2015
Beginning Default Inventory 29,530 29,827 30,869 35,303 35,875
Pre-2009 New Defaults 7,589 7,642 7,309 7,232 9,172
2009+ New Defaults 3,340 2,817 2,235 2,339 2,478
Total New Defaults (1) 10,929 10,459 9,544 9,571 11,650
Cures (1) (9,135) (9,127) (8,750) (11,577) (9,751)
Claims Paid (2) (3) (2,323) (1,615) (1,797) (2,488) (2,686) (4)
Recessions and Denials, net (5) 104 (14) (39) 60 34
Net Reinstatements (Recessions/Denials) relating to BofA Settlement Agreement (6) – – – – 181
Ending Default Inventory 29,105 29,530 29,827 30,869 35,303
3,653 4,160 4,342 4,869 4,592

18
MORTGAGE AND REAL ESTATE SERVICES
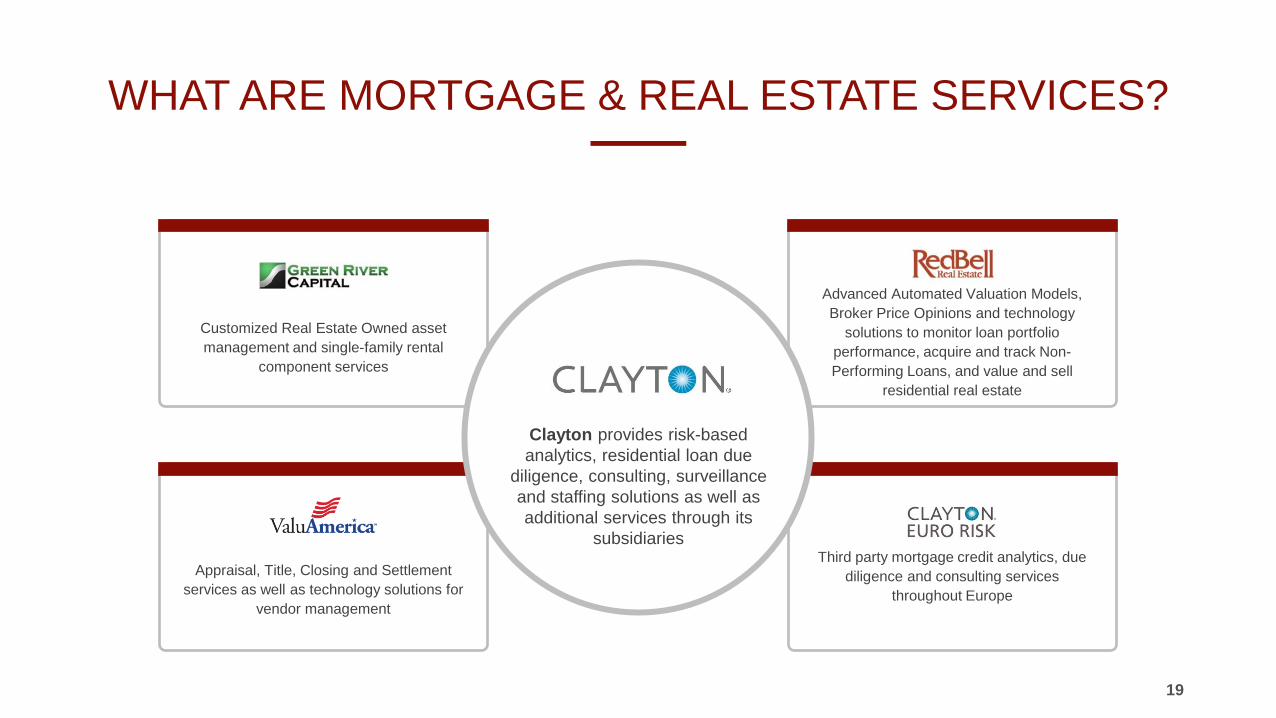
WHAT ARE MORTGAGE & REAL ESTATE SERVICES?
19
Appraisal, Title, Closing and Settlement services as well as technology solutions for
vendor management
Third party mortgage credit analytics, due diligence and consulting services
throughout Europe
Advanced Automated Valuation Models, Broker Price Opinions and technology
solutions to monitor loan portfolio performance, acquire and track Non-Performing Loans, and value and sell
residential real estate
Customized Real Estate Owned asset management and single-family rental
component services
Clayton provides risk-based analytics, residential loan due
diligence, consulting, surveillance and staffing solutions as well as additional services through its
subsidiaries
$0
$20
$40
$60
$80
$100
$120
$140
$160
$180
$200
2014 2015 2016
Eurorisk
Surveillance
REO management
Real estate valuation andcomponent services
Loan review, underwriting anddue diligence
(2)
(3)
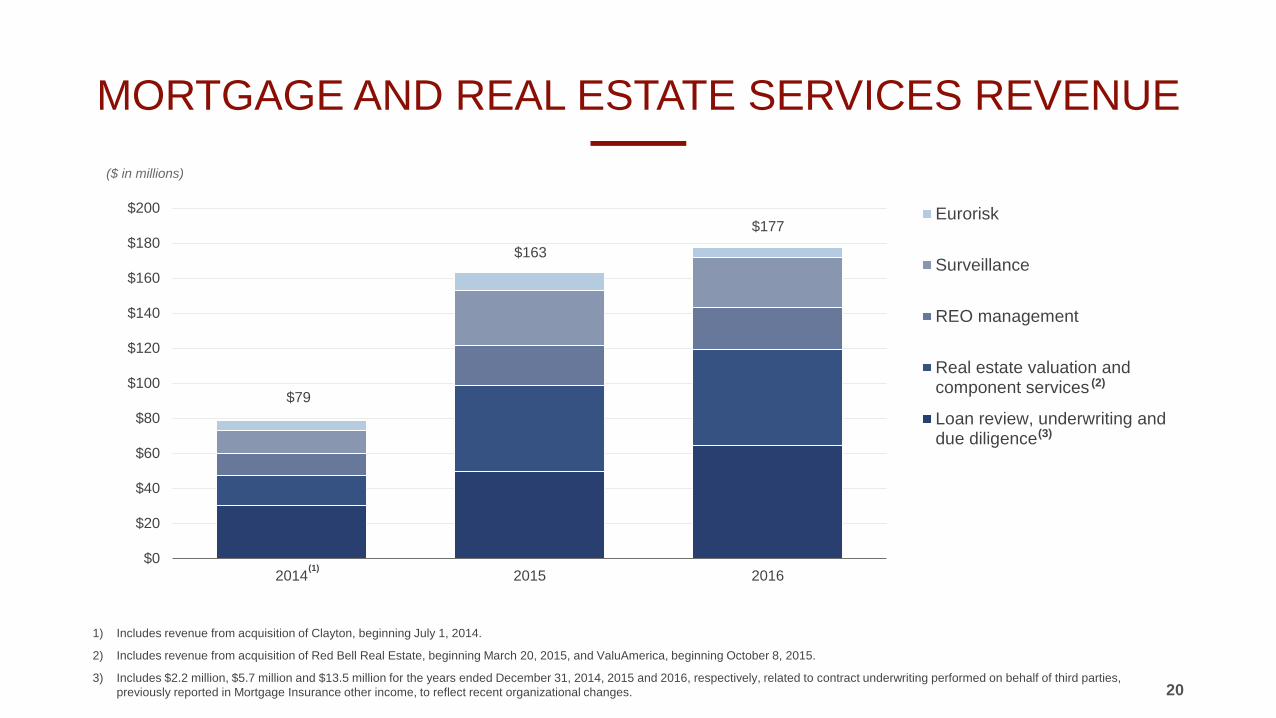
MORTGAGE AND REAL ESTATE SERVICES REVENUE
20
1) Includes revenue from acquisition of Clayton, beginning July 1, 2014.
2) Includes revenue from acquisition of Red Bell Real Estate, beginning March 20, 2015, and ValuAmerica, beginning October 8, 2015.
3) Includes $2.2 million, $5.7 million and $13.5 million for the years ended December 31, 2014, 2015 and 2016, respectively, related to contract underwriting performed on behalf of third parties, previously reported in Mortgage Insurance other income, to reflect recent organizational changes.
$177
$79
$163
($ in millions)
(1)
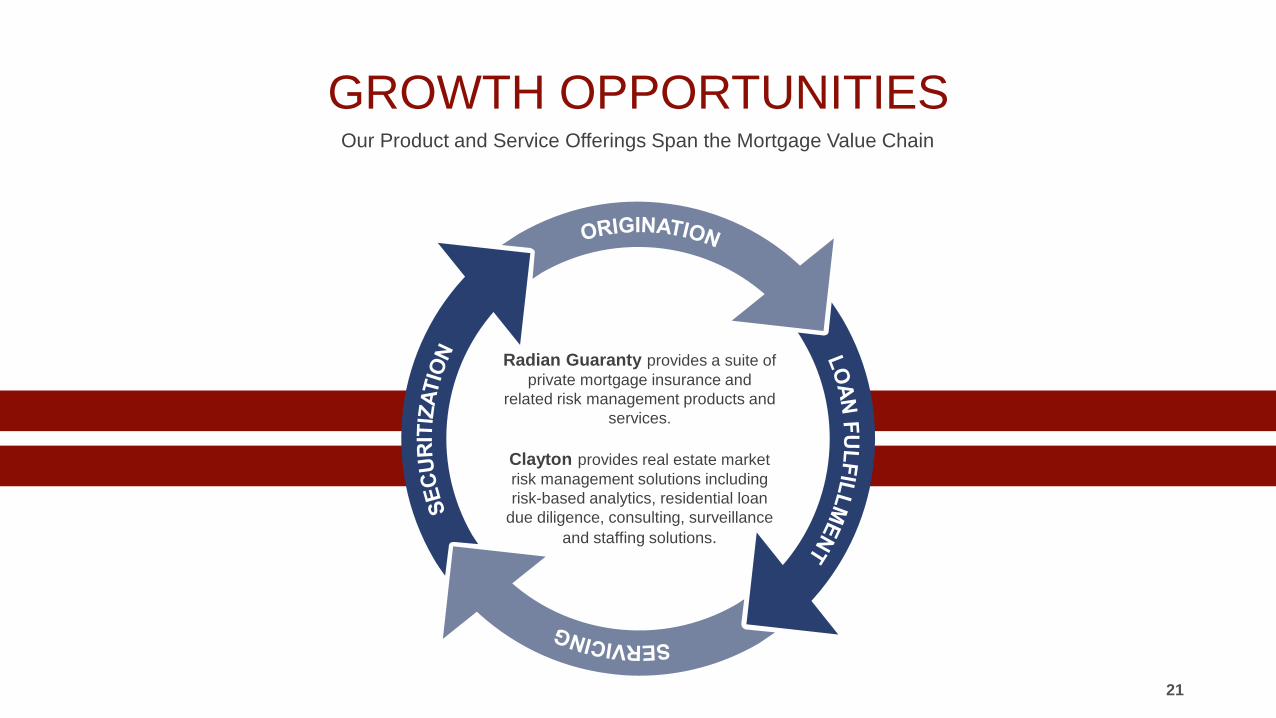
GROWTH OPPORTUNITIES Our Product and Service Offerings Span the Mortgage Value Chain
21
Radian Guaranty provides a suite of private mortgage insurance and
related risk management products and services.
Clayton provides real estate market risk management solutions including risk-based analytics, residential loan
due diligence, consulting, surveillance and staffing solutions.

CAPITAL AND DEBT STRUCTURE
22
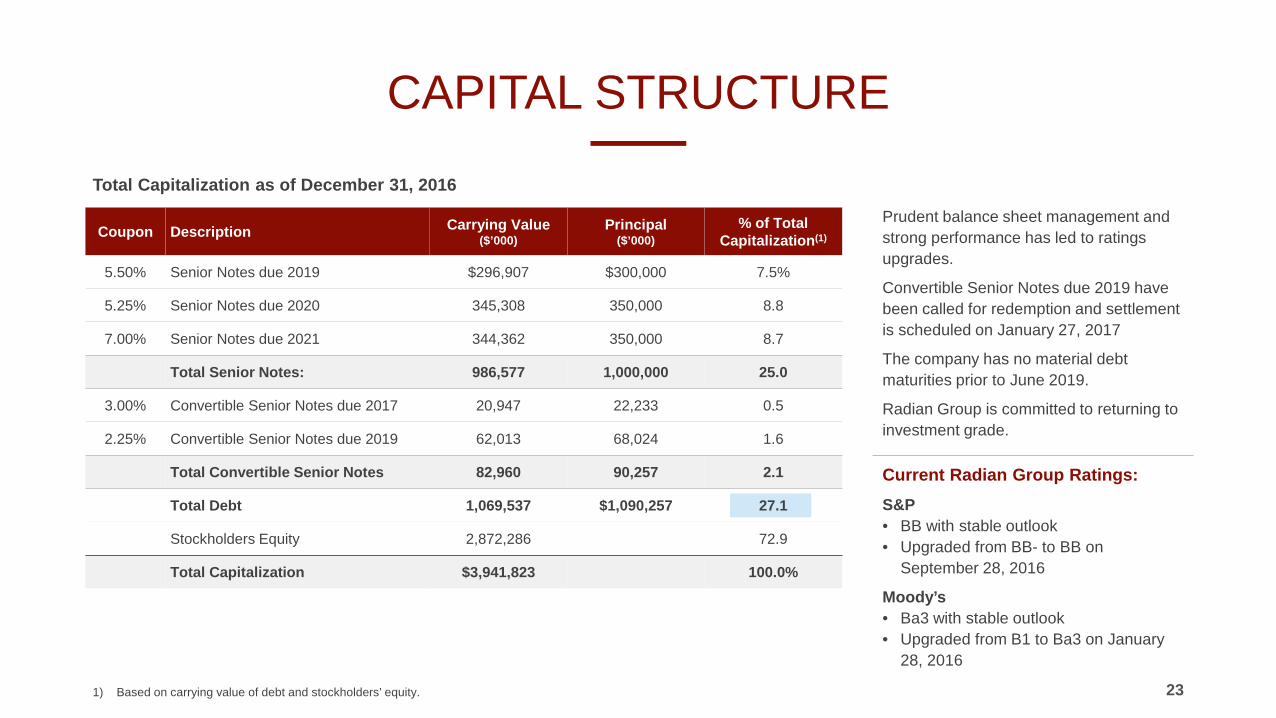
CAPITAL STRUCTURE
23 1) Based on carrying value of debt and stockholders’ equity.
Coupon Description Carrying Value ($’000)
Principal ($’000)
% of Total Capitalization(1)
5.50% Senior Notes due 2019 $296,907 $300,000 7.5%
5.25% Senior Notes due 2020 345,308 350,000 8.8
7.00% Senior Notes due 2021 344,362 350,000 8.7
Total Senior Notes: 986,577 1,000,000 25.0
3.00% Convertible Senior Notes due 2017 20,947 22,233 0.5
2.25% Convertible Senior Notes due 2019 62,013 68,024 1.6
Total Convertible Senior Notes 82,960 90,257 2.1
Total Debt 1,069,537 $1,090,257 27.1
Stockholders Equity 2,872,286 72.9
Total Capitalization $3,941,823 100.0%
Prudent balance sheet management and strong performance has led to ratings upgrades.
Convertible Senior Notes due 2019 have been called for redemption and settlement is scheduled on January 27, 2017
The company has no material debt maturities prior to June 2019.
Radian Group is committed to returning to investment grade. Current Radian Group Ratings: S&P • BB with stable outlook • Upgraded from BB- to BB on
September 28, 2016
Moody’s • Ba3 with stable outlook • Upgraded from B1 to Ba3 on January
28, 2016
Total Capitalization as of December 31, 2016
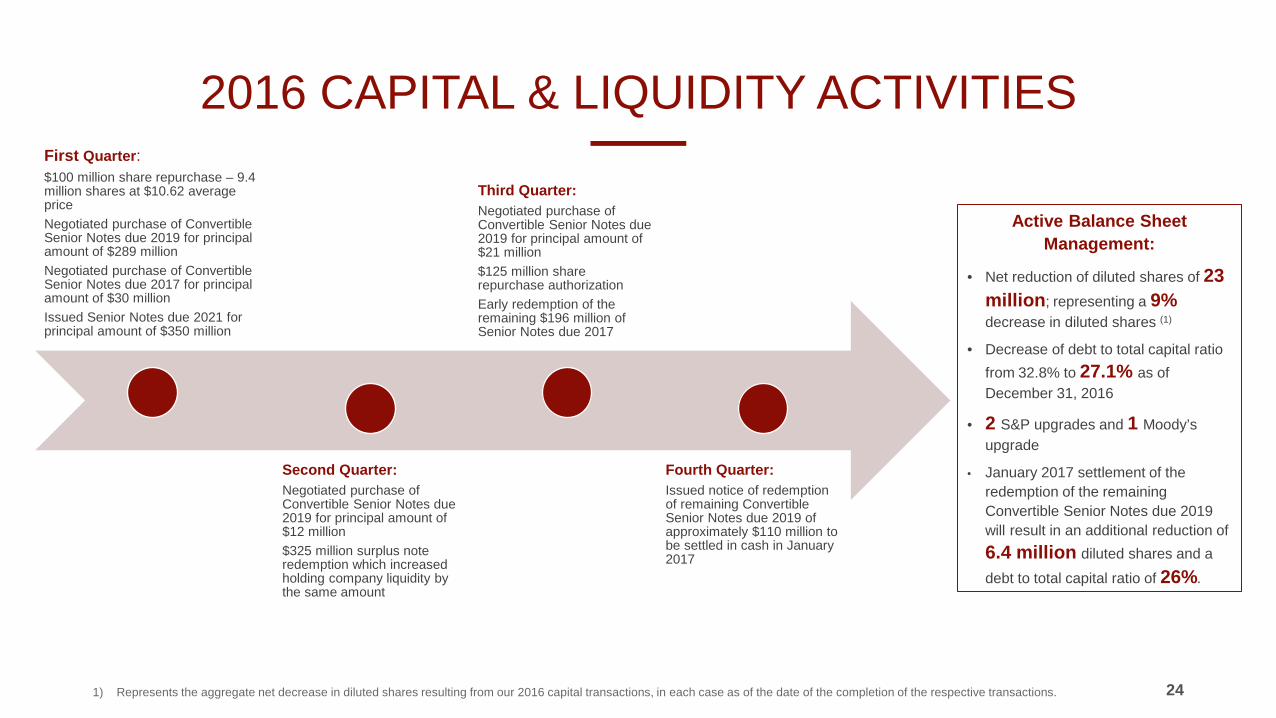
2016 CAPITAL & LIQUIDITY ACTIVITIES
24
Active Balance Sheet Management:
• Net reduction of diluted shares of 23 million; representing a 9% decrease in diluted shares (1)
• Decrease of debt to total capital ratio from 32.8% to 27.1% as of December 31, 2016
• 2 S&P upgrades and 1 Moody’s upgrade
• January 2017 settlement of the redemption of the remaining Convertible Senior Notes due 2019 will result in an additional reduction of 6.4 million diluted shares and a
debt to total capital ratio of 26%.
First Quarter: $100 million share repurchase – 9.4 million shares at $10.62 average price Negotiated purchase of Convertible Senior Notes due 2019 for principal amount of $289 million Negotiated purchase of Convertible Senior Notes due 2017 for principal amount of $30 million Issued Senior Notes due 2021 for principal amount of $350 million
Second Quarter: Negotiated purchase of Convertible Senior Notes due 2019 for principal amount of $12 million $325 million surplus note redemption which increased holding company liquidity by the same amount
Third Quarter: Negotiated purchase of Convertible Senior Notes due 2019 for principal amount of $21 million $125 million share repurchase authorization Early redemption of the remaining $196 million of Senior Notes due 2017
Fourth Quarter: Issued notice of redemption of remaining Convertible Senior Notes due 2019 of approximately $110 million to be settled in cash in January 2017
1) Represents the aggregate net decrease in diluted shares resulting from our 2016 capital transactions, in each case as of the date of the completion of the respective transactions.
25
Consolidated Non-GAAP Financial Measures Reconciliations
26
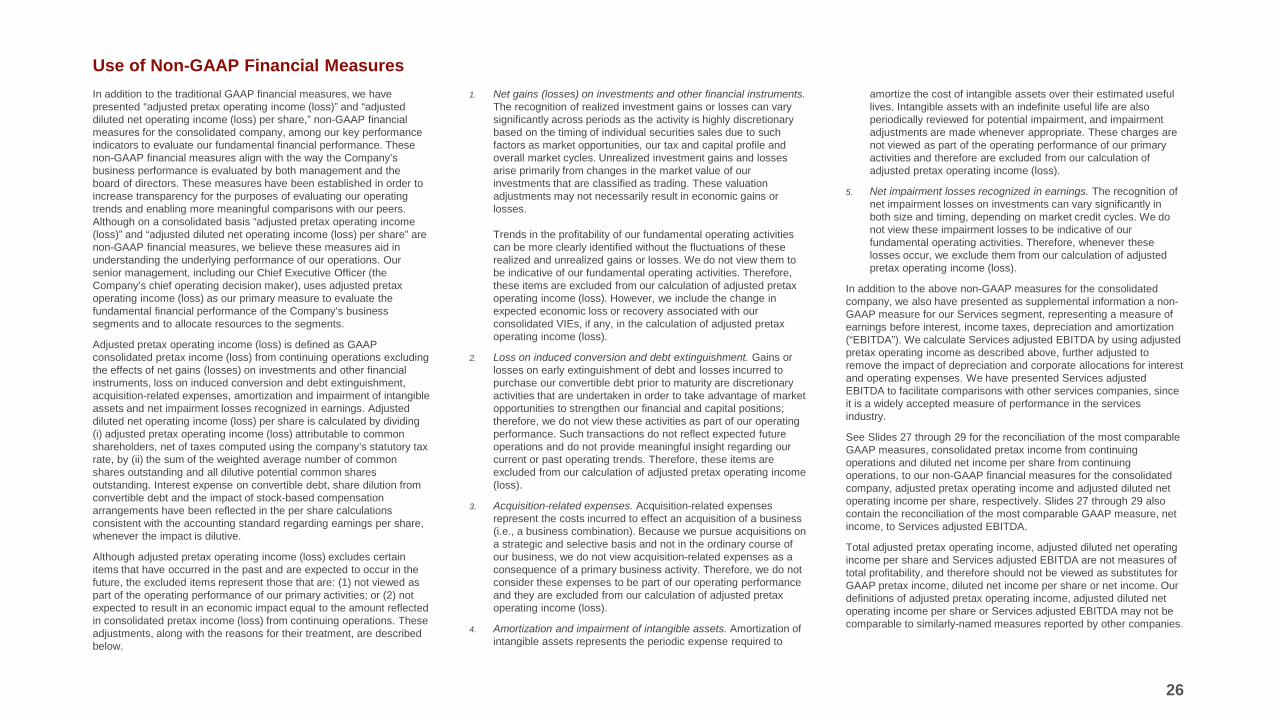
In addition to the traditional GAAP financial measures, we have presented “adjusted pretax operating income (loss)” and “adjusted diluted net operating income (loss) per share,” non-GAAP financial measures for the consolidated company, among our key performance indicators to evaluate our fundamental financial performance. These non-GAAP financial measures align with the way the Company’s business performance is evaluated by both management and the board of directors. These measures have been established in order to increase transparency for the purposes of evaluating our operating trends and enabling more meaningful comparisons with our peers. Although on a consolidated basis “adjusted pretax operating income (loss)” and “adjusted diluted net operating income (loss) per share” are non-GAAP financial measures, we believe these measures aid in understanding the underlying performance of our operations. Our senior management, including our Chief Executive Officer (the Company’s chief operating decision maker), uses adjusted pretax operating income (loss) as our primary measure to evaluate the fundamental financial performance of the Company’s business segments and to allocate resources to the segments.
Adjusted pretax operating income (loss) is defined as GAAP consolidated pretax income (loss) from continuing operations excluding the effects of net gains (losses) on investments and other financial instruments, loss on induced conversion and debt extinguishment, acquisition-related expenses, amortization and impairment of intangible assets and net impairment losses recognized in earnings. Adjusted diluted net operating income (loss) per share is calculated by dividing (i) adjusted pretax operating income (loss) attributable to common shareholders, net of taxes computed using the company’s statutory tax rate, by (ii) the sum of the weighted average number of common shares outstanding and all dilutive potential common shares outstanding. Interest expense on convertible debt, share dilution from convertible debt and the impact of stock-based compensation arrangements have been reflected in the per share calculations consistent with the accounting standard regarding earnings per share, whenever the impact is dilutive.
Although adjusted pretax operating income (loss) excludes certain items that have occurred in the past and are expected to occur in the future, the excluded items represent those that are: (1) not viewed as part of the operating performance of our primary activities; or (2) not expected to result in an economic impact equal to the amount reflected in consolidated pretax income (loss) from continuing operations. These adjustments, along with the reasons for their treatment, are described below.
1. Net gains (losses) on investments and other financial instruments. The recognition of realized investment gains or losses can vary significantly across periods as the activity is highly discretionary based on the timing of individual securities sales due to such factors as market opportunities, our tax and capital profile and overall market cycles. Unrealized investment gains and losses arise primarily from changes in the market value of our investments that are classified as trading. These valuation adjustments may not necessarily result in economic gains or losses. Trends in the profitability of our fundamental operating activities can be more clearly identified without the fluctuations of these realized and unrealized gains or losses. We do not view them to be indicative of our fundamental operating activities. Therefore, these items are excluded from our calculation of adjusted pretax operating income (loss). However, we include the change in expected economic loss or recovery associated with our consolidated VIEs, if any, in the calculation of adjusted pretax operating income (loss).
2. Loss on induced conversion and debt extinguishment. Gains or losses on early extinguishment of debt and losses incurred to purchase our convertible debt prior to maturity are discretionary activities that are undertaken in order to take advantage of market opportunities to strengthen our financial and capital positions; therefore, we do not view these activities as part of our operating performance. Such transactions do not reflect expected future operations and do not provide meaningful insight regarding our current or past operating trends. Therefore, these items are excluded from our calculation of adjusted pretax operating income (loss).
3. Acquisition-related expenses. Acquisition-related expenses represent the costs incurred to effect an acquisition of a business (i.e., a business combination). Because we pursue acquisitions on a strategic and selective basis and not in the ordinary course of our business, we do not view acquisition-related expenses as a consequence of a primary business activity. Therefore, we do not consider these expenses to be part of our operating performance and they are excluded from our calculation of adjusted pretax operating income (loss).
4. Amortization and impairment of intangible assets. Amortization of intangible assets represents the periodic expense required to
amortize the cost of intangible assets over their estimated useful lives. Intangible assets with an indefinite useful life are also periodically reviewed for potential impairment, and impairment adjustments are made whenever appropriate. These charges are not viewed as part of the operating performance of our primary activities and therefore are excluded from our calculation of adjusted pretax operating income (loss).
5. Net impairment losses recognized in earnings. The recognition of net impairment losses on investments can vary significantly in both size and timing, depending on market credit cycles. We do not view these impairment losses to be indicative of our fundamental operating activities. Therefore, whenever these losses occur, we exclude them from our calculation of adjusted pretax operating income (loss).
In addition to the above non-GAAP measures for the consolidated company, we also have presented as supplemental information a non-GAAP measure for our Services segment, representing a measure of earnings before interest, income taxes, depreciation and amortization (“EBITDA”). We calculate Services adjusted EBITDA by using adjusted pretax operating income as described above, further adjusted to remove the impact of depreciation and corporate allocations for interest and operating expenses. We have presented Services adjusted EBITDA to facilitate comparisons with other services companies, since it is a widely accepted measure of performance in the services industry.
See Slides 27 through 29 for the reconciliation of the most comparable GAAP measures, consolidated pretax income from continuing operations and diluted net income per share from continuing operations, to our non-GAAP financial measures for the consolidated company, adjusted pretax operating income and adjusted diluted net operating income per share, respectively. Slides 27 through 29 also contain the reconciliation of the most comparable GAAP measure, net income, to Services adjusted EBITDA.
Total adjusted pretax operating income, adjusted diluted net operating income per share and Services adjusted EBITDA are not measures of total profitability, and therefore should not be viewed as substitutes for GAAP pretax income, diluted net income per share or net income. Our definitions of adjusted pretax operating income, adjusted diluted net operating income per share or Services adjusted EBITDA may not be comparable to similarly-named measures reported by other companies.
Use of Non-GAAP Financial Measures
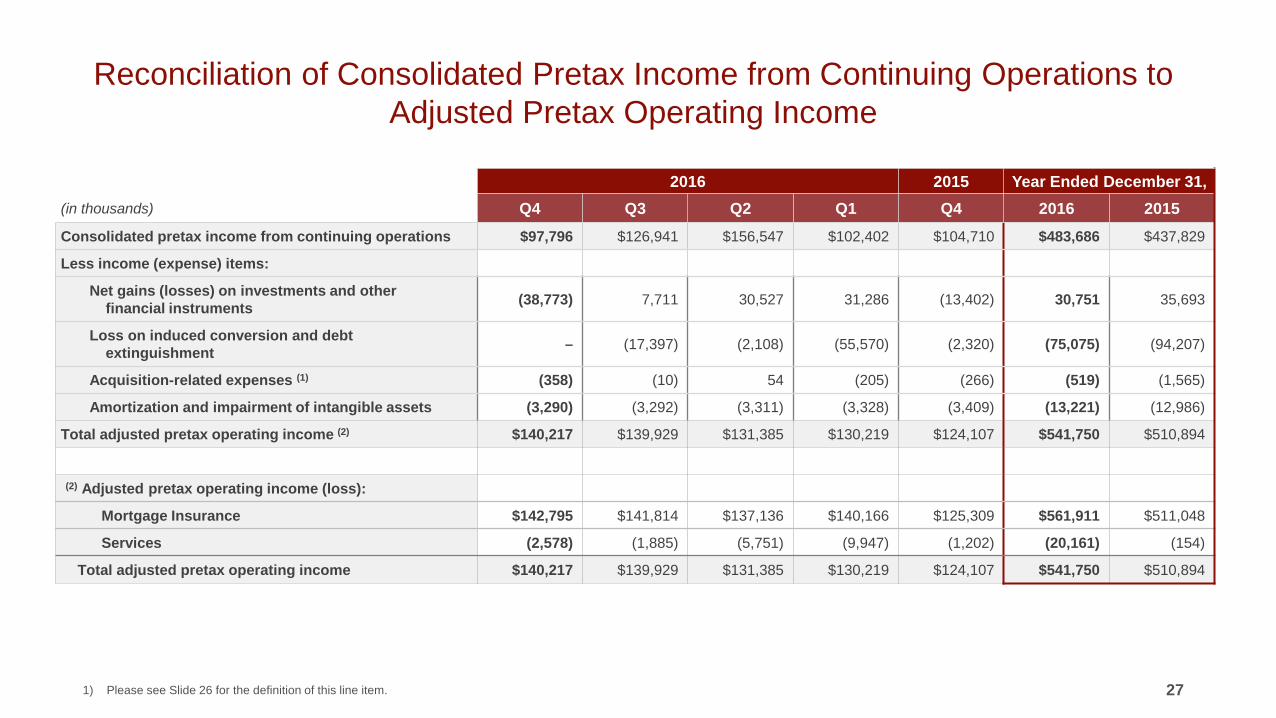
Reconciliation of Consolidated Pretax Income from Continuing Operations to Adjusted Pretax Operating Income
27
2016 2015 Year Ended December 31, (in thousands) Q4 Q3 Q2 Q1 Q4 2016 2015 Consolidated pretax income from continuing operations $97,796 $126,941 $156,547 $102,402 $104,710 $483,686 $437,829
Less income (expense) items:
Net gains (losses) on investments and other financial instruments (38,773) 7,711 30,527 31,286 (13,402) 30,751 35,693
Loss on induced conversion and debt extinguishment – (17,397) (2,108) (55,570) (2,320) (75,075) (94,207)
Acquisition-related expenses (1) (358) (10) 54 (205) (266) (519) (1,565)
Amortization and impairment of intangible assets (3,290) (3,292) (3,311) (3,328) (3,409) (13,221) (12,986)
Total adjusted pretax operating income (2) $140,217 $139,929 $131,385 $130,219 $124,107 $541,750 $510,894
(2) Adjusted pretax operating income (loss):
Mortgage Insurance $142,795 $141,814 $137,136 $140,166 $125,309 $561,911 $511,048
Services (2,578) (1,885) (5,751) (9,947) (1,202) (20,161) (154)
Total adjusted pretax operating income $140,217 $139,929 $131,385 $130,219 $124,107 $541,750 $510,894
1) Please see Slide 26 for the definition of this line item.
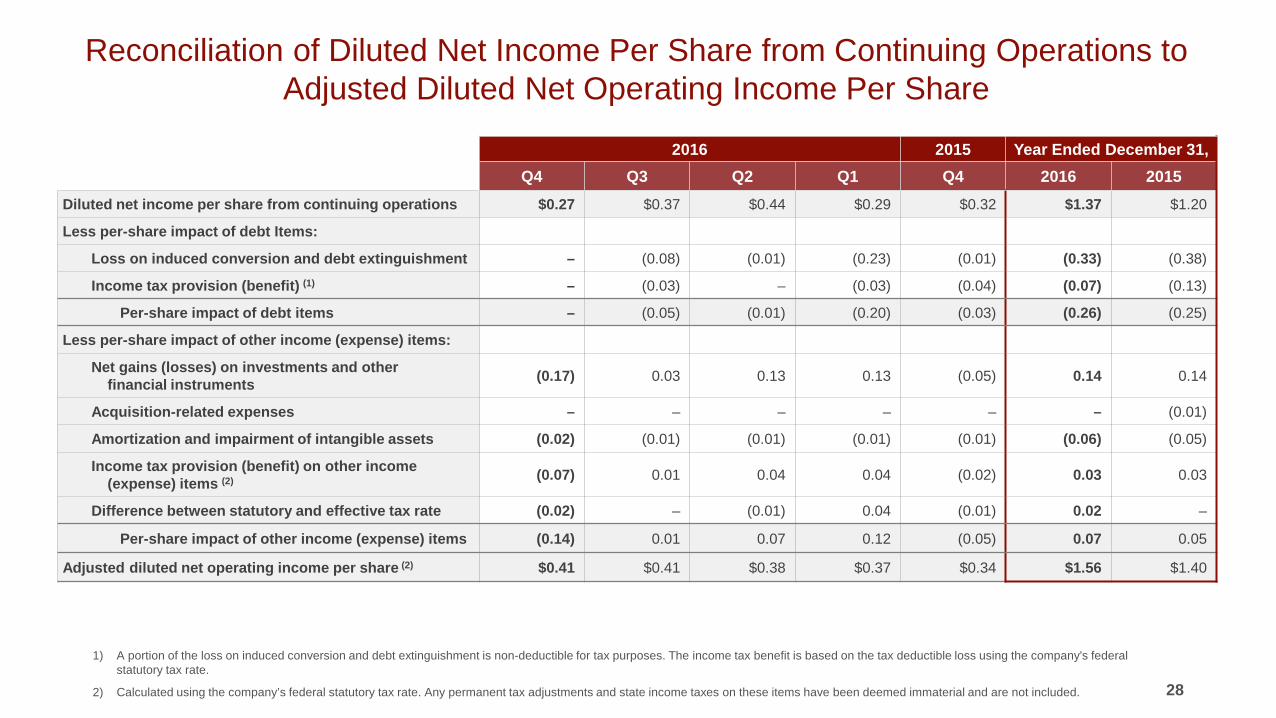
Reconciliation of Diluted Net Income Per Share from Continuing Operations to Adjusted Diluted Net Operating Income Per Share
28
2016 2015 Year Ended December 31, Q4 Q3 Q2 Q1 Q4 2016 2015
Diluted net income per share from continuing operations $0.27 $0.37 $0.44 $0.29 $0.32 $1.37 $1.20
Less per-share impact of debt Items:
Loss on induced conversion and debt extinguishment – (0.08) (0.01) (0.23) (0.01) (0.33) (0.38)
Income tax provision (benefit) (1) – (0.03) – (0.03) (0.04) (0.07) (0.13)
Per-share impact of debt items – (0.05) (0.01) (0.20) (0.03) (0.26) (0.25)
Less per-share impact of other income (expense) items:
Net gains (losses) on investments and other financial instruments (0.17) 0.03 0.13 0.13 (0.05) 0.14 0.14
Acquisition-related expenses – – – – – – (0.01)
Amortization and impairment of intangible assets (0.02) (0.01) (0.01) (0.01) (0.01) (0.06) (0.05)
Income tax provision (benefit) on other income (expense) items (2) (0.07) 0.01 0.04 0.04 (0.02) 0.03 0.03
Difference between statutory and effective tax rate (0.02) – (0.01) 0.04 (0.01) 0.02 –
Per-share impact of other income (expense) items (0.14) 0.01 0.07 0.12 (0.05) 0.07 0.05
Adjusted diluted net operating income per share (2) $0.41 $0.41 $0.38 $0.37 $0.34 $1.56 $1.40
1) A portion of the loss on induced conversion and debt extinguishment is non-deductible for tax purposes. The income tax benefit is based on the tax deductible loss using the company's federal statutory tax rate.
2) Calculated using the company’s federal statutory tax rate. Any permanent tax adjustments and state income taxes on these items have been deemed immaterial and are not included.
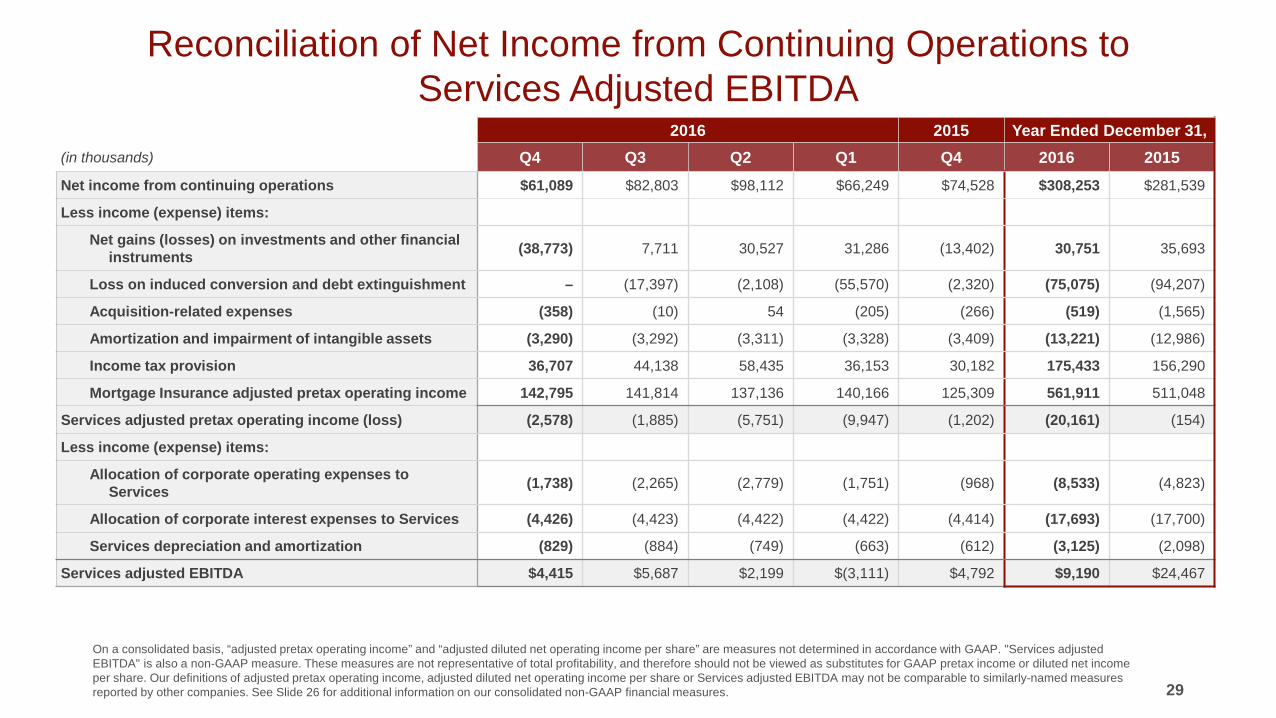
Reconciliation of Net Income from Continuing Operations to Services Adjusted EBITDA
29
2016 2015 Year Ended December 31, (in thousands) Q4 Q3 Q2 Q1 Q4 2016 2015 Net income from continuing operations $61,089 $82,803 $98,112 $66,249 $74,528 $308,253 $281,539
Less income (expense) items:
Net gains (losses) on investments and other financial instruments (38,773) 7,711 30,527 31,286 (13,402) 30,751 35,693
Loss on induced conversion and debt extinguishment – (17,397) (2,108) (55,570) (2,320) (75,075) (94,207)
Acquisition-related expenses (358) (10) 54 (205) (266) (519) (1,565)
Amortization and impairment of intangible assets (3,290) (3,292) (3,311) (3,328) (3,409) (13,221) (12,986)
Income tax provision 36,707 44,138 58,435 36,153 30,182 175,433 156,290
Mortgage Insurance adjusted pretax operating income 142,795 141,814 137,136 140,166 125,309 561,911 511,048
Services adjusted pretax operating income (loss) (2,578) (1,885) (5,751) (9,947) (1,202) (20,161) (154)
Less income (expense) items:
Allocation of corporate operating expenses to Services (1,738) (2,265) (2,779) (1,751) (968) (8,533) (4,823)
Allocation of corporate interest expenses to Services (4,426) (4,423) (4,422) (4,422) (4,414) (17,693) (17,700)
Services depreciation and amortization (829) (884) (749) (663) (612) (3,125) (2,098)
Services adjusted EBITDA $4,415 $5,687 $2,199 $(3,111) $4,792 $9,190 $24,467
On a consolidated basis, “adjusted pretax operating income” and “adjusted diluted net operating income per share” are measures not determined in accordance with GAAP. "Services adjusted EBITDA" is also a non-GAAP measure. These measures are not representative of total profitability, and therefore should not be viewed as substitutes for GAAP pretax income or diluted net income per share. Our definitions of adjusted pretax operating income, adjusted diluted net operating income per share or Services adjusted EBITDA may not be comparable to similarly-named measures reported by other companies. See Slide 26 for additional information on our consolidated non-GAAP financial measures.