Embed Size (px)
Citation preview
Bank Name IT - Banca Carige S.P.A. - Cassa di Risparmio di Genova e
Imperia
LEI Code F1T87K3OQ2OV1UORLH26
IT
NUK_WL_NR_XX
version
1809014
No restructuring
2014 EU-wide Stress Test
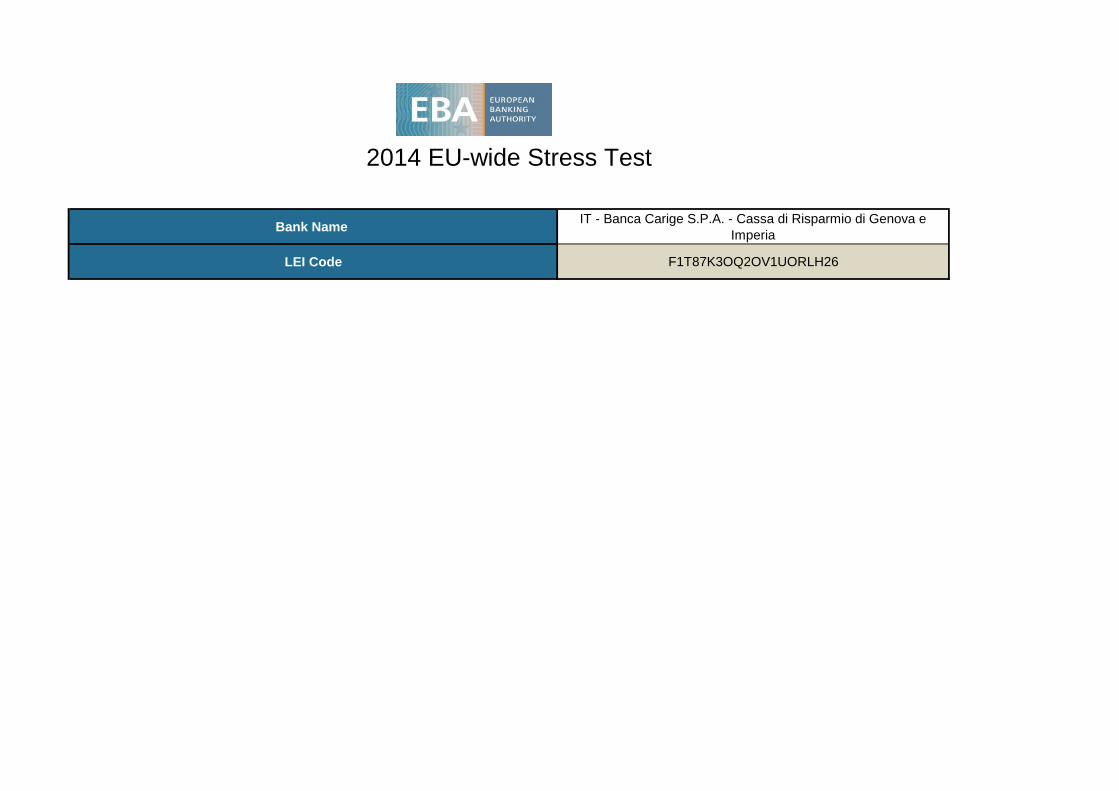
Actual figures as of 31 December 2013 mln EUR, % Actual figures as of 31 December 2013 mln EUR, %
Operating profit before impairments 208 Operating profit before impairments 208
Impairment losses on financial and non-financial assets in the banking book 3,141 Impairment losses on financial and non-financial assets in the banking book 3,141
Common Equity Tier 1 capital (1) 898 Common Equity Tier 1 capital (1) 898
Total Risk Exposure (1) 22,989 Total Risk Exposure (1) 22,989
Common Equity Tier 1 ratio, % (1) 3.9% Common Equity Tier 1 ratio, % (1) 3.9%
Outcome of the adverse scenario as of 31 December 2016 mln EUR, % Outcome of the baseline scenario as of 31 December 2016 mln EUR, %
3 yr cumulative operating profit before impairments 167 3 yr cumulative operating profit before impairments 492
3 yr cumulative impairment losses on financial and non-financial assets in the banking book 1,922 3 yr cumulative impairment losses on financial and non-financial assets in the banking book 959
3 yr cumulative losses from the stress in the trading book 66 3 yr cumulative losses from the stress in the trading book 31
Valuation losses due to sovereign shock after tax and prudential filters 97 Common Equity Tier 1 capital (1) 547
Common Equity Tier 1 capital (1) -551 Total Risk Exposure (1) 23,346
Total Risk Exposure (1) 23,337 Common Equity Tier 1 ratio, % (1) 2.3%
Common Equity Tier 1 ratio, % (1) -2.4%
Memorandum items mln EUR
Memorandum items mln EUR Common EU wide CET1 Threshold (8.0%) 1,868
Common EU wide CET1 Threshold (5.5%) 1,284
Total amount of instruments with mandatory conversion into ordinary shares upon a fixed date in
the 2014 -2016 period (cumulative conversions) (2)0
Total Additional Tier 1 and Tier 2 instruments eligible as regulatory capital under the CRR provisions
that convert into Common Equity Tier 1 or are written down upon a trigger event (3)0
Of which: eligible instruments whose trigger is above CET1 capital ratio in the adverse
scenario (3)0
(2) Conversions not considered for CET1 computation
(3) Excluding instruments with mandatory conversion into ordinary shares upon a fixed date in the 2014 -2016 period
(1) According to CRR/CRD4 definition transitional arrangements as per reporting date. Figures as of 31/12/2013 computed as of first day of application:
01/01/2014.
2014 EU-wide Stress Test 2014 EU-wide Stress TestSummary Baseline Scenario
IT - Banca Carige S.P.A. - Cassa di Risparmio di Genova e Imperia
(1) According to CRR/CRD4 definition transitional arrangements as per reporting date. Figures as of 31/12/2013 computed as of first day of application:
01/01/2014.
Summary Adverse Scenario
IT - Banca Carige S.P.A. - Cassa di Risparmio di Genova e Imperia
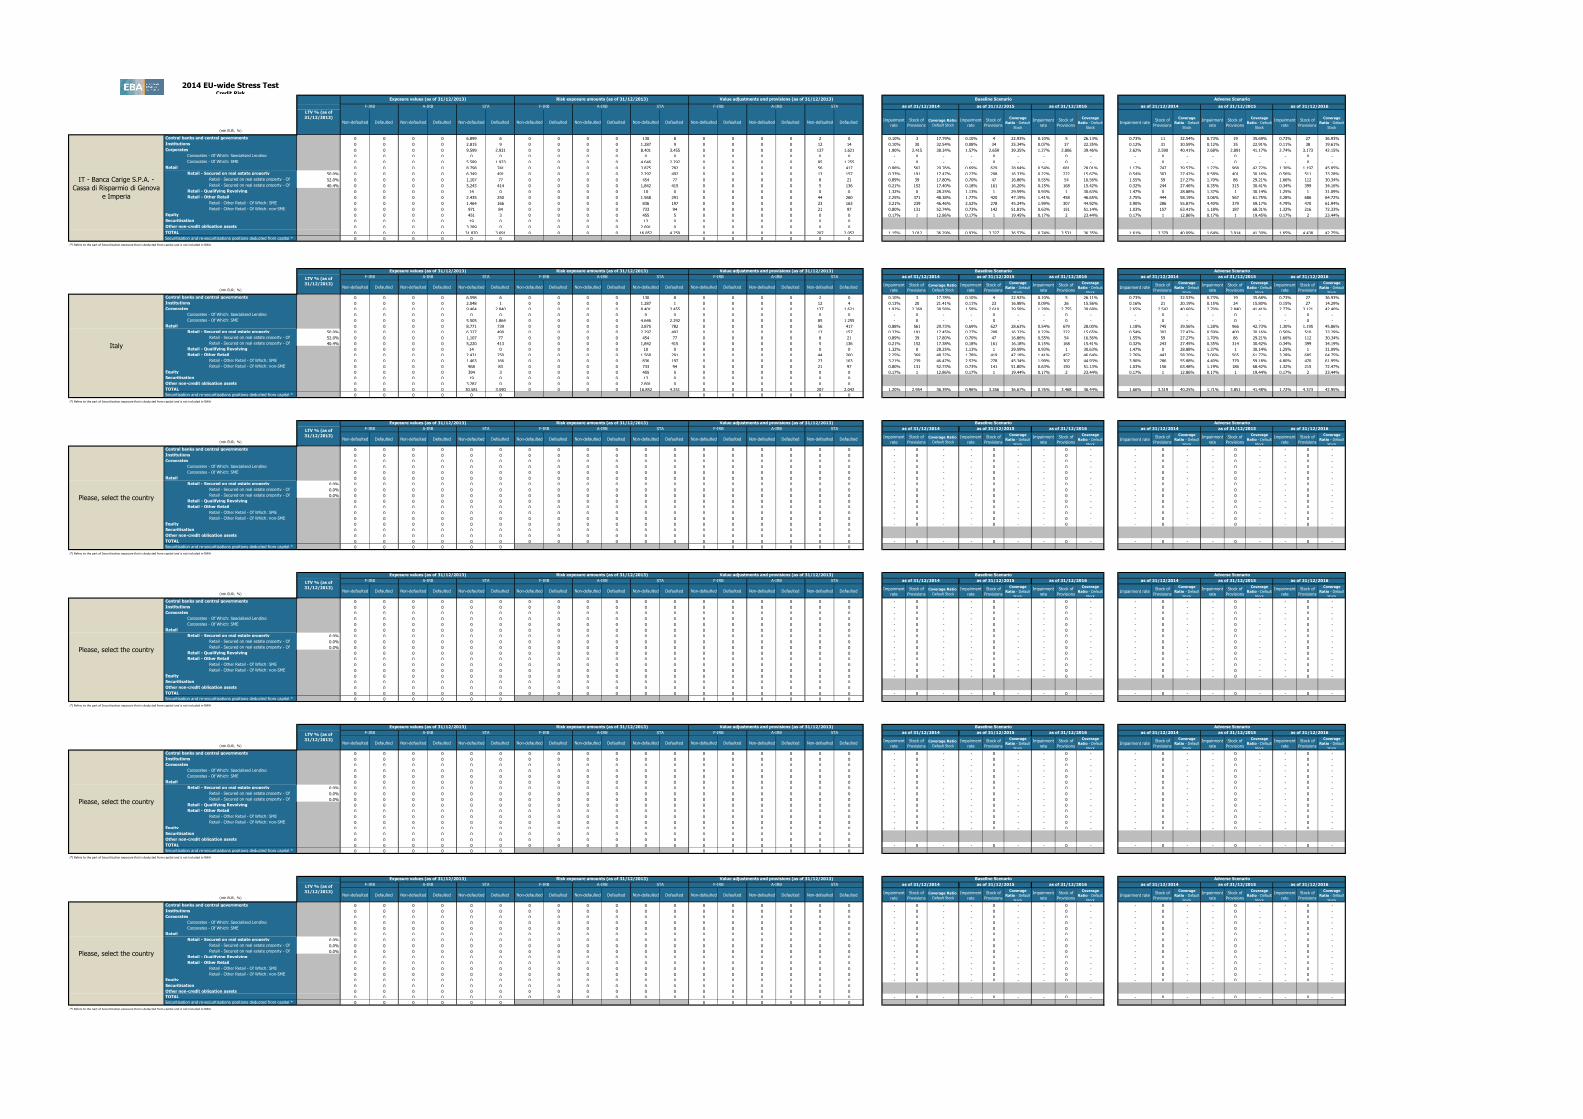
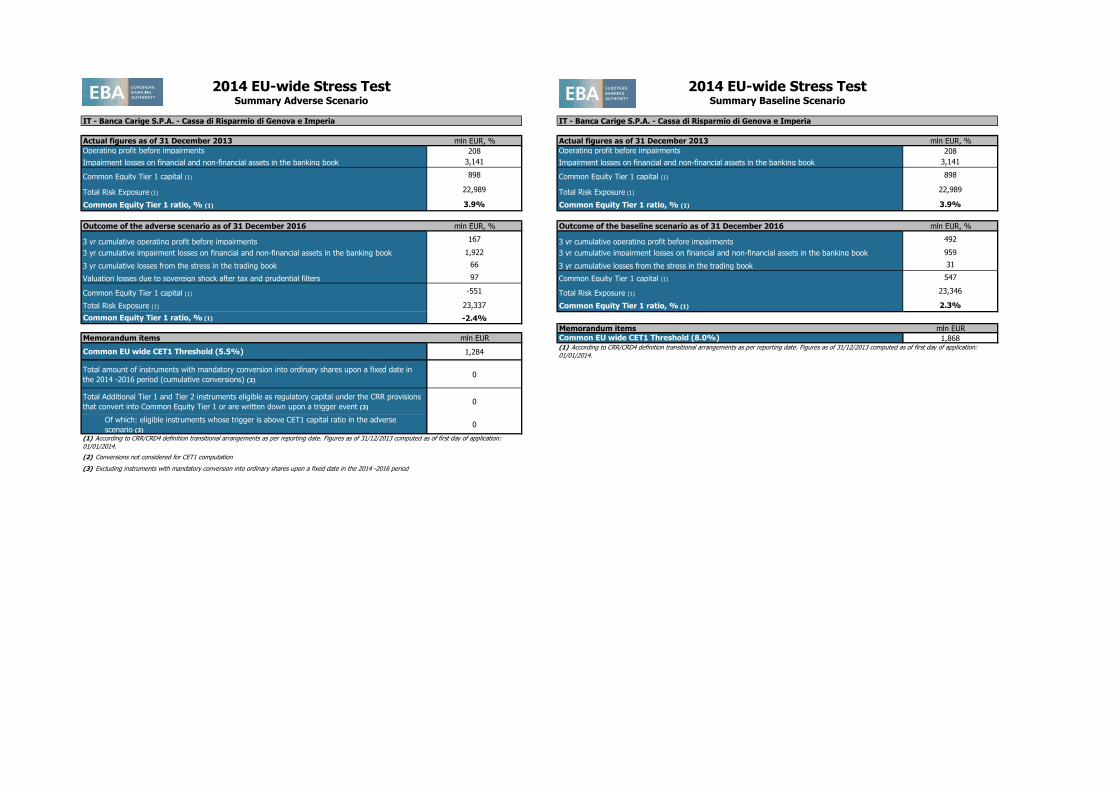
2014 EU-wide Stress TestCredit Risk
(mln EUR, %)
Non-defaulted Defaulted Non-defaulted Defaulted Non-defaulted Defaulted Non-defaulted Defaulted Non-defaulted Defaulted Non-defaulted Defaulted Non-defaulted Defaulted Non-defaulted Defaulted Non-defaulted Defaulted Impairment
rate
Stock of
Provisions
Coverage Ratio -
Default Stock
Impairment
rate
Stock of
Provisions
Coverage
Ratio - Default
Stock
Impairment
rate
Stock of
Provisions
Coverage
Ratio - Default
Stock
Impairment rateStock of
Provisions
Coverage
Ratio - Default
Stock
Impairment
rate
Stock of
Provisions
Coverage
Ratio - Default
Stock
Impairment
rate
Stock of
Provisions
Coverage
Ratio - Default
Stock
Central banks and central governments 0 0 0 0 6,899 6 0 0 0 0 130 8 0 0 0 0 2 0 0.10% 3 17.79% 0.10% 4 22.93% 0.10% 5 26.13% 0.73% 11 32.54% 0.73% 19 35.69% 0.73% 27 36.93%
Institutions 0 0 0 0 2,815 9 0 0 0 0 1,287 9 0 0 0 0 12 14 0.10% 30 32.54% 0.08% 34 25.34% 0.07% 37 22.35% 0.12% 31 30.59% 0.12% 35 22.91% 0.11% 38 19.61%
Corporates 0 0 0 0 9,599 2,931 0 0 0 0 8,401 3,455 0 0 0 0 137 1,621 1.90% 2,415 38.34% 1.57% 2,659 39.35% 1.27% 2,806 39.46% 2.62% 2,590 40.41% 2.68% 2,891 41.17% 2.74% 3,173 42.15%
Corporates - Of Which: Specialised Lending 0 0 0 0 0 0 0 0 0 0 0 0 0 0 0 0 0 0 - 0 - - 0 - - 0 - - 0 - - 0 - - 0 -
Corporates - Of Which: SME 0 0 0 0 5,589 1,933 0 0 0 0 4,646 2,292 0 0 0 0 85 1,255 - 0 - - 0 - - 0 - - 0 - - 0 - - 0 -
Retail 0 0 0 0 8,798 741 0 0 0 0 3,875 782 0 0 0 0 56 417 0.88% 562 29.76% 0.69% 629 28.64% 0.54% 681 28.01% 1.17% 747 39.57% 1.27% 968 42.72% 1.30% 1,197 45.85%
Retail - Secured on real estate property 50.0% 0 0 0 0 6,349 491 0 0 0 0 2,297 492 0 0 0 0 13 157 0.33% 191 17.47% 0.27% 208 16.33% 0.22% 222 15.67% 0.54% 303 27.42% 0.58% 401 30.16% 0.56% 511 33.28%
Retail - Secured on real estate property - Of
Which: SME52.0% 0 0 0 0 1,107 77 0 0 0 0 454 77 0 0 0 0 8 21 0.89% 39 17.80% 0.70% 47 16.86% 0.55% 54 16.56% 1.55% 59 27.27% 1.70% 86 29.21% 1.66% 112 30.34%
Retail - Secured on real estate property - Of
Which: non-SME40.4% 0 0 0 0 5,243 414 0 0 0 0 1,842 415 0 0 0 0 5 136 0.21% 152 17.40% 0.18% 161 16.20% 0.15% 168 15.42% 0.32% 244 27.46% 0.35% 315 30.41% 0.34% 399 34.16%
Retail - Qualifying Revolving 0 0 0 0 14 0 0 0 0 0 10 0 0 0 0 0 0 0 1.32% 0 28.25% 1.13% 1 29.59% 0.93% 1 30.63% 1.47% 0 28.88% 1.37% 1 30.14% 1.25% 1 31.09%
Retail - Other Retail 0 0 0 0 2,435 250 0 0 0 0 1,568 291 0 0 0 0 44 260 2.25% 371 48.38% 1.77% 420 47.19% 1.41% 458 46.65% 2.75% 444 58.19% 3.06% 567 61.75% 3.28% 686 64.72%
Retail - Other Retail - Of Which: SME 0 0 0 0 1,464 166 0 0 0 0 836 197 0 0 0 0 23 163 3.21% 239 46.46% 2.52% 278 45.34% 1.99% 307 44.92% 3.90% 286 55.87% 4.40% 379 59.17% 4.79% 470 61.94%
Retail - Other Retail - Of Which: non-SME 0 0 0 0 971 84 0 0 0 0 733 94 0 0 0 0 21 97 0.80% 131 52.74% 0.73% 142 51.81% 0.63% 151 51.14% 1.03% 157 63.41% 1.18% 187 68.31% 1.32% 216 72.33%
Equity 0 0 0 0 451 3 0 0 0 0 455 5 0 0 0 0 0 0 0.17% 1 12.86% 0.17% 1 19.45% 0.17% 2 23.44% 0.17% 1 12.86% 0.17% 1 19.45% 0.17% 2 23.44%
Securitisation 0 0 0 0 19 0 0 0 0 0 13 0 0 0 0 0 0 0
Other non-credit obligation assets 0 0 0 0 3,289 0 0 0 0 0 2,691 0 0 0 0 0 0 0
TOTAL 0 0 0 0 31,870 3,691 0 0 0 0 16,852 4,259 0 0 0 0 207 2,052 1.15% 3,012 36.29% 0.93% 3,327 36.57% 0.74% 3,531 36.35% 1.61% 3,379 40.09% 1.64% 3,914 41.30% 1.65% 4,438 42.75%
Securitisation and re-securitisations positions deducted from capital * 0 0 0 0 0 0 0 0 0 0 0 0
(mln EUR, %)Non-defaulted Defaulted Non-defaulted Defaulted Non-defaulted Defaulted Non-defaulted Defaulted Non-defaulted Defaulted Non-defaulted Defaulted Non-defaulted Defaulted Non-defaulted Defaulted Non-defaulted Defaulted
Impairment
rate
Stock of
Provisions
Coverage Ratio -
Default Stock
Impairment
rate
Stock of
Provisions
Coverage
Ratio - Default
Stock
Impairment
rate
Stock of
Provisions
Coverage
Ratio - Default
Stock
Impairment rateStock of
Provisions
Coverage
Ratio - Default
Stock
Impairment
rate
Stock of
Provisions
Coverage
Ratio - Default
Stock
Impairment
rate
Stock of
Provisions
Coverage
Ratio - Default
Stock
Central banks and central governments 0 0 0 0 6,598 6 0 0 0 0 130 8 0 0 0 0 2 0 0.10% 3 17.78% 0.10% 4 22.92% 0.10% 5 26.11% 0.73% 11 32.53% 0.73% 19 35.68% 0.73% 27 36.93%
Institutions 0 0 0 0 2,048 1 0 0 0 0 1,287 1 0 0 0 0 12 4 0.13% 20 21.41% 0.11% 23 16.98% 0.09% 26 15.56% 0.16% 21 20.19% 0.15% 24 15.80% 0.15% 27 14.29%
Corporates 0 0 0 0 9,464 2,840 0 0 0 0 8,401 3,455 0 0 0 0 137 1,621 1.92% 2,369 38.58% 1.58% 2,610 39.58% 1.28% 2,755 39.68% 2.65% 2,542 40.66% 2.70% 2,840 41.41% 2.77% 3,121 42.40%
Corporates - Of Which: Specialised Lending 0 0 0 0 0 0 0 0 0 0 0 0 0 0 0 0 0 0 - 0 - - 0 - - 0 - - 0 - - 0 - - 0 -
Corporates - Of Which: SME 0 0 0 0 5,505 1,864 0 0 0 0 4,646 2,292 0 0 0 0 85 1,255 - 0 - - 0 - - 0 - - 0 - - 0 - - 0 -
Retail 0 0 0 0 8,771 739 0 0 0 0 3,875 782 0 0 0 0 56 417 0.88% 561 29.73% 0.69% 627 28.63% 0.54% 679 28.00% 1.18% 745 39.56% 1.28% 966 42.73% 1.30% 1,195 45.86%
Retail - Secured on real estate property 50.0% 0 0 0 0 6,327 490 0 0 0 0 2,297 492 0 0 0 0 13 157 0.33% 191 17.45% 0.27% 208 16.32% 0.22% 222 15.65% 0.54% 302 27.42% 0.59% 400 30.16% 0.56% 510 33.29%
Retail - Secured on real estate property - Of
Which: SME52.0% 0 0 0 0 1,107 77 0 0 0 0 454 77 0 0 0 0 8 21 0.89% 39 17.80% 0.70% 47 16.86% 0.55% 54 16.56% 1.55% 59 27.27% 1.70% 86 29.21% 1.66% 112 30.34%
Retail - Secured on real estate property - Of
Which: non-SME40.4% 0 0 0 0 5,220 413 0 0 0 0 1,842 415 0 0 0 0 5 136 0.21% 152 17.38% 0.18% 161 16.18% 0.15% 168 15.41% 0.32% 243 27.45% 0.35% 314 30.42% 0.34% 399 34.19%
Retail - Qualifying Revolving 0 0 0 0 14 0 0 0 0 0 10 0 0 0 0 0 0 0 1.32% 0 28.25% 1.13% 1 29.59% 0.93% 1 30.63% 1.47% 0 28.88% 1.37% 1 30.14% 1.25% 1 31.09%
Retail - Other Retail 0 0 0 0 2,431 250 0 0 0 0 1,568 291 0 0 0 0 44 260 2.25% 369 48.37% 1.78% 419 47.18% 1.41% 457 46.64% 2.76% 443 58.20% 3.06% 565 61.77% 3.28% 685 64.75%
Retail - Other Retail - Of Which: SME 0 0 0 0 1,463 166 0 0 0 0 836 197 0 0 0 0 23 163 3.21% 239 46.47% 2.52% 278 45.34% 1.99% 307 44.93% 3.90% 286 55.88% 4.40% 379 59.18% 4.80% 470 61.95%
Retail - Other Retail - Of Which: non-SME 0 0 0 0 968 83 0 0 0 0 733 94 0 0 0 0 21 97 0.80% 131 52.73% 0.73% 141 51.80% 0.63% 150 51.13% 1.03% 156 63.48% 1.19% 186 68.42% 1.32% 215 72.47%
Equity 0 0 0 0 394 3 0 0 0 0 455 5 0 0 0 0 0 0 0.17% 1 12.86% 0.17% 1 19.44% 0.17% 2 23.44% 0.17% 1 12.86% 0.17% 1 19.44% 0.17% 2 23.44%
Securitisation 0 0 0 0 19 0 0 0 0 0 13 0 0 0 0 0 0 0
Other non-credit obligation assets 0 0 0 0 3,287 0 0 0 0 0 2,691 0 0 0 0 0 0 0
TOTAL 0 0 0 0 30,581 3,590 0 0 0 0 16,852 4,251 0 0 0 0 207 2,042 1.20% 2,954 36.39% 0.96% 3,266 36.67% 0.76% 3,468 36.44% 1.66% 3,319 40.25% 1.71% 3,851 41.48% 1.72% 4,373 42.95%
Securitisation and re-securitisations positions deducted from capital * 0 0 0 0 0 0 0 0 0 0 0 0
(mln EUR, %)Non-defaulted Defaulted Non-defaulted Defaulted Non-defaulted Defaulted Non-defaulted Defaulted Non-defaulted Defaulted Non-defaulted Defaulted Non-defaulted Defaulted Non-defaulted Defaulted Non-defaulted Defaulted
Impairment
rate
Stock of
Provisions
Coverage Ratio -
Default Stock
Impairment
rate
Stock of
Provisions
Coverage
Ratio - Default
Stock
Impairment
rate
Stock of
Provisions
Coverage
Ratio - Default
Stock
Impairment rateStock of
Provisions
Coverage
Ratio - Default
Stock
Impairment
rate
Stock of
Provisions
Coverage
Ratio - Default
Stock
Impairment
rate
Stock of
Provisions
Coverage
Ratio - Default
Stock
Central banks and central governments 0 0 0 0 0 0 0 0 0 0 0 0 0 0 0 0 0 0 - 0 - - 0 - - 0 - - 0 - - 0 - - 0 -
Institutions 0 0 0 0 0 0 0 0 0 0 0 0 0 0 0 0 0 0 - 0 - - 0 - - 0 - - 0 - - 0 - - 0 -
Corporates 0 0 0 0 0 0 0 0 0 0 0 0 0 0 0 0 0 0 - 0 - - 0 - - 0 - - 0 - - 0 - - 0 -
Corporates - Of Which: Specialised Lending 0 0 0 0 0 0 0 0 0 0 0 0 0 0 0 0 0 0 - 0 - - 0 - - 0 - - 0 - - 0 - - 0 -
Corporates - Of Which: SME 0 0 0 0 0 0 0 0 0 0 0 0 0 0 0 0 0 0 - 0 - - 0 - - 0 - - 0 - - 0 - - 0 -
Retail 0 0 0 0 0 0 0 0 0 0 0 0 0 0 0 0 0 0 - 0 - - 0 - - 0 - - 0 - - 0 - - 0 -
Retail - Secured on real estate property 0.0% 0 0 0 0 0 0 0 0 0 0 0 0 0 0 0 0 0 0 - 0 - - 0 - - 0 - - 0 - - 0 - - 0 -
Retail - Secured on real estate property - Of
Which: SME0.0% 0 0 0 0 0 0 0 0 0 0 0 0 0 0 0 0 0 0 - 0 - - 0 - - 0 - - 0 - - 0 - - 0 -
Retail - Secured on real estate property - Of
Which: non-SME0.0% 0 0 0 0 0 0 0 0 0 0 0 0 0 0 0 0 0 0 - 0 - - 0 - - 0 - - 0 - - 0 - - 0 -
Retail - Qualifying Revolving 0 0 0 0 0 0 0 0 0 0 0 0 0 0 0 0 0 0 - 0 - - 0 - - 0 - - 0 - - 0 - - 0 -
Retail - Other Retail 0 0 0 0 0 0 0 0 0 0 0 0 0 0 0 0 0 0 - 0 - - 0 - - 0 - - 0 - - 0 - - 0 -
Retail - Other Retail - Of Which: SME 0 0 0 0 0 0 0 0 0 0 0 0 0 0 0 0 0 0 - 0 - - 0 - - 0 - - 0 - - 0 - - 0 -
Retail - Other Retail - Of Which: non-SME 0 0 0 0 0 0 0 0 0 0 0 0 0 0 0 0 0 0 - 0 - - 0 - - 0 - - 0 - - 0 - - 0 -
Equity 0 0 0 0 0 0 0 0 0 0 0 0 0 0 0 0 0 0 - 0 - - 0 - - 0 - - 0 - - 0 - - 0 -
Securitisation 0 0 0 0 0 0 0 0 0 0 0 0 0 0 0 0 0 0
Other non-credit obligation assets 0 0 0 0 0 0 0 0 0 0 0 0 0 0 0 0 0 0
TOTAL 0 0 0 0 0 0 0 0 0 0 0 0 0 0 0 0 0 0 - 0 - - 0 - - 0 - - 0 - - 0 - - 0 -
Securitisation and re-securitisations positions deducted from capital * 0 0 0 0 0 0 0 0 0 0 0 0
as of 31/12/2016 as of 31/12/2014 as of 31/12/2015 as of 31/12/2016
Please, select the country
F-IRB A-IRB STA as of 31/12/2014 as of 31/12/2015LTV % (as of
31/12/2013)
Exposure values (as of 31/12/2013) Risk exposure amounts (as of 31/12/2013) Value adjustments and provisions (as of 31/12/2013) Baseline Scenario Adverse Scenario
F-IRB A-IRB STA F-IRB A-IRB STA
LTV % (as of
31/12/2013)
Exposure values (as of 31/12/2013) Risk exposure amounts (as of 31/12/2013) Value adjustments and provisions (as of 31/12/2013) Baseline Scenario Adverse Scenario
F-IRB A-IRB STA F-IRB A-IRB STA F-IRB as of 31/12/2014 as of 31/12/2015 as of 31/12/2016A-IRB STA as of 31/12/2014 as of 31/12/2015 as of 31/12/2016
LTV % (as of
31/12/2013)
Exposure values (as of 31/12/2013) Risk exposure amounts (as of 31/12/2013) Value adjustments and provisions (as of 31/12/2013) Baseline Scenario Adverse Scenario
F-IRB A-IRB STA F-IRB A-IRB STA F-IRB A-IRB as of 31/12/2015 as of 31/12/2016STA as of 31/12/2014 as of 31/12/2015 as of 31/12/2016 as of 31/12/2014
Risk exposure amounts (as of 31/12/2013)
Baseline Scenario Adverse Scenario
F-IRB A-IRB STA F-IRB A-IRB STA F-IRB A-IRB STA as of 31/12/2014 as of 31/12/2015 as of 31/12/2016 as of 31/12/2014 as of 31/12/2015 as of 31/12/2016
as of 31/12/2016
Italy
LTV % (as of
31/12/2013)
Exposure values (as of 31/12/2013) Risk exposure amounts (as of 31/12/2013) Value adjustments and provisions (as of 31/12/2013)
Adverse Scenario
F-IRB A-IRB STA F-IRB A-IRB STA F-IRB A-IRB STA as of 31/12/2014 as of 31/12/2015 as of 31/12/2016 as of 31/12/2014 as of 31/12/2015 as of 31/12/2016LTV % (as of
31/12/2013)
Exposure values (as of 31/12/2013)
IT - Banca Carige S.P.A. -
Cassa di Risparmio di Genova
e Imperia
(*) Refers to the part of Securitization exposure that is deducted from capital and is not included in RWA
Value adjustments and provisions (as of 31/12/2013) Baseline Scenario
LTV % (as of
31/12/2013)
Exposure values (as of 31/12/2013) Risk exposure amounts (as of 31/12/2013) Value adjustments and provisions (as of 31/12/2013) Adverse Scenario
F-IRB A-IRB STA F-IRB A-IRB STA F-IRB A-IRB STA
Baseline Scenario
as of 31/12/2014 as of 31/12/2015 as of 31/12/2016 as of 31/12/2014 as of 31/12/2015
(*) Refers to the part of Securitization exposure that is deducted from capital and is not included in RWA
(*) Refers to the part of Securitization exposure that is deducted from capital and is not included in RWA
(*) Refers to the part of Securitization exposure that is deducted from capital and is not included in RWA
(*) Refers to the part of Securitization exposure that is deducted from capital and is not included in RWA
(*) Refers to the part of Securitization exposure that is deducted from capital and is not included in RWA
Please, select the country
Please, select the country
Please, select the country

2014 EU-wide Stress TestCredit Risk
LTV % (as of
31/12/2013)
Exposure values (as of 31/12/2013) Risk exposure amounts (as of 31/12/2013) Value adjustments and provisions (as of 31/12/2013) Adverse ScenarioBaseline Scenario
(mln EUR, %)Non-defaulted Defaulted Non-defaulted Defaulted Non-defaulted Defaulted Non-defaulted Defaulted Non-defaulted Defaulted Non-defaulted Defaulted Non-defaulted Defaulted Non-defaulted Defaulted Non-defaulted Defaulted
Impairment
rate
Stock of
Provisions
Coverage Ratio -
Default Stock
Impairment
rate
Stock of
Provisions
Coverage
Ratio - Default
Stock
Impairment
rate
Stock of
Provisions
Coverage
Ratio - Default
Stock
Impairment rateStock of
Provisions
Coverage
Ratio - Default
Stock
Impairment
rate
Stock of
Provisions
Coverage
Ratio - Default
Stock
Impairment
rate
Stock of
Provisions
Coverage
Ratio - Default
Stock
Central banks and central governments 0 0 0 0 0 0 0 0 0 0 0 0 0 0 0 0 0 0 - 0 - - 0 - - 0 - - 0 - - 0 - - 0 -
Institutions 0 0 0 0 0 0 0 0 0 0 0 0 0 0 0 0 0 0 - 0 - - 0 - - 0 - - 0 - - 0 - - 0 -
Corporates 0 0 0 0 0 0 0 0 0 0 0 0 0 0 0 0 0 0 - 0 - - 0 - - 0 - - 0 - - 0 - - 0 -
Corporates - Of Which: Specialised Lending 0 0 0 0 0 0 0 0 0 0 0 0 0 0 0 0 0 0 - 0 - - 0 - - 0 - - 0 - - 0 - - 0 -
Corporates - Of Which: SME 0 0 0 0 0 0 0 0 0 0 0 0 0 0 0 0 0 0 - 0 - - 0 - - 0 - - 0 - - 0 - - 0 -
Retail 0 0 0 0 0 0 0 0 0 0 0 0 0 0 0 0 0 0 - 0 - - 0 - - 0 - - 0 - - 0 - - 0 -
Retail - Secured on real estate property 0.0% 0 0 0 0 0 0 0 0 0 0 0 0 0 0 0 0 0 0 - 0 - - 0 - - 0 - - 0 - - 0 - - 0 -
Retail - Secured on real estate property - Of
Which: SME0.0% 0 0 0 0 0 0 0 0 0 0 0 0 0 0 0 0 0 0 - 0 - - 0 - - 0 - - 0 - - 0 - - 0 -
Retail - Secured on real estate property - Of
Which: non-SME0.0% 0 0 0 0 0 0 0 0 0 0 0 0 0 0 0 0 0 0 - 0 - - 0 - - 0 - - 0 - - 0 - - 0 -
Retail - Qualifying Revolving 0 0 0 0 0 0 0 0 0 0 0 0 0 0 0 0 0 0 - 0 - - 0 - - 0 - - 0 - - 0 - - 0 -
Retail - Other Retail 0 0 0 0 0 0 0 0 0 0 0 0 0 0 0 0 0 0 - 0 - - 0 - - 0 - - 0 - - 0 - - 0 -
Retail - Other Retail - Of Which: SME 0 0 0 0 0 0 0 0 0 0 0 0 0 0 0 0 0 0 - 0 - - 0 - - 0 - - 0 - - 0 - - 0 -
Retail - Other Retail - Of Which: non-SME 0 0 0 0 0 0 0 0 0 0 0 0 0 0 0 0 0 0 - 0 - - 0 - - 0 - - 0 - - 0 - - 0 -
Equity 0 0 0 0 0 0 0 0 0 0 0 0 0 0 0 0 0 0 - 0 - - 0 - - 0 - - 0 - - 0 - - 0 -
Securitisation 0 0 0 0 0 0 0 0 0 0 0 0 0 0 0 0 0 0
Other non-credit obligation assets 0 0 0 0 0 0 0 0 0 0 0 0 0 0 0 0 0 0
TOTAL 0 0 0 0 0 0 0 0 0 0 0 0 0 0 0 0 0 0 - 0 - - 0 - - 0 - - 0 - - 0 - - 0 -
Securitisation and re-securitisations positions deducted from capital * 0 0 0 0 0 0 0 0 0 0 0 0
LTV % (as of
31/12/2013)
Exposure values (as of 31/12/2013) Risk exposure amounts (as of 31/12/2013) Value adjustments and provisions (as of 31/12/2013) Baseline Scenario Adverse Scenario
F-IRB A-IRB STA F-IRB A-IRB STA as of 31/12/2016 as of 31/12/2014 as of 31/12/2015 as of 31/12/2016F-IRB A-IRB STA as of 31/12/2014 as of 31/12/2015
LTV % (as of
31/12/2013)
Exposure values (as of 31/12/2013) Risk exposure amounts (as of 31/12/2013) Value adjustments and provisions (as of 31/12/2013) Baseline Scenario Adverse Scenario
F-IRB A-IRB STA F-IRB A-IRB STA F-IRB as of 31/12/2014 as of 31/12/2015 as of 31/12/2016A-IRB STA as of 31/12/2014 as of 31/12/2015 as of 31/12/2016
LTV % (as of
31/12/2013)
Exposure values (as of 31/12/2013) Risk exposure amounts (as of 31/12/2013) Value adjustments and provisions (as of 31/12/2013) Baseline Scenario Adverse Scenario
F-IRB A-IRB STA F-IRB A-IRB STA F-IRB A-IRB as of 31/12/2015 as of 31/12/2016STA as of 31/12/2014 as of 31/12/2015 as of 31/12/2016 as of 31/12/2014
Adverse Scenario
F-IRB A-IRB STA F-IRB A-IRB STA F-IRB A-IRB STA as of 31/12/2014 as of 31/12/2015 as of 31/12/2016 as of 31/12/2014 as of 31/12/2015 as of 31/12/2016LTV % (as of
31/12/2013)
Exposure values (as of 31/12/2013) Risk exposure amounts (as of 31/12/2013) Value adjustments and provisions (as of 31/12/2013)
Adverse Scenario
F-IRB A-IRB STA F-IRB A-IRB STA F-IRB A-IRB STA as of 31/12/2014 as of 31/12/2015 as of 31/12/2016 as of 31/12/2014 as of 31/12/2015 as of 31/12/2016LTV % (as of
31/12/2013)
Exposure values (as of 31/12/2013) Risk exposure amounts (as of 31/12/2013)
Baseline Scenario
Value adjustments and provisions (as of 31/12/2013) Baseline Scenario
(*) Refers to the part of Securitization exposure that is deducted from capital and is not included in RWA
(*) Refers to the part of Securitization exposure that is deducted from capital and is not included in RWA
(*) Refers to the part of Securitization exposure that is deducted from capital and is not included in RWA
(*) Refers to the part of Securitization exposure that is deducted from capital and is not included in RWA
(*) Refers to the part of Securitization exposure that is deducted from capital and is not included in RWA
Please, select the country
Please, select the country
Please, select the country
Please, select the country
Please, select the country
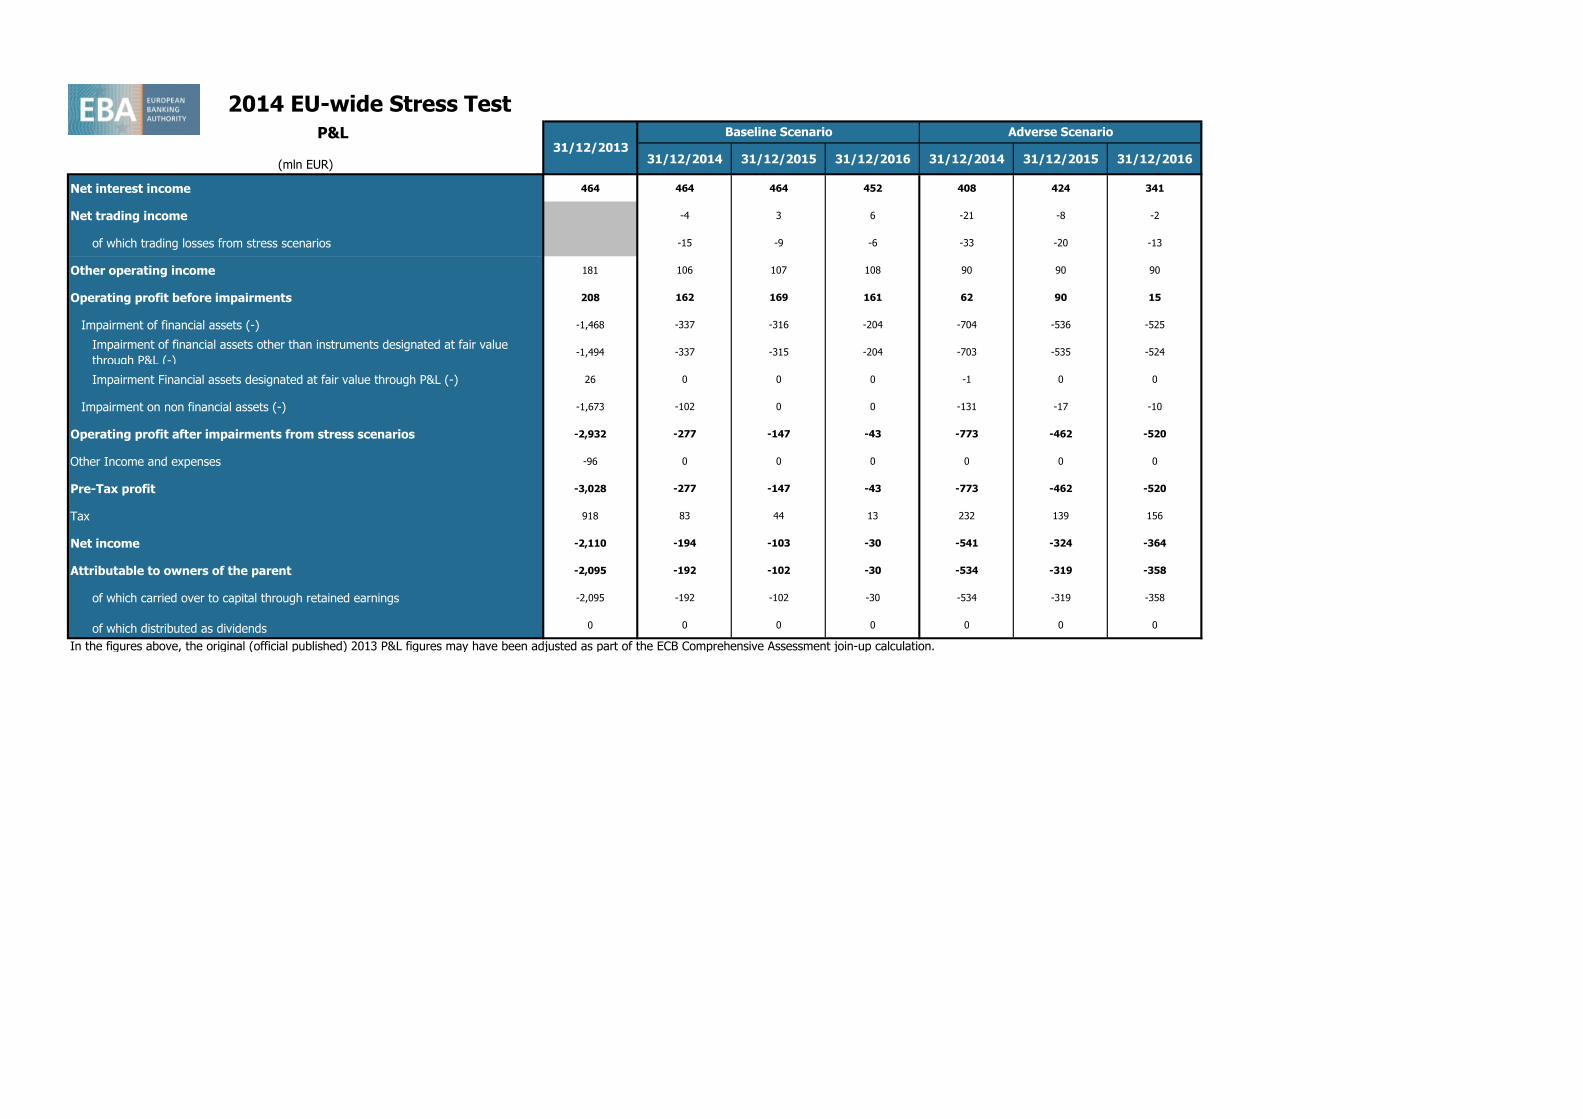
2014 EU-wide Stress Test P&L
(mln EUR) 31/12/2014 31/12/2015 31/12/2016 31/12/2014 31/12/2015 31/12/2016
Net interest income 464 464 464 452 408 424 341
Net trading income -4 3 6 -21 -8 -2
of which trading losses from stress scenarios -15 -9 -6 -33 -20 -13
Other operating income 181 106 107 108 90 90 90
Operating profit before impairments 208 162 169 161 62 90 15
Impairment of financial assets (-) -1,468 -337 -316 -204 -704 -536 -525
Impairment of financial assets other than instruments designated at fair value
through P&L (-)-1,494 -337 -315 -204 -703 -535 -524
Impairment Financial assets designated at fair value through P&L (-) 26 0 0 0 -1 0 0
Impairment on non financial assets (-) -1,673 -102 0 0 -131 -17 -10
Operating profit after impairments from stress scenarios -2,932 -277 -147 -43 -773 -462 -520
Other Income and expenses -96 0 0 0 0 0 0
Pre-Tax profit -3,028 -277 -147 -43 -773 -462 -520
Tax 918 83 44 13 232 139 156
Net income -2,110 -194 -103 -30 -541 -324 -364
Attributable to owners of the parent -2,095 -192 -102 -30 -534 -319 -358
of which carried over to capital through retained earnings -2,095 -192 -102 -30 -534 -319 -358
of which distributed as dividends 0 0 0 0 0 0 0
In the figures above, the original (official published) 2013 P&L figures may have been adjusted as part of the ECB Comprehensive Assessment join-up calculation.
31/12/2013
Baseline Scenario Adverse Scenario
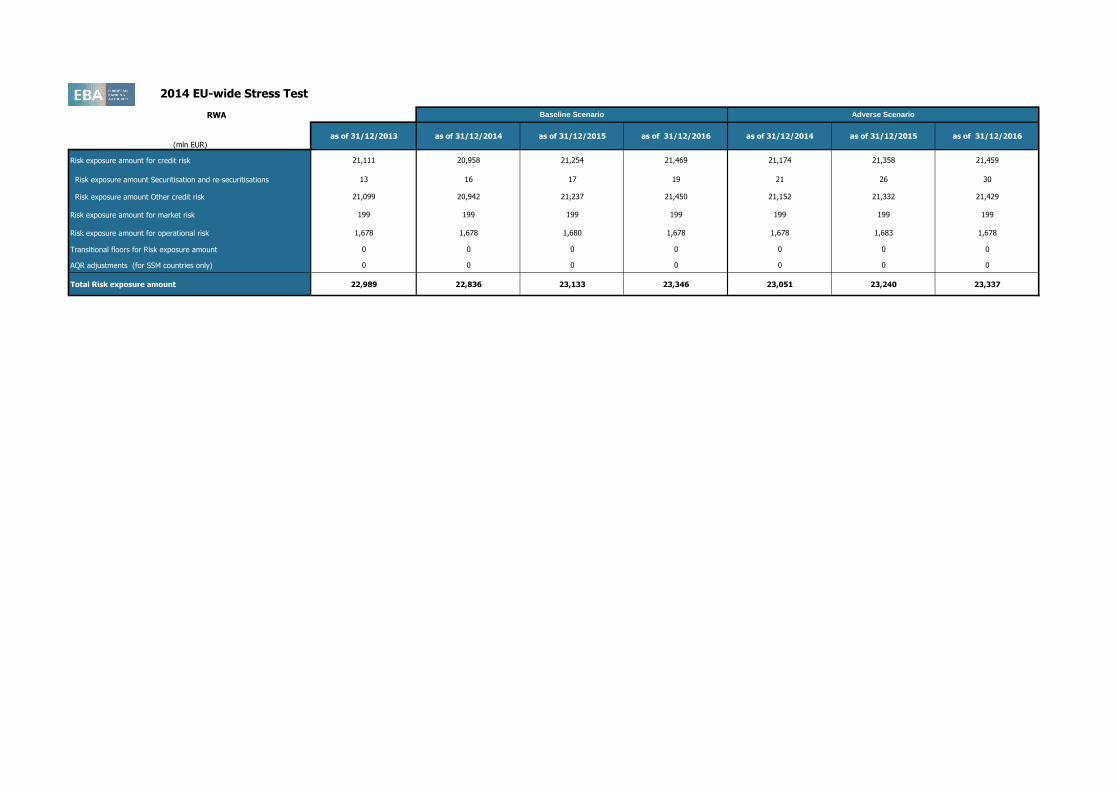
2014 EU-wide Stress Test
RWA
(mln EUR)as of 31/12/2013 as of 31/12/2014 as of 31/12/2015 as of 31/12/2016 as of 31/12/2014 as of 31/12/2015 as of 31/12/2016
Risk exposure amount for credit risk 21,111 20,958 21,254 21,469 21,174 21,358 21,459
Risk exposure amount Securitisation and re-securitisations 13 16 17 19 21 26 30
Risk exposure amount Other credit risk 21,099 20,942 21,237 21,450 21,152 21,332 21,429
Risk exposure amount for market risk 199 199 199 199 199 199 199
Risk exposure amount for operational risk 1,678 1,678 1,680 1,678 1,678 1,683 1,678
Transitional floors for Risk exposure amount 0 0 0 0 0 0 0
AQR adjustments (for SSM countries only) 0 0 0 0 0 0 0
Total Risk exposure amount 22,989 22,836 23,133 23,346 23,051 23,240 23,337
Baseline Scenario Adverse Scenario

(mln EUR) as of 31/12/2013 31/12/2014 31/12/2015 31/12/2016 31/12/2014 31/12/2015 31/12/2016
Banking Book 19
Trading Book (excl. correlation trading positions under CRM) 0
Correlation Trading Portfolio (CRM) 0
Total 19
Banking Book 13 16 17 19 21 26 30
Trading Book (excl. correlation trading positions under CRM) 0 0 0 0 0 0 0
Total 13 16 17 19 21 26 30
Hold to Maturity porfolio 0 0 0 0 0 0 0
Available for Sale porfolio 0 0 0 0 0 0 0
Held for trading portfolio
Total 0 0 0 0 0 0 0
2014 EU-wide Stress Test
Impairments
Baseline scenario Adverse scenario
Exposure values
Risk exposure values
Securitisation

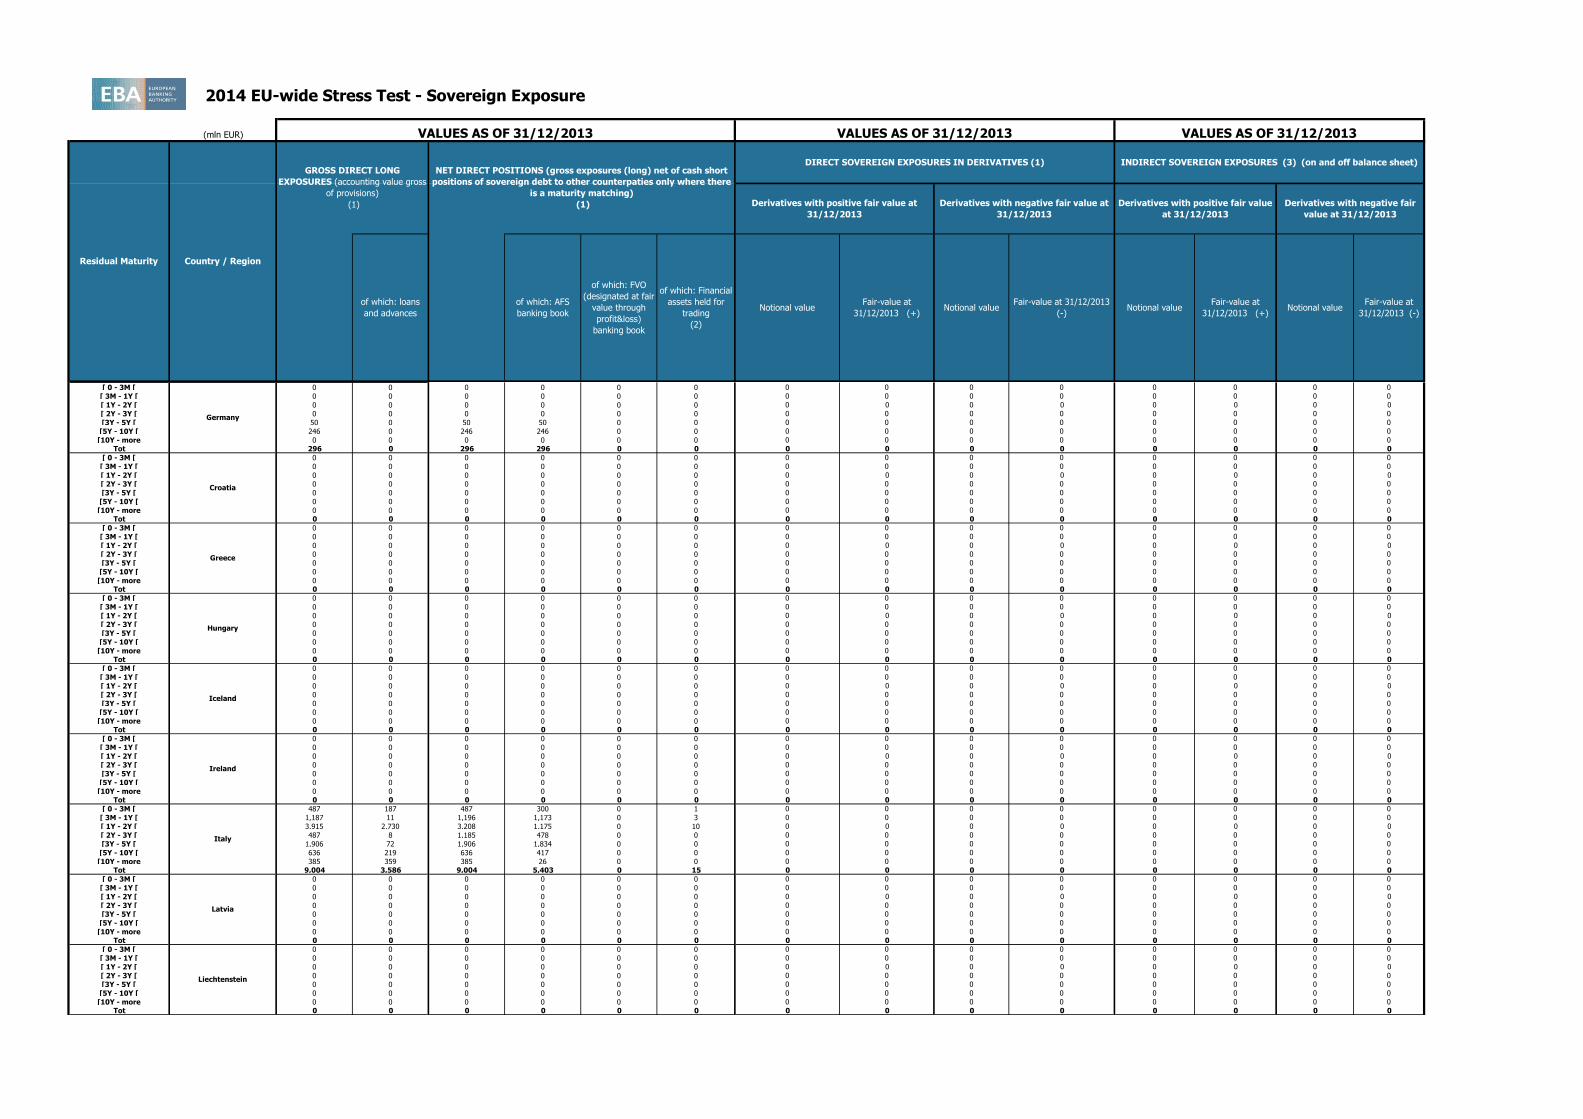
2014 EU-wide Stress Test - Sovereign Exposure
(mln EUR)
[ 0 - 3M [ 0 0 0 0 0 0 0 0 0 0 0 0 0 0
[ 3M - 1Y [ 0 0 0 0 0 0 0 0 0 0 0 0 0 0
[ 1Y - 2Y [ 0 0 0 0 0 0 0 0 0 0 0 0 0 0
[ 2Y - 3Y [ 0 0 0 0 0 0 0 0 0 0 0 0 0 0
[3Y - 5Y [ 0 0 0 0 0 0 0 0 0 0 0 0 0 0
[5Y - 10Y [ 0 0 0 0 0 0 0 0 0 0 0 0 0 0
[10Y - more 0 0 0 0 0 0 0 0 0 0 0 0 0 0
Tot 0 0 0 0 0 0 0 0 0 0 0 0 0 0
[ 0 - 3M [ 0 0 0 0 0 0 0 0 0 0 0 0 0 0
[ 3M - 1Y [ 0 0 0 0 0 0 0 0 0 0 0 0 0 0
[ 1Y - 2Y [ 0 0 0 0 0 0 0 0 0 0 0 0 0 0
[ 2Y - 3Y [ 0 0 0 0 0 0 0 0 0 0 0 0 0 0
[3Y - 5Y [ 0 0 0 0 0 0 0 0 0 0 0 0 0 0
[5Y - 10Y [ 0 0 0 0 0 0 0 0 0 0 0 0 0 0
[10Y - more 2 2 2 0 0 0 0 0 0 0 0 0 0 0
Tot 2 2 2 0 0 0 0 0 0 0 0 0 0 0
Residual Maturity Country / Region
GROSS DIRECT LONG
EXPOSURES (accounting value gross
of provisions)
(1)
NET DIRECT POSITIONS (gross exposures (long) net of cash short
positions of sovereign debt to other counterpaties only where there
is a maturity matching)
(1)
DIRECT SOVEREIGN EXPOSURES IN DERIVATIVES (1)
of which: loans
and advances
of which: AFS
banking book
of which: FVO
(designated at fair
value through
profit&loss)
banking book
of which: Financial
assets held for
trading
(2)
Derivatives with positive fair value at
31/12/2013
Derivatives with negative fair value at
31/12/2013
Derivatives with positive fair value
at 31/12/2013
Derivatives with negative fair
value at 31/12/2013
VALUES AS OF 31/12/2013 VALUES AS OF 31/12/2013 VALUES AS OF 31/12/2013
INDIRECT SOVEREIGN EXPOSURES (3) (on and off balance sheet)
Fair-value at
31/12/2013 (+)Notional value
Fair-value at
31/12/2013 (-)Notional value
Fair-value at
31/12/2013 (+)Notional value
Fair-value at 31/12/2013
(-)
Austria
Belgium
Bulgaria
Cyprus
Notional value
Czech Republic
Denmark
Estonia
Finland
France
2014 EU-wide Stress Test - Sovereign Exposure
(mln EUR)
Residual Maturity Country / Region
GROSS DIRECT LONG
EXPOSURES (accounting value gross
of provisions)
(1)
NET DIRECT POSITIONS (gross exposures (long) net of cash short
positions of sovereign debt to other counterpaties only where there
is a maturity matching)
(1)
DIRECT SOVEREIGN EXPOSURES IN DERIVATIVES (1)
of which: loans
and advances
of which: AFS
banking book
of which: FVO
(designated at fair
value through
profit&loss)
banking book
of which: Financial
assets held for
trading
(2)
Derivatives with positive fair value at
31/12/2013
Derivatives with negative fair value at
31/12/2013
Derivatives with positive fair value
at 31/12/2013
Derivatives with negative fair
value at 31/12/2013
VALUES AS OF 31/12/2013 VALUES AS OF 31/12/2013 VALUES AS OF 31/12/2013
INDIRECT SOVEREIGN EXPOSURES (3) (on and off balance sheet)
Fair-value at
31/12/2013 (+)Notional value
Fair-value at
31/12/2013 (-)Notional value
Fair-value at
31/12/2013 (+)Notional value
Fair-value at 31/12/2013
(-)
Austria
Notional value
[ 0 - 3M [ 0 0 0 0 0 0 0 0 0 0 0 0 0 0
[ 3M - 1Y [ 0 0 0 0 0 0 0 0 0 0 0 0 0 0
[ 1Y - 2Y [ 0 0 0 0 0 0 0 0 0 0 0 0 0 0
[ 2Y - 3Y [ 0 0 0 0 0 0 0 0 0 0 0 0 0 0
[3Y - 5Y [ 50 0 50 50 0 0 0 0 0 0 0 0 0 0
[5Y - 10Y [ 246 0 246 246 0 0 0 0 0 0 0 0 0 0
[10Y - more 0 0 0 0 0 0 0 0 0 0 0 0 0 0
Tot 296 0 296 296 0 0 0 0 0 0 0 0 0 0
[ 0 - 3M [ 0 0 0 0 0 0 0 0 0 0 0 0 0 0
[ 3M - 1Y [ 0 0 0 0 0 0 0 0 0 0 0 0 0 0
[ 1Y - 2Y [ 0 0 0 0 0 0 0 0 0 0 0 0 0 0
[ 2Y - 3Y [ 0 0 0 0 0 0 0 0 0 0 0 0 0 0
[3Y - 5Y [ 0 0 0 0 0 0 0 0 0 0 0 0 0 0
[5Y - 10Y [ 0 0 0 0 0 0 0 0 0 0 0 0 0 0
[10Y - more 0 0 0 0 0 0 0 0 0 0 0 0 0 0
Tot 0 0 0 0 0 0 0 0 0 0 0 0 0 0
[ 0 - 3M [ 0 0 0 0 0 0 0 0 0 0 0 0 0 0
[ 3M - 1Y [ 0 0 0 0 0 0 0 0 0 0 0 0 0 0
[ 1Y - 2Y [ 0 0 0 0 0 0 0 0 0 0 0 0 0 0
[ 2Y - 3Y [ 0 0 0 0 0 0 0 0 0 0 0 0 0 0
[3Y - 5Y [ 0 0 0 0 0 0 0 0 0 0 0 0 0 0
[5Y - 10Y [ 0 0 0 0 0 0 0 0 0 0 0 0 0 0
[10Y - more 0 0 0 0 0 0 0 0 0 0 0 0 0 0
Tot 0 0 0 0 0 0 0 0 0 0 0 0 0 0
[ 0 - 3M [ 487 187 487 300 0 1 0 0 0 0 0 0 0 0
[ 3M - 1Y [ 1,187 11 1,196 1,173 0 3 0 0 0 0 0 0 0 0
[ 1Y - 2Y [ 3,915 2,730 3,208 1,175 0 10 0 0 0 0 0 0 0 0
[ 2Y - 3Y [ 487 8 1,185 478 0 0 0 0 0 0 0 0 0 0
[3Y - 5Y [ 1,906 72 1,906 1,834 0 0 0 0 0 0 0 0 0 0
[5Y - 10Y [ 636 219 636 417 0 0 0 0 0 0 0 0 0 0
[10Y - more 385 359 385 26 0 0 0 0 0 0 0 0 0 0
Tot 9,004 3,586 9,004 5,403 0 15 0 0 0 0 0 0 0 0
[ 0 - 3M [ 0 0 0 0 0 0 0 0 0 0 0 0 0 0
[ 3M - 1Y [ 0 0 0 0 0 0 0 0 0 0 0 0 0 0
[ 1Y - 2Y [ 0 0 0 0 0 0 0 0 0 0 0 0 0 0
[ 2Y - 3Y [ 0 0 0 0 0 0 0 0 0 0 0 0 0 0
[3Y - 5Y [ 0 0 0 0 0 0 0 0 0 0 0 0 0 0
[5Y - 10Y [ 0 0 0 0 0 0 0 0 0 0 0 0 0 0
[10Y - more 0 0 0 0 0 0 0 0 0 0 0 0 0 0
Tot 0 0 0 0 0 0 0 0 0 0 0 0 0 0
Latvia
Germany
Greece
Hungary
Iceland
Ireland
Italy
Croatia
Liechtenstein

2014 EU-wide Stress Test - Sovereign Exposure
(mln EUR)
Residual Maturity Country / Region
GROSS DIRECT LONG
EXPOSURES (accounting value gross
of provisions)
(1)
NET DIRECT POSITIONS (gross exposures (long) net of cash short
positions of sovereign debt to other counterpaties only where there
is a maturity matching)
(1)
DIRECT SOVEREIGN EXPOSURES IN DERIVATIVES (1)
of which: loans
and advances
of which: AFS
banking book
of which: FVO
(designated at fair
value through
profit&loss)
banking book
of which: Financial
assets held for
trading
(2)
Derivatives with positive fair value at
31/12/2013
Derivatives with negative fair value at
31/12/2013
Derivatives with positive fair value
at 31/12/2013
Derivatives with negative fair
value at 31/12/2013
VALUES AS OF 31/12/2013 VALUES AS OF 31/12/2013 VALUES AS OF 31/12/2013
INDIRECT SOVEREIGN EXPOSURES (3) (on and off balance sheet)
Fair-value at
31/12/2013 (+)Notional value
Fair-value at
31/12/2013 (-)Notional value
Fair-value at
31/12/2013 (+)Notional value
Fair-value at 31/12/2013
(-)
Austria
Notional value
[ 0 - 3M [ 0 0 0 0 0 0 0 0 0 0 0 0 0 0
[ 3M - 1Y [ 0 0 0 0 0 0 0 0 0 0 0 0 0 0
[ 1Y - 2Y [ 0 0 0 0 0 0 0 0 0 0 0 0 0 0
[ 2Y - 3Y [ 0 0 0 0 0 0 0 0 0 0 0 0 0 0
[3Y - 5Y [ 0 0 0 0 0 0 0 0 0 0 0 0 0 0
[5Y - 10Y [ 0 0 0 0 0 0 0 0 0 0 0 0 0 0
[10Y - more 0 0 0 0 0 0 0 0 0 0 0 0 0 0
Tot 0 0 0 0 0 0 0 0 0 0 0 0 0 0
Lithuania
Luxembourg
Malta
Netherlands
Norway
Poland
Portugal
Romania
Slovakia

2014 EU-wide Stress Test - Sovereign Exposure
(mln EUR)
Residual Maturity Country / Region
GROSS DIRECT LONG
EXPOSURES (accounting value gross
of provisions)
(1)
NET DIRECT POSITIONS (gross exposures (long) net of cash short
positions of sovereign debt to other counterpaties only where there
is a maturity matching)
(1)
DIRECT SOVEREIGN EXPOSURES IN DERIVATIVES (1)
of which: loans
and advances
of which: AFS
banking book
of which: FVO
(designated at fair
value through
profit&loss)
banking book
of which: Financial
assets held for
trading
(2)
Derivatives with positive fair value at
31/12/2013
Derivatives with negative fair value at
31/12/2013
Derivatives with positive fair value
at 31/12/2013
Derivatives with negative fair
value at 31/12/2013
VALUES AS OF 31/12/2013 VALUES AS OF 31/12/2013 VALUES AS OF 31/12/2013
INDIRECT SOVEREIGN EXPOSURES (3) (on and off balance sheet)
Fair-value at
31/12/2013 (+)Notional value
Fair-value at
31/12/2013 (-)Notional value
Fair-value at
31/12/2013 (+)Notional value
Fair-value at 31/12/2013
(-)
Austria
Notional value
[ 0 - 3M [ 0 0 0 0 0 0 0 0 0 0 0 0 0 0
[ 3M - 1Y [ 0 0 0 0 0 0 0 0 0 0 0 0 0 0
[ 1Y - 2Y [ 0 0 0 0 0 0 0 0 0 0 0 0 0 0
[ 2Y - 3Y [ 0 0 0 0 0 0 0 0 0 0 0 0 0 0
[3Y - 5Y [ 0 0 0 0 0 0 0 0 0 0 0 0 0 0
[5Y - 10Y [ 0 0 0 0 0 0 0 0 0 0 0 0 0 0
[10Y - more 0 0 0 0 0 0 0 0 0 0 0 0 0 0
Tot 0 0 0 0 0 0 0 0 0 0 0 0 0 0
[ 0 - 3M [ 0 0 0 0 0 0 0 0 0 0 0 0 0 0
[ 3M - 1Y [ 0 0 0 0 0 0 0 0 0 0 0 0 0 0
[ 1Y - 2Y [ 0 0 0 0 0 0 0 0 0 0 0 0 0 0
[ 2Y - 3Y [ 0 0 0 0 0 0 0 0 0 0 0 0 0 0
[3Y - 5Y [ 0 0 0 0 0 0 0 0 0 0 0 0 0 0
[5Y - 10Y [ 0 0 0 0 0 0 0 0 0 0 0 0 0 0
[10Y - more 0 0 0 0 0 0 0 0 0 0 0 0 0 0
Tot 0 0 0 0 0 0 0 0 0 0 0 0 0 0
[ 0 - 3M [ 0 0 0 0 0 0 0 0 0 0 0 0 0 0
[ 3M - 1Y [ 0 0 0 0 0 0 0 0 0 0 0 0 0 0
[ 1Y - 2Y [ 0 0 0 0 0 0 0 0 0 0 0 0 0 0
[ 2Y - 3Y [ 0 0 0 0 0 0 0 0 0 0 0 0 0 0
[3Y - 5Y [ 0 0 0 0 0 0 0 0 0 0 0 0 0 0
[5Y - 10Y [ 0 0 0 0 0 0 0 0 0 0 0 0 0 0
[10Y - more 0 0 0 0 0 0 0 0 0 0 0 0 0 0
Tot 0 0 0 0 0 0 0 0 0 0 0 0 0 0
[ 0 - 3M [ 0 0 0 0 0 0 0 0 0 0 0 0 0 0
[ 3M - 1Y [ 0 0 0 0 0 0 0 0 0 0 0 0 0 0
[ 1Y - 2Y [ 0 0 0 0 0 0 0 0 0 0 0 0 0 0
[ 2Y - 3Y [ 0 0 0 0 0 0 0 0 0 0 0 0 0 0
[3Y - 5Y [ 0 0 0 0 0 0 0 0 0 0 0 0 0 0
[5Y - 10Y [ 0 0 0 0 0 0 0 0 0 0 0 0 0 0
[10Y - more 0 0 0 0 0 0 0 0 0 0 0 0 0 0
Tot 0 0 0 0 0 0 0 0 0 0 0 0 0 0
[ 0 - 3M [ 0 0 0 0 0 0 0 0 0 0 0 0 0 0
[ 3M - 1Y [ 0 0 0 0 0 0 0 0 0 0 0 0 0 0
[ 1Y - 2Y [ 0 0 0 0 0 0 0 0 0 0 0 0 0 0
[ 2Y - 3Y [ 0 0 0 0 0 0 0 0 0 0 0 0 0 0
[3Y - 5Y [ 0 0 0 0 0 0 0 0 0 0 0 0 0 0
[5Y - 10Y [ 0 0 0 0 0 0 0 0 0 0 0 0 0 0
[10Y - more 0 0 0 0 0 0 0 0 0 0 0 0 0 0
Tot 0 0 0 0 0 0 0 0 0 0 0 0 0 0
[ 0 - 3M [ 0 0 0 0 0 0 0 0 0 0 0 0 0 0
[ 3M - 1Y [ 0 0 0 0 0 0 0 0 0 0 0 0 0 0
[ 1Y - 2Y [ 0 0 0 0 0 0 0 0 0 0 0 0 0 0
[ 2Y - 3Y [ 0 0 0 0 0 0 0 0 0 0 0 0 0 0
[3Y - 5Y [ 0 0 0 0 0 0 0 0 0 0 0 0 0 0
[5Y - 10Y [ 0 0 0 0 0 0 0 0 0 0 0 0 0 0
[10Y - more 0 0 0 0 0 0 0 0 0 0 0 0 0 0
Tot 0 0 0 0 0 0 0 0 0 0 0 0 0 0
[ 0 - 3M [ 0 0 0 0 0 0 0 0 0 0 0 0 0 0
[ 3M - 1Y [ 0 0 0 0 0 0 0 0 0 0 0 0 0 0
[ 1Y - 2Y [ 0 0 0 0 0 0 0 0 0 0 0 0 0 0
[ 2Y - 3Y [ 0 0 0 0 0 0 0 0 0 0 0 0 0 0
[3Y - 5Y [ 0 0 0 0 0 0 0 0 0 0 0 0 0 0
[5Y - 10Y [ 0 0 0 0 0 0 0 0 0 0 0 0 0 0
[10Y - more 0 0 0 0 0 0 0 0 0 0 0 0 0 0
Tot 0 0 0 0 0 0 0 0 0 0 0 0 0 0
[ 0 - 3M [ 0 0 0 0 0 0 0 0 0 0 0 0 0 0
[ 3M - 1Y [ 0 0 0 0 0 0 0 0 0 0 0 0 0 0
[ 1Y - 2Y [ 0 0 0 0 0 0 0 0 0 0 0 0 0 0
[ 2Y - 3Y [ 0 0 0 0 0 0 0 0 0 0 0 0 0 0
[3Y - 5Y [ 0 0 0 0 0 0 0 0 0 0 0 0 0 0
[5Y - 10Y [ 0 0 0 0 0 0 0 0 0 0 0 0 0 0
[10Y - more 0 0 0 0 0 0 0 0 0 0 0 0 0 0
Tot 0 0 0 0 0 0 0 0 0 0 0 0 0 0
[ 0 - 3M [ 0 0 0 0 0 0 0 0 0 0 0 0 0 0
[ 3M - 1Y [ 0 0 0 0 0 0 0 0 0 0 0 0 0 0
[ 1Y - 2Y [ 0 0 0 0 0 0 0 0 0 0 0 0 0 0
[ 2Y - 3Y [ 0 0 0 0 0 0 0 0 0 0 0 0 0 0
[3Y - 5Y [ 0 0 0 0 0 0 0 0 0 0 0 0 0 0
[5Y - 10Y [ 0 0 0 0 0 0 0 0 0 0 0 0 0 0
[10Y - more 0 0 0 0 0 0 0 0 0 0 0 0 0 0
Tot 0 0 0 0 0 0 0 0 0 0 0 0 0 0
Spain
Slovenia
Sweden
United Kingdom
Australia
Canada
Hong Kong
Japan
U.S.

2014 EU-wide Stress Test - Sovereign Exposure
(mln EUR)
Residual Maturity Country / Region
GROSS DIRECT LONG
EXPOSURES (accounting value gross
of provisions)
(1)
NET DIRECT POSITIONS (gross exposures (long) net of cash short
positions of sovereign debt to other counterpaties only where there
is a maturity matching)
(1)
DIRECT SOVEREIGN EXPOSURES IN DERIVATIVES (1)
of which: loans
and advances
of which: AFS
banking book
of which: FVO
(designated at fair
value through
profit&loss)
banking book
of which: Financial
assets held for
trading
(2)
Derivatives with positive fair value at
31/12/2013
Derivatives with negative fair value at
31/12/2013
Derivatives with positive fair value
at 31/12/2013
Derivatives with negative fair
value at 31/12/2013
VALUES AS OF 31/12/2013 VALUES AS OF 31/12/2013 VALUES AS OF 31/12/2013
INDIRECT SOVEREIGN EXPOSURES (3) (on and off balance sheet)
Fair-value at
31/12/2013 (+)Notional value
Fair-value at
31/12/2013 (-)Notional value
Fair-value at
31/12/2013 (+)Notional value
Fair-value at 31/12/2013
(-)
Austria
Notional value
[ 0 - 3M [ 0 0 0 0 0 0 0 0 0 0 0 0 0 0
[ 3M - 1Y [ 0 0 0 0 0 0 0 0 0 0 0 0 0 0
[ 1Y - 2Y [ 0 0 0 0 0 0 0 0 0 0 0 0 0 0
[ 2Y - 3Y [ 0 0 0 0 0 0 0 0 0 0 0 0 0 0
[3Y - 5Y [ 0 0 0 0 0 0 0 0 0 0 0 0 0 0
[5Y - 10Y [ 0 0 0 0 0 0 0 0 0 0 0 0 0 0
[10Y - more 0 0 0 0 0 0 0 0 0 0 0 0 0 0
Tot 0 0 0 0 0 0 0 0 0 0 0 0 0 0
[ 0 - 3M [ 0 0 0 0 0 0 0 0 0 0 0 0 0 0
[ 3M - 1Y [ 0 0 0 0 0 0 0 0 0 0 0 0 0 0
[ 1Y - 2Y [ 0 0 0 0 0 0 0 0 0 0 0 0 0 0
[ 2Y - 3Y [ 0 0 0 0 0 0 0 0 0 0 0 0 0 0
[3Y - 5Y [ 0 0 0 0 0 0 0 0 0 0 0 0 0 0
[5Y - 10Y [ 0 0 0 0 0 0 0 0 0 0 0 0 0 0
[10Y - more 0 0 0 0 0 0 0 0 0 0 0 0 0 0
Tot 0 0 0 0 0 0 0 0 0 0 0 0 0 0
[ 0 - 3M [ 0 0 0 0 0 0 0 0 0 0 0 0 0 0
[ 3M - 1Y [ 0 0 0 0 0 0 0 0 0 0 0 0 0 0
[ 1Y - 2Y [ 0 0 0 0 0 0 0 0 0 0 0 0 0 0
[ 2Y - 3Y [ 0 0 0 0 0 0 0 0 0 0 0 0 0 0
[3Y - 5Y [ 0 0 0 0 0 0 0 0 0 0 0 0 0 0
[5Y - 10Y [ 0 0 0 0 0 0 0 0 0 0 0 0 0 0
[10Y - more 0 0 0 0 0 0 0 0 0 0 0 0 0 0
Tot 0 0 0 0 0 0 0 0 0 0 0 0 0 0
[ 0 - 3M [ 0 0 0 0 0 0 0 0 0 0 0 0 0 0
[ 3M - 1Y [ 0 0 0 0 0 0 0 0 0 0 0 0 0 0
[ 1Y - 2Y [ 0 0 0 0 0 0 0 0 0 0 0 0 0 0
[ 2Y - 3Y [ 0 0 0 0 0 0 0 0 0 0 0 0 0 0
[3Y - 5Y [ 0 0 0 0 0 0 0 0 0 0 0 0 0 0
[5Y - 10Y [ 0 0 0 0 0 0 0 0 0 0 0 0 0 0
[10Y - more 0 0 0 0 0 0 0 0 0 0 0 0 0 0
Tot 0 0 0 0 0 0 0 0 0 0 0 0 0 0
[ 0 - 3M [ 0 0 0 0 0 0 0 0 0 0 0 0 0 0
[ 3M - 1Y [ 0 0 0 0 0 0 0 0 0 0 0 0 0 0
[ 1Y - 2Y [ 0 0 0 0 0 0 0 0 0 0 0 0 0 0
[ 2Y - 3Y [ 0 0 0 0 0 0 0 0 0 0 0 0 0 0
[3Y - 5Y [ 0 0 0 0 0 0 0 0 0 0 0 0 0 0
[5Y - 10Y [ 0 0 0 0 0 0 0 0 0 0 0 0 0 0
[10Y - more 0 0 0 0 0 0 0 0 0 0 0 0 0 0
Tot 0 0 0 0 0 0 0 0 0 0 0 0 0 0
[ 0 - 3M [ 0 0 0 0 0 0 0 0 0 0 0 0 0 0
[ 3M - 1Y [ 0 0 0 0 0 0 0 0 0 0 0 0 0 0
[ 1Y - 2Y [ 0 0 0 0 0 0 0 0 0 0 0 0 0 0
[ 2Y - 3Y [ 0 0 0 0 0 0 0 0 0 0 0 0 0 0
[3Y - 5Y [ 0 0 0 0 0 0 0 0 0 0 0 0 0 0
[5Y - 10Y [ 0 0 0 0 0 0 0 0 0 0 0 0 0 0
[10Y - more 1 0 1 0 0 1 0 0 0 0 0 0 0 0
Tot 1 0 1 0 0 1 0 0 0 0 0 0 0 0
[ 0 - 3M [ 0 0 0 0 0 0 0 0 0 0 0 0 0 0
[ 3M - 1Y [ 0 0 0 0 0 0 0 0 0 0 0 0 0 0
[ 1Y - 2Y [ 0 0 0 0 0 0 0 0 0 0 0 0 0 0
[ 2Y - 3Y [ 0 0 0 0 0 0 0 0 0 0 0 0 0 0
[3Y - 5Y [ 0 0 0 0 0 0 0 0 0 0 0 0 0 0
[5Y - 10Y [ 0 0 0 0 0 0 0 0 0 0 0 0 0 0
[10Y - more 0 0 0 0 0 0 0 0 0 0 0 0 0 0
Tot 0 0 0 0 0 0 0 0 0 0 0 0 0 0
[ 0 - 3M [ 0 0 0 0 0 0 0 0 0 0 0 0 0 0
[ 3M - 1Y [ 0 0 0 0 0 0 0 0 0 0 0 0 0 0
[ 1Y - 2Y [ 0 0 0 0 0 0 0 0 0 0 0 0 0 0
[ 2Y - 3Y [ 0 0 0 0 0 0 0 0 0 0 0 0 0 0
[3Y - 5Y [ 0 0 0 0 0 0 0 0 0 0 0 0 0 0
[5Y - 10Y [ 0 0 0 0 0 0 0 0 0 0 0 0 0 0
[10Y - more 0 0 0 0 0 0 0 0 0 0 0 0 0 0Tot 0 0 0 0 0 0 0 0 0 0 0 0 0 0
Notes and definitions
(1) The exposures reported cover only exposures to central, regional and local governments on immediate borrower basis, and do not include exposures to other counterparts with full or partial government guarantees
(2) The banks disclose the exposures in the "Financial assets held for trading" portfolio after offsetting the cash short positions having the same maturities. (3) The exposures reported include the positions towards counterparts (other than sovereign) on sovereign credit risk (i.e. CDS, financial guarantees) booked in all the accounting portfolio (on-off balance sheet). 'Irrespective of the denomination and or accounting classification of the positions the economic substance over the form must be used as a criteria for the identification of the exposures to be included in this column. This item does not include exposures to counterparts (other than sovereign) with full or partial government guarantees by central, regional and local governments
Latin America and the
Caribbean
Africa
Others
Middle East
China
Switzerland
Other advanced economies
non EEA
Other Central and eastern
Europe countries non EEA

2014 EU-wide Stress TestCapital
(mln EUR) CRR / CRDIV DEFINITION OF CAPITAL As of 31/12/2013 As of 31/12/2014 As of 31/12/2015 As of 31/12/2016 As of 31/12/2014 As of 31/12/2015 As of 31/12/2016 COREP CODE REGULATION
A OWN FUNDS 1,549 1,317 1,038 1,144 752 269 5 CA1 {1} Articles 4(118) and 72 of CRR
A.1COMMON EQUITY TIER 1 CAPITAL (net of deductions and after applying
transitional adjustments)898 843 671 547 281 -75 -551 CA1 {1.1.1} Article 50 of CRR
A.1.1Capital instruments eligible as CET1 Capital (including share premium and net own
capital instruments)3,173 3,173 3,173 3,173 3,173 3,173 3,173 CA1 {1.1.1.1}
Articles 26(1) points (a) and (b), 27 to 29, 36(1) point (f)
and 42 of CRR
A.1.1.1 Of which: CET1 instruments subscribed by Government 0 0 0 0 0 0 0 - -
A.1.2 Retained earnings -1,879 -2,071 -2,173 -2,203 -2,413 -2,732 -3,090 CA1 {1.1.1.2}Articles 26(1) point (c), 26(2) and 36 (1) points (a) and (l)
of CRR
A.1.3 Accumulated other comprehensive income -133 -134 -135 -135 -338 -270 -287 CA1 {1.1.1.3} Articles 4(100), 26(1) point (d) and 36 (1) point (l) of CRR
A.1.3.1 Of which: arising from unrealised gains/losses from Sovereign exposure in AFS
portfolio-11 -11 -11 -11 -212 -144 -161 - -
A.1.3.2 Of which: arising from unrealised gains/losses from the rest of AFS portfolio 1 0 -1 -1 -3 -6 -7 - -
A.1.4 Other Reserves 91 91 91 91 91 91 91 CA1 {1.1.1.4} Articles 4(117) and 26(1) point (e) of CRR
A.1.5 Funds for general banking risk 0 0 0 0 0 0 0 CA1 {1.1.1.5} Articles 4(112), 26(1) point (f) and 36 (1) point (l) of CRR
A.1.6 Minority interest given recognition in CET1 capital 22 22 22 22 22 22 22 CA1 {1.1.1.7} Article 84 of CRR
A.1.7Adjustments to CET1 due to prudential filters excluding those from unrealised
gains/losses from AFS portfolio-156 -156 -156 -156 -156 -156 -156 CA1 {1.1.1.9} Articles 32 to 35 of and 36 (1) point (l) of CRR
A.1.8Adjustments to CET1 due to prudential filters from unrealised gains/losses from
Sovereign Exposure in AFS portfolio9 9 7 4 170 87 64 -
A.1.9 (-) Intangible assets (including Goodwill) -177 -84 -84 -84 -84 -84 -84CA1 {1.1.1.10 +
1.1.1.11}
Articles 4(113), 36(1) point (b) and 37 of CRR. Articles
4(115), 36(1) point (b) and 37 point (a) of CCR
A.1.10(-) DTAs that rely on future profitability and do not arise from temporary
differences net of associated DTLs -84 -60 -31 -31 -84 -84 -84 CA1 {1.1.1.12} Articles 36(1) point (c) and 38 of CRR
A.1.11 (-) IRB shortfall of credit risk adjustments to expected losses 0 0 0 0 0 0 0 CA1 {1.1.1.13} Articles 36(1) point (d), 40 and 159 of CRR
A.1.12 (-) Defined benefit pension fund assets 0 0 0 0 0 0 0 CA1 {1.1.1.14} Articles 4(109), 36(1) point (e) and 41 of CRR
A.1.13 (-) Reciprocal cross holdings in CET1 Capital 0 0 0 0 0 0 0 CA1 {1.1.1.15} Articles 4(122), 36(1) point (g) and 44 of CRR
A.1.14 (-) Excess deduction from AT1 items over AT1 Capital 0 -103 0 0 -518 -213 -148 CA1 {1.1.1.16} Article 36(1) point (j) of CRR
A.1.15(-) Deductions related to assets which can alternatively be subject to a 1.250% risk
weight0 0 0 0 0 0 0
CA1 {1.1.1.17 to
1.1.1.21}
Articles 4(36), 36(1) point (k) (i) and 89 to 91 of CRR;
Articles 36(1) point (k) (ii), 243(1) point (b), 244(1) point
(b) and 258 of CRR; Articles 36(1) point k) (iii) and 379(3)
of CRR; Articles 36(1) point k) (iv) and 153(8) of CRR and
A.1.15.1 Of which: from securitisation positions (-) 0 0 0 0 0 0 0 CA1 {1.1.1.18.1}Articles 36(1) point (k) (ii), 243(1) point (b), 244(1) point
(b) and 258 of CRR
A.1.16(-) Holdings of CET1 capital instruments of financial sector entities where the
institiution does not have a significant investment-1 0 0 0 0 0 15 CA1 {1.1.1.22}
Articles 4(27), 36(1) point (h); 43 to 46, 49 (2) and (3) and
79 of CRR
A.1.17(-) Deductible DTAs that rely on future profitability and arise from temporary
differences-19 -13 -31 -37 -111 -137 -184 CA1 {1.1.1.23}
Articles 36(1) point (c) and 38; Articles 48(1) point (a) and
48(2) of CRR
A.1.18(-) Holdings of CET1 capital instruments of financial sector entities where the
institiution has a significant investment-198 -191 -208 -214 -202 -256 -295 CA1 {1.1.1.24}
Articles 4(27); 36(1) point (i); 43, 45; 47; 48(1) point (b);
49(1) to (3) and 79 of CRR
A.1.19 (-) Amount exceding the 17.65% threshold -128 -151 -122 -114 -240 -164 -143 CA1 {1.1.1.25} Article 470 of CRR
A.1.20 Transitional adjustments 377 512 317 230 972 648 555CA1 {1.1.1.6 + 1.1.8 +
1.1.26}-
A.1.20.1 Transitional adjustments due to grandfathered CET1 Capital instruments (+/-) 0 0 0 0 0 0 0 CA1 {1.1.1.6}
Articles 483(1) to (3), and 484 to 487 of CRR
A.1.20.2 Transitional adjustments due to additional minority interests (+/-) 27 0 0 0 0 0 0 CA1 {1.1.1.8}
Articles 479 and 480 of CRR
A.1.20.3Other transitional adjustments to CET1 Capital excl. adjustments for Sovereign
exposure in AFS (+/-)351 512 317 230 972 648 555 CA1 {1.1.1.26}
Articles 469 to 472, 478 and 481 of CRR
A.2ADDITIONAL TIER 1 CAPITAL (net of deductions and after transitional
adjustments)36 0 12 44 0 0 0 CA1 {1.1.2} Article 61 of CRR
A.2.1 Of which: (+) Other existing support government measures 0 0 0 0 0 0 0 - -
A.3 TIER 1 CAPITAL (net of deductions and after transitional adjustments) 934 843 683 591 281 -75 -551 CA1 {1.1} Article 25 of CRR
A.4 TIER 2 CAPITAL (net of deductions and after transitional adjustments) 616 474 355 553 470 344 557 CA1 {1.2} Article 71 of CRR
B TOTAL RISK EXPOSURE AMOUNT 22,989 22,836 23,133 23,346 23,051 23,240 23,337 CA2 {1} Articles 92(3), 95, 96 and 98 of CRR
B.1of which: stemming from exposures that fall below the 10% / 15% limits for
CET1 deduction (+)573 0 0 0 0 0 0
Articles 36(1) points (a) and (i); Article 38 and Article 48 of
CRR
B.2 of which: stemming from from CVA capital requirements (+) 29 0 0 0 0 0 0 Article 381 to 386 of CRR
B.3of which: stemming from higher asset correlation parameter against exposures
to large financial institutions under IRB the IRB approaches to credit risk (+)0 0 0 0 0 0 0 Articles 153(2) of CRR
B.4of which: stemming from the application of the supporting factor to increase
lending to SMEs (-)-634 0 0 0 0 0 0 Recital (44) of CRR
B.5
of which: stemming from the effect of exposures that were previously part of
Risk Exposure amount and receive a deduction treatment under CRR/CRDIV (-
)
0 0 0 0 0 0 0 -
B.6 of which: others subject to the discretion of National Competent Authorities 0 0 0 0 0 0 0 Article 124 to 164 of CRR
C.1 Common Equity Tier 1 Capital ratio 3.90% 3.69% 2.90% 2.34% 1.22% -0.32% -2.36% CA3 {1} -
C.2 Tier 1 Capital ratio 4.06% 3.69% 2.95% 2.53% 1.22% -0.32% -2.36% CA3 {3} -
C.3 Total Capital ratio 6.74% 5.77% 4.49% 4.90% 3.26% 1.16% 0.02% CA3 {5} -
D Common Equity Tier 1 Capital Threshold 1,827 1,851 1,868 1,268 1,278 1,284
ETotal amount of instruments with mandatory conversion into ordinary shares upon
a fixed date in the 2014 -2016 period (cumulative conversions) (1)0 0 0 0 0 0
F
Total Additional Tier 1 and Tier 2 instruments eligible as regulatory capital under
the CRR provisions that convert into Common Equity Tier 1 or are written down
upon a trigger event (2)
0 0 0
F.1Of which: eligible instruments whose trigger is above CET1 capital ratio in the
adverse scenario (2)0 0 0
G Fully Loaded Common Equity Tier 1 Capital ratio (3) 1.35% -4.74%
(1) Conversions not considered for CET1 computation(2) Excluding instruments included in E(3) Memorandum item based on a fully implemented CRR/CRD IV definition of Common Equity Tier 1 capital including 60% of unrealised gains/losses from Sovereign Exposure in AFS portfolio
Memorandum items
Baseline Scenario Adverse Scenario
OWN FUNDS
OWN FUNDS
REQUIREMENTS
CAPITAL RATIOS (%) -
Transitional period

2014 EU-wide Stress Test - Restructuring scenarios
(mln EUR)
2013 0 0
2014 0 0 0 0
2015 0 0 0 0
2016 0 0 0 0
Total 0 0 0 0
Effects of mandatory restructuring plans publicly announced before 31 December 2013 and formally agreed with the European Commission.
Baseline scenario Adverse scenarioNarrative description of the transactions. (type, date of
completion/commitment, portfolios, subsidiaries, branches) CET1 impact
Risk exposure
amount impactCET1 impact
Risk exposure
amount impact

2014 EU-wide Stress Test
Outcome of the Stress Test based on the Restructuring plan for banks whose plan was formally agreed with the European Commission after 31 December 2013
(mln EUR)
As of
31/12/2013
As of
31/12/2014
As of
31/12/2015
As of
31/12/2016
As of
31/12/2014
As of
31/12/2015
As of
31/12/2016
COMMON EQUITY TIER 1 CAPITAL (net of deductions and after applying transitional adjustments)
TOTAL RISK EXPOSURE AMOUNT
COMMON EQUITY TIER 1 RATIO #DIV/0! #DIV/0! #DIV/0! #DIV/0! #DIV/0! #DIV/0! #DIV/0!
Baseline scenario Adverse scenario
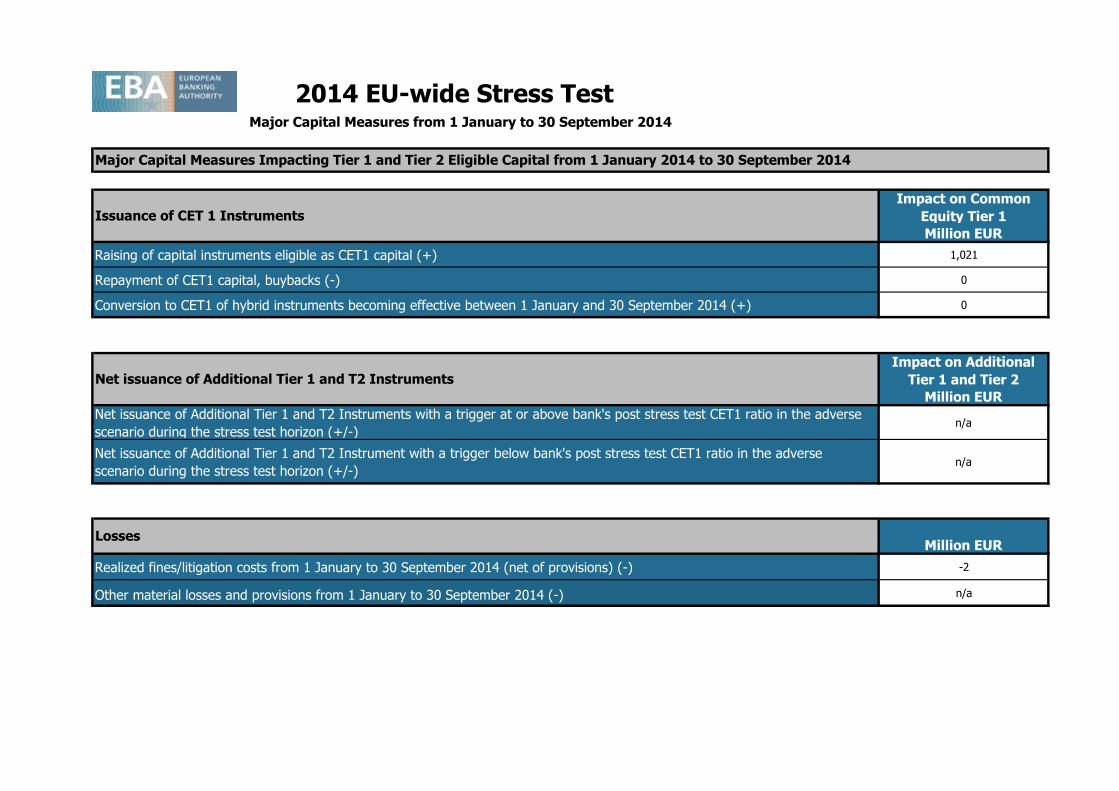
2014 EU-wide Stress Test
Impact on Common
Equity Tier 1
Million EUR
Raising of capital instruments eligible as CET1 capital (+) 1,021
Repayment of CET1 capital, buybacks (-) 0
Conversion to CET1 of hybrid instruments becoming effective between 1 January and 30 September 2014 (+) 0
Impact on Additional
Tier 1 and Tier 2
Million EUR
Net issuance of Additional Tier 1 and T2 Instruments with a trigger at or above bank's post stress test CET1 ratio in the adverse
scenario during the stress test horizon (+/-)n/a
Net issuance of Additional Tier 1 and T2 Instrument with a trigger below bank's post stress test CET1 ratio in the adverse
scenario during the stress test horizon (+/-)n/a
Million EUR
Realized fines/litigation costs from 1 January to 30 September 2014 (net of provisions) (-) -2
Other material losses and provisions from 1 January to 30 September 2014 (-) n/a
Major Capital Measures from 1 January to 30 September 2014
Losses
Net issuance of Additional Tier 1 and T2 Instruments
Issuance of CET 1 Instruments
Major Capital Measures Impacting Tier 1 and Tier 2 Eligible Capital from 1 January 2014 to 30 September 2014