Embed Size (px)
Citation preview

Financial Results Meeting: FY Ended March 2017(April 1, 2016 – March 31, 2017)
Financial Results Meeting: FY Ended March 2017(April 1, 2016 – March 31, 2017)
May 12, 2017May 12, 2017
Summary of Business Results for FY ended March 31, 2017, and Forecast for FY Ending March 2018
Business Strategies and Measures
02 Financial Summary
03 Year over Year Comparisons of Net Sales, Cost of Sales, and SGA Expenses
04 Balance Sheets (1)
05 Balance Sheets (2)
06 Cash Flow Statements
07 Net Sales and Operating Income by Segment
08 Operating Margins by Segment
09-11 Review of Operations
12 Net Sales by Business
13 Gross Margin by Transportation Mode
14 Performance Forecast for FY Ending March 2018
15 Performance Forecast by Business & Segmentfor FY Ending March 2018
17 Outline of Medium-Term Management Plan(FY Ended March 2017 - FY Ending March 2019)
18 Medium-Term Management Plan Results and Numerical Targets (Revised on May 11, 2017)
19 Net Sales and Operating Income Targets by Segment (FY Ending March 2018/FY Ending March 2019)
20 Basic Strategies21 KWE & APLL – Future Direction of Cooperation22-23 Priority Measures 201724 Dividends
Contents
Supplemental Materials
1
26 Freight Volume by Segment (Air Freight)27 Freight Volume by Segment (Sea Freight)28 Air Freight Export Volume by Destination29 Our Global Network

Financial Summary
Conversion Rate FY ended March 2016 1st 6 months of FY ended
March 2017 FY ended March 2017
US-Dollar ¥121.05 ¥105.29 ¥108.38
EURO ¥134.31 ¥118.15 ¥118.79
HK-Dollar ¥15.61 ¥13.57 ¥13.97
Chinese Yuan ¥19.22 ¥15.94 ¥16.11
Shipments (thousands) Weight (1,000 tons) Volume (1,000 TEU) Amount (¥million)
2
ItemFY ended March 31, 2016 FY ended March 31, 2017
YoY change (%) YoY change (%)
Air freight exports (Weight) 457 (4.4) 495 8.4Air freight imports (Shipments) 1,208 (2.0) 1,207 0.0Sea freight exports (Volume) 455 14.9 556 22.3Sea freight imports (Shipments) 238 1.0 245 2.9Net sales 420,252 28.4 474,330 12.9Operating gross profit 71,762 36.5 85,014 18.5Operating income 15,356 (7.3) 13,075 (14.9)Ordinary income 17,907 (2.8) 13,036 (27.2)Income before income taxes 17,847 9.0 12,486 (30.0)
Net income attributable to owners of the parent(formerly “Net income”)
9,773 (6.8) 4,487 (54.1)
FY ending March 31, 2018 Forecasts
(Revised on May 11, 2017)
510―
581―
500,000―
13,50013,000
―
5,000
Indicators FY endedMarch 2016
FY endedMarch 2017
EPS ¥135.74 ¥62.33
BPS ¥1,741.44 ¥1,627.84
ROE 7.9% 3.7%
*2 APLL was included in the scope of consolidation from the 3Q of FY ended March 31, 2016.
*1 Starting from the current fiscal year, consolidated subsidiaries unified the fiscal year-end from December 31 to March 31, except for APLL, and there is three-month difference in the year-on-year comparison of earnings and freight volume. Accordingly, the results for the current fiscal year represent those for the period from April 1, 2016 to March 31, 2017, and the results for the previous fiscal year represent those for the period from January 1, 2015 to December 31, 2015.

Year over Year Comparisons of Net Sales, Cost of Sales, and SGA Expenses
(Millions of yen)
FY ended March 2016 Ratio to net sales FY ended March 2017 Ratio to net sales
Net sales 420,252 100.0% 474,330 100.0%
Cost of sales 348,489 82.9% 389,316 82.1%
SGA expenses 56,405 13.4% 71,939 15.2%
Operating income 15,356 3.7% 13,075 2.8%
420,252474,330
348,489389,316
56,405 71,939
0
100,000
200,000
300,000
400,000
500,000
FY ended March 2016 FY ended March 2017
Net sales
Cost of sales
SGA expenses
(Millions of yen)
3

Balance Sheets (1)
March 31, 2016 March 31, 2017 Differences
Assets
Current assets 178,454 178,101 (353)Non-current assets 207,447 201,142 (6,304)
Property, plant and equipment 45,944 46,109 165Intangible assets 134,117 128,049 (6,068)Total investments and other assets 27,386 26,983 (402)
Total assets 385,902 379,244 (6,657)Liabilities
Current liabilities 98,406 104,450 6,043Non-current liabilities 152,296 148,777 (3,518)Total liabilities 250,703 253,228 2,525
Net assetsTotal net assets 135,199 126,016 (9,183)Total liabilities and net assets 385,902 379,244 (6,657)
(Millions of yen)
4

5
Balance Sheets (2)
Interest-bearing debt
Capital investments
Main capital investments (FY ended March 2017)・ Logistics facilities (Japan, South Africa, and APLL, etc.), IT/software, vehicles, etc.
Main capital investment plan (FY ending March 2018)・ Logistics facilities (Japan, Thailand, and APLL, etc.), IT/software, vehicles, etc.
Depreciation
FY ended March 2016 FY ended March 2017 Differences
165,510 165,677 +167
FY ended March 2016 FY ended March 2017 Differences FY ending March 2018 (Forecast)
7,112 6,319 (793) 10,130
FY ended March 2016 FY ended March 2017 Differences
5,255 7,095 +1,840
(Millions of yen)
(Millions of yen)
(Millions of yen)

Cash Flow Statements
FY ended March 2016 FY ended March 2017 Differences
Net cash provided by (used in) operating activities 20,143 14,589 (5,553)
Net cash provided by (used in)investing activities (147,207) (5,342) 141,864
Net cash provided by (used in)financing activities 144,744 (5,657) (150,401)
Effect of exchange rate change oncash and cash equivalents (2,476) (1,418) 1,058
Net increase (decrease) in cash and cash equivalents 15,203 2,172 (13,031)
Cash and cash equivalents at beginning of period 48,700 63,903 15,203
Cash and cash equivalents at end of period 63,903 65,506 1,602
(Millions of yen)
6

22.7%
9.1%
6.5%
15.9%9.2%
36.2%
0.4%
23.3%
13.0%
7.1%26.0%
15.6%
14.0% 1.0%
Net Sales and Operating Incomeby Segment
Composition by segment (FY ended March 2017)
(Millions of yen)
7
The Americas
Japan
Europe, Middle East & AfricaEast Asia & Oceania
Southeast Asia
Other
APLL
Net sales Operating incomeSegment Net Sales YoY change Operating Income YoY change
Japan 110,344 0.8% 4,440 7.6%
The Americas 44,240 (14.8%) 2,486 (34.2%)
Europe, Middle East & Africa 31,442 (12.6%) 1,357 36.8%
East Asia & Oceania 76,958 (15.7%) 4,969 (11.6%)
Southeast Asia 44,830 (4.2%) 2,985 54.8%
APLL 175,660 ― 2,671 ―
Amortization of goodwill ― ― (6,024) ―
Other 1,961 (7.0%) 182 (40.9%)
Adjustment (11,108) ― 5 ―Total 474,330 12.9% 13,075 (14.9%)
* “Other” refers to business not included in reportable segments and provides incidental logistics related services within the Group.* APLL was included in the scope of consolidation from the third quarter of FY ended March 31, 2016 and therefore year-on-year comparisons are omitted.
FOREX impacts (consolidated)Net sales: ¥(40,926) millionOperating income:
¥(1,977) million

3.7% 3.8%
7.3%
2.8%
6.2%
4.1%
2.8%
4.0%
5.6%
4.3%
6.5%6.7%
0.0%
2.0%
4.0%
6.0%
8.0%
Operating Margins by Segment
FY ended March 312016 and 2017
8
16/3 17/3 16/3 17/3 16/3 17/3 16/3 17/3 16/3 17/3 16/3 17/3 16/3 17/3
2.8%
1.5%
* APLL’s operating margin is calculated based on the amount before amortization of goodwill.
Japan The Americas Europe, Middle East & Africa
East Asia & Oceania Southeast Asia APLLConsolidated

59.9%28.0%
6.3% 5.8%
9
56.6%34.3%
7.9%1.2%
FY ended March 2016
FY ended March 2017 YoY change
Net sales 51,914 44,240 (7,674)
Operating income 3,778 2,486 (1,291)
(Millions of yen)
FY ended March 2016
FY ended March 2017 YoY change
Net sales 109,427 110,344 917
Operating income 4,127 4,440 313
(Millions of yen)Japan Net Sales by Business
The Americas
Air FreightSea FreightLogisticsOther
Air FreightSea FreightLogisticsOther
・Weak air freight volume during 1H recovered in 2H mainly with electronics・Subsidiaries in Japan had good results
・A backlash from an increased air freight volume bound for the West Coast in 2015・ FOREX impact
Net sales: ¥(5,976) million Operating income: ¥(461) million
Net Sales by Business
Differences
Differences
Review of Operations

48.2%
22.2%
23.4%
6.2%
63.8%19.2%
10.6%6.4%
10
FY endedMarch 2016
FY endedMarch 2017 YoY change
Net sales 35,975 31,442 (4,533)
Operating income 992 1,357 365
(Millions of yen)
FY endedMarch 2016
FY endedMarch 2017 YoY change
Net sales 91,286 76,958 (14,328)
Operating income 5,621 4,969 (651)
(Millions of yen)
Europe, Middle East & Africa
East Asia & Oceania
Air FreightSea FreightLogisticsOther
Air FreightSea FreightLogisticsOther
・Sluggish in Germany and Russia, but favorable in the U.K. and France
・Sluggish air freight volume growth and increase in freight cost ratio ・Logistics: Favorable growth during the period
・FOREX impactNet sales: ¥(5,214) million Operating income: ¥(150) million
・FOREX impactNet sales: ¥(13,074) million Operating income: ¥(803) million
Net Sales by Business
Net Sales by Business
Review of Operations
DifferencesDifferences
Differences

55.2%23.8%
14.5%6.5%
11
FY endedMarch 2016
FY endedMarch 2017 YoY change
Net sales 46,797 44,830 (1,966)
Operating income 1,928 2,985 1,057
(Millions of yen)
FY endedMarch 2016
FY endedMarch 2017 YoY change
Net sales 94,401 175,660 81,259
Operating income (1,404) (3,353) (1,949)
(Millions of yen)
Southeast Asia
APLL2.0%
34.4%63.6%
Air FreightSea FreightLogisticsOther
Air FreightSea FreightLogistics
・ Strong and favorable growth in air freight, sea freight, and logistics
・ Automotive: Parts logistics between U.S. and Mexico, finished car transportation in India had strong growth
・Retail, Consumer, Industrials: Remained the same level as previous year・ Weak growth in sea freight forwarding・ Operating income of 2,671 million yen before amortization of goodwill, however, recorded
operating loss of 3,353 million yen after goodwill amortization
・ FOREX impactNet sales: ¥(6,347) million Operating income: ¥(246) million
Net Sales by Business
Net Sales by Business
Review of Operations
Differences
Differences

Net Sales by Business
BusinessFY ended March 31, 2016 (Results) FY ended March 31, 2017 (Results)
Net sales Net sales YoY change
Freight transportation
Air Freight 168,768 155,486 (7.9%)
Sea Freight 115,961 134,991 16.4%
Logistics 101,380 151,680 49.6%
Other 34,141 32,172 (5.8%)
Total 420,252 474,330 12.9%
Air Freight
Sea Freight
Logistics
Other
Composition by Business
(Millions of yen)FY ended March 31, 2016 FY ended March 31, 2017
12

Gross Margin by Transportation Mode
13
Six months ended
September 30, 2015
FY ended March 31,
2016
Six months ended
September 30, 2016
FY ended March 31,
2017
Air 28.5% 29.3% 30.2% 30.0%
Sea 22.1% 27.8% 30.8% 31.0%
*Gross profit=Net sales-Direct cost
* Gross margin increased due to addition of PO Management and Buyer’s Consolidation related to APLL’s sea freight operation.
** *

Performance Forecast for FY Ending March 2018
Item FY ended March 31, 2017 (Results)
FY ending March 2018 (Forecasts)
YoY change YoY change
Net sales 474,330 12.9% 500,000 5.4%
Operating gross profit 85,014 18.5% 87,946 3.4%
Operating income 13,075 (14.9%) 13,500 3.2%
Ordinary income 13,036 (27.2%) 13,000 (0.3%)
Income before income taxes 12,486 (30.0%) 13,000 4.1%
Net income attributable to owners of the parent 4,487 (54.1%) 5,000 11.4%
(Millions of yen)
14

22.3%
8.6%
6.5%
16.2%8.8%
37.2%
0.4%31.6%
30.2%
31.4%
6.8%
Performance Forecast by Business & Segmentfor FY Ending March 2018
Net Sales by Business
BusinessFY ending March 2018
(Forecast)Net sales Composition
Freight transportation
Air Freight 158,000 31.6%
Sea Freight 151,000 30.2%
Logistics 157,000 31.4%
Other 34,000 6.8%
Total 500,000 100.0%
Air Freight
Sea Freight
Logistics
Other
SegmentFY ending March 2018 (Forecast)
Net sales Operating incomeJapan 114,000 4,110The Americas 44,000 2,700Europe, Middle East & Africa 33,000 1,150East Asia & Oceania 83,000 4,500Southeast Asia 45,000 2,450APLL 190,000 4,230Amortization of goodwill ― (5,890)
Other 2,000 250Adjustment (11,000) ―
Total 500,000 13,500
(Millions of yen)
Net Sales by Segment
(Millions of yen)
The AmericasJapan
Europe, Middle East & AfricaEast Asia & OceaniaSoutheast AsiaAPLL
15
Other

16
Business Strategies and Measures

Net Sales: 568 billion yen Operating Income: 18 billion yenTarget by March 2019 (Revised on May 11, 2017)
17
Outline of Medium-Term Management Plan(FY Ended March 2017 - FY Ending March 2019)
“ Going to the Next Phase !”
<Key Strategies>
Slogan
VisionA superior business partner supporting customers’ strategic objectives and
activities by providing comprehensive innovative supply chain solutions
Become an industry leader providing comprehensive services
Actively respond to customers’ logistics needs at production locations and consumer markets
Improve productivity by leveraging corporate capabilities
<Core Competences>Heighten quality of
operational performanceMaximize efficient utilization
of corporate resourcesStrengthen corporate risk management capabilities
― Toward Air Freight export 700,000 tons/Sea Freight export 700,000 TEUs ―

¥534.0 billion
¥474.3 billion
¥569.0 billion
¥500.0 billion
¥634.0 billion
¥568.0 billion
¥16.4 billion¥13.0 billion
¥19.0 billion¥13.5 billion
¥22.0 billion ¥18.0 billion¥17.0 billion
¥13.0 billion
¥19.5 billion
¥13.0 billion
¥22.3 billion
¥17.6 billion
¥9.8 billion
¥4.4 billion
¥10.9 billion
¥5.0 billion
¥13.3 billion
¥7.2 billion
0
50
100
150
200
250
300
350
0
1,000
2,000
3,000
4,000
5,000
6,000
7,000
(Initial plan) (Results) (Initial plan) (Revised plan) (Initial plan) (Revised plan)
Net sales
Operating income
Ordinary income
Net income attributable to owners of the parent
ROE5.5%
18
Medium-Term Management Plan Results and Numerical Targets (Revised on May 11, 2017)
(Billions of yen) (Billions of yen)
ROE3.7%
1st year (Mar 2017) 2nd year (Mar 2018) 3rd year (Mar 2019)
ROE4.0%
35
30
25
20
15
10
5
0
700
600
500
400
300
200
100
0

19
Net Sales and Operating Income Targets by Segment (FY Ending March 2018/FY Ending March 2019)
110.3 114.0 134.0
44.2 44.048.031.4 33.039.0
77.0 83.091.044.8 45.053.0
175.7 190.0
212.0
0
1,000
2,000
3,000
4,000
5,000
6,000
7,000
Japan The Americas Europe, Middle East & Africa East Asia & Oceania Southeast Asia APLL Other
Others2.0
Others2.0
36.6%36.6%36.6%
20120
Others2.0
4.4 4.1 4.5
2.5 2.7 2.91.3 1.2
1.4
5.0 4.55.0
3.0 2.42.9
1.0
0.10.2
0.3
0
50
100
150
200
Net Sales by Segment Operating Income by Segment
¥474.3 billion
¥13.0 billion
Mar 2017 (Results)
(3.3)Mar 2018 Mar 2019
(Revised plan)
¥500.0 billion
¥568.0 billion
Mar 2018(Revised plan)
(1.6)Mar 2018
(Revised plan)Mar 2017 (Results)
Mar 2019(Revised plan)
(Billions of yen)(Billions of yen)
¥13.5 billion
¥18.0 billion
* Total amount of net sales includes inter-segment elimination. (Results: ¥11.1 billion/Revised plan: ¥11.0 billion)
700
600
500
400
300
200
100
0
200
150
100
50
0
Consolidated

20
Basic Strategies
1. KWE and APLL are focused on expanding their respective business domains through mutual collaboration that leads to overall growth of the Group.
2. The most important task is to expand shipment volume for Air & Sea Freight. Volume expansion is indispensable to our recognition as a global player. By returning to our roots to strengthen our greatest assets in the forwarding business, in addition to KWE’s continued expansion, we aim to maximize the results of joint sales with APLL. This must be accomplished while considering profitability and securing new business strategically.
3. Early on in the process, APLL will establish a reliable system to reinforce its management foundation following the separation from the former parent company.
During the three years of the Mid-Term Management Plan, KWE and APLL will develop a management system to take a leap toward the future.

21
KWE & APLL – Future Direction of Joint Development
・ Priority on Air Freight business from APLL's customer base・ Standardization of Sea Freight platform (Operation, Carrier's relations)・ Facilitation to access to new format (Network, IT Application, Expertise)・ Optimization of IT infrastructure as a group entity
Together, KWE and APLL will fulfill customer’s needs through understanding their supply chain.
22
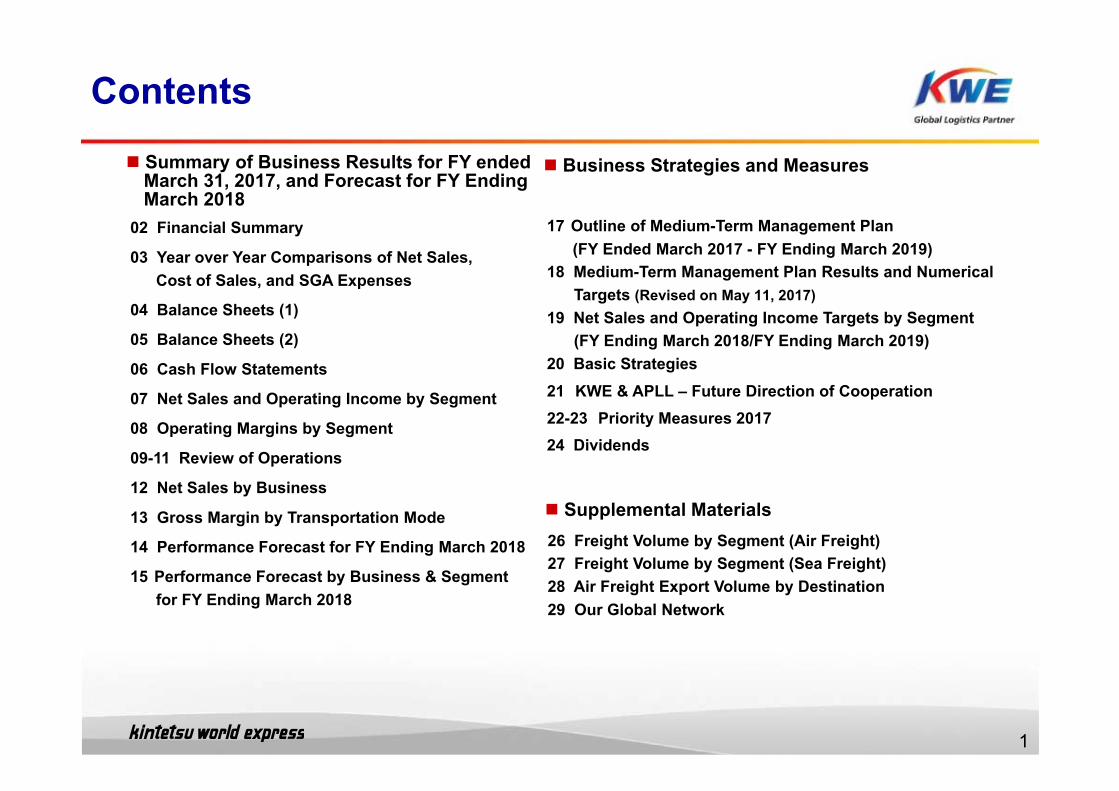
1. Volume expansion of TPEB (Trans-Pacific East Bound) business
Priority Measures 2017
2. Business expansion among Non-Japanese “Corporate Accounts”
3. Promotion of sales strategy by commodityElectronics: Semiconductor, Equipment, Electronic Components
(AI, IoT)Automobile: EV, Automated Driving Related Healthcare : Distribution of KWE/J’s experience and knowledge
among the GroupRetail / Consumer: Cooperation with APLL

23
6. Strengthen group governance for optimal groupmanagement
7. “The Right Person in the Right Place”Development of human resources and optimal placement of human resources
4. Verification of the IT system looking into the future
5. Continued efforts to improve earnings
Priority Measures 2017

Dividends
Cash dividends per share, payout ratio
10.0 10.0
16.0 16.0
15.3% 15.8% 19.2%41.7%
0
10
20
30
40
2014/3 2015/3 2016/3 2017/3 2018/3
Annual¥20.0
Annual¥23.0
Annual dividend per share (yen)
Interim
(Forecast)
Payout ratio↓
Annual¥26.0
Annual¥26.0
Year-end
24
(Plan)
Annual¥26.0
Interim
Year-end
(Plan)
37.4%
*The company conducted a stock split at a ratio of 1:2 of common stock on October 1, 2015. Cash dividends per share is calculated based on the assumption that the stock split was conducted on April 1, 2013.

Supplemental MaterialsSupplemental Materials
25

47,974 53,261
119,743117,476
81,410101,312
119,613 139,408
84,49088,722
0
100,000
200,000
300,000
400,000
500,000
600,000
Mar 2016 Mar 2017
112,463 115,338
465,993
209,663 205,717
307,477 317,414
103,473114,114
464,708
0
300,000
600,000
900,000
1,200,000
1,500,000
Mar 2016 Mar 2017
Freight Volume by Segment (Air Freight)
(Shipments) (Weight: tons) Air Freight Imports Air Freight Exports
111.0%
95.2%
116.5%
1,207,935
Y o Y
100.0%
100.3%
102.6%
90.7%
103.2%
98.1%
98.1%
East Asia & Oceania
Europe, Middle East &
Africa
The Americas
Japan
SoutheastAsia
1,208,425457,462
Y o Y
108.4%
26
495,947
124.4%
* The YoY (%) above represents a comparison of the figures for January to December 2015 and April 2016 to March 2017 except for Japan. (Please refer to *1 on page 2. )
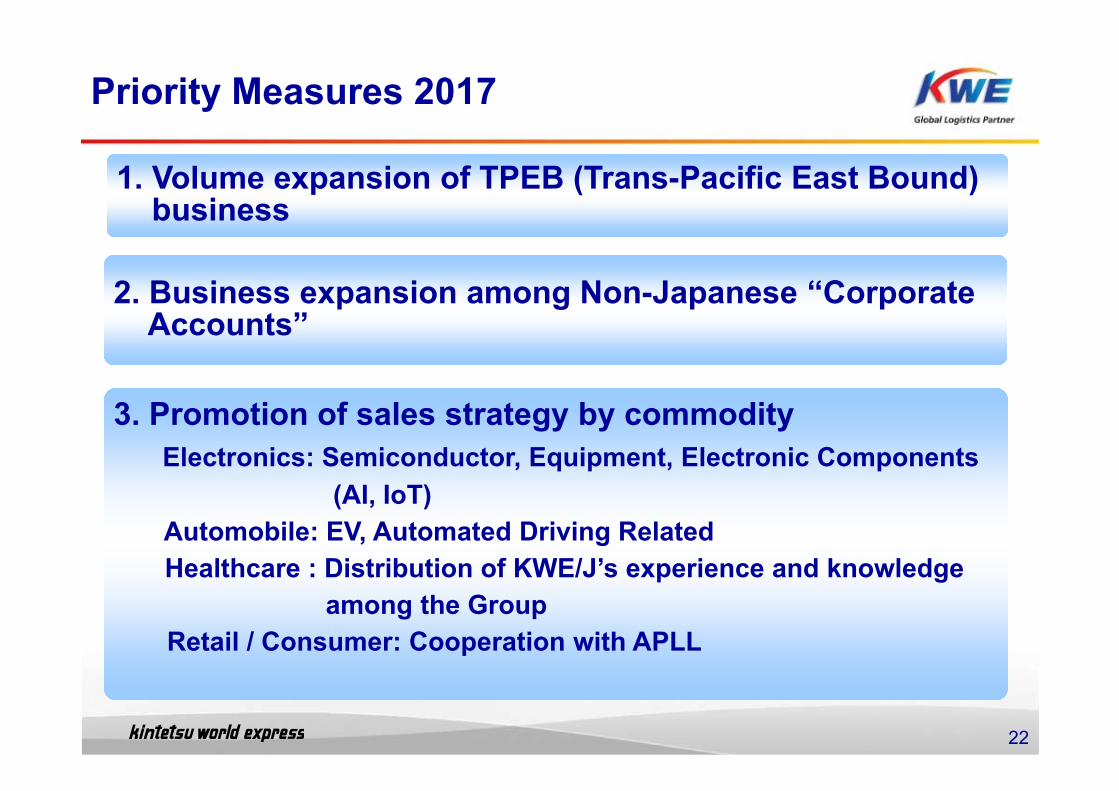
14,333 13,007
54,550
42,568 45,445
102,67398,563
27,850 30,067
55,592
0
50,000
100,000
150,000
200,000
250,000
300,000
Mar 2016 Mar 2017
Freight Volume by Segment (Sea Freight)
(Shipments)
245,742102.9%
98.1%
90.7%
108.0%
104.2%
106.8%East Asia &
Oceania
Europe, Middle East &
Africa
The Americas
Japan
SoutheastAsia238,906
Y o Y
Sea Freight Imports
27
114,207 125,476
37,216 42,90919,269 19,113
141,567153,319
82,473102,975
60,330
112,848
0
100,000
200,000
300,000
400,000
500,000
600,000
Mar 2016 Mar 2017
(Volume: TEUs)Sea Freight Exports
122.3%
115.3%99.2%
108.3%
109.9%
124.9%
556,640Y o Y
455,062 APLL* Note
* Note: APLL was included in the scope of consolidation from the 3Q of FY ended March 31, 2016 and therefore year-on-year comparisons are omitted.* The YoY (%) above represents a comparison of the figures for January to December 2015 and April 2016 to March 2017 except for Japan and APLL. (Please refer to *1 on page 2. )

28
33 30
16 20
36 34
11 13
Mar 2016 Mar 2017
43
21 16
1513
4856
16 15
Mar 2016 Mar 2017
100
(Composition ratio: %)
To East Asia &Oceania
To Europe, Middle East &
Africa
To Japan39 41
14 12
8 7
24 25
15 15
Mar 2016 Mar 2017
22 22
15 11
11 15
38 38
14 14
Mar 2016 Mar 2017
80
60
40
20
0
From East Asia & Oceania
From Europe, Middle East & AfricaFrom The AmericasFrom Japan From Southeast Asia
48 52
108
19 15
19 21
4 4
Mar 2016 Mar 2017
Air Freight Export Volume by Destination
Southeast AsiaTo
Southeast Asia
To the Americas

Other business(2 companies)
Our Global Network
46 countries, 351 cities, 848 locations (as of March 31, 2017)
KWE Group
Europe, Middle East & Africa(16 companies)
〔Includes 1 equity method affiliate〕
Japan(10 companies)
Includes KWE Japan and 3 equity method affiliates
The Americas(5 companies)
Southeast Asia(17 companies)
〔Includes 1 equity method affiliate〕
East Asia & Oceania(24 companies)
〔Includes 4 equity method affiliates〕APLL
(73 companies)〔Includes 1 equity method affiliate〕
Logistics facilities411 locations (2,910,222m²)
29

Kintetsu World Express, Inc.Website: https://www.kwe.co.jp/en/ir
* The information contained herein does not constitute an offer to solicit investment which can only be made by formal prospectus. The forward-looking statements contained herein are not intended to assure or guarantee future performance. Actual results may vary from that projected herein.