Embed Size (px)
Citation preview
Makoto Sakurai Member of the Policy Board
Hysteresis and Sluggish Growth in Wages and Prices: The Case Study of Japan
Presented at the 30th Villa Mondragone
International Economic Seminar in Rome
Bank of Japan J u n e 2 5 , 2 0 1 8
Masahiko Kataoka Director, Secretariat of the Policy Board
(The views expressed here, as well as any remaining errors, are those of the authors and should not be ascribed to the Bank of Japan.)

Abstract
Despite the recent strong economic recovery, growth in wages and prices has been sluggish
across the globe. Japan has come to face this issue ahead of any others. The policy
authorities of each economy could learn something from the case study of Japan. This
article will examine some factors that have restrained growth in wages and prices in Japan,
and discuss the desired policy responses to address this issue.
In relation to the theme of this session – inequality, wages, and growth – factors responsible
for this curb on growth in wages and prices can be divided primarily into two categories.
One is "hysteresis" brought about by past serious economic downturns. Serious economic
downturns have left persistent damage to the supply side of the economy through various
channels, including an increase in the number of "discouraged workers" and "involuntary
non-regular employees," a slowdown in (human) capital accumulation, and the inefficient
business processes that took root under excessive competition. This damage has created the
slack that is easing the upward pressure on prices that has come from an expansion in
demand. Besides this hysteresis, the second category includes factors of a more structural
nature that reduce upward pressure on wages amid an increase in labor demand. These
factors include: an increase in labor participation of women and the elderly, whose wages
are relatively low; firms' and households' anxiety for the future; and technological
innovation in the IT industry, such as robotic process automation (RPA) and artificial
intelligence (AI).
If the supply-demand conditions continue to tighten, the factors in the former category will
eventually mitigate with hysteresis reversing. Moreover, the reversal of hysteresis is a
desirable change, in that it can enrich people's lives. To bring this about, the Bank is
expected to continue to maintain the adequate level of tightening of supply-demand
conditions, thereby supporting the reversal of hysteresis. Given that it could take some time
to reverse hysteresis, the Bank needs to conduct monetary policy while closely monitoring
the economic and financial conditions so that no severe distortion will be created under the
prolonged accommodative financial condition. Meanwhile, factors in the latter category
need to be addressed in a more structural way. Monetary policy and structural policy must
1
nonetheless address the issue interactively, since these factors are somewhat related to each
other.
This article consists of three sections. Sections I and II are assessments of the factors
responsible for sluggish growth in wages and prices, jointly written by Makoto Sakurai and
Masahiko Kataoka. Section III is a personal assessment by Makoto Sakurai of the current
situation and what policy responses should be made.
2
I. Reversal of Hysteresis
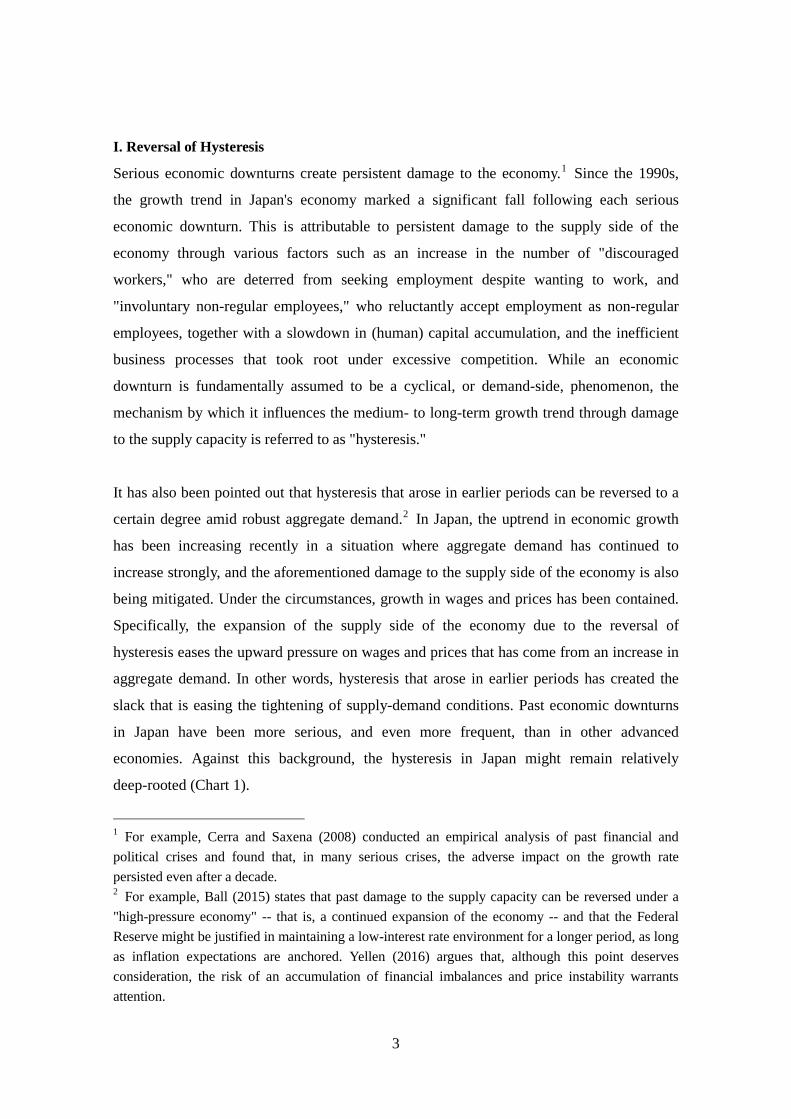
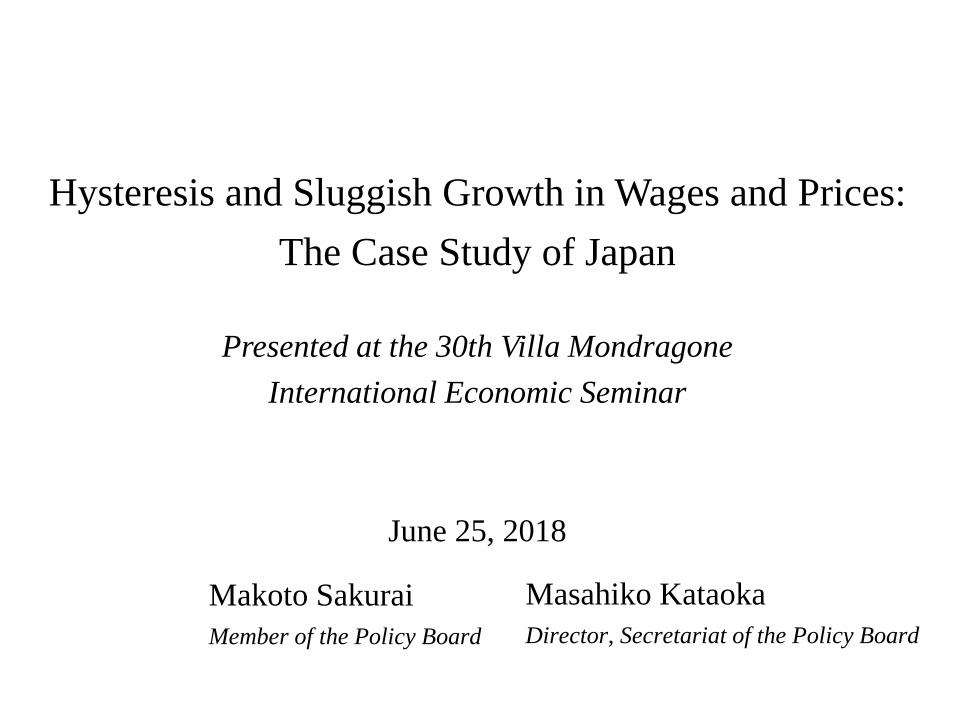
Serious economic downturns create persistent damage to the economy.1 Since the 1990s,
the growth trend in Japan's economy marked a significant fall following each serious
economic downturn. This is attributable to persistent damage to the supply side of the
economy through various factors such as an increase in the number of "discouraged
workers," who are deterred from seeking employment despite wanting to work, and
"involuntary non-regular employees," who reluctantly accept employment as non-regular
employees, together with a slowdown in (human) capital accumulation, and the inefficient
business processes that took root under excessive competition. While an economic
downturn is fundamentally assumed to be a cyclical, or demand-side, phenomenon, the
mechanism by which it influences the medium- to long-term growth trend through damage
to the supply capacity is referred to as "hysteresis."
It has also been pointed out that hysteresis that arose in earlier periods can be reversed to a
certain degree amid robust aggregate demand.2 In Japan, the uptrend in economic growth
has been increasing recently in a situation where aggregate demand has continued to
increase strongly, and the aforementioned damage to the supply side of the economy is also
being mitigated. Under the circumstances, growth in wages and prices has been contained.
Specifically, the expansion of the supply side of the economy due to the reversal of
hysteresis eases the upward pressure on wages and prices that has come from an increase in
aggregate demand. In other words, hysteresis that arose in earlier periods has created the
slack that is easing the tightening of supply-demand conditions. Past economic downturns
in Japan have been more serious, and even more frequent, than in other advanced
economies. Against this background, the hysteresis in Japan might remain relatively
deep-rooted (Chart 1).
1 For example, Cerra and Saxena (2008) conducted an empirical analysis of past financial and political crises and found that, in many serious crises, the adverse impact on the growth rate persisted even after a decade. 2 For example, Ball (2015) states that past damage to the supply capacity can be reversed under a "high-pressure economy" -- that is, a continued expansion of the economy -- and that the Federal Reserve might be justified in maintaining a low-interest rate environment for a longer period, as long as inflation expectations are anchored. Yellen (2016) argues that, although this point deserves consideration, the risk of an accumulation of financial imbalances and price instability warrants attention.
3
In what follows, the changes that have taken place in Japan's supply capacity since the
1990s will be discussed by focusing on hysteresis associated with labor input and labor
productivity.
A. Labor Input
1. Decline in the labor force participation rate
A decline in the labor force participation rate is one of the channels through which
hysteresis associated with labor input occurs. There are a number of reasons why people
find it increasingly difficult to get a job as their period of unemployment becomes longer:
for example, their abilities diminish relatively since they are unable to enhance their
practical skills through work experience, and prolonged unemployment becomes a stigma in
their career.3 Consequently, some of those who are unemployed for a prolonged period will
give up seeking employment and become discouraged workers, who are regarded as being
excluded from the labor force population. In fact, after the bursting of the asset bubble in
the early 1990s, the labor force participation rate in Japan turned down sharply, and the
labor force population also started to decline.
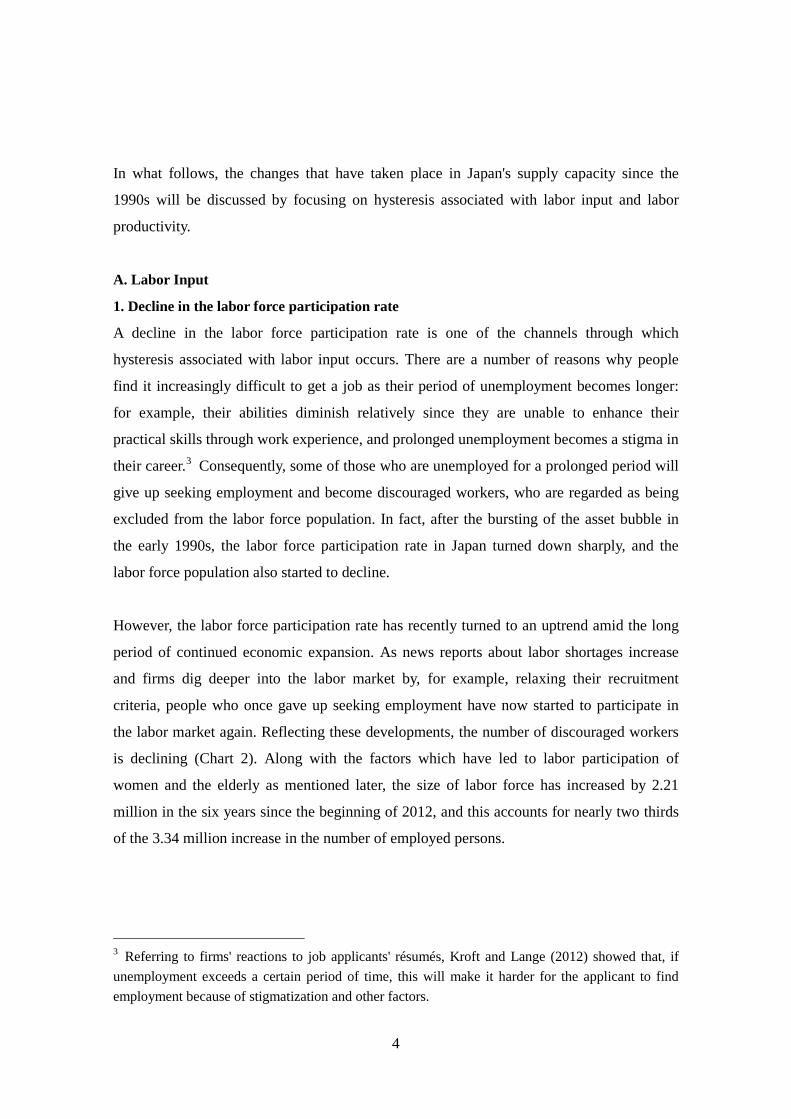
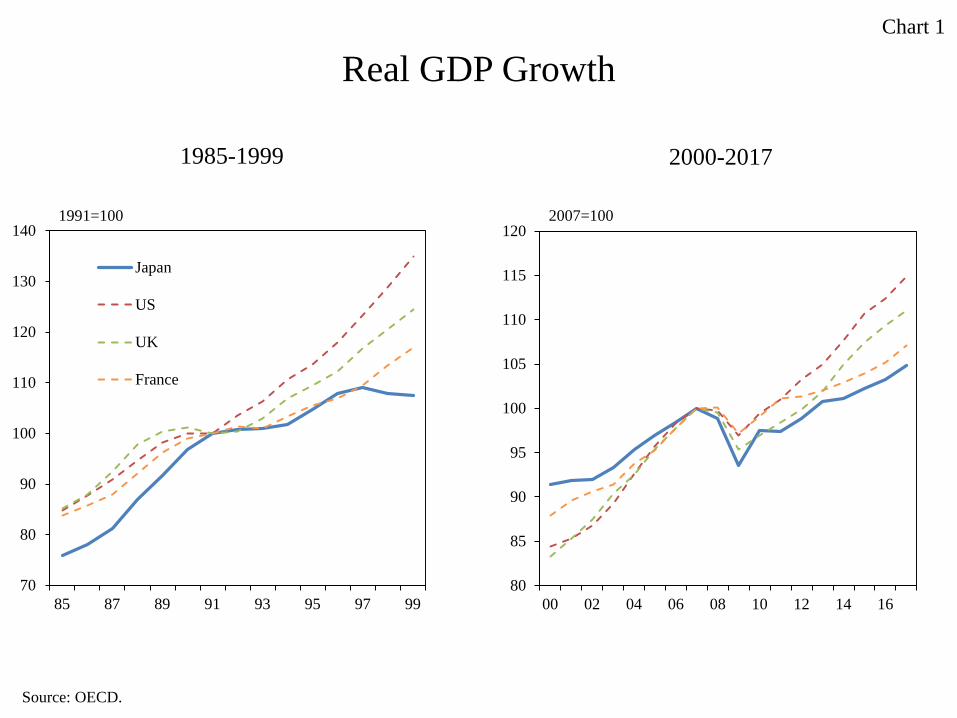
However, the labor force participation rate has recently turned to an uptrend amid the long
period of continued economic expansion. As news reports about labor shortages increase
and firms dig deeper into the labor market by, for example, relaxing their recruitment
criteria, people who once gave up seeking employment have now started to participate in
the labor market again. Reflecting these developments, the number of discouraged workers
is declining (Chart 2). Along with the factors which have led to labor participation of
women and the elderly as mentioned later, the size of labor force has increased by 2.21
million in the six years since the beginning of 2012, and this accounts for nearly two thirds
of the 3.34 million increase in the number of employed persons.
3 Referring to firms' reactions to job applicants' résumés, Kroft and Lange (2012) showed that, if unemployment exceeds a certain period of time, this will make it harder for the applicant to find employment because of stigmatization and other factors.
4
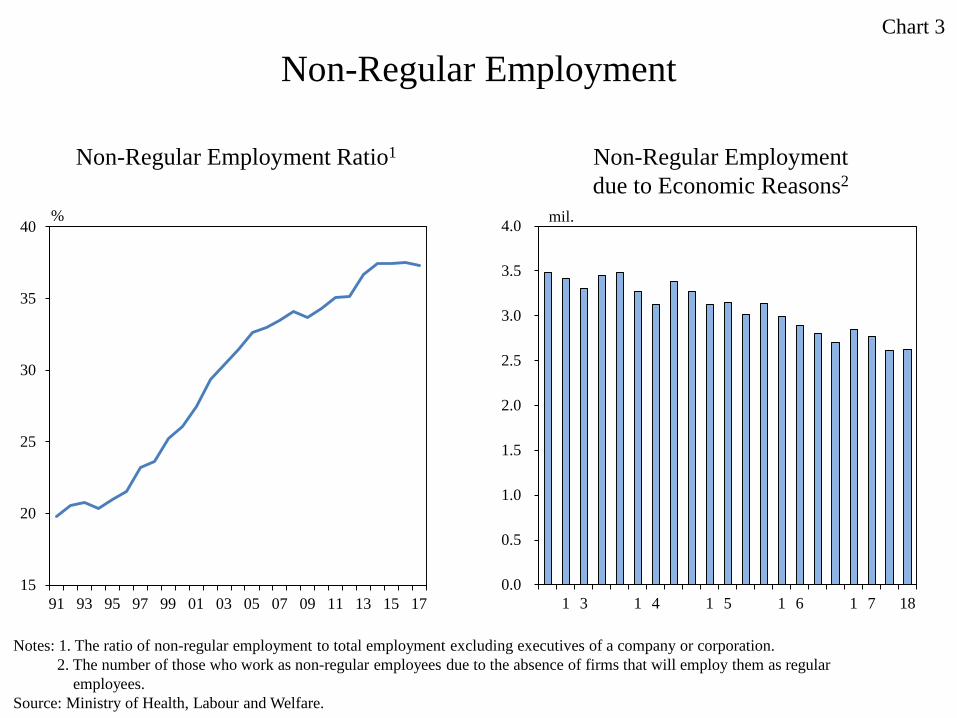
2. Increase in involuntary non-regular employees
Another channel through which hysteresis is generated is the increase in the number of
involuntary non-regular employees, who, despite wanting to become regular employees,
reluctantly accept employment as non-regular employees, due mainly to "the absence of
firms that will employ them as regular employees." Job offers for regular employees
decrease and the number of involuntary non-regular employees increases when firms shift
to hiring non-regular employees to cut labor costs and secure employment flexibility in
response to an economic downturn. It has been pointed out that if someone begins working
as a non-regular employee upon graduation, they are subsequently less likely to be
employed as a regular employee.4 Since working hours for non-regular employees are
relatively short, an increase in the number of involuntary non-regular employees leads to a
decline in labor input. Since the 1990s, the number of involuntary non-regular employees
has increased substantially in Japan, as firms have sought to benefit from employing
non-regular employees.
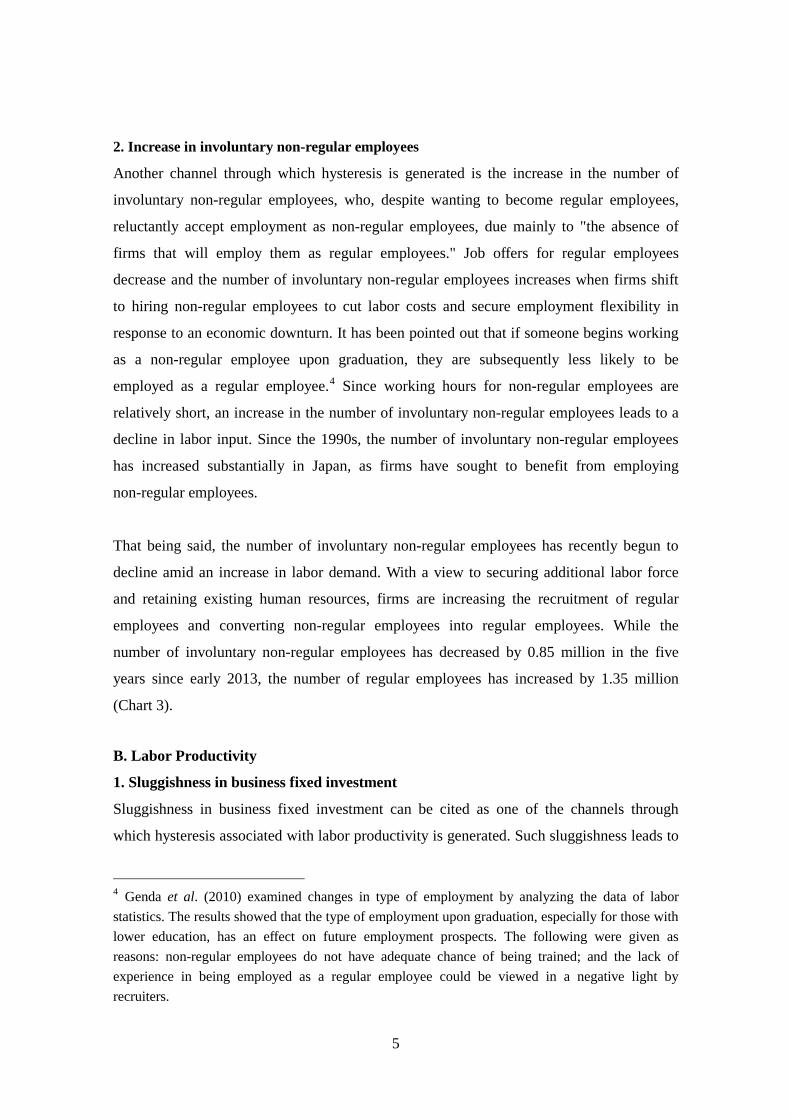
That being said, the number of involuntary non-regular employees has recently begun to
decline amid an increase in labor demand. With a view to securing additional labor force
and retaining existing human resources, firms are increasing the recruitment of regular
employees and converting non-regular employees into regular employees. While the
number of involuntary non-regular employees has decreased by 0.85 million in the five
years since early 2013, the number of regular employees has increased by 1.35 million
(Chart 3).
B. Labor Productivity
1. Sluggishness in business fixed investment
Sluggishness in business fixed investment can be cited as one of the channels through
which hysteresis associated with labor productivity is generated. Such sluggishness leads to
4 Genda et al. (2010) examined changes in type of employment by analyzing the data of labor statistics. The results showed that the type of employment upon graduation, especially for those with lower education, has an effect on future employment prospects. The following were given as reasons: non-regular employees do not have adequate chance of being trained; and the lack of experience in being employed as a regular employee could be viewed in a negative light by recruiters.
5

a deceleration in capital accumulation. An increase in aging capital stock and delays in the
introduction of new technology contributes to a sluggish rise in total factor productivity
(TFP).5 Since the bursting of the asset bubble in the early 1990s, Japanese firms have
reined in fixed investment as they have been burdened with excess production capacity and
excess debt, with the banking sector tightening their lending attitudes. Since then, business
fixed investment has been contained within the scope of depreciation expenses over the
years. As a consequence, aging capital stock has increased and the introduction of new
technology has tended to be delayed (Chart 4).
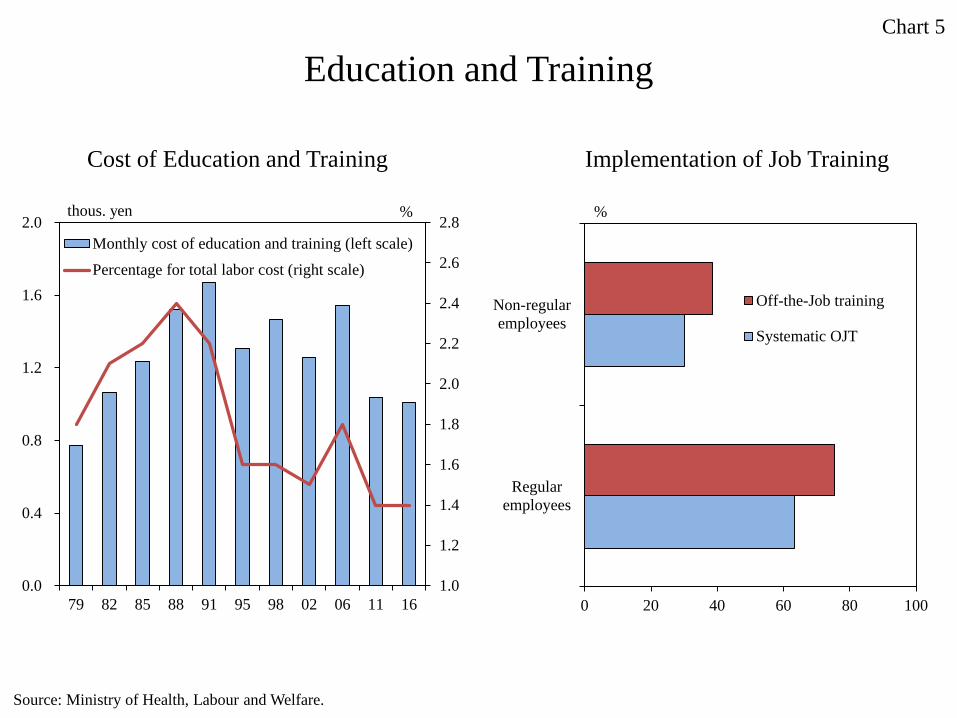
2. Reduction in the cost of education and training
Firms' attempts to cut costs by reducing spending on education and training leads to a
deceleration in the accumulation of human capital and a sluggish rise in labor productivity.
This is related to the aforementioned increase in the number of involuntary non-regular
employees. While firms address skills development for regular employees through
systematic on-the-job training (OJT) and other programs, both on-site and off-site, they tend
to avoid proactive investment in the training of non-regular employees, who are not
intended to be employed for a long period in the first place. Since the 1990s, Japanese firms
have shifted to hiring temporary workers rather than regular employees and have
endeavored to minimize the cost of education and training against the background of labor
costs being a burden on corporate profits due to excessive employment (Chart 5).
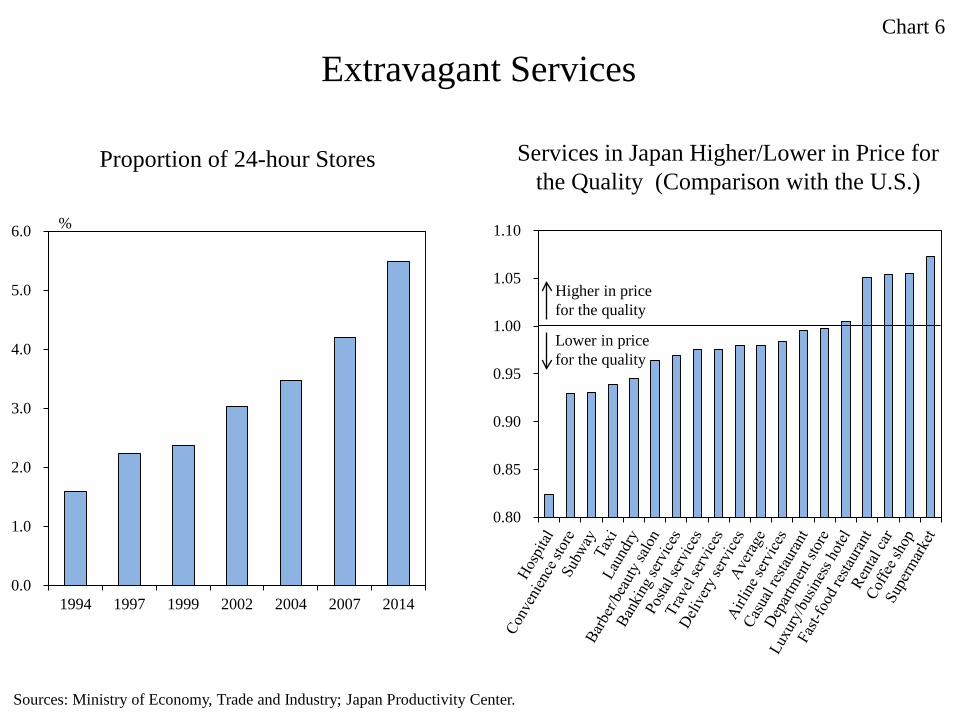
3. Excessive competition among firms
Excessive competition among firms stemming from protracted deficient demand may also
have contributed to the decline in labor productivity. Since the 1990s, many Japanese firms
have been drawn into fierce competition, cutting excessively the price of their products and
providing extravagant services. As a result, inefficient work practices and the provision of
excessively high-quality services for their prices have been seen in some industries. For
example, the proportion of businesses in the wholesale and retail industries operating 24
hours a day increased rapidly from 1.6 percent in 1994 to 5.5 percent in 2014. A
questionnaire survey conducted on people who have resided in both Japan and the United
States shows that a large number of services in Japan are regarded as lower in price for the
5 For example, see Haltmaier (2012).
6
quality (Chart 6).
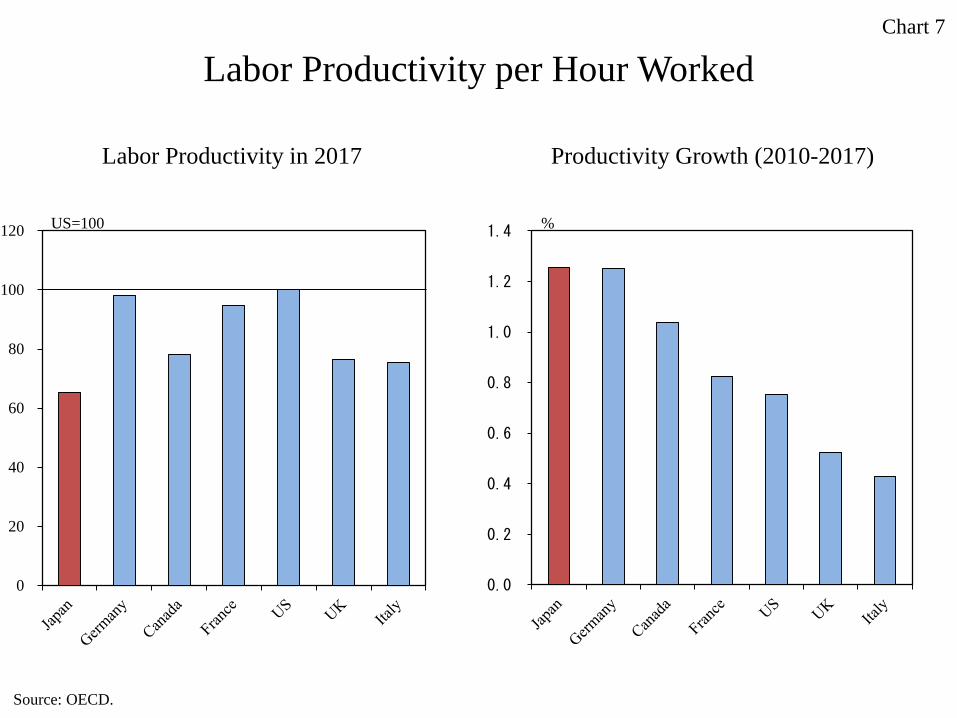
Japan's labor productivity appears to have declined through the various channels mentioned
earlier. It is often pointed out that labor productivity in Japan is lower than in other
advanced economies. For example, Jorgenson et al. (2016) made a comparison between
Japan and the United States in the levels of labor productivity, showing that productivity in
Japan was around 40 percent lower than in the United States in 2012.
However, factors that had lowered labor productivity are now being addressed. As
supply-side constraints materialize in tandem with labor shortages, firms are proactively
making fixed investment aimed at saving labor and increasing production capacity as well
as addressing the training of employees. Firms are also streamlining inefficient business
processes such as unrequested re-delivery services and late-night services where sales are
low. According to the OECD, Japan's labor productivity, though remaining at a low level,
has recently been improving at a relatively fast pace by catching up with that of other
economies (Chart 7).
II. Factors of a More Structural Nature
Sluggish growth in wages and prices is also attributable to factors of a more structural
nature. The following section will consider some examples, since these factors are also
important from the viewpoint of the theme of today's session.
A. Labor Force Participation of Women and the Elderly
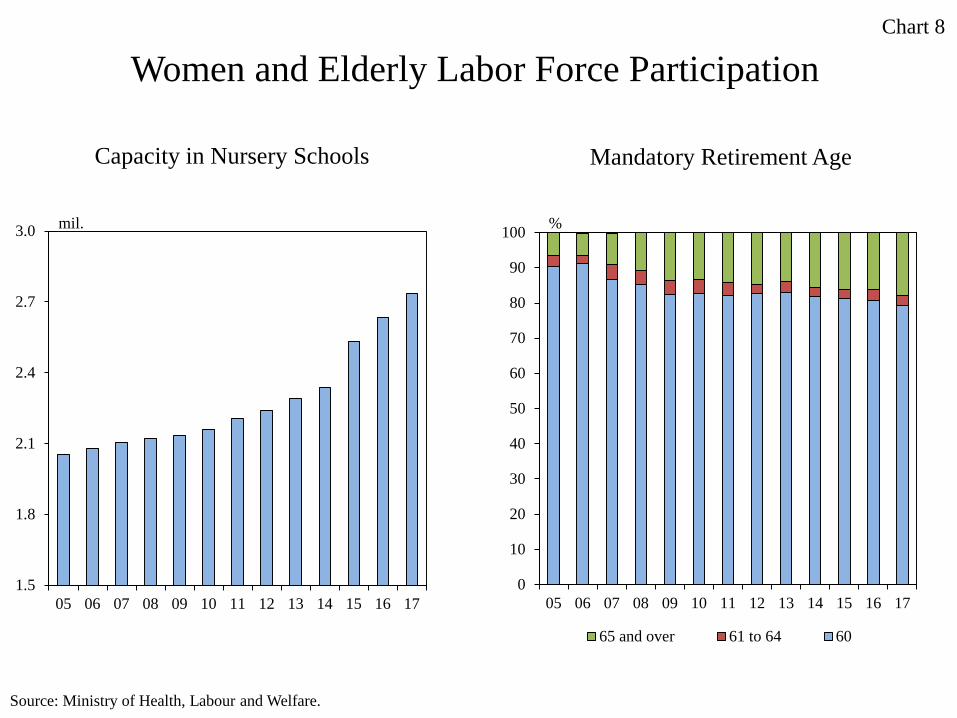
In Japan, where the population is rapidly aging and the birthrate is dropping sharply, the
government and firms have been promoting the active participation of women and the
elderly in the labor market. For example, steady progress has been made in increasing the
number of nursery schools and nursing homes as well as moves to extend or abolish the
mandatory retirement age (Chart 8). As a result, the number of women and the elderly
participating in the labor force has been increasing. The aging of baby boomers has also
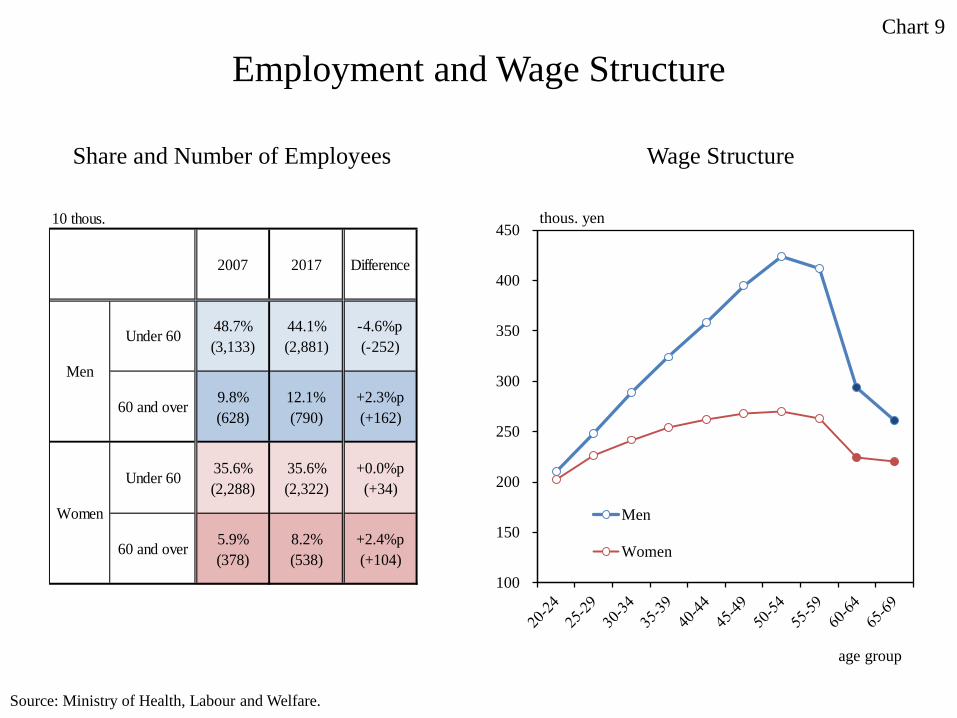
contributed to the rise in the ratio of the elderly to the overall workforce. Since wages for
women and the elderly have tended thus far to be relatively low, these changes provide
firms facing labor shortages with low-cost labor, thereby easing upward pressure on wages
7
(Chart 9).
Besides, although most women used to engage in jobs with simple and routine tasks, an
increasing number of talented women have shifted to more professional occupations,
leading to an increase in productivity. It has been noted that the easing of labor market
conditions is also brought about by the diminishing of slack in terms of quality.
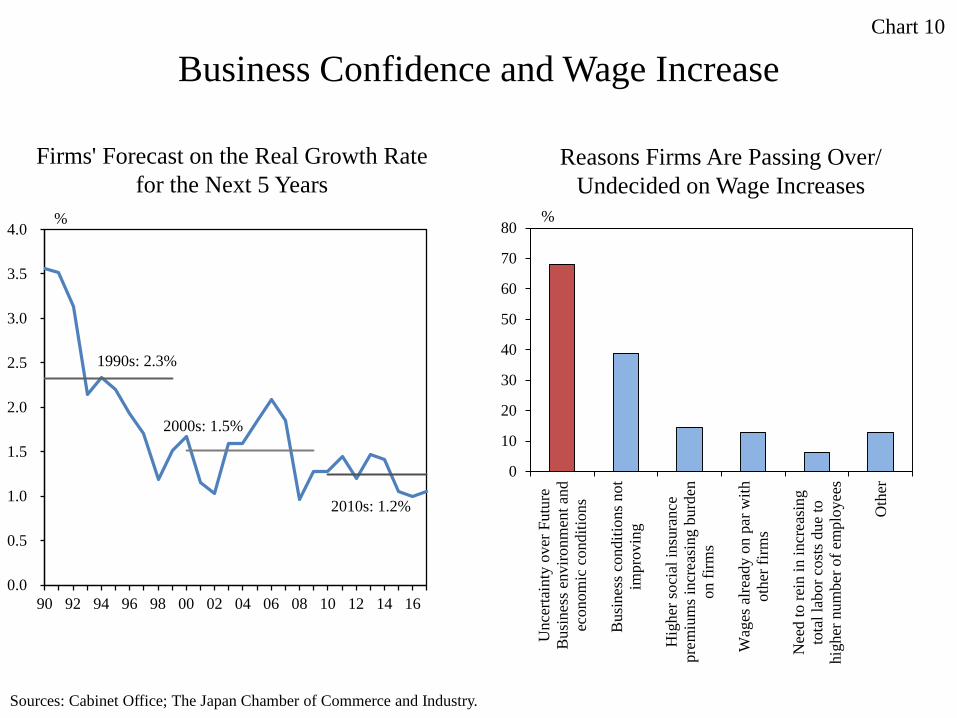
B. Future Anxiety
A possible decline in long-term growth potential of the economy and anxiety over future
income in anticipation, for example, of cuts in pensions, results in a rise in firms' and
households' reserve savings. Such anxieties also exert downward pressure on wages and
prices by restraining spending. The hardships that people suffered in past serious economic
downturns might also be exacerbating their anxieties. Japanese firms lack confidence in
their long-term profit growth and are thus cautious about raising wages -- particularly, base
pay -- that can lead to a rise in fixed costs (Chart 10). In addition, an increasing number of
households are anxious about their future income and life plans, with the number of such
households remaining at a high level since a surge in the 1990s. Their propensity to save
money seems to have exacerbated price competition among firms, bringing about
downward pressure on prices (Chart 11).
C. Technological Innovation
Advances in information technology such as RPA and AI might also be contributing to a
curb on growth in wages and prices. These technologies can contribute to improving the
value added and raising sales through, for example, the development of new products and
services; they are not simply a means to push down wages and prices. However, few
Japanese firms nowadays consider these technologies to be the key to expanding business
opportunities in the market; rather, most firms tend to regard them as a means to enhance
operational efficiency and cut costs (Chart 12). This tendency seems to lead to the easing of
labor market conditions and downward pressure on wages and prices. Still fresh in our
minds are the announcements made in 2017 by each of Japan's three major banks of their
decisions to reduce the work load that corresponds to a total of 33,000 employees within the
next ten years through the use of information technology.
8
The widespread use of smartphones and the expansion of e-commerce are also contributing
to sluggish price rises. Consumers can now easily refer to and compare a broad range of
information on prices at the press of a button, and purchase goods and services even from a
distance. It seems that these changes have increased consumers' responsiveness to prices,
consequently somewhat accelerating price competition among firms.
D. Factors Specific to Particular Industries
In some industries, downward pressure on wages and prices is brought about by specific
factors. For example, although the medical and nursing care industries are expanding
rapidly amid advanced population aging, service prices in these industries are controlled
under the remuneration systems for medical treatment and nursing care. Thus, wage growth
in these industries has been sluggish despite high demand in the labor force, the tightening
of labor market conditions, and the remarkable increase in the number of employees (Chart
13).
III. Framework of Monetary Policy
As discussed thus far, it seems that both the reversal of hysteresis and the factors of a more
structural nature have been constraining growth in wages and prices. With a focus on the
reversal of hysteresis, which seems to be the more important factor for the time being, this
is perhaps the place for a personal assessment of the current situation and what policy
responses should be made to address the issue.
A. Assessment of the Current Situation and Monetary Policy for the Time Being
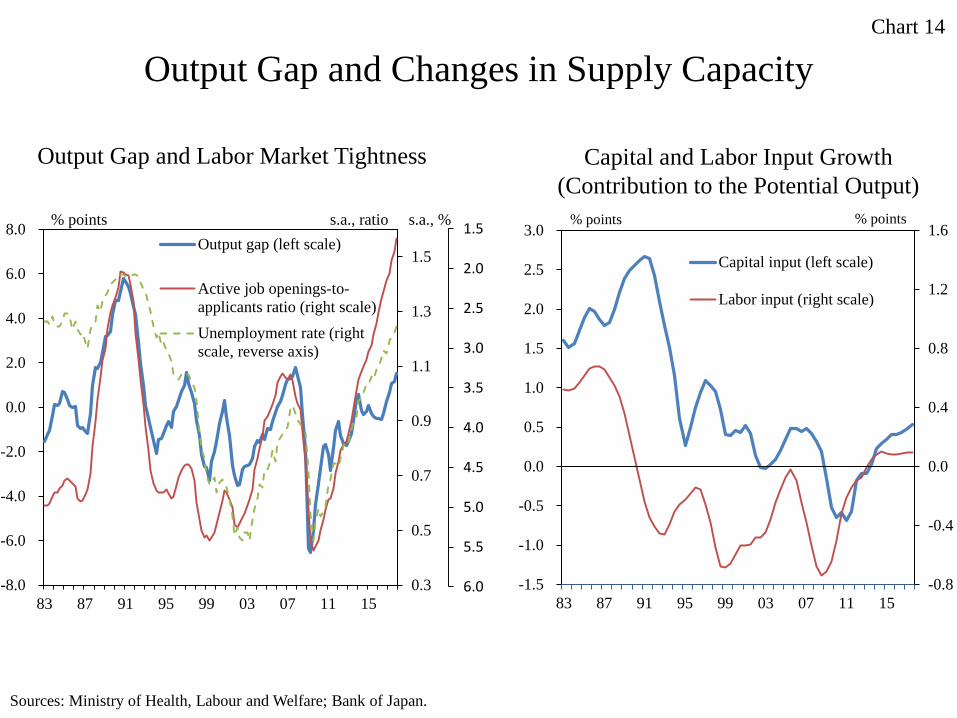
To reiterate the impact of hysteresis, the expansion of the supply side of the economy
associated with the reversal of hysteresis seems to be restraining the upward pressure on
prices exerted by an increase in demand. The active job openings-to-applicants ratio and the
unemployment rate have been hovering at levels close to or above the peak level observed
during the asset bubble period of the early 1990s, but the output gap has remained at a
relatively low level. The aforementioned increase in labor input and labor productivity
seems to have been easing the tightening of the output gap (Chart 14).
9

However, there is no need to be unduly pessimistic about the situation. There are two
reasons why. First, the expansion of the economy's supply capacity associated with the
reversal of hysteresis will not last forever. There are limits to the extent of such changes as
participation of discouraged workers in the labor market, conversion of involuntary
non-regular employees into regular employees, and streamlining of inefficient business
processes. The accumulation of (human) capital is also expected to decelerate as firms
approach the frontiers of technology and skills through the course of the replacement of
aging capital stock and improvements in the education and training of employees. From a
somewhat longer-term perspective, the effects of a curb on growth in wages and prices
through the expansion of supply capacity are expected to wane in due course. If a rising
trend in prices strengthens, inflation is expected to accelerate gradually toward the 2 percent
that the Bank is committed to achieving, accompanied by a rise in the public's inflation
expectations brought about through the adaptive formation mechanism.
Second, the reversal of hysteresis is itself a desirable change for people's lives. An
increasing number of people are participating in the labor market in ways that meet their
wishes, and firms are promoting a shift to more efficient and less wasteful working
practices. Firms and employees are raising their competitiveness on the back of the
introduction of new fixed investment and the development of employees' skills. Through
these changes, the long-term growth potential of Japan's economy, which declined
substantially in the past, is gradually strengthening again.
Although price rises are being constrained at present, the momentum toward achieving the
price stability target is being maintained. Furthermore, changes that will lead to improving
people's lives and strengthening the economy's competitiveness are progressing steadily. It
can be said that price rises are being restrained only temporarily as a side effect of such
positive changes. In fact, amid the ongoing reversal of hysteresis, Japan's economy seems to
be in a very favorable condition on the whole. It is essential, therefore, for the Bank to
continue to conduct monetary policy under the current framework for the time being to
maintain accommodative financial conditions, so that it can also continue to support the
reversal of hysteresis.
10

B. Future Policy Conduct in the Longer Run
The next issue is a longer-term perspective; how monetary policy should be conducted in
the future. The reversal of hysteresis might take some time. The supply side of Japan's
economy may still be fairly subdued as a result of past successive serious economic
downturns. Meanwhile, changes in the supply side of economy -- that is, the reversal of
hysteresis -- proceed at a slow pace by nature. There is no consensus in academic or other
circles regarding the extent to which and the time required for hysteresis to be eliminated.
However, experts have argued that, under continued strong economic expansion, much of
the hysteresis can be reversed, given time.6
As for the outlook, the accommodative monetary policy might be maintained over a longer
period, since the reversal of hysteresis could take a long time. In that case, it will be
necessary to monitor the situation carefully to avoid any serious distortion in the economic
and financial environment under prolonged accommodative financial conditions. The
following two factors particularly warrant attention.
First, it is necessary to keep a careful watch to prevent any significant supply-demand
imbalance. Changes in the economy's supply capacity proceed at a relatively slow pace. An
excessive increase in supply-side constraints under prolonged accommodative financial
conditions is undesirable. If economic swings amplify significantly, there could be adverse
effects, such as inefficient resource allocation. The Bank may then be rushed into tightening
its monetary policy, possibly resulting in an interruption in the course of the reversal of
hysteresis. In this situation, prices might rise in the short run, but this will not be stable over
the long run. In realizing the reversal of hysteresis, focus should not be placed solely on
tightening the output gap, but rather on maintaining moderately tight supply-demand
conditions for as long as possible.
6 Hall (2014) expresses the view that the extent to which and the time required for hysteresis to be dissipated differs for each element of the supply side of the economy, whether it is TFP, capital accumulation, unemployment, or the labor force participation rate. Kocherlakota (2014) -- expressing agreement with Hall's view -- notes that much of the hysteresis can be reversed ultimately, referring to the fact that hysteresis resulting from the Great Depression was eliminated under vigorous demand during World War II.
11
Second, it is also necessary to pay due attention to the stability of the financial system. In an
environment where accommodative financial conditions have been maintained over a long
period, the risk of an accumulation of financial imbalances will be heightened. According to
the Bank's assessment presented in the April 2018 Financial System Report, although
Japan's financial system as a whole is not showing any signs of overheating, some
indicators, such as the lending attitudes of financial institutions, are very close to a state of
overheating. Furthermore, if the low interest rate environment continues and downward
pressure on financial institutions' profits becomes prolonged, the functioning of financial
intermediation may be undermined.
Under the "yield curve control," which the Bank adopts as one of its policy tools, as
inflation expectations rise and the long-term growth potential of the economy strengthens in
accordance with the reversal of hysteresis, monetary easing effects will be enhanced
through a rise in the natural rate of interest and a decline in real interest rates.7 When
conducting monetary policy in the future, the Bank -- while taking account of the changes
in the external environment -- should consider without prejudgment the most appropriate
policy so as to avoid any serious distortion in the economic and financial environment.
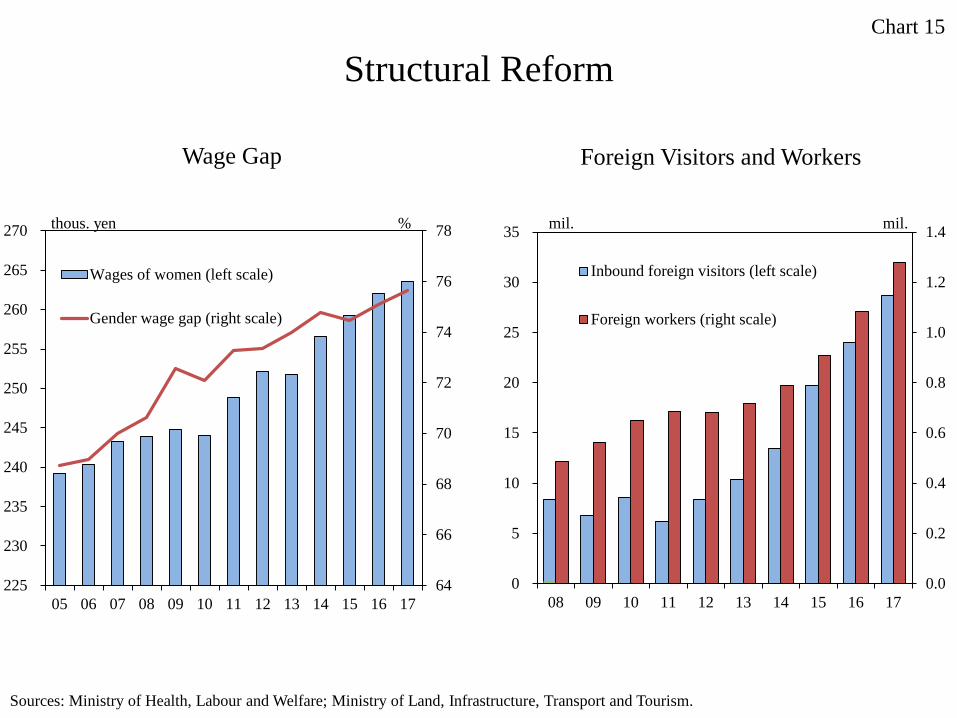
Upward pressure on wages and prices can be increased by appropriately addressing the
factors of a more structural nature mentioned in Section II. In fact, wages for women are
increasing steadily on the back of efforts by the government and firms to eliminate the wage
gap between men and women. In addition, with the assumption of a further decline in
population, the government is aiming to boost the number of foreign visitors and workers in
order to raise the long-term growth potential of Japan's economy (Chart 15). It is also
working toward developing IT-oriented human resources that are expected to create new
value rather than simply raise efficiency and cut costs, so that IT-related technological
innovation can be used for more creative and innovative economic activities. To raise the
wages for nursing care workers, the government plans to make special and temporary
7 Under the "yield curve control," the Bank facilitates the formation of short- and long-term interest rates that are considered most appropriate in light of the 2 percent price stability target. In the Bank's current guideline for market operations, the short-term policy interest rate is set at minus 0.1 percent and the target level for yields on 10-year Japanese government bonds is set at around 0 percent.
12
revisions to regulations on the remuneration system for nursing care in fiscal 2019.8 Even
more of these proactive initiatives and efforts are expected to be made by the government
and the private sector. Yet, as hysteresis and the factors of a more structural nature that have
been discussed thus far cannot, by their very nature, be distinguished explicitly, monetary
policy and structural policy should address these challenges interactively.
8 The Cabinet decided that the projected tax gains accrued from the consumption tax hike scheduled to take place in October 2019 will in part be used to raise monthly wages for nursing care workers who have been in service for more than 10 years by an equivalent of 80 thousand yen on average.
13

References
Ball, Laurence M. 2014. "Long-Term Damage from the Great Recession in OECD
Countries." NBER Working Paper no. 20185.
------. 2015. "Monetary Policy for a High-Pressure Economy." Center on Budget and Policy
Priorities. March 30.
Blanchflower, David G., and Andrew T. Levin. 2015. "Labor Market Slack and Monetary
Policy." NBER Working Paper no. 21094.
Cerra, Valerie, and Sweta Chaman Saxena. 2008. "Growth Dynamics: The Myth of
Economic Recovery." American Economic Review 2008 98 (1): 439-457.
Cœuré, Benoît. 2017. "Scars or Scratches? Hysteresis in the Euro Area," a speech delivered
at the International Center for Monetary and Banking Studies, Geneva, May 19.
Genda, Yuji, Ayako Kondo, and Souichi Ohta. 2010. "Long-Term Effects of a Recession at
Labor Market Entry in Japan and the United States." The Journal of Human Resources
Winter 2010 45 (1): 157-196.
Hall, Robert E. 2014. "Quantifying the Lasting Harm to the U.S. Economy from the
Financial Crisis." NBER Working Paper no. 20183.
Haltmaier, Jane. 2012. "Do Recessions Affect Potential Output?" Board of Governors of the
Federal Reserve System International Finance Discussion Papers no. 1066.
Holzer, Harry J., Steven Raphael, and Michael A. Stoll. 2003. "Employers in the Boom:
How Did the Hiring of Unskilled Workers Change During the 1990s?" IRP Discussion
Paper no.1267-03.
Hotchkiss, Julie L., and Robert E. Moore. 2018. "Some Like It Hot: Assessing Longer-Term
Labor Market Benefits from a High-Pressure Economy." Atlanta Fed Working Paper
no. 2018-1a.
Howard, Greg, Robert Martin, and Beth Anne Wilson. 2011. "Are Recoveries from Banking
and Financial Crises Really So Different?" Board of Governors of the Federal Reserve
System International Finance Discussion Papers no. 1037.
Jorgenson, Dale W., Koji Nomura, and Jon D. Samuels. 2016. "A Half Century of
Trans-Pacific Competition: Price Level Indices and Productivity Gaps for Japanese
and US Industries, 1955-2012." in The World Economy: Growth or Stagnation? edited
by Jorgenson et al. 469-507. Cambridge University Press.
14
Kroft, Kory, Fabian Lange, and Matthew J. Notowidigdo. 2012. "Duration Dependence and
Labor Market Conditions: Theory and Evidence from a Field Experiment." NBER
Working Paper no. 18387.
Martin, Robert, Teyanna Munyan, and Beth Anne Wilson. 2015. "Potential Output and
Recessions: Are We Fooling Ourselves?" Board of Governors of the Federal Reserve
System International Finance Discussion Papers no. 1145.
Narayana Kocherlakota. 2014. "Discussion of paper: 'Quantifying the Lasting Harm to the
U.S. Economy from the Financial Crisis,'" a paper presented at the National Bureau of
Economic Research Macroeconomics Conference.
Reifschneider, Dave, William Wascher, and David Wilcox. 2013. "Aggregate Supply in the
United States: Recent Developments and Implications for the Conduct of Monetary
Policy." Board of Governors of the Federal Reserve System Finance and Economics
Discussion Series no. 2013-77.
Yellen, Janet L. 2014. "What the Federal Reserve Is Doing to Promote a Stronger Job
Market," a speech delivered at the National Interagency Community Reinvestment
Conference, Chicago, Illinois, March 14.
------. 2016. "Macroeconomics Research after the Crisis," a speech delivered at 60th annual
economic conference sponsored by the Federal Reserve Bank of Boston, Boston,
Massachusetts, October 14.
Research and Statistics Department, Bank of Japan. 2018. A summary of the conference
co-hosted by the Center for Advanced Research in Finance (CARF), the University of
Tokyo, and the Research and Statistics Department, Bank of Japan, entitled "New
Developments in Macroeconomic Analysis: Linkage between Business Cycle and
Growth Trend," released on March 30 (available only in Japanese).
15
Hysteresis and Sluggish Growth in Wages and Prices:
Presented at the 30th Villa Mondragone International Economic Seminar
June 25, 2018
The Case Study of Japan
Makoto Sakurai Member of the Policy Board
Masahiko Kataoka Director, Secretariat of the Policy Board
80
85
90
95
100
105
110
115
120
00 02 04 06 08 10 12 14 16
2007=100
70
80
90
100
110
120
130
140
85 87 89 91 93 95 97 99
Japan
US
UK
France
1991=100
Real GDP Growth
Source: OECD.
Chart 1
1985-1999 2000-2017
0.0
0.2
0.4
0.6
0.8
1.0
1.2
1.4
1.6
1 2 1 3 1 4 1 5 1 6 1 7 18
mil.
Labor Force Participation Rate
Note: Discouraged workers are people who are not seeking employment because they feel that they have no prospect of finding a suitable job. Source: Ministry of Health, Labour and Welfare.
Chart 2
Labor Force Participation Rate Discouraged Workers
58
59
60
61
62
63
64
65
91 93 95 97 99 01 03 05 07 09 11 13 15 17
s.a., %
0.0
0.5
1.0
1.5
2.0
2.5
3.0
3.5
4.0
1 3 1 4 1 5 1 6 1 7 18
mil.
Non-Regular Employment Chart 3
Non-Regular Employment Ratio1 Non-Regular Employment due to Economic Reasons2
15
20
25
30
35
40
91 93 95 97 99 01 03 05 07 09 11 13 15 17
%
Notes: 1. The ratio of non-regular employment to total employment excluding executives of a company or corporation. 2. The number of those who work as non-regular employees due to the absence of firms that will employ them as regular employees. Source: Ministry of Health, Labour and Welfare.

Business Fixed Investment Chart 4
Business Fixed Investment Vintage Year
Sources: Ministry of Finance; The Small and Medium Enterprise Agency.
3.0
4.0
5.0
6.0
7.0
8.0
9.0
77 81 85 89 93 97 01 05 09 13
Small and medium-sized enterprises
Large enterprises
year
0
10
20
30
40
50
60
70
77 81 85 89 93 97 01 05 09 13 17
Depreciation expenses
Business fixed investment
tril. yen
1.0
1.2
1.4
1.6
1.8
2.0
2.2
2.4
2.6
2.8
0.0
0.4
0.8
1.2
1.6
2.0
79 82 85 88 91 95 98 02 06 11 16
Monthly cost of education and training (left scale)Percentage for total labor cost (right scale)
thous. yen %
Education and Training
Source: Ministry of Health, Labour and Welfare.
Chart 5
Cost of Education and Training Implementation of Job Training
0 20 40 60 80 100
Regularemployees
Non-regularemployees
Off-the-Job training
Systematic OJT
%
Extravagant Services Chart 6
Proportion of 24-hour Stores Services in Japan Higher/Lower in Price for the Quality (Comparison with the U.S.)
Sources: Ministry of Economy, Trade and Industry; Japan Productivity Center.
0.0
1.0
2.0
3.0
4.0
5.0
6.0
1994 1997 1999 2002 2004 2007 2014
%
0.80
0.85
0.90
0.95
1.00
1.05
1.10
Higher in price for the quality Lower in price for the quality
0.0
0.2
0.4
0.6
0.8
1.0
1.2
1.4%
Labor Productivity per Hour Worked
Source: OECD.
Chart 7
Labor Productivity in 2017 Productivity Growth (2010-2017)
0
20
40
60
80
100
120 US=100
Women and Elderly Labor Force Participation
Source: Ministry of Health, Labour and Welfare.
Chart 8
Capacity in Nursery Schools Mandatory Retirement Age
1.5
1.8
2.1
2.4
2.7
3.0
05 06 07 08 09 10 11 12 13 14 15 16 17
mil.
0
10
20
30
40
50
60
70
80
90
100
05 06 07 08 09 10 11 12 13 14 15 16 17
65 and over 61 to 64 60
%
Employment and Wage Structure
Source: Ministry of Health, Labour and Welfare.
Chart 9
Share and Number of Employees
100
150
200
250
300
350
400
450
Men
Women
thous. yen
age group
Wage Structure
10 thous.
2007 2017 Difference
Under 60 48.7%(3,133)
44.1%(2,881)
-4.6%p(-252)
60 and over 9.8%(628)
12.1%(790)
+2.3%p(+162)
Under 60 35.6%(2,288)
35.6%(2,322)
+0.0%p(+34)
60 and over 5.9%(378)
8.2%(538)
+2.4%p(+104)
Men
Women
Business Confidence and Wage Increase
Sources: Cabinet Office; The Japan Chamber of Commerce and Industry.
Chart 10
Firms' Forecast on the Real Growth Rate for the Next 5 Years
Reasons Firms Are Passing Over/ Undecided on Wage Increases
0.0
0.5
1.0
1.5
2.0
2.5
3.0
3.5
4.0
90 92 94 96 98 00 02 04 06 08 10 12 14 16
%
2000s: 1.5%
2010s: 1.2%
1990s: 2.3%
0
10
20
30
40
50
60
70
80
Unc
erta
inty
ove
r Fut
ure
Bus
ines
s env
ironm
ent a
ndec
onom
ic c
ondi
tions
Bus
ines
s con
ditio
ns n
otim
prov
ing
Hig
her s
ocia
l ins
uran
cepr
emiu
ms i
ncre
asin
g bu
rden
on fi
rms
Wag
es a
lread
y on
par
with
othe
r firm
s
Nee
d to
rein
in in
crea
sing
tota
l lab
or c
osts
due
tohi
gher
num
ber o
f em
ploy
ees
Oth
er
%

Anxiety of Households
Source: Cabinet Office.
Chart 11
Worries or Anxieties in Everyday Life
0
10
20
30
40
50
60
70
80
87 89 91 93 95 97 99 01 03 05 07 09 11 13 15 17
Feel worried or anxious
Do not feel worried or anxious
%
Causes of Worries or Anxieties (Changes between 1992 and 2017)
0
3
6
9
12
15
18
Plan
ning
for
post
-ret
irem
ent
Ow
n he
alth
Fam
ily h
ealth
Futu
re in
com
ean
d as
sets
Cur
rent
inco
me
and
asse
tsFa
mily
life
eve
nts (
high
er e
duca
tion,
empl
oym
ent,
mar
riage
, etc
.)O
wn
life
even
ts (h
ighe
r edu
catio
n,em
ploy
men
t, m
arria
ge, e
tc.)
Fam
ily re
latio
ns
Wor
k an
d w
orkp
lace
rela
tions
%

Purpose of Increasing IT Budgets
Note: 85 Japanese firms and 156 U.S. firms answered to the questionnaire. Figures in the chart indicate the proportion of firms that selected each choice. Since this was a multiple-choice questionnaire, the sum of figures exceeds 100%. Source: JEITA.
Chart 12
0
10
20
30
40
50Introduction of a private cloud
Regular system updates
Introduction of IT to non-ITbusiness processes
Greater business efficiency/costreductions using IT
Response to laws andregulations
Increasing sales
Increasing profits
Expansion of size of the firmExpansion of businessoperations/product lines
Enhanced analysis of customerbehavior and markets using IT
Enhanced development ofproducts/services using IT
Changes in business modelsusing IT
Use of newtechnologies/products/services
Prompt responses to changes inmarkets and customers
Investment in mobiletechnology
United States Japan
Defensive IT investment Aggressive IT investment
(%)

Demand for Labor and Wages
Source: Ministry of Health, Labour and Welfare.
Chart 13
Change in Number of Employees and New Job Openings
Change in Wages
0.0
0.5
1.0
1.5
2.0
2.5
3.0
3.5
0
2
4
6
8
10
12
14
16
Med
ical
and
nurs
ing
care
Who
lesa
le a
ndre
tail
trade
Man
ufac
turin
g
Acc
omm
odat
ions
,ea
ting
and
drin
king
serv
ices
Con
stru
ctio
n
Oth
er
Decrease (2002-2017, left scale)Increase (2002-2017, left scale)New job openings (in 2017, right scale)
mil. mil.
5.8
80
85
90
95
100
105
110
04 05 06 07 08 09 10 11 12 13 14 15 16 17
All industries
Manufacturing
Wholesale and retail trade
Medical and nursing care
2004=100
Output Gap and Changes in Supply Capacity
Sources: Ministry of Health, Labour and Welfare; Bank of Japan.
Chart 14
Output Gap and Labor Market Tightness Capital and Labor Input Growth (Contribution to the Potential Output)
1.5
2.0
2.5
3.0
3.5
4.0
4.5
5.0
5.5
6.0 -0.8
-0.4
0.0
0.4
0.8
1.2
1.6
-1.5
-1.0
-0.5
0.0
0.5
1.0
1.5
2.0
2.5
3.0
83 87 91 95 99 03 07 11 15
Capital input (left scale)
Labor input (right scale)
% points % points
0.3
0.5
0.7
0.9
1.1
1.3
1.5
-8.0
-6.0
-4.0
-2.0
0.0
2.0
4.0
6.0
8.0
83 87 91 95 99 03 07 11 15
Output gap (left scale)
Active job openings-to-applicants ratio (right scale)Unemployment rate (rightscale, reverse axis)
s.a., ratio s.a., % % points
Structural Reform
Sources: Ministry of Health, Labour and Welfare; Ministry of Land, Infrastructure, Transport and Tourism.
Chart 15
Wage Gap Foreign Visitors and Workers
64
66
68
70
72
74
76
78
225
230
235
240
245
250
255
260
265
270
05 06 07 08 09 10 11 12 13 14 15 16 17
Wages of women (left scale)
Gender wage gap (right scale)
thous. yen %
0.0
0.2
0.4
0.6
0.8
1.0
1.2
1.4
0
5
10
15
20
25
30
35
08 09 10 11 12 13 14 15 16 17
Inbound foreign visitors (left scale)
Foreign workers (right scale)
mil. mil.

![MAKOTO SAITO SCENE[0] · Makoto Saito and explore his yesterday, today, and tomorrow from multiple angles. Publication of the First Book of Makoto Saitoʼs Paintings In conjunction](https://img.pdfslide.us/doc/110x75/5f63fd3e28e8697dd12fd50b/makoto-saito-scene0-makoto-saito-and-explore-his-yesterday-today-and-tomorrow.jpg)