Embed Size (px)
Citation preview
Financial Results for the Third QuarterFiscal Year Ending December 2016
Investor Relations Presentation Materials
ISEKI & CO., LTD.Shirou Tomiyasu,
Director & Senior managing executive officerNovember 15, 2016
ISEKI 3Q of FY ending Dec. 16 Investor Relations Presentation Materials
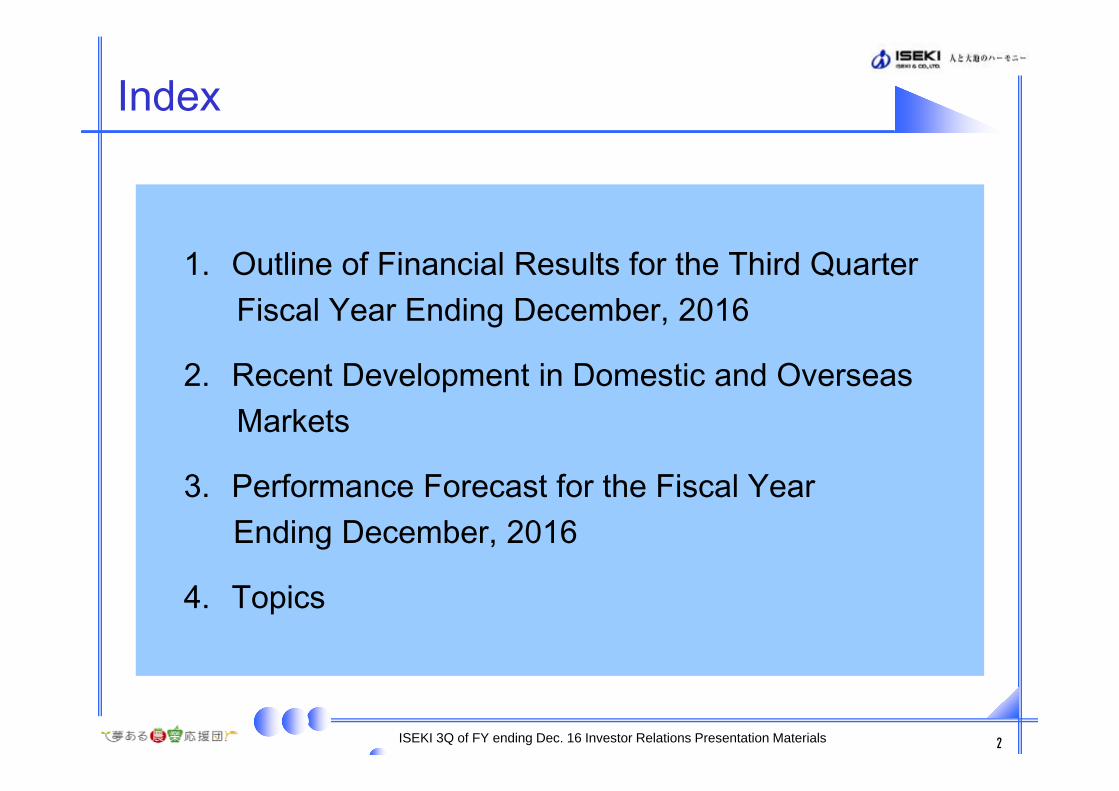
Index
1. Outline of Financial Results for the Third Quarter Fiscal Year Ending December, 2016
2. Recent Development in Domestic and Overseas Markets
3. Performance Forecast for the Fiscal YearEnding December, 2016
4. Topics
1. Outline of Financial Results for the Third Quarter Fiscal Year Ending December, 2016
2. Recent Development in Domestic and Overseas Markets
3. Performance Forecast for the Fiscal YearEnding December, 2016
4. Topics
2ISEKI 3Q of FY ending Dec. 16 Investor Relations Presentation Materials
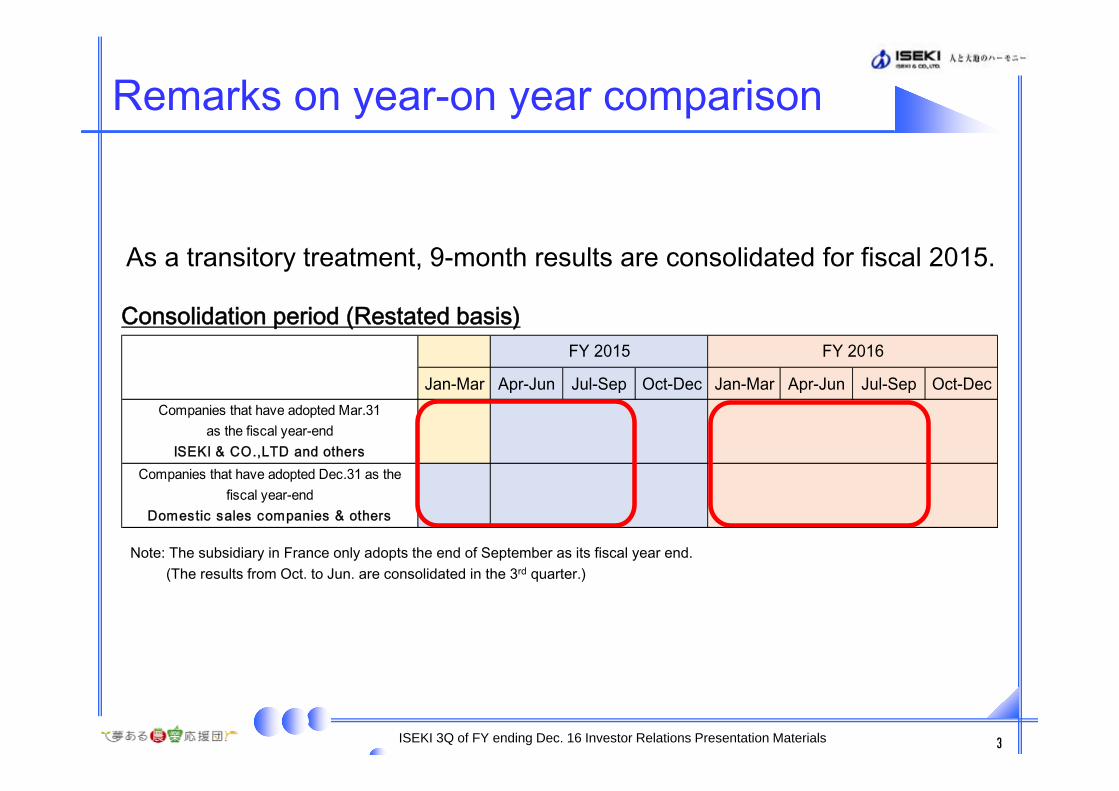
Remarks on year-on year comparison
Jan-Mar Apr-Jun Jul-Sep Oct-Dec Jan-Mar Apr-Jun Jul-Sep Oct-Dec
FY 2015 FY 2016
Companies that have adopted Dec.31 as thefiscal year-end
Domestic sales companies & others
Companies that have adopted Mar.31as the fiscal year-end
ISEKI & CO.,LTD and others
3ISEKI 3Q of FY ending Dec. 16 Investor Relations Presentation Materials
As a transitory treatment, 9-month results are consolidated for fiscal 2015.
Consolidation period (Restated basis)
Note: The subsidiary in France only adopts the end of September as its fiscal year end. (The results from Oct. to Jun. are consolidated in the 3rd quarter.)
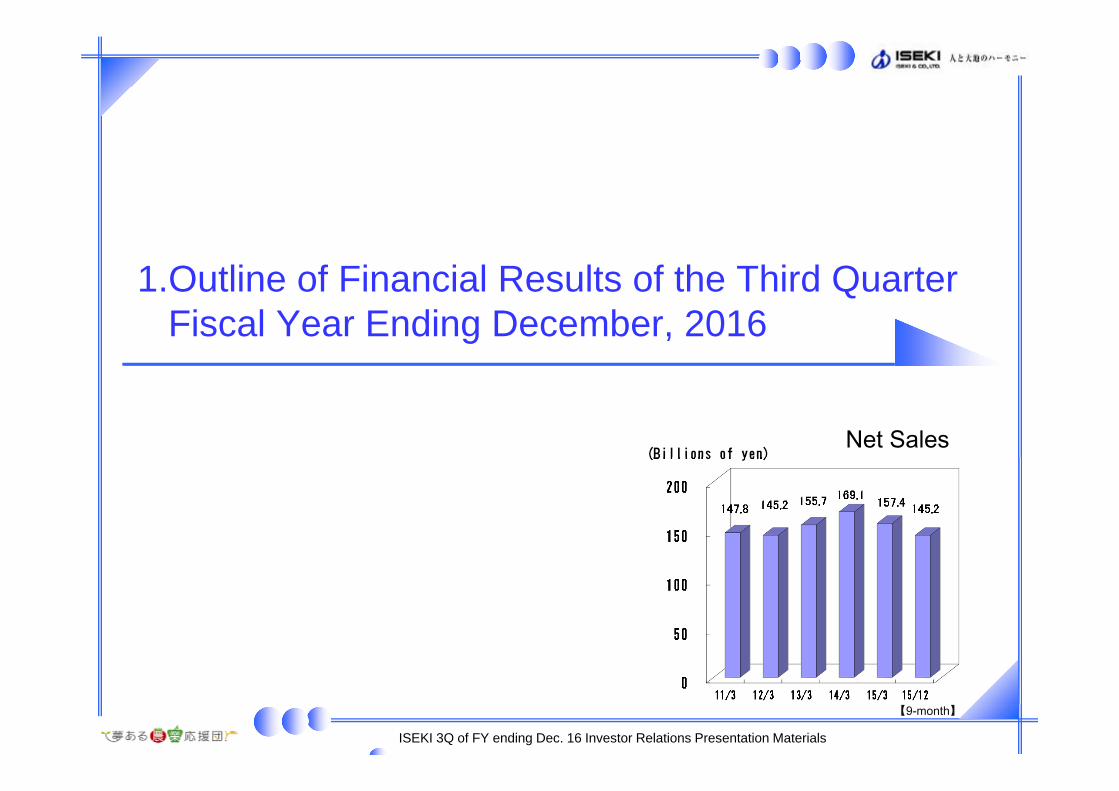
1.Outline of Financial Results of the Third Quarter Fiscal Year Ending December, 2016
Net Sales(Billions of yen)
【9-month】
ISEKI 3Q of FY ending Dec. 16 Investor Relations Presentation Materials
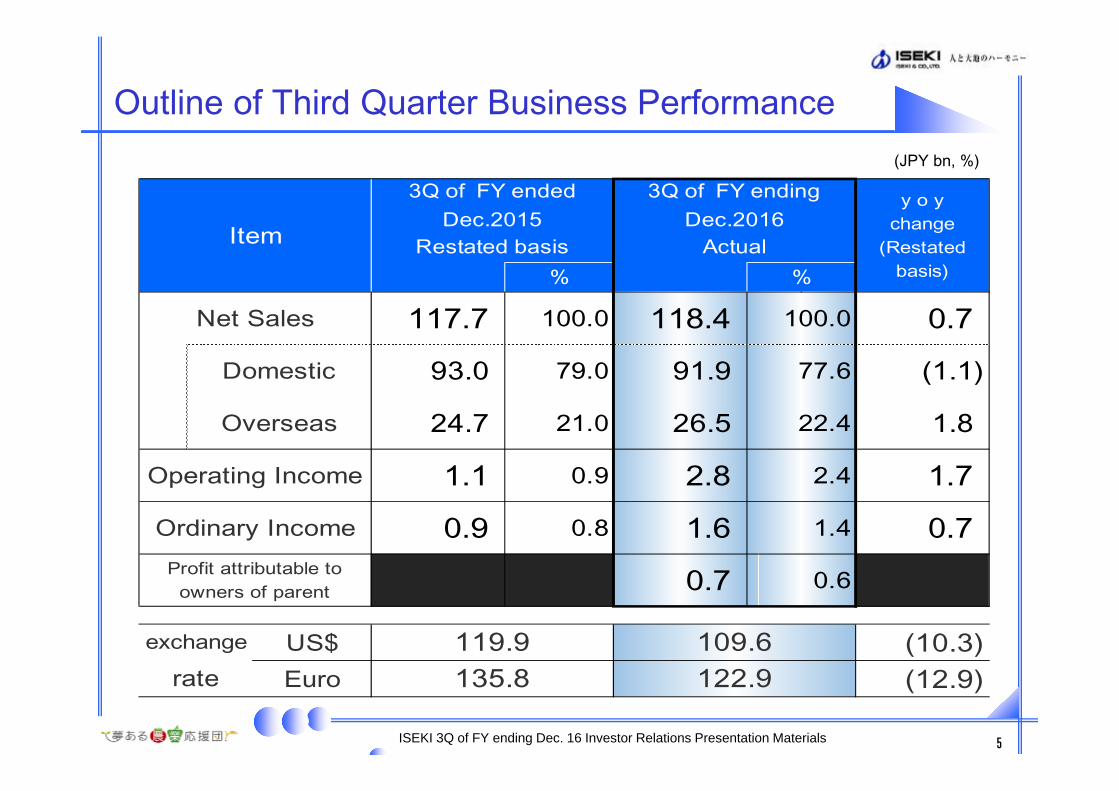
% %
117.7 100.0 118.4 100.0 0.7
93.0 79.0 91.9 77.6 (1.1)
24.7 21.0 26.5 22.4 1.8
1.1 0.9 2.8 2.4 1.7
0.9 0.8 1.6 1.4 0.7
0.7 0.6 US$ (10.3)Euro (12.9)
109.6
Domestic
Item
Net Sales
exchange
3Q of FY endingDec.2016
Restated basis
3Q of FY endedDec.2015
y o ychange
(Restatedbasis)
Overseas
Actual
rate 135.8119.9
Profit attributable toowners of parent
Ordinary Income
Operating Income
122.9
5ISEKI 3Q of FY ending Dec. 16 Investor Relations Presentation Materials
Outline of Third Quarter Business Performance(JPY bn, %)
(JPY bn,)
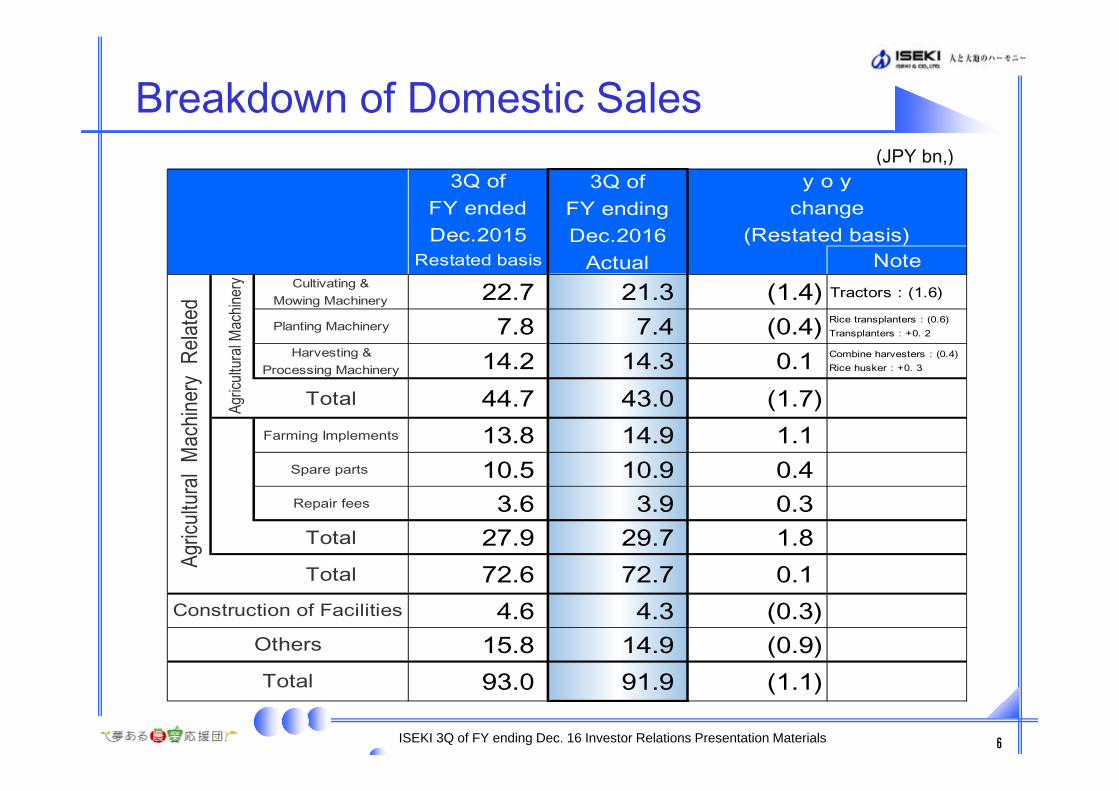
Restated basis NoteCultivating &
Mowing Machinery 22.7 21.3 (1.4) Tractors:(1.6)
Planting Machinery 7.8 7.4 (0.4) Rice transplanters:(0.6)Transplanters:+0. 2
Harvesting &Processing Machinery 14.2 14.3 0.1 Combine harvesters:(0.4)
Rice husker:+0. 3
Total 44.7 43.0 (1.7)Farming Implements 13.8 14.9 1.1
Spare parts 10.5 10.9 0.4Repair fees 3.6 3.9 0.3Total 27.9 29.7 1.8Total 72.6 72.7 0.1
4.6 4.3 (0.3)15.8 14.9 (0.9)93.0 91.9 (1.1)
3Q ofFY endingDec.2016
Actual
3Q ofFY endedDec.2015
y o ychange
(Restated basis)Ag
ricult
ural
Mac
hiner
y
Agric
ultur
al M
achin
ery
Relat
ed
Others
Construction of Facilities
Total
6ISEKI 3Q of FY ending Dec. 16 Investor Relations Presentation Materials
Breakdown of Domestic Sales

Breakdown of Overseas Sales
Restated basis NoteNorth America 9.6 9.4 (0.2) Tractors:(0.3)
Lawn mowers:+0.1
Europe 9.3 7.5 (1.8) Tractors:(0.5)Lawn mowers:(1.3)
China 1.0 2.4 1.4 Tractors:+0.6Rice transplanters:+0.9
ASEAN 1.0 2.5 1.5 Tractors:+1.3Rice transplanters:+0.1
Others 1.4 1.6 0.2 Tractors:+0.1Rice transplanters:+0.2
Product Sales Total 22.3 23.4 1.1Parts & Others 2.4 3.1 0.7
Total 24.7 26.5 1.8Overseas Sales incl. Chinese
Businesses 31.2 30.9 (0.3)Ratio of overseas net sales 25.1% 25.2%
y o yChange
(Restated basis)
3Q ofFY endingDec.2016
Actual
3Q ofFY endedDec.2015
7ISEKI 3Q of FY ending Dec. 16 Investor Relations Presentation Materials
(JPY bn,)
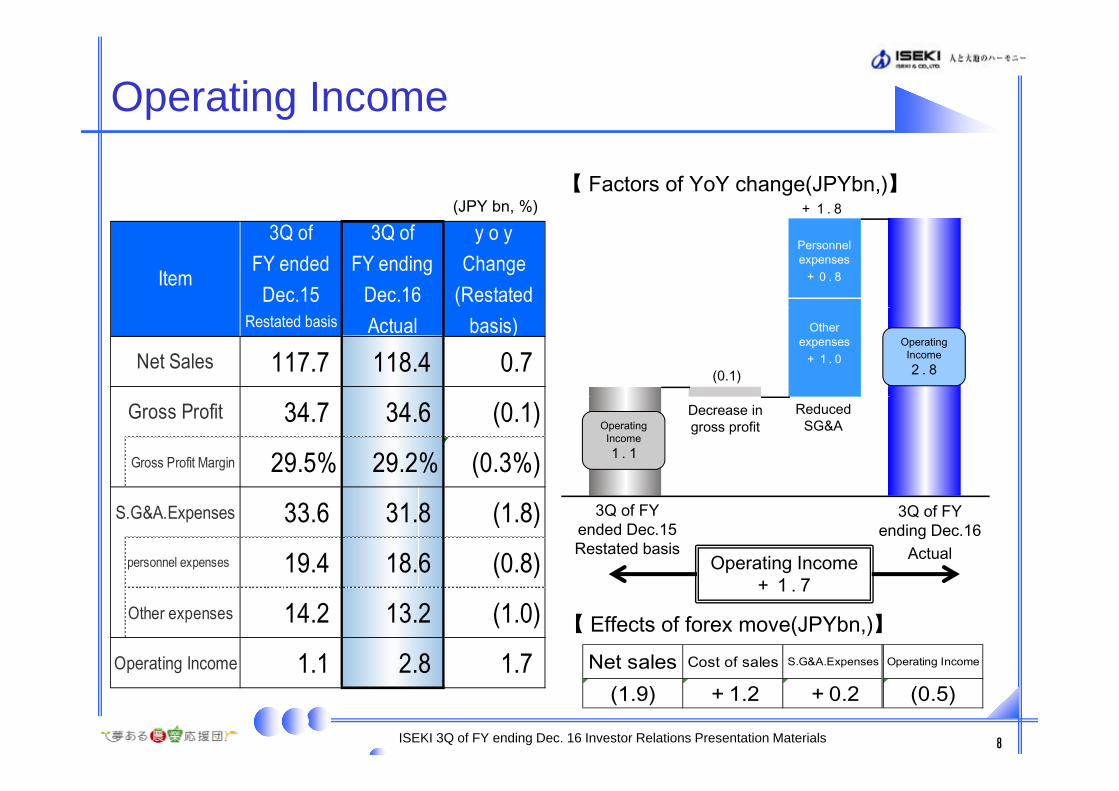
Operating Income
Restated basis
117.7 118.4 0.7
34.7 34.6 (0.1)Gross Profit Margin 29.5% 29.2% (0.3%)
33.6 31.8 (1.8)personnel expenses 19.4 18.6 (0.8)Other expenses 14.2 13.2 (1.0)
1.1 2.8 1.7
S.G&A.Expenses
Gross Profit
Operating Income
Item
Net Sales
3Q ofFY ending
Dec.16Actual
y o yChange
(Restatedbasis)
3Q ofFY ended
Dec.15
8
Operating Income1.1
Operating Income2.8
【 Factors of YoY change(JPYbn,)】
Operating Income+1.7
3Q of FY ended Dec.15 Restated basis
3Q of FY ending Dec.16
Actual
Decrease in gross profit
Reduced SG&A
+1.8
(0.1)
Other expenses+1.0
Personnel expenses+0.8
【 Effects of forex move(JPYbn,)】Net sales Cost of sales S.G&A.Expenses Operating Income
(1.9) +1.2 +0.2 (0.5)
ISEKI 3Q of FY ending Dec. 16 Investor Relations Presentation Materials
(JPY bn, %)
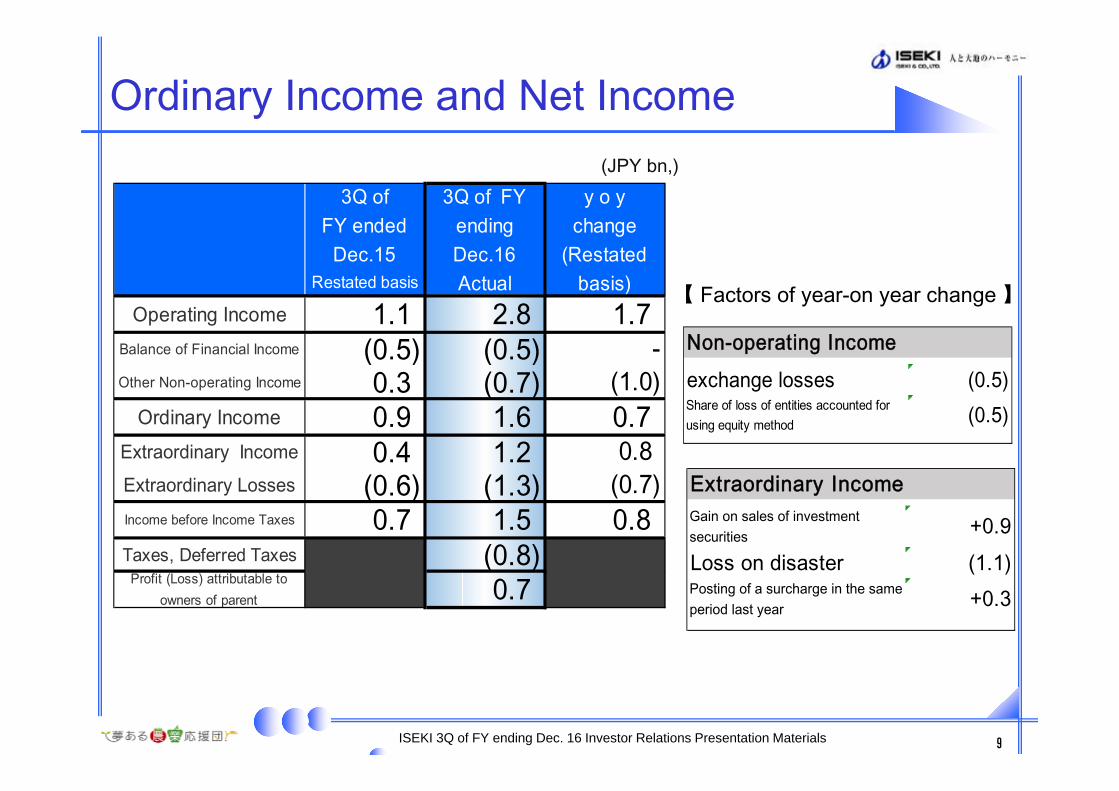
Ordinary Income and Net Income
【 Factors of year-on year change 】Restated basis
Operating Income 1.1 2.8 1.7Balance of Financial Income (0.5) (0.5) -Other Non-operating Income 0.3 (0.7) (1.0)
Ordinary Income 0.9 1.6 0.7Extraordinary Income 0.4 1.2 0.8Extraordinary Losses (0.6) (1.3) (0.7)Income before Income Taxes 0.7 1.5 0.8Taxes, Deferred Taxes (0.8)
Profit (Loss) attributable toowners of parent 0.7
3Q of FYendingDec.16Actual
y o ychange
(Restatedbasis)
3Q ofFY ended
Dec.15
9
exchange losses (0.5)Share of loss of entities accounted forusing equity method (0.5)
Non-operating Income
Gain on sales of investmentsecurities +0.9Loss on disaster (1.1)Posting of a surcharge in the sameperiod last year +0.3
Extraordinary Income
ISEKI 3Q of FY ending Dec. 16 Investor Relations Presentation Materials
(JPY bn,)

Balance Sheet
10
As ofSep.15
As ofSep.16
y o ychange
As ofSep.15
As ofSep.16
y o ychange
Cash & Deposits 7.7 14.5 6.8 Accounts Payables 39.6 40.2 0.6
Accounts Receivables 32.9 33.6 0.7 Interest Bearing Liabilities 72.3 78.2 5.9
Inventories 48.8 47.2 (1.6) Other Liabilities 26.0 24.1 (1.9)
(Merchandise and finished goods) 41.9 40.0 (1.9) Total Liabilities 137.9 142.5 4.6
Other Current Assets 3.5 3.8 0.3
Total Current Assets 92.9 99.1 6.2
Non-current Assets 96.6 97.8 1.2 (Retained earnings) 14.3 13.9 (0.4)
Investments and other assets 17.6 11.4 (6.2) (Valuation difference onavailable-for-sale securities) 2.4 0.5 (1.9)
Total Non-current Assets 114.2 109.2 (5.0) (Foreign currency translation adjustment) 1.8 0.3 (1.5)
Total Assets 207.1 208.3 1.2 Total Liabilities and Net Assets 207.1 208.3 1.2
(3.4)65.869.2Net Assets
ISEKI 3Q of FY ending Dec. 16 Investor Relations Presentation Materials
(JPY bn)
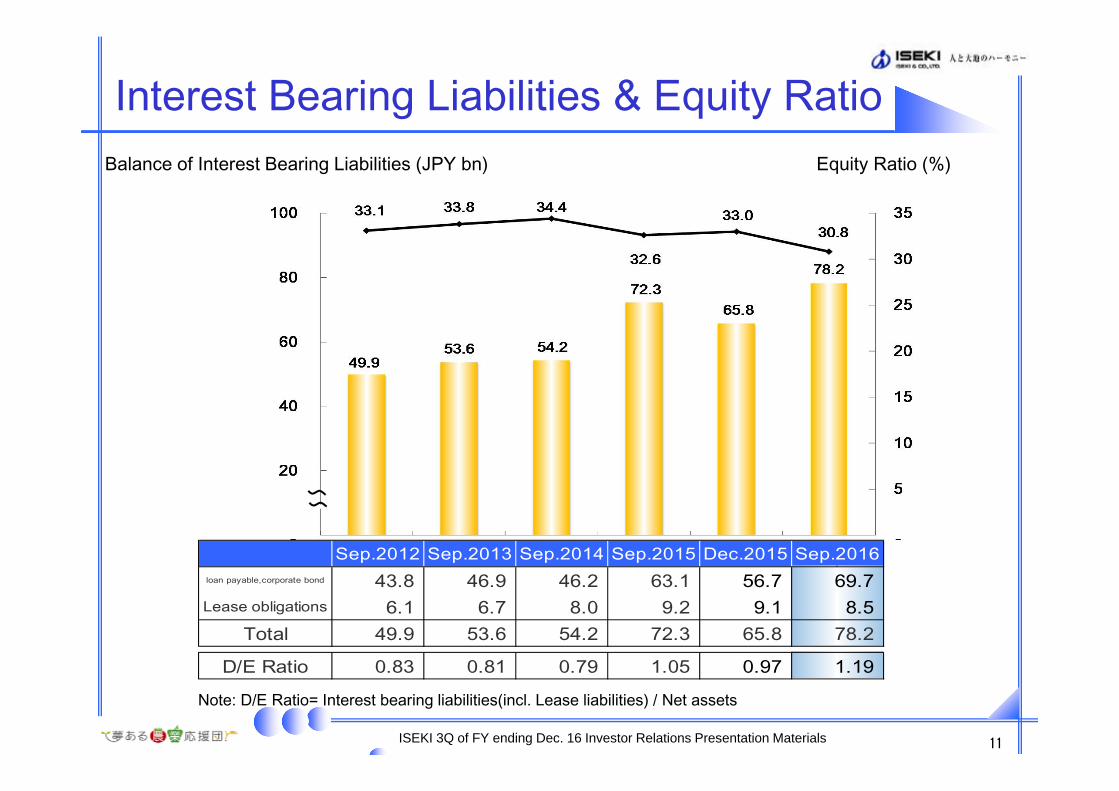
Interest Bearing Liabilities & Equity Ratio
Sep.2012 Sep.2013 Sep.2014 Sep.2015 Dec.2015 Sep.2016loan payable,corporate bond 43.8 46.9 46.2 63.1 56.7 69.7Lease obligations 6.1 6.7 8.0 9.2 9.1 8.5
Total 49.9 53.6 54.2 72.3 65.8 78.2
D/E Ratio 0.83 0.81 0.79 1.05 0.97 1.19
11ISEKI 3Q of FY ending Dec. 16 Investor Relations Presentation Materials
Balance of Interest Bearing Liabilities (JPY bn) Equity Ratio (%)
Note: D/E Ratio= Interest bearing liabilities(incl. Lease liabilities) / Net assets
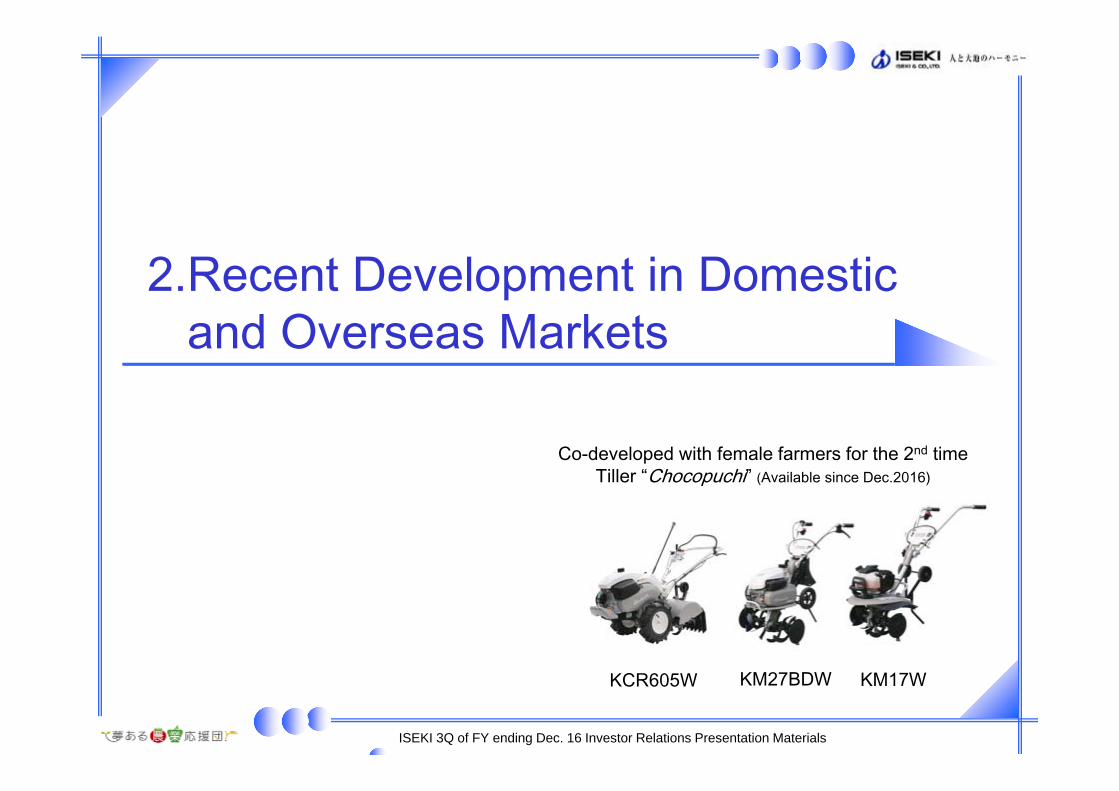
2.Recent Development in Domestic and Overseas Markets
Co-developed with female farmers for the 2nd timeTiller “Chocopuchi” (Available since Dec.2016)
KCR605W KM17WKM27BDW
ISEKI 3Q of FY ending Dec. 16 Investor Relations Presentation Materials
200
250
300
350
400
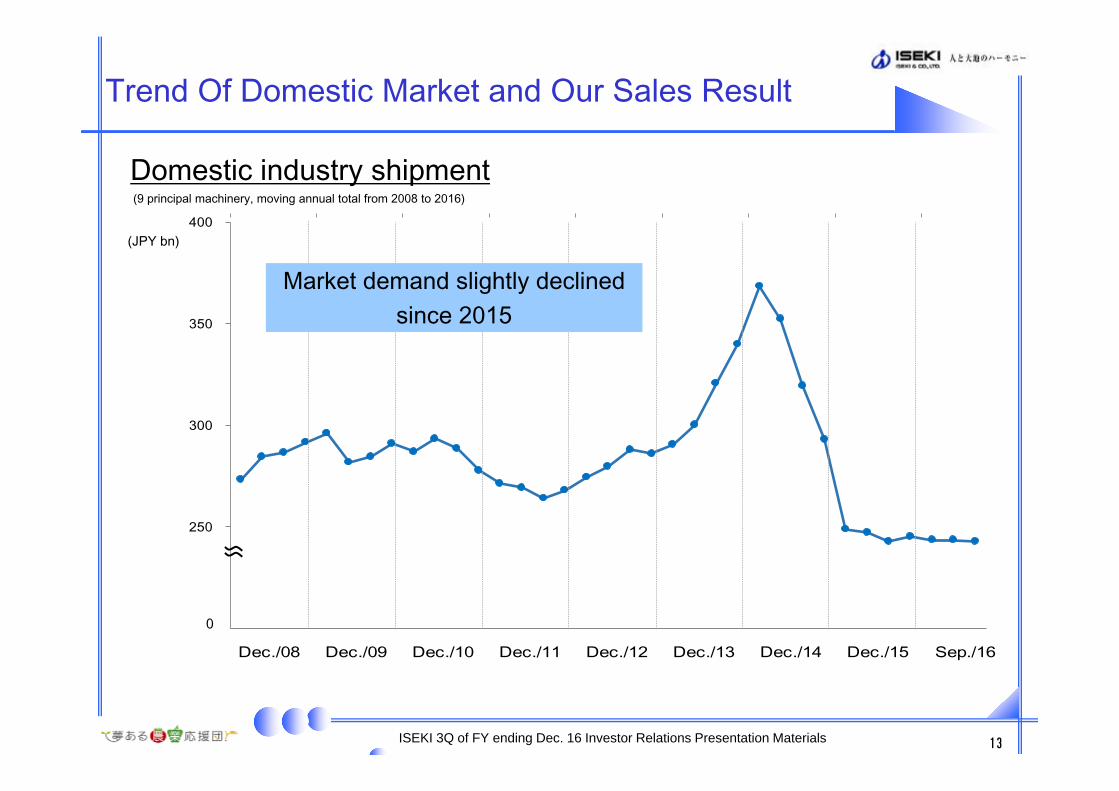
Trend Of Domestic Market and Our Sales Result
Dec./14 Dec./15 Sep./16Dec./08 Dec./09 Dec./10 Dec./11 Dec./12 Dec./13
Market demand slightly declined since 2015
13ISEKI 3Q of FY ending Dec. 16 Investor Relations Presentation Materials
Domestic industry shipment (9 principal machinery, moving annual total from 2008 to 2016)
(JPY bn)
0
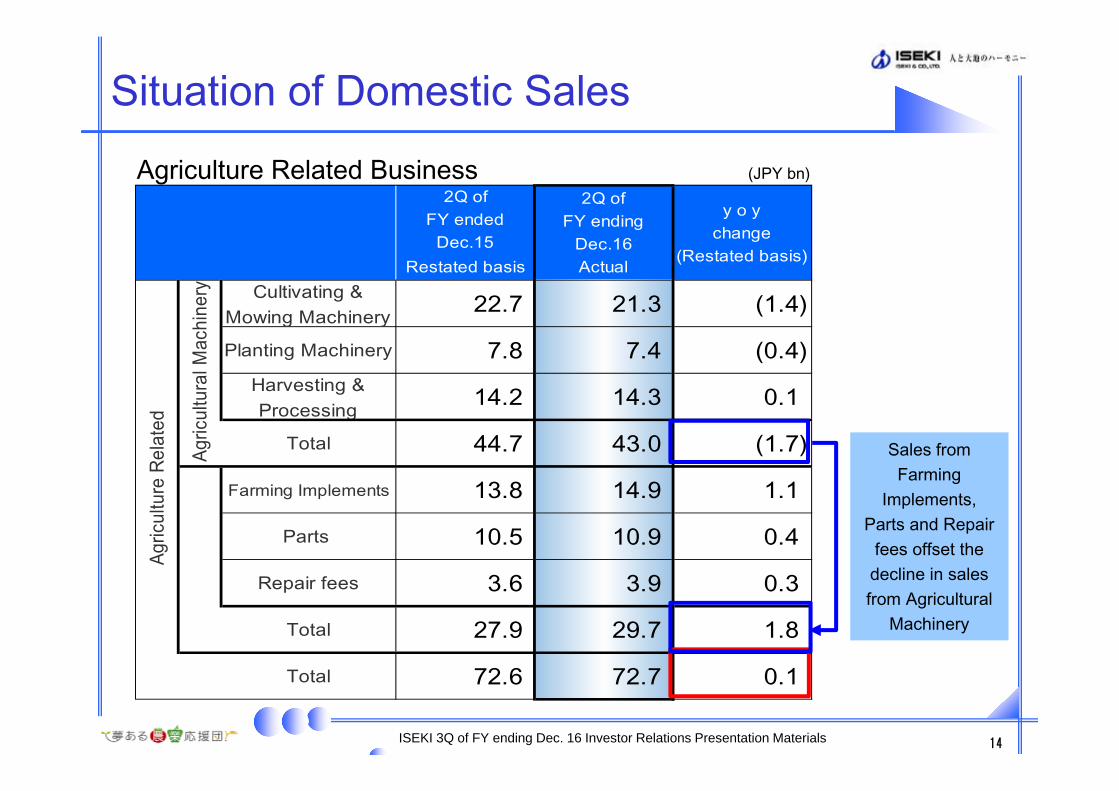
Restated basisCultivating &
Mowing Machinery 22.7 21.3 (1.4)
Planting Machinery 7.8 7.4 (0.4)Harvesting &Processing 14.2 14.3 0.1
Total 44.7 43.0 (1.7)
Farming Implements 13.8 14.9 1.1
Parts 10.5 10.9 0.4
Repair fees 3.6 3.9 0.3
Total 27.9 29.7 1.8
Total 72.6 72.7 0.1
y o ychange
(Restated basis)
2Q ofFY ending
Dec.16Actual
Agric
ultu
ral M
achi
nery
Agric
ultu
re R
elat
ed
2Q ofFY ended
Dec.15
Situation of Domestic Sales
14
Sales from Farming
Implements, Parts and Repair
fees offset the decline in sales from Agricultural
Machinery
ISEKI 3Q of FY ending Dec. 16 Investor Relations Presentation Materials
Agriculture Related Business (JPY bn)
0200400600800
1000
15/Oct. 16/Oct.
Transplanter
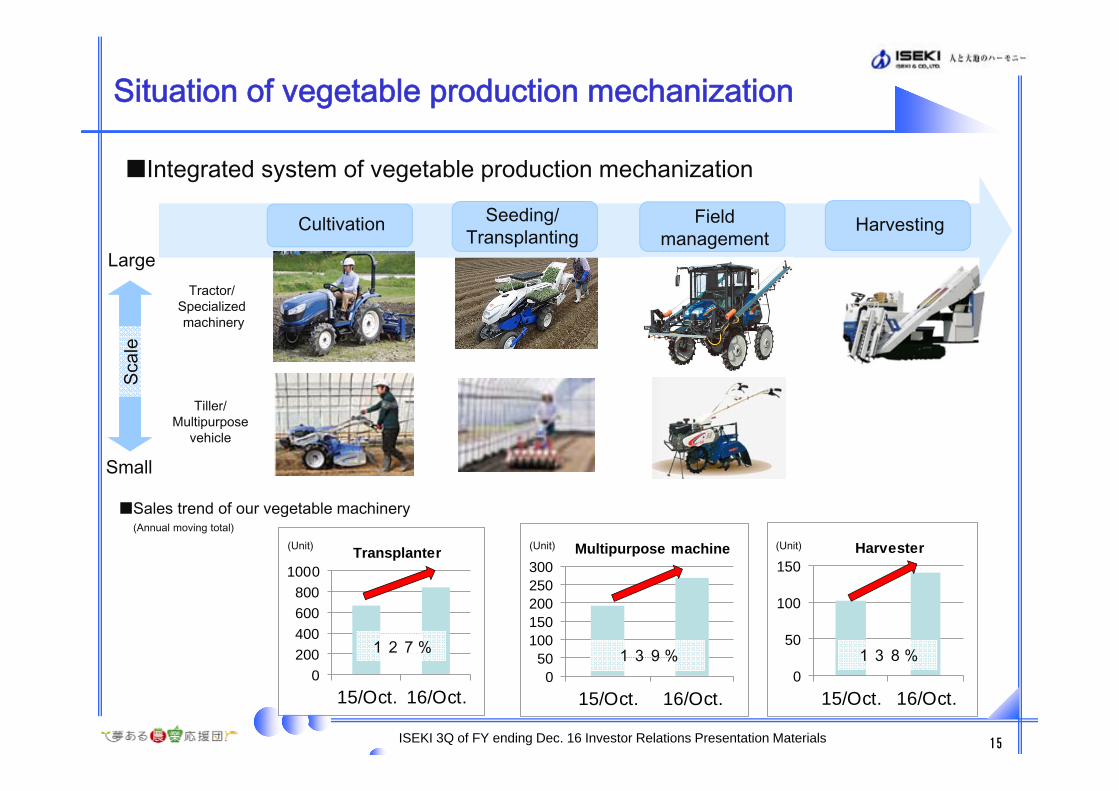
Integrated system of vegetable production mechanization
Situation of vegetable production mechanization
Cultivation Seeding/ Transplanting
Field management
Harvesting
Sales trend of our vegetable machinery
(Unit)
050
100150200250300
15/Oct. 16/Oct.
Multipurpose machine
0
50
100
150
15/Oct. 16/Oct.
Harvester
127% 139% 138%
Large
Small
Scal
e
Tractor/Specialized machinery
Tiller/Multipurpose
vehicle
(Annual moving total) (Unit) (Unit)
ISEKI 3Q of FY ending Dec. 16 Investor Relations Presentation Materials 15
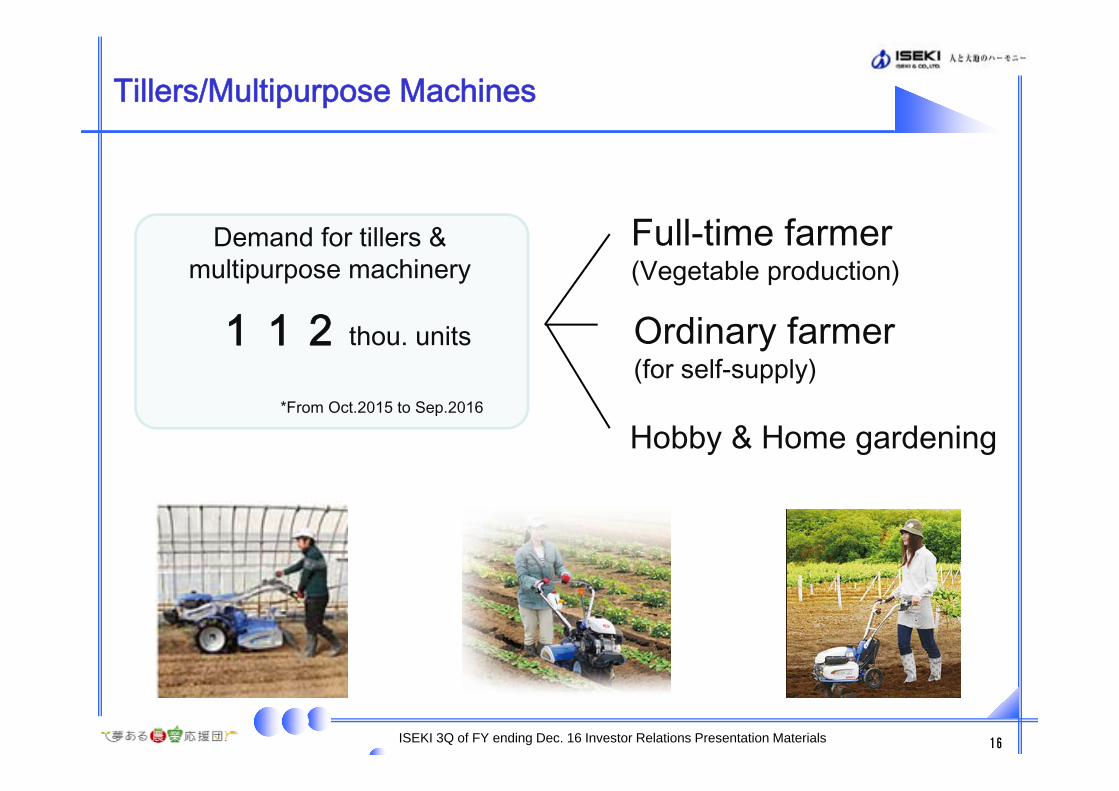
Full-time farmer (Vegetable production)
Ordinary farmer(for self-supply)
Hobby & Home gardening
Tillers/Multipurpose Machines
Demand for tillers & multipurpose machinery
112 thou. units
*From Oct.2015 to Sep.2016
ISEKI 3Q of FY ending Dec. 16 Investor Relations Presentation Materials 16
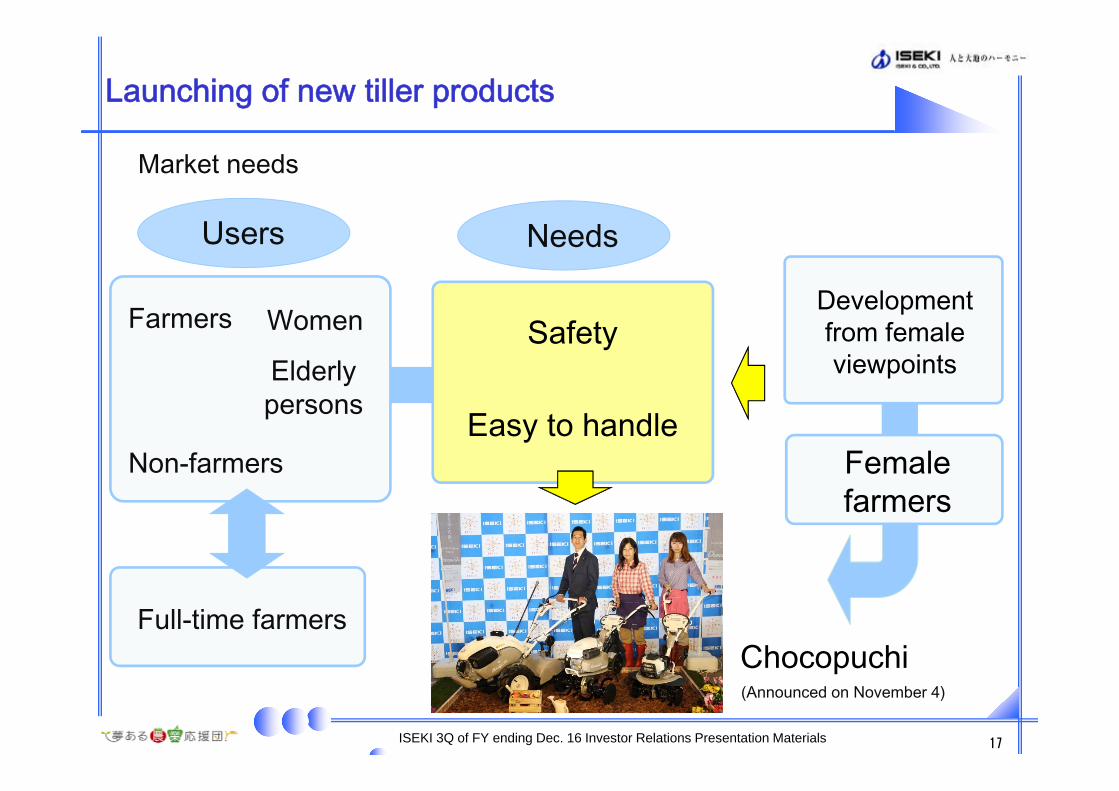
Development from female viewpoints
Needs
Launching of new tiller products
Market needs
Safety
Users
Farmers Women
Non-farmers
Elderly persons
Full-time farmers
Easy to handle Female farmers
Chocopuchi (Announced on November 4)
ISEKI 3Q of FY ending Dec. 16 Investor Relations Presentation Materials 17
0
5
10
15
20
25
30
35
Jan Feb Mar Apr May Jun Jul Aug Sep Oct Nov Dec
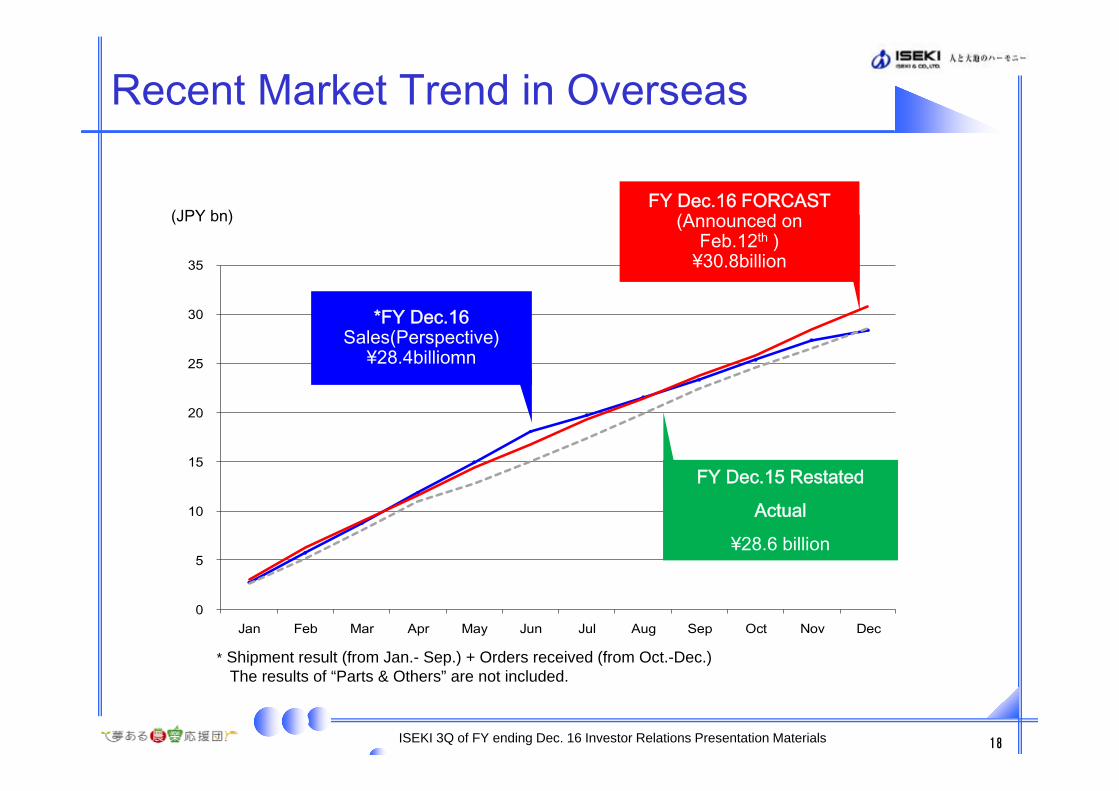
Recent Market Trend in Overseas
*FY Dec.16 Sales(Perspective)
¥28.4billiomn
FY Dec.16 FORCAST(Announced on
Feb.12th )¥30.8billion
18ISEKI 3Q of FY ending Dec. 16 Investor Relations Presentation Materials
FY Dec.15 Restated
Actual
¥28.6 billion
(JPY bn)
* Shipment result (from Jan.- Sep.) + Orders received (from Oct.-Dec.)The results of “Parts & Others” are not included.
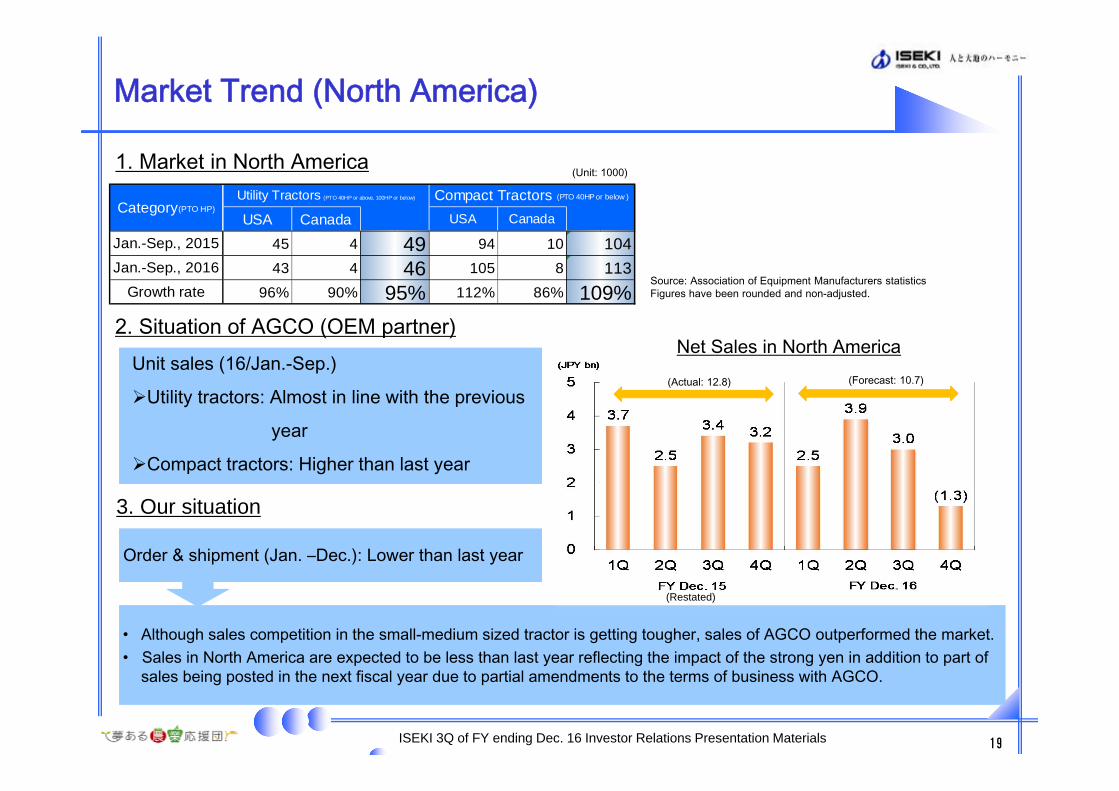
1. Market in North America
Market Trend (North America)
• Although sales competition in the small-medium sized tractor is getting tougher, sales of AGCO outperformed the market.• Sales in North America are expected to be less than last year reflecting the impact of the strong yen in addition to part of
sales being posted in the next fiscal year due to partial amendments to the terms of business with AGCO.
USA Canada USA Canada
45 4 49 94 10 10443 4 46 105 8 113
96% 90% 95% 112% 86% 109%
Utility Tractors (PTO 40HP or above, 100HP or below)
Category(PTO HP)
Growth rate
Compact Tractors (PTO 40HP or below )
Jan.-Sep., 2015
Jan.-Sep., 2016Source: Association of Equipment Manufacturers statisticsFigures have been rounded and non-adjusted.
2. Situation of AGCO (OEM partner)
(Unit: 1000)
3. Our situation
Order & shipment (Jan. –Dec.): Lower than last year
Unit sales (16/Jan.-Sep.)
Utility tractors: Almost in line with the previous
year
Compact tractors: Higher than last year
Net Sales in North America
(Restated)
(Actual: 12.8) (Forecast: 10.7)
ISEKI 3Q of FY ending Dec. 16 Investor Relations Presentation Materials 19
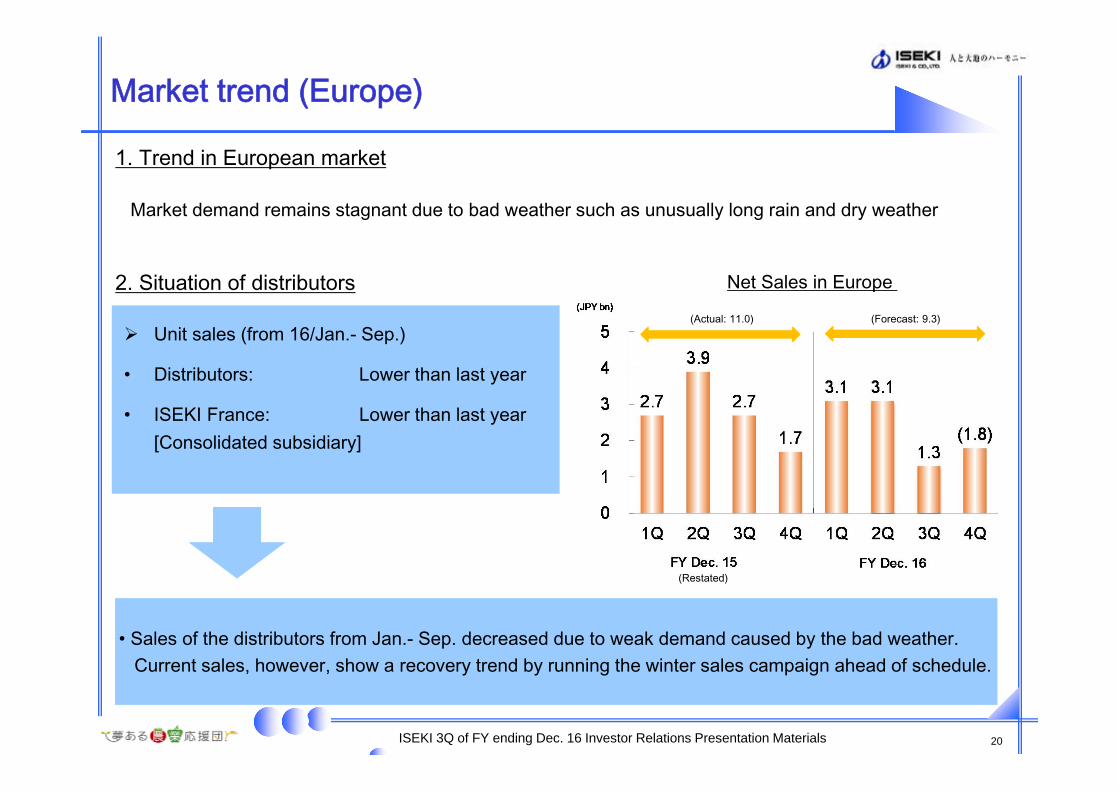
Market trend (Europe)
2. Situation of distributors
• Sales of the distributors from Jan.- Sep. decreased due to weak demand caused by the bad weather.Current sales, however, show a recovery trend by running the winter sales campaign ahead of schedule.
Market demand remains stagnant due to bad weather such as unusually long rain and dry weather
Unit sales (from 16/Jan.- Sep.)
• Distributors: Lower than last year
• ISEKI France: Lower than last year [Consolidated subsidiary]
1. Trend in European market
Net Sales in Europe
20
(Restated)
(Actual: 11.0) (Forecast: 9.3)
ISEKI 3Q of FY ending Dec. 16 Investor Relations Presentation Materials
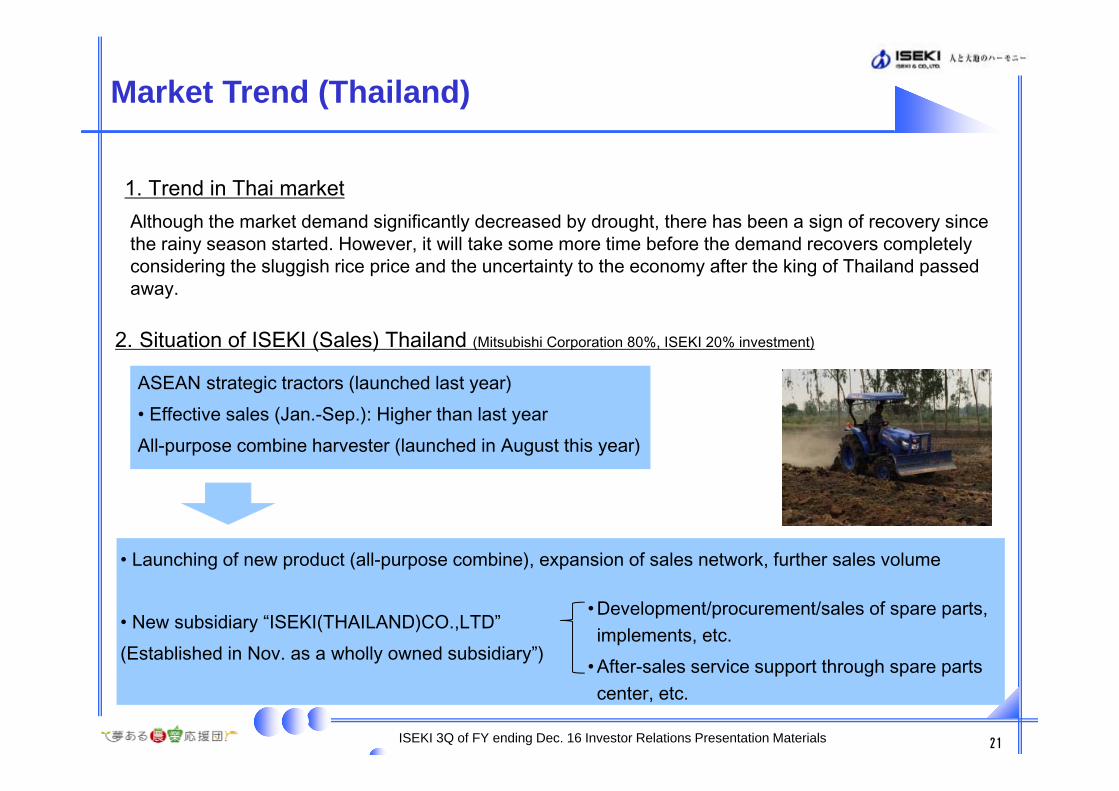
Market Trend (Thailand)
1. Trend in Thai market
2. Situation of ISEKI (Sales) Thailand (Mitsubishi Corporation 80%, ISEKI 20% investment)
Although the market demand significantly decreased by drought, there has been a sign of recovery since the rainy season started. However, it will take some more time before the demand recovers completely considering the sluggish rice price and the uncertainty to the economy after the king of Thailand passed away.
ASEAN strategic tractors (launched last year)• Effective sales (Jan.-Sep.): Higher than last yearAll-purpose combine harvester (launched in August this year)
• Launching of new product (all-purpose combine), expansion of sales network, further sales volume
• New subsidiary “ISEKI(THAILAND)CO.,LTD” (Established in Nov. as a wholly owned subsidiary”)
• Development/procurement/sales of spare parts, implements, etc.
• After-sales service support through spare parts center, etc.
ISEKI 3Q of FY ending Dec. 16 Investor Relations Presentation Materials 21
Market Trend (Indonesia)
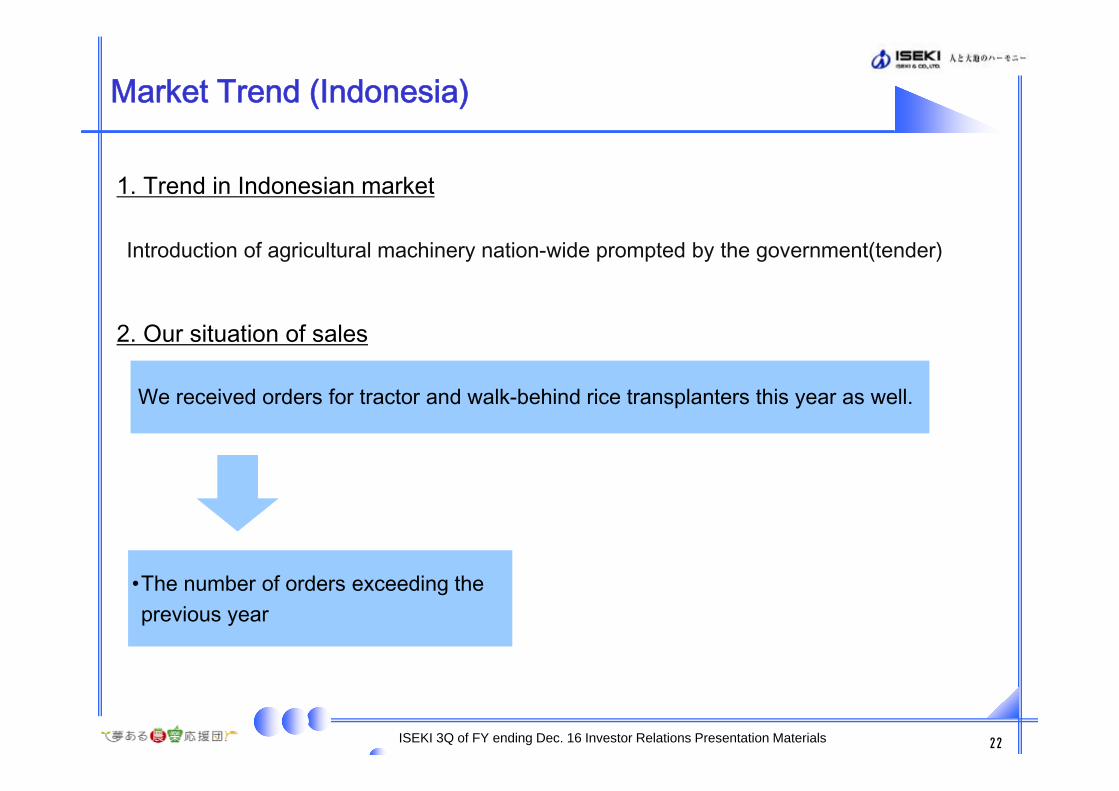
1. Trend in Indonesian market
2. Our situation of sales
Introduction of agricultural machinery nation-wide prompted by the government(tender)
We received orders for tractor and walk-behind rice transplanters this year as well.
•The number of orders exceeding the previous year
ISEKI 3Q of FY ending Dec. 16 Investor Relations Presentation Materials 22
Market Trend (Indonesia)
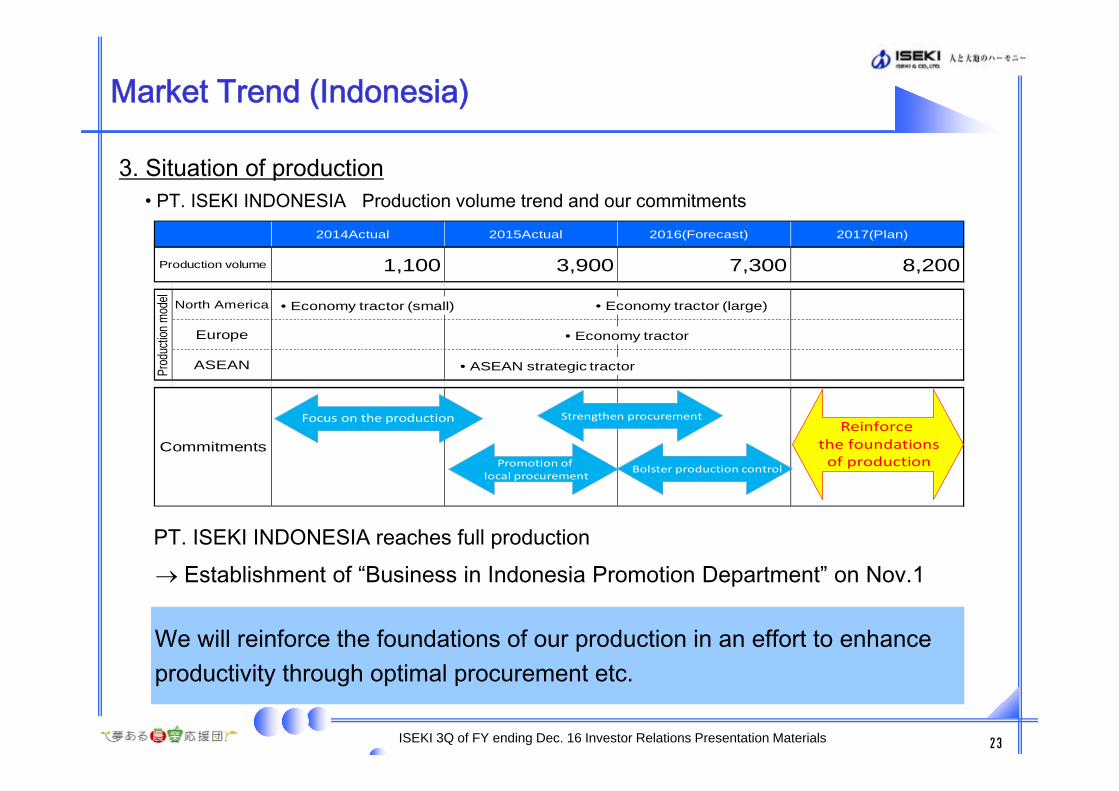
3. Situation of production
PT. ISEKI INDONESIA reaches full production
Establishment of “Business in Indonesia Promotion Department” on Nov.1
• PT. ISEKI INDONESIA Production volume trend and our commitments
We will reinforce the foundations of our production in an effort to enhance productivity through optimal procurement etc.
2014Actual 2015Actual 2016(Forecast) 2017(Plan)
1,100 3,900 7,300 8,200
North America
Europe
ASEAN
Production volume
Prod
uctio
n mod
el
Commitments
• Economy tractor (small) • Economy tractor (large)
• Economy tractor
• ASEAN strategic tractor
Focus on the production
Promotion of local procurement
Strengthen procurement
Bolster production control
Reinforce the foundations of production
ISEKI 3Q of FY ending Dec. 16 Investor Relations Presentation Materials 23
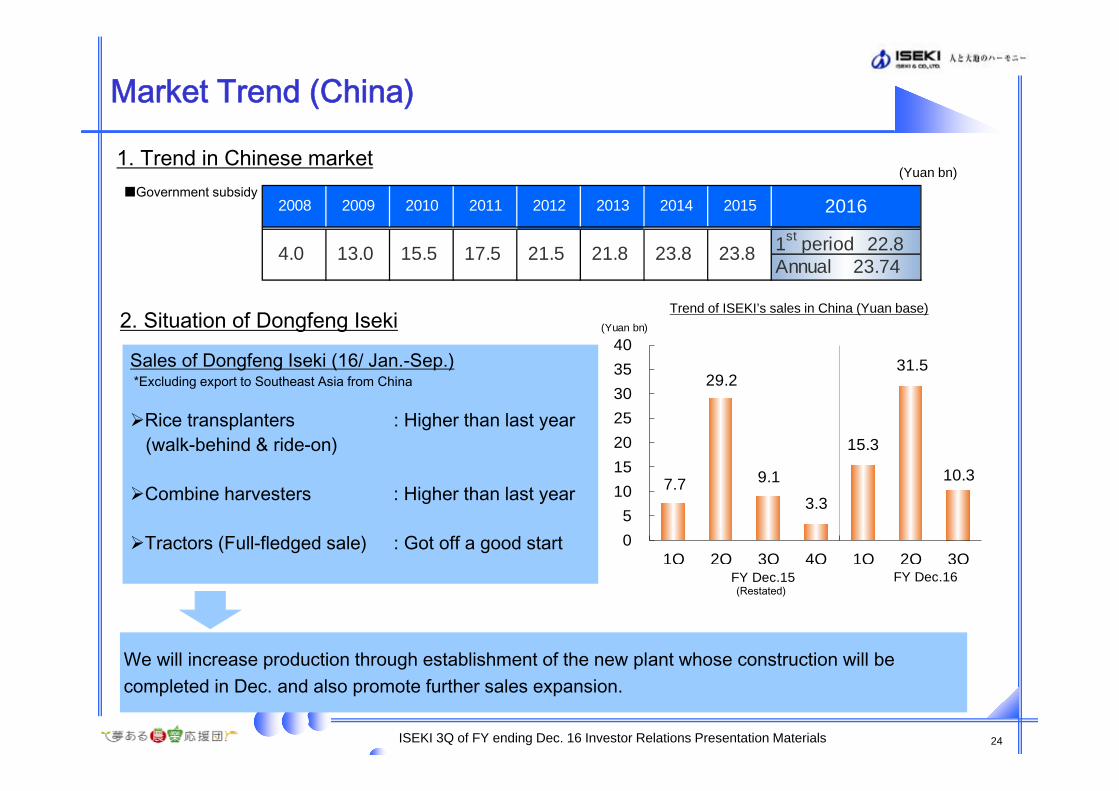
7.7
29.2
9.1
3.3
15.3
31.5
10.3
05
10152025303540
1Q 2Q 3Q 4Q 1Q 2Q 3Q
(Yuan bn)
FY Dec.15 FY Dec.16
Market Trend (China)
1. Trend in Chinese market
2.当社の状況
We will increase production through establishment of the new plant whose construction will be completed in Dec. and also promote further sales expansion.
Sales of Dongfeng Iseki (16/ Jan.-Sep.)*Excluding export to Southeast Asia from China
Rice transplanters : Higher than last year(walk-behind & ride-on)
Combine harvesters : Higher than last year
Tractors (Full-fledged sale) : Got off a good start
2008 2009 2010 2011 2012 2013 2014 2015
4.0 13.0 21.517.515.5 21.8Annual 23.741st period 22.823.8 23.8
2016
(Yuan bn) Government subsidy
2. Situation of Dongfeng Iseki Trend of ISEKI’s sales in China (Yuan base)
24
(Restated)
ISEKI 3Q of FY ending Dec. 16 Investor Relations Presentation Materials
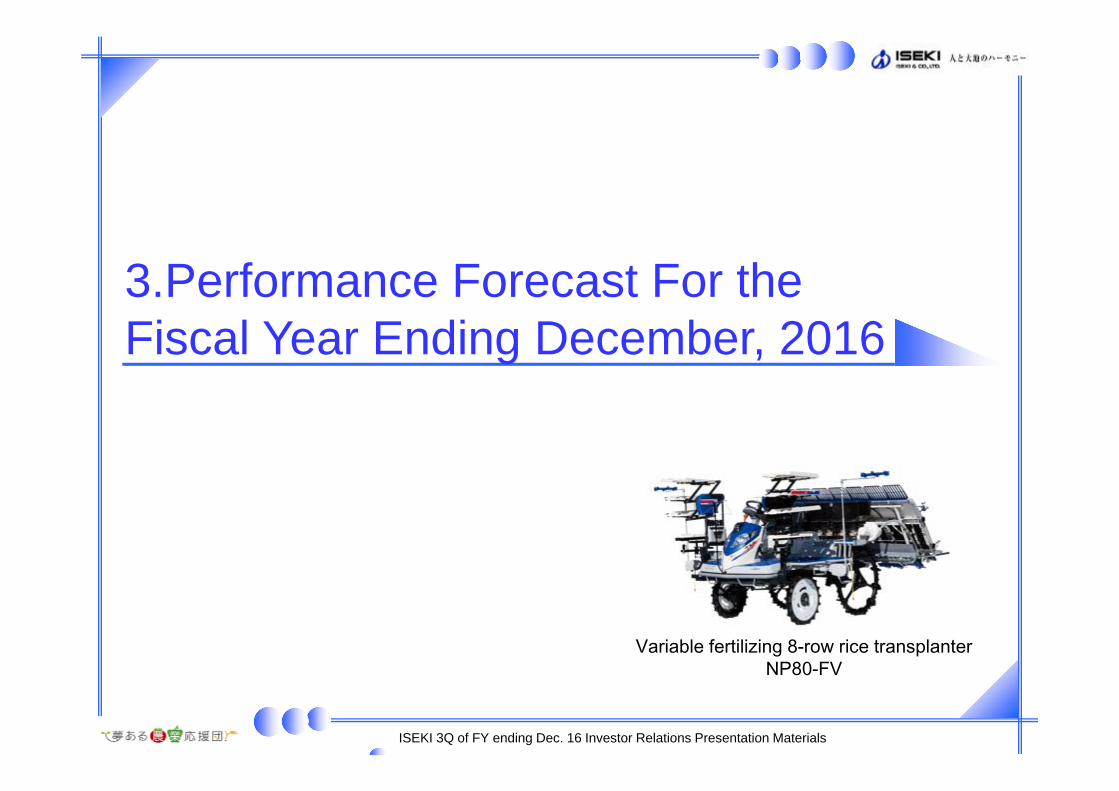
3.Performance Forecast For the Fiscal Year Ending December, 2016
ISEKI 3Q of FY ending Dec. 16 Investor Relations Presentation Materials
Variable fertilizing 8-row rice transplanterNP80-FV
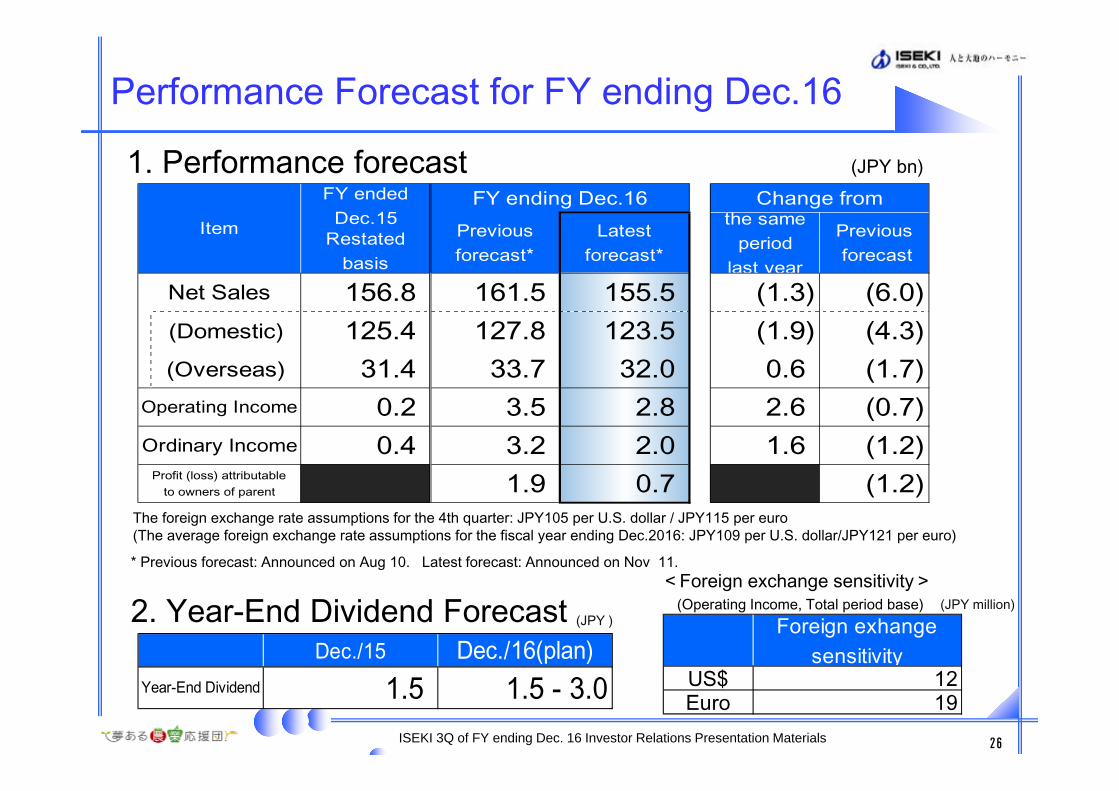
Restatedbasis
156.8 161.5 155.5 (1.3) (6.0)(Domestic) 125.4 127.8 123.5 (1.9) (4.3)(Overseas) 31.4 33.7 32.0 0.6 (1.7)
0.2 3.5 2.8 2.6 (0.7)0.4 3.2 2.0 1.6 (1.2)
1.9 0.7 (1.2)
Previousforecast*
FY endedDec.15
Change fromPrevious forecast
the sameperiod
last year
FY ending Dec.16
Profit (loss) attributableto owners of parent
Net Sales
Operating Income
Ordinary Income
Item Latestforecast*
Dec./15 Dec./16(plan)1.5 1.5 - 3.0Year-End Dividend
1. Performance forecast
2. Year-End Dividend Forecast
The foreign exchange rate assumptions for the 4th quarter: JPY105 per U.S. dollar / JPY115 per euro(The average foreign exchange rate assumptions for the fiscal year ending Dec.2016: JPY109 per U.S. dollar/JPY121 per euro)
Performance Forecast for FY ending Dec.16
Foreign exhangesensitivity
US$ 12Euro 19
ISEKI 3Q of FY ending Dec. 16 Investor Relations Presentation Materials
(JPY bn)
* Previous forecast: Announced on Aug 10. Latest forecast: Announced on Nov 11.<Foreign exchange sensitivity>
(Operating Income, Total period base) (JPY million) (JPY )
26
4. Topics
ISEKI 3Q of FY ending Dec. 16 Investor Relations Presentation Materials
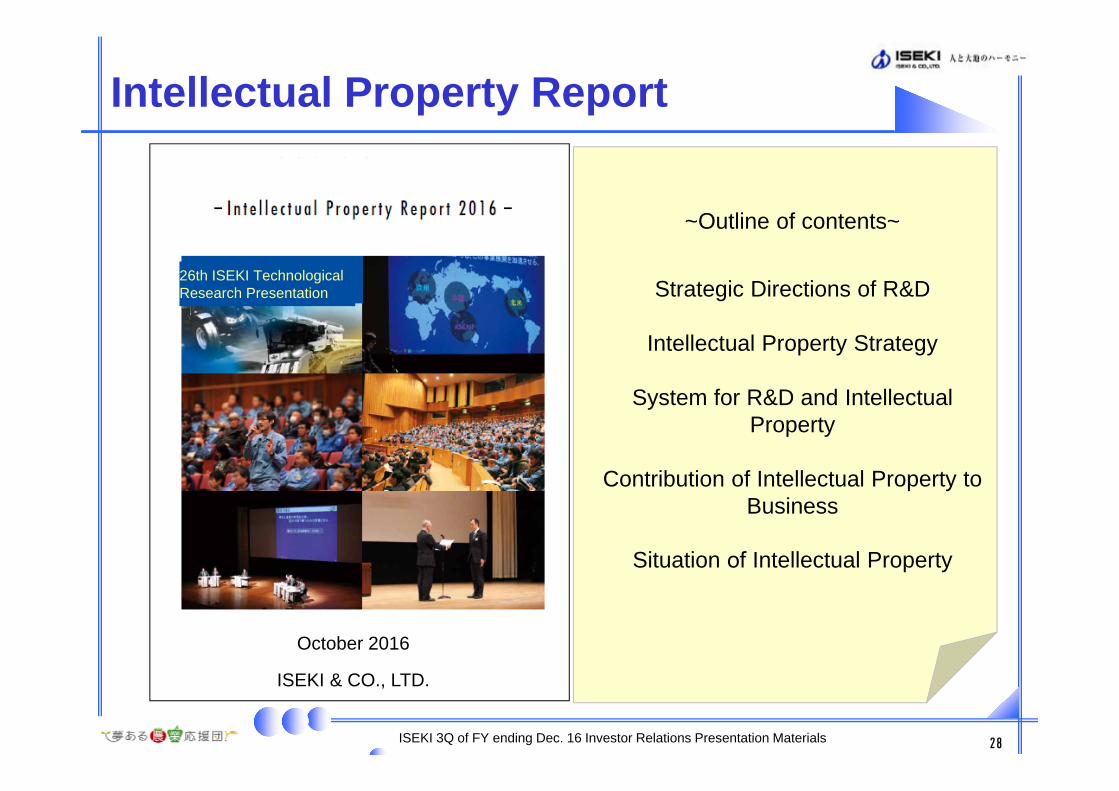
Intellectual Property Report
26th ISEKI Technological Research Presentation
October 2016
ISEKI & CO., LTD.
~Outline of contents~
Strategic Directions of R&D
Intellectual Property Strategy
System for R&D and Intellectual Property
Contribution of Intellectual Property to Business
Situation of Intellectual Property
ISEKI 3Q of FY ending Dec. 16 Investor Relations Presentation Materials 28
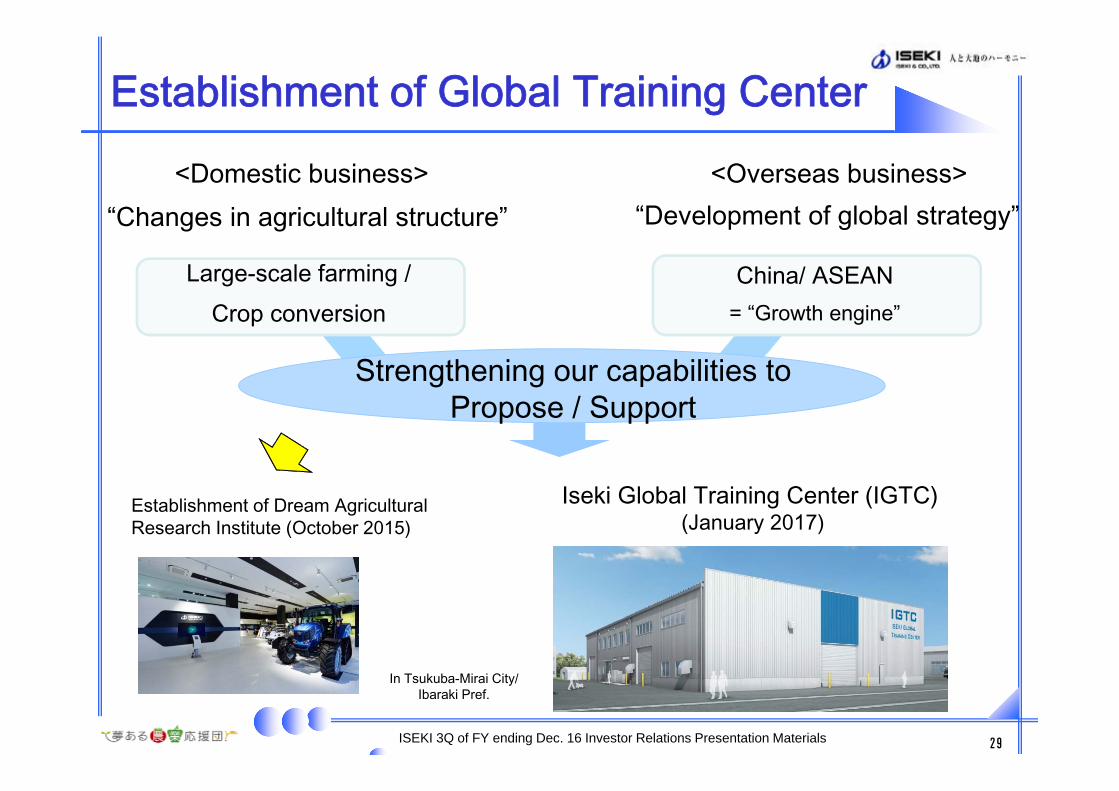
Establishment of Global Training Center
Strengthening our capabilities to Propose / Support
<Overseas business>
Establishment of Dream Agricultural Research Institute (October 2015)
“Changes in agricultural structure”
Large-scale farming /Crop conversion
<Domestic business>
Iseki Global Training Center (IGTC)(January 2017)
“Development of global strategy”
China/ ASEAN = “Growth engine”
In Tsukuba-Mirai City/ Ibaraki Pref.
ISEKI 3Q of FY ending Dec. 16 Investor Relations Presentation Materials 29
Notes on the Future Forecast
• The objective of this presentation document is to provide information and never intends to induce any action.
• The document was created by ISEKI with currently available information and it involves potential risks and uncertainties. The forecast may not be consistent with actual results depending on fluctuation of the economic situation and market trends.
• In using this information, investors are expected to depend on their own judgment. ISEKI is not liable for any losses incurred by investment decision made utilizing the business forecast or targets given in this document.
ISEKI group is a promotional partner of FOOD ACTION NIPPON.
ISEKI Group joins the nationwide action called “COOL CHOICE” run by the Ministry of the Environment Government of Japan, which promotes to make ”smart choices” for the global warming.As a proposal of “smart choices”, we develop and deliver environmental-friendly products like “eco products”.
ISEKI 3Q of FY ending Dec. 16 Investor Relations Presentation Materials 30