Embed Size (px)
Citation preview
Financial Results for the Fiscal Year Ended March 31, 2019 [Japanese GAAP] (Consolidated)
May 10, 2019
Name of Listed Company: UCHIYAMA HOLDINGS INC. Stock Listing: TSE
Code Number: 6059 URL: http://www.uchiyama-gr.jp
Representative: Fumiharu Uchiyama, President and Representative Director
Contact Point: Takehiro Yamamoto, Senior Managing Director and Manager of Business Planning Office
Phone: (093) 551-0002
Scheduled Date of Annual Meeting of Shareholders: June 25, 2019
Scheduled Date of Dividend Payment Start: June 26, 2019
Scheduled Date of Financial Statements Filing: June 26, 2019
Supplementary Materials for Financial Results: Yes
Investor Conference for Financial Results: Yes (For institutional investors and security analysts)
(Amounts are rounded down to the nearest one million yen)
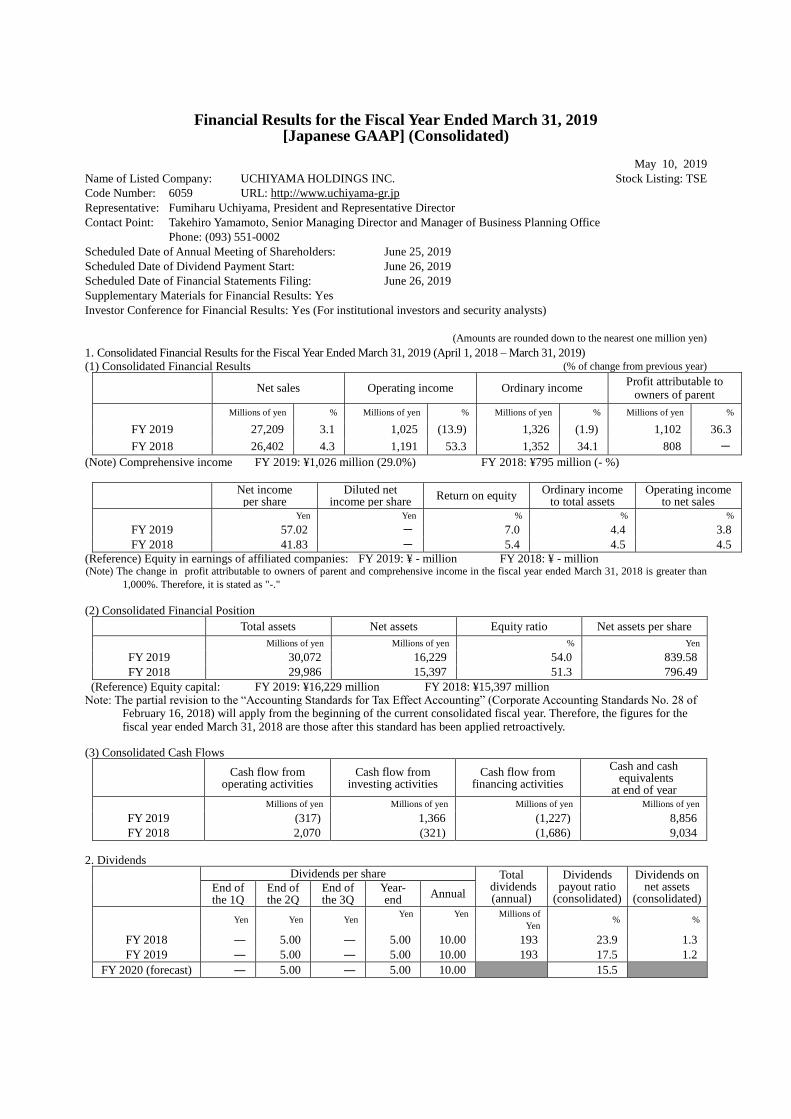
1. Consolidated Financial Results for the Fiscal Year Ended March 31, 2019 (April 1, 2018 – March 31, 2019) (1) Consolidated Financial Results (% of change from previous year)
Net sales Operating income Ordinary income Profit attributable to
owners of parent
Millions of yen % Millions of yen % Millions of yen % Millions of yen %
FY 2019 27,209 3.1 1,025 (13.9) 1,326 (1.9) 1,102 36.3
FY 2018 26,402 4.3 1,191 53.3 1,352 34.1 808 -
(Note) Comprehensive income FY 2019: ¥1,026 million (29.0%) FY 2018: ¥795 million (- %)
Net income
per share Diluted net
income per share Return on equity
Ordinary income to total assets
Operating income to net sales
Yen Yen % % %
FY 2019 57.02 - 7.0 4.4 3.8
FY 2018 41.83 - 5.4 4.5 4.5
(Reference) Equity in earnings of affiliated companies: FY 2019: ¥ - million FY 2018: ¥ - million (Note) The change in profit attributable to owners of parent and comprehensive income in the fiscal year ended March 31, 2018 is greater than
1,000%. Therefore, it is stated as "-."
(2) Consolidated Financial Position
Total assets Net assets Equity ratio Net assets per share
Millions of yen Millions of yen % Yen
FY 2019 30,072 16,229 54.0 839.58
FY 2018 29,986 15,397 51.3 796.49
(Reference) Equity capital: FY 2019: ¥16,229 million FY 2018: ¥15,397 million Note: The partial revision to the “Accounting Standards for Tax Effect Accounting” (Corporate Accounting Standards No. 28 of
February 16, 2018) will apply from the beginning of the current consolidated fiscal year. Therefore, the figures for the fiscal year ended March 31, 2018 are those after this standard has been applied retroactively.
(3) Consolidated Cash Flows
Cash flow from operating activities
Cash flow from investing activities
Cash flow from financing activities
Cash and cash equivalents
at end of year
Millions of yen Millions of yen Millions of yen Millions of yen
FY 2019 (317) 1,366 (1,227) 8,856
FY 2018 2,070 (321) (1,686) 9,034
2. Dividends
Dividends per share Total
dividends (annual)
Dividends payout ratio
(consolidated)
Dividends on net assets
(consolidated) End of the 1Q
End of the 2Q
End of the 3Q
Year-end
Annual
Yen Yen Yen Yen Yen Millions of
Yen % %
FY 2018 ― 5.00 ― 5.00 10.00 193 23.9 1.3
FY 2019 ― 5.00 ― 5.00 10.00 193 17.5 1.2
FY 2020 (forecast) ― 5.00 ― 5.00 10.00 15.5
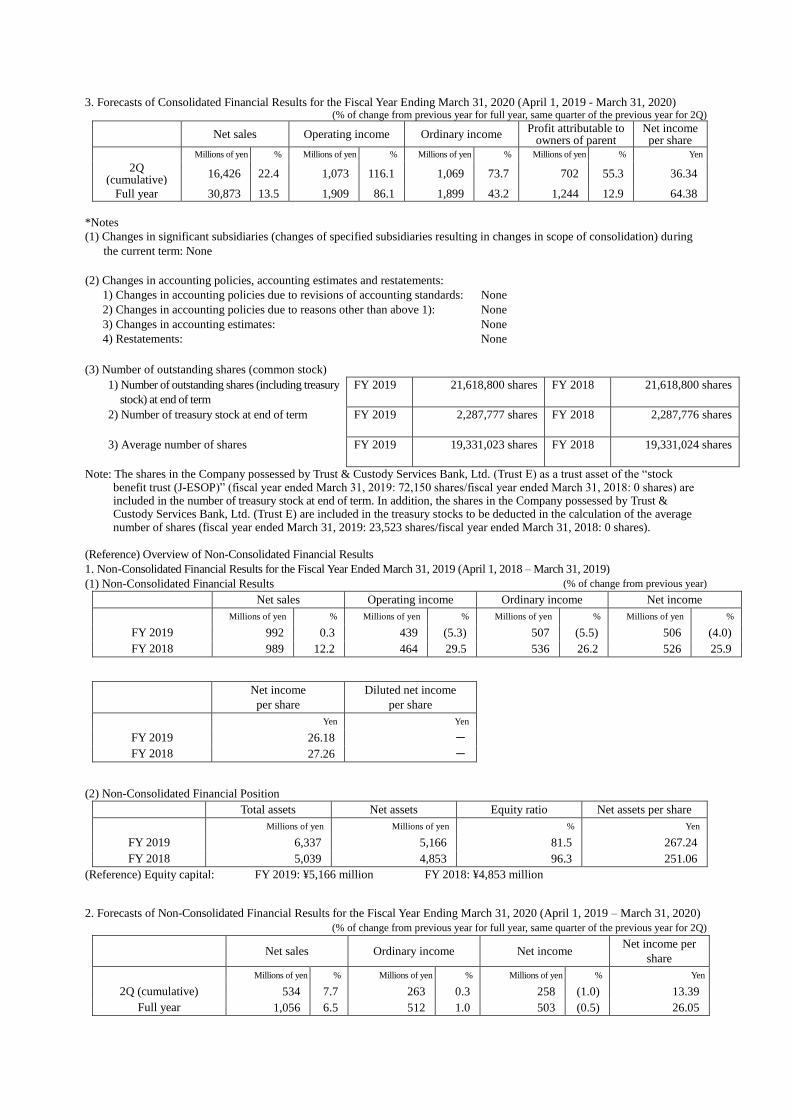
3. Forecasts of Consolidated Financial Results for the Fiscal Year Ending March 31, 2020 (April 1, 2019 - March 31, 2020) (% of change from previous year for full year, same quarter of the previous year for 2Q)
Net sales Operating income Ordinary income Profit attributable to
owners of parent Net income per share
Millions of yen % Millions of yen % Millions of yen % Millions of yen % Yen
2Q (cumulative)
16,426 22.4 1,073 116.1 1,069 73.7 702 55.3 36.34
Full year 30,873 13.5 1,909 86.1 1,899 43.2 1,244 12.9 64.38
*Notes
(1) Changes in significant subsidiaries (changes of specified subsidiaries resulting in changes in scope of consolidation) during
the current term: None
(2) Changes in accounting policies, accounting estimates and restatements:
1) Changes in accounting policies due to revisions of accounting standards: None
2) Changes in accounting policies due to reasons other than above 1): None
3) Changes in accounting estimates: None
4) Restatements: None
(3) Number of outstanding shares (common stock)
1) Number of outstanding shares (including treasury
stock) at end of term
FY 2019 21,618,800 shares FY 2018 21,618,800 shares
2) Number of treasury stock at end of term
FY 2019 2,287,777 shares FY 2018 2,287,776 shares
3) Average number of shares
FY 2019 19,331,023 shares FY 2018 19,331,024 shares
Note: The shares in the Company possessed by Trust & Custody Services Bank, Ltd. (Trust E) as a trust asset of the “stock benefit trust (J-ESOP)” (fiscal year ended March 31, 2019: 72,150 shares/fiscal year ended March 31, 2018: 0 shares) are included in the number of treasury stock at end of term. In addition, the shares in the Company possessed by Trust & Custody Services Bank, Ltd. (Trust E) are included in the treasury stocks to be deducted in the calculation of the average number of shares (fiscal year ended March 31, 2019: 23,523 shares/fiscal year ended March 31, 2018: 0 shares).
(Reference) Overview of Non-Consolidated Financial Results
1. Non-Consolidated Financial Results for the Fiscal Year Ended March 31, 2019 (April 1, 2018 – March 31, 2019)
(1) Non-Consolidated Financial Results (% of change from previous year)
Net sales Operating income Ordinary income Net income
Millions of yen % Millions of yen % Millions of yen % Millions of yen %
FY 2019 992 0.3 439 (5.3) 507 (5.5) 506 (4.0)
FY 2018 989 12.2 464 29.5 536 26.2 526 25.9
Net income
per share
Diluted net income
per share
Yen Yen
FY 2019 26.18 -
FY 2018 27.26 -
(2) Non-Consolidated Financial Position
Total assets Net assets Equity ratio Net assets per share
Millions of yen Millions of yen % Yen
FY 2019 6,337 5,166 81.5 267.24
FY 2018 5,039 4,853 96.3 251.06
(Reference) Equity capital: FY 2019: ¥5,166 million FY 2018: ¥4,853 million
2. Forecasts of Non-Consolidated Financial Results for the Fiscal Year Ending March 31, 2020 (April 1, 2019 – March 31, 2020)
(% of change from previous year for full year, same quarter of the previous year for 2Q)
Net sales Ordinary income Net income Net income per
share
Millions of yen % Millions of yen % Millions of yen % Yen
2Q (cumulative) 534 7.7 263 0.3 258 (1.0) 13.39
Full year 1,056 6.5 512 1.0 503 (0.5) 26.05
*Summary of financial results is out of scope of quarterly review by certified public accountant or audit corporation.
*Statement regarding the proper use of financial forecasts and other remarks
Descriptions regarding the future, including the financial projections contained in this report, are based on certain
assumptions currently available to the Company, which are, at the discretion of the Company, deemed reasonable. Actual
financial results may significantly vary due to various factors. For assumptions used in forecasting financial results and
precautions in using the financial projections, please refer to Appendix on Page 5, “1. Business Performance Overview
(4) Future Outlook.”
The Company is planning to host a financial settlement reporting meeting for institutional investors and analysts on May
31, 2019. The contents (recorded sound) will be posted on the Company’s Web page immediately after the meeting.
1
○Table of contents of the appendix
1. Business Performance Overview .................................................................................................................................................. 2
(1) Business Performance Overview for Current Term ................................................................................................................ 2
(2) Financial Standing Overview for Current Term ...................................................................................................................... 3
(3) Cash Flow Overview for Current Term ................................................................................................................................... 4
(4) Future Outlook ........................................................................................................................................................................ 5
2. Basic Principles of Selecting Accounting Standards .................................................................................................................... 5
3. Consolidated Financial Statements and Major Notes ................................................................................................................... 6
(1) Consolidated Balance Sheets .................................................................................................................................................. 6
(2) Consolidated Statements of Income and Consolidated Statements of Comprehensive Income .............................................. 8
(3) Consolidated Statements of Changes in Net Assets ...............................................................................................................10
(4) Consolidated Statements of Cash Flows ................................................................................................................................12
(5) Notes to Consolidated Financial Statements ..........................................................................................................................14
(Notes regarding premise of a going concern) .........................................................................................................................14
(Change in presentation method) .............................................................................................................................................14
(Additional information) .........................................................................................................................................................15
(Segment information, etc.) .....................................................................................................................................................15
(Per share information) ............................................................................................................................................................20
(Significant subsequent event) .................................................................................................................................................20
2
1. Business Performance Overview
(1) Business Performance Overview for Current Term
In the current consolidated fiscal year, the Japanese economy gradually recovered overall due to an improvement in
corporate earnings and the employment environment, but there are also concerns, including the prolonged trade friction
between the U.S. and China and the Brexit problem. Therefore, there continues to be uncertainty over the future.
Amid this business environment, our corporate group has carried out sales activities, etc. actively based on our business
strategies in each segment. In addition, we made efforts to improve the added values of our services, by planning and
implementing various measures for boosting synergetic effects among Nursing Care, Karaoke, and Restaurant Businesses.
As for expenditures, we streamlined our business administration by reducing costs, to stabilize our business performance.
As a result, sales of the current consolidated fiscal year were 27,209,311 thousand yen (up 3.1% Year-on-Year (YoY)),
operating income was 1,025,942 thousand yen (down 13.9% YoY), and ordinary income was 1,326,222 thousand yen (down
1.9% YoY). An extraordinary income of 670,292 thousand yen was posted due to gain on sales of noncurrent assets
accompanying sale and leaseback transactions of four paid nursing homes with nursing care services. On the other hand, as a
result of examining future collectability of noncurrent assets in the Nursing Care Business, Karaoke Business, Restaurant
Business and Hotel Business, we decided to impair the book value up to the recoverable value and an impairment loss of
334,496 thousand yen was posted. As a result, profit attributable to owners of parent increased by 293,579 thousand yen to
1,102,209 thousand yen (up 36.3% YoY).
The results of each segment were as follows.
a. Nursing Care Business
For the Nursing Care Business segment, we aimed at aggressive expansion, and established five paid nursing homes with
nursing care services, one group home, one new business office for short-stays, and three new day-care facilities in a project
for supporting disabled children in commuting to facilities after school, etc. As a result of these efforts we now have 179
offices in 102 locations as of the end of the current consolidated fiscal year.
We further promoted industry-academia-government collaboration in the current consolidated fiscal year.
We strived to train in-house qualified oral care certified persons in cooperation with Kyushu Dental University. We now
have 754 such persons. Improving oral care promotes the prevention of diseases such as aspiration pneumonia.
We conducted nursing care staff behavior analysis verification tests using IoT technology in cooperation with Kyushu
Institute of Technology. We would also like to utilize AI to contribute to the reform in the work styles of personnel based on
the results of these experiments.
We are developing a resident information collection tool called a life map under the theme of making life worthwhile in
cooperation with Kyushu University. We are working to utilize that to further enrich lives after entering facilities.
In addition, at existing facilities, we aimed to stabilize occupancy ratio by promoting the cementing of cooperation with
nearby hospitals and home care support offices by visiting them. Consequently, the average occupancy ratio of existing
facilities in the current consolidated fiscal year was 95.7% (average in the previous term: 94.6%). As a result, sales were
17,894,145 thousand yen (up 10.9% YoY) and segment income was 1,238,951 thousand yen (up 5.3% YoY).
b. Karaoke Business
For the Karaoke Business segment, we strived to increase the unit price by enhancing our food menu and lunch menu. At
the same time, we looked to increase repeat customers by strengthening acquisition of SNS members and by distributing
coupons. However, although we opened two new stores, we also closed three stores in the current consolidated fiscal year.
Therefore, we have 91 stores at the end of the current consolidated fiscal year. That is one store less than the previous fiscal
year. As a result, sales were 7,302,477 thousand yen (down 4.3% YoY) and segment income was 880,618 thousand yen (down
2.6% YoY).
3
c. Restaurant Business
For the Restaurant Business segment, one existing store changed its business type and four stores were closed. Accordingly,
the number of stores at the end of the current consolidated fiscal year is 17 inside Japan, and 2 outside Japan. As for existing
restaurants, customers were decreasing, and so we strived to increase them with a limited offer, and made effort to increase
the average amount from one customer by incorporating an all-you-can-eat plan into our banquet course to acquire banquet
demand. However, due to decrease in customers associated with closing of restaurants, sales were 1,586,380 thousand yen
(down 9.7% YoY) and segment income was 51,848 thousand yen (up 274.7% YoY).
d. Real Estate Business
For the Real Estate Business segment, our corporate group’s core business activities are sales/purchase of real estate
properties for sale and intermediary work for rental properties. Revenue from the disposal of real estate for sale was around
420,000 thousand yen in the previous fiscal year. However, this was around 15,000 thousand yen in this fiscal year, so sales
were 197,478 thousand yen (down 68.3% YoY) and segment income was 20,046 thousand yen (down 85.7% YoY).
e. Other businesses
In the other businesses segment, the Company made efforts to increase guests, secure bookings for parties, promote day
trips for bathing, etc. in the Hotel Business. As a result, sales were 228,830 thousand yen (down 10.1% YoY) and segment
loss was 53,660 thousand yen (segment loss was 32,250 thousand yen during the same term last year).
(2) Financial Standing Overview for Current Term
Total assets at the end of the current consolidated fiscal year were 30,072,034 thousand yen, up 85,726 thousand yen
from the end of the previous consolidated fiscal year.
Current assets were 15,549,530 thousand yen, up 2,340,620 thousand yen from the end of the previous consolidated fiscal
year. The major factors for the change were the increase of 2,266,055 thousand yen in real estate for sale and 170,756
thousand yen in notes and accounts receivable-trade, and the decrease of 155,357 thousand yen in cash and deposits.
Noncurrent assets were 14,522,504 thousand yen, down 2,254,893 thousand yen from the end of the previous
consolidated fiscal year. The major factors for the change were the decrease of 1,797,278 thousand yen in buildings and
structures, 613,355 thousand yen in land, and 290,302 thousand yen in other (property, plant and equipment) and the
increase of 457,116 thousand yen in investment securities.
Liabilities at the end of the current consolidated fiscal year were 13,842,135 thousand yen, down 747,154 thousand yen
from the end of the previous consolidated fiscal year.
Current liabilities were 6,756,849 thousand yen, up 286,591 thousand yen from the end of the previous consolidated
fiscal year. The major factors for the change were the increase of 372,945 thousand yen in current portion of long-term
loans payable, 175,219 thousand yen in income taxes payable and 105,076 thousand yen in other (current liabilities), and
the decrease of 394,004 thousand yen in short-term loans payable.
Noncurrent liabilities were 7,085,286 thousand yen, down 1,033,746 thousand yen from the end of the previous
consolidated fiscal year. The major factors for the change were the decrease of 937,166 thousand yen in long-term loans
payable, 209,799 thousand yen in other (noncurrent liabilities) and 117,992 thousand yen in deferred tax liabilities, and the
increase of 240,000 thousand yen in bonds payable.
Net assets at the end of the current consolidated fiscal year were 16,229,899 thousand yen, up 832,881 thousand yen
from the end of the previous consolidated fiscal year. The major factor for the change was the increase of 908,899 thousand
yen in retained earnings as a result of recording profit attributable to owners of parent and payment of dividends of surplus.
4
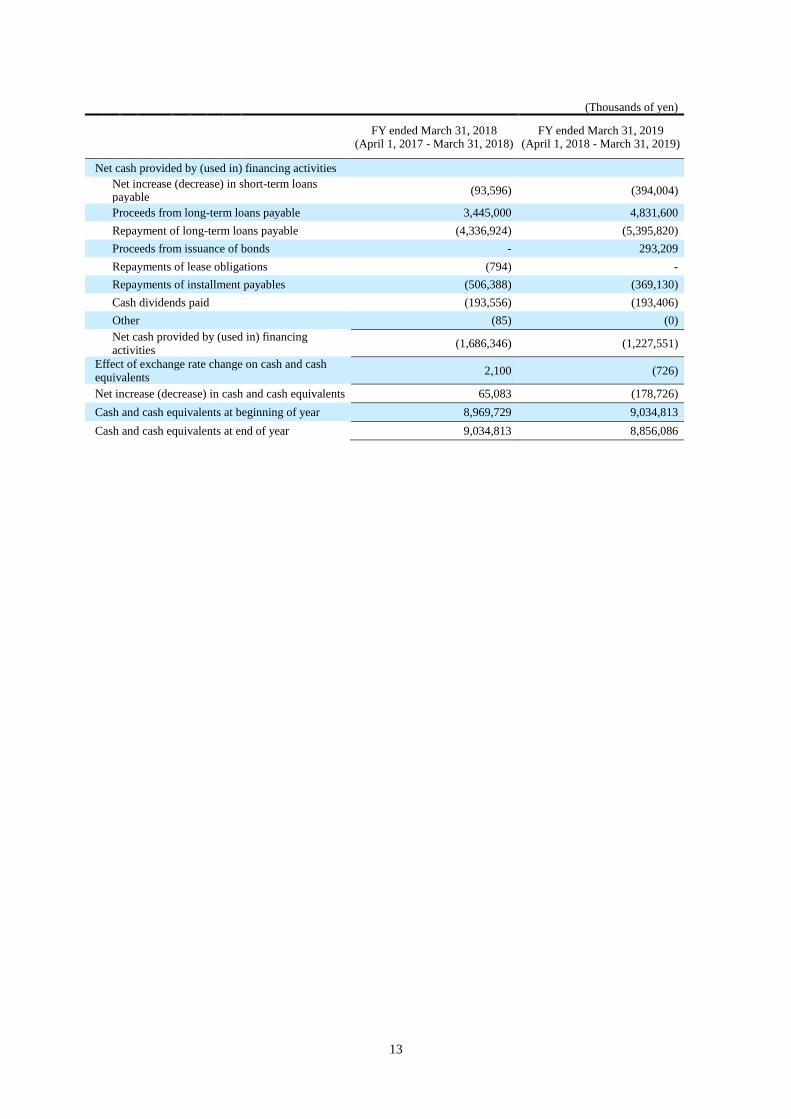
(3) Cash Flow Overview for Current Term
Cash and cash equivalents (hereinafter referred to as “funds”) at the end of the current consolidated fiscal year stood at
8,856,086 thousand yen, down 178,726 thousand yen from the end of the previous consolidated fiscal year.
The status of each cash flow is as follows:
(Cash flow from operating activities)
Funds used in operating activities were 317,132 thousand yen (funds obtained in the previous year were 2,070,559
thousand yen). The major breakdown of income was 1,573,106 thousand yen of income before income taxes, 939,934
thousand yen of depreciation and amortization, and 334,496 thousand yen of impairment loss. The major breakdown of
expenditure was 2,252,114 thousand yen of increase in inventories, 460,221 thousand yen of gain on sales of noncurrent
assets, and 495,815 thousand yen of income taxes paid.
(Cash flow from investing activities)
Funds obtained by investing activities were 1,366,683 thousand yen (funds used in the previous year were 321,230
thousand yen). The major breakdown of income was 3,583,111 thousand yen of proceeds from sales of property, plant and
equipment, and 400,426 thousand yen of proceeds from withdrawal of time deposits. The major breakdown of expenditure
was 1,515,878 thousand yen of purchase of property, plant and equipment, 567,015 thousand yen of purchase of investment
securities and 425,397 thousand yen of payments into time deposits.
(Cash flow from financing activities)
Funds used in financing activities were 1,227,551 thousand yen (funds used in the previous year were 1,686,346 thousand
yen). The major breakdown of income was 4,831,600 thousand yen of proceeds from long-term loans payable and 293,209
thousand yen of proceeds from issuance of bonds. The major breakdown of expenditure was 5,395,820 thousand yen of
repayment of long-term loans payable, 394,004 thousand yen of decrease in short-term loans payable, and 369,130 thousand
yen of repayments of installment payables.
(Reference) Trend of Cash Flow Related Indicators
FY ended
March 2015
FY ended
March 2016
FY ended
March 2017
FY ended
March 2018
FY ended
March 2019
Equity ratio (%) 47.0 49.4 48.7 51.3 54.0
Equity ratio on market price
basis (%) 36.7 33.1 28.2 38.3 29.6
Debt repayment period (years) 6.9 13.3 6.5 5.1 -
Interest coverage ratio (times) 14.2 7.4 21.2 30.2 -
Equity ratio: equity capital/total assets
Equity ratio on market price basis: total market value of stock/total assets
Debt repayment period: interest-bearing debt/operating cash flow
Interest coverage ratio: operating cash flow/interest payments
(Notes)
1. All are calculated using financial figures on consolidated base.
2. Cash flow is using cash flow from operating activities.
3. Total market value of stock is calculated as end-of-the-term share value multiplied by the number of outstanding
shares at end of term (after excluding treasury stocks).
4. Interest-bearing debt includes all debts that are included in the consolidated balance sheet, for which interests are
paid.
5. Our operating cash flow for the fiscal year ended March 31, 2019 was negative. Therefore, we have not calculated
debt repayment period and interest coverage ratio.
5
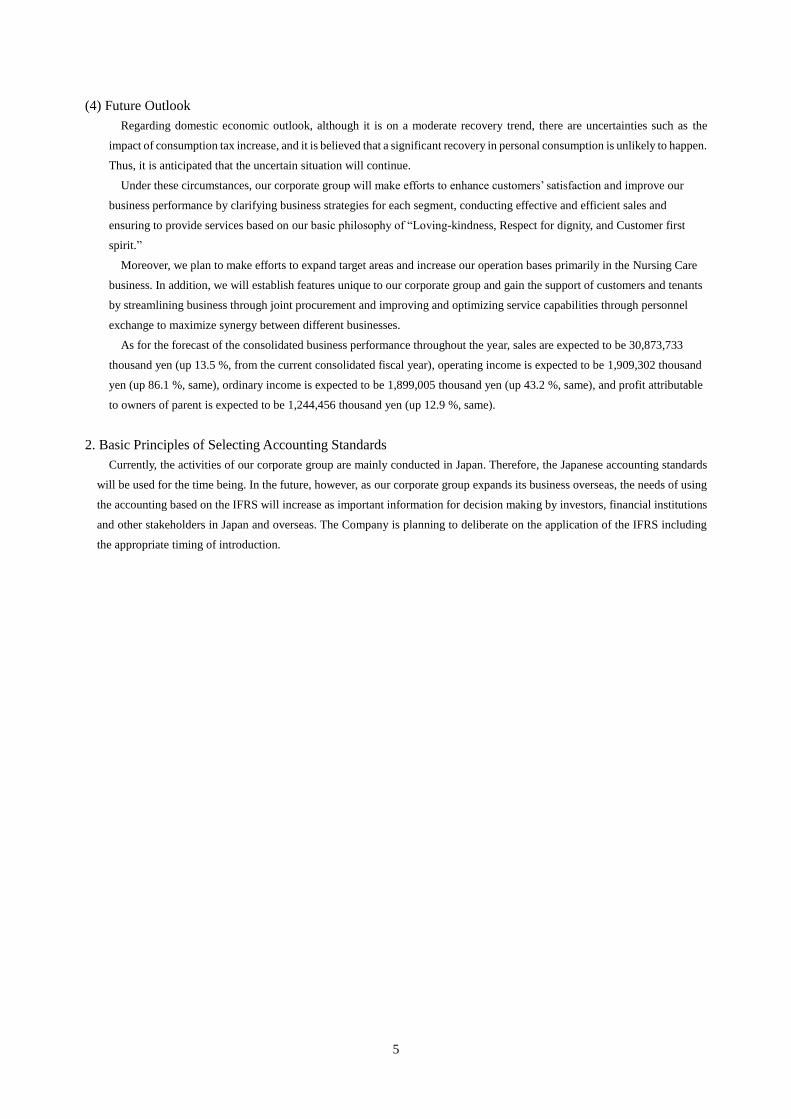
(4) Future Outlook
Regarding domestic economic outlook, although it is on a moderate recovery trend, there are uncertainties such as the
impact of consumption tax increase, and it is believed that a significant recovery in personal consumption is unlikely to happen.
Thus, it is anticipated that the uncertain situation will continue.
Under these circumstances, our corporate group will make efforts to enhance customers’ satisfaction and improve our
business performance by clarifying business strategies for each segment, conducting effective and efficient sales and
ensuring to provide services based on our basic philosophy of “Loving-kindness, Respect for dignity, and Customer first
spirit.”
Moreover, we plan to make efforts to expand target areas and increase our operation bases primarily in the Nursing Care
business. In addition, we will establish features unique to our corporate group and gain the support of customers and tenants
by streamlining business through joint procurement and improving and optimizing service capabilities through personnel
exchange to maximize synergy between different businesses.
As for the forecast of the consolidated business performance throughout the year, sales are expected to be 30,873,733
thousand yen (up 13.5 %, from the current consolidated fiscal year), operating income is expected to be 1,909,302 thousand
yen (up 86.1 %, same), ordinary income is expected to be 1,899,005 thousand yen (up 43.2 %, same), and profit attributable
to owners of parent is expected to be 1,244,456 thousand yen (up 12.9 %, same).
2. Basic Principles of Selecting Accounting Standards
Currently, the activities of our corporate group are mainly conducted in Japan. Therefore, the Japanese accounting standards
will be used for the time being. In the future, however, as our corporate group expands its business overseas, the needs of using
the accounting based on the IFRS will increase as important information for decision making by investors, financial institutions
and other stakeholders in Japan and overseas. The Company is planning to deliberate on the application of the IFRS including
the appropriate timing of introduction.
6
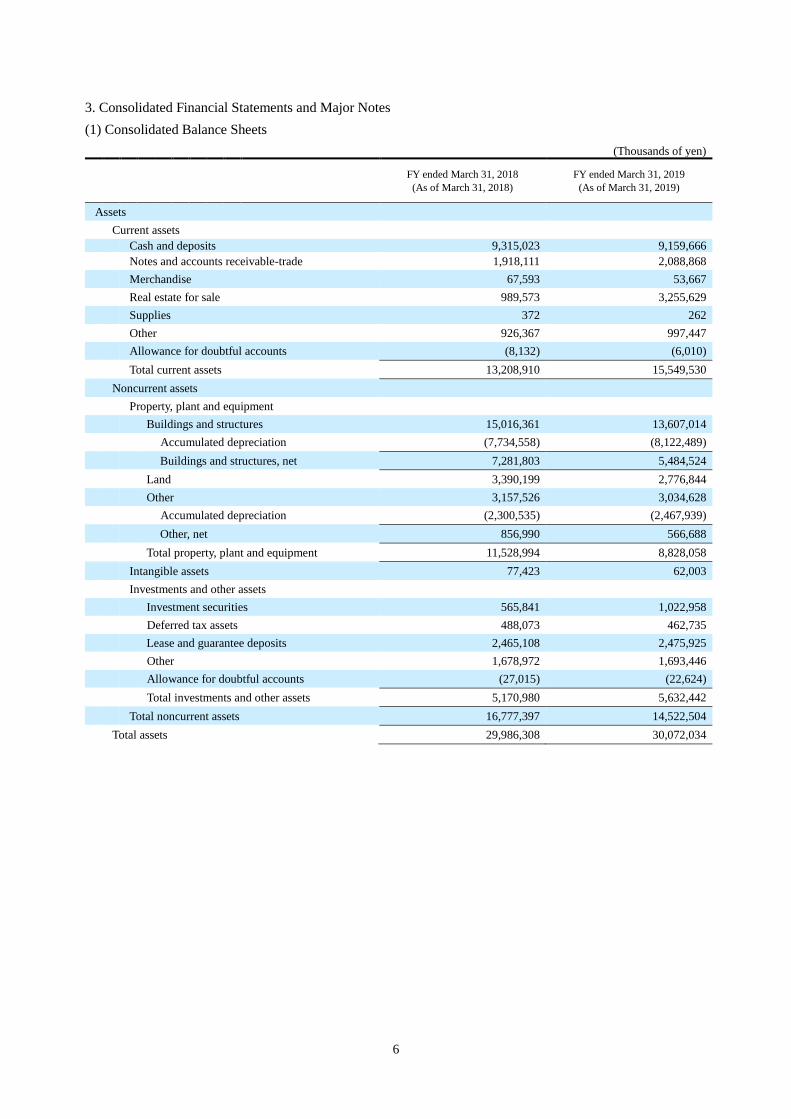
3. Consolidated Financial Statements and Major Notes
(1) Consolidated Balance Sheets
(Thousands of yen)
FY ended March 31, 2018
(As of March 31, 2018)
FY ended March 31, 2019
(As of March 31, 2019)
Assets
Current assets
Cash and deposits 9,315,023 9,159,666
Notes and accounts receivable-trade 1,918,111 2,088,868
Merchandise 67,593 53,667
Real estate for sale 989,573 3,255,629
Supplies 372 262
Other 926,367 997,447
Allowance for doubtful accounts (8,132) (6,010)
Total current assets 13,208,910 15,549,530
Noncurrent assets
Property, plant and equipment
Buildings and structures 15,016,361 13,607,014
Accumulated depreciation (7,734,558) (8,122,489)
Buildings and structures, net 7,281,803 5,484,524
Land 3,390,199 2,776,844
Other 3,157,526 3,034,628
Accumulated depreciation (2,300,535) (2,467,939)
Other, net 856,990 566,688
Total property, plant and equipment 11,528,994 8,828,058
Intangible assets 77,423 62,003
Investments and other assets
Investment securities 565,841 1,022,958
Deferred tax assets 488,073 462,735
Lease and guarantee deposits 2,465,108 2,475,925
Other 1,678,972 1,693,446
Allowance for doubtful accounts (27,015) (22,624)
Total investments and other assets 5,170,980 5,632,442
Total noncurrent assets 16,777,397 14,522,504
Total assets 29,986,308 30,072,034
7
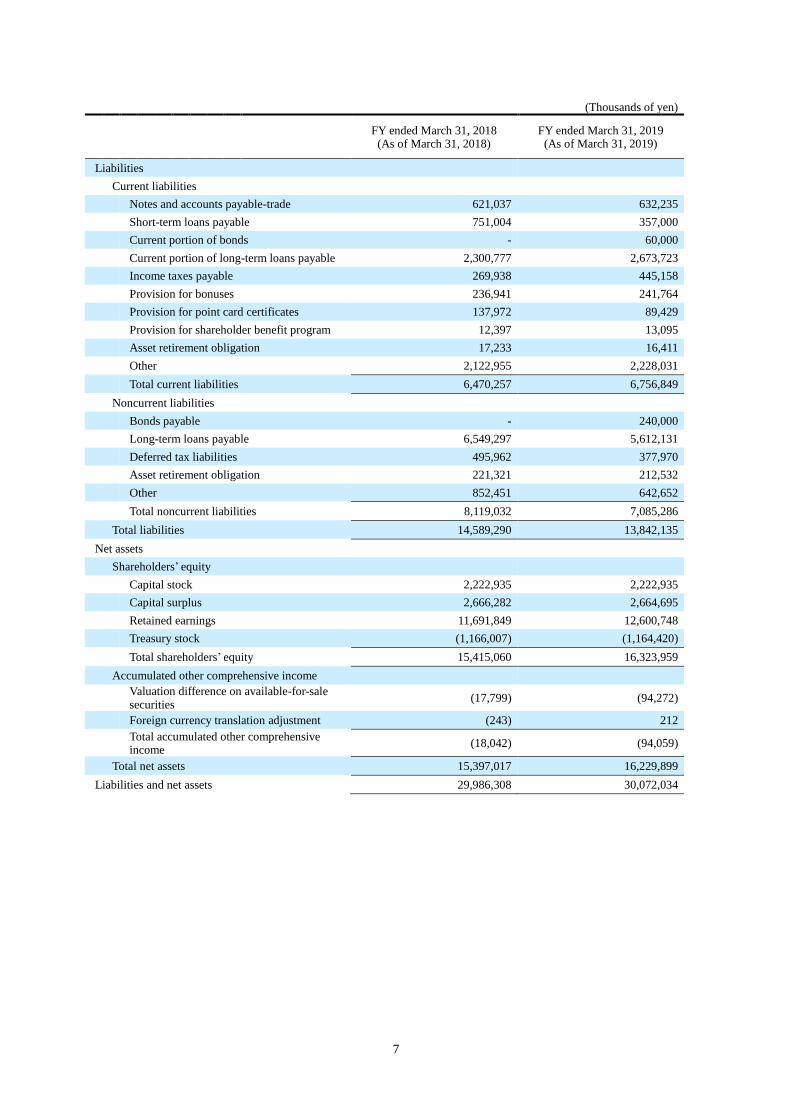
(Thousands of yen)
FY ended March 31, 2018
(As of March 31, 2018) FY ended March 31, 2019
(As of March 31, 2019)
Liabilities
Current liabilities
Notes and accounts payable-trade 621,037 632,235
Short-term loans payable 751,004 357,000
Current portion of bonds - 60,000
Current portion of long-term loans payable 2,300,777 2,673,723
Income taxes payable 269,938 445,158
Provision for bonuses 236,941 241,764
Provision for point card certificates 137,972 89,429
Provision for shareholder benefit program 12,397 13,095
Asset retirement obligation 17,233 16,411
Other 2,122,955 2,228,031
Total current liabilities 6,470,257 6,756,849
Noncurrent liabilities
Bonds payable - 240,000
Long-term loans payable 6,549,297 5,612,131
Deferred tax liabilities 495,962 377,970
Asset retirement obligation 221,321 212,532
Other 852,451 642,652
Total noncurrent liabilities 8,119,032 7,085,286
Total liabilities 14,589,290 13,842,135
Net assets
Shareholders’ equity
Capital stock 2,222,935 2,222,935
Capital surplus 2,666,282 2,664,695
Retained earnings 11,691,849 12,600,748
Treasury stock (1,166,007) (1,164,420)
Total shareholders’ equity 15,415,060 16,323,959
Accumulated other comprehensive income
Valuation difference on available-for-sale securities
(17,799) (94,272)
Foreign currency translation adjustment (243) 212
Total accumulated other comprehensive income
(18,042) (94,059)
Total net assets 15,397,017 16,229,899
Liabilities and net assets 29,986,308 30,072,034
8
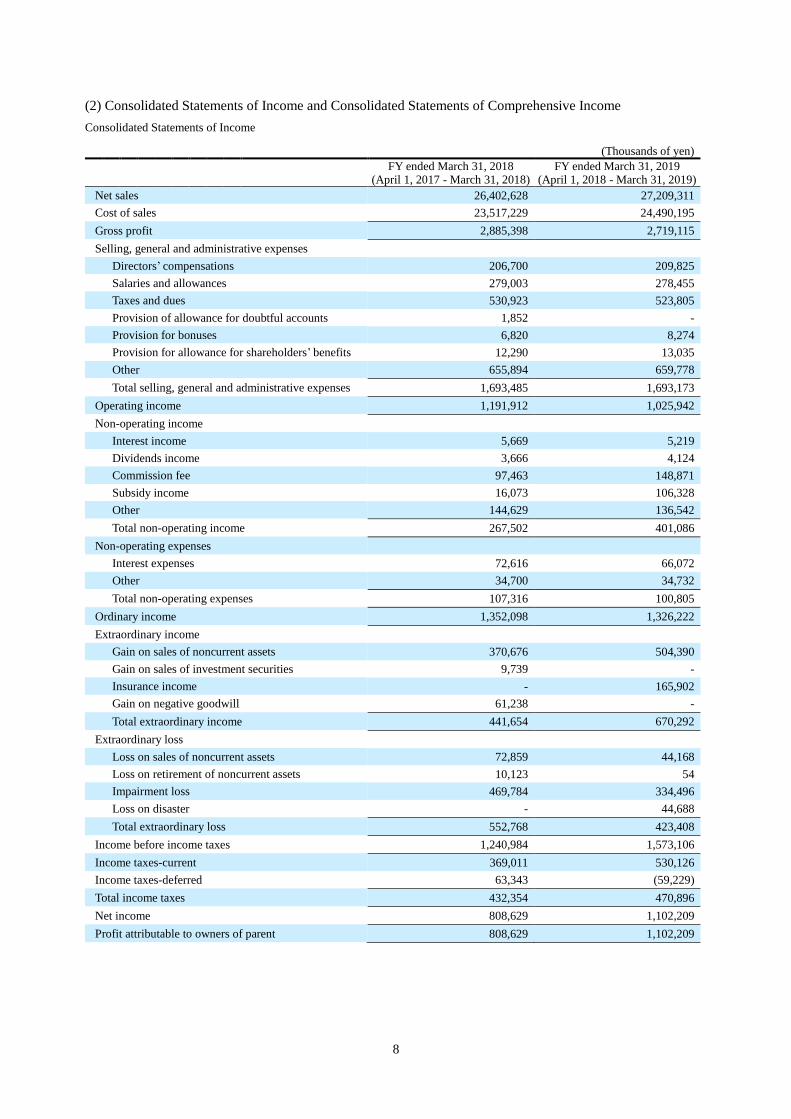
(2) Consolidated Statements of Income and Consolidated Statements of Comprehensive Income
Consolidated Statements of Income
(Thousands of yen)
FY ended March 31, 2018 (April 1, 2017 - March 31, 2018)
FY ended March 31, 2019 (April 1, 2018 - March 31, 2019)
Net sales 26,402,628 27,209,311
Cost of sales 23,517,229 24,490,195
Gross profit 2,885,398 2,719,115
Selling, general and administrative expenses
Directors’ compensations 206,700 209,825
Salaries and allowances 279,003 278,455
Taxes and dues 530,923 523,805
Provision of allowance for doubtful accounts 1,852 -
Provision for bonuses 6,820 8,274
Provision for allowance for shareholders’ benefits 12,290 13,035
Other 655,894 659,778
Total selling, general and administrative expenses 1,693,485 1,693,173
Operating income 1,191,912 1,025,942
Non-operating income
Interest income 5,669 5,219
Dividends income 3,666 4,124
Commission fee 97,463 148,871
Subsidy income 16,073 106,328
Other 144,629 136,542
Total non-operating income 267,502 401,086
Non-operating expenses
Interest expenses 72,616 66,072
Other 34,700 34,732
Total non-operating expenses 107,316 100,805
Ordinary income 1,352,098 1,326,222
Extraordinary income
Gain on sales of noncurrent assets 370,676 504,390
Gain on sales of investment securities 9,739 -
Insurance income - 165,902
Gain on negative goodwill 61,238 -
Total extraordinary income 441,654 670,292
Extraordinary loss
Loss on sales of noncurrent assets 72,859 44,168
Loss on retirement of noncurrent assets 10,123 54
Impairment loss 469,784 334,496
Loss on disaster - 44,688
Total extraordinary loss 552,768 423,408
Income before income taxes 1,240,984 1,573,106
Income taxes-current 369,011 530,126
Income taxes-deferred 63,343 (59,229)
Total income taxes 432,354 470,896
Net income 808,629 1,102,209
Profit attributable to owners of parent 808,629 1,102,209
9
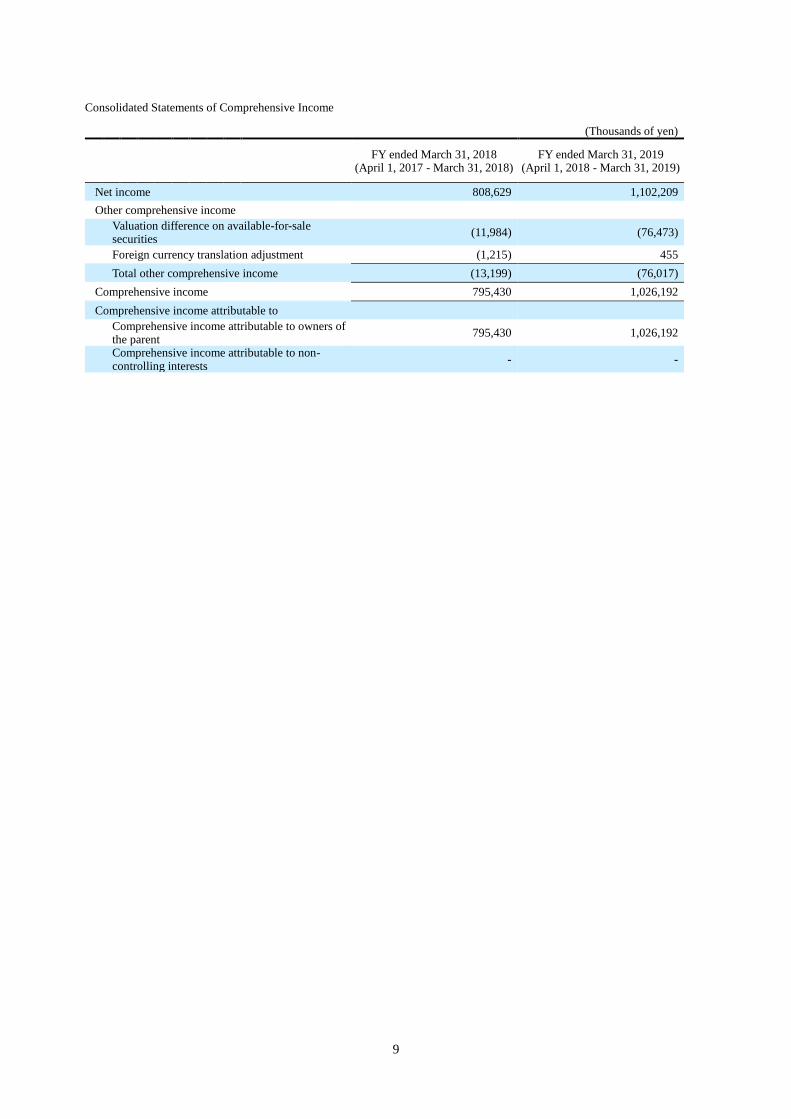
Consolidated Statements of Comprehensive Income
(Thousands of yen)
FY ended March 31, 2018
(April 1, 2017 - March 31, 2018) FY ended March 31, 2019
(April 1, 2018 - March 31, 2019)
Net income 808,629 1,102,209
Other comprehensive income
Valuation difference on available-for-sale securities
(11,984) (76,473)
Foreign currency translation adjustment (1,215) 455
Total other comprehensive income (13,199) (76,017)
Comprehensive income 795,430 1,026,192
Comprehensive income attributable to
Comprehensive income attributable to owners of the parent
795,430 1,026,192
Comprehensive income attributable to non-controlling interests
- -
10
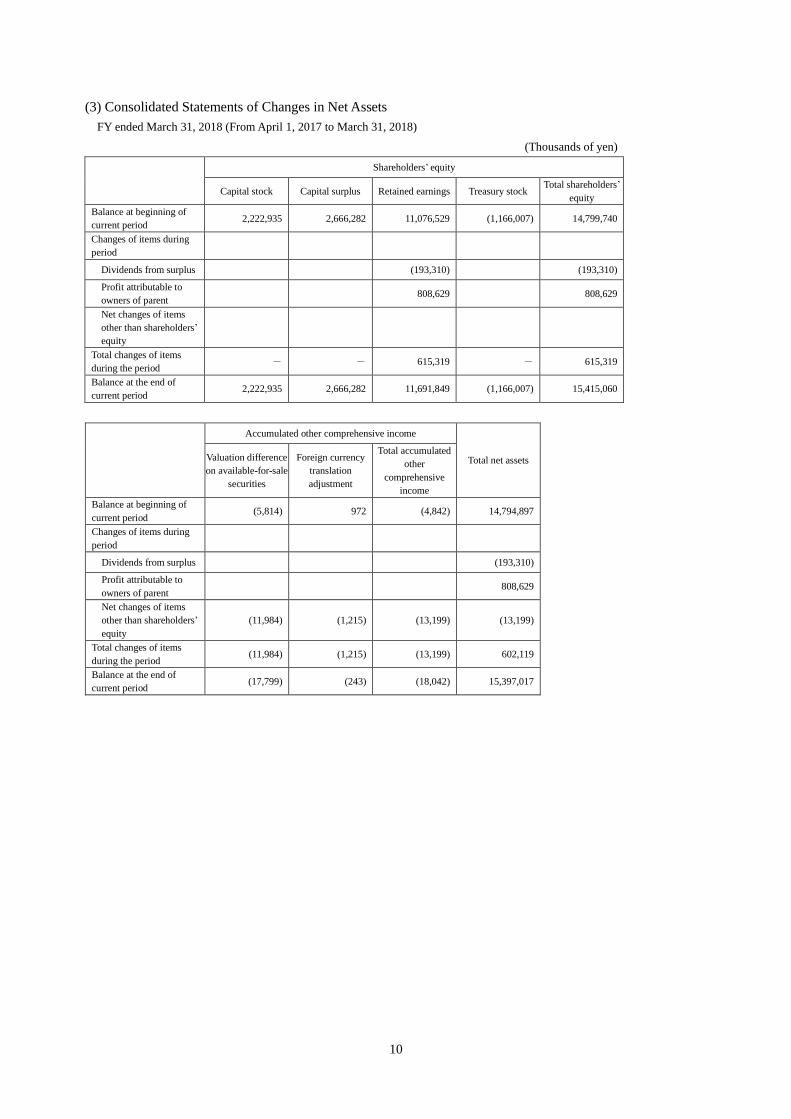
(3) Consolidated Statements of Changes in Net Assets
FY ended March 31, 2018 (From April 1, 2017 to March 31, 2018)
(Thousands of yen)
Shareholders’ equity
Capital stock Capital surplus Retained earnings Treasury stock Total shareholders’
equity
Balance at beginning of
current period 2,222,935 2,666,282 11,076,529 (1,166,007) 14,799,740
Changes of items during
period
Dividends from surplus (193,310) (193,310)
Profit attributable to
owners of parent 808,629 808,629
Net changes of items
other than shareholders’
equity
Total changes of items
during the period - - 615,319 - 615,319
Balance at the end of
current period 2,222,935 2,666,282 11,691,849 (1,166,007) 15,415,060
Accumulated other comprehensive income
Total net assets Valuation difference
on available-for-sale
securities
Foreign currency
translation
adjustment
Total accumulated
other
comprehensive
income
Balance at beginning of
current period (5,814) 972 (4,842) 14,794,897
Changes of items during
period
Dividends from surplus (193,310)
Profit attributable to
owners of parent 808,629
Net changes of items
other than shareholders’
equity
(11,984) (1,215) (13,199) (13,199)
Total changes of items
during the period (11,984) (1,215) (13,199) 602,119
Balance at the end of
current period (17,799) (243) (18,042) 15,397,017
11
FY ended March 31, 2019 (From April 1, 2018 to March 31, 2019)
(Thousands of yen)
Shareholders’ equity
Capital stock Capital surplus Retained earnings Treasury stock Total shareholders’
equity
Balance at beginning of
current period 2,222,935 2,666,282 11,691,849 (1,166,007) 15,415,060
Changes of items during
period
Dividends from surplus (193,310) (193,310)
Profit attributable to
owners of parent 1,102,209 1,102,209
Purchase of treasury
stock (0) (0)
Purchase of treasury
stock by J-ESOP (35,137) (35,137)
Disposal of treasury
stock for J-ESOP (1,587) 36,724 35,137
Net changes of items
other than shareholders’
equity
Total changes of items
during the period - (1,587) 908,899 1,586 908,898
Balance at the end of
current period 2,222,935 2,664,695 12,600,748 (1,164,420) 16,323,959
Accumulated other comprehensive income
Total net assets Valuation difference
on available-for-sale
securities
Foreign currency
translation
adjustment
Total accumulated
other
comprehensive
income
Balance at beginning of
current period (17,799) (243) (18,042) 15,397,017
Changes of items during
period
Dividends from surplus (193,310)
Profit attributable to
owners of the parent 1,102,209
Purchase of treasury
stock (0)
Purchase of treasury
stock by J-ESOP (35,137)
Disposal of treasury
stock for J-ESOP 35,137
Net changes of items
other than shareholders’
equity
(76,473) 455 (76,017) (76,017)
Total changes of items
during the period (76,473) 455 (76,017) 832,881
Balance at the end of
current period (94,272) 212 (94,059) 16,229,899
12
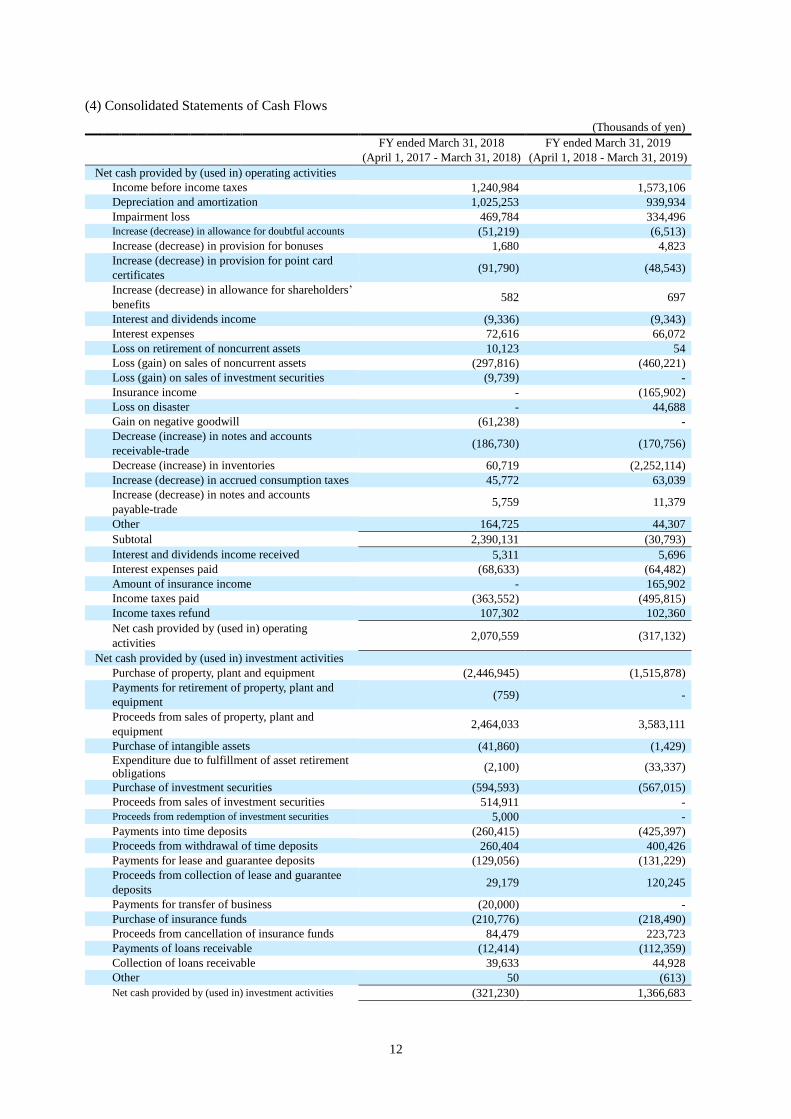
(4) Consolidated Statements of Cash Flows
(Thousands of yen)
FY ended March 31, 2018
(April 1, 2017 - March 31, 2018)
FY ended March 31, 2019
(April 1, 2018 - March 31, 2019)
Net cash provided by (used in) operating activities
Income before income taxes 1,240,984 1,573,106
Depreciation and amortization 1,025,253 939,934
Impairment loss 469,784 334,496
Increase (decrease) in allowance for doubtful accounts (51,219) (6,513)
Increase (decrease) in provision for bonuses 1,680 4,823
Increase (decrease) in provision for point card
certificates (91,790) (48,543)
Increase (decrease) in allowance for shareholders’
benefits 582 697
Interest and dividends income (9,336) (9,343)
Interest expenses 72,616 66,072
Loss on retirement of noncurrent assets 10,123 54
Loss (gain) on sales of noncurrent assets (297,816) (460,221)
Loss (gain) on sales of investment securities (9,739) -
Insurance income - (165,902)
Loss on disaster - 44,688
Gain on negative goodwill (61,238) -
Decrease (increase) in notes and accounts
receivable-trade (186,730) (170,756)
Decrease (increase) in inventories 60,719 (2,252,114)
Increase (decrease) in accrued consumption taxes 45,772 63,039
Increase (decrease) in notes and accounts
payable-trade 5,759 11,379
Other 164,725 44,307
Subtotal 2,390,131 (30,793)
Interest and dividends income received 5,311 5,696
Interest expenses paid (68,633) (64,482)
Amount of insurance income - 165,902
Income taxes paid (363,552) (495,815)
Income taxes refund 107,302 102,360
Net cash provided by (used in) operating
activities 2,070,559 (317,132)
Net cash provided by (used in) investment activities
Purchase of property, plant and equipment (2,446,945) (1,515,878)
Payments for retirement of property, plant and
equipment (759) -
Proceeds from sales of property, plant and
equipment 2,464,033 3,583,111
Purchase of intangible assets (41,860) (1,429)
Expenditure due to fulfillment of asset retirement obligations
(2,100) (33,337)
Purchase of investment securities (594,593) (567,015)
Proceeds from sales of investment securities 514,911 -
Proceeds from redemption of investment securities 5,000 -
Payments into time deposits (260,415) (425,397)
Proceeds from withdrawal of time deposits 260,404 400,426
Payments for lease and guarantee deposits (129,056) (131,229)
Proceeds from collection of lease and guarantee
deposits 29,179 120,245
Payments for transfer of business (20,000) -
Purchase of insurance funds (210,776) (218,490)
Proceeds from cancellation of insurance funds 84,479 223,723
Payments of loans receivable (12,414) (112,359)
Collection of loans receivable 39,633 44,928
Other 50 (613)
Net cash provided by (used in) investment activities (321,230) 1,366,683
13
(Thousands of yen)
FY ended March 31, 2018
(April 1, 2017 - March 31, 2018) FY ended March 31, 2019
(April 1, 2018 - March 31, 2019)
Net cash provided by (used in) financing activities
Net increase (decrease) in short-term loans payable
(93,596) (394,004)
Proceeds from long-term loans payable 3,445,000 4,831,600
Repayment of long-term loans payable (4,336,924) (5,395,820)
Proceeds from issuance of bonds - 293,209
Repayments of lease obligations (794) -
Repayments of installment payables (506,388) (369,130)
Cash dividends paid (193,556) (193,406)
Other (85) (0)
Net cash provided by (used in) financing activities
(1,686,346) (1,227,551)
Effect of exchange rate change on cash and cash equivalents
2,100 (726)
Net increase (decrease) in cash and cash equivalents 65,083 (178,726)
Cash and cash equivalents at beginning of year 8,969,729 9,034,813
Cash and cash equivalents at end of year 9,034,813 8,856,086
14
(5) Notes to Consolidated Financial Statements
(Notes regarding premise of a going concern)
Nothing is applicable.
(Change in presentation method)
(Related to consolidated balance sheet)
“Construction in progress” which was listed separately under “Property, plant and equipment” in the previous consolidated
fiscal year is included in “Other” from the current consolidated fiscal year, because it became less important in terms of
monetary value. In order to reflect this change, we have reclassified consolidated financial statements for the previous
consolidated fiscal year.
As a result, 238,450 thousand yen in “Construction in progress” under “Property, plant and equipment” and 2,919,076
thousand yen in “Other” in the consolidated balance sheet of the previous consolidated fiscal year was reclassified as 3,157,526
thousand yen in “Other.”
(Related to consolidated statements of income)
1. “Insurance income” which was listed separately under “Non-operating income” in the previous consolidated fiscal year
is included in “Other” from the current consolidated fiscal year, because it became less than 10% of the total amount of
non-operating income. In order to reflect this change, we have reclassified consolidated financial statements for the
previous consolidated fiscal year.
As a result, 74,575 thousand yen in “Insurance income” and 70,053 thousand yen in “Other” under “Non-operating
income” in the consolidated statements of income of the previous consolidated fiscal year was reclassified as 144,629
thousand yen in “Other.”
2. “Rent expenses” which was listed separately under “Non-operating expenses” in the previous consolidated fiscal year is
included in “Other” from the current consolidated fiscal year, because it became less than 10% of the total amount of
non-operating expenses. In order to reflect this change, we have reclassified consolidated financial statements for the
previous consolidated fiscal year.
As a result, 18,801 thousand yen in “Rent expenses” and 15,899 thousand yen in “Other” under “Non-operating
expenses” in the consolidated statements of income of the previous consolidated fiscal year was reclassified as 34,700
thousand yen in “Other.”
(Related to consolidated statements of cash flows)
“Expenditure due to fulfillment of asset retirement obligations” which was listed under “Other” in “Net cash provided by
(used in) investment activities” in the previous consolidated fiscal year increased in importance. Therefore, we have
decided to give this separately from the current consolidated fiscal year. In order to reflect this change, we have
reclassified consolidated financial statements for the previous consolidated fiscal year.
As a result, -2,050 thousand yen in “Other” under “Net cash provided by (used in) investment activities” in the consolidated
statements of cash flows of the previous consolidated fiscal year has been reclassified into -2,100 thousand yen in “Expenditure
due to fulfillment of asset retirement obligations” and 50 thousand yen for “Other.”
(Changes accompanying the application of the partial revision to the “Accounting Standards for Tax Effect Accounting”)
The partial revision to the “Accounting Standards for Tax Effect Accounting” (Corporate Accounting Standards No. 28 of
February 16, 2018; hereinafter “Partial Revision of the Tax Effect Accounting Standards”) will apply from the beginning of
the current consolidated fiscal year. Accordingly, we have changed to a method in which “Deferred tax assets” is given in the
“Investments and other assets” category while “Deferred tax liabilities” is given in the “Noncurrent liabilities” category.
As a result, “Deferred tax assets” in “Current assets” decreased by 184,469 thousand yen while “Deferred tax assets” in
“Investments and other assets” increased by 77,601 thousand yen in the consolidated balance sheet for the previous
consolidated fiscal year. In addition, “Deferred tax liabilities” in “Noncurrent liabilities” decreased by 106,867 thousand yen.
The deferred tax assets and deferred tax liabilities of the same tax paying entity are offset and indicated. This means that
total assets decreased by 106,867 thousand yen after the change.
15
(Additional information)
(Transactions to provide our own shares to employees through a trust)
We introduced a stock benefit trust (J-ESOP) system (hereinafter “this system”) incentive plan to offer our own shares to
employees (including the employees of our subsidiaries; hereinafter the same) at a Board of Directors’ meeting held on August
10, 2018. This aims to further enhance the interrelation between our stock price and performance and the treatment of our
employees while improving their motivation to improve our performance.
(1) Overview of transactions
This system is a mechanism to offer our own shares to employees who satisfy certain requirements based on the stock benefit
regulations we have established in advance. We have acquired the shares to be offered to our employees, including those for the
future, through a trust (hereinafter “the trust”) we established in advance. We are managing these shares separately as trust
assets.
(2) Our own shares remaining in the trust
We have recorded our own shares remaining in the trust as treasury stock under net assets according to their book value
(excluding the amount of incidental expenses) in the trust. The applicable treasury stock book value is 35,137 thousand yen and
the number of shares is 72,150 as of the end of the current consolidated fiscal year.(Segment information, etc.)
(Segment information)
1. Overview of the reporting segments
(1) How to determine the reporting segments
The reporting segments of our corporate group are the constituent units of business for which segregated financial
information is available and that are the subject of regular examination by the Board of Directors to decide management
resources and assess business performance.
Our corporate group has business departments for each service at head office, and each business department develops
comprehensive strategies for the services, etc. that they handle. Therefore, the Company is consisted of segments per
service based on each business department. There are 4 reporting segments including “Nursing Care Business,” “Karaoke
Business,” “Restaurant Business” and “Real Estate Business.”
(2) Types of products and services that belong to each reporting segment
The “Nursing Care Business” operates fee-based nursing homes for elderly, day-service centers, group homes and care
planning centers. It also conducts sales and lease of social-welfare tools and provides day-services such as afterschool
assistance for children with disabilities. The “Karaoke Business” operates karaoke stores, and the “Restaurant Business”
operates izakaya. The “Real Estate Business” undertakes sale and purchase of real estate for sale and lease, management
and brokerage of buildings, residences, and other properties.
2. Method to calculate the amount of sales, profits, loss, assets and other items per reporting segment
The accounting of reporting business segments is handled in the almost same way as the accounting method used in creating
consolidated financial statements.
The profit in the reporting segment is based on the figures of operating income.
Internal profit and transferred amount among the segments are based on the prevailing market values.
The partial revision to the “Accounting Standards for Tax Effect Accounting” (Corporate Accounting Standards No. 28 of
February 16, 2018) will apply from the beginning of the current consolidated fiscal year. Therefore, the figures for the previous
consolidated fiscal year are those after this standard has been applied retroactively.
16
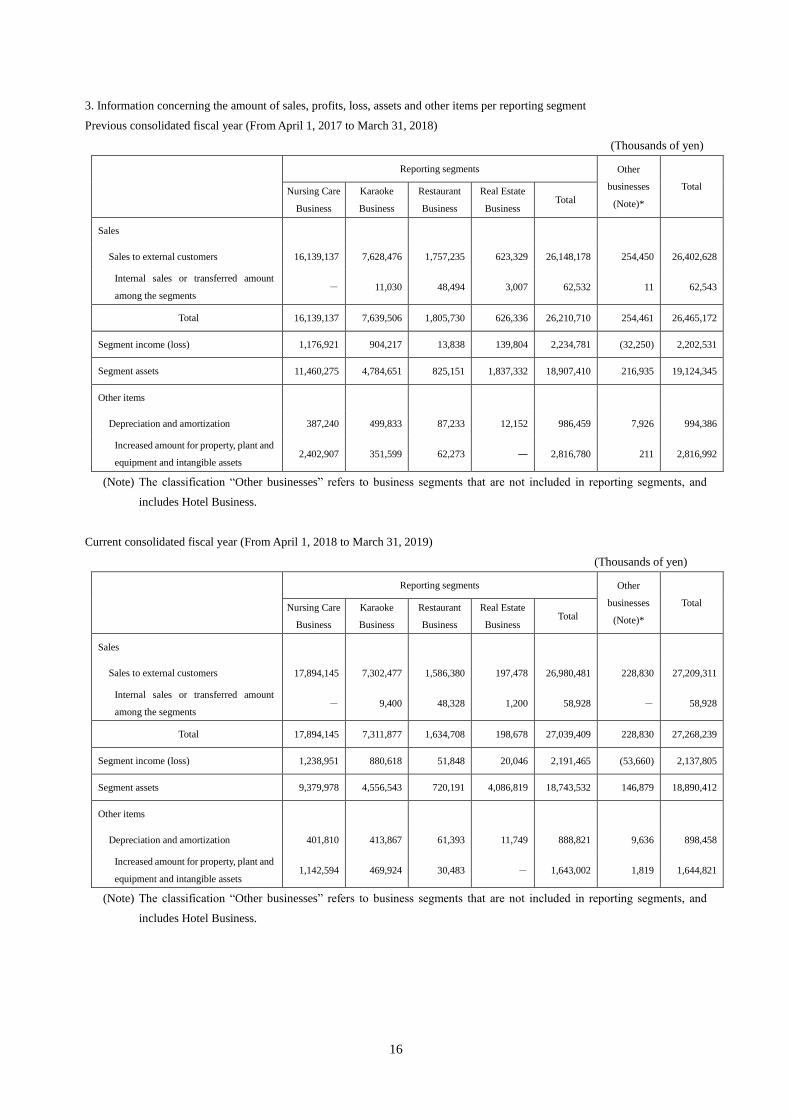
3. Information concerning the amount of sales, profits, loss, assets and other items per reporting segment
Previous consolidated fiscal year (From April 1, 2017 to March 31, 2018)
(Thousands of yen)
Reporting segments Other
businesses
(Note)*
Total Nursing Care
Business
Karaoke
Business
Restaurant
Business
Real Estate
Business Total
Sales
Sales to external customers 16,139,137 7,628,476 1,757,235 623,329 26,148,178 254,450 26,402,628
Internal sales or transferred amount
among the segments - 11,030 48,494 3,007 62,532 11 62,543
Total 16,139,137 7,639,506 1,805,730 626,336 26,210,710 254,461 26,465,172
Segment income (loss) 1,176,921 904,217 13,838 139,804 2,234,781 (32,250) 2,202,531
Segment assets 11,460,275 4,784,651 825,151 1,837,332 18,907,410 216,935 19,124,345
Other items
Depreciation and amortization 387,240 499,833 87,233 12,152 986,459 7,926 994,386
Increased amount for property, plant and
equipment and intangible assets 2,402,907 351,599 62,273 ― 2,816,780 211 2,816,992
(Note) The classification “Other businesses” refers to business segments that are not included in reporting segments, and
includes Hotel Business.
Current consolidated fiscal year (From April 1, 2018 to March 31, 2019)
(Thousands of yen)
Reporting segments Other
businesses
(Note)*
Total Nursing Care
Business
Karaoke
Business
Restaurant
Business
Real Estate
Business Total
Sales
Sales to external customers 17,894,145 7,302,477 1,586,380 197,478 26,980,481 228,830 27,209,311
Internal sales or transferred amount
among the segments - 9,400 48,328 1,200 58,928 - 58,928
Total 17,894,145 7,311,877 1,634,708 198,678 27,039,409 228,830 27,268,239
Segment income (loss) 1,238,951 880,618 51,848 20,046 2,191,465 (53,660) 2,137,805
Segment assets 9,379,978 4,556,543 720,191 4,086,819 18,743,532 146,879 18,890,412
Other items
Depreciation and amortization 401,810 413,867 61,393 11,749 888,821 9,636 898,458
Increased amount for property, plant and
equipment and intangible assets 1,142,594 469,924 30,483 - 1,643,002 1,819 1,644,821
(Note) The classification “Other businesses” refers to business segments that are not included in reporting segments, and
includes Hotel Business.
17
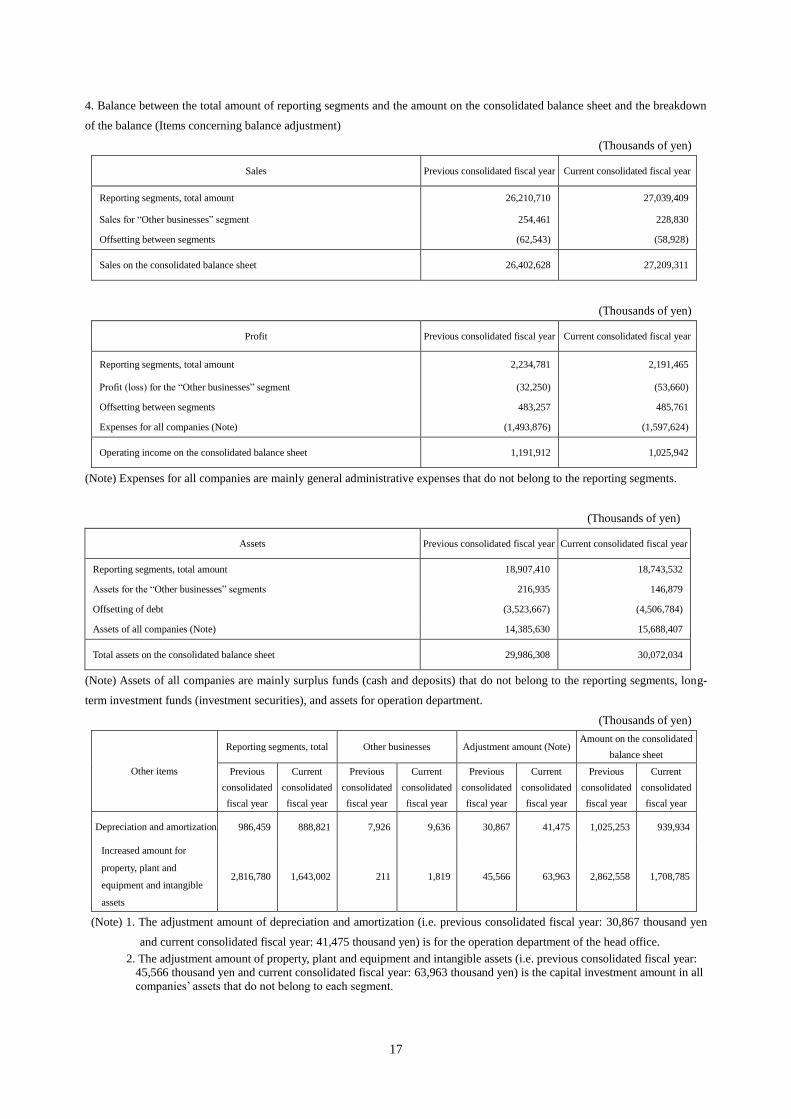
4. Balance between the total amount of reporting segments and the amount on the consolidated balance sheet and the breakdown
of the balance (Items concerning balance adjustment)
(Thousands of yen)
Sales Previous consolidated fiscal year Current consolidated fiscal year
Reporting segments, total amount 26,210,710 27,039,409
Sales for “Other businesses” segment 254,461 228,830
Offsetting between segments (62,543) (58,928)
Sales on the consolidated balance sheet 26,402,628 27,209,311
(Thousands of yen)
Profit Previous consolidated fiscal year Current consolidated fiscal year
Reporting segments, total amount 2,234,781 2,191,465
Profit (loss) for the “Other businesses” segment (32,250) (53,660)
Offsetting between segments 483,257 485,761
Expenses for all companies (Note) (1,493,876) (1,597,624)
Operating income on the consolidated balance sheet 1,191,912 1,025,942
(Note) Expenses for all companies are mainly general administrative expenses that do not belong to the reporting segments.
(Thousands of yen)
Assets Previous consolidated fiscal year Current consolidated fiscal year
Reporting segments, total amount 18,907,410 18,743,532
Assets for the “Other businesses” segments 216,935 146,879
Offsetting of debt (3,523,667) (4,506,784)
Assets of all companies (Note) 14,385,630 15,688,407
Total assets on the consolidated balance sheet 29,986,308 30,072,034
(Note) Assets of all companies are mainly surplus funds (cash and deposits) that do not belong to the reporting segments, long-
term investment funds (investment securities), and assets for operation department.
(Thousands of yen)
Other items
Reporting segments, total Other businesses Adjustment amount (Note) Amount on the consolidated
balance sheet
Previous
consolidated
fiscal year
Current
consolidated
fiscal year
Previous
consolidated
fiscal year
Current
consolidated
fiscal year
Previous
consolidated
fiscal year
Current
consolidated
fiscal year
Previous
consolidated
fiscal year
Current
consolidated
fiscal year
Depreciation and amortization 986,459 888,821 7,926 9,636 30,867 41,475 1,025,253 939,934
Increased amount for
property, plant and
equipment and intangible
assets
2,816,780 1,643,002 211 1,819 45,566 63,963 2,862,558 1,708,785
(Note) 1. The adjustment amount of depreciation and amortization (i.e. previous consolidated fiscal year: 30,867 thousand yen
and current consolidated fiscal year: 41,475 thousand yen) is for the operation department of the head office.
2. The adjustment amount of property, plant and equipment and intangible assets (i.e. previous consolidated fiscal year:
45,566 thousand yen and current consolidated fiscal year: 63,963 thousand yen) is the capital investment amount in all
companies’ assets that do not belong to each segment.
18
[Related information]
Previous consolidated fiscal year (From April 1, 2017 to March 31, 2018)
1. Information for each product and service
It is not described here because the same information is disclosed in the “Segment information” section.
2. Information per region
(1) Sales
Because sales to the external customers within Japan exceed 90% of the sales on the consolidated statements of income,
the description is omitted here.
(2) Property, plant and equipment
Because the amount of property, plant and equipment that exist within Japan exceeds 90% of the property, plant and
equipment on the consolidated balance sheet, the description is omitted here.
3. Information per major customer
(Thousands of yen)
Name of the customer Sales Relevant segment
Fukuoka National Health Insurance Organization 4,834,724 Nursing Care Business
Current consolidated fiscal year (From April 1, 2018 to March 31, 2019)
1. Information for each product and service
It is not described here because the same information is disclosed in the “Segment information” section.
2. Information per region
(1) Sales
Because sales to the external customers within Japan exceed 90% of the sales on the consolidated statements of income,
the description is omitted here.
(2) Property, plant and equipment
Because the amount of property, plant and equipment that exist within Japan exceeds 90% of the property, plant and
equipment on the consolidated balance sheet, the description is omitted here.
3. Information per major customer
(Thousands of yen)
Name of the customer Sales Relevant segment
Fukuoka National Health Insurance Organization 4,964,678 Nursing Care Business
19
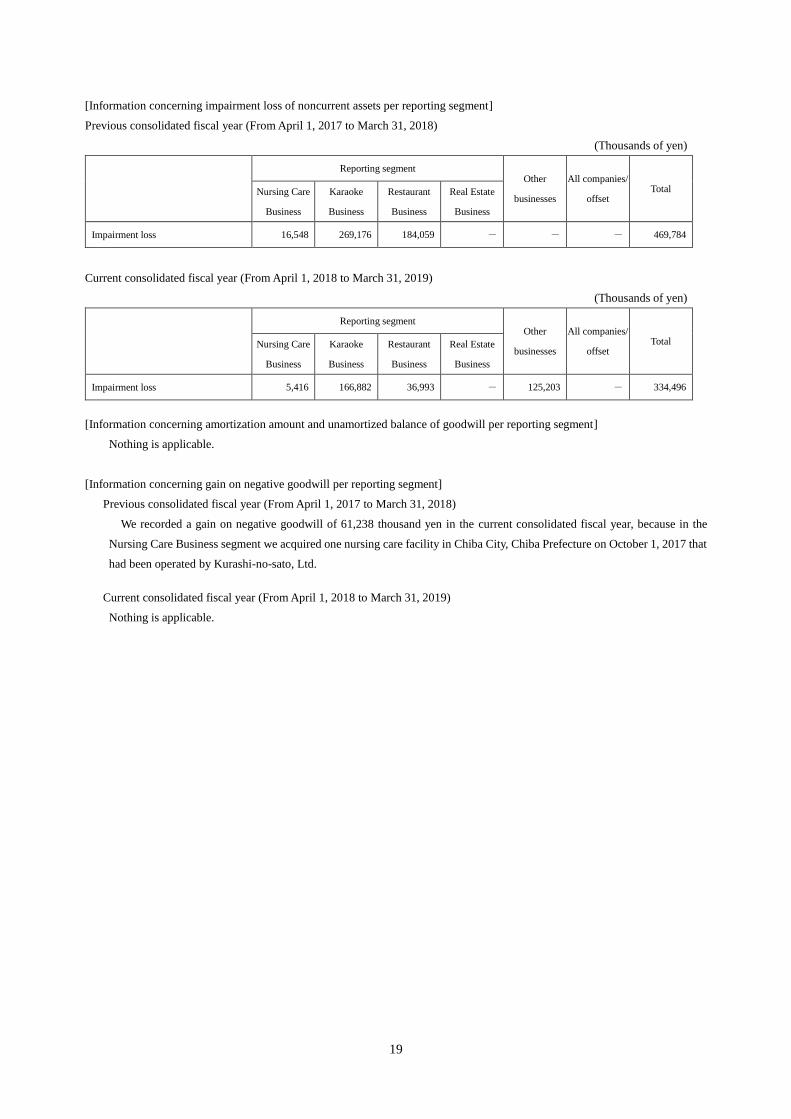
[Information concerning impairment loss of noncurrent assets per reporting segment]
Previous consolidated fiscal year (From April 1, 2017 to March 31, 2018)
(Thousands of yen)
Reporting segment Other
businesses
All companies/
offset Total Nursing Care
Business
Karaoke
Business
Restaurant
Business
Real Estate
Business
Impairment loss 16,548 269,176 184,059 - - - 469,784
Current consolidated fiscal year (From April 1, 2018 to March 31, 2019)
(Thousands of yen)
Reporting segment Other
businesses
All companies/
offset Total Nursing Care
Business
Karaoke
Business
Restaurant
Business
Real Estate
Business
Impairment loss 5,416 166,882 36,993 - 125,203 - 334,496
[Information concerning amortization amount and unamortized balance of goodwill per reporting segment]
Nothing is applicable.
[Information concerning gain on negative goodwill per reporting segment]
Previous consolidated fiscal year (From April 1, 2017 to March 31, 2018)
We recorded a gain on negative goodwill of 61,238 thousand yen in the current consolidated fiscal year, because in the
Nursing Care Business segment we acquired one nursing care facility in Chiba City, Chiba Prefecture on October 1, 2017 that
had been operated by Kurashi-no-sato, Ltd.
Current consolidated fiscal year (From April 1, 2018 to March 31, 2019)
Nothing is applicable.
20
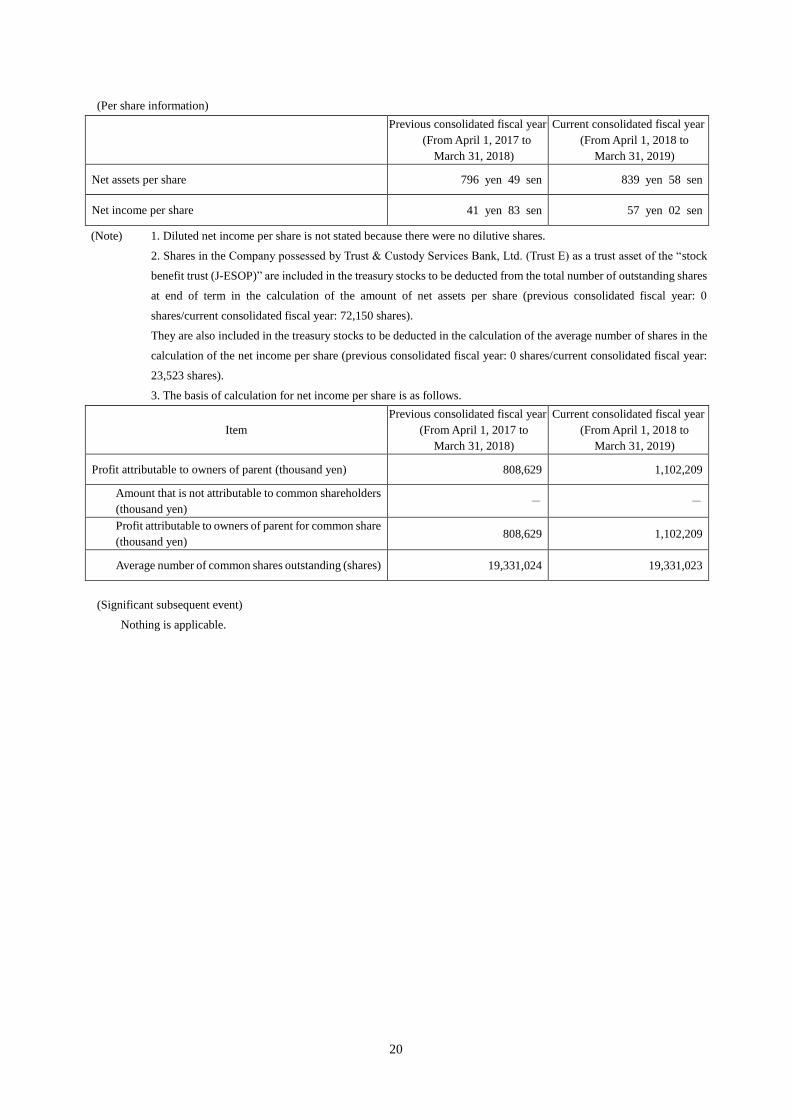
(Per share information)
Previous consolidated fiscal year
(From April 1, 2017 to
March 31, 2018)
Current consolidated fiscal year
(From April 1, 2018 to
March 31, 2019)
Net assets per share 796 yen 49 sen 839 yen 58 sen
Net income per share 41 yen 83 sen 57 yen 02 sen
(Note) 1. Diluted net income per share is not stated because there were no dilutive shares.
2. Shares in the Company possessed by Trust & Custody Services Bank, Ltd. (Trust E) as a trust asset of the “stock
benefit trust (J-ESOP)” are included in the treasury stocks to be deducted from the total number of outstanding shares
at end of term in the calculation of the amount of net assets per share (previous consolidated fiscal year: 0
shares/current consolidated fiscal year: 72,150 shares).
They are also included in the treasury stocks to be deducted in the calculation of the average number of shares in the
calculation of the net income per share (previous consolidated fiscal year: 0 shares/current consolidated fiscal year:
23,523 shares).
3. The basis of calculation for net income per share is as follows.
Item
Previous consolidated fiscal year
(From April 1, 2017 to
March 31, 2018)
Current consolidated fiscal year
(From April 1, 2018 to
March 31, 2019)
Profit attributable to owners of parent (thousand yen) 808,629 1,102,209
Amount that is not attributable to common shareholders
(thousand yen) - -
Profit attributable to owners of parent for common share
(thousand yen) 808,629 1,102,209
Average number of common shares outstanding (shares) 19,331,024 19,331,023
(Significant subsequent event)
Nothing is applicable.


![Consolidated Financial Results Fiscal Year ended … · May 14, 2018 Consolidated Financial Results Fiscal Year ended March 31, 2018 [IFRS] April 1, 2017 – March 31, 2018 Konica](https://img.pdfslide.us/doc/110x75/5b96242c09d3f2de4a8ce6bd/consolidated-financial-results-fiscal-year-ended-may-14-2018-consolidated-financial.jpg)


![Consolidated Financial Results for the Fiscal Year Ended ...Note: Comprehensive income Fiscal year ended March 31, 2019: ¥1,761 million [24.3%] Fiscal year ended March 31, 2018: ¥1,417](https://img.pdfslide.us/doc/110x75/5fe4d06806b4775830253106/consolidated-financial-results-for-the-fiscal-year-ended-note-comprehensive.jpg)