Embed Size (px)
Citation preview
October 14, 2021MEIKO NETWORK JAPAN CO., LTD.The First Section of the Tokyo Stock Exchange4668 URL https://www.meikonet.co.jpKazuhito Yamashita, PresidentKouyuki Sakamoto, Executive Officer, General Manager of Corporate Planning Department+81-3-5860-2111
Scheduled date for the ordinary general meeting of shareholders: November 19, 2021Scheduled date for commencement of dividend payment: November 22, 2021Scheduled date for filing the securities report: November 24, 2021Supplementary material development: YesFinancial results meeting: Yes for analysts and institutional investor
(Amounts less than one million yen are discarded)
(1) Consolidated operating results Percentages represent increases or decreases from the previous year
million yen million yen million yen million yen
19,039 4.5 969 351.2 1,113 146.5 1140
18,218 (8.8) 214 (87.9) 451 (76.3) (2,232)(Note) Comprehensive income:Year ended August 2021: 1,179 million yen ( %) Year ended August 2020: (2,728) million yen ( %)
Fully dilutednet incomeper share
yen
(Reference) Profit or loss on equity method investments:
Year ended August 2021 8 million yen Year ended August 2020 12 million yen
(2) Consolidated financial situation
(Reference) Shareholders’ equity:Year ended August 2021: 10,025 million yen Year ended August 2020: 9,473 million yen
(3) Consolidated cash flows
Year ended August 2021
Year ended August 2020 (85.21)
45.47yen
Net income pershare
1,697 (628) 8,577
140 1,243 (2,063) 6,765
Year ended August 2021
Year ended August 2020
742million yen million yen
Year ended August 2020
Year ended August 2020
Year ended August 2021
14,649 10,025 68.4
Total assets
million yen million yen %
Year ended August 2021
Net incomeattributable to
owners of the parent
Ratio of operatingincome to net salese
%
5.1
1.2
399.67yen
Cash and cashequivalents at the
end of the year
Cash flows fromfinancing activities
Cash flows frominvesting activities
Cash flows fromoperating activities
14,041 9,473 67.5 377.67
million yen million yen
Shareholders’ equityratioNet assets Shareholders’ equity
ratio
Summary Report on Financial Results for Fiscal Year Ended August 2021 (Japanese Accounting Standards)
Company name:
Tel:Contact:Representative:Stock code:Stock exchange listing:
1. Consolidated financial results for year ended August 2021 September 1, 2020 through August 31, 2021
Ratio of net income toshareholders’ equity
%
11.7
(18.7)
Ratio of ordinaryincome to total assets
%
7.8
2.7
Net sales Operating income Ordinary income
Summary Report on Financial Results for Fiscal Year Ended August 2021
1

2. Dividends
End of thefirst
quarter
End of thesecond quarter
End of thethird quarter
End of theterm annual
yen yen yen yen yen million yen % %
15.00 15.00 30.00 774 6.5
10.00 10.00 20.00 504 44.0 5.1
11.00 11.00 22.00 83.6
3. Forecast of consolidated financial results for fiscal year ending August 2022 (September 1, 2021 through August 31, 2022)(Percentages represent increases or decreases from the previous year for the full-year figures)
Netincome
per share
million yen million yen million yen million yen yen
10,100 3.6 952 2.3 980 (3.6) 590 (11.5) 23.52
19,800 4.0 1,040 7.3 1,100 (1.2) 660 (42.1) 26.31
(Notes)(1) Changes of important subsidiaries during the period
(changes of specific subsidiaries in accordance with changes in the scope of consolidation): None
(2) Changes in accounting policies and changes or restatement of accounting estimates ( ) Changes in accounting policies caused by revision of accounting standards: None
( ) Changes in accounting policies other than ( ): None ( ) Changes in accounting estimates: None ( ) Restatement: None
(3) Number of outstanding issues common stock ( ) Number of outstanding shares at the end of the period (including treasury stock)
Year ended August 2021 : 27,803,600 shares Year ended August 2020 : 27,803,600 shares ( ) Number of shares of treasury stock at the end of the period:
Year ended August 2021 : 2,720,058 sharesYear ended August 2020 : 2,,719,974 shares
( ) Average number of shares during the period (accumulated consolidated quarter)Year ended August 2021 : 25,084,293 sharesYear ended August 2020 : 26,198,740 shares
* The number of treasury stock at the end of the fiscal year includes the Company's shares held by the "Stock GrantingTrust for Officers" (141,000 shares for the fiscal year ended August 31, 2021) and the Company's shares held by the "StockGranting Trust for Employees" (121,000 shares for the fiscal year ended August 31, 2021).
In addition, shares of the Company held by the "Stock Granting Trust for Directors" (70,693 shares in the fiscal yearended August 31, 2021) and shares of the Company held by the "Stock Granting Trust for Employees" (60,666 shares inthe fiscal year ended August 31, 2021) are included in the treasury stock deducted in the calculation of the averagenumber of shares outstanding during the fiscal year.
Year ending August 2022(estimate)
Year ended August 2020
Year ended August 2021
Full-year
second quarter (comulative)
Net incomeattributable to
owners of the parentOrdinary incomeOperating incomeNet sales
Yearly Dividends per share Ratio ofdividends tonet assets
(consolidated)
Payout ratio(consolidate
d)
Totaldividends
(for the year)
Summary Report on Financial Results for Fiscal Year Ended August 2021
2

Reference Overview of non-consolidated financial results
Non-consolidated financial results for fiscal year ended August 2021 September 1, 2020 through August 31, 2021
(1) Non-consolidated operating results Percentages represent increases or decreases from the previous year
million yen million yen million yen million yen
12,770 8.3 610 153.2 691 57.9 922
11,796 (8.5) 241 (84.5) 438 (71.3) (1,673)
(2) Non-consolidated financial situation
(Reference) Shareholders’ equity:
Year ended August 2021: 10,119 million yen Year ended August 2020: 9,790 million yen
This financial summary falls outside the scope of quarterly review procedures.
Explanation of the appropriate use of the forecasts of financial results, and other noteworthy matters
Forward-looking statements in the document, such as earnings forecasts, are based on the information currently availableand certain assumptions that the company thinks reasonable. Actual results may differ remarkably from the statements dueto variety of different factors.
Year ended August 2020 11,871 9,790 82.5 390.30
Year ended August 2021 12,451 10,119 81.3 403.43
Shareholders’ equityratio
million yen million yen % yen
Fully diluted net incomeper share
Total assets Net assets Shareholders’ equityratio
Year ended August 2020 (63.88)
yen
Net income pershare
yen
Year ended August 2021 36.76
Year ended August 2021
Year ended August 2020
Net sales Operating income Ordinary income Net income
Summary Report on Financial Results for Fiscal Year Ended August 2021
3

Term
Operatingresults
Same period ofthe previous
year
Operatingresults
Same period ofthe previous
year
Number of Meiko Gijuku directly operated schools 244 +23 205 (39)
Number of Meiko Gijuku directly operated schools(MAXIS) 94 +2 93 (1)
Number of Meiko Gijuku directly operated schools(KLINE) 41 41
Number of Meiko Gijuku directly operated schools 3(KMG) 42 (1) 42
Number of Meiko Gijuku directly operated schools (One link) 20 +20
Number of Meiko Gijuku directly operated schools 421 +24 401 (20)
Number of Meiko Gijuku franchised schools 1,441 (99) 1,366 (75)
Total number of Meiko Gijuku schools 1,862 (75) 1,767 (95)
Number of registered students of Meiko Gijuku directlyoperated schools 14,961 (611) 15,002 +41
Number of registered students of Meiko Gijuku directlyoperated schools (MAXIS) 6,613 (208) 7,007 +394
Number of registered students of Meiko Gijuku directlyoperated schools (KLINE) 2,657 (77) 2,952 +295
Number of registered students of Meiko Gijuku directlyoperated schools (KMG) 3 2,086 (217) 2,228 +142
Number of registered students of Meiko Gijuku directlyoperated schools (One link) 885 +885
Number of registered students of Meiko Gijuku directlyoperated schools 26,317 (1,113) 28,074 +1,757
Number of registered students of Meiko Gijuku franchisedschools 74,956 (10,695) 74,377 (579)
Total number of registered students of Meiko Gijuku schools 101,273 (11,808) 102,451 +1,178
Sales from Meiko Gijuku directly operated schools(million yen) 10,297 (342) 11,557 +1,260
Sales from Meiko Gijuku franchised schools 1(million yen) 4,349 (685) 4,505 +155
Sales from Japanese language schools (million yen) 1,156 (205) 840 (315)
Sales from others (million yen) 2,414 (516) 2,135 (278)
Total Sales (million yen) 18,218 (1,749) 19,039 +821
Sales from Meiko Gijuku directly operated schools(million yen) 10,297 (342) 11,557 +1,260
System-wide sales from Meiko Gijuku franchised schools (million yen) 26,386 (3,384) 25,976 (409)
Total system-wide sales from Meiko Gijuku schools 2 (million yen) 36,684 (3,726) 37,534 +850
3 K.M.G Corporation Co., Ltd is called KMG for short. The company has changed its name to TOMONI Co., Ltd.as of September 1, 2021.
Reference Trend of numbers of Meiko Gijuku schools and registered students and system-wide sales
1 Sales from Meiko Gijuku franchised schools represent royalty revenues and sales of products.
2 Total system-wide sales from Meiko Gijuku schools represent the sum of total sales of Meiko Gijuku directlyoperated schools, including tuition, materials fees, and examination fees, and the total sales of Meiko Gijukufranchised schools, including tuition. Materials fees and examination fees of franchised schools are excluded.
Year ended August 2021Year ended August 2020
From September 1, 2019 toAugust 31, 2020
From September 1, 2020 toAugust 31, 2021
Fiscal Period
Summary Report on Financial Results for Fiscal Year Ended August 2021
4

Summary of consolidated financial statements(1) Consolidated balance sheets
(Million yen)
AssetsCurrent assets
Cash and deposits 7,015 8,727Accounts receivable - trade 845 767Securities 300 200Merchandise 137 114Work in process 11 13Supplies 7 7Advance payments - trade 14 19Prepaid expenses 279 303Other 282 322Allowance for doubtful accounts (46) (33)Total current assets 8,848 10,441
Non-current assetsProperty, plant and equipment
Buildings and structures 1,508 1,145Accumulated depreciation (789) (676)Buildings and structures, net 719 469
Tools, furniture and fixtures 350 375Accumulated depreciation (321) (322)Tools, furniture and fixtures, net 28 52
Land 385 0Leased assets 10 10
Accumulated depreciation (0) (1)Leased assets, net 9 8
Total property, plant and equipment 1,142 531Intangible assets
Goodwill 277 203Software 255 190Software in progress 8 4Telephone subscription right 4 4Total intangible assets 545 402
Investments and other assetsInvestment securities 2,120 2,022Long-term prepaid expenses 41 42Deferred tax assets 198 226Leasehold and guarantee deposits 1,006 942Long-term time deposits 100Other 37 40Total investments and other assets 3,504 3,274
Total non-current assets 5,192 4,207Total assets 14,041 14,649
Year ended August31, 2020
Year ended August31, 2021
Summary Report on Financial Results for Fiscal Year Ended August 2021
5

(Million yen)
LiabilitiesCurrent liabilities
Accounts payable - trade 119 119Accounts payable - other 134 102Accrued expenses 1,055 1,139Income taxes payable 287 427Accrued consumption taxes 198 331Advances received 1,537 1,242Lease obligations 1 1Deposits received 45 54Provision for bonuses 423 404Other 43 51Total current liabilities 3,847 3,876
Non-current liabilitiesRetirement benefit liability 104 111Provision for share awards for directors (and other officers) 11Provision for share awards 34Long-term accounts payable-other to employees 108 104Long-term accounts payable-other to officers 117 117Deferred tax liabilities 32 18Lease obligations 9 7Asset retirement obligations 346 339Long-term guarantee deposits 1 1Total non-current liabilities 720 747
Total liabilities 4,568 4,624Net assets
Shareholders' equityShare capital 972 972Capital surplus 909 909Retained earnings 10,140 10,529Treasury shares (2,903) (2,779)Total shareholders' equity 9,119 9,632
Accumulated other comprehensive incomeValuation difference on available-for-sale securities 342 377Foreign currency translation adjustment 11 15Total accumulated other comprehensive income 354 392
Total net assets 9,473 10,025Total liabilities and net assets 14,041 14,649
Year ended August31, 2020
Year ended August31, 2021
Summary Report on Financial Results for Fiscal Year Ended August 2021
6
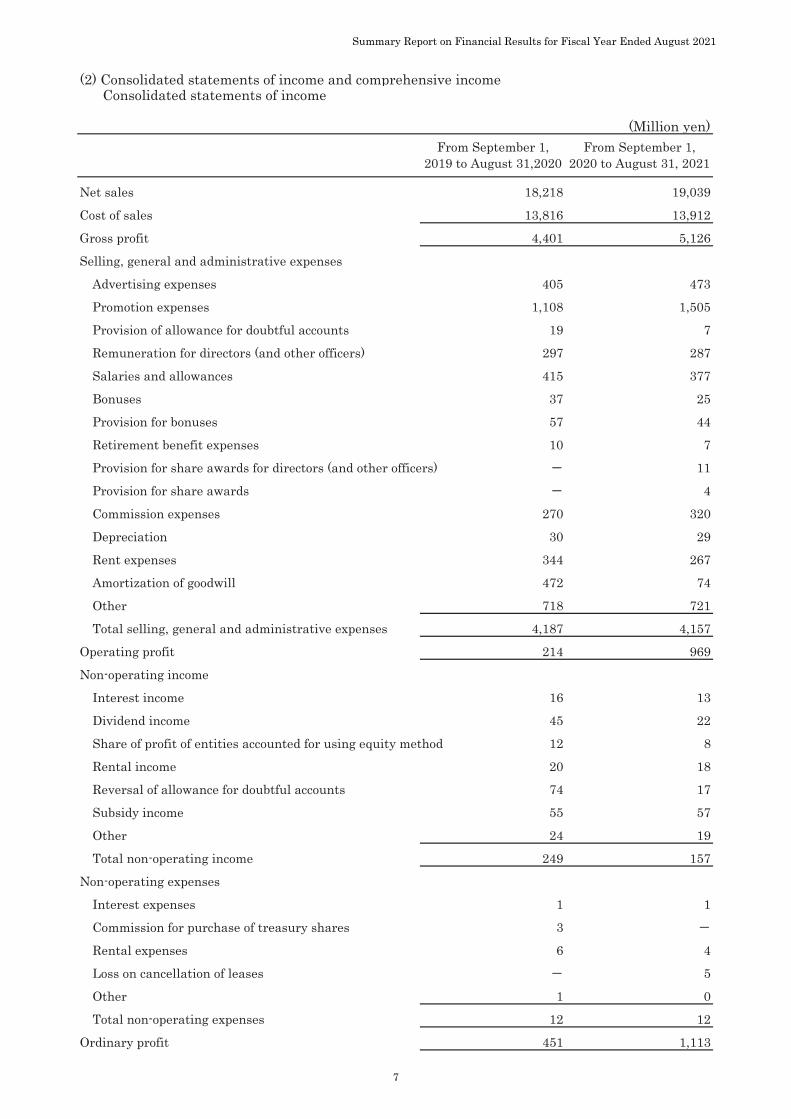
(2) Consolidated statements of income and comprehensive incomeConsolidated statements of income
(Million yen)
Net sales 18,218 19,039
Cost of sales 13,816 13,912
Gross profit 4,401 5,126
Selling, general and administrative expenses
Advertising expenses 405 473
Promotion expenses 1,108 1,505
Provision of allowance for doubtful accounts 19 7
Remuneration for directors (and other officers) 297 287
Salaries and allowances 415 377
Bonuses 37 25
Provision for bonuses 57 44
Retirement benefit expenses 10 7
Provision for share awards for directors (and other officers) 11
Provision for share awards 4
Commission expenses 270 320
Depreciation 30 29
Rent expenses 344 267
Amortization of goodwill 472 74
Other 718 721
Total selling, general and administrative expenses 4,187 4,157
Operating profit 214 969
Non-operating income
Interest income 16 13
Dividend income 45 22
Share of profit of entities accounted for using equity method 12 8
Rental income 20 18
Reversal of allowance for doubtful accounts 74 17
Subsidy income 55 57
Other 24 19
Total non-operating income 249 157
Non-operating expenses
Interest expenses 1 1
Commission for purchase of treasury shares 3
Rental expenses 6 4
Loss on cancellation of leases 5
Other 1 0
Total non-operating expenses 12 12
Ordinary profit 451 1,113
From September 1,2019 to August 31,2020
From September 1,2020 to August 31, 2021
Summary Report on Financial Results for Fiscal Year Ended August 2021
7
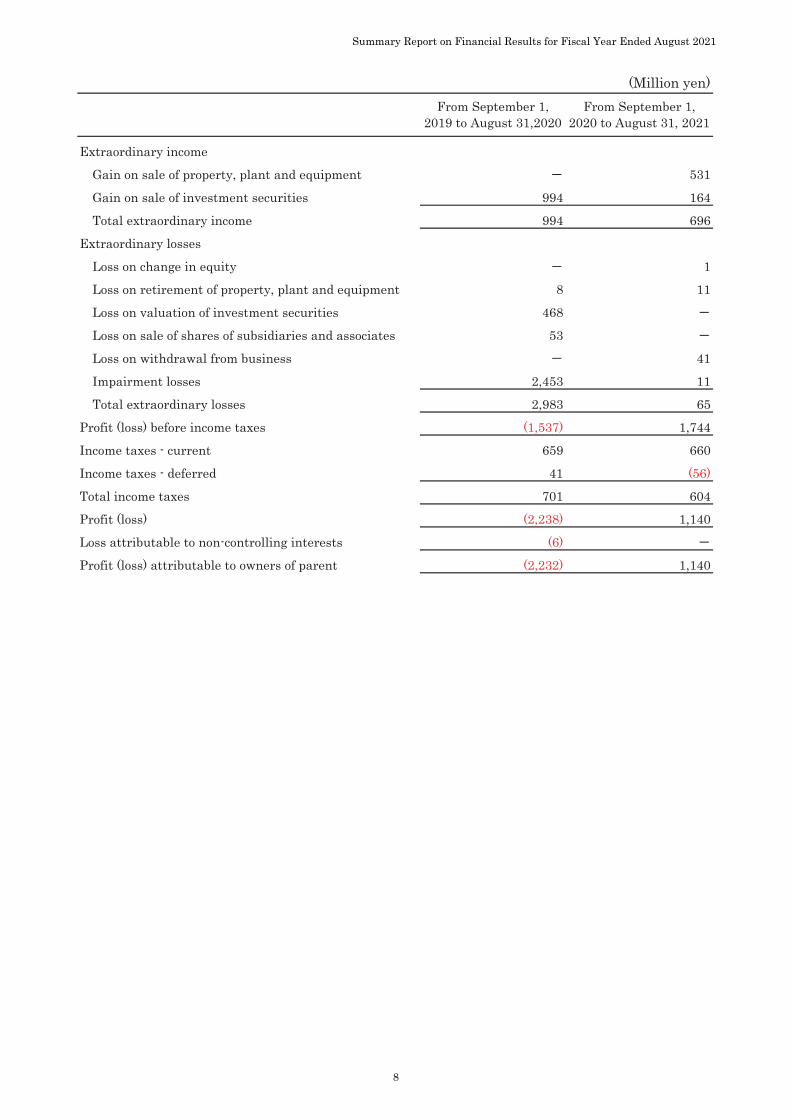
(Million yen)
Extraordinary income
Gain on sale of property, plant and equipment 531
Gain on sale of investment securities 994 164
Total extraordinary income 994 696
Extraordinary losses
Loss on change in equity 1
Loss on retirement of property, plant and equipment 8 11
Loss on valuation of investment securities 468
Loss on sale of shares of subsidiaries and associates 53
Loss on withdrawal from business 41
Impairment losses 2,453 11
Total extraordinary losses 2,983 65
Profit (loss) before income taxes (1,537) 1,744
Income taxes - current 659 660
Income taxes - deferred 41 (56)
Total income taxes 701 604
Profit (loss) (2,238) 1,140
Loss attributable to non-controlling interests (6)
Profit (loss) attributable to owners of parent (2,232) 1,140
From September 1,2019 to August 31,2020
From September 1,2020 to August 31, 2021
Summary Report on Financial Results for Fiscal Year Ended August 2021
8

(Million yen)
Profit (2,238) 1,140Other comprehensive incomeValuation difference on available-for-sale securities (488) 34
Share of other comprehensive income of entitiesaccounted for using equity method (1) 3
Total other comprehensive income (489) 38Comprehensive income (2,728) 1,179Comprehensive income attributable to
Comprehensive income attributable to owners ofparent (2,721) 1,179
Comprehensive income attributable to non-controlling interests (7)
Consolidated statements of comprehensive income
From September 1, 2019to August 31, 2020
From September 1, 2020to August 31, 2021
Summary Report on Financial Results for Fiscal Year Ended August 2021
9

(3) Consolidated statement of change in shareholder's equityPrevious consolidated fiscal year (From September 1, 2019 to August 31, 2020)
(million yen)
Share capital Capital surplus Retainedearnings Treasury shares
Totalshareholders'
equity
Balance at beginning of period 972 909 13,317 (1,643) 13,556
Changes during period
Dividends of surplus (796) (796)
Profit (loss) attributable to ownersof parent (2,232) (2,232)
Purchase of treasury shares (1,259) (1,259)
Change in scope of consolidation (148) (148)
Disposal of treasury shares
Net changes in items other thanshareholders' equity
Total changes during period (3,177) (1,259) (4,436)
Balance at end of period 972 909 10,140 (2,903) 9,119
Valuationdifference on
available-for-salesecurities
Foreign currencytranslationadjustment
Total accumulatedother
comprehensiveincome
Balance at beginning of period 830 12 843 15 14,414
Changes during period
Dividends of surplus (796)
Profit (loss) attributable to ownersof parent (2,232)
Purchase of treasury shares (1,259)
Change in scope of consolidation (148)
Disposal of treasury shares
Net changes in items other thanshareholders' equity (488) (1) (489) (15) (504)
Total changes during period (488) (1) (489) (15) (4,941)
Balance at end of period 342 11 354 9,473
Accumulated other comprehensive income
Non-controllinginterests Total net assets
Shareholder's equity
Summary Report on Financial Results for Fiscal Year Ended August 2021
10

Current consolidated fiscal year (From September 1, 2020 to August 31, 2021)(million yen)
Share capital Capital surplus Retainedearnings Treasury shares
Totalshareholders'
equity
Balance at beginning of period 972 909 10,140 (2,903) 9,119
Changes during period
Dividends of surplus (627) (627)
Profit (loss) attributable to ownersof parent 1,140 1,140
Purchase of treasury shares (155) (155)
Change in scope of consolidation
Disposal of treasury shares (124) 279 155
Net changes in items other thanshareholders' equity
Total changes during period 389 124 513
Balance at end of period 972 909 10,529 (2,779) 9,632
Valuationdifference on
available-for-salesecurities
Foreign currencytranslationadjustment
Total accumulatedother
comprehensiveincome
Balance at beginning of period 342 11 354 9,473
Changes during period
Dividends of surplus (627)
Profit (loss) attributable to ownersof parent 1,140
Purchase of treasury shares (155)
Change in scope of consolidation
Disposal of treasury shares 155
Net changes in items other thanshareholders' equity 34 3 38 38
Total changes during period 34 3 38 552
Balance at end of period 377 15 392 10,025
Accumulated other comprehensive income
Non-controllinginterests Total net assets
Shareholder's equity
Summary Report on Financial Results for Fiscal Year Ended August 2021
11
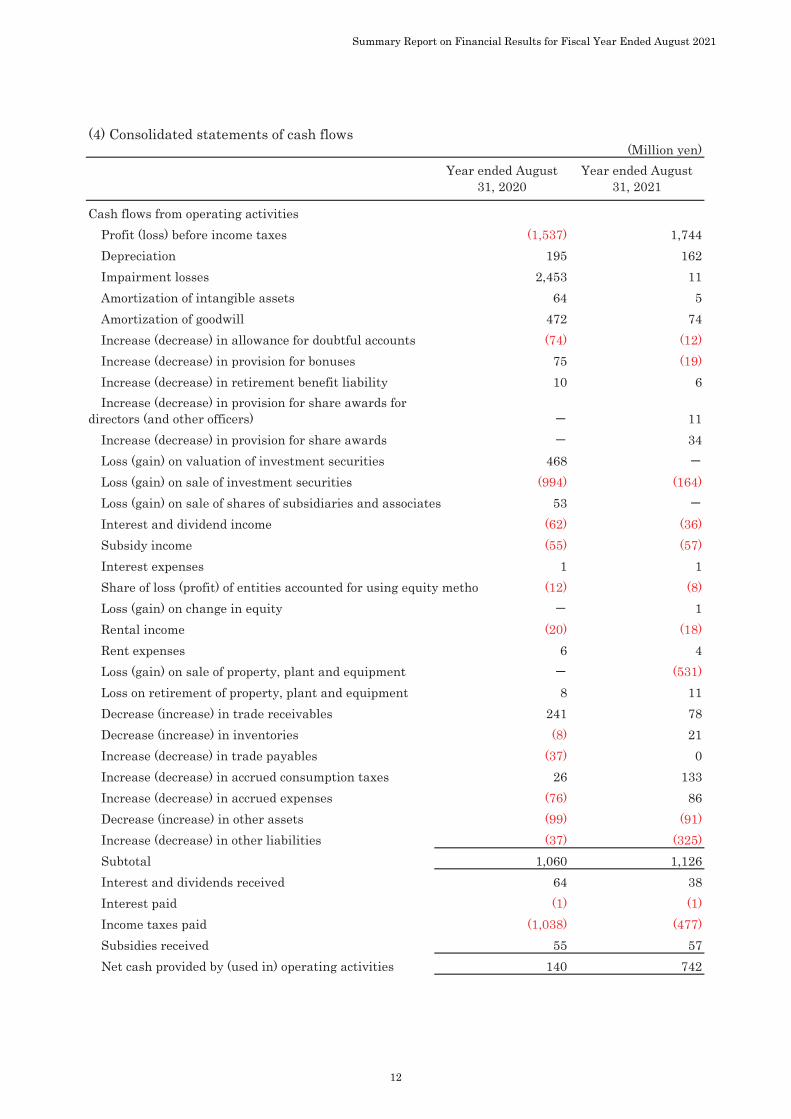
(4) Consolidated statements of cash flows(Million yen)
Cash flows from operating activitiesProfit (loss) before income taxes (1,537) 1,744Depreciation 195 162Impairment losses 2,453 11Amortization of intangible assets 64 5Amortization of goodwill 472 74Increase (decrease) in allowance for doubtful accounts (74) (12)Increase (decrease) in provision for bonuses 75 (19)Increase (decrease) in retirement benefit liability 10 6Increase (decrease) in provision for share awards for
directors (and other officers) 11Increase (decrease) in provision for share awards 34Loss (gain) on valuation of investment securities 468Loss (gain) on sale of investment securities (994) (164)Loss (gain) on sale of shares of subsidiaries and associates 53Interest and dividend income (62) (36)Subsidy income (55) (57)Interest expenses 1 1Share of loss (profit) of entities accounted for using equity metho (12) (8)Loss (gain) on change in equity 1Rental income (20) (18)Rent expenses 6 4Loss (gain) on sale of property, plant and equipment (531)Loss on retirement of property, plant and equipment 8 11Decrease (increase) in trade receivables 241 78Decrease (increase) in inventories (8) 21Increase (decrease) in trade payables (37) 0Increase (decrease) in accrued consumption taxes 26 133Increase (decrease) in accrued expenses (76) 86Decrease (increase) in other assets (99) (91)Increase (decrease) in other liabilities (37) (325)Subtotal 1,060 1,126Interest and dividends received 64 38Interest paid (1) (1)Income taxes paid (1,038) (477)Subsidies received 55 57Net cash provided by (used in) operating activities 140 742
Year ended August31, 2020
Year ended August31, 2021
Summary Report on Financial Results for Fiscal Year Ended August 2021
12

(Million yen)
Cash flows from investing activitiesPurchase of securities (100) (100)Proceeds from redemption of securities 100 100Purchase of property, plant and equipment (151) (165)Proceeds from sale of property, plant and equipment 2 1,235Purchase of intangible assets (166) (24)Purchase of investment securities (191)Proceeds from sale of investment securities 1,674 221Proceeds from redemption of investment securities 200 200
change in scope of consolidation (66)
Loan advances (1)Proceeds from collection of loans receivable 80Payments of guarantee deposits (69) (36)Proceeds from refund of guarantee deposits 14 52Decrease (increase) in time deposits (100) 200Other, net 17 15Net cash provided by (used in) investing activities 1,243 1,697
Cash flows from financing activitiesProceeds from borrowings 1,000Repayments of borrowings (6) (1,000)Purchase of treasury shares (1,259)Dividends paid (797) (626)Repayments of lease obligations (0) (1)Net cash provided by (used in) financing activities (2,063) (628)
Net increase (decrease) in cash and cash equivalents (679) 1,811Cash and cash equivalents at beginning of period 7,445 6,765Cash and cash equivalents at end of period 6,765 8,577
Year ended August31, 2020
Year ended August31, 2021
Summary Report on Financial Results for Fiscal Year Ended August 2021
13

Previous consolidated fiscal year (From September 1, 2019 to August 31, 2020)(Million yen)
Meiko Gijukudirectly operated
schools
Meiko Gijukufranchised
schools
Japaneselanguage schools Total
10,297 4,349 1,156 15,803 2,414 18,218
4 743 748 68 816
10,301 5,093 1,156 16,551 2,483 19,034
294 1,428 54 1,778 (276) 1,501
69 70 16 156 32 189
228 169 398 74 472
(Note)
Current consolidated fiscal year (From September 1, 2020 to August 31, 2021)
(Million yen)
Meiko Gijukudirectly operated
schools
Meiko Gijukufranchised
schools
Japaneselanguage schools Total
11,557 4,505 840 16,903 2,135 19,039
892 3 895 28 924
11,557 5,397 844 17,799 2,164 19,963
1,338 1,367 (176) 2,529 (269) 2,259
40 59 15 115 37 153
74 74(Note)
Depreciation
Amortization of goodwill
Intersegment sales
Others* Total
* “Others” consists of the operating segments not included in reportable segments. It includes Kids Business (Afterschool), SportsBusiness (Meiko Soccer School etc.), Waseda Academy Kobetsu Schools, RED Business, Meiko Kids e and other businesses ofconsolidated subsidiaries.
Reportable segment
Others* Total
Net salesSales to third party
Intersegment sales
Total
Segment income(loss)Other items
Amortization of goodwill
DepreciationOther itemsSegment income(loss)
Total
Segment Information
1 Information about Segment Sales and Income (Loss)
Reportable segment
Sales to third partyNet sales
*** The Company sold all of its shares in Youdec Co., Ltd. As a result, Youdec Co., Ltd. and its subsidiary, KOYO SHOBO Co.has been excluded from the scope of consolidation. In preparing the consolidated financial statements, the income statement up tothe deemed sale date has been consolidated, assuming that the deemed sale date of Youdec Co., Ltd. shares is March 1, 2020.
** Information about assets and liabilities are not disclosed because it is not treated as information that is central to theallocation of management resources and the evaluation of business performance.
* “Others” consists of the operating segments not included in reportable segments. It includes Kids Business (Afterschool), SportsBusiness (Meiko Soccer School etc.), Waseda Academy Kobetsu Schools, RED Business, Meiko Kids e and other businesses ofconsolidated subsidiaries.
Summary Report on Financial Results for Fiscal Year Ended August 2021
14

(Million yen)
(Million yen)
(Note)
Year ended August31, 2020
Year ended August31, 2021
Year ended August31, 2020
Year ended August31, 2021
Year ended August31, 2020
Year ended August31, 2021
Year ended August31, 2020
Year ended August31, 2021
Depreciation 156 115 32 37 5 9 195 162(Note)
Per share information
399.67 yen
45.47 yen(Note)* As there is no potential shares, we do not disclosure the diluted net income per share.** Net income per share or basis for calculation of net income (loss) per share
Adjustment of depreciation and amortization is mainly depreciation and amortization of assets related to administrative divisionssuch as the general affairs division of the parent company's head office that do not belong to any reportable segment.
Corporate expenses are mainly expenses that relate to the General Affairs section of the parent company that are notattributable to the reportable segment.
Other Items
Amount in consolidated financialstatements
377.67 yen
Year ended August 31, 2021
Operating income in financial statements
Corporate expenses
Income(Loss) for “Others”category
Reportable segment total
Profit
Year ended August 31, 2020
19,039
(924)
2,164
17,799
Year ended August 31, 2021
2 Reconciliation of dfference between reportable segment totals and consolidated financial statement totals (Matters relating to reconciliation of differences)
*** Tokyo Ishin Gakuin Co., Ltd. was excluded from the scope of consolidation due to the completion of liquidation on June 30,2021. In the current consolidated fiscal year, only the profit and loss statement up to the time of completion of liquidation isconsolidated.
** Information about assets and liabilities are not disclosed because it is not treated as information that is central to theallocation of management resources and the evaluation of business performance.
969
(1,290)
214
(1,287)
(269)
2,529
(276)
1,778
Net sales in financial statements 18,218
Year ended August 31, 2020
Intersegment eliminations
Sales for “Others”category
(816)
2,483
Year ended August 31, 2021Year ended August 31, 2020
Earnings per share
Net assets per share
Net income (loss) per share
Net assets per share
(85.21) yen
ReconciliationsOthersReportable segmenttotal
Reportable segment total
Sales
16,551
Summary Report on Financial Results for Fiscal Year Ended August 2021
15
(Million yen)
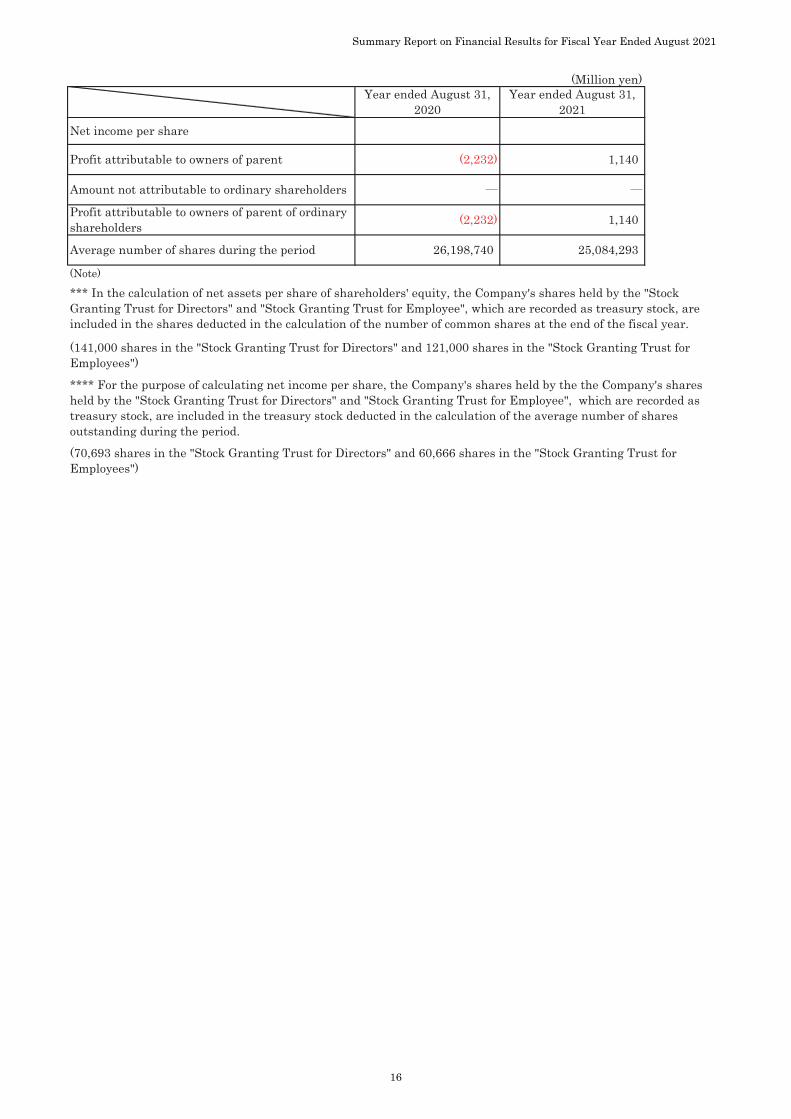
(Note)
**** For the purpose of calculating net income per share, the Company's shares held by the the Company's sharesheld by the "Stock Granting Trust for Directors" and "Stock Granting Trust for Employee", which are recorded astreasury stock, are included in the treasury stock deducted in the calculation of the average number of sharesoutstanding during the period.
(70,693 shares in the "Stock Granting Trust for Directors" and 60,666 shares in the "Stock Granting Trust forEmployees")
*** In the calculation of net assets per share of shareholders' equity, the Company's shares held by the "StockGranting Trust for Directors" and "Stock Granting Trust for Employee", which are recorded as treasury stock, areincluded in the shares deducted in the calculation of the number of common shares at the end of the fiscal year.
(141,000 shares in the "Stock Granting Trust for Directors" and 121,000 shares in the "Stock Granting Trust forEmployees")
26,198,740
(2,232)
(2,232)
Year ended August 31,2020
1,140
25,084,293Average number of shares during the period
Profit attributable to owners of parent of ordinaryshareholders
Amount not attributable to ordinary shareholders
1,140
Year ended August 31,2021
Net income per share
Profit attributable to owners of parent
Summary Report on Financial Results for Fiscal Year Ended August 2021
16


![Consolidated Financial Results for the Fiscal Year Ended ...Note: Comprehensive income Fiscal year ended March 31, 2019: ¥1,761 million [24.3%] Fiscal year ended March 31, 2018: ¥1,417](https://img.pdfslide.us/doc/110x75/5fe4d06806b4775830253106/consolidated-financial-results-for-the-fiscal-year-ended-note-comprehensive.jpg)


![[Japanese GAAP] : Freund Corporation · Fiscal year ended Feb. 29, 2020: 16,744,520 shares Fiscal year ended Feb. 28, 2019: 16,821,233 shares Reference: Summary of Non-consolidated](https://img.pdfslide.us/doc/110x75/5ece2710cebd7c0f84041010/japanese-gaap-freund-fiscal-year-ended-feb-29-2020-16744520-shares-fiscal.jpg)