Embed Size (px)
Citation preview

Lion Corporation Itsuo HamaRepresentative Director and President, Executive Officer
Financial Results for the First Half of 2016
August 3, 2016

Financial Results for the 1st Half of 2016
Financial Forecast for 2016
Initiatives under Vision2020
Contents

Financial Results for the 1st Half of 2016

4
2016
1st Half
2015
1st Half
Y-on-Y Change
Amount %
Net Sales 188,248 180,283 7,964 4.4
Operating Income
% of Sales
10,430
5.5
5,698
3.2
4,731
2.383.0
Ordinary Income
% of Sales
11,338
6.0
6,647
3.7
4,690
2.370.6
Profit attributable to
owners of parent
% of Sales
7,161
3.8
3,898
2.2
3,262
1.683.7
EPS 24.86 14.53 10.33 71.1
(Millions of yen)
Difference from forecast
Forecast as of the
beginning of the
year
Revised forecast
as of May. 9, 2016
3,248
1.8%
(1,752)
(0.9%)
3,930
60.5%
2,430
30.4%
4,338
62.0%
2,338
26.0%
3,161
79.0%
2,161
43.2%
FY2016 First Half Results
Record-high first-half income

5
(Millions of yen)
Sales Segment income (operating income)
2016
1st Half
2015
1st Half
Y-on-Y change 2016
1st Half
2015
1st Half
Y-on-Y change
Amount % Amount %
Consumer
Products135,714 129,293 6,421 5.0 6,155 2,527 3,628 143.5
Industrial
Products26,614 29,015 (2,400) (8.3) 1,249 691 558 80.7
Overseas 48,749 48,749 6,393 13.1 2,468 1,612 856 53.1
Other 14,320 14,320 (2,176) (15.2) 333 494 (161) (32.6)
Subtotal 229,615 221,378 8,237 3.7 10,207 5,326 4,881 91.7
Adjustment (41,367) (41,094) (272) - 222 372 (149) (40.2)
Consolidated
total188,248 180,283 7,964 4.4 10,430 5,698 4,731 83.0
Results by Business Segment
Profitability up in and outside Japan

6
Y-on-Y Changes in Operating Income
0 5 10 15
Operating income for Jan-Jun 2016
Other expenses
Competition expenses
Total cost reduction efforts(manufacturing and logistics costs)
Crude oil and vegetable oil prices
Sales, product mix and othres
Operating income for Jan-Jun 2015 5.6
10.4
+6.1
+1.5
+1.5
(4.0)
(0.3)
(Billions of yen)
Sales up and costs down, leading to increased income

7
Growth in both units sales and unit prices
outpaced the market
Sales value +4pp
Unit sales +3pp
Average unit price +1pp
Toothpastes +3pp
Toothbrushes +5pp
Topics: Oral Care
Difference in growth rates of Lion and the market (Oral care business)
Difference by category
(Jan.–June 2016, YoY , Lion survey)

8
( Lion survey )
Sales value +23pp
Unit sales +33pp
Entire
Market
Lion
products
Sales
value105% 128%
Unit
sales108% 141%
Entire
Market
Lion
products
Sales
value109% 126%
Unit
sales109% 127%
Driving growth in high-end categories
Sales value +17pp
Unit sales +18pp
Topics: Oral Care
¥500 and up toothpastesJan.–June 2016, YoY (%) Jan.–June 2016, YoY (%)
¥250 and up toothbrushes
Difference in growth rates of Lion and the market Difference in growth rates of Lion and the market

9
Antipyretic Analgesic 115%
Eye drops for middle-aged
and older users 110%
BUFFERIN PREMIUM
127%
Smile40 Premium
123%
Double-digit growth through expansion of high-end product lines
Topics: Pharmaceuticals
Lion’s sales growth rate (Jan.-June 2016, YoY)

10
Dishwashing detergent
CHARMY Magica111%
Super-Concentrated
Liquid Laundry Detergent
TOP SUPER NANOX108%
Reinforced profitability with
New high-value-added productsLion’s sales growth rate
(Jan.-June 2016, vs. planned sales)
Fabric Care / Living Care

11
Chemical Products category
・Indirect costs down, streamlining
・Synergies through integration
Detergent for Institutional Use category
・Securing new customers for ongoing growth
Topics: Industrial Products Business
Increased profitability by integrating businesses
Segment operating income ratio: 2.4% → 4.7%
2015 1H 2016 1H

12
Thailand 110%
Oral Care Products:109%
Beauty Care Products:115%
South Korea 109 %
Beauty Care Products:107%
Living Care Products:116%
Topics: Overseas Business
Ongoing profitable growth in key countries
Sales growth rate(Jan.-June 2016, YoY, local currency basis)

13
TaiwanNew sales/marketing company performing favorably 138%
MalaysiaSolidified No. 1 position in laundry detergent 119%
China Strong e-commerce sales 114%
IndonesiaContinued double-digit annualized growth 128%
Topics: Overseas Business
Business growth outpacing GDP growth
Sales growth rate (Jan.-June 2016, YoY, local currency basis)

Financial Forecast for 2016

15
ThailandSystema
Toothbrush
SingaporeTOP NANOX
Indonesiaposh
ChinaSystema
Toothpastes
Dent HealthToothpastes
Interdental Brushhadakara
Body Soap
SYSTEMA Haguki(the Gums) PlusNight Care Gel
Domestic
Overseas
Initiatives for Second Half of 2016
Launch, nurture high-value-added products in growth markets

16
2016 Consolidated Financial Forecast
2016
Revised
Forecast(Jul. 29, 2016)
2015Y-on-Y Change
Amount %
Net Sales 385,000 378,659 6,340 1.7
Operating
Income
% of Sales
21,000
5.5
16,374
4.34,625 28.2
Ordinary Income
% of Sales
22,000
5.7
18,099
4.83,900 21.6
Profit attributable to
owners of parent
% of Sales
13,000
3.4
10,680
2.82,319 21.7
EPS 44.73 39.35 5.38 13.7
V-2 Planfinal targets
(2017)
400,000
20,000
22,000
12,000
(Millions of yen)
Aiming to reach V-2 Plan targets early

17
Fiscal 2016 Dividend Forecast:Annual dividend of ¥11 per share,
up ¥1 year on year
●Basic policy of ongoing, stable returns
●Aiming for consolidated return ratio
of 30% through dividend payments
Shareholder Returns

Initiatives under Vision2020

19
Roadmap to Achieving the Vision
V-1 Plan
V-2 Plan
V-3 Plan
Accelerate profit structure reform,
lay foundation for new business growth
Rebuild the profit
structure
Further accelerate
business growth
2012 2015 2018 2020(Illustration of planned profit growth)
Reforms to achieve
Vision2020

20
Accelerate profit growth ahead of
market changes
Achieve profitable double-digit growth
Quickly establish new profitable businesses
Domestic
Overseas
New
Business
Reform Themes and Key Strategies
Building a strong business base for the future

21
Continuing Growth in Domestic Healthcare Market
0
500
1,000
1,500
2,000
2,500
3,000
2015 2020 2025 2030 2035
(%)
How Seniors Want to Use Money
(Hakuhodo Elder Business Development Division survey)
Toiletries Consumption Forecast by Age of
Head of Household(Spending × No. of households)
29 and
below
30-39
40-49
50-59
60 and over
(Billion yen)
(Toiletries market: The total of kitchen/household detergents, laundry detergents, toothpaste,
toothbrushes, body and facial soap. Lion survey.
Trav
el/l
eisu
re
Ho
bb
ies
Ord
inar
y ea
tin
g
Dis
eas
e a
nd
agi
ng
pre
ven
tio
n
Savi
ngs
/ass
et m
anag
emen
t
Mo
vies
, art
, p
erfo
rman
ces
Mai
nta
inin
g h
eal
th a
nd
yo
uth
fuln
ess
Tre
atin
g d
ise
ase
an
d a
gin
g
Ho
me
and
gar
den
Lear
nin
g an
d s
elf-
dev
elo
pm
ent
Clo
thin
g /
fash
ion
Mas
s m
edia
, in
tern
et u
se,
etc.
Co
smet
ics,
bea
uty
sal
on
s,
etc.
Rai
sin
g ch
ildre
n
Short term:
Ongoing market growth・Gradual rise in number of
households
・Firm demand for
healthcare products
from visitors to Japan
Long term:
Market structure changes
・Rising consumption by
seniors
・Growing demand for
high-value-added
healthcare products

22
• Launch high-value-added products
• Strengthen R&D and new development
Healthcare
• Concentrate investment on key markets
• Streamline business
Home care
Capture
demand
from seniors
Boost
profitability
Accelerating Profit Growth Ahead of Market Changes

23
Expand high-profit businesses
Speeding up Reinforcement of Domestic Profitability
• Stay ahead of structural changes in logistics
Build SCM framework
• Move into new channels
Improve sales framework
• More advanced digital marketing
Reinforce marketing

24
429 541 600 648
0
300
600
900
1,200
2010 2015 2020 2025
(Millions of households)
Growing populations, graying, growing middle class
Households in Asia by Income
(Lion survey)
High-income
Annual income: Over USD35k
Middle-income
Annual income: USD5–35k
Low-income
Annual income: Below USD5k
(“Asia”: China, Hong Kong, Taiwan, South Korea, India, Indonesia, Thailand, Vietnam, Singapore, Malaysia, the Philippines)
Additional Business Opportunities Overseas
Percent of Population Over 65 y/o by Country
(Source: Ministry of Land,
Infrastructure, Transport and
Tourism Statistics Bureau)
Japan 35.7%South Korea 34.5%
Singapore 31.3%
China 23.6%Thailand 21.4%
Indonesia 17.4%Malaysia 16.1%India 14.8%Philippines 14.2%
25
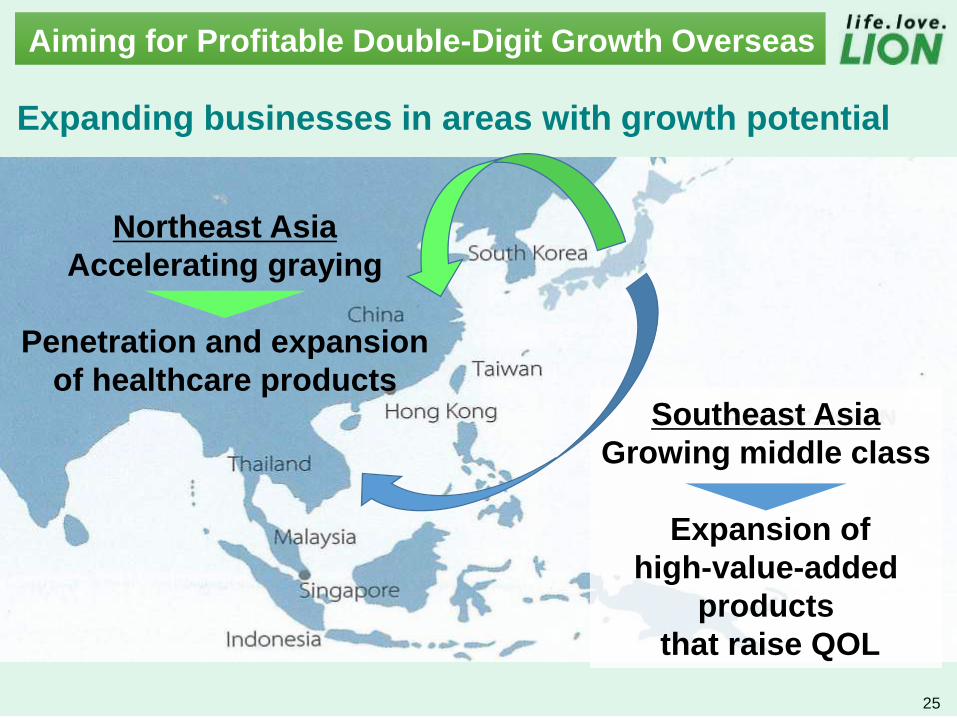
Aiming for Profitable Double-Digit Growth Overseas
Expanding businesses in areas with growth potential
Southeast Asia
Growing middle class
Expansion of
high-value-added
products
that raise QOL
Northeast Asia
Accelerating graying
Penetration and expansion
of healthcare products

26
Increase presence in Asia
Strengthen R&D and marketing in each area
Develop global brands
Shift toward personal care field
Accelerating Overseas Business Growth
Horizontal development of know-how with action tailored to each region

27
Quickly Establish New Profitable Businesses
Expanding the Wellness Direct business
Expand products labeled as functional foods
Secure new customers
Enhance products for cross-selling
Activate existing customers
Target further business expansion
Enhance business infrastructure
・Preventing
lifestyle
diseases
・Raising QOL
Providing value
for aging-related
needs

28
Growing from Oral Care to Oral Health Care
New oral
healthcare
business
●Raising awareness and
providing information
● Enhancing
coordination with
academia and
communities
●Salivary test system
●Support for preventive
dentistry clinics
●Enhance products for
dentistry clinics
Existing oral
care business
Professional care
Self-carePreventive dentistry
initiatives

29
Domestic business
Accelerate profit
growth ahead of
market changes
New businessQuickly
establish new
profitable
businesses
Overseas business
Achieve
profitable
double-digit
growth
V-2 Plan V-3 PlanV-1 Plan
Aiming for Further Success
Achieve
Vision2020
The forecasts and projected operating results contained in this
report are based on information available at the time of
preparation, and thus involve inherent risks and uncertainties.
Accordingly, readers are cautioned that actual results may differ
materially from those projected as a result of a variety of factors.
Note: Figures are rounded down to the digits that are displayed.

Reference Materials

32
Consolidated Statements of Income
(Millions of yen)
2016
1st Half
2015
1st Half
Y-o-Y Change
Amount %
Net sales 188,248 180,283 7,964 4.4
Cost of sales 77,460 78,846 (1,385) (1.8)
Gross profit 110,787 101,437 9,350 9.2
Selling, general and administrative expenses 100,357 95,738 4,618 4.8
Operating Income 10,430 5,698 4,731 83.0
Non-operating income 1,180 1,338 (157) (11.8)
Non-operating expenses 273 390 (116) (30.0)
Ordinary income 11,338 6,647 4,690 70.6
Extraordinary income - 755 (755) -
Extraordinary loss 731 955 (224) (23.5)
Profit before income taxes 10,607 6,447 4,160 64.5
Income taxes 2,989 1,300 1,689 129.9
Adjustment of income taxes (125) 613 (738) -
Profit 7,743 4,533 3,209 70.8
Profit attributable to owners of parent 7,161 3,898 3,262 83.7

33
Selling, General and Administrative Expenses
2016 1st Half 2015 1st Half Y-o-Y Change
Amount % of sales Amount % of salesMillions of
yen%
Selling, general and
administrative expenses100,357 53.3 95,738 53.1 4,618 4.8
Sales commission 4,032 2.1 3,890 2.2 142 3.7
Promotion expenses 44,363 23.6 42,221 23.4 2,141 5.1
Advertising expenses 14,196 7.5 12,502 6.9 1,693 13.5
Transportation and
warehousing expenses8,617 4.6 8,244 4.6 373 4.5
Salaries and allowances 7,322 3.9 7,266 4.0 55 0.8
Research and
development expenses4,777 2.5 4,761 2.6 15 0.3
Other 17,046 9.1 16,851 9.3 195 1.2
(Millions of yen)

34
Significant Extraordinary Income or Loss
2016 Jan-Jun 2015 Jan-Jun
Extraordinary
income
Gain on disposal of noncurrent
assets-
Gain on disposal of noncurrent
assets615
Gain on sales of investment
securities-
Gain on sales of investment
securities139
Total - Total 755
Extraordinary
loss
Loss on disposal of noncurrent
assets436
Loss on disposal of noncurrent
assets781
Impairment loss 59 Impairment loss 173
Other 235 Other -
Total 731 Total 955
(Millions of yen)

35
Consolidated Balance Sheets (Selected) I
2016 1st Half(Ended Jun. 30, 2016)
2015(Ended Dec. 30, 2015) Change
Current assets 153,756 166,830 (13,074)
Cash and deposits 19,132 18,584 548
Notes and accounts receivable-trade 50,597 58,655 (8,058)
Short-term investments 37,889 45,919 (8,030)
Inventories 40,424 37,554 2,869
Noncurrent assets 111,047 115,603 (4,555)
Property, plant and equipment 72,338 75,060 (2,722)
Intangible assets 4,312 5,921 (1,608)
Investments and other assets 34,396 34,622 (225)
Total assets 264,804 282,434 (17,630)
(Millions of yen)
36
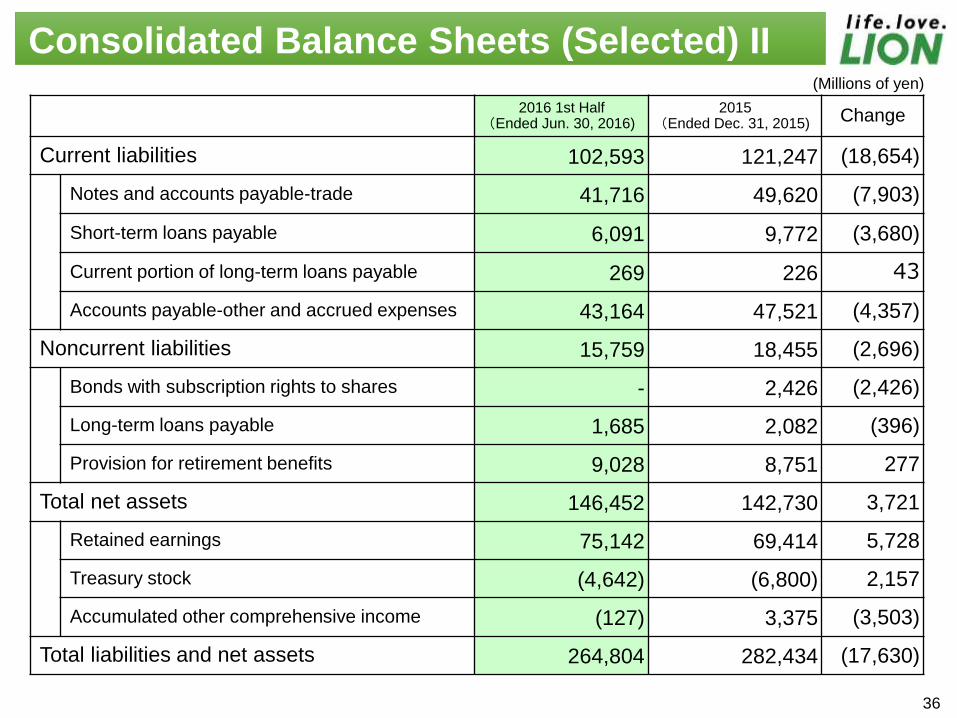
Consolidated Balance Sheets (Selected) II
2016 1st Half(Ended Jun. 30, 2016)
2015(Ended Dec. 31, 2015) Change
Current liabilities 102,593 121,247 (18,654)
Notes and accounts payable-trade 41,716 49,620 (7,903)
Short-term loans payable 6,091 9,772 (3,680)
Current portion of long-term loans payable 269 226 43
Accounts payable-other and accrued expenses 43,164 47,521 (4,357)
Noncurrent liabilities 15,759 18,455 (2,696)
Bonds with subscription rights to shares - 2,426 (2,426)
Long-term loans payable 1,685 2,082 (396)
Provision for retirement benefits 9,028 8,751 277
Total net assets 146,452 142,730 3,721
Retained earnings 75,142 69,414 5,728
Treasury stock (4,642) (6,800) 2,157
Accumulated other comprehensive income (127) 3,375 (3,503)
Total liabilities and net assets 264,804 282,434 (17,630)
(Millions of yen)
37
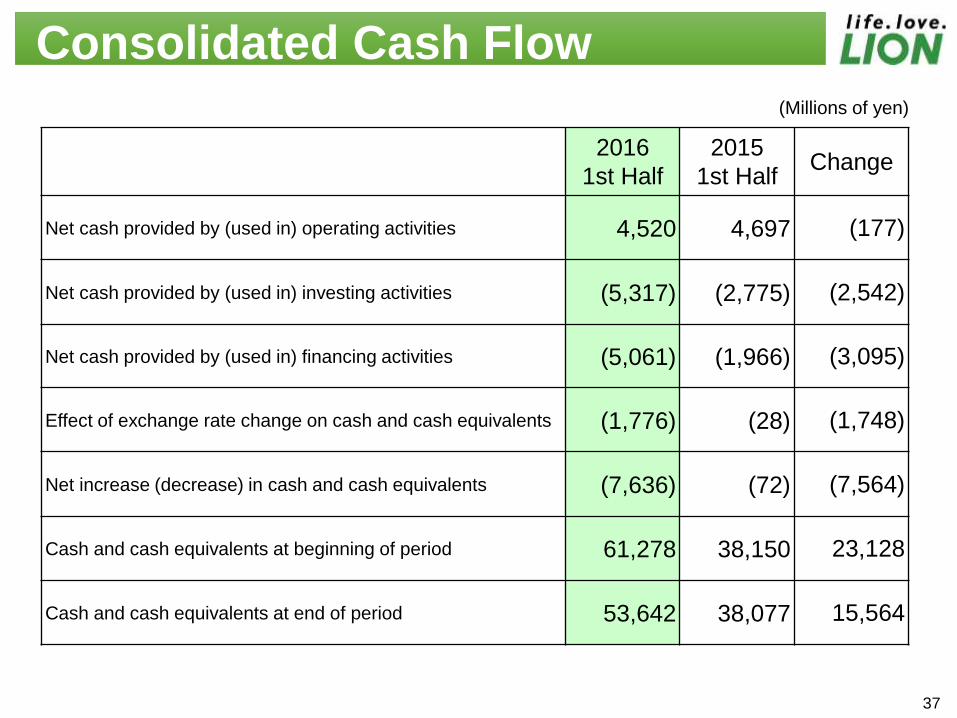
Consolidated Cash Flow
2016
1st Half
2015
1st HalfChange
Net cash provided by (used in) operating activities 4,520 4,697 (177)
Net cash provided by (used in) investing activities (5,317) (2,775) (2,542)
Net cash provided by (used in) financing activities (5,061) (1,966) (3,095)
Effect of exchange rate change on cash and cash equivalents (1,776) (28) (1,748)
Net increase (decrease) in cash and cash equivalents (7,636) (72) (7,564)
Cash and cash equivalents at beginning of period 61,278 38,150 23,128
Cash and cash equivalents at end of period 53,642 38,077 15,564
(Millions of yen)

38
Results by business segment(Millions of yen)
Sales Segment income (operating income)
2016
1st Half
Y-on-Y change 2016
1st Half
Y-on-Y change
Amount % Amount %
Consumer
Products
135,714 6,421 5.06,155 3,628 143.5
122,597 6,051 5.2
Industrial
Products
26,614 (2,400) (8.3)1,249 558 80.7
15,202 309 2.1
Overseas55,142 6,393 13.1
2,468 856 53.149,182 3,658 8.0
Other12,143 (2,176) (15.2)
333 (161) (32.6)1,265 (2,054) (61.9)
Subtotal 229,615 8,237 3.7 10,207 4,881 91.7
Consolidated
total188,248 7,964 4.4 10,430 4,731 83.0
Sales: The upper row for each segment shows gross sales, while the bottom row shows sales to external customers.
Operating income: “Subtotal” shows segment income before the elimination of intersegment transactions, while
“Consolidated total” shows the total income of all consolidated segments after adjustments.

39
Overseas Sales Results by Region
2016
1st Half
2015
1st HalfY-on-Y
Change
Y-on-Y
Change(%)
Southeast
Asia 37,811 31,922 5,888 18.4
Northeast
Asia17,331 16,826 504 3.0
Total 55,142 48,749 6,393 13.1
Southeast Asia :Thailand, Malaysia, Singapore, Philippinesand Indonesia (PT. IPPOSHA INDONESIA)
Northeast Asia :South Korea, China, Taiwan and Hong Kong
(Millions of yen)

40
2016Revised Forecast
(Aug. 3, 2016)
2015Y-o-Y Change
Amount %
Consumer
Products258,500 247,978 10,521 4.2
Industrial
Products30,000 30,805 (806) (2.6)
Overseas 94,000 93,903 96 0.1
Other 2,500 5,972 (3,473) (58.1)
Total 385,000 378,659 6,340 1.7
By business segment
Net sales to external customers
2016 Consolidated Financial Forecast
(Millions of yen)
41
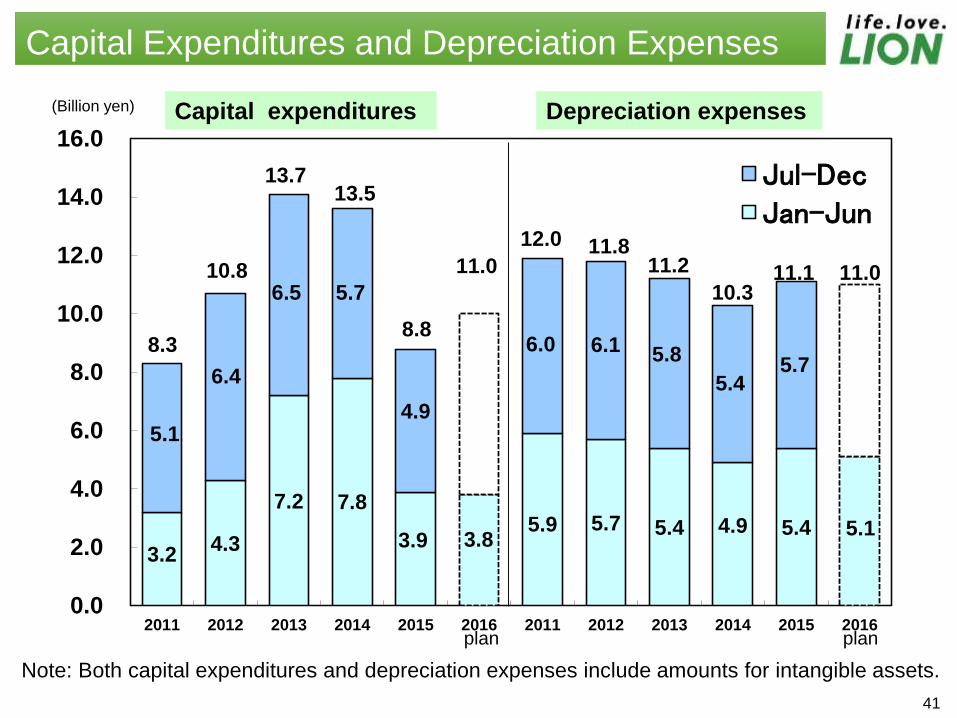
3.24.3
7.2 7.8
3.95.9 5.7 5.4 4.9 5.4
8.3
13.5
6.0 6.1 5.8
5.45.7
0.0
2.0
4.0
6.0
8.0
10.0
12.0
14.0
16.0
2011 2012 2013 2014 2015 2016 2011 2012 2013 2014 2015 2016
Jul-DecJan-Jun
10.8
12.0
10.3
11.2
13.7
11.1
11.8
8.8
11.0 11.0
6.4
6.5 5.7
4.9
3.85.1
5.1
Capital Expenditures and Depreciation Expenses
plan
Capital expenditures Depreciation expenses(Billion yen)
Note: Both capital expenditures and depreciation expenses include amounts for intangible assets.
plan
42
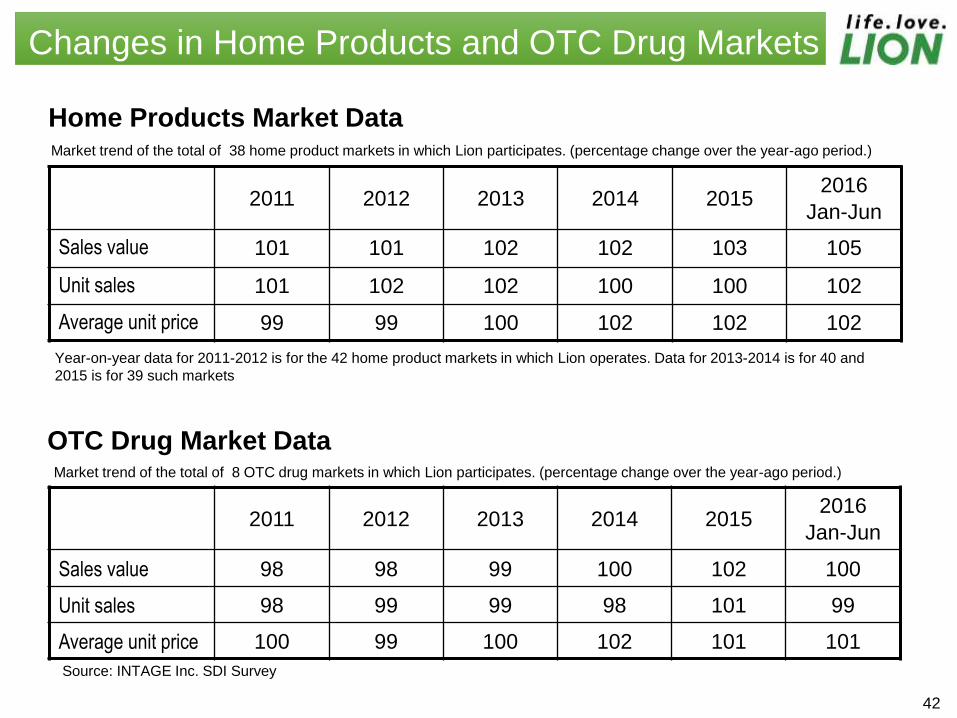
Market trend of the total of 38 home product markets in which Lion participates. (percentage change over the year-ago period.)
2011 2012 2013 2014 20152016
Jan-Jun
Sales value 101 101 102 102 103 105
Unit sales 101 102 102 100 100 102
Average unit price 99 99 100 102 102 102
OTC Drug Market Data
2011 2012 2013 2014 20152016
Jan-Jun
Sales value 98 98 99 100 102 100
Unit sales 98 99 99 98 101 99
Average unit price 100 99 100 102 101 101
Market trend of the total of 8 OTC drug markets in which Lion participates. (percentage change over the year-ago period.)
Home Products Market Data
Source: INTAGE Inc. SDI Survey
Year-on-year data for 2011-2012 is for the 42 home product markets in which Lion operates. Data for 2013-2014 is for 40 and
2015 is for 39 such markets
Changes in Home Products and OTC Drug Markets

43
Assumptions for Raw Material Prices and Currency
Crude oil (Dubai) Domestic naphtha Crude palm oil
2016 Jul-Dec
forecastsUSD45/BBL JPY35,000/KL MYR2,600/ton
US Dollar Thai Baht Korean Won
2016 Jul-Dec
forecastsJPY105.0 JPY3.0 JPY0.092
Raw material prices
Currency