Embed Size (px)
Citation preview
Confidential & Proprietary
1
Wabtec 3rd Quarter 2021Financial Results & Company Highlights
October 27, 2021
2
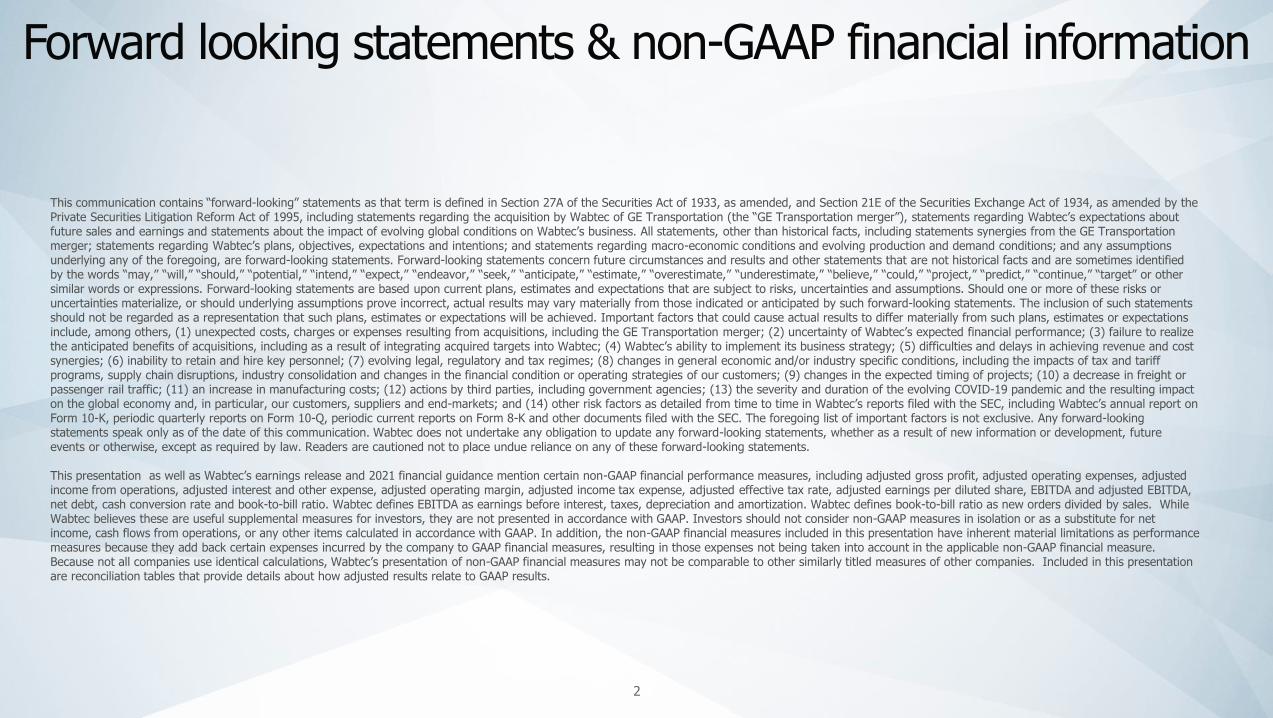
Forward looking statements & non-GAAP financial information
This communication contains “forward-looking” statements as that term is defined in Section 27A of the Securities Act of 1933, as amended, and Section 21E of the Securities Exchange Act of 1934, as amended by the Private Securities Litigation Reform Act of 1995, including statements regarding the acquisition by Wabtec of GE Transportation (the “GE Transportation merger”), statements regarding Wabtec’s expectations about future sales and earnings and statements about the impact of evolving global conditions on Wabtec’s business. All statements, other than historical facts, including statements synergies from the GE Transportation merger; statements regarding Wabtec’s plans, objectives, expectations and intentions; and statements regarding macro-economic conditions and evolving production and demand conditions; and any assumptions underlying any of the foregoing, are forward-looking statements. Forward-looking statements concern future circumstances and results and other statements that are not historical facts and are sometimes identified by the words “may,” “will,” “should,” “potential,” “intend,” “expect,” “endeavor,” “seek,” “anticipate,” “estimate,” “overestimate,” “underestimate,” “believe,” “could,” “project,” “predict,” “continue,” “target” or other similar words or expressions. Forward-looking statements are based upon current plans, estimates and expectations that are subject to risks, uncertainties and assumptions. Should one or more of these risks or uncertainties materialize, or should underlying assumptions prove incorrect, actual results may vary materially from those indicated or anticipated by such forward-looking statements. The inclusion of such statements should not be regarded as a representation that such plans, estimates or expectations will be achieved. Important factors that could cause actual results to differ materially from such plans, estimates or expectations include, among others, (1) unexpected costs, charges or expenses resulting from acquisitions, including the GE Transportation merger; (2) uncertainty of Wabtec’s expected financial performance; (3) failure to realize the anticipated benefits of acquisitions, including as a result of integrating acquired targets into Wabtec; (4) Wabtec’s ability to implement its business strategy; (5) difficulties and delays in achieving revenue and cost synergies; (6) inability to retain and hire key personnel; (7) evolving legal, regulatory and tax regimes; (8) changes in general economic and/or industry specific conditions, including the impacts of tax and tariff programs, supply chain disruptions, industry consolidation and changes in the financial condition or operating strategies of our customers; (9) changes in the expected timing of projects; (10) a decrease in freight or passenger rail traffic; (11) an increase in manufacturing costs; (12) actions by third parties, including government agencies; (13) the severity and duration of the evolving COVID-19 pandemic and the resulting impact on the global economy and, in particular, our customers, suppliers and end-markets; and (14) other risk factors as detailed from time to time in Wabtec’s reports filed with the SEC, including Wabtec’s annual report on Form 10-K, periodic quarterly reports on Form 10-Q, periodic current reports on Form 8-K and other documents filed with the SEC. The foregoing list of important factors is not exclusive. Any forward-looking statements speak only as of the date of this communication. Wabtec does not undertake any obligation to update any forward-looking statements, whether as a result of new information or development, future events or otherwise, except as required by law. Readers are cautioned not to place undue reliance on any of these forward-looking statements.
This presentation as well as Wabtec’s earnings release and 2021 financial guidance mention certain non-GAAP financial performance measures, including adjusted gross profit, adjusted operating expenses, adjusted income from operations, adjusted interest and other expense, adjusted operating margin, adjusted income tax expense, adjusted effective tax rate, adjusted earnings per diluted share, EBITDA and adjusted EBITDA, net debt, cash conversion rate and book-to-bill ratio. Wabtec defines EBITDA as earnings before interest, taxes, depreciation and amortization. Wabtec defines book-to-bill ratio as new orders divided by sales. While Wabtec believes these are useful supplemental measures for investors, they are not presented in accordance with GAAP. Investors should not consider non-GAAP measures in isolation or as a substitute for net income, cash flows from operations, or any other items calculated in accordance with GAAP. In addition, the non-GAAP financial measures included in this presentation have inherent material limitations as performance measures because they add back certain expenses incurred by the company to GAAP financial measures, resulting in those expenses not being taken into account in the applicable non-GAAP financial measure. Because not all companies use identical calculations, Wabtec’s presentation of non-GAAP financial measures may not be comparable to other similarly titled measures of other companies. Included in this presentation are reconciliation tables that provide details about how adjusted results relate to GAAP results.

3
Today’s participants
Rafael SantanaPresident &
Chief Executive Officer
John OlinExecutive Vice President &
Chief Financial Officer
Kristine KubackiVice President,
Investor Relations
PRESENTERS INVESTOR
RELATIONS
4
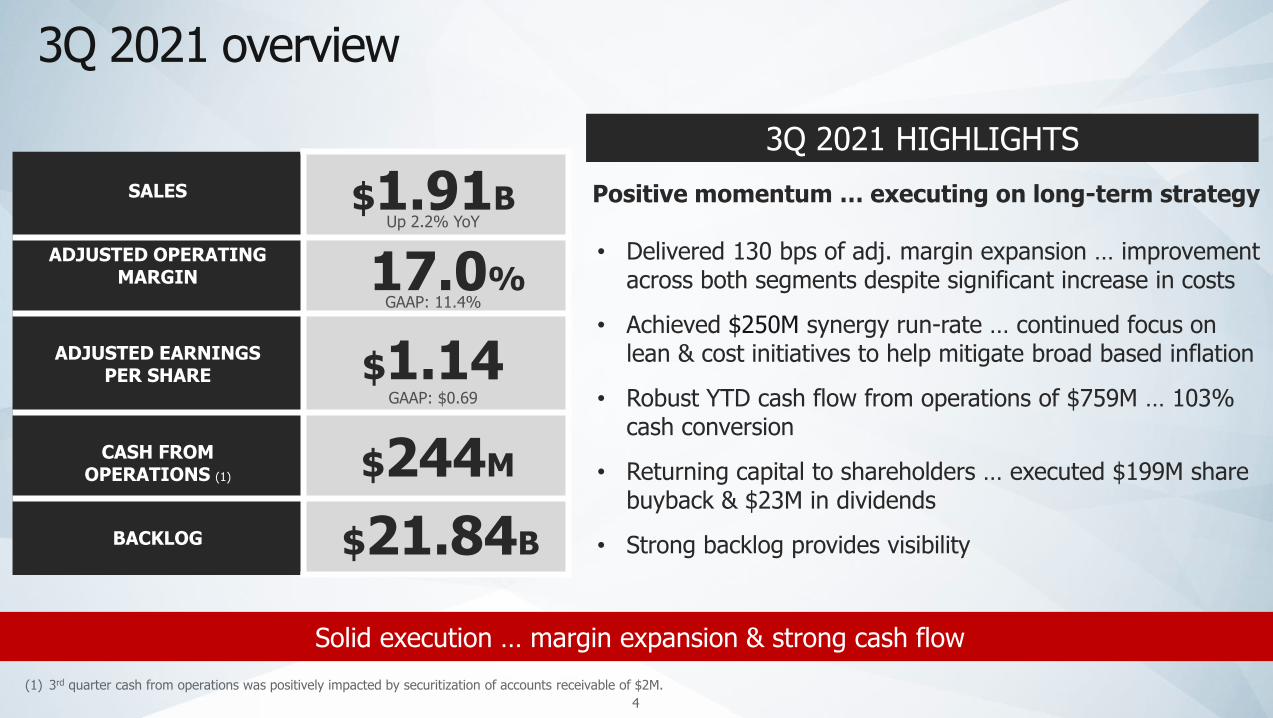
3Q 2021 overview
(1) 3rd quarter cash from operations was positively impacted by securitization of accounts receivable of $2M.
SALES
ADJUSTED OPERATING MARGIN
ADJUSTED EARNINGS PER SHARE
CASH FROM OPERATIONS (1)
BACKLOG
$1.14GAAP: $0.69
$1.91B
17.0%
$244M
$21.84B
• Delivered 130 bps of adj. margin expansion … improvement across both segments despite significant increase in costs
• Achieved $250M synergy run-rate … continued focus on lean & cost initiatives to help mitigate broad based inflation
• Robust YTD cash flow from operations of $759M … 103% cash conversion
• Returning capital to shareholders … executed $199M share buyback & $23M in dividends
• Strong backlog provides visibility
3Q 2021 HIGHLIGHTS
GAAP: 11.4%
Positive momentum … executing on long-term strategy
Solid execution … margin expansion & strong cash flow
Up 2.2% YoY
5
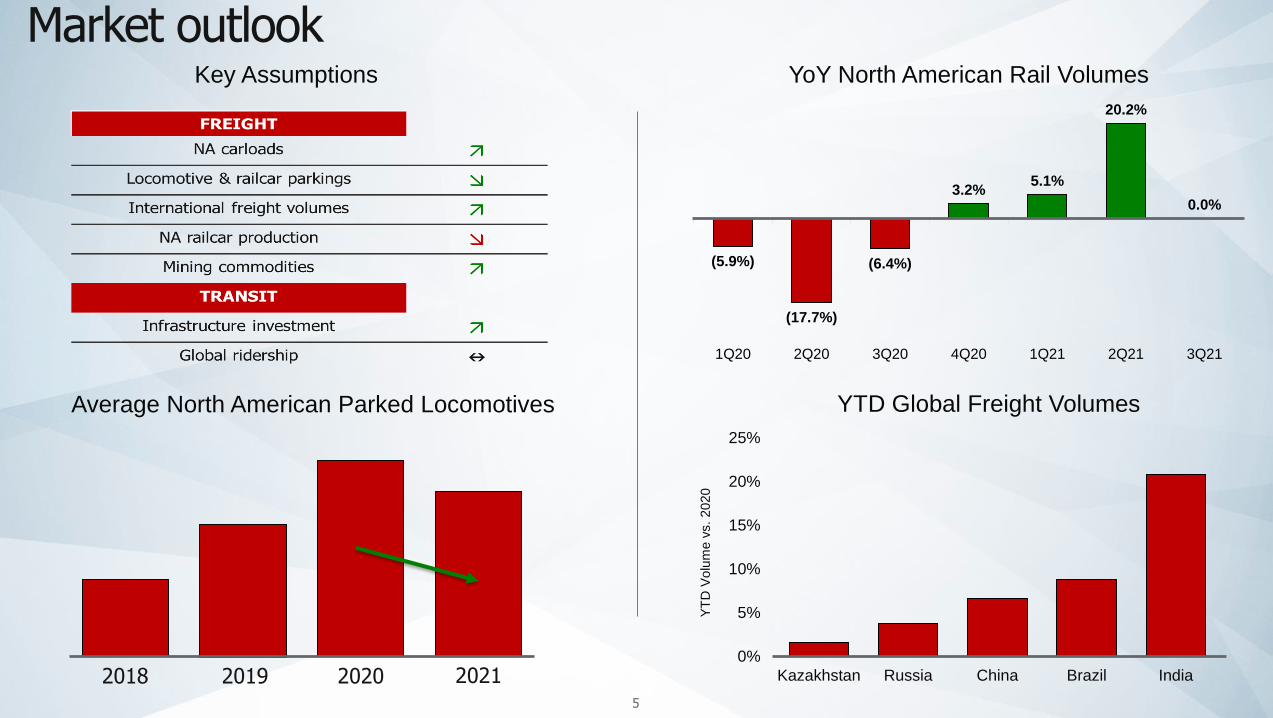
Market outlook
Average North American Parked Locomotives
Key Assumptions
YTD Global Freight Volumes
2018 2019 2020 2021
YoY North American Rail Volumes
(5.9%)
(17.7%)
(6.4%)
3.2% 5.1%
20.2%
0.0%
1Q20 2Q20 3Q20 4Q20 1Q21 2Q21 3Q21
0%
5%
10%
15%
20%
25%
Kazakhstan Russia China Brazil India
YT
D V
olu
me v
s.
2020
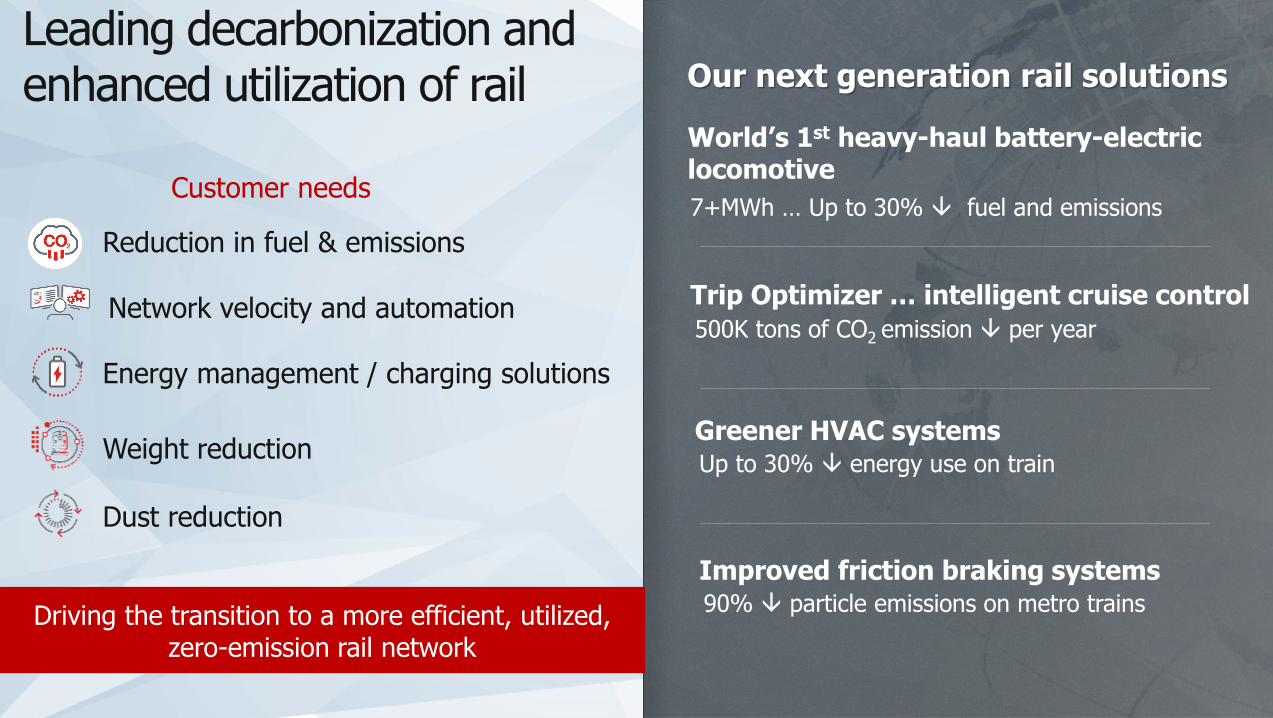
Leading decarbonization and enhanced utilization of rail
Energy management / charging solutions
Weight reduction
Dust reduction
Reduction in fuel & emissions
Driving the transition to a more efficient, utilized, zero-emission rail network
World’s 1st heavy-haul battery-electric locomotive
7+MWh … Up to 30% fuel and emissions
Trip Optimizer … intelligent cruise control
500K tons of CO2 emission per year
Greener HVAC systems Up to 30% energy use on train
Improved friction braking systems90% particle emissions on metro trains
Our next generation rail solutions
Customer needs
Network velocity and automation
7
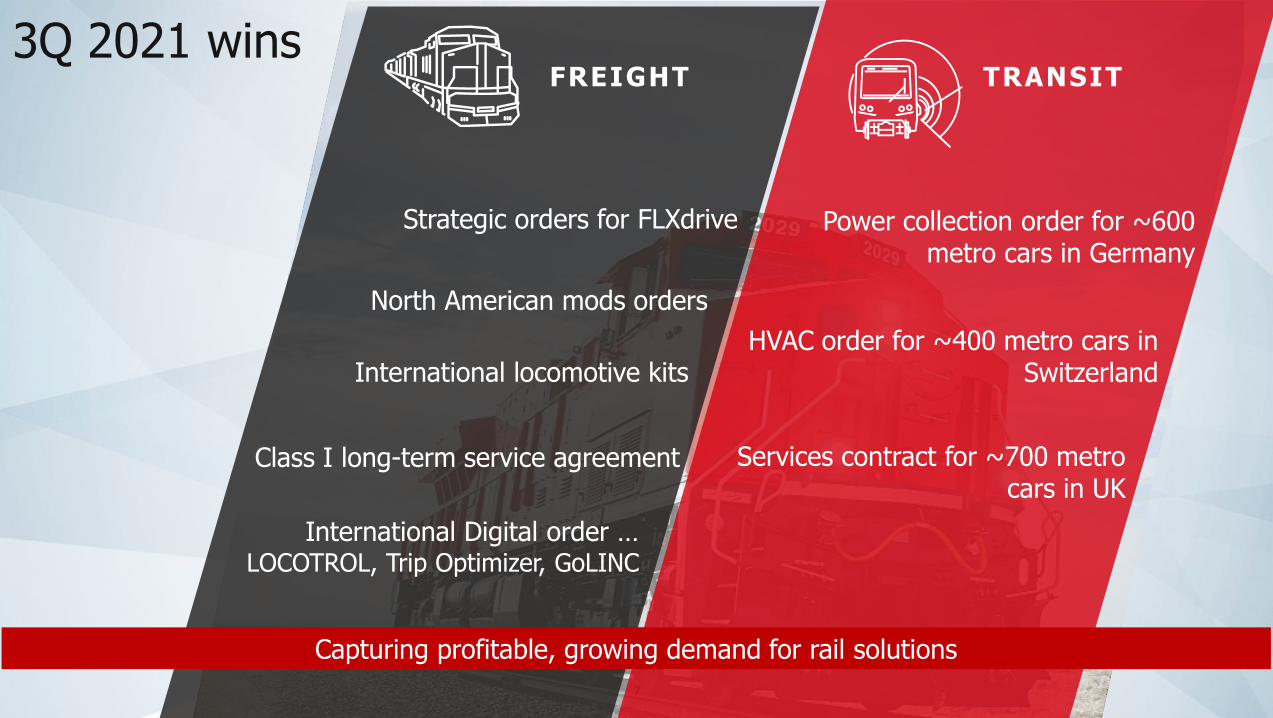
3Q 2021 wins
Class I long-term service agreement
International locomotive kits
Power collection order for ~600 metro cars in Germany
Capturing profitable, growing demand for rail solutions
Strategic orders for FLXdrive
North American mods orders
FREIGHT TRANSIT
HVAC order for ~400 metro cars in Switzerland
Services contract for ~700 metro cars in UK
International Digital order … LOCOTROL, Trip Optimizer, GoLINC
8
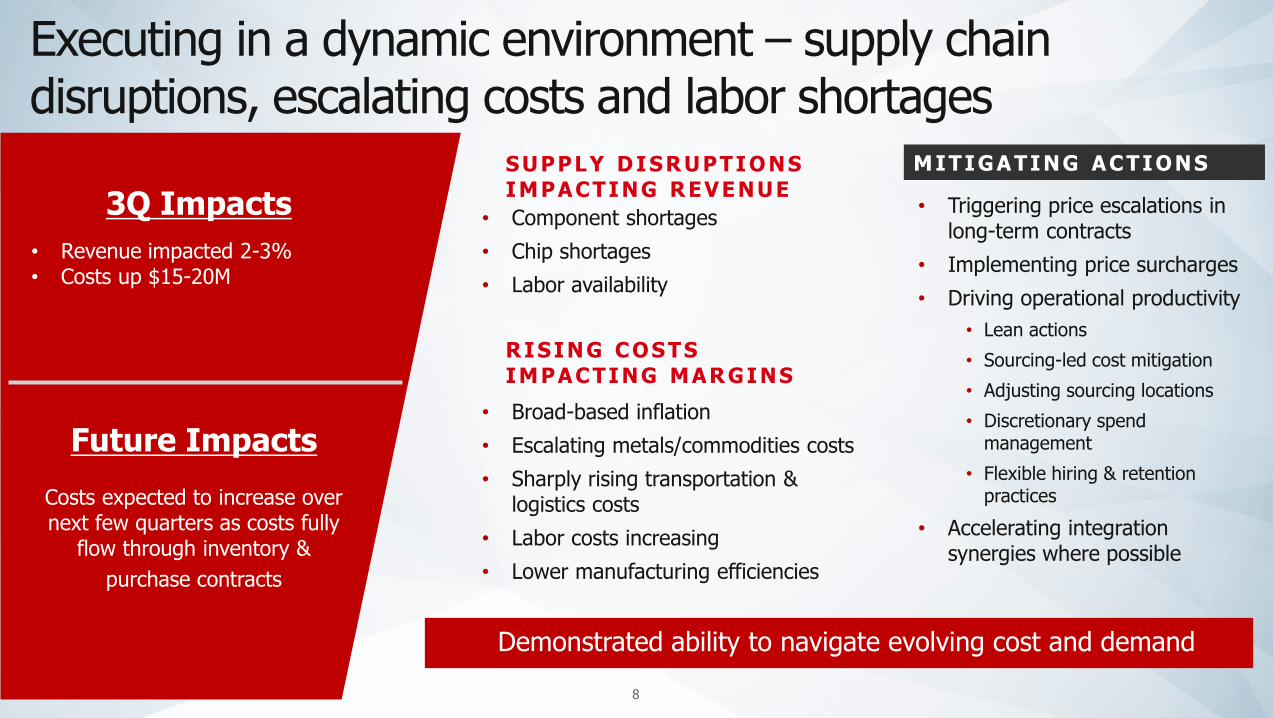
RISING COSTS IMPACTING MARGINS
MITIGATING ACTIONS
Executing in a dynamic environment – supply chain disruptions, escalating costs and labor shortages
3Q Impacts
• Revenue impacted 2-3%• Costs up $15-20M
Future Impacts
Costs expected to increase over next few quarters as costs fully
flow through inventory &
purchase contracts
Demonstrated ability to navigate evolving cost and demand
SUPPLY DISRUPTI ONS IMPACTING REVENUE
• Broad-based inflation
• Escalating metals/commodities costs
• Sharply rising transportation & logistics costs
• Labor costs increasing
• Lower manufacturing efficiencies
• Component shortages
• Chip shortages
• Labor availability
• Triggering price escalations in long-term contracts
• Implementing price surcharges
• Driving operational productivity
• Lean actions
• Sourcing-led cost mitigation
• Adjusting sourcing locations
• Discretionary spend management
• Flexible hiring & retention practices
• Accelerating integration synergies where possible
9
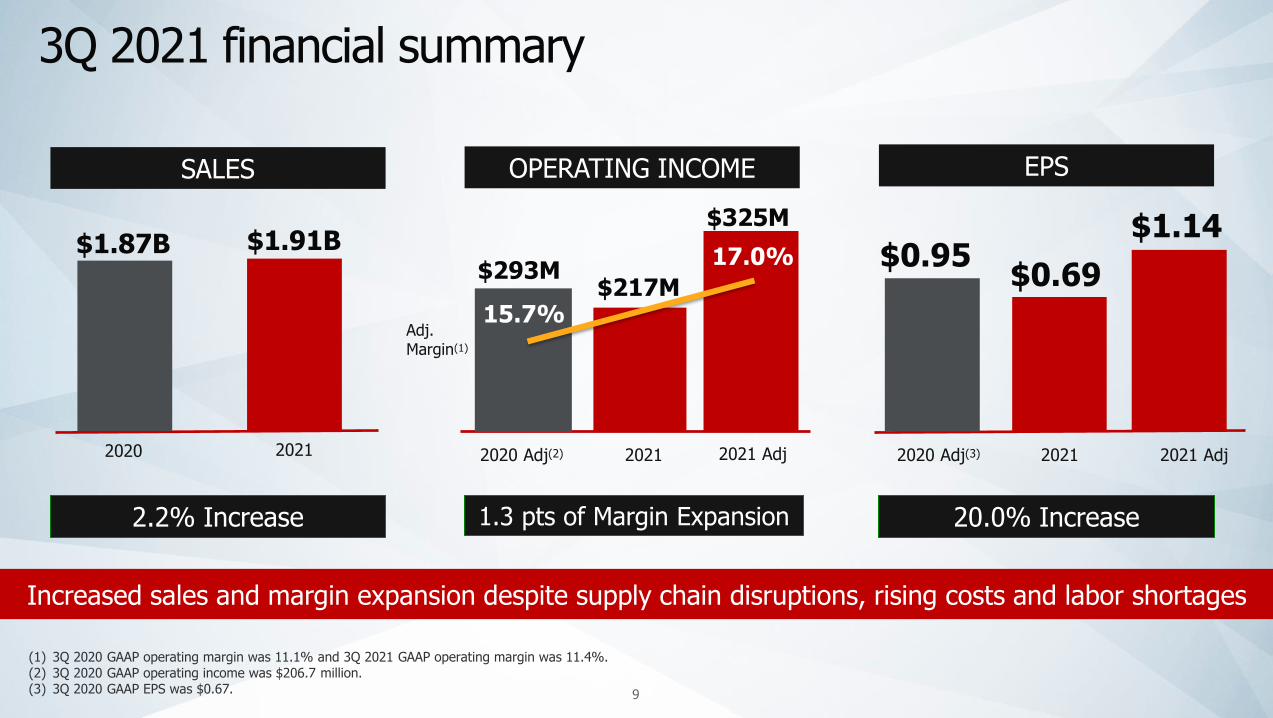
3Q 2021 financial summary
SALES
2021
OPERATING INCOME
2021
EPS
2021 Adj2020 Adj(3) 2021 2020 2021 Adj2020 Adj(2)
$1.91B
$217M $0.69$1.87B
$293M
$325M
$0.95$1.14
Adj. Margin(1)
15.7%
17.0%
(1) 3Q 2020 GAAP operating margin was 11.1% and 3Q 2021 GAAP operating margin was 11.4%.(2) 3Q 2020 GAAP operating income was $206.7 million.(3) 3Q 2020 GAAP EPS was $0.67.
Increased sales and margin expansion despite supply chain disruptions, rising costs and labor shortages
2.2% Increase 1.3 pts of Margin Expansion 20.0% Increase
10
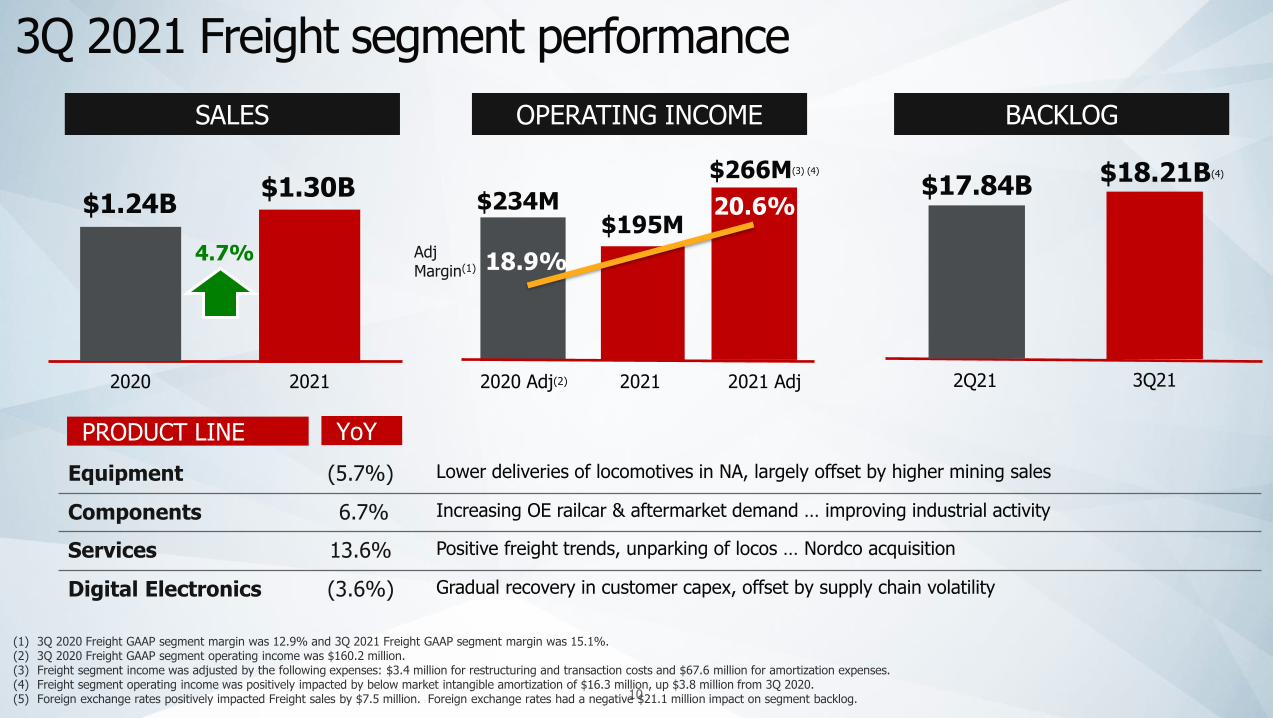
3Q 2021 Freight segment performance
PRODUCT LINE YoY
Equipment (5.7%) Lower deliveries of locomotives in NA, largely offset by higher mining sales
Components 6.7% Increasing OE railcar & aftermarket demand … improving industrial activity
Services 13.6% Positive freight trends, unparking of locos … Nordco acquisition
Digital Electronics (3.6%) Gradual recovery in customer capex, offset by supply chain volatility
SALES
2021
OPERATING INCOME
2021
BACKLOG
3Q212Q212020 2021 Adj2020 Adj(2)
$1.30B
$195M$1.24B $234M
$266M(3) (4)
$17.84B$18.21B(4)
18.9%
20.6%
4.7%
(1) 3Q 2020 Freight GAAP segment margin was 12.9% and 3Q 2021 Freight GAAP segment margin was 15.1%. (2) 3Q 2020 Freight GAAP segment operating income was $160.2 million.(3) Freight segment income was adjusted by the following expenses: $3.4 million for restructuring and transaction costs and $67.6 million for amortization expenses. (4) Freight segment operating income was positively impacted by below market intangible amortization of $16.3 million, up $3.8 million from 3Q 2020. (5) Foreign exchange rates positively impacted Freight sales by $7.5 million. Foreign exchange rates had a negative $21.1 million impact on segment backlog.
Adj Margin(1)
11
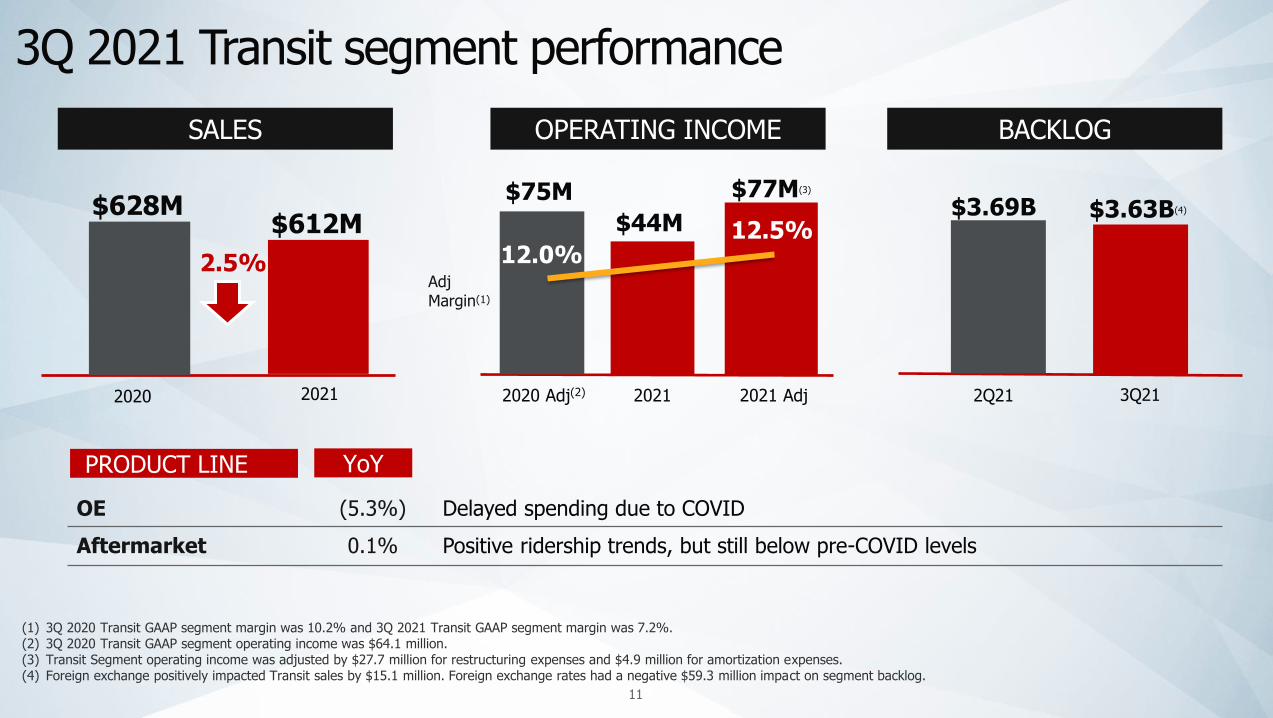
3Q 2021 Transit segment performance
PRODUCT LINE YoY
OE (5.3%) Delayed spending due to COVID
Aftermarket 0.1% Positive ridership trends, but still below pre-COVID levels
SALES
2021
OPERATING INCOME
2021
BACKLOG
3Q212Q212020 2021 Adj2020 Adj(2)
$612M $44M$628M
$75M $77M(3)
$3.69B $3.63B(4)
12.0%12.5%
(1) 3Q 2020 Transit GAAP segment margin was 10.2% and 3Q 2021 Transit GAAP segment margin was 7.2%. (2) 3Q 2020 Transit GAAP segment operating income was $64.1 million.(3) Transit Segment operating income was adjusted by $27.7 million for restructuring expenses and $4.9 million for amortization expenses.(4) Foreign exchange positively impacted Transit sales by $15.1 million. Foreign exchange rates had a negative $59.3 million impact on segment backlog.
Adj Margin(1)
2.5%
12
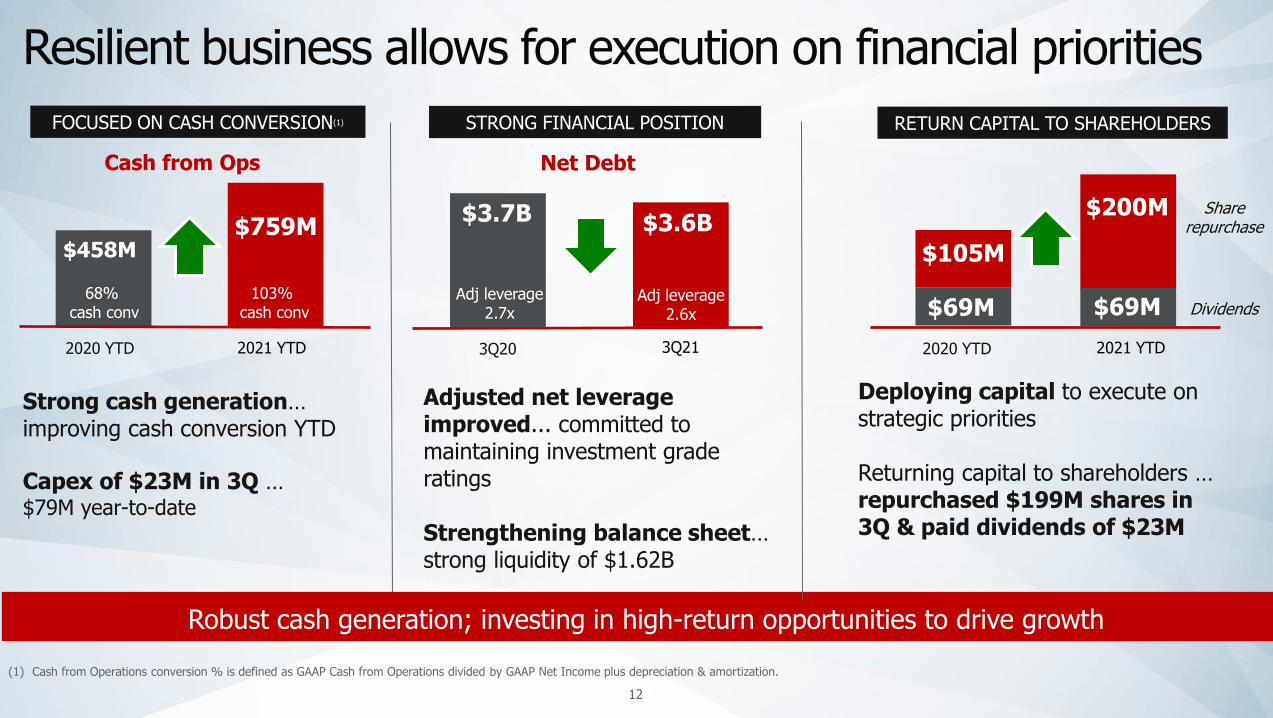
Resilient business allows for execution on financial priorities
FOCUSED ON CASH CONVERSION(1)
2021 YTD2020 YTD
$458M$759M
Cash from Ops
Strong cash generation…improving cash conversion YTD
Capex of $23M in 3Q … $79M year-to-date
STRONG FINANCIAL POSITION
3Q213Q20
$3.6B
Net Debt
$3.7B
Adjusted net leverage improved... committed to maintaining investment grade ratings
Strengthening balance sheet… strong liquidity of $1.62B
Robust cash generation; investing in high-return opportunities to drive growth
Adj leverage2.7x
RETURN CAPITAL TO SHAREHOLDERS
2021 YTD2020 YTD
$200M
$105M
Deploying capital to execute on strategic priorities
Returning capital to shareholders … repurchased $199M shares in 3Q & paid dividends of $23M
Adj leverage2.6x
103%cash conv
(1) Cash from Operations conversion % is defined as GAAP Cash from Operations divided by GAAP Net Income plus depreciation & amortization.
68%cash conv $69M $69M
Share repurchase
Dividends
13
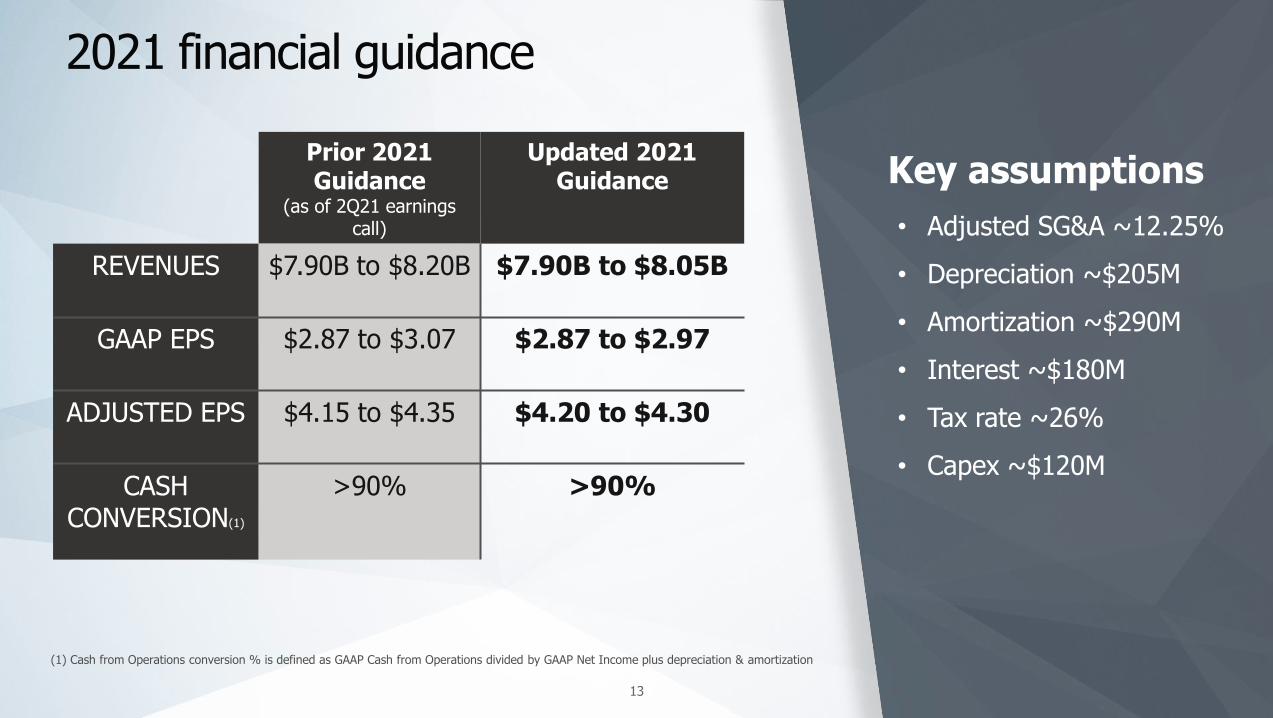
2021 financial guidance
(1) Cash from Operations conversion % is defined as GAAP Cash from Operations divided by GAAP Net Income plus depreciation & amortization
Key assumptions
• Adjusted SG&A ~12.25%
• Depreciation ~$205M
• Amortization ~$290M
• Interest ~$180M
• Tax rate ~26%
• Capex ~$120M
Prior 2021 Guidance
(as of 2Q21 earnings call)
Updated 2021 Guidance
REVENUES $7.90B to $8.20B $7.90B to $8.05B
GAAP EPS $2.87 to $3.07 $2.87 to $2.97
ADJUSTED EPS $4.15 to $4.35 $4.20 to $4.30
CASH CONVERSION(1)
>90% >90%
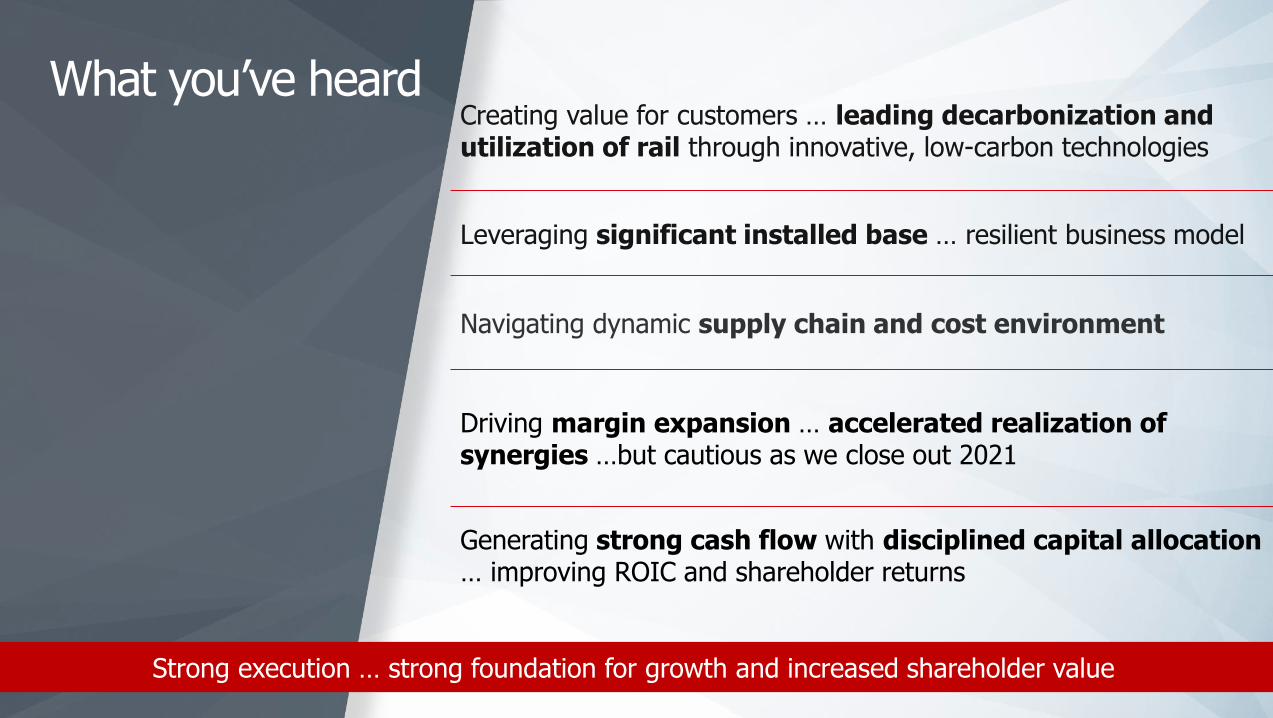
What you’ve heardCreating value for customers … leading decarbonization and utilization of rail through innovative, low-carbon technologies
Leveraging significant installed base … resilient business model
Navigating dynamic supply chain and cost environment
Driving margin expansion … accelerated realization of synergies …but cautious as we close out 2021
Generating strong cash flow with disciplined capital allocation … improving ROIC and shareholder returns
Strong execution … strong foundation for growth and increased shareholder value

16
Appendix
17
Income statement
Appendix A ( 1 of 2)
18
Appendix A ( 2 of 2)
Income statement(cont.)
2021 2020 2021 2020
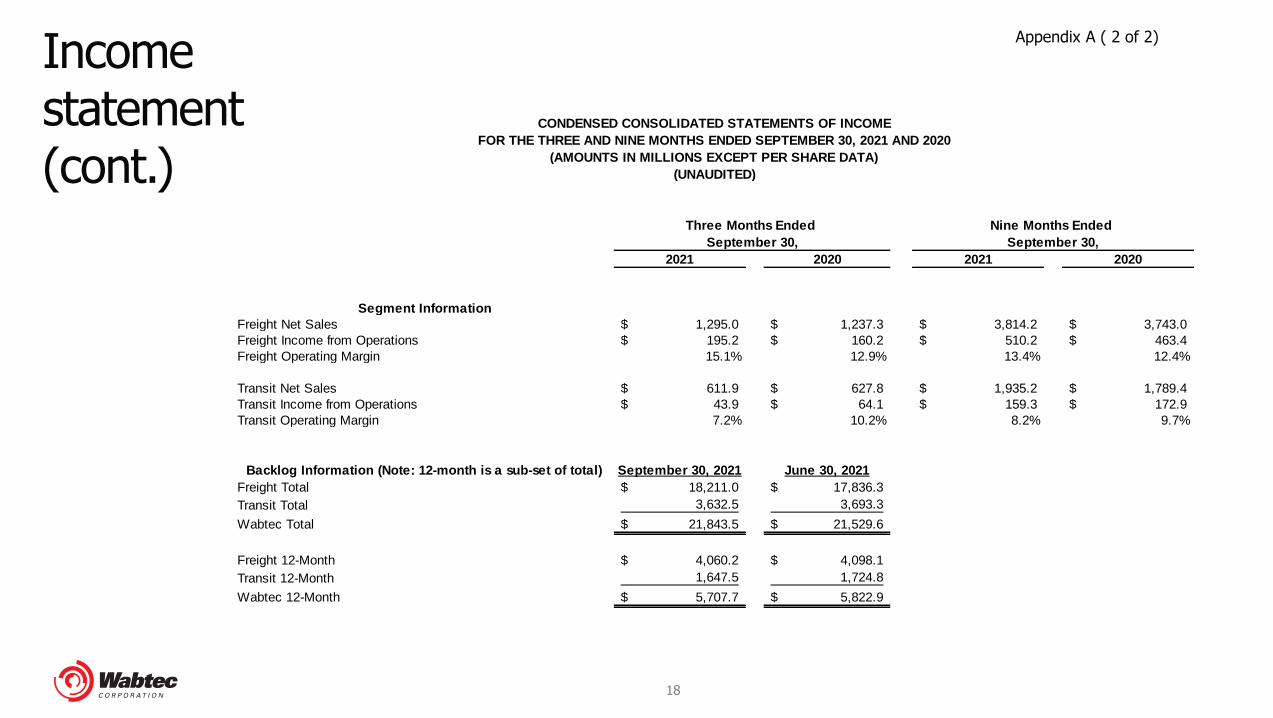
Segment Information
Freight Net Sales 1,295.0$ 1,237.3$ 3,814.2$ 3,743.0$
Freight Income from Operations 195.2$ 160.2$ 510.2$ 463.4$
Freight Operating Margin 15.1% 12.9% 13.4% 12.4%
Transit Net Sales 611.9$ 627.8$ 1,935.2$ 1,789.4$
Transit Income from Operations 43.9$ 64.1$ 159.3$ 172.9$
Transit Operating Margin 7.2% 10.2% 8.2% 9.7%
Backlog Information (Note: 12-month is a sub-set of total) September 30, 2021 June 30, 2021
Freight Total 18,211.0$ 17,836.3$
Transit Total 3,632.5 3,693.3
Wabtec Total 21,843.5$ 21,529.6$
Freight 12-Month 4,060.2$ 4,098.1$
Transit 12-Month 1,647.5 1,724.8
Wabtec 12-Month 5,707.7$ 5,822.9$
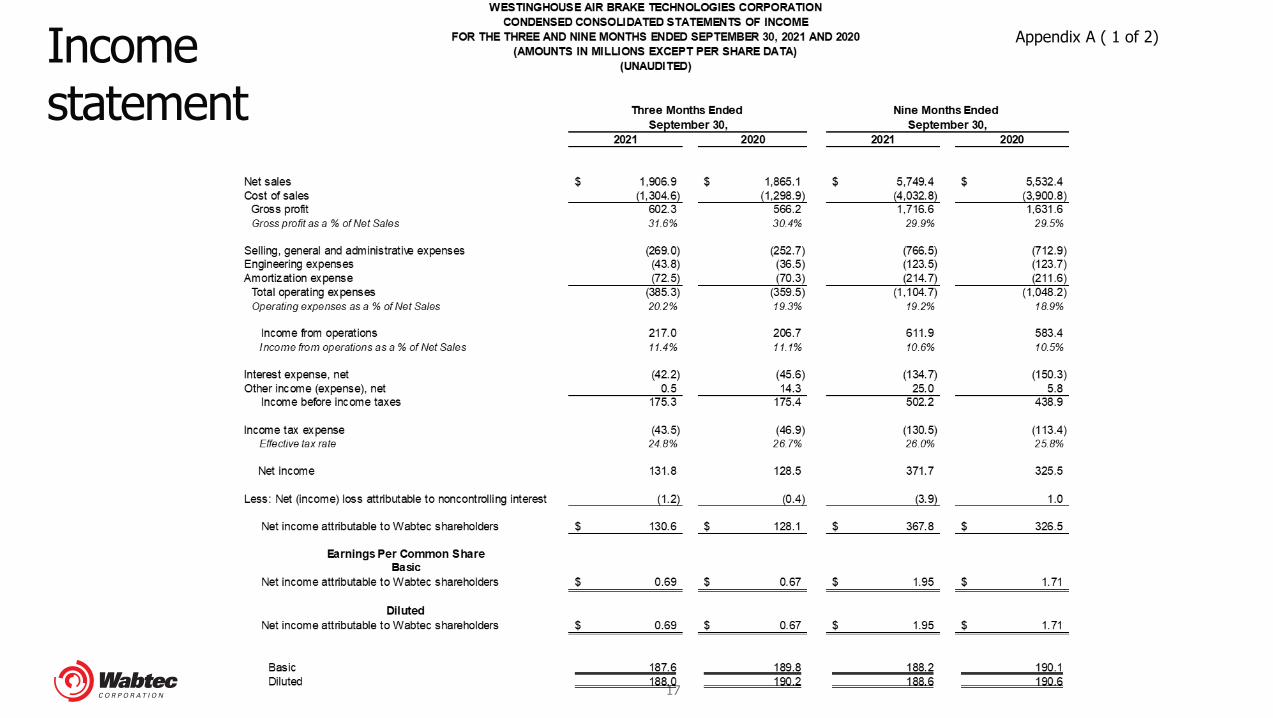
September 30, September 30,
CONDENSED CONSOLIDATED STATEMENTS OF INCOME
FOR THE THREE AND NINE MONTHS ENDED SEPTEMBER 30, 2021 AND 2020
(AMOUNTS IN MILLIONS EXCEPT PER SHARE DATA)
(UNAUDITED)
Three Months Ended Nine Months Ended
19
Balance sheet
Appendix B
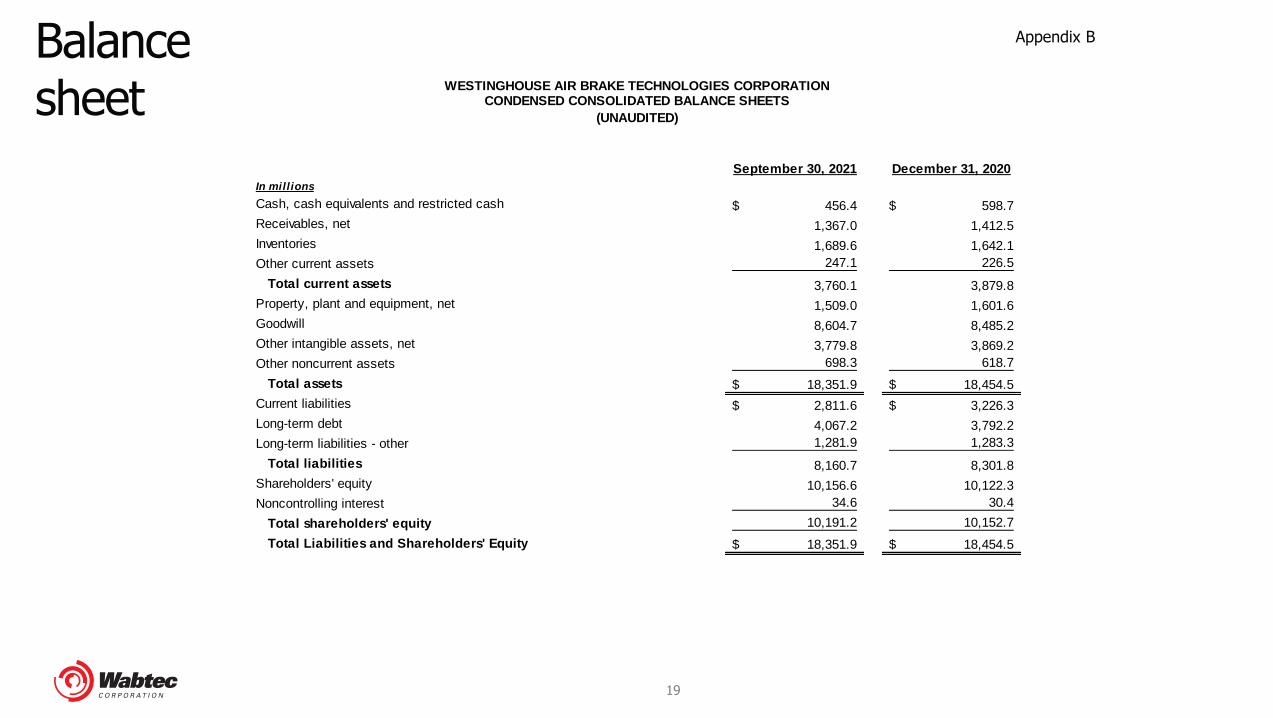
September 30, 2021 December 31, 2020
In millions
Cash, cash equivalents and restricted cash 456.4$ 598.7$
Receivables, net 1,367.0 1,412.5
Inventories 1,689.6 1,642.1
Other current assets 247.1 226.5
Total current assets 3,760.1 3,879.8
Property, plant and equipment, net 1,509.0 1,601.6
Goodwill 8,604.7 8,485.2
Other intangible assets, net 3,779.8 3,869.2
Other noncurrent assets 698.3 618.7
Total assets 18,351.9$ 18,454.5$
Current liabilities 2,811.6$ 3,226.3$
Long-term debt 4,067.2 3,792.2
Long-term liabilities - other 1,281.9 1,283.3
Total liabilities 8,160.7 8,301.8
Shareholders' equity 10,156.6 10,122.3
Noncontrolling interest 34.6 30.4
Total shareholders' equity 10,191.2 10,152.7
Total Liabilities and Shareholders' Equity 18,351.9$ 18,454.5$
WESTINGHOUSE AIR BRAKE TECHNOLOGIES CORPORATIONCONDENSED CONSOLIDATED BALANCE SHEETS
(UNAUDITED)
20
Appendix C
Cash flow
2021 2020
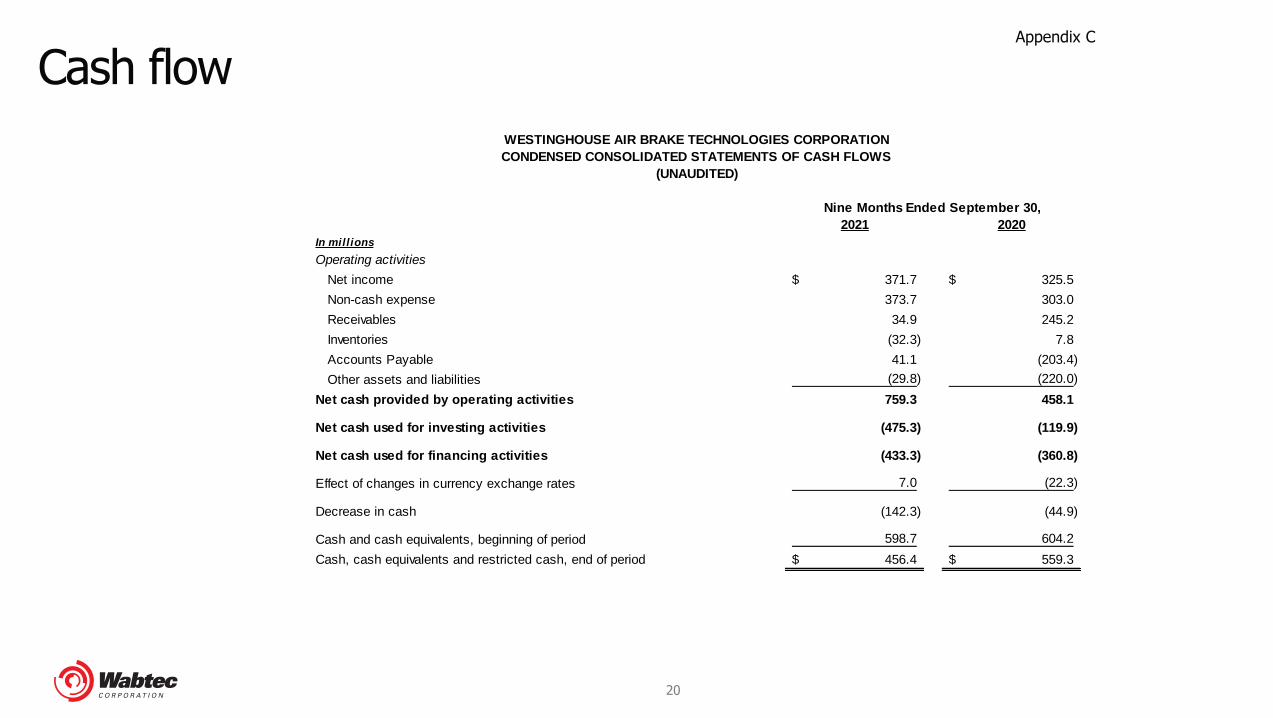
In millions
Operating activities
Net income 371.7$ 325.5$
Non-cash expense 373.7 303.0
Receivables 34.9 245.2
Inventories (32.3) 7.8
Accounts Payable 41.1 (203.4)
Other assets and liabilities (29.8) (220.0)
Net cash provided by operating activities 759.3 458.1
Net cash used for investing activities (475.3) (119.9)
Net cash used for financing activities (433.3) (360.8)
Effect of changes in currency exchange rates 7.0 (22.3)
Decrease in cash (142.3) (44.9)
Cash and cash equivalents, beginning of period 598.7 604.2
Cash, cash equivalents and restricted cash, end of period 456.4$ 559.3$
WESTINGHOUSE AIR BRAKE TECHNOLOGIES CORPORATION
CONDENSED CONSOLIDATED STATEMENTS OF CASH FLOWS
(UNAUDITED)
Nine Months Ended September 30,
21
EPSand non-GAAP Reconciliation
Appendix D(1 of 2)
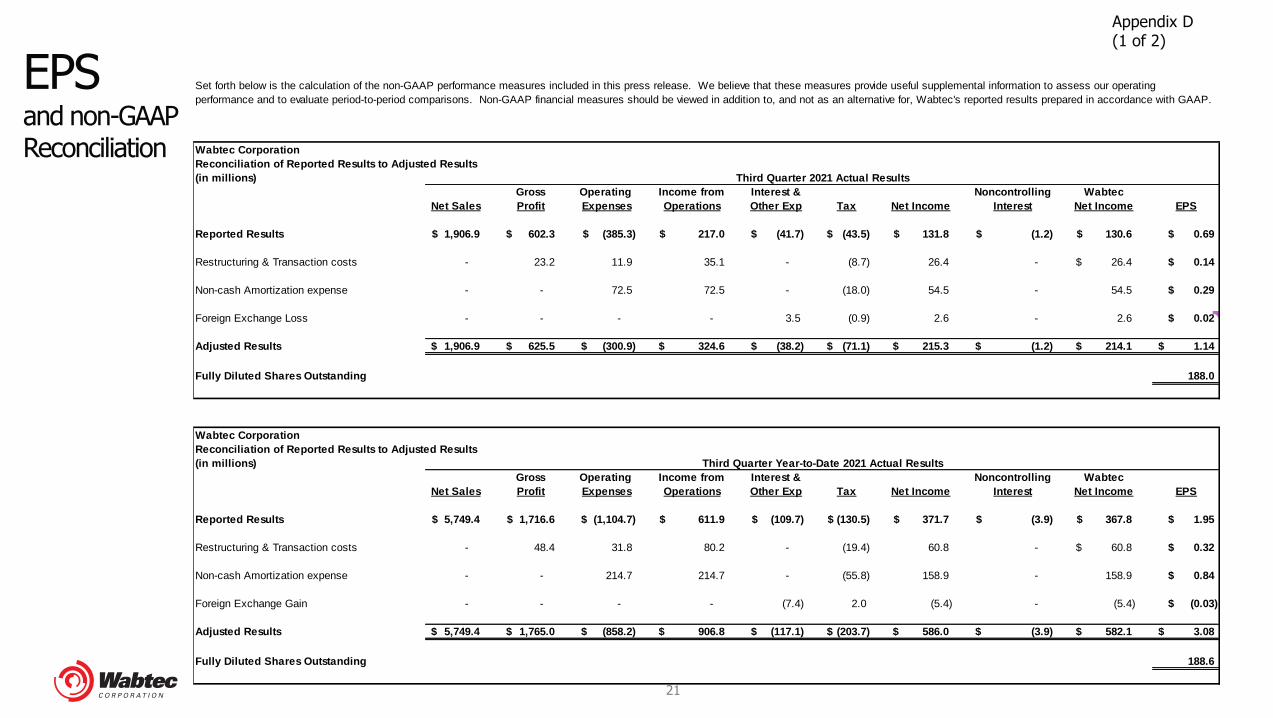
Wabtec Corporation
Reconciliation of Reported Results to Adjusted Results
(in millions)
Gross Operating Income from Interest & Noncontrolling Wabtec
Net Sales Profit Expenses Operations Other Exp Tax Net Income Interest Net Income EPS
Reported Results 1,906.9$ 602.3$ (385.3)$ 217.0$ (41.7)$ (43.5)$ 131.8$ (1.2)$ 130.6$ 0.69$
Restructuring & Transaction costs - 23.2 11.9 35.1 - (8.7) 26.4 - 26.4$ 0.14$
Non-cash Amortization expense - - 72.5 72.5 - (18.0) 54.5 - 54.5 0.29$
Foreign Exchange Loss - - - - 3.5 (0.9) 2.6 - 2.6 0.02$
Adjusted Results 1,906.9$ 625.5$ (300.9)$ 324.6$ (38.2)$ (71.1)$ 215.3$ (1.2)$ 214.1$ 1.14$
Fully Diluted Shares Outstanding 188.0
Wabtec Corporation
Reconciliation of Reported Results to Adjusted Results
(in millions)
Gross Operating Income from Interest & Noncontrolling Wabtec
Net Sales Profit Expenses Operations Other Exp Tax Net Income Interest Net Income EPS
Reported Results 5,749.4$ 1,716.6$ (1,104.7)$ 611.9$ (109.7)$ (130.5)$ 371.7$ (3.9)$ 367.8$ 1.95$
Restructuring & Transaction costs - 48.4 31.8 80.2 - (19.4) 60.8 - 60.8$ 0.32$
Non-cash Amortization expense - - 214.7 214.7 - (55.8) 158.9 - 158.9 0.84$
Foreign Exchange Gain - - - - (7.4) 2.0 (5.4) - (5.4) (0.03)$
Adjusted Results 5,749.4$ 1,765.0$ (858.2)$ 906.8$ (117.1)$ (203.7)$ 586.0$ (3.9)$ 582.1$ 3.08$
Fully Diluted Shares Outstanding 188.6
Set forth below is the calculation of the non-GAAP performance measures included in this press release. We believe that these measures provide useful supplemental information to assess our operating
performance and to evaluate period-to-period comparisons. Non-GAAP financial measures should be viewed in addition to, and not as an alternative for, Wabtec's reported results prepared in accordance with GAAP.
Third Quarter 2021 Actual Results
Third Quarter Year-to-Date 2021 Actual Results
22
EPSand non-GAAP Reconciliation
Appendix D(2 of 2)
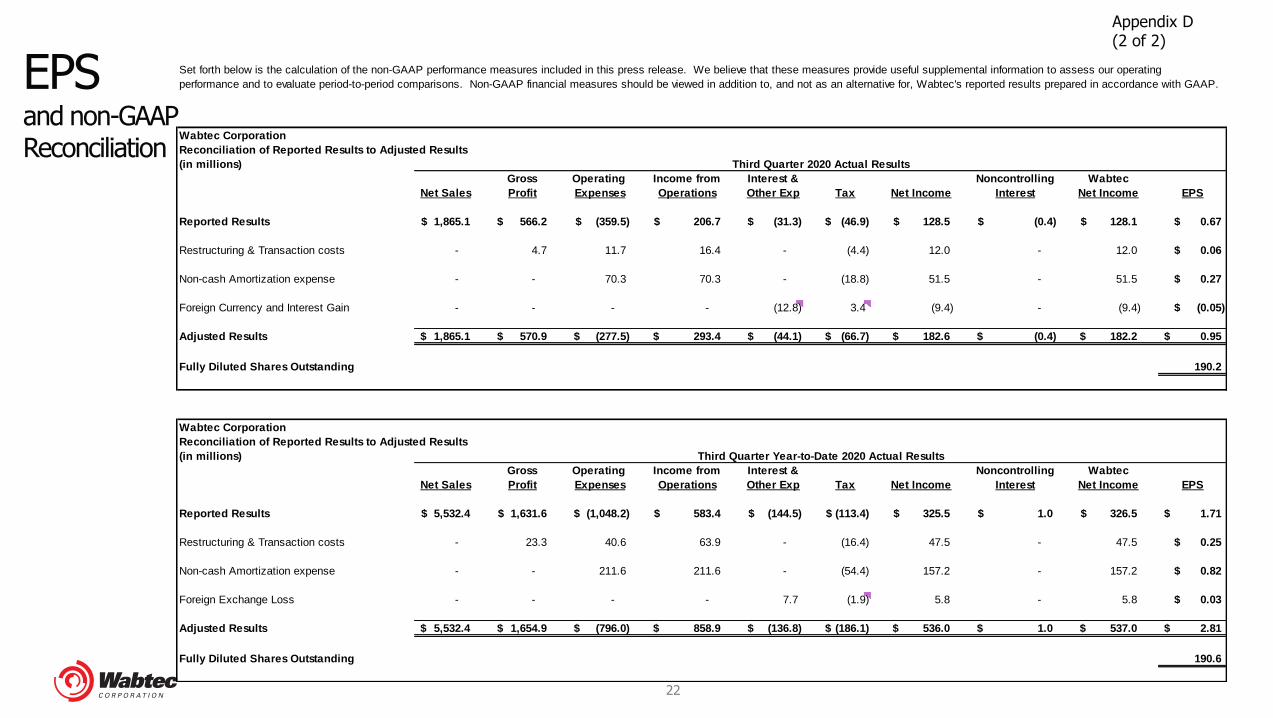
Wabtec Corporation
Reconciliation of Reported Results to Adjusted Results
(in millions)
Gross Operating Income from Interest & Noncontrolling Wabtec
Net Sales Profit Expenses Operations Other Exp Tax Net Income Interest Net Income EPS
Reported Results 1,865.1$ 566.2$ (359.5)$ 206.7$ (31.3)$ (46.9)$ 128.5$ (0.4)$ 128.1$ 0.67$
Restructuring & Transaction costs - 4.7 11.7 16.4 - (4.4) 12.0 - 12.0 0.06$
Non-cash Amortization expense - - 70.3 70.3 - (18.8) 51.5 - 51.5 0.27$
Foreign Currency and Interest Gain - - - - (12.8) 3.4 (9.4) - (9.4) (0.05)$
Adjusted Results 1,865.1$ 570.9$ (277.5)$ 293.4$ (44.1)$ (66.7)$ 182.6$ (0.4)$ 182.2$ 0.95$
Fully Diluted Shares Outstanding 190.2
Wabtec Corporation
Reconciliation of Reported Results to Adjusted Results
(in millions)
Gross Operating Income from Interest & Noncontrolling Wabtec
Net Sales Profit Expenses Operations Other Exp Tax Net Income Interest Net Income EPS
Reported Results 5,532.4$ 1,631.6$ (1,048.2)$ 583.4$ (144.5)$ (113.4)$ 325.5$ 1.0$ 326.5$ 1.71$
Restructuring & Transaction costs - 23.3 40.6 63.9 - (16.4) 47.5 - 47.5 0.25$
Non-cash Amortization expense - - 211.6 211.6 - (54.4) 157.2 - 157.2 0.82$
Foreign Exchange Loss - - - - 7.7 (1.9) 5.8 - 5.8 0.03$
Adjusted Results 5,532.4$ 1,654.9$ (796.0)$ 858.9$ (136.8)$ (186.1)$ 536.0$ 1.0$ 537.0$ 2.81$
Fully Diluted Shares Outstanding 190.6
Set forth below is the calculation of the non-GAAP performance measures included in this press release. We believe that these measures provide useful supplemental information to assess our operating
performance and to evaluate period-to-period comparisons. Non-GAAP financial measures should be viewed in addition to, and not as an alternative for, Wabtec's reported results prepared in accordance with GAAP.
Third Quarter 2020 Actual Results
Third Quarter Year-to-Date 2020 Actual Results
23
EBITDA reconciliation
Appendix E
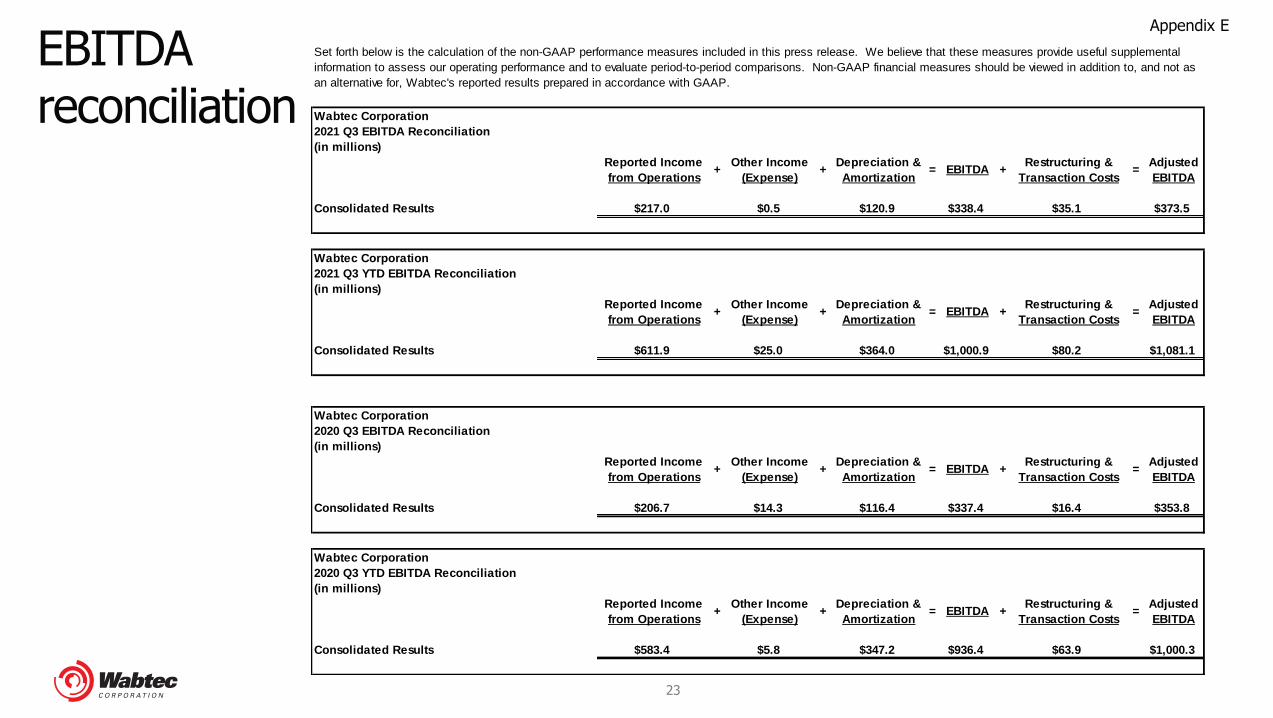
Wabtec Corporation
2021 Q3 EBITDA Reconciliation
(in millions)
Reported Income Other Income Depreciation & Restructuring & Adjusted
from Operations (Expense) Amortization Transaction Costs EBITDA
Consolidated Results $217.0 $0.5 $120.9 $338.4 $35.1 $373.5
Wabtec Corporation
2021 Q3 YTD EBITDA Reconciliation
(in millions)
Reported Income Other Income Depreciation & Restructuring & Adjusted
from Operations (Expense) Amortization Transaction Costs EBITDA
Consolidated Results $611.9 $25.0 $364.0 $1,000.9 $80.2 $1,081.1
Wabtec Corporation
2020 Q3 EBITDA Reconciliation
(in millions)
Reported Income Other Income Depreciation & Restructuring & Adjusted
from Operations (Expense) Amortization Transaction Costs EBITDA
Consolidated Results $206.7 $14.3 $116.4 $337.4 $16.4 $353.8
Wabtec Corporation
2020 Q3 YTD EBITDA Reconciliation
(in millions)
Reported Income Other Income Depreciation & Restructuring & Adjusted
from Operations (Expense) Amortization Transaction Costs EBITDA
Consolidated Results $583.4 $5.8 $347.2 $936.4 $63.9 $1,000.3
=+ + = EBITDA +
=
+ + = EBITDA + =
+ + = EBITDA +
Set forth below is the calculation of the non-GAAP performance measures included in this press release. We believe that these measures provide useful supplemental
information to assess our operating performance and to evaluate period-to-period comparisons. Non-GAAP financial measures should be viewed in addition to, and not as
an alternative for, Wabtec's reported results prepared in accordance with GAAP.
+ + = EBITDA + =
24
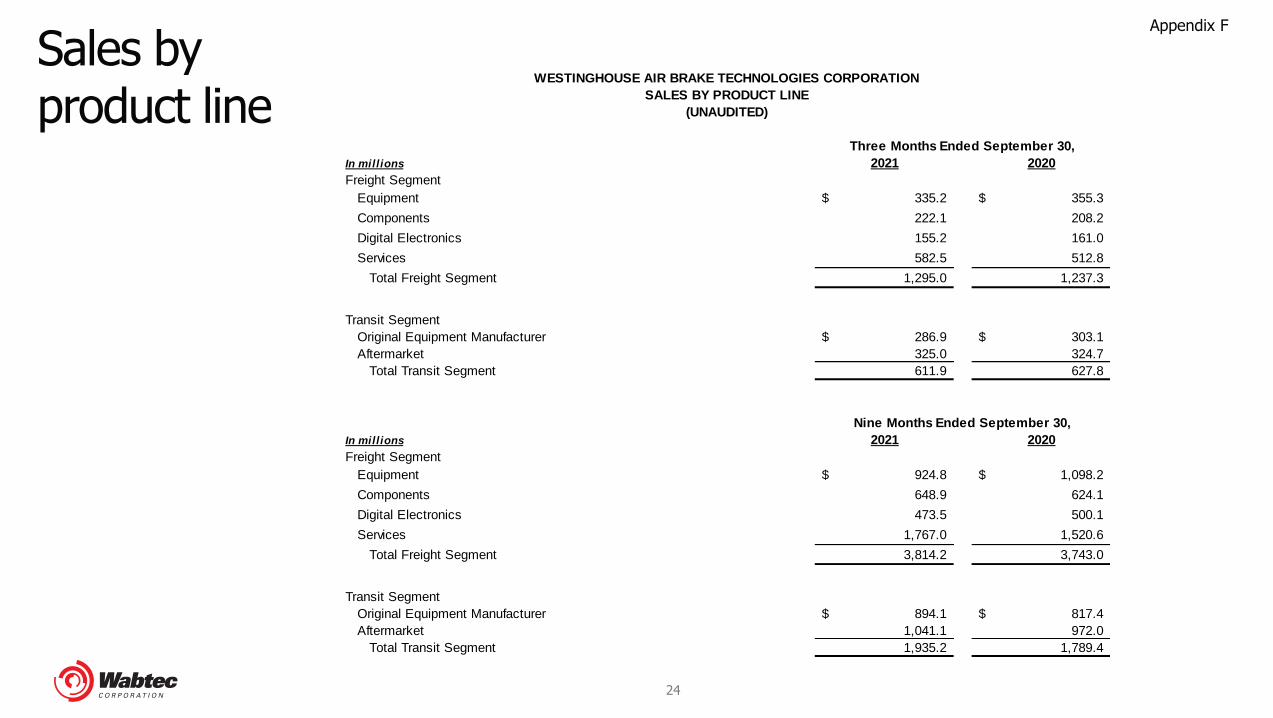
Sales by product line
Appendix F
In millions 2021 2020
Freight Segment
Equipment 335.2$ 355.3$
Components 222.1 208.2
Digital Electronics 155.2 161.0
Services 582.5 512.8
Total Freight Segment 1,295.0 1,237.3
Transit Segment
Original Equipment Manufacturer 286.9$ 303.1$
Aftermarket 325.0 324.7
Total Transit Segment 611.9 627.8
In millions 2021 2020
Freight Segment
Equipment 924.8$ 1,098.2$
Components 648.9 624.1
Digital Electronics 473.5 500.1
Services 1,767.0 1,520.6
Total Freight Segment 3,814.2 3,743.0
Transit Segment
Original Equipment Manufacturer 894.1$ 817.4$
Aftermarket 1,041.1 972.0
Total Transit Segment 1,935.2 1,789.4
Nine Months Ended September 30,
WESTINGHOUSE AIR BRAKE TECHNOLOGIES CORPORATION
SALES BY PRODUCT LINE
(UNAUDITED)
Three Months Ended September 30,
25
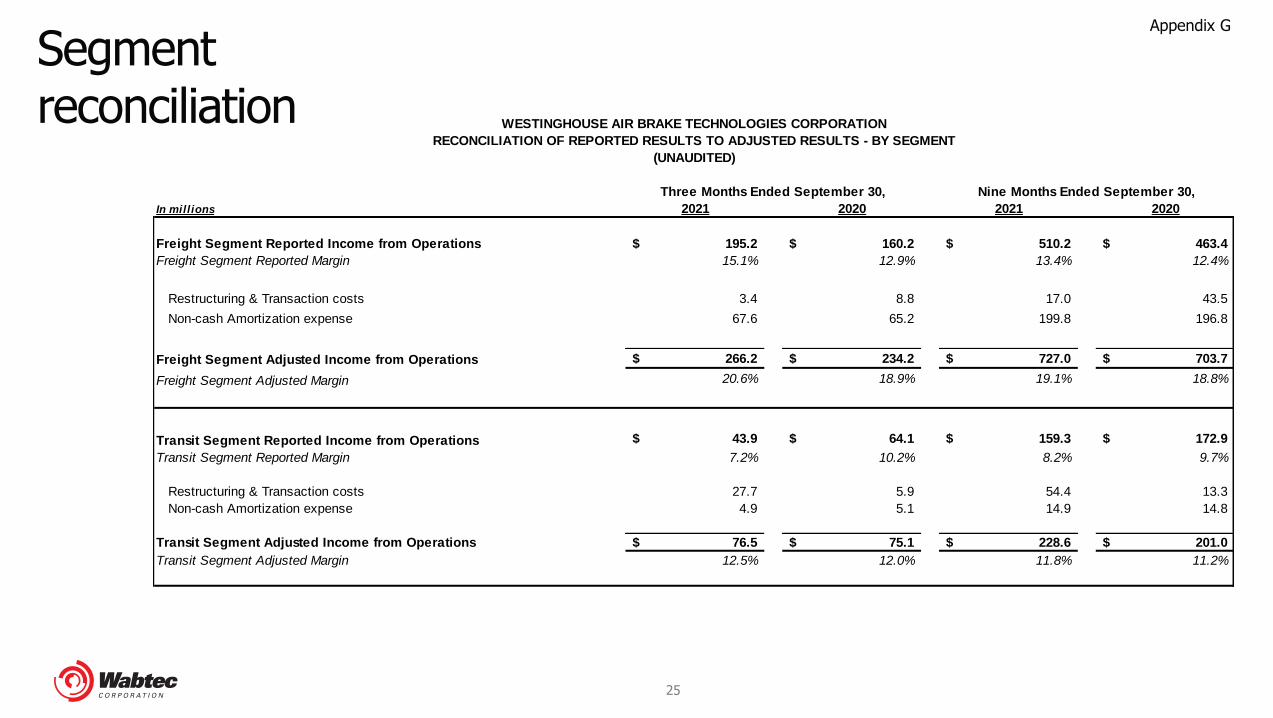
Segment reconciliation
Appendix G
In millions 2021 2020 2021 2020
Freight Segment Reported Income from Operations 195.2$ 160.2$ 510.2$ 463.4$
Freight Segment Reported Margin 15.1% 12.9% 13.4% 12.4%
Restructuring & Transaction costs 3.4 8.8 17.0 43.5
Non-cash Amortization expense 67.6 65.2 199.8 196.8
Freight Segment Adjusted Income from Operations 266.2$ 234.2$ 727.0$ 703.7$
Freight Segment Adjusted Margin 20.6% 18.9% 19.1% 18.8%
Transit Segment Reported Income from Operations 43.9$ 64.1$ 159.3$ 172.9$
Transit Segment Reported Margin 7.2% 10.2% 8.2% 9.7%
Restructuring & Transaction costs 27.7 5.9 54.4 13.3
Non-cash Amortization expense 4.9 5.1 14.9 14.8
Transit Segment Adjusted Income from Operations 76.5$ 75.1$ 228.6$ 201.0$
Transit Segment Adjusted Margin 12.5% 12.0% 11.8% 11.2%
WESTINGHOUSE AIR BRAKE TECHNOLOGIES CORPORATION
RECONCILIATION OF REPORTED RESULTS TO ADJUSTED RESULTS - BY SEGMENT
(UNAUDITED)
Three Months Ended September 30, Nine Months Ended September 30,