Embed Size (px)
DESCRIPTION
VACARVM, std and stochastic
Citation preview

TheFinancialReporter
ISSUE 81 JUNE 2010
Solvency II – What Does It Mean to U.S. Companies?by Patricia Matson, William Hines and Rony Sleiman
1 SolvencyII–WhatDoesItMeantoU.S.Companies?
byPatriciaMatson,WilliamHinesandRonySleiman
2 Chairperson’sCorner bySteveMalerich
10 SpeakingTheNewLingo–AUSGAAPCodificationPrimer
byDouglasS.VanDam
12 ManagingC3PhaseIII–ACaseStudy
byTimothyC.Cardinal
15 ReportontheInternationalActuarialAssociation:CapetownMeeting
byJimMilholland
19 PBACorner byKarenRudolph
22 ModelCompressionandStochasticModeling
byCraigW.Reynolds
29 AG43:WhichReservesWillDominate?StandardScenarioOrStochastic
byYuhong(Jason)Xue
35 IsAccountingTheoryanOxymoron?
byHenrySiegel
Financial ReportingSectionSOCIETYOFACTUARIES
CONTINUED ON PAGE 4
I n the early 1970s, Solvency I was developed for the European Union (EU) countries to provide a standard for monitoring the required capital to be held by insurers. Several inadequacies in the Solvency I methodol-
ogy have led to Solvency II, the new solvency regime for all EU insurers and reinsurers. Due to come into effect in late 2012, Solvency II aims to implement requirements that better reflect risks which companies face and is intended to create a level playing field for insurers across the United Kingdom and Europe through the introduction of a comparable and trans-parent regulation.
This article provides an overview of Solvency II and identifies potential impacts on U.S.-domiciled companies.
OVERVIEWThe Solvency II regime is somewhat similar to the banking regulations of Basel II. It is based on three guiding principles (pillars) which cut across market, credit, liquidity, operational and insurance risk. It offers insurance companies incentives, potentially in the form of reduced capital require-ments, to implement appropriate risk management systems, have sound internal controls, and to measure and better manage their risk situation. It is significantly more than a calculation of required capital. It is a change in overall risk management and risk culture, and requires embedding into company culture a strong link between decision making and quantitative risk measurement.
As in Basel II for Banking, Solvency II includes both quantitative and qualitative aspects of risk, each pillar focusing on a different regulatory component:
B y the time you read this, we will be about two-thirds of the way through the Society’s year. Two others and I will have but four months left on the council. Yet, as I write this at the end of March, it seems like we’re just getting started
on much of our work for the year.
In December, when I wrote my previous column, we were getting ready for two new volunteer roles within the Section—volunteer coordinator and a webcast team. Since then, the council has decided to add a research team, as well. All three roles have been filled. Both teams are now headed by members of the Section council. The volunteer coordinator is a new friend of the council and both teams include Section members who are not on the council. By expanding the involvement of non-council members in these roles, we expect to see greater continuity from year to year, much as we see now with the Financial Reporter.
The first action by our new webcast team was to take a short survey of the Section membership about interest in continuing professional development and research. The response to the survey was excellent—more than 500 Section members, nearly 13 percent of our total membership. The results of that survey have helped us to plan for Section-sponsored sessions at the 2010 annual meeting and for 2010 webcasts.
Our new research team is also looking closely at the survey results, along with several specific research ideas that were brought to the council before the survey. As I write this, it is too soon to report on the direction of our new research this year. However, you can expect that research will continue to be a major focus of the council and use of Section funds.
Another area of focus for the council is in serving our membership outside of the United States. Twenty percent of us live outside of the United States—10 percent in Canada and 10 percent elsewhere. Among all people currently taking Society exams, 40 percent live outside of the United States. How we can and should serve these members is still being considered. I don’t know what decisions the council will reach in this respect, but we do have two seemingly obvious places to start.
First, we need to involve more of these members in the work of our Section. Just as we draw on expertise from actuaries working in the United States to serve the mem-bers working in the United States or subject to U.S. reporting requirements, we need to draw on the expertise of those working outside the United States to serve others working outside the United States or subject to other requirements.
Second, we know there is much activity at the International Accounting Standards Board (IASB). Especially important to us is the development of new standards for reporting of insurance contracts and the reexamination of standards for financial instruments. Many of our international members will be subject to these changes. Further, we know that, in the United States, the Financial Accounting Standards Board is working together with IASB on these new standards and the Securities Exchange Commission is planning for adoption of International Financial Reporting Standards (IFRS). Altogether, these tell us that we need to pay attention to the coming changes to both IFRS and US GAAP.
CHAIRPERSON’S CORNER
PublishedbyTheFinancialReportingSectionoftheSocietyofActuaries
This newsletter is free to section members. Current-year issues are available from the communications department. Back issues of section newsletters have been placed in the SOA library and on the SOA Web site(www.soa.org). Photocopies of back issues may be requested for a nominal fee.
2009-2010SectionLeadershipSteve Malerich, ChairpersonCraig Buck, Vice-ChairpersonJohn Roeger, SecretaryMike Sparrow, TreasurerErrol Cramer, Board PartnerMark Alberts, Council MemberMark Davis, Council MemberRob Frasca, Council MemberBasha Hoffman, Council MemberDwayne McGraw, Council MemberKerry Krantz, Web Coordinator
ContentManagersTara Hansen, Newsletter EditorErnst & Young, LLPNew York, NY 10036-6530e:[email protected]
Carol Marler, Associate Editore:[email protected]
Michael Fruchter, Associate Editore:[email protected]
SOAStaffSam Phillips, Staff Editore:[email protected]
James Miles, Staff Partnere:[email protected]
Christy Cook, Project Support Specialiste:[email protected]
Julissa Sweeney, Graphic Designere:[email protected]
Facts and opinions contained herein are the sole responsibility of the persons expressing them and shall not be attributed to the Society of Actuaries, its commit-tees, The Financial Reporting Section or the employers of the authors. We will promptly correct errors brought to our attention.
Copyright © 2010 Society of Actuaries.All rights reserved.Printed in the United States of America
The FinancialReporterISSUE 81 JUNE 2010
2 | JUNE 2010 | The Financial Reporter
A CHALLENGE FOR US ALL …Last year, along with the Product Development and Reinsurance Sections, we cosponsored a call for essays, “Visions for the Future of the Life Insurance Sector.” In that call, we asked you to envision success in our business 10 years from now. Since then, several of those essays have been published.
In line with that project, I challenge you to look beyond the basic requirements of current financial reporting standards, to envision a future different from your best estimate and then consider how that future would affect your business. That can be hard to do when we’re continually pressed to satisfy the recurring and new demands on our time. Yet, pause for a moment and think about the things that are driving those increased demands.
I’ll dare to suggest that the reasons for many new demands can be summarized simply as—what we’ve been doing has been found inadequate in some respect. Yet, rather than turning to others to fill the need, those who find our work inadequate continue to come to us. Surely, that’s a mixed blessing. It means that our work remains in demand, but it also means that new demands add to an already heavy work load.
Instead of waiting for the next new demand, examine your own work and consider where it might still be inadequate. Ask yourself—what are some of the things that could easily happen in the coming years, but prove disruptive in some way? Next, determine how your business would perform if that were to happen. Then, share your findings with company management. Help them to see those possible futures. If you can do this effectively, perhaps your company will be the one that’s well prepared for the next crisis.
Collectively, if we can do more of this, then perhaps we can avoid the next large-scale mandate, or at least ensure that we have a significant voice in the develop-ment of its form.
SteveMalerich,FSA,MAAA,isassistantvicepresidentandactuaryatAEGONUSA,Inc.inCedarRapids,[email protected].
The Financial Reporter | JUNE 2010 | 3

Solvency II – What Does … | FROM PAGE 1
• Pillar 1 consists of the quantitative requirements (for example, a calculation of the minimum amount of capital an insurer should hold).
• Pillar 2 sets out requirements for the governance and risk management of insurers, for embedding of quan-titative risk measurement into decision making, and for the effective supervision of insurers.
• Pillar 3 focuses on disclosure and transparency requirements. In addition to requiring firms to dis-close their capital and risk frameworks, they must also demonstrate how and where those frameworks are embedded in their wider business activities.
More on each of the pillarsPillar 1 considers the quantitative requirements of the system, including the calculation of technical provisions (reserves), the calculation of the capital requirements and investment management requirements. Pillar 1 sets out a valuation standard for liabilities to policyholders and the capital requirements insurers will be required to meet, and uses a market-consistent framework for those requirements. There are two Solvency requirements—the Minimum Capital Requirements (MCR), and the Solvency Capital Requirement (SCR). If available capital (which is also defined by the Solvency II regu-lations) lies between the SCR and MCR, it is an early indicator to the supervisor and the insurance company that action needs to be taken. An insurance company can choose whether to calculate the capital require-ments using the standard formula set by the regulator or whether to develop its own internal model to reflect
the specific risks the organization faces. If the latter approach is adopted, the insurer needs to gain approval from the supervisor to which Solvency II results are reported. It appears that most large insurers plan to use an internal model to depart from the embedded conser-vativeness of the standard formula.
Pillar 2 deals with the qualitative aspects of a com-pany’s internal controls, risk management process and the approach to supervisory review. Pillar II includes the Own Risk and Solvency Assessment (ORSA) and the Supervisory Review Process (SRP). Irrespective of whether a firm adopts the standard formula or internal model under Pillar 1, it has to produce an ORSA. If supervisors are dissatisfied with a company’s assess-ment of the risk-based capital or the quality of the risk management arrangements under the SRP they will have the power to impose higher capital requirements. The regulator could also impose capital add-ons for other reasons as well, and therefore the more robust and embedded a company’s analysis is, the less likely they are to face capital add ons. The Pillar 2 requirements are likely the most challenging in terms of implemen-tation, as they require a change in risk culture within the organization, all the way up to the Board level. Executive compensation is expected to be based on results of an internal model, all senior level individu-als involved in the SII analysis and risk management functions must meet defined “fit and proper” require-ments to serve in their positions, and the Board retains ultimate accountability for the internal model results.
Pillar 3 involves enhanced disclosure requirements in order to increase market transparency. There are two required reports: the Report to Supervisor (RTS), which contains narrative and quantitative information that is provided to the supervisory authority and kept confidential, and the Solvency and Financial Condition Report (SFCR) which is publicly available. Companies must interpret the disclosure requirements, develop a strategy for disclosure and educate key stakeholders on the results of the analysis. The onus is placed on firms to design the information which, through public dis-closure, will be available to regulators, analysts, rating agencies and shareholders. In addition, organizations
4 | JUNE 2010 | The Financial Reporter
CREDIT RISK
LIQUIDITY RISK
OPERATIONAL RISK
INSURANCE RISK
MARKET RISK
Pillar 1Quantitative
Requirements
Regulations on minimum capital requirements
Solvency Capital Requirements
Technical provisions
Investment Rules
Pillar 2Qualitative
Requirements & Rules on Supervision
Regulations on financial services supervision
Own Risk and Solvency Assessment (ORSA)
Capabilities and powers of regulators, areas of
activity
Quantification Governance Disclosure
Pillar 3Supervisory
Reporting and Public Disclosure
Transparency
Disclosure requirements
Competition related elements
Solvency II
must also develop the internal processes and systems to produce these reports.
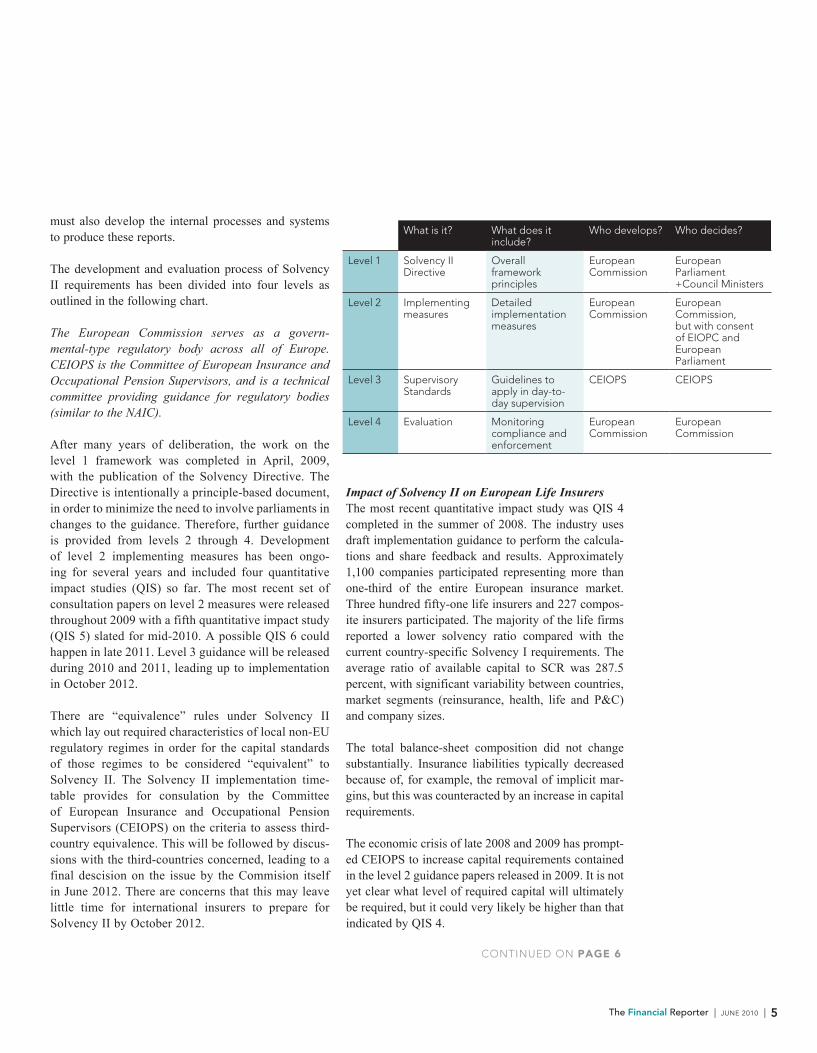
The development and evaluation process of Solvency II requirements has been divided into four levels as outlined in the following chart. The European Commission serves as a govern-mental-type regulatory body across all of Europe. CEIOPS is the Committee of European Insurance and Occupational Pension Supervisors, and is a technical committee providing guidance for regulatory bodies (similar to the NAIC).
After many years of deliberation, the work on the level 1 framework was completed in April, 2009, with the publication of the Solvency Directive. The Directive is intentionally a principle-based document, in order to minimize the need to involve parliaments in changes to the guidance. Therefore, further guidance is provided from levels 2 through 4. Development of level 2 implementing measures has been ongo-ing for several years and included four quantitative impact studies (QIS) so far. The most recent set of consultation papers on level 2 measures were released throughout 2009 with a fifth quantitative impact study (QIS 5) slated for mid-2010. A possible QIS 6 could happen in late 2011. Level 3 guidance will be released during 2010 and 2011, leading up to implementation in October 2012.
There are “equivalence” rules under Solvency II which lay out required characteristics of local non-EU regulatory regimes in order for the capital standards of those regimes to be considered “equivalent” to Solvency II. The Solvency II implementation time-table provides for consulation by the Committee of European Insurance and Occupational Pension Supervisors (CEIOPS) on the criteria to assess third-country equivalence. This will be followed by discus-sions with the third-countries concerned, leading to a final descision on the issue by the Commision itself in June 2012. There are concerns that this may leave little time for international insurers to prepare for Solvency II by October 2012.
The Financial Reporter | JUNE 2010 | 5
Impact of Solvency II on European Life InsurersThe most recent quantitative impact study was QIS 4 completed in the summer of 2008. The industry uses draft implementation guidance to perform the calcula-tions and share feedback and results. Approximately 1,100 companies participated representing more than one-third of the entire European insurance market. Three hundred fifty-one life insurers and 227 compos-ite insurers participated. The majority of the life firms reported a lower solvency ratio compared with the current country-specific Solvency I requirements. The average ratio of available capital to SCR was 287.5 percent, with significant variability between countries, market segments (reinsurance, health, life and P&C) and company sizes.
The total balance-sheet composition did not change substantially. Insurance liabilities typically decreased because of, for example, the removal of implicit mar-gins, but this was counteracted by an increase in capital requirements.
The economic crisis of late 2008 and 2009 has prompt-ed CEIOPS to increase capital requirements contained in the level 2 guidance papers released in 2009. It is not yet clear what level of required capital will ultimately be required, but it could very likely be higher than that indicated by QIS 4.
What is it? What does it include?
Who develops? Who decides?
Level 1 Solvency II Directive
Overall framework principles
European Commission
European Parliament +Council Ministers
Level 2 Implementing measures
Detailed implementation measures
European Commission
European Commission, but with consent of EIOPC and European Parliament
Level 3 Supervisory Standards
Guidelines to apply in day-to-day supervision
CEIOPS CEIOPS
Level 4 Evaluation Monitoring compliance and enforcement
European Commission
European Commission
CONTINUED ON PAGE 6
6 | JUNE 2010 | The Financial Reporter
Solvency II – What Does … | FROM PAGE 5
The key recent and upcoming dates regarding Solvency II implementation are as follows:
• CEIOPS published its last wave of technical advice on associated implementation measures (level 2) which is expected to be formally approved in the second half of 2010 by the European Commission, and adopted by October 2011, one year in advance of the Solvency II implementation date of October 2012.
• CEIOPS has published a consultation paper on level 3 guidance and is expected to finalize level 3 guidance by the end of 2010. The level 3 guidance is based on the level 2 advice on the internal model approval process.
• July 2010: CEIOPS is expected to provide a complete draft of the QIS 5 technical specification along with a comprehensive calibration paper by the end of March to enable the European Commission to publish final technical specifications by the end of July.
• June through November 2010: First wave of organi-zations to initiate a “dry-run” (initial production of results) of their internal models.
• During 2011: Many regulatory bodies requiring orga-nizations to submit initial results of analysis.
• October 2012: Organizations to be compliant with SII requirements.
Relationship with IFRSSolvency II regulations were initially developed with the intention of being compatible with International Financial Reporting Standards (IFRS), the basis of pub-lic accounting requirements used in Europe that were developed by the International Accounting Standards Board (IASB). As the IASB is still working on a final accounting standard for insurance contracts, divergence is occurring between the IFRS 4 insurance contract liability measurement requirements and the Solvency II technical provisions, which will create additional challenges for insurers as they adopt the measures. Liabilities are expected to be largely based on the same concepts, but potentially material differences could exist in certain items such as discount rates and treat-ment of future premiums. There are also likely to be differences in the definition, calibration and amortiza-tion of the margins used.
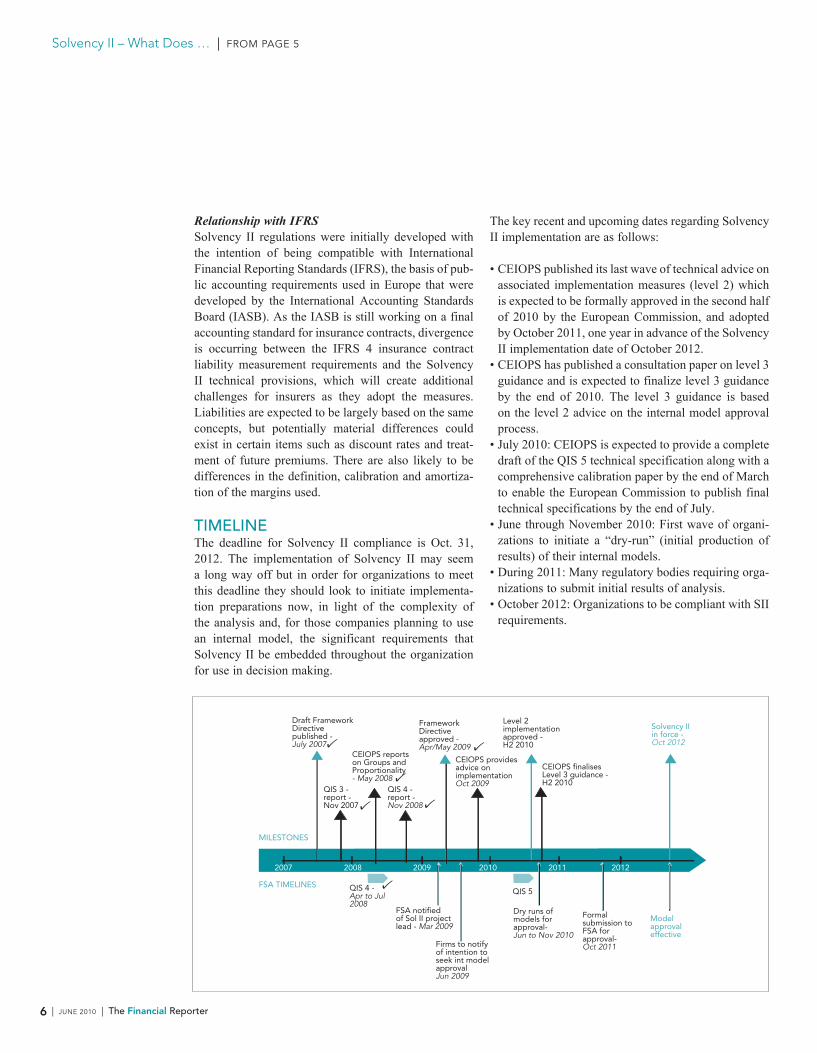
TIMELINEThe deadline for Solvency II compliance is Oct. 31, 2012. The implementation of Solvency II may seem a long way off but in order for organizations to meet this deadline they should look to initiate implementa-tion preparations now, in light of the complexity of the analysis and, for those companies planning to use an internal model, the significant requirements that Solvency II be embedded throughout the organization for use in decision making.
MILESTONES
FSA TIMELINES
CEIOPS reports on Groups and Proportionality- May 2008
Framework Directiveapproved - Apr/May 2009
CEIOPS provides advice on implementation Oct 2009
Level 2 implementation approved - H2 2010
CEIOPS finalisesLevel 3 guidance - H2 2010
Solvency IIin force - Oct 2012
Model approval effective
Formal submission to FSA for approval- Oct 2011
Dry runs of models for approval- Jun to Nov 2010
FSA notified of Sol II project lead - Mar 2009
Firms to notify of intention to seek int modelapprovalJun 2009
QIS 4 - Apr to Jul 2008
QIS 3 - report - Nov 2007
QIS 4 - report - Nov 2008
QIS 5
2007 2008 2009 20112010 2012
Draft FrameworkDirective published - July 2007

The Financial Reporter | JUNE 2010 | 7
relates to the “equivalence” rules under Solvency II. These rules lay out required characteristics of local regulatory regimes in order for the capital standards of those regimes to be considered “equiv-alent” to Solvency II. The National Association of Insurance Commissioners (NAIC) has embarked on a Solvency Modernization Initiative (SMI) to examine current solvency requirements, review international developments, move toward a princi-ple-based approach to solvency regulation, and ulti-mately improve the U.S. solvency system. The SMI Task Force issued two papers in December 2009 requesting feedback from the industry regarding potential changes to the U.S. regulatory framework, including potential quantitative capital require-ments (akin to pillar 1) changes and governance and risk management (akin to pillar 2) changes. The papers lay out potential revisions to U.S. require-ments, including consideration of requirements similar to those of Solvency II. Comments on the paper were due March 1, 2010. Depending on the extent of and timing of changes to the U.S. system, as well as the political environment, equivalence may or may not be reached in time.
If equivalence is met in the United States, the U.S. subsidiaries with EU parent companies could base their Own Risk and Solvency Assessment on U.S. statutory capital requirements, and use that as a
Although no one is predicting major delays to the pro-posed timeline, there have been views supportive of a delay. On May 4, 2010, Michel Barnier, in his opening speech at the European Commission’s Public Hearing on the Solvency II Directive, specifically proposed deferring the implementation date to Dec. 31, 2012.
Implications for U.S.-based InsurersActivity with respect to Solvency II is increasing in the United States. The implications vary depending on how directly impacted a given U.S. company is by Solvency II:
1. U.S. subsidiaries of parent companies in a loca-tion planning for Solvency II adoption
In the United States, the companies most inter-ested in the development of Solvency II are U.S.-domiciled subsidiaries with parent companies located in the EU. In order for the parent company to meet the requirements, its subsidiaries must pro-vide the required MCR and SCR calculations, must meet the Pillar II requirements regarding risk management practices and structure (including the Own Risk and Solvency Assessment, an insurer’s internal view of the required capital based on their view of risk), governance, documentation and con-trols, and must provide information to their parent in order to meet the reporting requirements under Pillar II. In addition, if the parent plans to use a full internal model, the subsidiary must then demon-strate that the results of their own internal model is used as the basis to make broad business decisions, including pricing, underwriting, performance mea-surement, and executive compensation. As a result of these requirements, a number of U.S. subsidiar-ies of multinational insurers are undertaking signifi-cant projects, many of those costing tens of millions of dollars, to prepare for Solvency II requirements, with several participating in the quantitative impact studies. Therefore, forward planning for capital adequacy, risk management and disclosures will become a part of strategic decisions. Responding adequately to these new requirements will mean a major shift in thinking for many organizations, and a rigorous and planned approach to bridge the gap between standards now and those required for 2012.
One unknown with respect to U.S. subsidiaries CONTINUED ON PAGE 8
8 | JUNE 2010 | The Financial Reporter
Solvency II – What Does … | FROM PAGE 7
Solvency II is a reality and will impact not only those companies with operations in the European Union (EU). …
public disclosures from a competitive perspective and ongoing communication with stakeholders will be needed.
2. U.S. companies with subsidiaries in a location planning for Solvency II adoption
Certain U.S. companies that have subsidiaries in locations that are adopting Solvency II-like-regulations will need to meet the requirements as outlined above with respect to those subsidiaries. At a minimum, those subsidiaries will need to produce the required MCR and SCR calculations, comply with governance requirements, and pro-vide the required reporting and disclosure. There will be implications for the parent company due to the change in the capital requirements themselves, as well as implications on business decisions relat-ed to the subsidiary to the extent an internal model is being used, similar to the implications described above for U.S. subsidiaries of EU companies. Jurisdictions that have announced intentions to move to solvency regimes patterned on or equiva-lent to Solvency II include Canada and reinsurance centers such as Bermuda, and Guernsey. Other jurisdictions such as Japan and Chile are modern-izing their solvency regimes using concepts under-lying Solvency II; a company-based, risk-driven scheme emphasizing corporate governance, risk management and transparency between companies and the regulator.
3. Broader implications for the U.S. marketplace Solvency II is a reality and will impact not only
those companies with operations in the European Union (EU), but also the broader U.S. industry. Solvency II is likely to raise the bar for risk man-agement practices for all insurers, and potentially disclosures as well. This will be fueled by regula-tors and rating agencies as they review the detailed analysis and disclosures for those companies that do implement Solvency II.
In addition, there will be product and pricing implications caused by differences, in some cases significant differences, in capital requirements by product. U.S. domiciled companies may have a
basis for decision making within an internal model framework. The U.S. subsidiary would still need to produce the SCR and MCR calculations, as well as meet certain other requirements with respect to risk management and reporting; however, the level of effort for implementation would be significantly lower. To the extent equivalence is not achieved, competitive issues are likely to result between U.S.-domiciled companies and U.S. subsidiaries of EU parents, as the former will price products with a view toward statutory capital requirements, whereas the latter will be required to consider market-consistent, Solvency II capital requirements in their pricing.
The emphasis on a market-consistent approach to Solvency II and risk management will likely require accessing data that have not been avail-able or used in the past. For example, there are regulations to produce capital requirements for 16 specific categories of business, and some compa-nies may not have data at this level of granularity currently. In addition, all material risks must be considered in a company’s ORSA, which may require increased capture of information regard-ing operational risk, CAT risk, spread risk and/or market risk. It will potentially require building new data warehouse functionality with enhanced reporting and disclosure tools in order to have results available in a timely manner for decision making. It may also require business process rede-signs in order to fully integrate risk management and capital analysis, and be capable of continuous recalibration and assessment of emerging risks. Additional disclosures will be necessary for both a public report as well as a regulatory report. Careful consideration of the interplay between the regulatory report requirements and the enhanced

The Financial Reporter | JUNE 2010 | 9
dictions that have achieved equivalence. The hope is that it gives regulators, rating agencies, analysts, and investors a higher level of confidence in the insurance industry’s business model and management. However it may also result in lack of consistency and introduc-tion of competitive advantages and disadvantages between U.S. domiciled companies and subsidiaries of multinational companies for jurisdictions where equivalence is not achieved. In light of all these factors, U.S. companies will be well served to understand the Solvency II requirements, their implications on the risk management framework and culture, particular chal-lenges related to U.S. products, and the plans of U.S. regulatory bodies with respect to gaining equivalence and/or adopting Solvency II-like standards.
The authors would like to thank Aniko Smith of Deloitte & Touche and David Schraub of Aviva for their contributions to this article.
competitive advantage in pricing products with low U.S. capital requirements as compared to the Solvency II required capital. However those com-panies using Solvency II approaches may have a deeper understanding of the underlying risks in the products, which may provide longer term advan-tages as financial results are realized.
CONCLUSIONClearly the implementation of Solvency II will require a significant amount of effort, and a change in culture and management’s approach to making decisions. Solvency II may help promote the application of a prin-ciple-based approach for determining capital require-ments, better alignment of risk management, and capital analysis using complex modeling techniques. It may encourage management to use more comprehen-sive and integrated risk management, provide increased consistency and comparability in measurement in juris-
PatriciaMatsonFSA,MAAA,isaprinci-palwithDeloitteConsultingLLP.Shecanbecontactedatpmatson@deloitte.com.
WilliamHines,FSA,MAAA,isaconsult-ingactuarywithMilliman,[email protected].
RonySleiman,FSA,MAAAisaseniormanagerwithDeloitteConsultingLLP.Hecanbecontactedatrsleiman@deloitte.com.
Speaking The New Lingo – A US GAAP Codification Primerby Douglas S. Van Dam
sub-topics will vary by the topic, but three-digit sub-topics will correspond to the topic with the same num-ber. For example:
225 [Income Statement]944-225 [Financial Services Insurance-Income Statement]944-20-20 [Financial Services Insurance-Insurance Activities-Glossary]
Sections where the number is preceded by an “S” refer-ence SEC material.
As changes are made in the standards, there will be Accounting Standard Updates issued. The number-ing system for the updates will be the year followed by sequential number of the update for that year. The updates will be a transient document that includes background, the update to codification, and the basis for conclusions. The updates are not in themselves authoritative. As codification is updated, both the cur-rent paragraph and the updated paragraph will be in the codification during the transition period. Once the new paragraph is fully effective the outdated guidance will be removed.
Due to the volume of materials in ASC, it is anticipated that the primary method for accessing the information in ASC will be electronic. It is available at asc.fasb.org. Most of you will work for companies with a subscrip-tion to the professional view. There is a basic view, which is available for free, but it is fairly inefficient to use. A single user license for a year of professional view is $850. There are also multi-user licenses avail-able.
Even using the basic view at asc.fasb.org you can get a good feel for how codification is organized. In my opinion FASB did succeed in making things easier to find. You can review the topic names or, if you know the old standard and you want to know the new topic, you can use the cross reference tool. Due to the reor-ganization of the material, there is not necessarily a one-to-one or many-to-one mapping from old to new. Below are some rough descriptions of where to find things.
T here is a new acronym you need to know. ASC stands for Accounting Standards Codification. My goal in this article is to give a little back-
ground on ASC and a very basic tutorial for speaking the new lingo.
In 2004 the FASB undertook a project to replace the US GAAP hierarchy, which included accounting guid-ance from FASB, AICPA, EITF, and others, with a sin-gle authoritative codification. Codification, which was effective Sept. 15, 2009, replaces the hierarchy, where certain sources were considered more authoritative than others, with a single level. If it is in the codification, it is authoritative, and if it is not in the codification, it is not authoritative. An exception to this is pronounce-ments from the SEC. SEC rules may be considered authoritative and codification may reference SEC rules, but they are typically not reproduced in ASC and they may be updated outside of the process the FASB has put into place for updating the ASC.
A goal of codification was to simplify access to all US GAAP by codifying it in one spot and replicate the guidance that existed as of July 1, 2009. In that respect it isn’t new–it is just a reorganization of current mate-rials. This was a large project that combined the 168 FASB statements with thousands of other authoritative statements and produced one large guide with roughly 90 Topics.
Topics represent a collection of related guidance. There are five main groupings for topics:
1. General Principles (Topic Code 105) 2. Presentation (Topic Codes 205-280) 3. Financial Statement Accounts (Topic Codes 305-
740) 4. Broad Transactions (Topic Codes 805-860) 5. Industry Specific (Topic Codes 905-995)
Within topics are sub-topics and within sub-topics are sections. The sections follow a consistent numbering system (XXX-YY-ZZ where XXX = topic, YY = sub-topic, ZZ = section). For example, section 20 is always the Glossary. Those that work with the ASC regularly will also notice a pattern in the sub-topics. Two-digit
DouglasS.VanDam,FSA,MAAA,is
manager,ActuarialServicesfor
Polysystems,Inc.Hecanbecontactedat
312.578.3090.
10 | JUNE 2010 | The Financial Reporter
For insurance actuaries, Topic 944 Financial Services – Insurance, incorporates a long list of old standards, including FAS 60, 97, 113, 120, 163, SOP 92-5, 93-6, 94-5, 95-1, 00-3, 03-1, 05-1, FSP FAS 97-1, DIG B7, B8, G04, Practice Bulletins 8, 15, EITF 92-9, D-34, D-35, D-54 the AICPA’s Accounting and Auditing Guides.
For pension actuaries, it appears that much of their mate-rial has been combined into Topic 715 Compensation-Retirement Benefits. This topic includes in the cross reference FAS 87, 88, 106, 132(R), 158 various EITFs and FSPs. There is also Topic 712 Compensation-Nonretirement Post Employment Benefits with cross-references to prior standards FAS 88 and 112.
Other topics that you might previously have referred to by the FAS number include:
The Financial Reporter | JUNE 2010 | 11
Topic Prior FAS Incorporated Into Topic
310 Receivables FAS 91
320 Investments-Debt and Equity Securities FAS115, EITF D-41
350 Intangibles-Goodwill and Other FAS 142
450 Contingencies FAS 5
805 Business Combinations FAS 141(R)
815 Derivatives and Hedging FAS 133, 138, 149, and 155
820 Fair Value Measurements and Disclosure FAS 157
825 Financial Instruments FAS 159
12 | JUNE 2010 | The Financial Reporter
Dec. 31, 2011. (A proposed change may limit the scope to UL policies with secondary guarantees greater than five years.) Senior management is concerned about the potential magnitude of the increased required capital on the block of UL with secondary guarantees both at C3 Phase III adoption and in the future. Are there actions management can take to manage its required capital?
UL C3 Phase III Required Capital – Preliminary Report
To: CEO, CFO, CROFrom: Chief Actuary
BackgroundOur UL block can be divided into two sub-blocks. Block A consists of policies issued prior to 2003 with five-year secondary guar-antees and Block B is made up of policies issued in 2003 and later with guarantees to maturity. Up until now, all UL poli-cies belonged to one asset segment. For the purposes of performing the C3 Phase III calculation we recently formed a new asset sub-segment for Block B by taking a pro rata share of the total UL segmented assets based on account value.
FindingsBlock B has $115 million in statutory reserves with $100 million in account value. The cur-rent C3 required capital is $0.6 million. The new C3 Phase III required capital is $9.5 mil-lion (8.3 percent of the reserve). Maintaining our target 300 percent RBC ratio (which is well above the minimum required capital) will require $26.7 million in additional capital (24.8 percent of the reserve).
The large impact on capital is due to the short duration of the assets. Block B has much longer liability durations than the pro rata assets chosen to back Block B. Also, a recent buildup of cash and short-term bonds has shortened average asset durations relative to the liabilities.
T o date, numerous articles have covered the details of C3 Phase III in terms of various exposure drafts and associated terminology,
calculations, and requirements. Others have made comparisons between the proposed and current capital levels in a simplified setting. This article will do nei-ther. Instead, the following discussion will center on the implications for the Chief Actuary in communicat-ing the impact of C3 Phase III to management, once it becomes effective.
The stage after implementation will involve under-standing the implications of C3 Phase III from a business sense and how it will impact management decisions. Almost immediately, this stage will evolve into a process of trying to find answers to critical busi-ness issues and implementing viable solutions. See the sidebar on page 14 for a few questions management might ask.
Once actuaries have dealt with the mechanics, have wrestled with interpretations and have struggled with implementation issues (or perhaps even before all that occurs), management will want to anticipate what will happen to their capital and their business strategies. Management will entrust the challenging details to the actuaries, but they will want answers and they will want their questions answered not with details, but with a business view from 30,000 feet.
In the shaded box on the right is an Executive Summary case study. The analysis provided is a sample high-level summary of the business issues of C3 Phase III, without going into the minutiae that would necessarily be included in the actuarial supporting documentation. The block of business analyzed is based on a block of competitively designed UL poli-cies with secondary guarantees to maturity. The assets were modified and the results scaled for illustration purposes and anonymity.
Business issue: The new C3 Phase III capital require-ment for all life insurance policies becomes effective Dec. 31, 20XX and will apply to both in-force and new business. At the March 24–27 NAIC Meeting, Life RBC Working Group Chairman Barlow announced that C3 Phase III can be implemented no earlier than
Managing C3 Phase III – A Case Studyby Timothy C. Cardinal
TimothyC.Cardinal,FSA,MAAAisaVice
President,PolySystems,Inc.Hecanbe
The Financial Reporter | JUNE 2010 | 13
On the in-force block, in order to impact required capital levels, management can con-trol credited rates, investments and modify/enter into reinsurance or hedging arrange-ments. We found that changing the target spread is ineffective with respect to reducing required capital levels. Changing the target spread 50 bps reduces required capital by $1.0 million. The efficacy of increasing spreads is limited since many of the “bad” scenarios occur in low interest rate environments where much of the block is at minimum guaran-teed credited interest rates. However, we found that re-assigning assets to the Block B sub-segment to more closely match the liability duration was completely effective. The new C3 Phase III required capital under this asset re-allocation would be $0, thus not only preventing an additional $26.7 million in capital but also freeing up $1.8 million in capital or 1.6 percent of reserves (and main-taining a 300 percent RBC ratio). Note that statutory reserves are calculated according to current deterministic methodology and in this instance are greater than the C3 Phase III calculated capital requirements.
We did not consider product feature modifi-cations nor did we explore YRT reinsurance. We did not believe either to be a driver in the large capital requirements. Coinsuring the secondary guarantees, if available and fea-sible, would reduce the capital requirements.
RecommendationsWe recommend creating asset sub-segments where warranted. Active asset management will be needed going forward. Asset-liability duration mismatch risk is clearly a key driver of required capital levels. Further analysis will be needed to find the appropriate (best) balance between earnings and risk and to evaluate the cost of the additional required resources. C3 Phase III capital needs to be another factor to be considered when evaluat-
ing investment strategies and managing the trade-offs between cost of capital, yield, and credit and liquidity risks. C3 Phase III consid-erations will also need to be incorporated into product design and underwriting.
The brevity of this report is not indicative of the work effort required to implement a basic C3 Phase III framework. Work included performing experience studies and setting assumptions and margins, vetting interpreta-tions, and developing position papers. In addition, we evaluated alternative modeling decisions and determined model granular-ity, built new tools for analysis and con-trols, validated output, documented work pro-cesses and outcomes, and performed audits. Considerable time and effort will be needed to perform sensitivity analysis, to explore “what-ifs,” and to answer additional senior management questions. We have concerns regarding run-time and the impact on busi-ness close deadlines, business forecasts and strategic planning.
MethodBased on the Dec. 31, 2009 inventory we worked with our software vendor to build a C3 Phase III model based on our reporting production environment. We streamlined set-ting the C3 Phase III assumptions by making simplistic adjustments to our GAAP best esti-mate assumptions. Note we could have made adjustments to our cash flow testing assump-tions instead of to GAAP. Assumptions do reflect our significant underwriting experi-ence, whether guarantees are in-the-money, and the degree to which the guarantee is fully funded. Using our model, we projected the required liability and asset cash flows over 1,000 scenarios and performed the requisite calculations.
The case study above demonstrates the potential for business issues that might arise from the implementa-tion of C3 Phase III. While the focus to date has been
CONTINUED ON PAGE 14
14 | JUNE 2010 | The Financial Reporter
Potential Questions for the Chief Actuary from Management• What are the key elements of the C3 Phase
III calculation for our business that will cause required capital to change from the current required capital calculation?
• How is the assumption setting and docu-mentation different from what we do for GAAP or EV?
• Are our current systems, processes, models and experience studies capable of support-ing these new requirements?
• How can we implement C3 Phase III cost-effectively?
• How will it affect business close deadlines and will quality and controls suffer?
• What are our staffing and outsourcing needs during implementation and beyond?
• How do we do our business forecasts and support other strategic planning activities?
• What does it mean to my capital especially at a time when capital and liquidity are kings?
• How does it affect how we manage our present and future top and bottom lines and risk profile?
• How do we reflect C3 Phase III in our pric-ing and risk mitigation development cycles?
on calculation issues, the above scenario highlights the actuary’s role in the aftermath of the implementation of C3 Phase III.
In addition, the above scenario demonstrates the pos-sibilities for management to make decisions to better manage capital and earnings trade-offs. This is actually not surprising, but expected. The intent of the new requirements is that actions taken by management—product design, underwriting, actions influencing poli-cyholder behavior, investment and risk mitigation such as reinsurance and hedging—can be used to improve the financial health and performance of the insurance company and increase the understanding of the rela-tionships between the risk profile of the company and top/bottom line results.
Almost hidden in this case study, is that considerable effort and infrastructure will be needed prior to being in a position to answer the questions that will inevitably be asked. And when answered, the solutions will need to be communicated in terms of top-level business actions management can take.
Managing C3 Phase III … | FROM PAGE 13
The Financial Reporter | JUNE 2010 | 15
Report on the International Actuarial Association: Capetown Meeting by James Milholland
problem, generally relating to various rationales for recognizing revenue or deferring costs. These ideas were those that the IASB has already discussed, but because it has not made a final decision and it contin-ues to discuss them there is reason to hope that further clarification may contribute to finding a resolution.
The second topic was risk margins, which are now more commonly referred to as risk adjustments to distinguish them from the residual margins, which are now often referred to simply as the margins. Notwithstanding the confusion caused by the shifting terminology, actuaries agree that there should be a risk adjustment to insurance liabilities. There was a vocal minority of one, namely the author of this report, taking the view that there should be no risk adjustment to the measurement of insurance liabilities. Actuaries agreed that the IASB should not prescribe an approach to risk margins but should instead articulate the purpose of the risk margin and leave the approach to quantification of risk adjustments to preparers of financial statements. If the IAA gets its wish, it will undoubtedly be active in developing educational material and professional guid-ance on determining risk margins.
Discussion on the third topic, revenue recognition, focused on treatment of the residual margin. Some committee members expressed concern that the resid-ual margin obscures the profitability of new business, but most committee members acknowledged the dif-
JamesMilhollandisownerofMilhollandActuarialConsultinginRoswell,[email protected].
O nce again the Accounting Committee of the International Actuarial Association had hoped to use its meeting to write a com-
ment letter on the exposure draft of an International Financial Reporting Standard on insurance, but when the IAA met in Cape Town on March 3-5, the expo-sure draft had not been published. Despite the deferral of the response to an exposure draft, the Accounting Committee had a full agenda. It included organizing for the response to the exposure draft, commenting on the IASB’s proposed revisions to accounting for liabilities, approving a request for proposals on a monograph on discounting, addressing the development of actuarial standards, and sharing ideas with pension actuaries on accounting topics of common interest.
THE INSURANCE STANDARDUndeterred by the delays in the exposure draft, the Committee decided to provide unsolicited input to the International Accounting Standards Board on certain critical topics. The Committee hopes to assist the IASB by clarifying the issues and will not take positions on issues in this letter.
Leading the list of topics was acquisition expenses. Actuaries agreed that, if acquisition costs are expensed with no offsetting effects in revenue recognition or in the measurement of liabilities, the results may be misleading to users of financial statements. Committee members discussed several ideas for resolving the
CONTINUED ON PAGE 16
16 | JUNE 2010 | The Financial Reporter
Report On The International Actuarial Association … | FROM PAGE 15
There is also broad agreement among actuaries at the meeting that contracts should not be unbundled. …
PREPARING TO COMMENT ON THE EXPOSURE DRAFTIt now appears probable that the IASB will publish the ED in May or June with a comment period that ends in September. The IAA does not meet during this period, so the comment letter must be prepared without benefit of a regular meeting. The committee made plans for a process that uses smaller groups to address specific topics by using the Internet and by tele-conferencing. There will be a special meeting to pull the letter togeth-er either in July or September, depending on the actual date of publication for the exposure draft.
The planning was accompanied by additional discus-sions of topics not to be included in the unsolicited letter, with some interesting insights and perspectives. There is consensus among actuaries that the IASB should not prescribe approaches to the calculation of the liabilities, but should leave the development of practices to preparers. This means that the standard would not prescribe how insurers should set risk mar-gins (as noted previously) or discount rates. The dis-cussion of discount rates included some observations about adjustments to observed rates for differences in the liquidity of insurance contracts from that of the observed instrument. The discussions revealed that not all actuaries are confident that the adjustments can be made reliably. One can conclude that the process of developing application guidance to follow on to the standard may be very difficult indeed.
There is also broad agreement among actuaries at the meeting that contracts should not be unbundled, i.e., separated between the deposit and the insurance com-ponents, unless the components are not so interdepen-dent that they cannot be separated reliably. The IASB seems to favor unbundling for presentation purposes but is having difficulty finding satisfactory criteria for requiring unbundling. They are having difficulty defining “interrelated” and deciding if embedded derivatives require separation even if the contract is not unbundled. While it can be said that there is broad opposition to requiring unbundling, some insurers, Swedish bancassurers for instance, wish to unbundle and have asked that unbundling be permitted if not required. It is not clear where the IASB will land on
ficulty of measuring liabilities reliably enough to allow for some initial revenue recognition. The consensus view was that there should be a residual margin and the discussions centered on how it should be released. The period of release is the period over which the obliga-tions of the contract are fulfilled, but it may be difficult to identify a driver of the performance and hence a basis for the pattern of the release for some contracts, such as immediate annuities and long-tailed nonlife
insurance. There was discussion of the relative merits of re-measuring or not re-measuring residual margins when there are changes in the assumptions underlying the measurement of the liabilities. Re-measurement has a shock absorber effect and can mask the effects of changes in assumptions. On the other hand, not re-measuring seems more consistent with the idea that the residual margin should be reflected in revenue margins at some point in time and that a contract’s revenue should not be affected by changes in the estimated cost to fulfill the obligations. Committee members agreed that the amount of the residual margin and the move-ment in the residual margin should be disclosed.
A recurring topic in the discussion was the unit of account, which became the fourth topic for the letter. Currently the IASB sees each insurance contract as a unit of account with perhaps some consideration of portfolios in setting risk margins. In the discussions of the Accounting Committee, actuaries pointed out a number of areas where the unit of account needed to be a portfolio of contracts. Testing for onerous contracts, and incorporating decrements into revenue recognition are examples of areas where the accounting concepts are more appropriately applied to portfolios than to individual contracts.
The Financial Reporter | JUNE 2010 | 17
pensions will become the default approach for insur-ance contracts.
The measurement of pension liabilities does not include an adjustment for risk. Undoubtedly the IASB will at some point discuss the need for measurement of pen-sion liabilities to be consistent with the measurement of insurance liabilities. Actuaries at the joint meeting agreed that they should add risk margins to their list of topics of common interest.
RFP ON DISCOUNT RATESThe Subcommittee on Actuarial Standards approved a request for proposals to write a monograph on dis-counting. The monograph is intended to summarize concepts and practices in actuarial areas where the time value of money is significant. It is not intended to be an original research project. The request is open to all interested parties and will be circulated widely to actuaries and others in public practice and in academia who may be interested in proposing.
THE FUTURE OF ACTUARIAL STANDARDSThere are currently 12 International Actuarial Standards of Practice (IASP). Eleven of them relate to financial reporting under IFRS. All of the existing standards are Level IV type, which means they do not provide bind-ing guidance but are for educational purposes only. The IAA has recognized that having four classes of standards (ranging from binding guidance for all actu-aries in member organizations to notes for educational purposes only) is confusing and has decided to move to two types of guidance, model standards and practice notes. Model standards are binding only to actuaries in member organizations that have adopted the standard or if the actuary states that he has followed the stan-dards. Practice notes are for educational purposes.
The Standard subcommittee has agreed to convert most of the IASPs on financial reporting to Practice Notes, an effort that is fairly simple as it requires only minor reformatting and editing. The single excep-tion is IASP 2 Actuarial Practice When Providing Professional Services Concerning Financial Reporting under International Financial Reporting Standards. The
this topic and it is also not clear what position the IAA will take in the end.
IAS 37 LIABILITIESThe IAA is submitting a comment letter on the exposure draft of proposed revision to IAS 37 Liabilities. This standard applies to liabilities that are not addressed in other standards, so insurance contracts, pension liabili-ties, performance obligations, and financial liabilities are not in the scope of IAS 37. Because the Board seeks broad consistency among standards, IAS 37 is potentially precedent-setting and hence important to the development of the insurance standard and to the mea-surement of pension liabilities as well. The proposed revisions make clear that the measurement of liabilities include an adjustment for risk. The comment letter from the IAA is supportive of the proposed revisions. Among the actuaries discussing the IAA’s comment letter, there was one dissenting voice on adjustment for risk (once again, yours truly) that echoed the alternative view of some of the IASB members as presented in the appendix to the exposure draft. The Committee decided to submit its letter without an alternative view.
MEETINGS WITH PENSION ACTUARIESThe Accounting Committee met in a joint session with the Pension committee to discuss topics of common interest. The Pension actuaries are compiling a list of similarities and differences between insurance con-tracts and pension plans, which may inform the debate on the accounting for both categories of contracts. Similar discussions in past meetings of the IAA have focused on discount rates. Pension liabilities are dis-counted at high-grade bond yield rates. The IASB has tentatively decided that the discount rate for insurance contracts should reflect the characteristics of insur-ance liabilities and should be based on observed rates to the extent possible. The IASB does not intend to give further guidance on discount rates for insurance contracts. As things stand, guidance on discounting for pensions is fairly prescriptive whereas guidance for insurance contracts will leave room for interpreta-tion. It remains to be seen if the IASB will see a need to reconcile the standards or make them consistent. Some actuaries see a possibility that the guidance for
CONTINUED ON PAGE 18
Report On The International Actuarial Association … | FROM PAGE 17
18 | JUNE 2010 | The Financial Reporter
sions to explore the possibility of global convergence of national standards, perhaps leading to Globally Accepted Actuarial Standards (GAAS). The initia-tive for the discussions comes from the U.K. actuarial standard setters and from the Subcommittee. The dis-cussions are chaired by Hillevi Mannonen, an actuary from Finland, whose country currently has no codified standards and hence can be relatively neutral on the topic. The discussions are intended to result in a report or recommendations to be presented to the IAA at its next meeting in November in Vienna. It is not known if the report will recommend that convergence, if it is pur-sued, be an objective of the IAA or of some other body.
NEXT MEETINGBy the time of the next meeting of the IAA in October in Vienna, there should be some indication of the direction of global actuarial standards-setting. There will also undoubtedly be discussions on the IASB’s Exposure Draft on Insurance and on the comment let-ters from the IAA and others. Most importantly, the Accounting Committee will start developing applica-tion guidance and education on the new insurance standard.
members of the subcommittee believe that this IASP contains valuable general guidance and that it should be converted to a model standard. The subcommittee voted unanimously to submit to the IAA Council a Statement of Intent (SOI) to convert IASP 2 to a model standard.
IAA protocol dictates that the approval of the Professionalism Committee is also needed before the SOI is submitted to the Council. The Professionalism Committee did not approve the SOI because of:• concerns that the model standard would supersede
national standards and become binding,• concern that the SOI did not adequately describe the
intended content of the contemplated standard, and• a desire that the standard refer to specific IFRSs (e.g.,
to insurance and pension standards) rather than to IFRSs generally.
While the IAA standards setting process appears stalled, there is a new initiative to promote convergence of national actuarial standards. Concurrent with IAA committee meetings and in the same venue, ad hoc meetings took place in the form of roundtable discus-
The Financial Reporter | JUNE 2010 | 19
KarenRudolph,FSA,MAAA,isaconsultingactuarywithMilliman,Inc.inOmaha,[email protected].
Subsequently, at the NAIC Spring meeting, the choice of the subgroup (iii above) was affirmed by the full LHATF and adopted as part of the new VM-20 expo-sure draft.
AGGREGATIONSince its development, VM-20 allowed the company to aggregate, for purposes of determining the Stochastic Reserve, in a manner consistent with the company’s management of risks across differing product types, reflecting changes in risk offsets that may arise from shifts between product types. If a company manages the risks of two or more different product types as part of an integrated risk management process, then the products can be combined into the same subgroup for purposes of the Stochastic Reserve.
An amendment proposal form sponsored by New York required at a minimum, subgroups to be set up for each major insurance type: Term life Traditional permanent life Simplified or guaranteed issue life Universal life with secondary guarantees Universal life without secondary guarantees Variable universal life Credit life Blocks for which the company contemplates a trans-
action
Further, within each type, the company would be required to keep individual coverages separate from group coverages, separate from COLI/BOLI coverages.This amendment proposal form was adopted during a Feb. 17, 2010 conference call, but later reversed at the NAIC Spring meeting by the full LHATF. This topic of aggregation will remain on the issues list and will likely be discussed further.
DEFAULT COST METHODOLOGY/ REINVESTMENT SPREAD ASSUMPTIONSThe components of the methodology for setting asset default assumptions for assets with an NAIC desig-nation include a baseline default cost assumption; a spread related component and a maximum net spread
L ooking back to the last issue of Financial Reporter, I had commented on the issues remain-ing for the regulators to resolve before the
August, 2010 deadline. As you may recall, the Valuation Manual must be functionally complete before it can be placed, together with the revised Standard Valuation Law, into the state legislative process. Functionally complete (a term I coin here) is intended to mean that the minimum requirements for any given policy type, be they formulaic or principle-based, are addressed within the chapters of the Valuation Manual. In this issue, I summarize the efforts of the regulators to get to that point during the months January through March, 2010, just prior to the March NAIC meeting in Denver.
INTEREST SCENARIOSThe LHATF subgroup studying and making recommen-dations to the parent LHATF group has been debating the assumed mean reversion parameter (MRP) used within the Academy’s revised interest rate generator tool. The Academy working group responsible for developing the generator presented rationale several times surrounding their choice of a 5.5 percent MRP for longer maturity interest rates. The chair of the LHATF subgroup presented three alternatives. The alternatives included: i. A 50/50 blend of historical and three-year moving
averages of treasury rates. This is the Academy working group proposed MRP formula.
ii. Using two sets of scenarios, one with a high MRP; one with a low MRP. In this case, the determination of the stochastic reserve would be driven by the set that most adversely impacts the block being valued.
iii. Fifty percent weighting of the three-year moving average of 20-year treasury rates; plus 30 percent weighting of the 10-year moving average of 20- year treasury rates; plus 20 percent weighting of the historical (50-year) median yield of 20-year treasury rates less 25 basis points.
Recognizing the diminishing returns of analyzing this issue further, the subgroup voted in favor of using alter-native iii above. This formula will be used to set the MRP for interest rates within the Academy’s revised interest rate generator. For comparison, alternative iii produces an MRP of approximately 5.0 percent compared to the Academy’s recommendation in alternative i which pro-duced 5.5 percent.
PBA Cornerby Karen Rudolph
CONTINUED ON PAGE 20
20 | JUNE 2010 | The Financial Reporter
two compelling needs: first, the need for a reserve that can be considered to qualify as a tax-deductible reserve and second, to serve as an efficient minimum reserve for those products where, absent the NPR, the work involved in establishing the assumptions necessary for a deterministic reserve would be for naught after consideration of the cash surrender value floor. In the ACLI’s proposal, the cash surrender value floor is recognized in the net premium reserve determination.
During the first quarter 2010 conference calls, LHATF’s VM-20 subgroup was presented with a VM-20 amendment proposal that attempts to address both scope issues and small company considerations in one proposal. This proposal suggests the ACLI deter-ministic exclusion test can be used to determine which products can continue to use the current SVL reserve requirements (formulaic) and which would fall under the minimum requirement methods of VM-20. With the exception of credit life and pre-need insurance, the pro-posal would encompass all life insurance product types. The author of the proposal is Katie Campbell of the Alaska Division of Insurance. Each group of policies travels through the decision paths, where a group of policies is defined as policies with similar risk profiles.
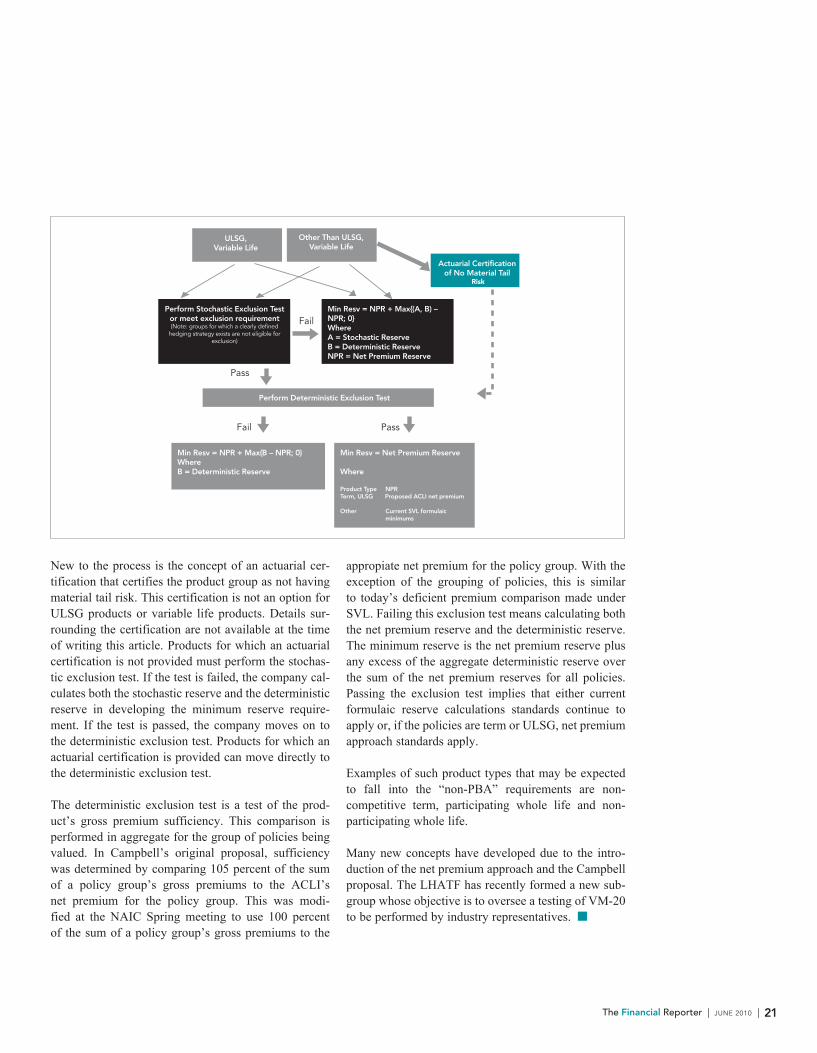
The May 7, 2010 working draft of VM-20 specifies the following procedures for life insurance products in scope. For policies considered ULSG or Variable Life, the company may elect to either perform the complete series of VM-20 calculations or perform the stochastic exclusion test. For products in scope other than ULSG and Variable Life, the company may elect the complete series of VM-20 calculations, or may elect to perform the stochastic exclusion test, or may submit an actuarial certification of no material tail risk. For policy groups subject to and passing the stochastic exclusion test, the deterministic exclusion test is performed next. A fail-ing outcome here means the policy group’s minimum reserve consists of the greater of the net premium reserve and the deterministic reserve. A passing out-come means the policy group’s minimum reserve is the net premium reserve, which is defined as the ACLI net premium reserve for term or ULSG products and the current CRVM minimums for other products in scope.
adjustment. The baseline assumption uses 20 rating cat-egories rather than the six used by the NAIC. Since the assumption for asset defaults is a prescriptive one, the margin is inherent in the prescribed assumption. If an asset does not have an NAIC designation the assumed default charge will be such that the net yield is no greater than 104 percent of the corresponding treasury rate plus 25 basis points. The LRWG’s Asset Subgroup provided complete documentation of the recommended methodology to LHATF at the NAIC Spring meeting. The proposal was adopted as part of the new VM-20 exposure draft.
During the second quarter of 2010, the LRWG Asset Subgroup will respond to feedback on their proposed asset default methodology; continue review of how the methodology impacts reserves and reserve volatility; and provide details of an alternate formula for pre-scribed reinvestment spreads.
NET PREMIUM RESERVE APPROACH AND VM-20 SCOPEIn the last issue, I provided a high-level overview of the net premium reserve (NPR) approach championed by the ACLI. The proposed NPR is believed to satisfy
PBA Corner … | FROM PAGE 19
The Financial Reporter | JUNE 2010 | 21
New to the process is the concept of an actuarial cer-tification that certifies the product group as not having material tail risk. This certification is not an option for ULSG products or variable life products. Details sur-rounding the certification are not available at the time of writing this article. Products for which an actuarial certification is not provided must perform the stochas-tic exclusion test. If the test is failed, the company cal-culates both the stochastic reserve and the deterministic reserve in developing the minimum reserve require-ment. If the test is passed, the company moves on to the deterministic exclusion test. Products for which an actuarial certification is provided can move directly to the deterministic exclusion test.
The deterministic exclusion test is a test of the prod-uct’s gross premium sufficiency. This comparison is performed in aggregate for the group of policies being valued. In Campbell’s original proposal, sufficiency was determined by comparing 105 percent of the sum of a policy group’s gross premiums to the ACLI’s net premium for the policy group. This was modi-fied at the NAIC Spring meeting to use 100 percent of the sum of a policy group’s gross premiums to the
appropiate net premium for the policy group. With the exception of the grouping of policies, this is similar to today’s deficient premium comparison made under SVL. Failing this exclusion test means calculating both the net premium reserve and the deterministic reserve. The minimum reserve is the net premium reserve plus any excess of the aggregate deterministic reserve over the sum of the net premium reserves for all policies. Passing the exclusion test implies that either current formulaic reserve calculations standards continue to apply or, if the policies are term or ULSG, net premium approach standards apply.
Examples of such product types that may be expected to fall into the “non-PBA” requirements are non-competitive term, participating whole life and non-participating whole life.
Many new concepts have developed due to the intro-duction of the net premium approach and the Campbell proposal. The LHATF has recently formed a new sub-group whose objective is to oversee a testing of VM-20 to be performed by industry representatives.
ULSG,Variable Life
Perform Deterministic Exclusion Test
Other Than ULSG, Variable Life
Actuarial Certification of No Material Tail
Risk
Perform Stochastic Exclusion Test or meet exclusion requirement (Note: groups for which a clearly defined
hedging strategy exists are not eligible for exclusion)
Min Resv = NPR + Max{(A, B) – NPR; 0}WhereA = Stochastic ReserveB = Deterministic ReserveNPR = Net Premium Reserve
Min Resv = NPR + Max{B – NPR; 0} WhereB = Deterministic Reserve
Min Resv = Net Premium Reserve
Where
Product Type NPRTerm, ULSG Proposed ACLI net premium
Other Current SVL formulaic minimums
Fail
Fail
Pass
Pass
22 | JUNE 2010 | The Financial Reporter
CraigW.Reynolds,FSA,MAAA,isprin-cipalandconsultingactuaryforMilliman,
Inc.Hecanbecontactedatcraig.reynolds@milliman.
com
Model Compression and Stochastic Modelingby Craig W. Reynolds
For the last several years, the U.S. life insurance industry has been moving gradually towards a principle-based approach to statutory valuation.
While the ultimate destination or arrival date for this journey is still far from clear, it seems likely that princi-ple-based valuation will involve stochastic modeling in many cases. For variable annuities, stochastic principle-based statutory valuation became a reality at the end of 2009 when Actuarial Guideline 43 (AG 43) became effective. Furthermore, stochastic modeling is becoming more common for other applications as well, such as embedded value, enterprise risk management, economic capital, and fair value valuation. And of course, stochas-tic modeling has already been part of statutory exercises already in areas such as C-3 Phase 2 and, in some cases, cash flow testing.
While principle-based valuation has been a reality for some time in some markets (e.g., Canada) and for US GAAP (e.g., FAS 157), AG 43 is the first application of stochastic principle-based valuation in U.S. statutory accounting. As such, we should take an opportunity to look at what we learned in this exercise that we can apply to any future stochastic reserve or capital calculations that might arise in the move to a principle-based approach (PBA). Some key issues that distinguish stochastic PBA from traditional valuation approaches include:
• Valuation may be done using projection systems rather than traditional valuation systems.
• Assumptions may be largely up to the judgment of the individual actuary rather than prescribed.
• Assumptions and economic conditions may change dramatically from period to period.
• Calculations will be aggregate in nature, and then allocated to policies, rather than the reverse.
• Reinsurance will be reflected in a fundamentally different way.
• Assets need to be modeled. • Hedging may need to be reflected.
Each of these issues combine together to create compli-cations with respect to: • controls, • auditing, • movement analysis, and • model runtime.
Each of these complications is significant and will cause most companies to fundamentally overhaul their valuation processes. For purposes of this article, I will focus on the last issue: runtime. Runtime is significant for stochastic valuation applications because of the large number of cells, the large number of scenarios, and the need to perform principle-based forecasts rather than prescribed closed-form calculations. In contrast, for most companies using traditional valuation process-es, machine runtime is not a material factor in periodic financial reporting exercises.
RUNTIME REDUCTION OPTIONSAG 43 calculations for most companies require calcula-tions in excess of 100,000 policies across 1,000 or more scenarios. For companies modeling dynamic hedging, each policy might need to be projected thousands of times for each scenario in order to calculate required liability “Greeks.” Clearly, this can result in an extraor-dinarily lengthy runtime. Some of the options available for reducing runtime for such models include:
• reduce liability cell count, • reduce asset cell count, • reduce scenario count, • reduce path count for hedging, • simplify actuarial calculations, • utilize faster or more hardware, and • utilize faster software.
The American Academy of Actuaries has a Model Efficiency Working Group (MEWG), of which I am a member, that is charged with exploring these and related options. In this article I am speaking for myself, and not for the MEWG.
The MEWG has attempted, with some success, to iden-tify specific actions that companies are currently taking to manage runtime efficiently. But it is clear that compa-nies can do more to reduce runtime and most would like to do so. While more and faster hardware and software are always desirable, I believe that reduced cell or sce-nario counts offer the most hope for runtime improve-ments in the orders of magnitude that might be desired. This article summarizes a case study of one application of cell reduction.
The Financial Reporter | JUNE 2010 | 23
REDUCING SCENARIOSFor AG 43, the Academy has published a set of 10,000 economic scenarios. Most companies that I work with have used 1,000 of these scenarios to drive their AG 43 work. In fact, it seems many valuation actuaries almost view this as a “safe harbor.” So perhaps before we think about reducing below 1,000 scenarios, we need to consider this fundamental question: Is 1,000 enough? Unfortunately, I know of no way to resolve this issue without running 10,000 scenarios, and seeing how the answer changes as we reduce the scenario count gradu-ally down to 1,000. This is perhaps an exercise that could be done well in advance of year-end.
Much research has been done on the topic of sce-nario reduction. Unfortunately, most techniques for analyzing the error in scenario reduction appear to be designed assuming that scenarios are chosen randomly from an adequately large universe of scenarios. In contrast, many reduction techniques rely on a distance measure to stratify and map scenarios, so the statisti-cal tools used to analyze the appropriateness of the reduction may be of limited value. In practice, the best way to measure the appropriateness of the reduction might be to run a test model through a larger number of scenarios to see if the answer changes materially. As discussed below, cell compression techniques might be one useful means of creating a model that is sufficiently representative for such testing, while small enough to run in a viable amount of time.
In my experience, it is not likely that scenario count could be reduced much below 100, if we still want results that sufficiently capture the distributions illus-trated by a run of 1,000 scenarios that we might start with. Thus, for truly revolutionary reduction in runtime, we need to consider liability and asset cell reduction.
LIABILITY AND ASSET CELL REDUCTIONMost actuaries have at some time in their career utilized traditional techniques to reduce cell count for projec-tion purposes, but such compression is atypical for statutory valuation in the United States. When used, such techniques have often included strategies such as: • mapping issues ages into quinquennial or decennial
issue age bands,
• mapping similar plans together, • mapping issue dates into central issue points within
a year or a quarter of a year, and • mapping all cells as male cells, perhaps with an age
setback or a blending of mortality rates.
These techniques have their place, but for some lines of business (LOBs), including variable annuities, they have their limitations. Among other things, these sorts of mappings tend to mask factors such as “in-the-mon-eyness” or fund distribution, which can have a material impact on model results. After allowing for this, it is challenging to compress models by more than a factor of 10 or so.
At Milliman we have developed a technique that we call “cluster modeling” that can greatly improve model compression ratios, or improve model fit for a given level of compression.1 Rather than presenting the details here, this article focuses on results of a single case study. Case studies such as these can serve an important purpose, in that they can give modelers and regulators increased comfort with compression tech-niques. This is particularly important now, as using liability or asset cell compression has not historically been common in statutory valuation exercises.
Cluster modeling is clearly not the only available option for cell compression, but we illustrate it here as a particularly effective technique that can be used for stochastic valuation calculations, such as those required by AG 43.
CASE STUDY FOR LIABILITY CELL COMPRESSIONIn our case study we consider a variable annuity block with more than 100,000 policies in-force.2 The block
CONTINUED ON PAGE 24
FOOTNOTES:1 Freedman, A. & Reynolds, C. (August 2008). Cluster analysis: A spatial
approach to actuarial modeling. Milliman Research Report. Retrieved March 16, 2010, from http://www.milliman.com/expertise/life-finan-cial/publications/rr/pdfs/cluster-analysis-a-spatial-rr08-01-08.pdf. The technique is also described in some detail in the July 2009 issue of CompAct (http://www.soa.org/library/newsletters/compact/2009/july/com-2009-iss32.pdf).
2 While the results presented here are based on a real valuation AG 43 model, modest changes have been made to the model to ensure confidentiality. As such, calculated reserves reported here will not tie to the reserves reported by the company.

24 | JUNE 2010 | The Financial Reporter
Model Compression … | FROM PAGE 23
… we are running the seriatim model only five times, and we will run the compressed model at least 1,000 times. …
includes account values of approximately $9.5 billion, a cash surrender value of approximately $9.0 billion, and a variety of Guaranteed Minimum Benefits (GMB), including GMAB, GMDB, GMIB, and GMWB. We will focus here on the stochastically calculated greatest present value of accumulated deficiencies, because the standard scenario reserve is straightforward to calculate on a seriatim basis, and in fact must be calculated that way. The 70 CTE value on a seriatim basis for this block is $143.6 million. Of course, this amount must be added to the starting asset amount and compared to the standard scenario reserve to get the final AG 43 reserve.
For convenience and ease of presentation we have ignored the impacts of reinsurance.
Using clustering, we modeled the liability cells into successively smaller models, using model criteria designed to closely reproduce values of the following key metrics across five representative scenarios. We refer to these variables as “location variables”:
• initial GMB face amount for each benefit type and guarantee type,
• initial account value in-force by fund, • present value of net revenue, • present value of commission income, • present value of revenue sharing, • present value of maintenance expenses, • present value of M&E fee income, and • present value of net benefit costs for each GMB
type (benefits paid less associated charges).
For each location variable that requires present values, we ran our model seriatim across five scenarios to get calibration data to drive our mapping process. The five scenarios were chosen to represent the 2.5 percent, 20
percent, 50 percent, 80 percent, and 97.5 percent level of the aggregate average wealth ratios across the com-plete set of 1,000 scenarios. The model reflected seven different equity indices and a fixed account. We used the five-year U.S. Treasury rate as the representative interest rate to be indicative of the level of interest rates for bond funds, and we weighted each of the indices by the associated initial fund allocation in order to drive average wealth ratios.
While at first it might seem counterproductive to run the model seriatim in order to get data to produce a model, remember that we are running the seriatim model only five times, and we will run the compressed model at least 1,000 times—potentially many more times than this if we conduct sensitivity testing. Thus, the investment in five seriatim runs to get data to allow us to run thousands of other runs in a time that is orders of magnitude faster is clearly worthwhile.
The table in Figure 1 summarizes the fit of selected model location variables as of the valuation date using various levels of model compression. In the com-pressed models, the original in-force, with more than 100,000 policies in-force, is compressed to models ranging in size from 5,000 cells to 50 cells. In these tables, the “Variable Weight” is an indicator of the priority we assigned to replicating that variable’s value. As we would expect, in general, we get a better fit for higher-weighted variables. As with selecting the location variables themselves, selecting the weights requires some judgment.
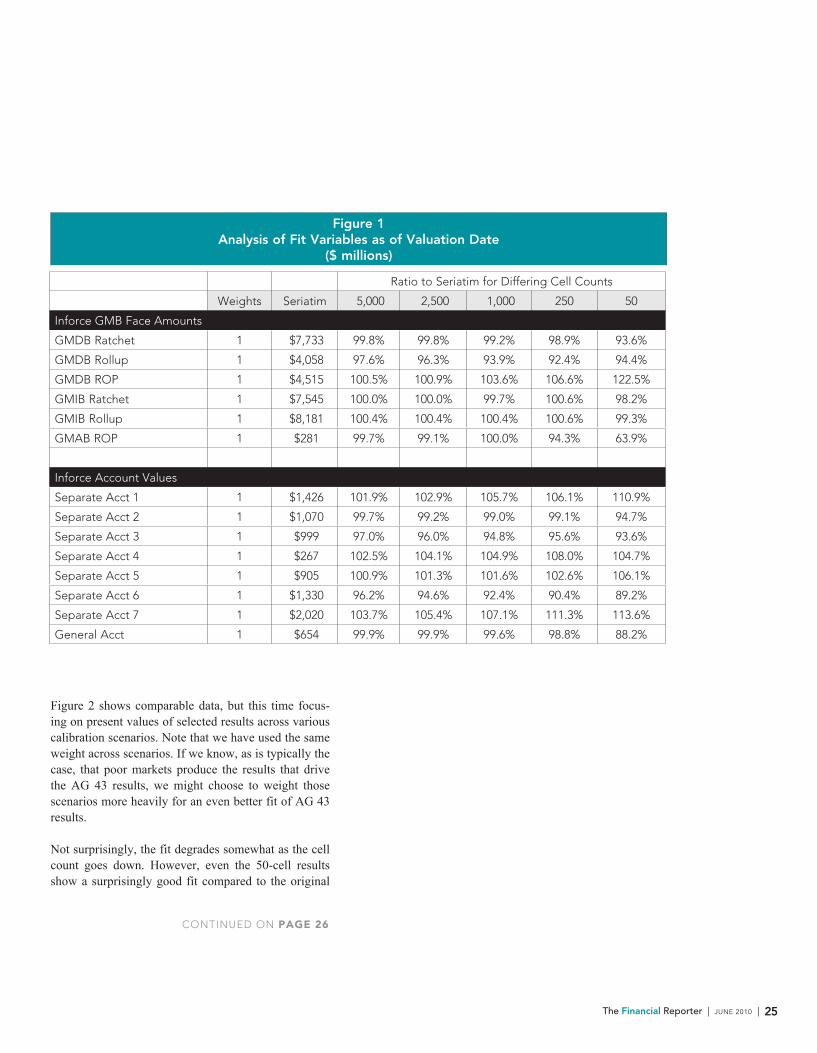
The Financial Reporter | JUNE 2010 | 25
Figure1AnalysisofFitVariablesasofValuationDate
($millions)
Figure 2 shows comparable data, but this time focus-ing on present values of selected results across various calibration scenarios. Note that we have used the same weight across scenarios. If we know, as is typically the case, that poor markets produce the results that drive the AG 43 results, we might choose to weight those scenarios more heavily for an even better fit of AG 43 results.
Not surprisingly, the fit degrades somewhat as the cell count goes down. However, even the 50-cell results show a surprisingly good fit compared to the original
CONTINUED ON PAGE 26
Ratio to Seriatim for Differing Cell Counts
Weights Seriatim 5,000 2,500 1,000 250 50
Inforce GMB Face Amounts
GMDB Ratchet 1 $7,733 99.8% 99.8% 99.2% 98.9% 93.6%
GMDB Rollup 1 $4,058 97.6% 96.3% 93.9% 92.4% 94.4%
GMDB ROP 1 $4,515 100.5% 100.9% 103.6% 106.6% 122.5%
GMIB Ratchet 1 $7,545 100.0% 100.0% 99.7% 100.6% 98.2%
GMIB Rollup 1 $8,181 100.4% 100.4% 100.4% 100.6% 99.3%
GMAB ROP 1 $281 99.7% 99.1% 100.0% 94.3% 63.9%
Inforce Account Values
Separate Acct 1 1 $1,426 101.9% 102.9% 105.7% 106.1% 110.9%
Separate Acct 2 1 $1,070 99.7% 99.2% 99.0% 99.1% 94.7%
Separate Acct 3 1 $999 97.0% 96.0% 94.8% 95.6% 93.6%
Separate Acct 4 1 $267 102.5% 104.1% 104.9% 108.0% 104.7%
Separate Acct 5 1 $905 100.9% 101.3% 101.6% 102.6% 106.1%
Separate Acct 6 1 $1,330 96.2% 94.6% 92.4% 90.4% 89.2%
Separate Acct 7 1 $2,020 103.7% 105.4% 107.1% 111.3% 113.6%
General Acct 1 $654 99.9% 99.9% 99.6% 98.8% 88.2%
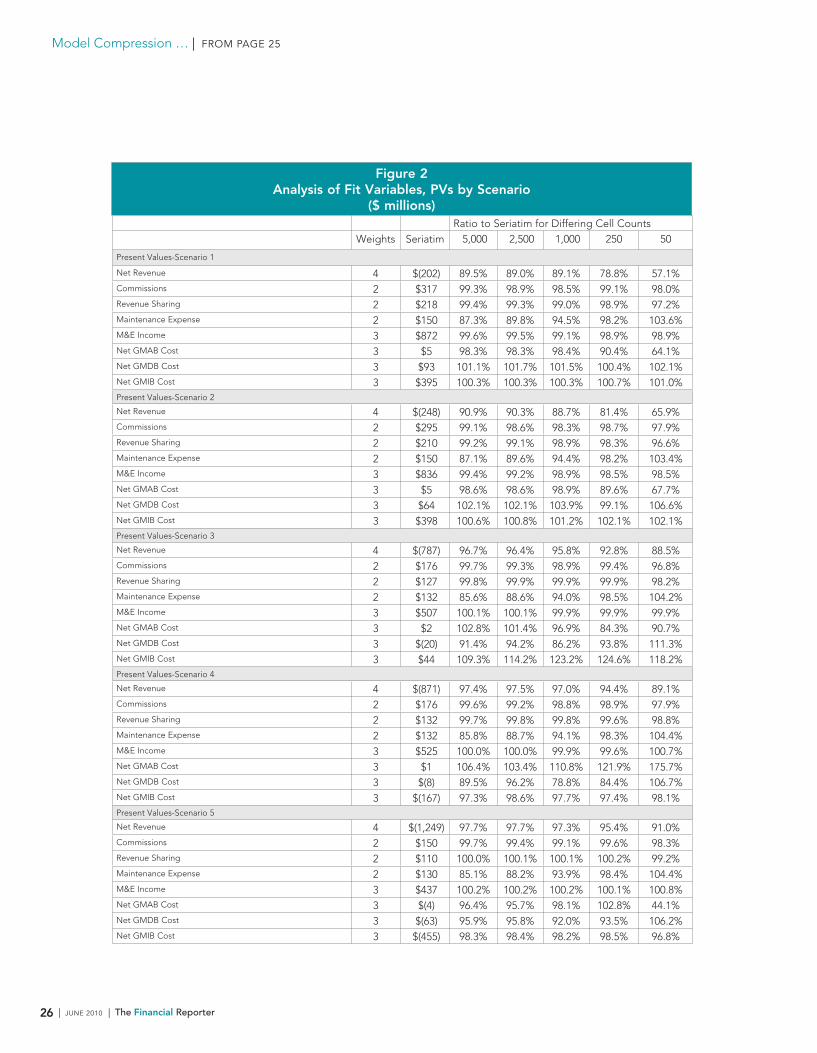
Model Compression … | FROM PAGE 25
26 | JUNE 2010 | The Financial Reporter
Figure2AnalysisofFitVariables,PVsbyScenario
($millions)Ratio to Seriatim for Differing Cell Counts
Weights Seriatim 5,000 2,500 1,000 250 50
Present Values-Scenario 1
Net Revenue 4 $(202) 89.5% 89.0% 89.1% 78.8% 57.1%Commissions 2 $317 99.3% 98.9% 98.5% 99.1% 98.0%Revenue Sharing 2 $218 99.4% 99.3% 99.0% 98.9% 97.2%Maintenance Expense 2 $150 87.3% 89.8% 94.5% 98.2% 103.6%M&E Income 3 $872 99.6% 99.5% 99.1% 98.9% 98.9%Net GMAB Cost 3 $5 98.3% 98.3% 98.4% 90.4% 64.1%Net GMDB Cost 3 $93 101.1% 101.7% 101.5% 100.4% 102.1%Net GMIB Cost 3 $395 100.3% 100.3% 100.3% 100.7% 101.0%Present Values-Scenario 2
Net Revenue 4 $(248) 90.9% 90.3% 88.7% 81.4% 65.9%Commissions 2 $295 99.1% 98.6% 98.3% 98.7% 97.9%Revenue Sharing 2 $210 99.2% 99.1% 98.9% 98.3% 96.6%Maintenance Expense 2 $150 87.1% 89.6% 94.4% 98.2% 103.4%M&E Income 3 $836 99.4% 99.2% 98.9% 98.5% 98.5%Net GMAB Cost 3 $5 98.6% 98.6% 98.9% 89.6% 67.7%Net GMDB Cost 3 $64 102.1% 102.1% 103.9% 99.1% 106.6%Net GMIB Cost 3 $398 100.6% 100.8% 101.2% 102.1% 102.1%Present Values-Scenario 3
Net Revenue 4 $(787) 96.7% 96.4% 95.8% 92.8% 88.5%Commissions 2 $176 99.7% 99.3% 98.9% 99.4% 96.8%Revenue Sharing 2 $127 99.8% 99.9% 99.9% 99.9% 98.2%Maintenance Expense 2 $132 85.6% 88.6% 94.0% 98.5% 104.2%M&E Income 3 $507 100.1% 100.1% 99.9% 99.9% 99.9%Net GMAB Cost 3 $2 102.8% 101.4% 96.9% 84.3% 90.7%Net GMDB Cost 3 $(20) 91.4% 94.2% 86.2% 93.8% 111.3%Net GMIB Cost 3 $44 109.3% 114.2% 123.2% 124.6% 118.2%Present Values-Scenario 4
Net Revenue 4 $(871) 97.4% 97.5% 97.0% 94.4% 89.1%Commissions 2 $176 99.6% 99.2% 98.8% 98.9% 97.9%Revenue Sharing 2 $132 99.7% 99.8% 99.8% 99.6% 98.8%Maintenance Expense 2 $132 85.8% 88.7% 94.1% 98.3% 104.4%M&E Income 3 $525 100.0% 100.0% 99.9% 99.6% 100.7%Net GMAB Cost 3 $1 106.4% 103.4% 110.8% 121.9% 175.7%Net GMDB Cost 3 $(8) 89.5% 96.2% 78.8% 84.4% 106.7%Net GMIB Cost 3 $(167) 97.3% 98.6% 97.7% 97.4% 98.1%Present Values-Scenario 5
Net Revenue 4 $(1,249) 97.7% 97.7% 97.3% 95.4% 91.0%Commissions 2 $150 99.7% 99.4% 99.1% 99.6% 98.3%Revenue Sharing 2 $110 100.0% 100.1% 100.1% 100.2% 99.2%Maintenance Expense 2 $130 85.1% 88.2% 93.9% 98.4% 104.4%M&E Income 3 $437 100.2% 100.2% 100.2% 100.1% 100.8%Net GMAB Cost 3 $(4) 96.4% 95.7% 98.1% 102.8% 44.1%Net GMDB Cost 3 $(63) 95.9% 95.8% 92.0% 93.5% 106.2%Net GMIB Cost 3 $(455) 98.3% 98.4% 98.2% 98.5% 96.8%
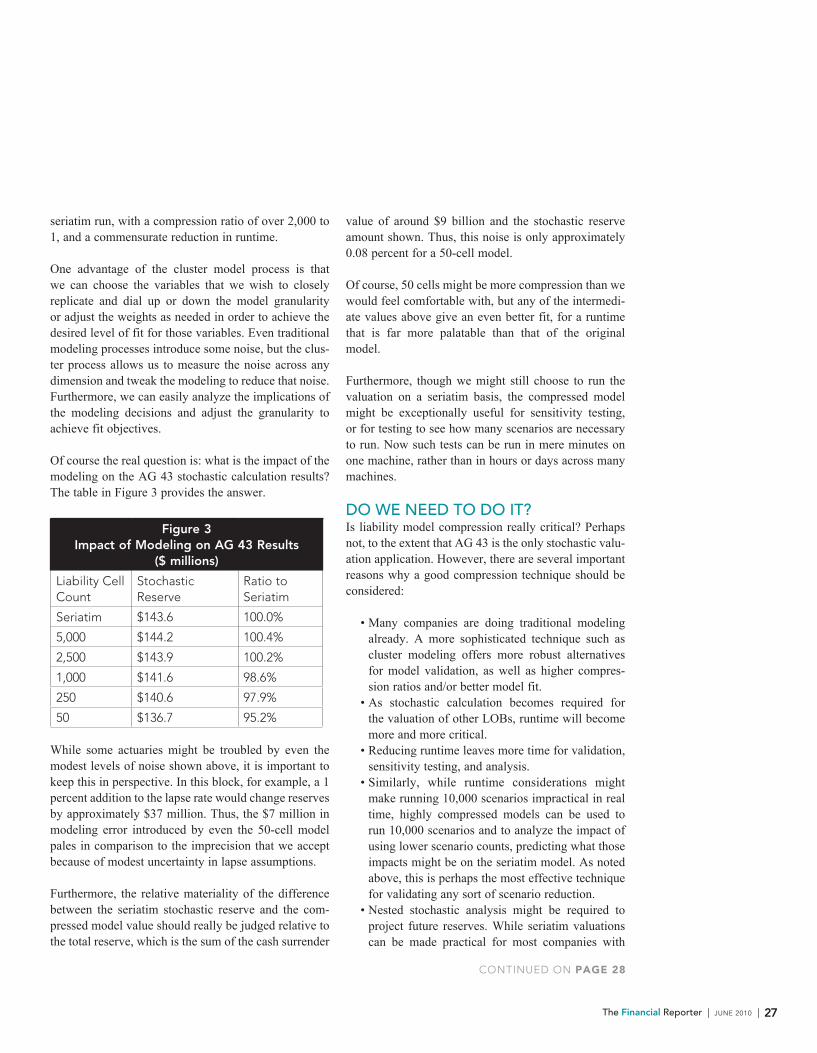
The Financial Reporter | JUNE 2010 | 27
seriatim run, with a compression ratio of over 2,000 to 1, and a commensurate reduction in runtime.
One advantage of the cluster model process is that we can choose the variables that we wish to closely replicate and dial up or down the model granularity or adjust the weights as needed in order to achieve the desired level of fit for those variables. Even traditional modeling processes introduce some noise, but the clus-ter process allows us to measure the noise across any dimension and tweak the modeling to reduce that noise. Furthermore, we can easily analyze the implications of the modeling decisions and adjust the granularity to achieve fit objectives.
Of course the real question is: what is the impact of the modeling on the AG 43 stochastic calculation results? The table in Figure 3 provides the answer.
Figure3ImpactofModelingonAG43Results
($millions)
Liability Cell Count
Stochastic Reserve
Ratio to Seriatim
Seriatim $143.6 100.0%
5,000 $144.2 100.4%
2,500 $143.9 100.2%
1,000 $141.6 98.6%
250 $140.6 97.9%
50 $136.7 95.2%
While some actuaries might be troubled by even the modest levels of noise shown above, it is important to keep this in perspective. In this block, for example, a 1 percent addition to the lapse rate would change reserves by approximately $37 million. Thus, the $7 million in modeling error introduced by even the 50-cell model pales in comparison to the imprecision that we accept because of modest uncertainty in lapse assumptions.
Furthermore, the relative materiality of the difference between the seriatim stochastic reserve and the com-pressed model value should really be judged relative to the total reserve, which is the sum of the cash surrender
value of around $9 billion and the stochastic reserve amount shown. Thus, this noise is only approximately 0.08 percent for a 50-cell model.
Of course, 50 cells might be more compression than we would feel comfortable with, but any of the intermedi-ate values above give an even better fit, for a runtime that is far more palatable than that of the original model.
Furthermore, though we might still choose to run the valuation on a seriatim basis, the compressed model might be exceptionally useful for sensitivity testing, or for testing to see how many scenarios are necessary to run. Now such tests can be run in mere minutes on one machine, rather than in hours or days across many machines.
DO WE NEED TO DO IT?Is liability model compression really critical? Perhaps not, to the extent that AG 43 is the only stochastic valu-ation application. However, there are several important reasons why a good compression technique should be considered:
• Many companies are doing traditional modeling already. A more sophisticated technique such as cluster modeling offers more robust alternatives for model validation, as well as higher compres-sion ratios and/or better model fit.
• As stochastic calculation becomes required for the valuation of other LOBs, runtime will become more and more critical.
• Reducing runtime leaves more time for validation, sensitivity testing, and analysis.
• Similarly, while runtime considerations might make running 10,000 scenarios impractical in real time, highly compressed models can be used to run 10,000 scenarios and to analyze the impact of using lower scenario counts, predicting what those impacts might be on the seriatim model. As noted above, this is perhaps the most effective technique for validating any sort of scenario reduction.
• Nested stochastic analysis might be required to project future reserves. While seriatim valuations can be made practical for most companies with
CONTINUED ON PAGE 28
Model Compression … | FROM PAGE 27
28 | JUNE 2010 | The Financial Reporter
is not adequately addressed, PBA will not be practical. Early evaluation and validation of scenario reduction and model compression techniques will be an important key to success. If you would like to help in this process, feel free to contact the author at [email protected], or Tony Dardis, chair of the MEWG, at [email protected].
adequate hardware and software, nested seria-tim stochastic applications are almost certainly impractical for all but the smallest blocks of busi-ness.
CONCLUSIONModel efficiency is just one issue to consider in the long list of practical issues as we move to principle-based methods for reserves and capital. But if this issue

Yuhong(Jason)Xue,FSA,MAA,isanofficerofRetirementSolutionsattheGuardianLifeInsuranceofAmericainNewYork,[email protected].
The Financial Reporter | JUNE 2010 | 29
AG 43: Which Reserves Will Dominate? Standard Scenario Or Stochasticby Yuhong (Jason) Xue
Obviously capital market movement is a big driver. Generally, higher account values would reduce the reserve requirements while lower ones would push both the standard scenario and stochastic reserve up. But which is more sensitive to the capital market? Unfortunately, there is not a straightforward answer. It depends on a long list of factors, some of which are: • in-force business mix,• mix and volume of new business,• policy holder behavior assumptions such as
dynamic lapses and withdrawal delays for with-drawal benefits,
• revenue sharing considered “guaranteed” in the standard scenario reserve, and
• stochastic scenario generation process.
In addition to affecting the value of the fixed invest-ments in the separate account, interest rate movement can impact the reserve calculations directly. The stan-dard scenario reserve uses issue year based prescribed interest rates as the discount and reinvestment rates. The calculation itself is insensitive to current interest rate movement. However, the regulation permits a reserve credit if companies are holding hedge assets for their VA business as of the valuation date. The hedge assets could move up and down as interest rates move, so could the reserve credit, which ultimately impacts the standard scenario reserve.
Interest rates affect stochastic reserve calculations in a different way. AG 43 permits three options for dis-count or reinvestment rates in the stochastic model: 1) the forward interest rates implied by the swap curve, 2) C3 Phase I interest rates with modifications, and 3) stochastically generated rates that integrate the devel-opment of interest rates and separate account returns. Options 1) and 3) both reflect the current interest rate environment, although by different degrees. Adopting these options in the stochastic model means that the stochastic reserve would be affected by current inter-est rate movement. Moreover, interest rate movement will impact the value of the starting assets, including hedge assets, in the stochastic model, which will in turn impact the stochastic reserve.
For the Variable Annuity (VA) writers in the United States, the year 2009 marked the begin-ning of a new era of principle-based statutory
reserves. AG VACARVM (Actuarial Guideline cover-ing the Commissioners’ Annuity Reserving Valuation Method for VAs) was adopted by the NAIC (National Association of Insurance Commissioners) and became known as Actuarial Guideline 43 or AG 43. It has been effective since Dec. 31, 2009.
Unlike the old rules which valued the VA base con-tract, death benefit and living benefit guarantees sepa-rately, AG 43 calculates an integrated reserve taking all contract features into consideration. The guideline mandates the calculations of two reserves: a standard scenario reserve based on prescribed assumptions and a deterministic scenario, and a stochastic reserve using prudent best estimate assumptions and calculated over a large number of economic scenarios. The larger of the two reserves is the final AG 43 reserve.
Companies have finished implementing the new reserv-ing standard and have reported the first AG 43 reserves of their VA businesses for year-end 2009. Interestingly, underneath the reported reserve, for some companies the dominant force is the standard scenario reserve, but for others it’s the stochastic one. What drives this phenomenon? Companies’ own unique product fea-tures, business mix, and the timing of the past sales are among the determining factors. Also underlying this phenomenon are companies’ own assumptions, margins on the assumptions, and their interpretations of the regulation. Given these determining factors, a key question is: which reserve will win the battle—standard or stochastic? Under what circumstances will the bal-ance of power flip?
The answer to this question is crucial to companies’ ability to accurately explain reserve changes from quarter to quarter, forecast reserves for a longer time horizon and understand reserve impact in various con-ditions, especially stressful ones.
But in order to find the answer, let’s first examine how the standard scenario and the stochastic reserve move through time.
CONTINUED ON PAGE 30
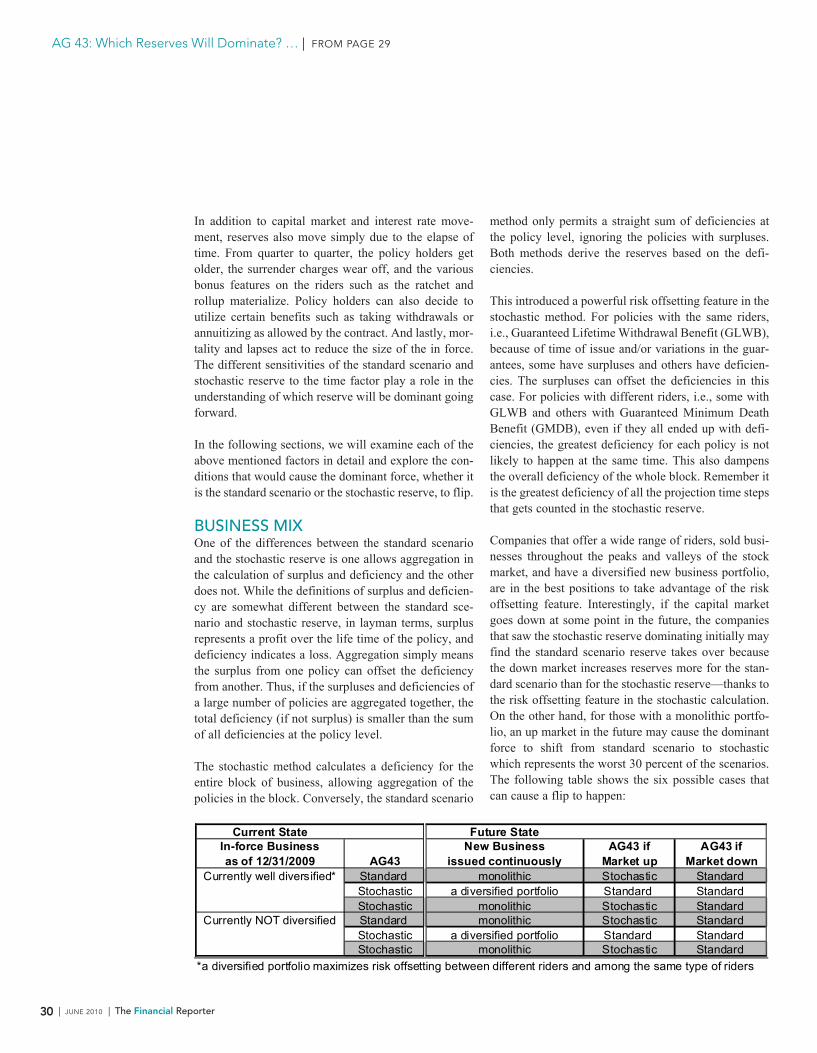
30 | JUNE 2010 | The Financial Reporter
method only permits a straight sum of deficiencies at the policy level, ignoring the policies with surpluses. Both methods derive the reserves based on the defi-ciencies.
This introduced a powerful risk offsetting feature in the stochastic method. For policies with the same riders, i.e., Guaranteed Lifetime Withdrawal Benefit (GLWB), because of time of issue and/or variations in the guar-antees, some have surpluses and others have deficien-cies. The surpluses can offset the deficiencies in this case. For policies with different riders, i.e., some with GLWB and others with Guaranteed Minimum Death Benefit (GMDB), even if they all ended up with defi-ciencies, the greatest deficiency for each policy is not likely to happen at the same time. This also dampens the overall deficiency of the whole block. Remember it is the greatest deficiency of all the projection time steps that gets counted in the stochastic reserve.
Companies that offer a wide range of riders, sold busi-nesses throughout the peaks and valleys of the stock market, and have a diversified new business portfolio, are in the best positions to take advantage of the risk offsetting feature. Interestingly, if the capital market goes down at some point in the future, the companies that saw the stochastic reserve dominating initially may find the standard scenario reserve takes over because the down market increases reserves more for the stan-dard scenario than for the stochastic reserve—thanks to the risk offsetting feature in the stochastic calculation. On the other hand, for those with a monolithic portfo-lio, an up market in the future may cause the dominant force to shift from standard scenario to stochastic which represents the worst 30 percent of the scenarios. The following table shows the six possible cases that can cause a flip to happen:
In addition to capital market and interest rate move-ment, reserves also move simply due to the elapse of time. From quarter to quarter, the policy holders get older, the surrender charges wear off, and the various bonus features on the riders such as the ratchet and rollup materialize. Policy holders can also decide to utilize certain benefits such as taking withdrawals or annuitizing as allowed by the contract. And lastly, mor-tality and lapses act to reduce the size of the in force. The different sensitivities of the standard scenario and stochastic reserve to the time factor play a role in the understanding of which reserve will be dominant going forward.
In the following sections, we will examine each of the above mentioned factors in detail and explore the con-ditions that would cause the dominant force, whether it is the standard scenario or the stochastic reserve, to flip.
BUSINESS MIXOne of the differences between the standard scenario and the stochastic reserve is one allows aggregation in the calculation of surplus and deficiency and the other does not. While the definitions of surplus and deficien-cy are somewhat different between the standard sce-nario and stochastic reserve, in layman terms, surplus represents a profit over the life time of the policy, and deficiency indicates a loss. Aggregation simply means the surplus from one policy can offset the deficiency from another. Thus, if the surpluses and deficiencies of a large number of policies are aggregated together, the total deficiency (if not surplus) is smaller than the sum of all deficiencies at the policy level.
The stochastic method calculates a deficiency for the entire block of business, allowing aggregation of the policies in the block. Conversely, the standard scenario
Current State Future StateIn-force Business as of 12/31/2009 AG43
New Businessissued continuously
AG43 if Market up
AG43 if Market down
Currently well diversified* Standard monolithic Stochastic Standard Stochastic a diversified portfolio Standard Standard Stochastic monolithic Stochastic Standard
Currently NOT diversified Standard monolithic Stochastic Standard Stochastic a diversified portfolio Standard Standard Stochastic monolithic Stochastic Standard
*a diversified portfolio maximizes risk offsetting between different riders and among the same type of riders
AG 43: Which Reserves Will Dominate? … | FROM PAGE 29
The Financial Reporter | JUNE 2010 | 31
The table only considers the business mix factor. There are many other factors that would push the two under-lying forces in different directions as they respond to drivers such as capital market and interest rates. Next, we will take a look at the various policy holder behav-ior assumptions.
POLICY HOLDER BEHAVIOR ASSUMPTIONSDynamic lapsesDynamic lapses for variable annuity refer to the phe-nomenon that policy holders tend not to surrender their policies when the guarantees embedded in the contracts are “in the money.” A policy is said to be in the money when the guaranteed value exceeds the account value. It is out of the money when the account value is suf-ficient to cover the value of the guarantees.
Reducing lapse rates when the policies are in the money tend to increase liability. Hence, it is not surprising that many companies have incorporated it in their stochas-tic models for statutory reserve and required capital calculations.
The modeling is often achieved by using a dynamic lapse formula which acts to increase or decrease the base lapse rates when policies are out of or in the money. A formula that increases the lapse rate when in the money and decreases it when out of the money is said to be two-sided. One that only increases the lapse rate when in the money but does not reduce it when out of the money is said to be one-sided.
The extent to which the base lapse rate is increased or decreased obviously depends on the parameters chosen. It also depends on the definition of the guar-anteed value which determines the in-the-moneyness, the factor that ultimately drives the lapse rate. Take the following formula for example:
lapse rate = base lapse rate * ℮ a * [MIN (account value / guaranteed
value, 1) – 1] (1)Where a = 2
This is a one-sided dynamic lapse formula. When guaranteed value exceeds account value in (1), the
base lapse rate will be multiplied by a factor less than 1, serving to reduce the base lapse rate. In fact, when the guaranteed value is twice the account value, or 200 percent in the money, and the parameter “a” is 2, the base lapse rate will be reduced to just 38 percent of its original value.
When the capital market goes down, account value goes down and guaranteed value stays level or even increases, the base lapse rates can be reduced to very low levels, causing the CTE 70 amount to increase much more than the standard scenario reserve does. In our example shown in (1), a big parameter “a” would reduce the base lapse rates much faster than a small “a” when capital market drops. We will call such a function a “strong” dynamic lapse function. Therefore, for companies with a strong dynamic lapse function, declines in the capital markets could allow stochastic reserve to dominate.
But does interest rate movement play a role in the dynamic lapse formula? Take a life-time guaranteed minimum withdrawal benefit (GMWB) rider on a variable annuity contract for example, the Guaranteed Value is often defined as the present value of the stream of future guaranteed payments where discount rates are the forward rates at the point of calculation.
For companies that calibrate the interest rate scenarios to their current levels, low interest rates will increase the guaranteed value of the contracts at a point where account value is already low. This exacerbates the situ-ation and makes a strong dynamic lapse function even stronger.
To summarize, the combination of a strong dynamic lapse function, declines in the capital markets and inter-est rates could allow the stochastic reserve to win.
Withdrawal delay assumptions for policies with GMWBSome GMWB riders offer bonuses if the contract hold-er delays withdrawals. For example, a rider may credit a certain percentage to the guaranteed value for each year the holder delays withdrawal or it may credit a one time bonus if the holder starts withdrawals after a lon-
CONTINUED ON PAGE 32
32 | JUNE 2010 | The Financial Reporter
AG 43: Which Reserves Will Dominate? … | FROM PAGE 31
the least conservative one in the standard scenario. For these companies, as time goes by, experiences could turn out to be quite different than the assumptions. By that time, they will see a jump in the standard scenario reserve because actual guaranteed value due to the bonus is larger than what is assumed in the model. If stochastic reserve dominated in the beginning for these companies, they could see a flip when the experiences and assumptions diverge.
Guaranteed Revenue SharingBoth the standard scenario and stochastic reserve cal-culations of AG 43 permit the inclusion of projected future revenue sharing. The key difference is: in the standard scenario calculation, only “contractually guar-anteed to the insurer and its liquidator, receiver, and statutory successor” can be included. There is no such requirement in the stochastic reserve.
However, as companies comb through the legal lan-guages of their revenue sharing agreements, it is not always clear what constitutes “contractually guaran-teed.” Interpretations and judgments also come in here.
Let’s imagine a scenario where a company adopt-ed a strict interpretation and allowed little revenue sharing income in the standard scenario calculation. Consequently it ended up with a dominant standard scenario reserve. But going forward, it is able to form new agreements with languages that it interprets as “contractually guaranteed.” It is even able to modify some existing ones to its satisfaction. By then, the amount of revenue sharing income in the standard scenario calculation increases and reserve decreases. Depending on the magnitude of the reduction in stan-dard scenario reserve, the balance of power can shift to the stochastic side.
Internal Scenario SetEssential to the stochastic calculation is a scenario set that consists of multiple equity and interest rate scenarios. Companies can opt to use the scenario set published by the American Academy of Actuaries, or they can choose to generate scenarios internally subject to certain restrictions such as the calibration points of AG 43. The scenarios, whether they are internally generated or taken from the Academy, are meant to reflect long-term views of equity and interest
ger period. An early withdrawal, even though permitted by the contract, would reduce if not cancel the bonus.
However, it is not always optimal for the contract holder to maximize the bonus. It depends on the life expectancy. A younger person can afford to wait for the bonus since he or she has enough years left to maxi-mize the benefits. On the other hand, it may be a good idea for an older policy holder to start withdrawing even if he or she loses some bonuses since otherwise, there would be too few years to take advantage of the bigger benefits.
Thus, for each policy holder, there is a theoretical optimal withdrawal delay period at any given time. But there are other influencing factors such as personal financial situations, perceived value of the contract and health. How to set this assumption? One extreme is to assume everyone can compute the optimal period and act on it. This is obviously the most conserva-tive approach. On the other end of the spectrum is to assume everyone withdraws right away regardless of bonus features. This approach can be the least conser-vative and potentially understate reserves. Since there is very little experience to go by, judgment comes in. And because there is no definitive rules on setting this assumption in either the stochastic or the standard sce-nario guidelines of AG 43, companies could be using different assumptions in the two reserve calculations.
For example, some companies can be using the most conservative approach in the stochastic calculation but

The Financial Reporter | JUNE 2010 | 33
narios. Thus, the impact is the average of the cash flows of each of the scenarios. Depending on the scenarios chosen for the stochastic calculation, this average can be either positive or negative. Hence, reflecting the hedges can either increase or decrease the stochastic reserve.
For companies with a dynamic hedging program in place, the hedge positions are rebalanced regularly to reduce volatilities in their GAAP or economic liabili-ties. The rebalancing is achieved by purchasing just enough hedges to mirror the Greeks in the liabil-ity. When there are fluctuations in the financial mar-kets, adjustments are made to the hedge positions in response to the changes in the Greeks. But how does it impact AG 43 reserves?
As equity and interest rates moves down, a dynamic hedge program tends to add to its hedge positions due to the higher Greeks. This could have opposite effects on the two reserves. While increased hedge positions almost always result in a reserve credit for the standard scenario reserve, it could be a strain on the stochas-tic reserve. For companies with a dominant standard scenario reserve initially, downward moves in the financial markets can cause the two reserves to move closer and closer to each other. If the magnitude is large enough, they could even see the balance of power shift to the stochastic side.
The Time FactorAs time goes by, surrender charges of VA contracts wear off after certain periods. How does it impact the two reserves?
Generally, both reserves benefit from having a sur-render charge. For the standard scenario reserve, it manifests in the Basic Adjusted Reserve (BAR)
rates. They are not necessarily sensitive to short-term market volatility.
However, for companies that generate scenarios inter-nally, a number of parameters can be adjusted on a regular basis in the scenario engine if one chooses to do so. These parameters include: equity market mean returns and volatility, correlations between equity and interest rates, starting interest rates, long-term mean and volatility of interest rates, correlations in the term structure, and strength of mean reversion if the interest rate model is a mean reverting one.
As time goes by, companies could change their long-term views on any of the parameters above, which in turn, would impact the scenarios and ultimately the stochastic reserve. Imagine a situation where a com-pany increased the long-term mean of interest rates. Generally higher interest rates lead to high earned rate and high discount rate for the liability. So by only this reasoning this would lead to lower reserve. However, the standard scenario reserve may exert its power at this very moment. The reserve reduction can be far less than what is expected initially since the dominant force has shifted.
Value of HedgesThe financial guarantees embedded in the VA contracts are often hedged using instruments such as futures and options. These hedge instruments held as of the valu-ation date are projected in both the standard scenario and stochastic reserves. In other words, the cash flows resulted from holding these instruments to maturity are counted in the reserve calculations.
Here, we are only referring to modeling the hedges held on the valuation date. The modeling of a Clearly Defined Hedging Strategy (CDHS) where future hedge positions are reflected is not in the scope of this article.
Although hedges are reflected in both the standard scenario and stochastic reserves, the impact can be very different. The cash flows projected under the standard scenario tend to be positive because of the prescribed equity shock (-13.5 percent). The result of reflecting the hedge is likely a reserve credit. It is not as clear in the stochastic reserve calculation. Here, the cash flows are projected along many equity and interest rate sce-
Although hedges are reflected in both the standard scenario and stochastic reserves, the impact can be very different.
CONTINUED ON PAGE 34
34 | JUNE 2010 | The Financial Reporter
AG 43: Which Reserves Will Dominate? … | FROM PAGE 33
the regulation. But this is just the beginning. Drivers of reserves are no longer the few independent factors. In this new world, factors such as equity market, inter-est rates, business mix, and behavior assumptions are all interconnected and drive reserves in sometimes surprising and counter-intuitive ways. As mentioned in previous sections for example: downward move-ment in interest rates can push stochastic and standard scenario reserves in opposite directions through the increased hedge positions; a balanced business mix can allow risks to offset and bring reserve down; behavior assumptions such as dynamic lapses can exacerbate the situation in a low equity and low inter-est rate environment.
Despite all these interconnected moving parts, compa-nies are counting on actuaries to provide a future view of reserve movements especially under extreme market conditions. To do that, it is essential to understand how the two forces, standard scenario and stochastic reserve, underneath AG 43 would respond to external and internal drivers and under what circumstances the dominant force would flip.
This article gave a few examples in which the flip can occur. Inevitably there can be other factors not discussed in this article that would influence the two reserves and change the balance of power. The good news is that we will understand these dynamics much better in the years to come.
component. It is usually under the account value of the contract because of the surrender charge. In the stochastic reserve calculation, since the deficiency is defined to be the excess of working reserve (cash surrender value) over the assets at any time step, the surrender charge just pushes the possibility of having a deficiency to later years. After all, the working reserve only increases to the account value after the surrender charge period. Since the stochastic reserve is based on present value of the deficiency, the later it happens the smaller the reserve.
Depending on the relative discount rate and fund growth in the two reserve calculations, the benefit of having a surrender charge could be higher for the standard scenario than the stochastic reserve. For com-panies with a dominant stochastic reserve and mostly recent sold business initially, the standard scenario reserve can grow stronger gradually as surrender charg-es wear off. It could eventually take over and become the dominant force.
Final WordsAG 43 has brought us from the comfort of the formu-laic statutory reserves to the new world of principle-based reserves. Life seems to be more complicated in this new world for actuaries. In addition to the com-plex actuarial models that we have to build and main-tain, there are more areas for interpretations, decisions, and judgments because of the principle-based nature of
NEW REPORT:COST OF IMPLEMENTING A PRINCIPLE-BASED FRAMEWORK FOR DETERMINING RESERVES AND CAPITAL SURVEY RESULTS
Review the results of a survey on life insurer perspectives and preparedness levels for implementing a
principle-based framework for determining reserves and capital. Forty-eight companies participated
in the study and offered insight into the stages of their planning, expected cost levels and concerns
for implementing the new approach. The report also details additional observations Towers Watson
obtained through follow-up interviews with some of the study participants.
View the report today at http://www.soa.org/pbasurvey.

The Financial Reporter | JUNE 2010 | 35
HenryW.Siegel,FSA,MAAA,isvicepresident,OfficeoftheChiefActuarywithNewYorkLifeInsuranceCompanyinNewYork,[email protected].
T he question asked in the title of this arti-cle was suggested by a comment made by an International Accounting Standards Board
(IASB) member during one of their joint meetings with the Financial Accounting Standards Board (FASB) this March. The comment was during the discussion of acquisition expenses and was as follows:
“That’s why they want us to change, they don’t like the results!”
It’s not important which board member said it or whether he meant it seriously or partly in jest. It simply summarizes, in one sentence, the problems we’ve been having with the insurance contracts project.
Almost five years ago, I commented to Patricia O’Malley, then an IASB member, that I was fairly confident I knew what the best accounting for life insurance was but that I didn’t know if I could explain it so it fit accounting theory. She told me not to worry; they had lots of smart folks who could explain the outcome based on accounting theory once they knew what the outcome needed to be. It sounded reasonable (and helpful) at the time. Unfortunately, it didn’t work out that way.
Consider, for instance, the treatment of acquisition expenses for life contracts. I’ve traveled and talked with actuaries all over the world—India, China, Korea, Europe—and elsewhere, and there’s almost uniform agreement that acquisition expenses should be treated as just another part of the expected future cash flows on the contract. Then if you take the present value of future premiums less benefits and expenses (including acquisition expenses) you get an appropriate place to start your reserve calculation.
But we haven’t been able to get the board members to agree. Something that is so simple and apparent to actuaries worldwide does not seem to fit in accounting theory. Or at least not for everyone. As I’ll cover later, some of the board members seem to be coming around.Which takes me back to the quote above. If accounting theory produces results that are not usable (for instance, if it produces large losses on sale for all life products) can the theory be correct? I’ve always believed that accounting needs to be useful; if the theory leads to a result that isn’t useful, can the theory be correct?
I’ve had accountants tell me that insurance companies should change their business models so that acquisition expenses are not so front-end loaded. I’ve had others tell me that the large losses at issue were proper and that we simply needed to explain them to the people who are using life company financial statements. Of course, I’ve also heard that the entire industry in certain large European countries would show negative total equity if the Boards’ proposal went forward!
At this point in the project, all the arguments have been made. What remains is that preparers and users alike continue to tell both boards that their proposals will produce unusable results. It’s possible that in the end the boards will find a way to produce a useful exposure draft of a standard. I still believe that the smart people on the boards will find a way to make the theory work properly.
If they don’t, then it is highly likely that two things will happen. First everyone will begin using embed-ded value (EV) reports to explain their results to users. This is not good; EV is too sensitive to the assumptions chosen and therefore too subject to manipulation to be an effective measurement base. The struggles Europe has had over the past five years, particularly in the past two years, in trying to agree on a basis for EV (or its new incarnation, Market Consistent EV) shows this clearly. When results weren’t satisfactory, the concept of a liquidity premium was introduced to raise discount rates and therefore raise EVs (otherwise the guarantees on too many products were underwater). This is not, in my view, a reliable basis for measuring a company’s performance although it remains a very useful tool for internal company management.
The second thing that will happen is that analysts will request information from companies so that they can adjust for what would have been DAC. This would create the ridiculous situation where the analysts are making adjustments that the standard setters refused to incorporate into the accounting standards. Not exactly a vote of confidence for the boards.
But, as I said, I’m still hopeful things will work out. As the developments of the quarter show, progress is slowly being made.
Is Accounting Theory an Oxymoron?by Henry Siegel
CONTINUED ON PAGE 36
Is Accounting Theory an Oxymoron? … | FROM PAGE 35
36 | JUNE 2010 | The Financial Reporter
a) measurement and risk adjustments,b) day-one losses,c) the treatment of the residual margin, andd) policyholder behavior.
After lengthy discussions, the boards agreed that the obligations and rights under a contract should be mea-sured together (not a major decision!), that the risk margin should now be called the risk adjustment and the risk adjustment should be the amount the insurer requires for bearing the uncertainty that arises from having to fulfill the net obligation arising from the contract. How to do this would become a major topic for March.
With regard to day-one losses, they decided to recog-nize them immediately although they didn’t acknowl-edge how common this would be under their proposed treatment of acquisition expenses. With regard to the residual adjustment, they decided the staff should develop guidance on how to release it over time and that it should not be allowed to be a shock absorber (i.e., if things go badly, the adjustment could be released more quickly to absorb it).
Policyholder behavior was an important conceptual dis-cussion and the IASB stated that policyholder options should be reflected in the measurement of future cash flows under the contract and that no cash value floor should be required. FASB could not reach an agree-ment on this.
All in all, the boards did not resolve anything very major but did set the stage for future debates.
FEBRUARYThe boards had a special meeting on February 10 where they discussed for the first time reinsurance and policy-holder accounting.
They concluded that reinsurers should use the same measurement and recognition approach as direct insur-ers. The only difference would be that the residual margin would be based on the reinsurance agreement rather than the direct contract. Staff was asked to
JANUARYThe boards discussed unbundling, presentation and embedded derivatives at a special board meeting on January 5.
They discussed whether to account for components of an insurance contract (e.g., mortality, investment and service) as if those components were separate contracts (i.e., unbundle them). After a confusing discussion, the IASB decided, tentatively, that for recognition and measurement an insurer should unbundle a component of an insurance contract if it is not interdependent with other components of that contract and not unbundle a component that is interdependent. The only problem with this is that it was not clear what interdependent meant.
The FASB tentatively decided that if unbundling is not required for recognition and measurement, it should not be a permitted option. Staff was given the task of further clarifying what interdependent meant and how the definition of insurance contract might affect the discussion.
The boards next discussed five models for the presen-tation of the statement of comprehensive income for insurance contracts. They tentatively rejected a model that recognizes revenue on the basis of written premi-ums (rather than recognizing revenue as the insurer performs under the contract) and then asked the staff to further clarify the remaining models.
The discussion of embedded derivatives considered two possible approaches:
a) Measure the derivative at fair value (using existing guidance on when to bifurcate).
b) Measure consistently with the measurement used for the host insurance contract.
Once again, the boards were unable to reach agreement.
This set the stage for the major joint discussion on January 19. At this meeting the boards discussed the following topics:
The Financial Reporter | JUNE 2010 | 37
review how reinsurance specific issues might impact the measurement.
Otherwise, the basic presentation would show reinsur-ance and direct insurance items separately rather than netted. Also, the income statement for the reinsurer should reflect acquisition expenses for proportionate reinsurance consistent with their treatment for direct insurance.
For policyholder accounting, the boards decided ten-tatively not to carry out any further discussion before issuing the exposure draft.
The February joint meeting the next week was one of the more confusing discussions in the long history of the project.
The first discussion was a rerun of the unbundling dis-cussion from January. Once again, the boards did not reach an agreement and asked the staff for more infor-mation on interdependence. The boards also replayed their discussion on embedded derivatives, the IASB concluding that no special calculation was required. The FASB decided not to make a decision until staff developed more guidance on interdependence.
The next subject was presentation. The staff had proposed several alternative schemes in January and now the boards were asked to express an opinion. Nine IASB members voted in favor of an expanded margin presentation and six for a summarized margin approach. FASB didn’t vote but expressed a preference for the summarized approach. The boards seemed to understand neither the difficulty in actually preparing a margin approach presentation on a timely basis nor the lack of firm guidance on how to separate items like pol-icyholder dividends among the various types of margin.It was now becoming common for the two boards to disagree on important narrow votes.
Finally, the boards considered the accounting for variable contracts. The first question was whether the separate accounts represented assets and liabilities of the insurer or not. The IASB voted 10 to five in favor of leaving them on the company’s balance sheet and
FASB agreed. Other issues concerning variable con-tract accounting were left to another time.
MARCHIf the discussion in February was confused, March set a new record. The board spent six different sessions on insurance during which they discussed risk and residual margins, acquisition costs, the definition of an insur-ance contract, participating policies and disclosures. Overall, things ended on a more positive note than I had feared.
In the margin discussion, the boards and staff demon-strated that while they had made significant efforts to understand the actuarial concepts behind risk adjust-ment calculations, they were no more able to resolve the question of how to calculate risk adjustments than the IAA’s Accounting Committee was in its paper on the subject. After three discussions on different days that ranged from discussion of the various types of risk models (from Black/Scholes to the cost of capital method) to how the residual margin should be released over time, the boards refused to allow the industry to develop appropriate methods on their own. On the other hand, they were unable to reach a conclusion themselves.
Several board members believed that since the residual margin was a plug anyway, it made no sense to sepa-rate it from the risk adjustment. Others believed that the risk adjustment was essential so that two liabilities with different risks would show different values on the financial statement. In the end, the IASB split eight to seven in favor of keeping a separate risk adjustment, with more work to be done by staff on how to calculate it, while the FASB was four to one in favor of a com-posite adjustment. It’s likely that both views will be presented in the exposure draft.
CONTINUED ON PAGE 38
If the discussion in February was confused, March set a new record.
38 | JUNE 2010 | The Financial Reporter
Is Accounting Theory an Oxymoron? … | FROM PAGE 37
The second quarter of the year is expect-ed to see the final release of the exposure draft, although it’s probably a good idea to bet on July.
The boards next discussed the role of timing risk in defining insurance risk and tentatively decided to change the factors considered in evaluating the sig-nificance of insurance risk from absolute amounts to present values.
The boards also discussed how to assess possible outcomes when determining whether insurance risk exists. The IASB expressed an initial preference for considering the range of possible outcomes while the FASB expressed an initial preference for considering whether there are outcomes in which the present value of the net cash outflows can exceed the present value of the premiums.
On disclosures, the boards discussed a paper prepared by staff that included the current requirements of IFRS 4 and 7 as well as several new ideas. The members gave staff comments on these proposals and agreed that staff could continue along the lines recommended. No conclusions were reached, however, and it is likely that the final requirements will depend significantly on the comments that are received on the exposure draft.
NEXT QUARTERThe second quarter of the year is expected to see the final release of the exposure draft, although it’s prob-ably a good idea to bet on July. Comments will still probably be due in September.
If the boards do not change their positions on such things as acquisition expenses, it is likely that the exposure draft will be even more controversial than the discussion paper was in 2007. If you listened to the boards discuss risk adjustments, you should understand even more clearly why…
Insurance Accounting is too important to be left to the accountants!
They also tentatively decided that the residual margin should be run off over the coverage period while the risk adjustment should extend for as long as there is a liability on the books. This is not so important for life contracts but of great concern to property and casualty and health insurers.
The discussion of acquisition costs centered on the theory from revenue recognition vs. the practical problems created by expensing acquisition costs with no offset in revenue or liability. Staff admitted that they have been receiving significant complaints from both preparers and users about the results of their cur-rent tentative decision, but the boards were not totally swayed. Finally, six IASB members voted for keeping their tentative conclusion and nine, acknowledging the practical problem, found a theoretical reason to either offset acquisition expenses directly with revenue or to reduce the residual margin by the amount of acquisition expenses. In both cases, the acquisition expenses are limited to incremental acquisition costs. FASB voted to keep their tentative decision not to offset acquisition expenses by revenue.
On participating contracts, the IASB agreed to treat participating payments in the same way as other cash flows in the contract. The FASB only agreed to rec-ognize them if there’s an obligation to pay them. The FASB’s position may cause a problem for U.S. compa-nies where policyholder dividends are at the Board of Directors’ discretion. Some board members, however, believed that there would be a constructive obligation in this case that would allow companies to recognize future payments.
Both boards agreed to retain the basic definition of insurance currently in IFRS 4.

The Financial Reporter | JUNE 2010 | 39

TheFinancialReporter
Financial ReportingSectionSOCIETYOFACTUARIES
475 N. Martingale Road, Suite 600
Schaumburg, Illinois 60173
p: 847.706.3500 f: 847.706.3599 w: www.soa.org
Non Profit OrgU.S. Postage
PAIDCarol Stream, IL Permit No 475