Embed Size (px)
Citation preview

City of Northville, Michigan
Financial Report
with Supplemental Information
June 30, 2018

City of Northville, Michigan
Contents
Independent Auditor's Report 1-2
Management's Discussion and Analysis 3-9
Basic Financial Statements
Government-wide Financial Statements:Statement of Net Position 10Statement of Activities 11-12
Fund Financial Statements:Governmental Funds:
Balance Sheet 13Reconciliation of the Balance Sheet to the Statement of Net Position 14Statement of Revenue, Expenditures, and Changes in Fund Balances 15Reconciliation of the Statement of Revenue, Expenditures, and Changes in Fund
Balances to the Statement of Activities 16
Proprietary Funds:Statement of Net Position 17-18Statement of Revenue, Expenses, and Changes in Net Position 19Statement of Cash Flows 20
Fiduciary Funds:Statement of Fiduciary Net Position 21Statement of Changes in Fiduciary Net Position 22
Notes to Financial Statements 23-45
Required Supplemental Information 46
Budgetary Comparison Schedule - General Fund 47-48Schedule of Changes in the Net Pension Liability and Related Ratios 49Schedule of Pension Contributions 50Schedule of Changes in the Total OPEB Liability and Related Ratios 51Schedule of OPEB Contributions 52Notes to Required Supplemental Information 53
Other Supplemental Information 54
Nonmajor Governmental Funds:Combining Balance Sheet 55Combining Statement of Revenue, Expenditures, and Changes in Fund Balances 56Combining Balance Sheet 57-58Combining Statement of Revenue, Expenditures, and Changes in Fund Balances 59-60
Internal Service Funds:Combining Statement of Net Position 61Combining Statement of Revenue, Expenses, and Changes in Net Position 62Combining Statement of Cash Flows 63
Independent Auditor's Report
To the Mayor and Members of the City CouncilCity of Northville, Michigan
Report on the Financial Statements
We have audited the accompanying financial statements of the governmental activities, the business-typeactivities, the discretely presented component unit, each major fund, and the aggregate remaining fundinformation of the City of Northville, Michigan (the "City") as of and for the year ended June 30, 2018 and therelated notes to the financial statements, which collectively comprise the City of Northville, Michigan's basicfinancial statements, as listed in the table of contents.
Management’s Responsibility for the Financial Statements
Management is responsible for the preparation and fair presentation of these financial statements in accordancewith accounting principles generally accepted in the United States of America; this includes the design,implementation, and maintenance of internal control relevant to the preparation and fair presentation of financialstatements that are free from material misstatement, whether due to fraud or error.
Auditor’s Responsibility
Our responsibility is to express opinions on these financial statements based on our audit. We conducted ouraudit in accordance with auditing standards generally accepted in the United States of America. Those standardsrequire that we plan and perform the audit to obtain reasonable assurance about whether the financial statementsare free from material misstatement.
An audit involves performing procedures to obtain audit evidence about the amounts and disclosures in thefinancial statements. The procedures selected depend on the auditor’s judgment, including the assessment of therisks of material misstatement of the financial statements, whether due to fraud or error. In making those riskassessments, the auditor considers internal control relevant to the entity’s preparation and fair presentation of thefinancial statements in order to design audit procedures that are appropriate in the circumstances, but not for thepurpose of expressing an opinion on the effectiveness of the entity’s internal control. Accordingly, we express nosuch opinion. An audit also includes evaluating the appropriateness of accounting policies used and thereasonableness of significant accounting estimates made by management, as well as evaluating the overallpresentation of the financial statements.
We believe that the audit evidence we have obtained is sufficient and appropriate to provide a basis for our auditopinions.
Opinions
In our opinion, the financial statements referred to above present fairly, in all material respects, the respectivefinancial position of the governmental activities, the business-type activities, the discretely presented componentunit, each major fund, and the aggregate remaining fund information of the City of Northville, Michigan as of June30, 2018 and the respective changes in its financial position and, where applicable, cash flows for the year thenended, in accordance with accounting principles generally accepted in the United States of America.
Emphasis of Matter
As discussed in Note 14 to the basic financial statements, the City adopted the new accounting guidance ofGASB Statement No. 75, Accounting and Financial Reporting for Postemployment Benefits Other than Pensions.The new standard establishes accounting and financial reporting requirements for OPEB plans provided to theemployees of governmental employers. The adoption of GASB Statement No. 75 resulted in the recognition of anet other postemployment benefit liability. Our opinion is not modified with respect to this matter.
1

To the Mayor and Members of the City CouncilCity of Northville, Michigan
Required Supplemental Information
Accounting principles generally accepted in the United States of America require that the management'sdiscussion and analysis and the required supplemental information, as identified in the table of contents, bepresented to supplement the basic financial statements. Such information, although not a part of the basicfinancial statements, is required by the Governmental Accounting Standards Board, which considers it to be anessential part of financial reporting for placing the basic financial statements in an appropriate operational,economic, or historical context. We have applied certain limited procedures to the required supplementalinformation in accordance with auditing standards generally accepted in the United States of America, whichconsisted of inquiries of management about the methods of preparing the information and comparing theinformation for consistency with management's responses to our inquiries, the basic financial statements, andother knowledge we obtained during our audit of the basic financial statements. We do not express an opinion orprovide any assurance on the information because the limited procedures do not provide us with sufficientevidence to express an opinion or provide any assurance.
Other Information
Our audit was conducted for the purpose of forming opinions on the financial statements that collectivelycomprise the City's basic financial statements. The other supplemental information, as identified in the table ofcontents, is presented for purposes of additional analysis and is not a required part of the basic financialstatements.
The other supplemental information, as identified in the table of contents, is the responsibility of management andwas derived from and relates directly to the underlying accounting and other records used to prepare the basicfinancial statements. Such information has been subjected to the auditing procedures applied in the audit of thebasic financial statements and certain additional procedures, including comparing and reconciling suchinformation directly to the underlying accounting and other records used to prepare the basic financial statementor to the basic financial statements themselves, and other additional procedures in accordance with auditingstandards generally accepted in the United States of America. In our opinion, the other supplemental information,as identified in the table of contents, is fairly stated in all material respects in relation to the basic financialstatements as a whole.
October 23, 2018
2

City of Northville, Michigan
Management's Discussion and Analysis
The following discussion and analysis of the financial performance of the City of Northville, Michigan (the "City")provides an overview of the City's financial activities for the fiscal year ended June 30, 2018.
Financial Highlights
Due to financial reporting changes required by GASB Statement No. 54 in fiscal year 2011, the Street, Drainage,and Sidewalk Improvement Fund, the Interfund Investment Pool Fund, and the Payroll Fund are included with theGeneral Fund for financial reporting purposes. The Street, Drainage, and Sidewalk Improvement Fund accountsfor proceeds from a dedicated millage. The expenditures are based upon a rolling 20-year capital improvementplan for improvements throughout the City. The Payroll Fund accounts for the activity related to employee fringebenefits costs. The Interfund Investment Pool Fund accounts for investment activity.
• The General Fund increase of $40,468 was due to several factors. Revenue was higher than expected by$17,000, primarily due to increased permit activity. The remainder was primarily due to close monitoring of theexpenditures among all activities.
• The Street, Drainage, and Sidewalk Improvement Fund increase of $413,535 was due to street improvementprojects that were deferred to the following fiscal year.
Property tax revenue increased 3.6 percent from the prior year and it continues to be the City’s single largestsource of revenue at approximately 55 percent of total governmental revenue. The City’s millage generatedapproximately $5 million to support General Fund operations and approximately $607,000 for street, drainage,and sidewalk improvements.
State-shared revenue, the City’s second largest source of revenue in the General Fund, remained consistent withthe prior year. This revenue source includes liquor license fees, constitutional revenue sharing, and City, Village,Township Revenue Sharing (CVTRS) payments.
Rental income is another significant source of governmental revenue. This includes cell tower rent recorded in theGeneral Fund and tenant rents at Allen Terrace, a senior housing facility. The Housing Commission approved a1.44 percent increase in rent at the beginning of the fiscal year. The City has leases with five cellular providersthat allows placement of their equipment at the public works yard and on the water tower. This was the last fiscalyear that the cell tower revenue was transferred to the Water and Sewer Fund to replenish cash reserves. Goingforward, it is budgeted to remain in the General Fund.
The State of Michigan, under Act 51, distributes revenue received from gasoline taxes to municipalities formaintenance of major and local streets. This revenue source increased $125,000, or 29 percent, over the prioryear due to increased funding approved by the State Legislature.
As of December 31, 2017, the net pension liability was $7.5 million and was 63 percent funded. At that date, therewere a total of 79 participants in the plan, of which eight were active. The Parks and Recreation Commission isresponsible for a portion of the pension liability. Of the $7.5 million net pension liability, the commission's share is$465,921.
As of December 31, 2017, the net other postemployment benefits (OPEB) liability was just under $3.8 million, andthe plan was 72 percent funded. At that date, there were 19 actives and 73 retirees or beneficiaries in the plan.The Parks and Recreation Commission has its own separate trust and plan.
Funds have been set aside in the amount of approximately $485,000 to fund the accumulated compensatedabsences liability. This represents accumulated vacation, sick, and comp time earned by employees.
Long-term debt for the primary government is $1.9 million. There are two general obligation debt issuesoutstanding. The Allen Terrace Renovation Bonds mature in fiscal year 2023, and the Streetscape ImprovementBonds mature in fiscal year 2025. There is one outstanding installment purchase agreement which is a 10-yearobligation jointly shared with the City of Plymouth, Michigan.
The City’s business-type activities have no outstanding debt as of the end of the fiscal year. This is consistentwith the City’s long-term goal to reduce debt. Where appropriate, a well planned “pay as you go” system has beenestablished and utilized.
3

City of Northville, Michigan
Management's Discussion and Analysis (Continued)
Using this Annual Report
This annual report consists of a series of financial statements. The statement of net position and the statement ofactivities provide information about the activities of the City as a whole and present a longer-term view of theCity’s finances. This longer-term view uses the accrual basis of accounting so that it can measure the cost ofproviding services during the current year and whether the taxpayers have funded the full cost of providinggovernment services.
The fund financial statements present a short-term view; they tell us how the taxpayers’ resources were spentduring the year, as well as how much is available for future spending. Fund financial statements also report theCity’s operations in more detail than the government-wide financial statements by providing information about theCity’s most significant funds. The fiduciary fund statements provide financial information about activities for whichthe City acts solely as trustee or agent for the benefit of those outside of the City.
City's Net Position
The following tables show, in a condensed format, the current year’s net position compared to the two prior years:
Governmental Activities2016 2017 2018 Change Percent Change
AssetsCurrent and other assets $ 14,597,424 $ 14,618,864 $ 15,585,583 $ 966,719 6.6
Capital assets 26,138,772 25,701,072 24,200,783 (1,500,289) (5.8)
Total assets 40,736,196 40,319,936 39,786,366 (533,570) (1.3)
Deferred Outflows of Resources -Related to pensions and OPEB 1,447,276 1,223,691 806,613 (417,078) (34.1)
LiabilitiesCurrent liabilities 979,672 1,395,401 1,035,252 (360,149) (25.8)Noncurrent liabilities:
Due within one year 355,922 432,794 361,236 (71,558) (16.5)
Due in more than one year 12,216,251 10,652,961 11,628,508 975,547 9.2
Total liabilities 13,551,845 12,481,156 13,024,996 543,840 4.4
Deferred Inflows of Resources -Related to pensions and OPEB - 251,810 583,830 332,020 100.0
Net PositionNet investment in capital assets 23,721,175 23,534,072 22,295,783 (1,238,289) (5.3)Restricted 2,046,628 1,588,209 2,164,803 576,594 36.3
Unrestricted 2,863,824 3,688,380 2,523,567 (1,164,813) (31.6)
Total net position $ 28,631,627 $ 28,810,661 $ 26,984,153 $ (1,826,508) (6.3)
4

City of Northville, Michigan
Management's Discussion and Analysis (Continued)
Business-type Activities
2016 2017 2018 Change Percent Change
AssetsCurrent and other assets $ 1,567,775 $ 1,733,844 $ 2,633,646 $ 899,802 51.9
Capital assets 5,401,376 5,537,530 5,275,319 (262,211) (4.7)
Total assets 6,969,151 7,271,374 7,908,965 637,591 8.8
Deferred Outflows of Resources -Related to pensions and OPEB 135,180 120,642 100,073 (20,569) (17.0)
LiabilitiesCurrent liabilities 280,469 264,471 262,093 (2,378) (0.9)Noncurrent liabilities:
Due within one year 13,766 8,578 9,127 549 6.4
Due in more than one year 1,169,250 1,081,912 1,204,043 122,131 11.3
Total liabilities 1,463,485 1,354,961 1,475,263 120,302 8.9
Deferred Inflows of Resources - 24,759 80,089 55,330 100.0
Net PositionNet investment in capital assets 5,401,376 5,537,530 5,275,319 (262,211) (4.7)
Unrestricted 239,470 474,766 1,178,367 703,601 148.2
Total net position $ 5,640,846 $ 6,012,296 $ 6,453,686 $ 441,390 7.3
Governmental Activities
Overall, the City’s net position of governmental activities decreased by 6.3 percent from a year ago. The increasein current and other assets is mainly due to the accumulation of cash for deferred street improvements and toincrease reserves for special projects and capital purchases. The decrease in capital assets was primarily due todepreciation expense.
The changes in deferred inflows and outflows is directly related to GASB Statement No. 68, Accounting andFinancial Reporting for Pensions, and GASB Statement No. 75, Accounting and Financial Reporting forPostemployment Benefits Other than Pensions. The changes are related to (1) contributions to the defined benefitpension and OPEB plans subsequent to the plan’s year end (December 31, 2017) to the end of the fiscal year(June 30, 2018), and (2) the variance between the plan’s actual investment earnings compared to the plan’sassumed investment earnings.
The increase in current liabilities was due to the timing of accounts payable at year end. The decrease innoncurrent liabilities due within one year is related to the retirement of one long-term employee. The increase innoncurrent long-term liabilities related to GASB Statement No. 75 required the full OPEB liability to be recorded inthe financial statements.
Business-type Activities
The City’s business-type activities consist of the Water and Sewer and Refuse and Recycling Funds. The Citymaintains transmission lines that allow customers to receive water from the Great Lakes Water Authority anddeliver it to its residents. In addition, a water tower is operated and maintained to supplement water pressureduring periods of peak water demand. Sewage treatment is provided through Wayne County’s Rouge ValleySewage Disposal System. Refuse collection and recycling services are provided by an outside commercial entity.
An increase in total net position of 7.3 percent was expected for the following reasons:
The increase in current assets was expected. Cell tower revenue was transferred from the General Fund to theWater and Sewer Fund to improve cash reserves. In addition, $534,000 has been accumulated for a future meterreplacement program and water system capital improvements.
5

City of Northville, Michigan
Management's Discussion and Analysis (Continued)
The decrease in capital assets and net investment in capital assets was due to the current year depreciationexpense.
The changes in deferred inflows and outflows is directly related to GASB Statement No. 68, Accounting andFinancial Reporting for Pensions, and GASB Statement No. 75, Accounting and Financial Reporting forPostemployment Benefits Other Than Pensions. The changes are related to (1) contributions to the definedbenefit pension and OPEB plans subsequent to the plan’s year end (December 31, 2017) to the end of the fiscalyear (June 30, 2018), and (2) the variance between the plan’s actual investment earnings compared to the plan’sassumed investment earnings.
The change in current liabilities fluctuates annually due to timing of payments at year end. The increase innoncurrent liabilities was due to the pension and other postemployment benefits changes.
City's Changes in Net Position
The following tables show the changes in net position during the current year as compared to the two prior years:
Governmental Activities
2016 2017 2018 Change Percent Change
RevenueProgram revenue:
Charges for services $ 2,345,346 $ 2,266,434 $ 2,244,466 $ (21,968) (1.0)Operating grants and
contributions 339,737 374,147 500,208 126,061 33.7Capital grants and
contributions 285,416 50,423 126,823 76,400 151.5General revenue:
Property taxes 5,316,091 5,433,778 5,631,764 197,986 3.6State-shared revenue and
grants 912,305 996,050 1,100,337 104,287 10.5Investment income 111,139 5,622 54,869 49,247 876.0Other revenue:
Racetrack breakage 107,591 119,089 175,416 56,327 47.3
Franchise fees 188,044 191,892 202,292 10,400 5.4
Total revenue 9,605,669 9,437,435 10,036,175 598,740 6.3
ExpensesGeneral government 2,111,167 1,816,548 1,729,322 (87,226) (4.8)Public safety 3,823,810 3,403,454 3,749,788 346,334 10.2Public works 2,594,779 2,668,713 2,693,253 24,540 0.9Senior housing 903,582 861,982 851,747 (10,235) (1.2)Recreation and culture 257,806 318,019 355,973 37,954 11.9
Interest on long-term debt 68,318 62,466 56,537 (5,929) (9.5)
Total expenses 9,759,462 9,131,182 9,436,620 305,438 3.3
Transfers (239,106) (127,219) (175,045) (47,826) 37.6
Change in Net Position (392,899) 179,034 424,510 245,476 137.1
Net Position - Beginning of year 29,024,526 28,631,627 26,559,643 (2,071,984) (7.2)
Net Position - End of year $ 28,631,627 $ 28,810,661 $ 26,984,153 $ (1,826,508) (6.3)
6

City of Northville, Michigan
Management's Discussion and Analysis (Continued)
Business-type Activities
2016 2017 2018 Change Percent Change
RevenueProgram revenue - Charges for
service $ 3,094,236 $ 3,544,891 $ 3,750,051 $ 205,160 5.8General revenue - Investment
income 6,801 525 5,949 5,424 1,033.1
Total revenue 3,101,037 3,545,416 3,756,000 210,584 5.9
Operating Expenses 3,609,011 3,301,185 3,296,229 (4,956) (0.2)
Transfers 239,106 127,219 178,845 51,626 40.6
Change in Net Position (268,868) 371,450 638,616 267,166 71.9
Net Position - Beginning of year 5,909,714 5,640,846 6,012,296 371,450 6.6
Net Position - End of year $ 5,640,846 $ 6,012,296 $ 6,650,912 $ 638,616 10.6
Governmental Activities
Overall, net position increased $424,510, or 1.5 percent. Governmental revenue increased 6.3 percent from theprior year. That was due to a combination of factors described below.
The increase in operating grants and contributions was due Community Development Block Grants for seniorservices which were not received in the prior year, receipt of a one-time supplemental road funding payment fromthe State of Michigan and a grant received from the State Historic Preservation Office to perform a study of thehistoric properties in the City.
The increase in capital grants and contributions was due to a contribution from Northville Township, Michigan forFish Hatchery pond repairs, a grant received to purchase new election equipment, increase contribution from theCity of Plymouth, Michigan for fire equipment, and a contribution from a private entity for the addition of electricvehicle charging stations in the downtown area.
Investment income fluctuates year to year and is dependent upon the changes in the market value ofinvestments.
The increase in racetrack breakage was a result of the Hazel Park racetrack closing.
The overall increase in total expenses of 3.3 percent was primarily due to the implementation of GASB StatementNo. 75 recognizing the net OPEB liability for the first time.
Business-type Activities
Charges from services increased 5.8 percent over the prior year. This was primarily due to an 8.5 percentincrease to the utility bill for the average homeowner. Charges for services includes water and sewer revenuebased upon consumption and the refuse and recycling revenue based upon a bimonthly rate.
The decrease in transfers was directly related to the amount of cell tower revenue transferred from the GeneralFund to improve the cash position of the Water and Sewer Fund.
7

City of Northville, Michigan
Management's Discussion and Analysis (Continued)
The City’s Funds
The presentation of the City’s major funds follows the government-wide financial statements. The fund financialstatements provide detailed information about the most significant funds, not the City as a whole. The CityCouncil creates funds to help manage money for specific purposes, as well as to show accountability for certainactivities, such as dedicated property tax millages. The City’s major governmental funds for 2018, as defined byGovernmental Accounting Standards Board Statement No. 34, are the following:
• General Fund• Public Improvement Fund
General Fund Budgetary Highlights
The General Fund accounts for all police, fire, public works, planning and zoning, and administrative functions ofthe city government. The budget is essentially a “maintenance” budget, which means it increases modestly fromyear to year. The budget is monitored closely and amended quarterly.
Due to financial reporting changes required by GASB Statement No. 54, in fiscal year 2011, the Street, Drainage,and Sidewalk Improvement Fund, Interfund Investment Pool Fund, and the Payroll Fund are included with theGeneral Fund for financial reporting purposes. The Street, Drainage, and Sidewalk Improvement Fund accountsfor proceeds from a dedicated millage. The expenditures are based upon a rolling 20-year capital improvementplan for improvements throughout the City. The Payroll Fund accounts for the activity related to employee fringebenefits costs. The Interfund Investment Pool Fund accounts for investment activity.
The General Fund pays for most of the City’s governmental services. The most significant category is the policedepartment, which represents 43 percent of total General Fund expenditures, which is an increase of 2 percentover the prior year.
Shared services contributions account for 3.3 percent of total expenditures. Contributions from both the City ofNorthville, Michigan and Northville Township provide funding for parks and recreation activities, senior adultservices, and the youth assistance program.
Operating transfers out from the Street, Drainage, and Sidewalk Fund to the Major and Local Streets Funds arededicated for street, drainage, and sidewalk improvements. Transfers from the General Fund are committed forfuture capital needs or to support operations of other funds.
Property values continue to be stable in the City. Property taxes represent 70 percent of General Fund revenue.The General Fund contributed $68,000 to advance fund the retiree pension fund.
Other Major Funds Highlights
The Public Improvement Fund accounts for racetrack breakage revenue and special public improvement projects.Annually, the Northville City Council commits breakage funds received in excess of police and fire service costs atNorthville Downs racetrack. The allocation of those funds is generally for physical improvements or programs thatare of a general public nature.
Capital Assets and Debt Administration
At the end of fiscal year 2018, the City had approximately $29.5 million invested in a broad range of capitalassets, including land and buildings, police and fire equipment, infrastructure, and water and sewer lines.
The City continues to collect a dedicated millage approved by the voters in March 1997 for comprehensiveimprovements to streets, drains, and sidewalks. The focus of the related capital project spending continues to bein conjunction with a 20 year improvement plan, which is reviewed on an ongoing basis.
The City also utilizes a Fire Equipment Replacement Fund and a Police Equipment Replacement Fund. Thesefunds allow for the purchase of equipment following a 20 year replacement program to keep equipment up to dateand meet current standards. A pay as you go system is utilized.
8

City of Northville, Michigan
Management's Discussion and Analysis (Continued)
The total debt outstanding at the end of the year related to governmental activities was $1.9 million. Thisrepresents less than 1 percent of the City’s state equalized value (SEV). The City is significantly under the legaldebt margin, as defined by state statute, of 10 percent of SEV.
Economic Factors and Next Year's Budgets and Rates
The net taxable value of the City increased 5 percent for the next fiscal year. The City's operating millage was13.5864 in fiscal year 2018. However, it was reduced to 13.5188 in fiscal year 2019 due to the City reaching itsHeadlee maximum. This will provide for an additional $200,000 in general operating tax revenue. For fiscal year2018, the City’s millage for streets, drainage, and sidewalk improvements has decreased from 1.7097 to 1.6841mills due to a Headlee rollback.
The City no longer has any unlevied millage available. Asking the voters for a Headlee override in the short termwill be required in order to maintain financial stability. In November 2018, the voters will be asked to approve abond issuance of $3.05 million to fund street improvements. If approved, a debt levy of approximately 0.98 millswill be added to the tax bill for a period of 10 years beginning in fiscal year 2020.
Constitutional revenue sharing is budgeted to increase 3.1 percent while the city, village, township revenuesharing remains consistent with the prior year.
The City provides fire prevention, fire suppression, and emergency medical services to the City of Plymouth,Michigan. The City of Plymouth, Michigan will reimburse 58 percent of the costs to the City of Northville,Michigan, up from 56 percent in the prior year.
The water and sewer rate structure is set up to cover the Great Lakes Water Authority water costs, WayneCounty sewage disposal costs, capital improvements, and increased operational and maintenance costs. TheCity increased the combined water and sewer rate from $14.99 to $15.52 per unit, or 3.5 percent, effective July 1,2018. The service charge, which covers the cost of the meter reading and billing process, remains unchanged at$3.37 bimonthly. The meter replacement charge increased from $3.70 to $5.57 bi-monthly to continue a multi-year program to replace all aging meters within the City. The City has no debt in the Water and Sewer Fund.
The Housing Commission increased the rent at Allen Terrace, an independent senior citizen apartmentcommunity, by 1.4 percent, from $705 to $155, for one bedroom apartments. The cost of rent includes all utilities.
All departments will continue to evaluate how to maintain a high level of service to the citizens, while containingcosts. Containing rising healthcare and pension costs will continue to be a high priority of administration.Additional contributions in an attempt to reduce the unfunded pension and other postemployment liabilities will bemade when funding is available.
Contacting the City's Management
This financial report is intended to provide the citizens, taxpayers, customers, and investors with a generaloverview of the City’s finances and demonstrate the City’s accountability for the money it receives. If you havequestions about this report or need additional information, please contact the City's finance office at 215 WestMain Street, Northville, Michigan 48167 or via the City’s website at www.ci.northville.mi.us.
9

City of Northville, Michigan
Statement of Net Position
June 30, 2018
Primary Government
GovernmentalActivities
Business-typeActivities Total Component Unit
AssetsCash and investments $ 13,371,752 $ 1,932,822 $ 15,304,574 $ 406,032Receivables:
Property taxes receivable 1,937 - 1,937 -Special assessments 60,737 - 60,737 -Customer receivables - 952,587 952,587 -Accrued interest 50,553 - 50,553 -Other 103,937 1,383 105,320 144Due from other governmental units 296,403 6,402 302,805 2,193
Internal balances 307,613 (307,613) - -Inventory 41,796 41,491 83,287 -Prepaid expenses and other assets 158,946 6,574 165,520 11,424Restricted assets (Note 8) 356,422 - 356,422 -Investment in joint ventures (Note 11) 610,487 - 610,487 -Land held for resale 225,000 - 225,000 -Capital assets: (Note 5)
Assets not subject to depreciation 3,967,876 62,631 4,030,507 -
Assets subject to depreciation - Net 20,232,907 5,212,688 25,445,595 -
Total assets 39,786,366 7,908,965 47,695,331 419,793
Deferred Outflows of ResourcesDeferred outflows related to pension (Note 9) 528,582 57,747 586,329 -
Deferred outflows related to OPEB (Note 10) 278,031 42,326 320,357 -
Total deferred outflows of resources 806,613 100,073 906,686 -
LiabilitiesAccounts payable 164,777 254,669 419,446 12,535Due to other governmental units 36,753 - 36,753 -Refundable deposits, bonds, etc. 117,870 803 118,673 -Accrued liabilities and other 681,090 6,621 687,711 24,915Unearned revenue 34,762 - 34,762 -Noncurrent liabilities:
Due within one year (Note 7) 361,236 9,127 370,363 -Due in more than one year:
Compensated absences - Net of currentportion (Note 7) 402,959 16,243 419,202 -
Net pension liability (Note 9) 6,323,535 689,996 7,013,531 -Net retiree healthcare obligation (Note 10) 3,270,014 497,804 3,767,818 -
Long-term debt (Note 7) 1,632,000 - 1,632,000 -
Total liabilities 13,024,996 1,475,263 14,500,259 37,450
Deferred Inflows of Resources - Pension andOPEB (Notes 9 and 10) 583,830 80,089 663,919 -
Net PositionNet investment in capital assets 22,295,783 5,275,319 27,571,102 -Restricted:
Roads, streets, drainage, and sidewalkimprovements 1,907,529 - 1,907,529 -
Insurance retention 228,506 - 228,506 -Police forfeitures 28,768 - 28,768 -
Unrestricted 2,523,567 1,178,367 3,701,934 382,343
Total net position $ 26,984,153 $ 6,453,686 $ 33,437,839 $ 382,343
See notes to financial statements. 10

City of Northville, Michigan
Program Revenue
ExpensesCharges for
Services
OperatingGrants and
Contributions
Capital Grantsand
Contributions
Functions/ProgramsPrimary government:
Governmental activities:General government $ 1,729,322 $ 654,698 $ 52,066 $ -Public safety 3,749,788 595,086 23,634 111,823Public works 2,693,253 23,071 320,395 9,000Senior housing 851,747 853,025 104,113 -Recreation and culture 355,973 118,586 - 6,000Interest on long-term debt 56,537 - - -
Total governmental activities 9,436,620 2,244,466 500,208 126,823
Business-type activities:Water and Sewer 2,706,138 3,152,734 - -Refuse and Recycling 590,091 597,317 - -
Total business-type activities 3,296,229 3,750,051 - -
Total primary government $ 12,732,849 $ 5,994,517 $ 500,208 $ 126,823
Component units - Downtown DevelopmentAuthority $ 757,633 $ - $ - $ -
General revenue:Property taxesState-shared revenue and grantsUnrestricted investment income (loss)Racetrack breakageFranchise fee revenue
Total general revenue
Transfers
Change in Net Position
Net Position - Beginning of year - As restated
Net Position - End of year
See notes to financial statements. 11

Statement of Activities
Year Ended June 30, 2018
Net (Expense) Revenue and Changes in Net Position
Primary Government
GovernmentalActivities
Business-typeActivities Total
ComponentUnit
$ (1,022,558) $ - $ (1,022,558) $ -(3,019,245) - (3,019,245) -(2,340,787) - (2,340,787) -
105,391 - 105,391 -(231,387) - (231,387) -
(56,537) - (56,537) -
(6,565,123) - (6,565,123) -
- 446,596 446,596 -- 7,226 7,226 -
- 453,822 453,822 -
(6,565,123) 453,822 (6,111,301) -
- - - (757,633)
5,631,764 - 5,631,764 746,3771,100,337 - 1,100,337 -
54,869 5,949 60,818 889175,416 - 175,416 -202,292 - 202,292 1,150
7,164,678 5,949 7,170,627 748,416
(175,045) 178,845 3,800 -
424,510 638,616 1,063,126 (9,217)
26,559,643 5,815,070 32,374,713 391,560
$ 26,984,153 $ 6,453,686 $ 33,437,839 $ 382,343
12

City of Northville, Michigan
Governmental Funds Balance Sheet
June 30, 2018
General Fund
PublicImprovement
Fund Nonmajor Funds
TotalGovernmental
Funds
AssetsCash and investments $ 4,410,484 $ 2,716,078 $ 5,370,499 $ 12,497,061Receivables:
Property taxes receivable 1,937 - - 1,937Special assessments - - 60,737 60,737Accrued interest 41,794 - 8,759 50,553Other 77,111 22,595 3,930 103,636Due from other governmental units 196,594 6,000 93,118 295,712
Inventory 14,866 - 3,716 18,582Prepaid expenses and other assets 145,007 - 12,860 157,867
Land held for resale - 225,000 - 225,000
Total assets $ 4,887,793 $ 2,969,673 $ 5,553,619 $ 13,411,085
LiabilitiesAccounts payable $ 90,982 $ 7,615 $ 61,869 $ 160,466Due to other governmental units 36,753 - - 36,753Refundable deposits, bonds, etc. 117,870 - - 117,870Accrued liabilities and other 528,708 - 9,709 538,417
Unearned revenue - - 34,762 34,762
Total liabilities 774,313 7,615 106,340 888,268
Deferred Inflows of Resources - Unavailablerevenue (Note 4) 27,439 6,000 47,463 80,902
Total liabilities and deferred inflowsof resources 801,752 13,615 153,803 969,170
Fund BalancesNonspendable:
Inventory/Assets held for resale 14,866 225,000 3,716 243,582Prepaids 145,007 - 12,860 157,867
Restricted:Streets, drains, and sidewalk improvements 1,193,487 - 708,223 1,901,710Police forfeitures 28,768 - - 28,768
Committed:Capital projects - 2,559,121 2,565,761 5,124,882Cemetery improvements - 171,937 984,261 1,156,198Arts commission - - 45,121 45,121Parking - - 704,991 704,991Allen Terrace - - 369,549 369,549Debt service - - 5,334 5,334
Assigned - Beautification commission 991 - - 991
Unassigned 2,702,922 - - 2,702,922
Total fund balances 4,086,041 2,956,058 5,399,816 12,441,915
Total liabilities, deferred inflows ofresources, and fund balances $ 4,887,793 $ 2,969,673 $ 5,553,619 $ 13,411,085
See notes to financial statements. 13

City of Northville, Michigan
Governmental Funds Reconciliation of the Balance Sheet to the Statement of Net Position
June 30, 2018
Fund Balances Reported in Governmental Funds $ 12,441,915
Amounts reported for governmental activities in the statement of net position are differentbecause:
Capital assets used in governmental activities are not financial resources and are notreported in the funds 24,029,633
Special assessment receivables are expected to be collected over several years and arenot available to pay for current year expenditures 47,463
Receivables that are not collected or collectible within 60 days of year end are notavailable to pay for current year expenditures 33,439
Investments in joint ventures are not financial resources and are not reported in thefunds 610,487
Long-term liabilities are not due and payable in the current period and are not reportedin the funds (1,905,000)
Interest payable is not accrued in the funds (13,168)
Some employee fringe benefits are payable over a long period of years and do notrepresent a claim on current financial resources; therefore, they are not reported asfund liabilities:
Employee compensated absences (485,260)Net pension liability and deferred inflows and outflows related to pensions are due
and payable in the current period and are not reported in the funds (5,996,520)Retiree healthcare benefits and deferred inflows and outflows are due and payable in
the current period and are not reported in the funds. (3,374,246)
Internal service funds are included as part of governmental activities 1,595,410
Net Position of Governmental Activities $ 26,984,153
See notes to financial statements. 14

City of Northville, Michigan
Governmental Funds Statement of Revenue, Expenditures, and Changes in Fund Balances
Year Ended June 30, 2018
General FundPublic
Improvement Nonmajor Funds
TotalGovernmental
Funds
RevenueProperty taxes $ 5,631,764 $ - $ - $ 5,631,764Special assessments - - 17,715 17,715State-shared revenue and grants:
Federal grants 21,836 - 2,547 24,383State-shared revenue and grants 612,174 - 581,839 1,194,013Community Development Block Grant - - 17,466 17,466
Sales and services:Cemetery 132,830 - - 132,830Charges for overhead services 200,395 - - 200,395Sales and services 590,920 - 8,057 598,977
Fines and forfeitures 22,447 - - 22,447Licenses and permits 469,772 - - 469,772Interest and rentals:
Investment income 15,281 9,915 26,010 51,206Rental income 198,891 - 817,930 1,016,821
Other revenue:Local contribution 50,991 - 374,869 425,860Other 44,091 - 156,896 200,987Racetrack breakage 16,007 159,409 - 175,416
Michigan Housing Authority subsidies - - 35,237 35,237
Total revenue 8,007,399 169,324 2,038,566 10,215,289
ExpendituresCurrent services -
General government 1,977,313 13,610 - 1,990,923Public safety:
Police department 2,888,512 - 2,451 2,890,963Fire department 871,758 - 42,390 914,148
Public works 624,726 22,661 911,343 1,558,730Senior housing - - 701,439 701,439Recreation and culture 224,699 - 148,776 373,475
Contributions to MERS trusts 68,000 - - 68,000
Debt service 52,306 - 268,002 320,308
Total expenditures 6,707,314 36,271 2,074,401 8,817,986
Excess of Revenue Over (Under) Expenditures 1,300,085 133,053 (35,835) 1,397,303
Other Financing Sources (Uses)Transfers in (Note 6) 10,724 202,056 869,846 1,082,626Transfers out (Note 6) (856,806) (70,724) (333,941) (1,261,471)
Proceeds from sale of capital assets - - 9,130 9,130
Total other financing (uses) sources (846,082) 131,332 545,035 (169,715)
Net Change in Fund Balances 454,003 264,385 509,200 1,227,588
Fund Balances - Beginning of year 3,632,038 2,691,673 4,890,616 11,214,327
Fund Balances - End of year $ 4,086,041 $ 2,956,058 $ 5,399,816 $ 12,441,915
See notes to financial statements. 15

City of Northville, Michigan
Governmental Funds Reconciliation of the Statement of Revenue, Expenditures, and Changes in
Fund Balances to the Statement of Activities
Year Ended June 30, 2018
Net Change in Fund Balance Reported in Governmental Funds $ 1,227,588
Amounts reported for governmental activities in the statement of activities are differentbecause:
Governmental funds report capital outlays as expenditures; however, in the statement ofactivities, these costs are allocated over their estimated useful lives as depreciation:
Depreciation expense (1,766,589)Capital outlay 299,143
Revenue in the statement of activities that does not provide current financial resourcesis not reported as revenue in the funds until it is available 17,618
Net income from joint ventures is not recorded in the governmental funds, but isrecorded in the statement of activities 14,190
Decrease in accumulated employee sick and vacation pay reported in the statement ofactivities does not require the use of current resources and, therefore, is not reportedin the fund statements until it comes due for payment 34,562
Repayment of bond principal is an expenditure in the governmental funds, but not in thestatement of activities (where it reduces long-term debt) 262,000
Interest expense is recognized in the government-wide statements as it accrues 1,771
Changes in the other postemployment benefits liability reported in the statement ofactivities does not require the use of current resources and, therefore, is not reportedin the fund statements until it becomes due for payment. (73,584)
Changes in the net retiree pension liability and deferred outflows related to pensionsreported in the statement of activities do not require the use of current resources and,therefore, are not reported in the fund statements until they become due for payment. 374,952
Internal service funds are included as part of governmental activities 32,859
Change in Net Position of Governmental Activities $ 424,510
See notes to financial statements. 16

City of Northville, Michigan
Proprietary Funds Statement of Net Position
June 30, 2018
Enterprise Funds
Water andSewer
Refuse andRecycling
Total EnterpriseFunds
Internal ServiceFunds
AssetsCurrent assets:
Cash and investments $ 1,779,819 $ 153,003 $ 1,932,822 $ 874,691Receivables 862,909 97,463 960,372 993Inventory 41,491 - 41,491 23,214
Prepaid expenses and other assets 5,876 698 6,574 1,079
Total current assets 2,690,095 251,164 2,941,259 899,977
Noncurrent assets:Restricted assets (Note 8) - - - 356,422Capital assets: (Note 5)
Assets not subject to depreciation 62,631 - 62,631 -
Assets subject to depreciation - Net 5,184,462 28,226 5,212,688 171,150
Total noncurrent assets 5,247,093 28,226 5,275,319 527,572
Total assets 7,937,188 279,390 8,216,578 1,427,549
Deferred Outflows of ResourcesDeferred outflows related to pension (Note 9) 52,743 5,004 57,747 -
Deferred outflows related to OPEB (Note 10) 37,564 4,762 42,326 -
Total deferred outflows of resources 90,307 9,766 100,073 -
LiabilitiesCurrent liabilities:
Accounts payable 217,124 37,545 254,669 4,311Refundable deposits, bonds, etc. 515 288 803 -Accrued liabilities and other 5,780 841 6,621 129,505
Current portion of compensated absences 7,753 1,374 9,127 2,136
Total current liabilities 231,172 40,048 271,220 135,952
Noncurrent liabilities:Compensated absences - Net of current
portion 13,798 2,445 16,243 3,800Net pension liability 630,134 59,862 689,996 -
Net retiree healthcare obligation 441,802 56,002 497,804 -
Total noncurrent liabilities 1,085,734 118,309 1,204,043 3,800
Total liabilities 1,316,906 158,357 1,475,263 139,752
Deferred Inflows of ResourcesDeferred inflows related to pension (Note 9) 19,989 1,907 21,896 -
Deferred inflows related to OPEB (Note 10) 51,646 6,547 58,193 -
Total deferred inflows of resources 71,635 8,454 80,089 -
See notes to financial statements. 17

City of Northville, Michigan
Proprietary Funds Statement of Net Position (Continued)
June 30, 2018
Enterprise Funds
Water andSewer
Refuse andRecycling
Total EnterpriseFunds
Internal ServiceFunds
Net PositionNet investment in capital assets $ 5,247,093 $ 28,226 $ 5,275,319 $ 171,150Restricted - Insurance retention - - - 228,506
Unrestricted 1,391,861 94,119 1,485,980 888,141
Total net position $ 6,638,954 $ 122,345 6,761,299 $ 1,287,797
Amounts reported for business-type activities inthe statement of net position are differentbecause a portion of the Internal Service Fund isincluded as business-type activities (307,613)
Total Net Position $ 6,453,686
See notes to financial statements. 18

City of Northville, Michigan
Proprietary Funds Statement of Revenue, Expenses, and Changes in Net Position
Year Ended June 30, 2018
Enterprise Funds
Water andSewer
Refuse andRecycling
TotalEnterprise
FundsInternal
Service Funds
Operating RevenueSales to customers $ 3,152,314 $ 595,208 $ 3,747,522 $ -Rental income - - - 264,931Recoveries - - - 33,398
Other revenue 420 2,109 2,529 111,150
Total operating revenue 3,152,734 597,317 3,750,051 409,479
Operating ExpensesOther operating and maintenance costs 2,099,644 511,738 2,611,382 285,651Claims - - - 20,095Compensation pay-outs - - - 41,368Other expenses 319,699 74,367 394,066 -
Depreciation 258,225 3,986 262,211 70,783
Total operating expenses 2,677,568 590,091 3,267,659 417,897
Operating Income (Loss) 475,166 7,226 482,392 (8,418)
Nonoperating (Expense) Revenue -Investment income (loss) 5,233 716 5,949 11,542
Transfers In 178,845 - 178,845 -
Change in Net Position 659,244 7,942 667,186 3,124
Net Position - Beginning of year - As restated 5,979,710 114,403 6,094,113 1,284,673
Net Position - End of year $ 6,638,954 $ 122,345 $ 6,761,299 $ 1,287,797
Net Change in Net Position - Total EnterpriseFunds $ 667,186
Amounts reported for business-type activitiesin the statement of activities are differentbecause a portion of the Internal ServiceFund is included as business-type activities (28,570)
Change in Net Position of Business-typeActivities $ 638,616
See notes to financial statements. 19

City of Northville, Michigan
Proprietary Funds Statement of Cash Flows
Year Ended June 30, 2018
Enterprise Funds
Water andSewer
Refuse andRecycling Total
Internal ServiceFunds
Cash Flows from Operating ActivitiesReceipts from customers $ 3,096,007 $ 598,799 $ 3,694,806 $ 264,724Receipts from interfund services and
reimbursements 420 1,473 1,893 -Payments to suppliers/insurance claims (1,919,454) (515,162) (2,434,616) (241,587)Payments to employees and fringes (506,277) (60,931) (567,208) (151,479)Other receipts - - - 143,857
Net cash and cash equivalentsprovided by operating activities 670,696 24,179 694,875 15,515
Cash Flows from Noncapital Financing Activities -Transfers from other funds 178,845 - 178,845 -
Cash Flows Used in Financing Activities -Purchase of capital assets - - - (37,940)
Cash Flows Provided by Investing Activities -Interest received on investments and net realizedlosses on investments 5,233 716 5,949 11,542
Net Increase (Decrease) in Cash and CashEquivalents 854,774 24,895 879,669 (10,883)
Cash and Cash Equivalents - Beginning of year 925,045 128,108 1,053,153 1,241,996
Cash and Cash Equivalents - End of year $ 1,779,819 $ 153,003 $ 1,932,822 $ 1,231,113
Classification of Cash and Cash EquivalentsCash and investments $ 1,779,819 $ 153,003 $ 1,932,822 $ 874,691
Restricted cash - - - 356,422
Total cash and cash equivalents $ 1,779,819 $ 153,003 $ 1,932,822 $ 1,231,113
Reconciliation of Operating Income (Loss) to NetCash from Operating Activities
Operating income (loss) $ 475,166 $ 7,226 $ 482,392 $ (8,418)Adjustments to reconcile operating income (loss)
to net cash from operating activities:Depreciation 258,225 3,986 262,211 70,783Changes in assets and liabilities:
Receivables (56,307) 2,955 (53,352) (898)Inventories 3,702 - 3,702 (1,524)Prepaid and other assets 887 60 947 325Accounts payable (3,896) (729) (4,625) (45,987)Accrued and other liabilities (2,764) (99) (2,863) -Net pension or OPEB liability (81,591) 3,201 (78,390) -Deferrals related to pension or OPEB 72,231 6,531 78,762 -
Accrued and other liabilities 5,043 1,048 6,091 1,234
Total adjustments 195,530 16,953 212,483 23,933
Net cash and cash equivalentsprovided by operating activities $ 670,696 $ 24,179 $ 694,875 $ 15,515
See notes to financial statements. 20
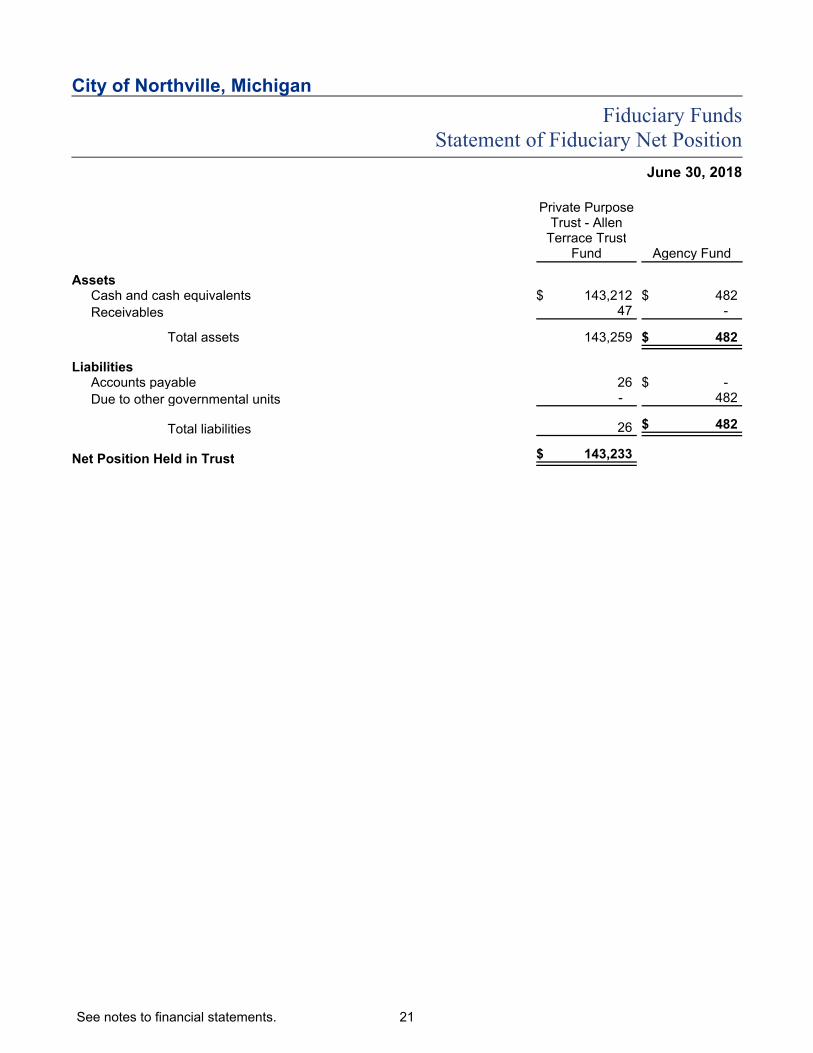
City of Northville, Michigan
Fiduciary Funds Statement of Fiduciary Net Position
June 30, 2018
Private PurposeTrust - Allen
Terrace TrustFund Agency Fund
AssetsCash and cash equivalents $ 143,212 $ 482
Receivables 47 -
Total assets 143,259 $ 482
LiabilitiesAccounts payable 26 $ -
Due to other governmental units - 482
Total liabilities 26 $ 482
Net Position Held in Trust $ 143,233
See notes to financial statements. 21
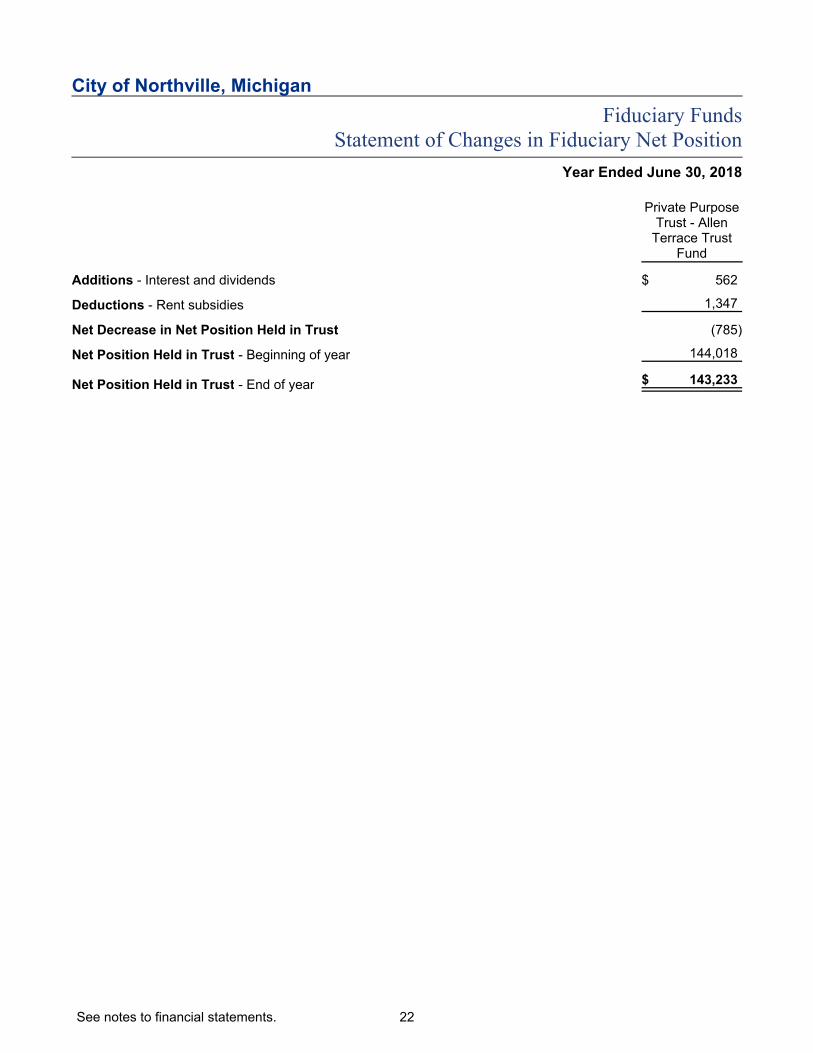
City of Northville, Michigan
Fiduciary Funds Statement of Changes in Fiduciary Net Position
Year Ended June 30, 2018
Private PurposeTrust - Allen
Terrace TrustFund
Additions - Interest and dividends $ 562
Deductions - Rent subsidies 1,347
Net Decrease in Net Position Held in Trust (785)
Net Position Held in Trust - Beginning of year 144,018
Net Position Held in Trust - End of year $ 143,233
See notes to financial statements. 22
City of Northville, Michigan
Notes to Financial Statements
June 30, 2018
Note 1 - Significant Accounting Policies
Accounting and Reporting Principles
The City of Northville, Michigan (the "City") is governed by a City Council of five members consisting ofthe elected council members and the mayor, who is deemed a member of the council for all purposes.The accompanying financial statements present the City and its component unit, an entity for which theCity is considered to be financially accountable. The discretely presented component unit is reported in aseparate column in the government-wide financial statements to emphasize that it is legally separate fromthe City (see discussion below for description).
The City follows accounting principles generally accepted in the United States of America (GAAP), asapplicable to governmental units. Accounting and financial reporting pronouncements are promulgated bythe Governmental Accounting Standards Board. The following is a summary of the significant accountingpolicies used by the City:
Reporting Entity
Discretely Presented Component Unit
Downtown Development Authority
The Downtown Development Authority (DDA) of the City is reported in a separate component unit columnto emphasize that it is legally separate from the City. The DDA was created to assist the City in thedevelopment of the downtown area. The DDA’s governing body, which consists of nine individuals, isapproved by the City Council. In addition, the DDA’s budget is subject to approval by the City Council.The financial information included in the separate column is condensed. The complete financialstatements of the DDA can be obtained from the city offices at 215 W. Main Street, Northville, Michigan48167.
Jointly Governed Organization
Jointly governed organizations are discussed in Note 11.
Report Presentation
Governmental accounting principles require that financial reports include two different perspectives, thegovernment-wide perspective and the fund-based perspective. The government-wide financial statements(i.e., the statement of net position and the statement of activities) report information on all of thenonfiduciary activities of the primary government and its component units, as applicable. Thegovernment-wide financial statements are presented on the economic resources measurement focus andthe full accrual basis of accounting. Property taxes are recognized as revenue in the year for which theyare levied. Grants and similar items are recognized as revenue as soon as all eligibility requirementsimposed by the provider have been met. The statements also present a schedule reconciling theseamounts to the modified accrual-based presentation found in the fund-based statements.
The statement of activities demonstrates the degree to which the direct expenses of a given function orsegment are offset by program revenue. Direct expenses are those that are clearly identifiable with aspecific function or segment. Program revenue includes: (1) charges to customers or applicants forgoods, services, or privileges provided; (2) operating grants and contributions; and (3) capital grants andcontributions, including special assessments. Taxes, unrestricted intergovernmental receipts, and otheritems not properly included among program revenue are reported instead as general revenue.
As a general rule, the effect of interfund activity has been removed from the government-wide financialstatements. Exceptions to this general rule occur when there are charges between the City's water andsewer function and various other functions. Eliminations of these charges would distort the direct costsand program revenue reported for the various functions concerned.
23

City of Northville, Michigan
Notes to Financial Statements
June 30, 2018
Note 1 - Significant Accounting Policies (Continued)
Separate financial statements are provided for governmental funds, proprietary funds, and fiduciaryfunds, even though the latter are excluded from the government-wide financial statements. Majorindividual governmental funds and major individual enterprise funds, if any, are reported as separatecolumns in the fund financial statements.
Fund Accounting
The City accounts for its various activities in several different funds in order to demonstrate accountabilityfor how it spends certain resources; separate funds allow the City to show the particular expenditures forwhich specific revenue is used. The various funds are aggregated into three broad fund types:
Governmental Funds
Governmental funds include all activities that provide general governmental services that are notbusiness-type activities. This includes the General Fund, special revenue funds, debt service funds,capital project funds, and permanent funds. The City reports the following funds as "major" governmentalfunds:
The General Fund is the primary operating fund because it accounts for all financial resources used to
provide government services other than those specifically assigned to another fund.
The Public Improvement Fund is a capital projects fund that accounts for breakage revenue to the
extent that it exceeds the cost of providing police and fire service at the racetrack. The expenditures in
this fund are primarily for public improvement projects.
Proprietary Funds
Proprietary funds include enterprise funds (which provide goods or services to users in exchange forcharges or fees) and internal service funds (which provide goods or services to other funds of the City).The City reports the following fund as "major" enterprise funds:
The Water and Sewer Fund provides water to customers and disposes of sanitary sewage in
exchange for bimonthly user charges.
The Refuse and Recycling Fund provides refuse and recycling services to customers in exchange for
user charges.
Fiduciary Funds
Fiduciary funds include amounts held in a fiduciary capacity for others. These amounts will not be used tooperate our government's programs. Activities that are reported as fiduciary include the following:
The Allen Terrace Trust Fund, which provides rental subsidies for eligible Allen Terrace residents.
The Agency Fund accounts for assets held by the City in a trustee capacity. Agency funds are
custodial in nature (assets equal liabilities) and do not involve the measurement of results of
operations.
24

City of Northville, Michigan
Notes to Financial Statements
June 30, 2018
Note 1 - Significant Accounting Policies (Continued)
Interfund Activity
During the course of operations, the City has activity between funds for various purposes. Any residualbalances outstanding at year end are reported as due from/to other funds and advances to/from otherfunds. While these balances are reported in fund financial statements, certain eliminations are made inthe preparation of the government-wide financial statements. Balances between the funds included ingovernmental activities (i.e., the governmental and internal service funds) are eliminated so that only thenet amount is included as internal balances in the governmental activities column. Similarly, balancesbetween the funds included in business-type activities (i.e., the enterprise funds) are eliminated so thatonly the net amount is included as internal balances in the business-type activities column.
Furthermore, certain activity occurs during the year involving transfers of resources between funds. Infund financial statements, these amounts are reported at gross amounts as transfers in/out. Whilereported in fund financial statements, certain eliminations are made in the preparation of the government-wide financial statements. Transfers between the funds included in governmental activities are eliminatedso that only the net amount is included as transfers in the governmental activities column. Similarly,balances between the funds included in business-type activities are eliminated so that only the netamount is included as transfers in the business-type activities column.
Basis of Accounting
The governmental funds use the current financial resources measurement focus and the modified accrualbasis of accounting. This basis of accounting is intended to better demonstrate accountability for how theCity has spent its resources.
Expenditures are reported when the goods are received or the services are rendered. Capital outlays arereported as expenditures (rather than as capital assets) because they reduce the ability to spendresources in the future; conversely, employee benefit costs that will be funded in the future (such aspension and retiree healthcare-related costs or sick and vacation pay) are not counted until they comedue for payment. In addition, debt service expenditures, claims, and judgments are recorded only whenpayment is due.
Revenue is not recognized until it is collected, or collected soon enough after the end of the year that it isavailable to pay for obligations outstanding at the end of the year. For this purpose, the City considersamounts collected within 60 days of year end to be available for recognition. The following major revenuesources meet the availability criterion: most state-shared revenue, state gas and weight tax revenue,district court fines, and interest associated with the current fiscal period. Conversely, specialassessments and federal grant reimbursements will be collected after the period of availability;receivables have been recorded for these, along with a “deferred inflow”.
Proprietary funds and fiduciary funds, as applicable, use the economic resources measurement focusand the full accrual basis of accounting. Revenue is recorded when earned, and expenses are recordedwhen a liability is incurred regardless of the timing of related cash flows.
Specific Balances and Transactions
Cash and Investments
Cash and cash equivalents include cash on hand, demand deposits, and short-term investments with amaturity of three months or less when acquired. Investments are stated at fair value. Pooled investmentincome is generally allocated to each fund using a weighted average of balance for the principal.
Inventories and Prepaid Items
Inventories are valued at cost, on a first-in, first-out basis. Certain payments to vendors reflect costsapplicable to future fiscal years and are recorded as prepaid items in both government-wide and fundfinancial statements, when applicable.
25

City of Northville, Michigan
Notes to Financial Statements
June 30, 2018
Note 1 - Significant Accounting Policies (Continued)
Restricted Assets
Restricted assets represent funds held with the Michigan Municipal Risk Management Authority forinsurance claims. When an expense is incurred for purposes for which both restricted and unrestrictednet position is available, the City's policy is to first apply restricted resources.
Capital Assets
Capital assets, which include property, plant, equipment, intangible assets, and infrastructure assets(e.g., roads, bridges, sidewalks, and similar items), are reported in the applicable governmental orbusiness-type activities column in the government-wide financial statements. Capital assets are definedby the City as assets with an initial individual cost of more than $5,000 and an estimated useful life inexcess of one year. Such assets are recorded at historical cost or estimated historical cost if purchasedor constructed. Donated capital assets are recorded at estimated acquisition value at the date ofdonation.
Interest incurred during the construction of capital assets of business-type activities is included as part ofthe capitalized value of the assets constructed.
Capital assets are depreciated using the straight-line method over the following useful lives:
Depreciable Life -Years
Roads, sidewalks, and bridges 20 to 50Streetscape 3 to 20Buildings and improvements 5 to 50Machinery and equipment 3 to 15Vehicles 2 to 20Parking system 5 to 10Land improvements 10 to 20Refuse and recycling systems 15Wells, water, and sewer distribution systems 30 to 90
Long-term Obligations
In the government-wide financial statements and the proprietary fund types in the fund financialstatements, long-term debt and other long-term obligations are reported as liabilities in the applicablegovernmental activities, business-type activities, or proprietary fund-type statement of net position. Bondpremiums and discounts are deferred and amortized over the lives of the bonds using the effectiveinterest method; bonds payable are reported net of the applicable bond premium or discount. Bondissuance costs are expensed at the time they are incurred. In the fund financial statements, governmentalfund types recognize bond issuances as "other financing sources," as well as bond premiums anddiscounts. The debt retirement fund is used to liquidate governmental long-term debt.
Deferred Outflows/Inflows of Resources
In addition to assets, the statement of net position and/or balance sheet will sometimes report a separatesection for deferred outflows of resources. This separate financial statement element represents aconsumption of net position that applies to a future period and so will not be recognized as an outflow ofresources (expense/expenditure) until then. The City has one item that qualifies for reporting in thiscategory, which is the deferred outflows of resources related to the defined benefit pension plan. Thedeferred outflows of resources related to the defined benefit pension plan are reported in the government-wide financial statements and the Water and Sewer Fund. The deferred outflows of resources result fromtwo transactions: contributions to the defined benefit pension plan subsequent to the plan's year endthrough the City's fiscal year end and the variance between the plan's actual investment earningscompared to the plan's assumed investment earnings.
26

City of Northville, Michigan
Notes to Financial Statements
June 30, 2018
Note 1 - Significant Accounting Policies (Continued)
In addition to liabilities, the statement of net position and/or balance sheet will sometimes report aseparate section for deferred inflows of resources. This separate financial statement element representsan acquisition of net position that applies to a future period and so will not be recognized as an inflow ofresources (revenue) until that time. The City has deferred inflows related to special assessments andgrants that are not received within the period of availability and the variance between the defined benefitpension plan's and other postemployment benefits plan's actual investment earnings compared to theplans' assumed investment earnings.
Net Position Flow Assumption
The City will sometimes fund outlays for a particular purpose from both restricted (e.g., restricted bond orgrant proceeds) and unrestricted resources. In order to calculate the amounts to report as restricted netposition and unrestricted net position in the government-wide and proprietary fund financial statements(as applicable), a flow assumption must be made about the order in which the resources are consideredto be applied. It is the City’s policy to consider restricted net position to have been depleted beforeunrestricted net position is applied.
Fund Balance Flow Assumptions
The City will sometimes fund outlays for a particular purpose from both restricted and unrestrictedresources (the total of committed, assigned, and unassigned fund balance). In order to calculate theamounts to report as restricted, committed, assigned, and unassigned fund balance in the governmentalfund financial statements, a flow assumption must be made about the order in which the resources areconsidered to be applied. It is the City’s policy to consider restricted fund balance to have been depletedbefore using any of the components of unrestricted fund balance. Furthermore, when the components ofunrestricted fund balance can be used for the same purpose, committed fund balance is depleted firstfollowed by assigned fund balance. Unassigned fund balance is applied last.
Fund Balance Policies
Fund balance of governmental funds is reported in various categories based on the nature of anylimitations requiring the use of resources for specific purposes. The government itself can establishlimitations on the use of resources through either a commitment (committed fund balance) or anassignment (assigned fund balance).
The committed fund balance classification includes amounts that can be used only for the specificpurposes determined by a formal action of the government’s highest level of decision-making authority.The City Council is the highest level of decision-making authority for the government that can, byadoption of an ordinance prior to the end of the fiscal year, commit fund balance. Once adopted, thelimitation imposed by the ordinance remains in place until a similar action is taken (the adoption ofanother ordinance) to remove or revise the limitation.
Amounts in the assigned fund balance classification are intended to be used by the government forspecific purposes but do not meet the criteria to be classified as committed. The City Council has, byresolution, authorized the city manager and finance director to assign fund balance. The council may alsoassign fund balance as it does when appropriating fund balance to cover a gap between estimatedrevenue and appropriations in the subsequent year’s appropriated budget. Unlike commitments,assignments generally only exist temporarily. In other words, an additional action does not normally haveto be taken for the removal of an assignment. Conversely, as discussed above, an additional action isessential to either remove or revise a commitment.
The fund balance policy prescribes the minimum unassigned fund balance in the General Fund as noless than two months of regular operating revenue or regular operating expenditures in the General Fund.This is deemed to be the prudent amount to maintain the City's ability to meet obligations as they comedue throughout the year.
27
City of Northville, Michigan
Notes to Financial Statements
June 30, 2018
Note 1 - Significant Accounting Policies (Continued)
Property Tax Revenue
Property tax receivables are shown as net of allowance for uncollectible amounts. Properties areassessed as of December 31. The related property taxes are billed and become a lien on July 1 of thefollowing year. These taxes are due without penalty during the period from July 1 through August 31, withthe final collection date of February 28 before they are added to the county tax rolls.
The 2017 taxable valuation of the City totaled $353 million (net of captured taxable value of $25 million),on which taxes levied consisted of 13.5864 mills for the City's operating purposes and 1.7097 mills forstreet improvements. The ad valorem taxes levied raised approximately $4.8 million for operations and$603,000 for street, drainage, and sidewalk improvements. These amounts are recognized in the GeneralFund financial statements as taxes receivable - current or as tax revenue.
The delinquent real property taxes of the City are purchased by Wayne County, Michigan and OaklandCounty, Michigan. The counties sell tax notes, the proceeds of which are used to pay the City for theseproperty taxes. Both the Wayne County, Michigan and Oakland County, Michigan shares of delinquentreal property taxes have been recorded as revenue in the current year.
Pension
The City offers a defined benefit pension plan to its employees. The City records a net pension liability forthe difference between the total pension liability calculated by the actuary and the pension plan’s fiduciarynet position. For the purpose of measuring the net pension liability, deferred outflows of resources anddeferred inflows of resources related to pensions, and pension expense, information about the fiduciarynet position of the pension plan and additions to/deductions from the pension plan’s fiduciary net positionhave been determined on the same basis as they are reported by the pension plan. For this purpose,benefit payments (including refunds of employee contributions) are recognized when due and payable inaccordance with the benefit terms. Investments are reported at fair value.
Other Postemployment Benefit Costs
The City offers retiree healthcare benefits to retirees. The City records an OPEB liability for the differencebetween the total OPEB liability calculated by the actuary and the OPEB plan's fiduciary net position. Forthe purpose of measuring the net OPEB liability, deferred outflows of resources and deferred inflows ofresources related to OPEB, and OPEB expense, information about the fiduciary net position of the OPEBplan and additions to/deductions from the OPEB plan's fiduciary net position have been determined onthe same basis as they are reported by the OPEB plan. For this purpose, benefit payments (includingrefunds of employee contributions) are recognized when due and payable in accordance with the benefitterms. Investments are reported at fair value.
Compensated Absences (Vacation and Sick Leave)
It is the City's policy to permit employees to accumulate earned but unused sick and vacation paybenefits and accumulate compensatory leave time. After 10 years of service, employees may receivepayment of the accumulated sick leave balance at the rate of 50 percent for retirement or 25 percent forother types of termination. A liability is accrued when incurred in the government-wide and proprietaryfund financial statements. A liability for these amounts is reported in governmental funds only foremployee terminations as of year end. The Employees' Accumulated Compensation Fund internalservice fund (or the Leave Time Reserve Fund) has been established to fully reserve funds to liquidatethese liabilities for the City. The Downtown Development Authority will liquidate the compensatedabsences liabilities in that component unit.
28

City of Northville, Michigan
Notes to Financial Statements
June 30, 2018
Note 1 - Significant Accounting Policies (Continued)
Proprietary Funds Operating Classification
Proprietary funds distinguish operating revenue and expenses from nonoperating items. Operatingrevenue and expenses generally result from providing services and producing and delivering goods inconnection with a proprietary fund's principal ongoing operations. The principal operating revenue of theenterprise funds and internal service funds is charges to customers for sales and services. The Waterand Sewer Fund also recognizes as operating revenue the portion of tap fees intended to recover thecost of connecting new customers to the system. Operating expenses for enterprise funds and internalservice funds include the cost of sales and services, administrative expenses, and depreciation on capitalassets. All revenue and expenses not meeting this definition are reported as nonoperating revenue andexpenses.
Use of Estimates
The preparation of financial statements in conformity with accounting principles generally accepted in theUnited States of America requires management to make estimates and assumptions that affect thereported amounts of assets and liabilities and disclosure of contingent assets and liabilities at the date ofthe financial statements and the reported amounts of revenue and expenses during the period. Actualresults could differ from those estimates.
Upcoming Accounting Pronouncements
In January 2017, the Governmental Accounting Standards Board issued Statement No. 84, FiduciaryActivities. This statement establishes criteria for identifying fiduciary activities of all state and localgovernments. An activity meeting the criteria should be reported in a fiduciary fund in the basic financialstatements. The City is currently evaluating the impact this standard will have on the financial statementswhen adopted. The provisions of this statement are effective for the City's financial statements for theyear ending June 30, 2020.
In June 2017, the Governmental Accounting Standards Board issued GASB Statement No. 87, Leases,which improves accounting and financial reporting for leases by governments. This statement requiresrecognition of certain lease assets and liabilities for leases that were previously classified as operatingleases and recognized as inflows of resources or outflows of resources based on the payment provisionsof the contract. It establishes a single model for lease accounting based on the foundational principle thatleases are financings of the right to use an underlying asset. Under this statement, a lessee is required torecognize a lease liability and an intangible right-to-use lease asset, and a lessor is required to recognizea lease receivable and a deferred inflow of resources. The City is currently evaluating the impact thisstandard will have on the financial statements when adopted. The provisions of this statement areeffective for the City's financial statements for the year ending June 30, 2021.
29
City of Northville, Michigan
Notes to Financial Statements
June 30, 2018
Note 2 - Stewardship, Compliance, and Accountability
Construction Code Fees
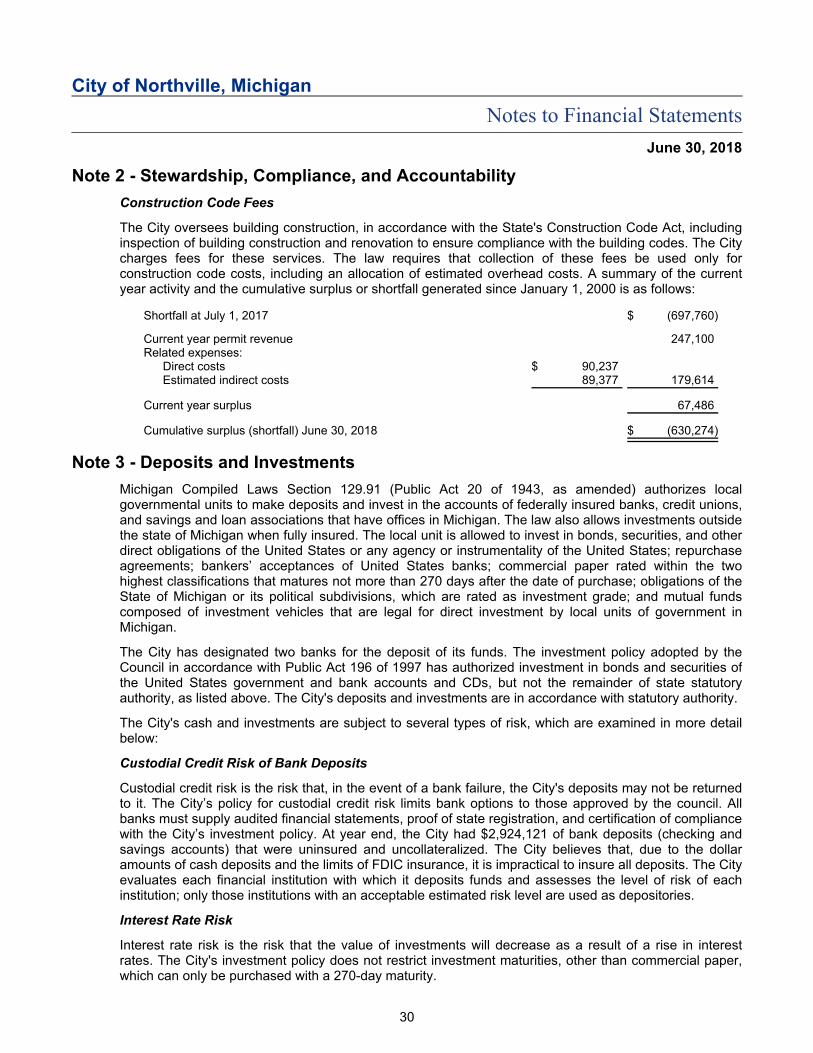
The City oversees building construction, in accordance with the State's Construction Code Act, includinginspection of building construction and renovation to ensure compliance with the building codes. The Citycharges fees for these services. The law requires that collection of these fees be used only forconstruction code costs, including an allocation of estimated overhead costs. A summary of the currentyear activity and the cumulative surplus or shortfall generated since January 1, 2000 is as follows:
Shortfall at July 1, 2017 $ (697,760)
Current year permit revenue 247,100Related expenses:
Direct costs $ 90,237Estimated indirect costs 89,377 179,614
Current year surplus 67,486
Cumulative surplus (shortfall) June 30, 2018 $ (630,274)
Note 3 - Deposits and Investments
Michigan Compiled Laws Section 129.91 (Public Act 20 of 1943, as amended) authorizes localgovernmental units to make deposits and invest in the accounts of federally insured banks, credit unions,and savings and loan associations that have offices in Michigan. The law also allows investments outsidethe state of Michigan when fully insured. The local unit is allowed to invest in bonds, securities, and otherdirect obligations of the United States or any agency or instrumentality of the United States; repurchaseagreements; bankers’ acceptances of United States banks; commercial paper rated within the twohighest classifications that matures not more than 270 days after the date of purchase; obligations of theState of Michigan or its political subdivisions, which are rated as investment grade; and mutual fundscomposed of investment vehicles that are legal for direct investment by local units of government inMichigan.
The City has designated two banks for the deposit of its funds. The investment policy adopted by theCouncil in accordance with Public Act 196 of 1997 has authorized investment in bonds and securities ofthe United States government and bank accounts and CDs, but not the remainder of state statutoryauthority, as listed above. The City's deposits and investments are in accordance with statutory authority.
The City's cash and investments are subject to several types of risk, which are examined in more detailbelow:
Custodial Credit Risk of Bank Deposits
Custodial credit risk is the risk that, in the event of a bank failure, the City's deposits may not be returnedto it. The City’s policy for custodial credit risk limits bank options to those approved by the council. Allbanks must supply audited financial statements, proof of state registration, and certification of compliancewith the City’s investment policy. At year end, the City had $2,924,121 of bank deposits (checking andsavings accounts) that were uninsured and uncollateralized. The City believes that, due to the dollaramounts of cash deposits and the limits of FDIC insurance, it is impractical to insure all deposits. The Cityevaluates each financial institution with which it deposits funds and assesses the level of risk of eachinstitution; only those institutions with an acceptable estimated risk level are used as depositories.
Interest Rate Risk
Interest rate risk is the risk that the value of investments will decrease as a result of a rise in interestrates. The City's investment policy does not restrict investment maturities, other than commercial paper,which can only be purchased with a 270-day maturity.
30

City of Northville, Michigan
Notes to Financial Statements
June 30, 2018
Note 3 - Deposits and Investments (Continued)
At year end, the City had the following investments:
Investment Carrying Value
WeightedAverage Maturity
(Days)
Primary Government
U.S. Treasury $ 6,177,911 712Federal Agency Bond 4,996,956 362Supra National Agency Bond 255,480 888Federal Agency Collateralized Mortgage Obligations 48,050 124
Total $ 11,478,397
Credit Risk
State law limits investments in commercial paper to the top two ratings issued by nationally recognizedstatistical rating organizations. The City has no investment policy that would further limit its investmentchoices. As of year end, the credit quality ratings of debt securities (other than the U.S. government) areas follows:
Investment Carrying Value RatingRating
Organization
Primary Government
U.S. Treasury $ 6,177,911 AA+ S&PTerm investment 900,000 AAAfk KrollMoney market 317,236 AAAm S&PFederal Agency Bonds/CMOs 5,045,006 AA+ S&PSupra National Agency Bond 255,480 AAA S&P
Total $ 12,695,633
Concentration of Credit Risk
It is the City’s policy to diversify its investment portfolio with a goal of 5 percent maximum exposure to anyone credit risk at the time of purchase. This requirement does not apply to investments issued by the U.S.government or its agencies, investments in mutual funds, and external investment pools and other pooledinvestments. At June 30, 2018, more than 5 percent of the City's investments are in the following federalagency securities:
Federal Home Loan Banks %6Fannie Mae 22Freddie Mac 13
Component Units
The cash and investments of the Downtown Development Authority are pooled with the City's cash andinvestments and included in the amounts above. At June 30, 2018, the carrying amount of the cash andinvestments for the DDA was $406,032.
31

City of Northville, Michigan
Notes to Financial Statements
June 30, 2018
Note 3 - Deposits and Investments (Continued)
Fair Value Measurements
The City categorizes its fair value measurements within the fair value hierarchy established by generallyaccepted accounting principles. The hierarchy is based on the valuation inputs used to measure the fairvalue of the asset. Level 1 inputs are quoted prices in active markets for identical assets; Level 2 inputsare significant other observable inputs; Level 3 inputs are significant unobservable inputs. Investmentsthat are measured at fair value using the net asset value per share (or its equivalent) as a practicalexpedient are not classified in the fair value hierarchy below.
In instances whereby inputs used to measure fair value fall into different levels in the above fair valuehierarchy, fair value measurements in their entirety are categorized based on the lowest level input that issignificant to the valuation. The City’s assessment of the significance of particular inputs to these fairvalue measurements requires judgment and considers factors specific to each asset.
The City has the following recurring fair value measurements as of June 30, 2018:
Assets and Liabilities Measured at Carrying Value on a Recurring Basisat June 30, 2018
Quoted Prices inActive Markets
for IdenticalAssets
(Level 1)
Significant OtherObservable
Inputs(Level 2)
SignificantUnobservable
Inputs(Level 3)
Balance at June30, 2018
AssetsDebt securities:
U.S. Treasury securities $ - $ 6,177,911 $ - $ 6,177,911Supra national agency
bonds - 255,480 - 255,480Federal agency bonds - 4,996,956 - 4,996,956Federal agency
collateralized mortgageobligations - 48,050 - 48,050
Total $ - $ 11,478,397 $ - 11,478,397
Investments measured at NAV:Term investment 317,236Money market 900,000
Total assets $ 12,695,633
The fair value of debt securities at June 30, 2018 was determined primarily based on Level 2 inputs. TheCity estimates the fair value of these investments using quoted market prices and other market data forthe same or comparable instruments and transactions in establishing prices, discounted cash flowmodels, and other pricing models.
The valuation method for investments measured at the net asset value (NAV) per share (or its equivalent)is presented on the table below.
Investments in Entities that Calculate Net Asset Value per Share
The City holds money market investments in the Governments of Michigan Investing CooperativeProgram. These investments are measured at the net asset value (NAV) per share (or its equivalent).There are no limitations or restrictions on participant withdrawals for the cooperative program that arerecorded at amortized cost.
32

City of Northville, Michigan
Notes to Financial Statements
June 30, 2018
Note 4 - Deferred Inflows/Outflows of Resources
Governmental funds report deferred inflows of resources in connection with receivables that are notcollectible soon enough after the end of the year (60 days) that they are considered to be available toliquidate liabilities of the current period. At the end of the current fiscal year, there was $47,463 inunavailable revenue related to special assessments and $33,439 in unavailable revenue related toamounts that had not been received within the period of availability.
In addition, the government-wide statements and the proprietary funds report deferred inflows or deferredoutflows of resources related to pension and OPEB liabilities. These are discussed in more detail inNotes 9 and 10 below.
Note 5 - Capital Assets
Capital asset activity of the City's governmental and business-type activities was as follows:
Governmental Activities
BalanceJuly 1, 2017 Additions
Disposals andAdjustments
BalanceJune 30, 2018
Capital assets not beingdepreciated:
Land $ 3,611,236 $ - $ - $ 3,611,236Construction in progress 77,336 159,332 - 236,668Other nondepreciable assets 119,972 - - 119,972
Subtotal 3,808,544 159,332 - 3,967,876
Capital assets being depreciated:Roads, sidewalks, and bridges 30,562,853 70,001 - 30,632,854Parking system 5,616,421 - - 5,616,421Buildings and improvements 11,172,399 - - 11,172,399Machinery and equipment 2,019,909 69,810 (5,998) 2,083,721Vehicles 2,983,557 37,940 (224,370) 2,797,127Streetscape 5,330,109 - - 5,330,109
Subtotal 57,685,248 177,751 (230,368) 57,632,631
Accumulated depreciation:Infrastructure 20,345,658 939,029 - 21,284,687Parking system 2,540,739 134,411 - 2,675,150Buildings and improvements 7,420,570 259,780 - 7,680,350Machinery and equipment 1,693,490 108,206 (5,998) 1,795,698Vehicles 1,855,017 134,238 (224,370) 1,764,885Streetscape 1,937,246 261,708 - 2,198,954
Subtotal 35,792,720 1,837,372 (230,368) 37,399,724
Net capital assets beingdepreciated 21,892,528 (1,659,621) - 20,232,907
Net governmental activitiescapital assets $ 25,701,072 $ (1,500,289) $ - $ 24,200,783
33

City of Northville, Michigan
Notes to Financial Statements
June 30, 2018
Note 5 - Capital Assets (Continued)
Business-type Activities
BalanceJuly 1, 2017 Additions
Disposals andAdjustments
BalanceJune 30, 2018
Capital assets not beingdepreciated - Construction inprogress $ 62,631 $ - $ - $ 62,631
Capital assets being depreciated:Water and sewer lines 11,969,250 - (13,855) 11,955,395Buildings and improvements 21,535 - - 21,535Refuse and recycling system 59,798 - - 59,798
Subtotal 12,050,583 - (13,855) 12,036,728
Accumulated depreciation:Water and sewer lines 6,526,563 258,225 (13,855) 6,770,933Buildings and improvements 21,535 - - 21,535Refuse and recycling system 27,586 3,986 - 31,572
Subtotal 6,575,684 262,211 (13,855) 6,824,040
Net capital assets beingdepreciated 5,474,899 (262,211) - 5,212,688
Net business-type activitycapital assets $ 5,537,530 $ (262,211) $ - $ 5,275,319
Depreciation expense was charged to programs of the primary government as follows:
Governmental activities:General government $ 86,865Public safety 134,253Public works 1,336,330Senior housing 186,886Recreation and culture 22,255Internal Service Fund depreciation is charged to the various functions based on their
usage of the asset 70,783
Total governmental activities $ 1,837,372
Business-type activities:Water and sewer $ 258,225Refuse and recycling 3,986
Total business-type activities $ 262,211
34

City of Northville, Michigan
Notes to Financial Statements
June 30, 2018
Note 5 - Capital Assets (Continued)
Construction Commitments
The City has active construction projects at year end. At year end, the City's commitments withcontractors are as follows:
Spent to DateRemaining
Commitment
Allen Drive sewer relief $ 41,171 $ 16,873Fish hatchery 31,143 11,857Rural Hill Cemetery expansion 7,200 17,500
Total $ 79,514 $ 46,230
Note 6 - Interfund Receivables, Payables, and Transfers
Interfund transfers reported in the fund financial statements are composed of the following:
Paying Fund (Transfer Out) Receiving Fund (Transfer In) Amount
General Fund Public Improvement Fund (2) $ 200,000Water and Sewer Fund (1) 178,845Other nonmajor governmental funds (1) (2) 477,961
Total General Fund 856,806
Public Improvement Fund General Fund (2) 10,724Other nonmajor governmental funds (2) 60,000
Total Public Improvement Fund 70,724
Other nonmajor governmental funds Public Improvement Fund (2) 2,056Other nonmajor governmental funds (1) (2) 331,885
Total other nonmajor governmentalfunds 333,941
Total $ 1,261,471
(1) Transfers between funds are to support the operations of those funds.
(2) Transfers between the various funds represent payment from one fund to another without anequivalent return of goods or services to fund projects, capital improvements, or debt serviceexpenditures accounted for in the respective funds.
35

City of Northville, Michigan
Notes to Financial Statements
June 30, 2018
Note 7 - Long-term Debt
Long-term debt activity for the year ended June 30, 2018 can be summarized as follows:
Governmental Activities
Interest RateRanges
BeginningBalance Additions Reductions
EndingBalance
Due WithinOne Year
General obligations:Allen Terrace renovation
bonds (refunding) -Maturing through 2023 2.14% $ 540,000 $ - $ (85,000) $ 455,000 $ 90,000
Streetscape improvementbonds (refunding) -Maturing through 2025 3.10% 1,205,000 - (135,000) 1,070,000 140,000
Installment PurchaseAgreement - Maturingthrough 2026 2.57% 422,000 - (42,000) 380,000 43,000
Total bonds payable 2,167,000 - (262,000) 1,905,000 273,000
Accumulated compensatedabsences 525,758 26,784 (61,347) 491,195 88,236
Total governmentalactivities $ 2,692,758 $ 26,784 $ (323,347) $ 2,396,195 $ 361,236
Business-type Activities
BeginningBalance Additions Reductions Ending Balance
Due Within OneYear
Business-type activities - Accumulatedcompensated absences $ 21,526 $ 3,844 $ - $ 25,370 $ 9,127
Debt Service Requirements to Maturity
Annual debt service requirements to maturity for the above bonds and note obligations are as follows:
Governmental Activities
Years EndingJune 30 Principal Interest Total
2019 $ 273,000 $ 51,158 $ 324,1582020 279,000 43,773 322,7732021 286,000 36,196 322,1962022 292,000 28,424 320,4242023 298,000 20,420 318,420
2024-2026 477,000 21,126 498,126
Total $ 1,905,000 $ 201,097 $ 2,106,097
Bond Refunding
The City defeased certain bonds in a prior period by placing the proceeds of new bonds in an irrevocabletrust to provide for all future debt service payments on old bonds. The old bonds are not callable.Accordingly, the trust accounts' assets and liabilities for the defeased bonds are not included in the basicfinancial statements. At June 30, 2018, $1,050,000 of bonds outstanding is considered defeased.
36

City of Northville, Michigan
Notes to Financial Statements
June 30, 2018
Note 8 - Restricted Assets
At June 30, 2018, restricted assets are composed of the following:
GovernmentalActivities
Funds held for insurance claims $ 356,422
Note 9 - Pension Plans
Plan Description
The City of Northville, Michigan provides a monthly retirement benefit to employees who meet theeligibility requirements, including age and years of service. The benefits are provided through theMichigan Municipal Employees' Retirement System (MERS or MERS of Michigan), an agent multiple-employer plan, administered by the MERS of Michigan Plan Board.
The pension system issues a publicly available financial report that can be obtained atwww.mersofmich.com or in writing to MERS at 1134 Municipal Way, Lansing, Michigan 48917.
The City of Northville, Michigan also contributes to the City of Northville Defined Contribution PensionPlan, a defined contribution pension plan, for certain employees who meet the eligibility requirements.The benefits are administered by the MERS of Michigan Plan Board.
Benefits Provided
The Michigan Municipal Employees' Retirement System provides retirement, disability, and death benefitsto members and beneficiaries. Retirement benefits are calculated as various percentages (ranging from2.5 to 2.75 percent) of the employee's final three to five-year average compensation times the employee'syears of service. To be eligible, employees must have a minimum number of years of service (rangingfrom 15 to 25), as well as meeting minimum retirement age (ranging from 50 to 60). The vesting period is10 years. The benefits also include nonduty disability benefits and disability retirement benefits in limitedsituations. An employee who leaves city service may withdraw his or her contributions, plus anyaccumulated interest.
Benefit terms, within the parameters established by MERS, are generally established and amended byauthority of the members of the City Council, generally after negotiations of these terms with the affectedunions. Police and fire employees' benefit terms may be subject to binding arbitration in certaincircumstances.
Benefit terms, including contribution requirements, for the City of Northville Defined Contribution PensionPlan are established and may be amended by the members of the City Council. For each employee in thepension plan, the City is required to contribute a percent of annual salary (ranging from 5.5 to 12 percent)to an individual employee account. Employees are permitted to make contributions to the pension plan upto applicable Internal Revenue Code limits. Employees are immediately vested in their own contributionsand earnings on those contributions and become vested in city contributions and earnings on citycontributions after completion of seven years of creditable service with the City. Nonvested citycontributions are forfeited upon termination of employment. Such forfeitures are used to cover a portion ofthe plan's future contributions.
37

City of Northville, Michigan
Notes to Financial Statements
June 30, 2018
Note 9 - Pension Plans (Continued)
Employees Covered by Benefit Terms
The following members were covered by the benefit terms:
Michigan MunicipalEmployees'
Retirement System
Date of member count December 31, 2017
Inactive plan members or beneficiaries currently receiving benefits 61Inactive plan members entitled to but not yet receiving benefits 10Active plan members 8
Total employees covered by the plan 79
Contributions
State law requires public employers to make pension contributions in accordance with an actuarialvaluation. Accordingly, MERS retains an independent actuary for this purpose, and the City annuallycontributes the amount determined to finance the costs of benefits earned by employees during the year,with an additional amount to finance any unfunded accrued liability. Employees are required to makepension contributions based on the amounts agreed upon in union contracts. The City's requiredcontribution is determined after consideration of the required contribution rate of employees.
The City's total payroll during the current year was $3,755,033. For the City of Northville DefinedContribution Plan, the current year contribution (including DDA) was calculated based on covered payrollof $1,678,648, resulting in an employer contribution of $191,775.
Net Pension Liability
The City has chosen to use the December 31 measurement date as its measurement date for the netpension liability. The June 30, 2018 fiscal year end reported net pension liability was determined using ameasure of the total pension liability and the pension net position as of the December 31, 2017measurement date. The December 31, 2017 measurement date total pension liability was determined byan actuarial valuation performed as of that date.
Changes in the net pension liability during the measurement year were as follows:
Increase (Decrease)
Changes in Net Pension LiabilityTotal Pension
LiabilityPlan NetPosition
Net PensionLiability
Balance at December 31, 2016 $ 19,905,529 $ 11,481,583 $ 8,423,946
Changes for the year:Service cost 98,211 - 98,211Interest 1,534,515 - 1,534,515Differences between expected and actual
experience 370,870 - 370,870Contributions - Employer - 1,441,908 (1,441,908)Contributions - Employee - 12,583 (12,583)Net investment income - 1,517,589 (1,517,589)Benefit payments, including refunds (1,546,397) (1,546,397) -Administrative expenses - (23,990) 23,990
Net changes 457,199 1,401,693 (944,494)
Balance at December 31, 2017 $ 20,362,728 $ 12,883,276 $ 7,479,452
38
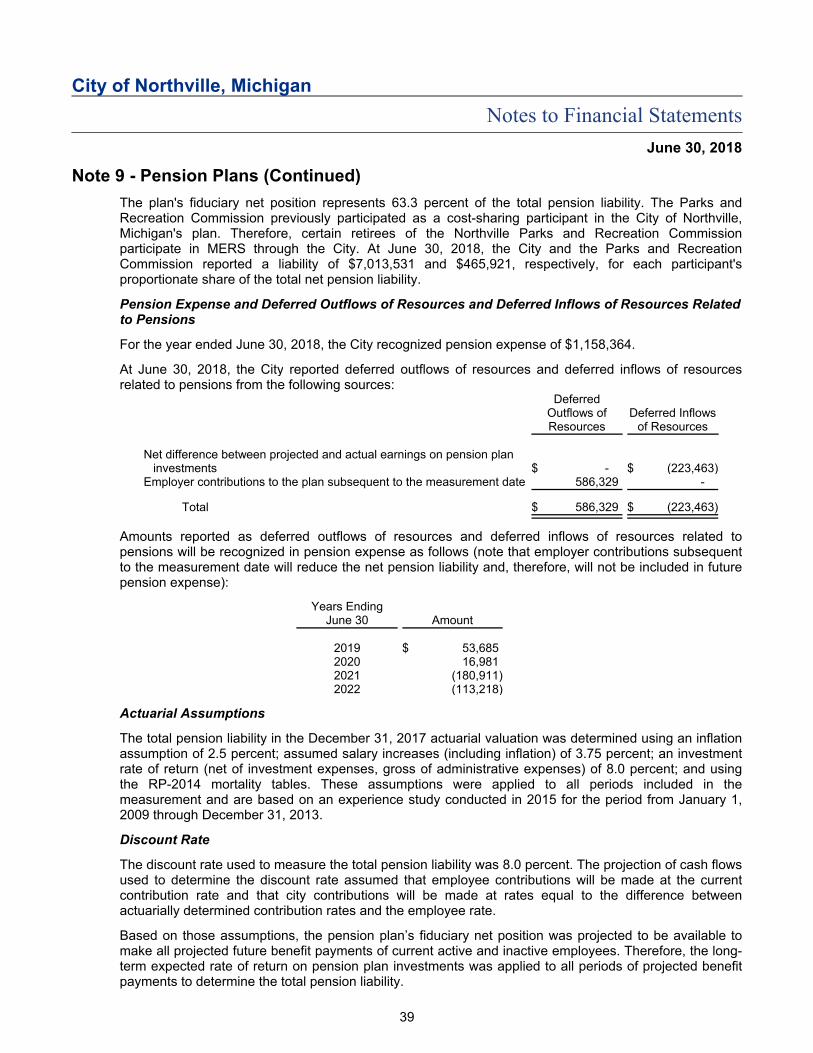
City of Northville, Michigan
Notes to Financial Statements
June 30, 2018
Note 9 - Pension Plans (Continued)
The plan's fiduciary net position represents 63.3 percent of the total pension liability. The Parks andRecreation Commission previously participated as a cost-sharing participant in the City of Northville,Michigan's plan. Therefore, certain retirees of the Northville Parks and Recreation Commissionparticipate in MERS through the City. At June 30, 2018, the City and the Parks and RecreationCommission reported a liability of $7,013,531 and $465,921, respectively, for each participant'sproportionate share of the total net pension liability.
Pension Expense and Deferred Outflows of Resources and Deferred Inflows of Resources Relatedto Pensions
For the year ended June 30, 2018, the City recognized pension expense of $1,158,364.
At June 30, 2018, the City reported deferred outflows of resources and deferred inflows of resourcesrelated to pensions from the following sources:
DeferredOutflows ofResources
Deferred Inflowsof Resources
Net difference between projected and actual earnings on pension planinvestments $ - $ (223,463)
Employer contributions to the plan subsequent to the measurement date 586,329 -
Total $ 586,329 $ (223,463)
Amounts reported as deferred outflows of resources and deferred inflows of resources related topensions will be recognized in pension expense as follows (note that employer contributions subsequentto the measurement date will reduce the net pension liability and, therefore, will not be included in futurepension expense):
Years EndingJune 30 Amount
2019 $ 53,6852020 16,9812021 (180,911)2022 (113,218)
Actuarial Assumptions
The total pension liability in the December 31, 2017 actuarial valuation was determined using an inflationassumption of 2.5 percent; assumed salary increases (including inflation) of 3.75 percent; an investmentrate of return (net of investment expenses, gross of administrative expenses) of 8.0 percent; and usingthe RP-2014 mortality tables. These assumptions were applied to all periods included in themeasurement and are based on an experience study conducted in 2015 for the period from January 1,2009 through December 31, 2013.
Discount Rate
The discount rate used to measure the total pension liability was 8.0 percent. The projection of cash flowsused to determine the discount rate assumed that employee contributions will be made at the currentcontribution rate and that city contributions will be made at rates equal to the difference betweenactuarially determined contribution rates and the employee rate.
Based on those assumptions, the pension plan’s fiduciary net position was projected to be available tomake all projected future benefit payments of current active and inactive employees. Therefore, the long-term expected rate of return on pension plan investments was applied to all periods of projected benefitpayments to determine the total pension liability.
39

City of Northville, Michigan
Notes to Financial Statements
June 30, 2018
Note 9 - Pension Plans (Continued)
Investment Rate of Return
Best estimates of arithmetic real rates of return as of the December 31, 2017 measurement date for eachmajor asset class included in the pension plan's target asset allocation, as disclosed in the investmentfootnote, are summarized in the following tables:
Asset Class Target Allocation
Long-termExpected RealRate of Return
Global equity %55.50 %8.65Global fixed income 18.50 3.76Real assets 13.50 9.72Diversifying strategies 12.50 7.50
Sensitivity of the Net Pension Liability to Changes in the Discount Rate
The following presents the net pension liability of the City, calculated using the discount rate of 8.0percent, as well as what the City's net pension liability would be if it were calculated using a discount ratethat is 1 percentage point lower (7.0 percent) or 1 percentage point higher (9.0 percent) than the currentrate:
1 PercentDecrease
(7.0%)
Current DiscountRate
(8.0%)
1 PercentIncrease(9.0%)
Net pension liability of the plan $ 9,408,284 $ 7,479,452 $ 5,825,427
Pension Plan Fiduciary Net Position
Detailed information about the plan’s fiduciary net position is not available in the separately issuedfinancial report. For the purpose of measuring the net pension liability, deferred outflows of resources,and deferred inflows or resources related to pension, and pension expense, information about the plan’sfiduciary net position and addition to/deduction from fiduciary net position have been determined on thesame basis as they are reported by the plan. The plan uses the economic resources measurement focusand the full accrual basis of accounting. Investments are stated at fair value. Contribution revenue isrecorded as contributions are due, pursuant to legal requirements. Benefit payments and refunds ofemployee contributions are recognized as expense when due and payable in accordance with the benefitterms.
Note 10 - Other Postemployment Benefit Plan
Plan Description
The City provides OPEB for all employees, retirees, and beneficiaries who meet eligibility requirements.The benefits are provided through the Retiree Health Care Plan, an agent multiple-employer plan,administered by the Municipal Employees' Retirement System of Michigan Health Funding Vehicle. Noassets are accumulated in a trust that meets the criteria in paragraph 4 of Statement No. 75. The plandoes not issue a publicly available financial report.
Management of the plan is vested in the pension board, which consists of seven members, three electedby plan members, three appointed by the City, and the city treasurer, who serves as an exofficio member.
Benefits Provided
Retiree Health Care Plan provides healthcare and vision benefits for retirees and their dependents.Benefits are provided under collective bargaining agreements. As of July 1, 2008, the plan was closed tonew entrants.
40

City of Northville, Michigan
Notes to Financial Statements
June 30, 2018
Note 10 - Other Postemployment Benefit Plan (Continued)
Employees Covered by Benefit Terms
The following members were covered by the benefit terms:
Retiree Health CarePlan
Date of member count December 31, 2017
Inactive plan members or beneficiaries currently receiving benefits 73Active plan members 19
Total plan members 92
Contributions
Retiree healthcare costs are paid by the City on a "pay-as-you-go" basis. The City has no obligation tomake contributions in advance of when the insurance premiums are due for payment. For the fiscal yearended June 30, 2018, the City made payments for postemployment health benefit premiums of $630,978.
Net OPEB Liability
The City's net OPEB liability of $3,767,818 was measured as of December 31, 2017 and was determinedby an actuarial valuation as of that date.
Changes in the net OPEB liability during the measurement year were as follows:
Changes in Net OPEB LiabilityTotal OPEB
LiabilityPlan NetPosition
Net OPEBLiability
Balance at January 1, 2017 $ 13,134,347 $ 8,647,497 $ 4,486,850
Changes for the year:Service cost 130,093 - 130,093Interest 831,247 - 831,247Contributions - Employer - 593,069 (593,069)Net investment income - 1,108,749 (1,108,749)Benefit payments, including refunds (691,872) (691,872) -Administrative expenses - (21,446) 21,446
Net changes 269,468 988,500 (719,032)
Balance at December 31, 2017 $ 13,403,815 $ 9,635,997 $ 3,767,818
The plan's fiduciary net position represents 71.9 percent of the total OPEB liability.
OPEB Expense and Deferred Outflows of Resources and Deferred Inflows of Resources Relatedto OPEB
For the year ended June 30, 2018, the City recognized OPEB expense of $314,493.
41

City of Northville, Michigan
Notes to Financial Statements
June 30, 2018
Note 10 - Other Postemployment Benefit Plan (Continued)
At June 30, 2018, the City reported deferred outflows of resources and deferred inflows of resourcesrelated to OPEB from the following sources:
DeferredOutflows ofResources
Deferred Inflowsof Resources
Net difference between projected and actual earnings on OPEB planinvestments $ - $ (440,456)
Employer contributions to the plan subsequent to the measurement date 320,357 -
Total $ 320,357 $ (440,456)
Amounts reported as deferred outflows of resources and deferred inflows of resources related to OPEBwill be recognized in OPEB expense as follows:
Years EndingJune 30 Amount
2019 $ (110,114)2020 (110,114)2021 (110,114)2022 (110,114)
Actuarial Assumptions
The total OPEB liability in the December 31, 2017 actuarial valuation was determined using an inflationassumption of 2.5 percent; assumed salary increases (including inflation) of 2.5 percent; an investmentrate of return (net of investment expenses) of 6.5 percent; a healthcare cost trend rate of 8.5 percent for2018, decreasing 0.5 percent per year to an ultimate rate of 5.0 percent for 2025 and later years; andusing the RP-2014 mortality tables. These assumptions were applied to all periods included in themeasurement.
The actuarial assumptions used in the December 31, 2017 valuation were based on the results of anactuarial experience study for the period 2000-2013.
Discount Rate
The discount rate used to measure the total OPEB liability was 6.5 percent. The projection of cash flowsused to determine the discount rate assumed that employee contributions will be made at the currentcontribution rate and that city contributions will be made at rates equal to the difference betweenactuarially determined contribution rates and the employee rate.
Based on those assumptions, the OPEB plan's fiduciary net position was projected to be available tomake all projected future benefit payments of current active and inactive employees. Therefore, the long-term expected rate of return on OPEB plan investments was applied to all periods of projected benefitpayments to determine the total OPEB liability.
Sensitivity of the Net OPEB Liability to Changes in the Discount Rate
The following presents the net OPEB liability of the City, calculated using the discount rate of 6.5 percent,as well as what the City's net OPEB liability would be if it were calculated using a discount rate that is 1percentage point lower or 1 percentage point higher than the current rate:
1 PercentDecrease
(5.5%)
Current DiscountRate
(6.5%)
1 PercentIncrease(7.5%)
Net OPEB liability of the Retiree Health Care Plan $ 5,659,818 $ 3,767,818 $ 2,218,818
42

City of Northville, Michigan
Notes to Financial Statements
June 30, 2018
Note 10 - Other Postemployment Benefit Plan (Continued)
Sensitivity of the Net OPEB Liability to Changes in the Healthcare Cost Trend Rate
The following presents the net OPEB liability of the City, calculated using the healthcare cost trend rate of8.5 percent (decreasing to 5.0 percent), as well as what the City's net OPEB liability would be if it werecalculated using a healthcare cost trend rate that is 1 percentage point lower or 1 percentage point higherthan the current rate:
1 PercentDecrease
(7.5%,Decreasing to
4.0%)
CurrentHealthcare Cost
Trend Rate(8.5%,
Decreasing to5.0%)
1 PercentIncrease(9.5%,
Decreasing to6.0%)
Net OPEB liability of the Retiree Health Care Plan $ 2,189,818 $ 3,767,818 $ 5,697,818
Note 11 - Jointly Governed Organizations
The City participates in the Northville Parks and Recreation Commission (the "Recreation Commission")as a joint venture with the Charter Township of Northville (the "Township"). The City is represented bythe mayor or mayor pro tem and one other member of the City Council. Approval of the annual budget isrequired by the City and the Charter Township of Northville. The Recreation Commission has beensubsidized to the extent that expenditures exceed operating revenue. At June 30, 2018, the investment inthe Recreation Commission was $591,782. During the current year, the City contributed $194,014 for theoperations of the Recreation Commission. The City is unaware of any circumstances that would cause anadditional benefit or burden to the participating governments in the near future. Complete financialstatements for the Recreation Commission can be obtained from the city offices at 215 W. Main Street,Northville, Michigan 48167.
The City sponsors a pension plan and postretirement benefit plan on behalf of the RecreationCommission. There are no active Recreation Commission employees in the plan sponsored by the City.The Recreation Commission contributes a pro rata share of the amortization of unfuded actuarial liabilityfor the defined benefit pension plan and postretirement benefit plan.
The City participates in the Northville Youth Assistance Commission (the "Commission") as a jointventure with the Charter Township of Northville and Northville Public Schools. The City appoints threemembers to the governing board of the Commission. Approval of the annual budget is required by theCity and the Charter Township of Northville. At June 30, 2018, the investment in the Commission was$18,705. During the current year, the City contributed $18,010 for the operations of the Commission. TheCity is unaware of any circumstances that would cause an additional benefit or burden to the participatinggovernments in the near future. Complete financial statements for the Commission can be obtained fromthe Charter Township of Northville at 44405 Six Mile Road, Northville, Michigan 48167.
43

City of Northville, Michigan
Notes to Financial Statements
June 30, 2018
Note 11 - Jointly Governed Organizations (Continued)
The City is a member of the 35th District Court System, which provides judicial services to the City andvarious other surrounding communities. The City appoints one member to the joint venture’s board, whichthen approves the annual budget and one member to the related Building Authority board. Completefinancial statements for the court can be obtained from the 35th Judicial District Court at 660 PlymouthRoad, Plymouth, Michigan 48170.
The City is also served by the North Huron Valley/Rouge Valley (NHV/RV) Sewage Disposal System,which provides services to 17 municipal entities, including cities, townships, and counties. During fiscalyear 2018, the City paid $815,443 for sewage disposal, operation and maintenance, and debt in thissystem. Payment of these charges is funded through the collection of sewer fees to city residents.
Note 12 - Risk Management
The City is exposed to various risks of loss related to property loss, torts, errors, and omissions, andemployee injuries (workers' compensation), as well as medical benefits provided to employees. The Cityparticipates in the Michigan Municipal Risk Management Authority (the "Authority") for claims relating toproperty loss, torts, and errors and omissions. The City also participates in the Accident Fund MunicipalGroup Program for employee injuries. The City purchases commercial insurance for all medical benefitsand for firefighter death and disability coverage. Settled claims related to the commercial insurance havenot exceeded the amount of insurance coverage in any of the past three fiscal years.
The Michigan Municipal Risk Management Authority risk pool program operates as a claims servicingpool for amounts up to member retention limits and operates as a common risk-sharing managementprogram for losses in excess of member retention amounts. Although premiums are paid annually to theAuthority that it uses to pay claims up to the retention limits, the ultimate liability for those claims remainswith the City. A portion of the excess insurance coverage is underwritten by the Michigan Municipal RiskManagement Authority itself.
The City estimates the liability for general liability claims that have been incurred through the end of thefiscal year, including claims that have been reported, as well as claims that may have been incurred butnot reported. During the year ended June 30, 2018, there were no significant uninsured claims paid bythe City and no significant outstanding balances at year end.
Note 13 - Tax Abatements
The City entered into lease agreements with two local businesses to utilize their vacant lots as publicparking. Per the underlying contractual agreements, the City reimburses one business 100 percent andthe other business 45 percent of their annual property taxes, respectively. The local businesses pay theirfull tax bills each year. These lease agreements may be terminated at any time. For the current fiscalyear, the City reimbursed a total of $4,962 to the property owners.
Note 14 - Reporting Change
During the current year, the City adopted GASB Statement No. 75, Accounting and Financial Reportingfor Postemployment Benefits Other than Pensions. As a result, the government-wide statements and theproprietary funds now include a liability for unfunded legacy costs. Some of the changes in this net OPEBliability will be recognized immediately as part of the OPEB expense measurement and part will bedeferred and recognized over future years. Refer to the OPEB note for further details. This change doesnot impact the General Fund or any other governmental fund.
The financial statements for the year ended June 30, 2017 have been restated in order to adopt GASBStatement No. 75. The effect of this new accounting standard was a decrease in net position to recordthe net OPEB liability and deferred outflows at June 30, 2017.
44

City of Northville, Michigan
Notes to Financial Statements
June 30, 2018
Note 14 - Reporting Change (Continued)
The beginning net position of governmental activities, business-type activities, the Water and SewerFund, and the Refuse and Recycling Fund have been restated as follows:
GovernmentalActivities
Business-typeActivities
Water andSewer
Refuse andRecycling
Net position - June 30, 2017 - Aspreviously reported $ 28,810,661 $ 6,012,296 $ 6,153,760 $ 137,579
Reversal of GASB Statement No.45 OPEB liability 1,049,645 343,897 312,927 30,970
Adjustment for implementation ofGASB Statement No. 75 (3,300,663) (541,123) (486,977) (54,146)
Net position - June 30, 2017- As restated $ 26,559,643 $ 5,815,070 $ 5,979,710 $ 114,403
45

Required Supplemental Information
46

City of Northville, Michigan
Required Supplemental InformationBudgetary Comparison Schedule - General Fund
Year Ended June 30, 2018
Original BudgetAmendedBudget Actual
Variance withAmendedBudget
RevenueProperty taxes $ 5,636,578 $ 5,631,276 $ 5,631,764 $ 488State-shared revenue and grants:
Federal grants - 18,397 21,836 3,439State-shared revenue and grants 574,126 612,174 612,174 -
Sales and services:Cemetery 77,000 125,500 132,830 7,330Charges for overhead services 208,170 200,395 200,395 -Sales and services 598,009 618,403 590,920 (27,483)
Fines and forfeitures 29,450 20,245 22,447 2,202Licenses and permits 365,500 451,391 469,772 18,381Interest and rentals:
Investment income 10,500 220 15,281 15,061Rental income 181,710 203,899 198,891 (5,008)
Other revenue:Local contribution 135,650 50,990 50,991 1Other 16,200 39,365 44,091 4,726
Racetrack breakage 18,409 15,785 16,007 222
Total revenue 7,851,302 7,988,040 8,007,399 19,359
ExpendituresCurrent services:
General government:City Council 14,265 14,450 14,041 409City manager and communications 398,120 427,940 427,326 614Finance and administrative services 344,870 352,950 351,772 1,178Technology costs 74,615 80,725 67,857 12,868Tax and assessing 188,160 178,095 178,015 80City clerk 151,964 150,420 148,311 2,109Buildings and grounds 185,155 191,565 183,954 7,611City attorney 100,000 177,525 164,327 13,198Clerk - Elections 50,185 74,600 73,339 1,261Insurance 24,130 26,410 26,406 4Planning, zoning, and inspection 304,362 336,922 322,374 14,548Central supply 24,025 24,025 19,591 4,434
Public safety:Police department 2,964,819 2,905,282 2,888,512 16,770Fire department 879,285 909,585 871,758 37,827
Public works:Civic events 36,440 39,710 29,725 9,985Administration 255,910 304,636 300,841 3,795Parking system maintenance 94,975 - - -Street lighting and miscellaneous public
works 174,355 159,560 155,100 4,460Beautification 5,950 7,165 5,623 1,542Cemetery 136,300 136,745 133,437 3,308
Recreation and culture 220,706 224,700 224,699 1Contributions to MERS trusts - 68,000 68,000 -
Debt service 52,306 52,306 52,306 -
Total expenditures 6,680,897 6,843,316 6,707,314 136,002
Excess of Revenue Over Expenditures 1,170,405 1,144,724 1,300,085 155,361
See notes to required supplemental information. 47

City of Northville, Michigan
Required Supplemental InformationBudgetary Comparison Schedule - General Fund (Continued)
Year Ended June 30, 2018
Original BudgetAmendedBudget Actual
Variance withAmendedBudget
Other Financing Sources (Uses)Transfers in $ 27,368 $ 10,724 $ 10,724 $ -
Transfers out (766,155) (729,951) (856,806) (126,855)
Total other financing uses (738,787) (719,227) (846,082) (126,855)
Net Change in Fund Balance 431,618 425,497 454,003 28,506
Fund Balance - Beginning of year 3,632,038 3,632,038 3,632,038 -
Fund Balance - End of year $ 4,063,656 $ 4,057,535 $ 4,086,041 $ 28,506
See notes to required supplemental information. 48

City of Northville, Michigan
Required Supplemental InformationSchedule of Changes in the Net Pension Liability and Related Ratios
Last Four Fiscal Years
2018 2017 2016 2015
Total Pension LiabilityService cost $ 98,211 $ 90,532 $ 105,071 $ 108,463Interest 1,534,515 1,547,682 1,518,738 1,508,044Differences between expected and actual
experience 370,870 (287,626) (45,461) -Changes in assumptions - - 881,953 -Benefit payments, including refunds (1,546,397) (1,491,621) (1,540,297) (1,430,069)
Net Change in Total Pension Liability 457,199 (141,033) 920,004 186,438
Total Pension Liability - Beginning of year 19,905,529 20,046,562 19,126,558 18,940,120
Total Pension Liability - End of year $ 20,362,728 $ 19,905,529 $ 20,046,562 $ 19,126,558
Plan Fiduciary Net PositionContributions - Employer $ 1,441,908 $ 1,319,184 $ 1,307,640 $ 1,099,108Contributions - Member 12,583 11,156 11,969 11,676Net investment income (loss) 1,517,589 1,191,540 (167,140) 661,980Administrative expenses (23,990) (23,515) (23,783) (24,342)Benefit payments, including refunds (1,546,397) (1,491,621) (1,540,297) (1,430,069)
Net Change in Plan Fiduciary Net Position 1,401,693 1,006,744 (411,611) 318,353
Plan Fiduciary Net Position - Beginning ofyear 11,481,583 10,474,839 10,886,450 10,568,097
Plan Fiduciary Net Position - End of year $ 12,883,276 $ 11,481,583 $ 10,474,839 $ 10,886,450
City's Net Pension Liability - Ending $ 7,479,452 $ 8,423,946 $ 9,571,723 $ 8,240,108
Plan Fiduciary Net Position as a Percentageof Total Pension Liability %63.27 %57.68 %52.25 %56.92
Covered Employee Payroll $ 731,856 $ 706,615 $ 825,019 $ 855,589
City's Net Pension Liability as a Percentageof Covered Employee Payroll %1,021.98 %1,192.15 %1,160.18 %963.09
See notes to required supplemental information. 49

City of Northville, Michigan
Required Supplemental InformationSchedule of Pension Contributions
Last Ten Fiscal Years
Years Ended June 30
2018 2017 2016 2015 2014 2013 2012 2011 2010 2009
Actuarially determinedcontribution $ 1,052,112 $ 901,164 $ 851,664 $ 842,856 $ 760,020 $ 717,456 $ 663,972 $ 639,696 $ 558,240 $ 544,825
Contributions in relation to theactuarially determinedcontribution 1,441,908 1,319,184 1,307,640 1,099,108 1,042,329 717,456 663,972 639,696 558,240 544,825
Contribution (excess) deficiency $ (389,796) $ (418,020) $ (455,976) $ (256,252) $ (282,309) $ - $ - $ - $ - $ -
Notes to Schedule of Pension Contributions
Actuarial valuation information relative to the determination of contributions:
Valuation date Actuarially determined contribution rates are calculated as of December 31, two years prior to the end of the fiscal year in which the contributionsare reported.
Methods and assumptions used to determine contribution rates:
Actuarial cost method Entry age normal
Amortization method Option B, level dollar contribution
Remaining amortization period 21 years
Asset valuation method 10-year smoothed
Inflation 2.50 percent
Salary increase 3.75 percent
Investment rate of return 8.00 percent, net of pension plan investment expense and gross of administrative expenses
Retirement age 60
Mortality 50 percent female/50 percent male RP-2014 Healthy Annuity Mortality Table (rates multiplied by 105 percent), RP-2014 Employee Mortality Table,and RP-2014 Juvenile Mortality Table. For disabled retirees, RP-2014 Disabled Retiree Mortality Table, 50 percent male and 50 percent femaleblend.
Other information None
See notes to required supplemental information. 50
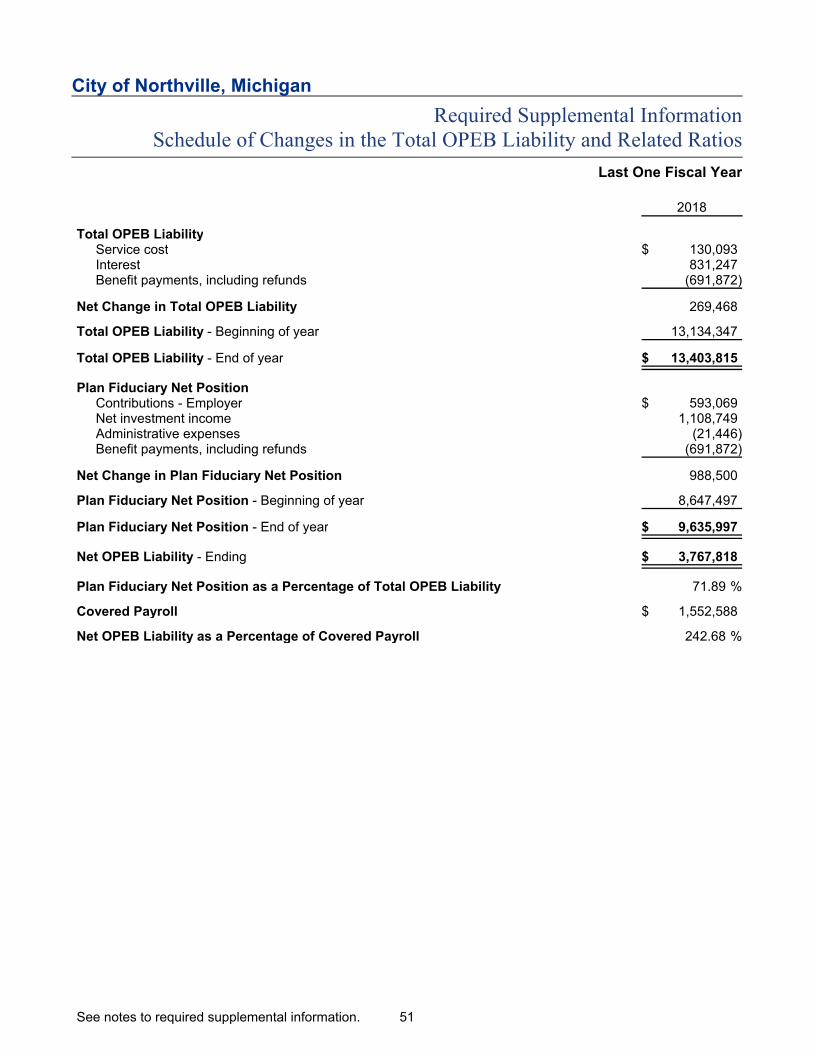
City of Northville, Michigan
Required Supplemental InformationSchedule of Changes in the Total OPEB Liability and Related Ratios
Last One Fiscal Year
2018
Total OPEB LiabilityService cost $ 130,093Interest 831,247Benefit payments, including refunds (691,872)
Net Change in Total OPEB Liability 269,468
Total OPEB Liability - Beginning of year 13,134,347
Total OPEB Liability - End of year $ 13,403,815
Plan Fiduciary Net PositionContributions - Employer $ 593,069Net investment income 1,108,749Administrative expenses (21,446)Benefit payments, including refunds (691,872)
Net Change in Plan Fiduciary Net Position 988,500
Plan Fiduciary Net Position - Beginning of year 8,647,497
Plan Fiduciary Net Position - End of year $ 9,635,997
Net OPEB Liability - Ending $ 3,767,818
Plan Fiduciary Net Position as a Percentage of Total OPEB Liability %71.89
Covered Payroll $ 1,552,588
Net OPEB Liability as a Percentage of Covered Payroll %242.68
See notes to required supplemental information. 51

City of Northville, Michigan
Required Supplemental InformationSchedule of OPEB Contributions
Last Ten Fiscal Years
Years Ended June 30
2018 2017 2016 2015 2014 2013 2012 2011 2010 2009
Actuarially determinedcontribution $ 391,691 $ 808,187 $ 993,116 $ 840,692 $ 820,187 $ 1,012,634 $ 982,988 $ 1,733,557 $ 1,733,557 $ 1,733,557
Contributions in relation tothe actuarially determinedcontribution 847,194 1,001,872 1,109,503 961,787 1,129,194 1,305,128 956,325 907,052 1,023,794 1,138,764
Contribution excess
(deficiency) $ 455,503 $ 193,685 $ 116,387 $ 121,095 $ 309,007 $ 292,494 $ (26,663) $ (826,505) $ (709,763) $ (594,793)
Notes to Schedule of Contributions
Actuarial valuation information relative to the determination of contributions:
Valuation date Actuarially determined contribution rates are calculated as of December 31, one year prior to the end of the fiscal year in which thecontributions are reported.
Methods and assumptions used to determine contribution rates:
Actuarial cost method Entry age normal
Amortization method Level Percent of Payroll, Closed
Remaining amortization period 26 years
Asset valuation method Market value
Inflation 2.50 percent
Healthcare cost trend rates 5.00 to 8.50 percent
Salary increase 2.50 percent
Investment rate of return 6.50 percent
Retirement age 100 percent at 20-25 years of full-time service, depending on the bargaining unit
Mortality 50 percent female/50 percent male RP-2014 Healthy Annuity Mortality Table (rates multiplied by 105 percent), RP-2014 EmployeeMortality Table, and RP-2014 Juvenile Mortality Table. For disabled retirees, RP-2014 Disabled Retiree Mortality Table, 50percent male and 50 percent female blend.
Other information None
See notes to required supplemental information. 52

City of Northville, Michigan
Notes to Required Supplemental Information
June 30, 2018
Budgetary Information
Annual budgets are adopted on a basis consistent with generally accepted accounting principles for the GeneralFund and all special revenue funds, except that operating transfers and debt proceeds have been included in the"revenue" and "expenditures" categories, rather than as "other financing sources (uses)." All annualappropriations lapse at fiscal year end. The legal level of budgetary control adopted by the City is the activitylevel.
The budget represents a complete financial plan for all activities of the City for the ensuing fiscal year. Allestimated income and proposed expenditures are detailed and presented in a form prescribed by law. In addition,this budget presents the proposed budget as part of a five-year plan to improve the decision-making process.
The budget process begins with goals and objectives meetings in January with the City Council, city manager,and administrative staff. These are public meetings. Based upon presentations by the city staff and discussionbetween the mayor and City Council, goals and objectives are prioritized by the City Council for the next fiscalyear.
Each January, department heads receive work papers to prepare their individual line-item budgets. Uponcompletion, the departmental budgets are returned to the finance director in February. The city manager and thefinance director then analyze these amounts. Furthermore, discussions occur with department heads, and thebudget is adjusted accordingly.
A proposed balanced budget is then developed to support the direction and focus established for the communityby the City Council. Specific issues are identified that are vital to continued quality services within the meansavailable. This method of budgeting serves to improve the level of organizational accountability. The City Councilmeetings, held in April and May, provide all interested citizens an open forum where they can be heard. Uponreview and a subsequent public hearing, the City Council adopts the budget by resolution.
The budget is scheduled for adoption at the second regular City Council meeting in May. The operating millagerate is established as part of the budget adoption resolution at that meeting.
Excess of Expenditures Over Appropriations in Budgeted Funds
During the year, the City incurred expenditures in the General Fund, which were in excess of the amountsbudgeted, as follows:
Operating Transfers - Operating transfers out were approximately $127,000 higher than budgeted. The majorityof the unfavorable variance is due to a $125,000 transfer to the Public Improvement Fund resulting from anoperating surplus realized by the General Fund. The transfer to the Public Improvement Fund to be set aside forcontingency/grant match opportunities was approved by City Council subsequent to year end.
See notes to required supplemental information. 53

Other Supplemental Information
54
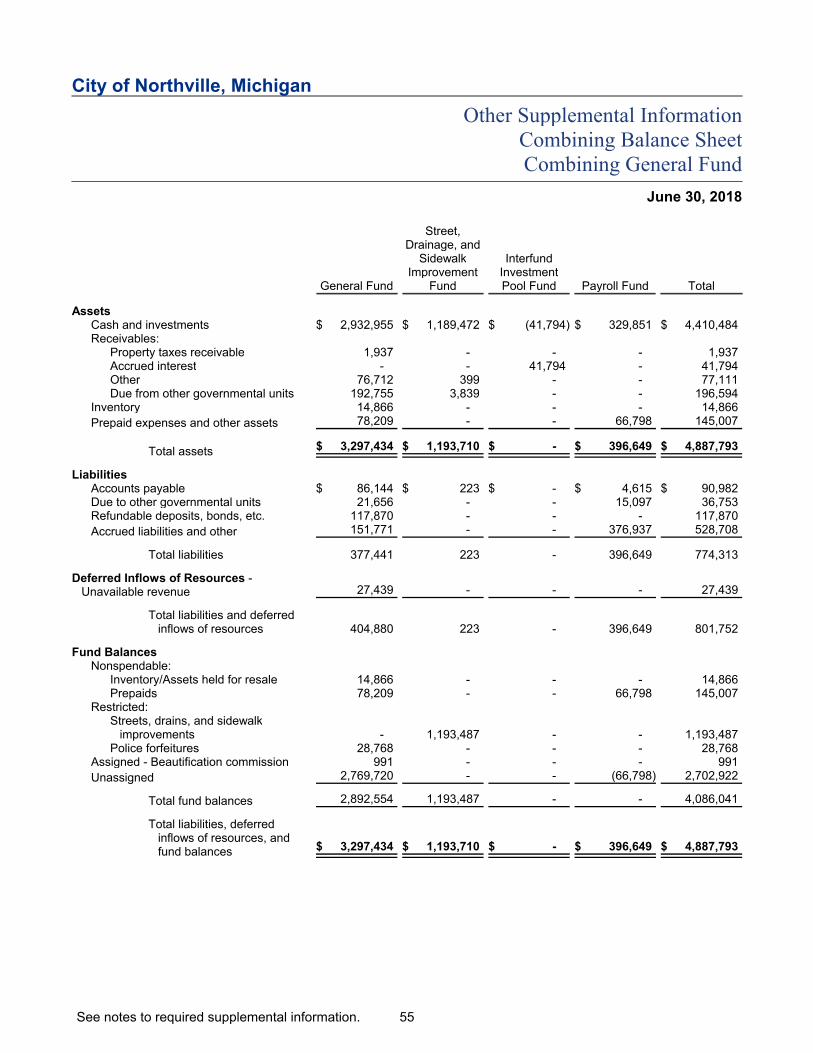
City of Northville, Michigan
Other Supplemental InformationCombining Balance SheetCombining General Fund
June 30, 2018
General Fund
Street,Drainage, and
SidewalkImprovement
Fund
InterfundInvestmentPool Fund Payroll Fund Total
AssetsCash and investments $ 2,932,955 $ 1,189,472 $ (41,794) $ 329,851 $ 4,410,484Receivables:
Property taxes receivable 1,937 - - - 1,937Accrued interest - - 41,794 - 41,794Other 76,712 399 - - 77,111Due from other governmental units 192,755 3,839 - - 196,594
Inventory 14,866 - - - 14,866
Prepaid expenses and other assets 78,209 - - 66,798 145,007
Total assets $ 3,297,434 $ 1,193,710 $ - $ 396,649 $ 4,887,793
LiabilitiesAccounts payable $ 86,144 $ 223 $ - $ 4,615 $ 90,982Due to other governmental units 21,656 - - 15,097 36,753Refundable deposits, bonds, etc. 117,870 - - - 117,870
Accrued liabilities and other 151,771 - - 376,937 528,708
Total liabilities 377,441 223 - 396,649 774,313
Deferred Inflows of Resources -Unavailable revenue 27,439 - - - 27,439
Total liabilities and deferredinflows of resources 404,880 223 - 396,649 801,752
Fund BalancesNonspendable:
Inventory/Assets held for resale 14,866 - - - 14,866Prepaids 78,209 - - 66,798 145,007
Restricted:Streets, drains, and sidewalk
improvements - 1,193,487 - - 1,193,487Police forfeitures 28,768 - - - 28,768
Assigned - Beautification commission 991 - - - 991
Unassigned 2,769,720 - - (66,798) 2,702,922
Total fund balances 2,892,554 1,193,487 - - 4,086,041
Total liabilities, deferredinflows of resources, andfund balances $ 3,297,434 $ 1,193,710 $ - $ 396,649 $ 4,887,793
See notes to required supplemental information. 55

City of Northville, Michigan
Other Supplemental InformationCombining Statement of Revenue, Expenditures, and Changes in Fund
BalancesCombining General Fund
Year Ended June 30, 2018
General Fund
Street,Drainage, and
SidewalkImprovement
Fund
InterfundInvestmentPool Fund Payroll Fund Total
RevenueProperty taxes $ 5,024,632 $ 607,132 $ - $ - $ 5,631,764State-shared revenue and grants:
Federal grants 21,836 - - - 21,836State-shared revenue and grants 612,174 - - - 612,174
Sales and services:Cemetery 132,830 - - - 132,830Charges for overhead services 200,395 - - - 200,395Sales and services 590,920 - - - 590,920
Fines and forfeitures 22,447 - - - 22,447Licenses and permits 469,772 - - - 469,772Interest and rentals 210,555 3,617 - - 214,172Other revenue:
Local contribution 50,991 - - - 50,991Other 21,591 22,500 - - 44,091
Racetrack breakage 16,007 - - - 16,007
Total revenue 7,374,150 633,249 - - 8,007,399
ExpendituresCurrent services -
General government 1,977,313 - - - 1,977,313Public safety:
Police department 2,888,512 - - - 2,888,512Fire department 871,758 - - - 871,758
Public works 624,726 - - - 624,726Recreation and culture 224,699 - - - 224,699
Contributions to MERS trusts 68,000 - - - 68,000
Debt service 52,306 - - - 52,306
Total expenditures 6,707,314 - - - 6,707,314
Excess of Revenue Over Expenditures 666,836 633,249 - - 1,300,085
Other Financing Sources (Uses)Transfers in 10,724 - - - 10,724
Transfers out (637,092) (219,714) - - (856,806)
Total other financing uses (626,368) (219,714) - - (846,082)
Net Change in Fund Balances 40,468 413,535 - - 454,003
Fund Balances - Beginning of year 2,852,086 779,952 - - 3,632,038
Fund Balances - End of year $ 2,892,554 $ 1,193,487 $ - $ - $ 4,086,041
See notes to required supplemental information. 56

City of Northville, Michigan
Special Revenue Funds
Major Streets Local Streets ParkingHousing
Commission CemeteryArts
Commission
AssetsCash and investments $ 552,161 $ 108,234 $ 704,398 $ 404,172 $ 975,491 $ 55,267Receivables:
Special assessments - - 60,737 - - -Accrued interest - - - - 8,759 -Other 213 - 220 698 26 2,054Due from other governmental
units 63,283 27,127 161 2,547 - -Inventory - - 3,716 - - -
Prepaid expenses and other assets 1,001 4,818 - 7,041 - -
Total assets $ 616,658 $ 140,179 $ 769,232 $ 414,458 $ 984,276 $ 57,321
LiabilitiesAccounts payable $ 10,741 $ 28,474 $ 12,406 $ 7,065 $ 15 $ 2,768Accrued liabilities and other 719 2,861 656 4,335 - 1,138
Unearned revenue - - - 26,468 - 8,294
Total liabilities 11,460 31,335 13,062 37,868 15 12,200
Deferred Inflows of Resources -Unavailable revenue - - 47,463 - - -
Fund BalancesNonspendable:
Inventory/Assets held for resale - - 3,716 - - -Prepaids 1,001 4,818 - 7,041 - -
Restricted - Roads 604,197 104,026 - - - -Committed:
Capital projects - - - - - -Cemetery improvements - - - - 984,261 -Arts commission - - - - - 45,121Parking - - 704,991 - - -Allen Terrace - - - 369,549 - -
Debt service - - - - - -
Total fund balances 605,198 108,844 708,707 376,590 984,261 45,121
Total liabilities, deferredinflows of resources,and fund balances $ 616,658 $ 140,179 $ 769,232 $ 414,458 $ 984,276 $ 57,321
See notes to required supplemental information. 57

Other Supplemental InformationCombining Balance Sheet
Nonmajor Governmental Funds
June 30, 2018
Debt Service Funds Capital Project Funds
DDA DebtService Fund
HousingDebt
RetirementFund
PoliceEquipment
Replacement
FireEquipment
Replacement
HousingCommission
CapitalOutlay
TotalNonmajor
GovernmentalFunds
$ 2,554 $ 2,780 $ 260,927 $ 1,321,335 $ 983,180 $ 5,370,499
- - - - - 60,737- - - - - 8,759- - 65 368 286 3,930
- - - - - 93,118- - - - - 3,716- - - - - 12,860
$ 2,554 $ 2,780 $ 260,992 $ 1,321,703 $ 983,466 $ 5,553,619
$ - $ - $ 36 $ 205 $ 159 $ 61,869- - - - - 9,709- - - - - 34,762
- - 36 205 159 106,340
- - - - - 47,463
- - - - - 3,716- - - - - 12,860- - - - - 708,223
- - 260,956 1,321,498 983,307 2,565,761- - - - - 984,261- - - - - 45,121- - - - - 704,991- - - - - 369,549
2,554 2,780 - - - 5,334
2,554 2,780 260,956 1,321,498 983,307 5,399,816
$ 2,554 $ 2,780 $ 260,992 $ 1,321,703 $ 983,466 $ 5,553,619
58
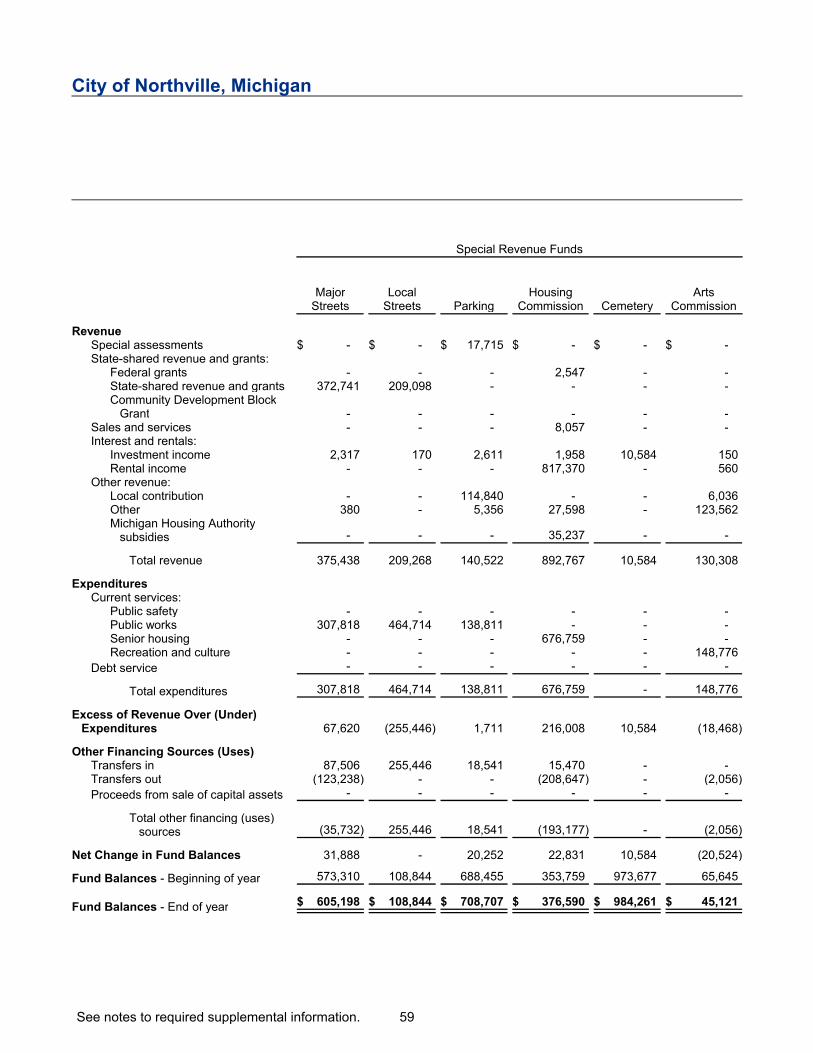
City of Northville, Michigan
Special Revenue Funds
MajorStreets
LocalStreets Parking
HousingCommission Cemetery
ArtsCommission
RevenueSpecial assessments $ - $ - $ 17,715 $ - $ - $ -State-shared revenue and grants:
Federal grants - - - 2,547 - -State-shared revenue and grants 372,741 209,098 - - - -Community Development Block
Grant - - - - - -Sales and services - - - 8,057 - -Interest and rentals:
Investment income 2,317 170 2,611 1,958 10,584 150Rental income - - - 817,370 - 560
Other revenue:Local contribution - - 114,840 - - 6,036Other 380 - 5,356 27,598 - 123,562Michigan Housing Authority
subsidies - - - 35,237 - -
Total revenue 375,438 209,268 140,522 892,767 10,584 130,308
ExpendituresCurrent services:
Public safety - - - - - -Public works 307,818 464,714 138,811 - - -Senior housing - - - 676,759 - -Recreation and culture - - - - - 148,776
Debt service - - - - - -
Total expenditures 307,818 464,714 138,811 676,759 - 148,776
Excess of Revenue Over (Under)Expenditures 67,620 (255,446) 1,711 216,008 10,584 (18,468)
Other Financing Sources (Uses)Transfers in 87,506 255,446 18,541 15,470 - -Transfers out (123,238) - - (208,647) - (2,056)
Proceeds from sale of capital assets - - - - - -
Total other financing (uses)sources (35,732) 255,446 18,541 (193,177) - (2,056)
Net Change in Fund Balances 31,888 - 20,252 22,831 10,584 (20,524)
Fund Balances - Beginning of year 573,310 108,844 688,455 353,759 973,677 65,645
Fund Balances - End of year $ 605,198 $ 108,844 $ 708,707 $ 376,590 $ 984,261 $ 45,121
See notes to required supplemental information. 59

Other Supplemental InformationCombining Statement of Revenue, Expenditures, and Changes in Fund
BalancesNonmajor Governmental Funds
Year Ended June 30, 2018
Debt Service Funds Capital Project Funds
DDA DebtServiceFund
Housing DebtRetirement
Fund
PoliceEquipment
Replacement
FireEquipment
Replacement
HousingCommission
Capital Outlay
TotalNonmajor
GovernmentalFunds
$ - $ - $ - $ - $ - $ 17,715
- - - - - 2,547- - - - - 581,839
- - - - 17,466 17,466- - - - - 8,057
- - 686 4,241 3,293 26,010- - - - - 817,930
172,355 - - 81,638 - 374,869- - - - - 156,896
- - - - - 35,237
172,355 - 686 85,879 20,759 2,038,566
- - 2,451 42,390 - 44,841- - - - - 911,343- - - - 24,680 701,439- - - - - 148,776
172,355 95,647 - - - 268,002
172,355 95,647 2,451 42,390 24,680 2,074,401
- (95,647) (1,765) 43,489 (3,921) (35,835)
- 95,647 77,000 207,236 113,000 869,846- - - - - (333,941)- - 5,330 3,800 - 9,130
- 95,647 82,330 211,036 113,000 545,035
- - 80,565 254,525 109,079 509,200
2,554 2,780 180,391 1,066,973 874,228 4,890,616
$ 2,554 $ 2,780 $ 260,956 $ 1,321,498 $ 983,307 $ 5,399,816
60

City of Northville, Michigan
Other Supplemental InformationCombining Statement of Net Position
Internal Service Funds
June 30, 2018
MunicipalEquipment
InsuranceRetention
Fund
Employees'Accumulated
CompensationTotal Internal
Service Funds
AssetsCurrent assets:
Cash and investments $ 388,601 $ 1,005 $ 485,085 $ 874,691Receivables 820 - 173 993Inventory 23,214 - - 23,214
Prepaid expenses and other assets 1,079 - - 1,079
Total current assets 413,714 1,005 485,258 899,977
Noncurrent assets:Restricted assets - 356,422 - 356,422Capital assets - Assets subject to
Depreciation 171,150 - - 171,150
Total noncurrent assets 171,150 356,422 - 527,572
Total assets 584,864 357,427 485,258 1,427,549
LiabilitiesCurrent liabilities:
Accounts payable 4,215 - 96 4,311Accrued liabilities and other 584 128,921 - 129,505
Current portion of compensated absences 2,136 - - 2,136
Total current liabilities 6,935 128,921 96 135,952
Noncurrent liabilities - Compensatedabsences - Net of current portion 3,800 - - 3,800
Total liabilities 10,735 128,921 96 139,752
Net PositionNet investment in capital assets 171,150 - - 171,150Restricted - Insurance retention - 228,506 - 228,506
Unrestricted 402,979 - 485,162 888,141
Total net position $ 574,129 $ 228,506 $ 485,162 $ 1,287,797
See notes to required supplemental information. 61

City of Northville, Michigan
Other Supplemental InformationCombining Statement of Revenue, Expenses, and Changes in Net Position
Internal Service Funds
Year Ended June 30, 2018
MunicipalEquipment
InsuranceRetention
Fund
Employees'Accumulated
Compensation Total
Operating RevenueRental income $ 264,931 $ - $ - $ 264,931Recoveries - 33,398 - 33,398
Other revenue 2,415 108,735 - 111,150
Total operating revenue 267,346 142,133 - 409,479
Operating ExpensesOther operating and maintenance costs 285,651 - - 285,651Claims - 20,095 - 20,095Compensation pay-outs - - 41,368 41,368
Depreciation 70,783 - - 70,783
Total operating expenses 356,434 20,095 41,368 417,897
Operating Income (Loss) (89,088) 122,038 (41,368) (8,418)
Nonoperating Revenue - Investment income 1,608 7,878 2,056 11,542
Change in Net Position (87,480) 129,916 (39,312) 3,124
Net Position - Beginning of year 661,609 98,590 524,474 1,284,673
Net Position - End of year $ 574,129 $ 228,506 $ 485,162 $ 1,287,797
See notes to required supplemental information. 62

City of Northville, Michigan
Other Supplemental InformationCombining Statement of Cash Flows
Internal Service Funds
Year Ended June 30, 2018
MunicipalEquipment
InsuranceRetention Fund
Employees'Accumulated
CompensationTotal InternalService Funds
Cash Flows from Operating ActivitiesReceipts from customers $ 264,845 $ - $ (121) $ 264,724Payments to suppliers (175,642) (65,922) (23) (241,587)Payments to employees and fringes (110,111) - (41,368) (151,479)Other receipts 1,724 142,133 - 143,857
Net cash and cash equivalents (used in)provided by operating activities (19,184) 76,211 (41,512) 15,515
Cash Flows Used in Capital and RelatedFinancing Activities - Purchase of capital assets (37,940) - - (37,940)
Cash Flows Provided by Investing Activities -Interest received on investments 1,608 7,878 2,056 11,542
Net (Decrease) Increase in Cash and CashEquivalents (55,516) 84,089 (39,456) (10,883)
Cash and Cash Equivalents - Beginning of year 444,117 273,338 524,541 1,241,996
Cash and Cash Equivalents - End of year $ 388,601 $ 357,427 $ 485,085 $ 1,231,113
Classification of Cash and Cash EquivalentsCash and investments $ 388,601 $ 1,005 $ 485,085 $ 874,691
Restricted cash - 356,422 - 356,422
Total cash and cash equivalents $ 388,601 $ 357,427 $ 485,085 $ 1,231,113
Reconciliation of Operating (Loss) Income to NetCash from Operating Activities
Operating (loss) income $ (89,088) $ 122,038 $ (41,368) $ (8,418)Adjustments to reconcile operating income (loss)
to net cash from operating activities:Depreciation 70,783 - - 70,783Changes in assets and liabilities:
Receivables (777) - (121) (898)Inventories (1,524) - - (1,524)Prepaid and other assets 325 - - 325Accounts payable (137) (45,827) (23) (45,987)
Accrued and other liabilities 1,234 - - 1,234
Total adjustments 69,904 (45,827) (144) 23,933
Net cash and cash equivalents(used in) provided by operatingactivities $ (19,184) $ 76,211 $ (41,512) $ 15,515
See notes to required supplemental information. 63