Embed Size (px)
Citation preview

April 22, 2021
Supplemental Financial Presentation

2
SAFE HARBOR
The Company claims the protection of the safe-harbor for forward-looking statements contained in the Private Securities Litigation Reform Act of 1995.
The information in this presentation contains certain forward-looking statements. These statements discuss, among other things, expectations with respect to sales, earnings, store growth, capital expenses, margins, debt, payment of dividends and stock repurchases. These forward-looking statements are based on estimates, projections, beliefs and assumptions, and may be affected by risks or uncertainties including, but not limited to, the effects of the COVID-19 pandemic, competition, product demand, economic conditions, the ability to open new stores, the effectiveness of merchandising and marketing initiatives, the ability to realize operational efficiencies, inflation, consumer debt levels, governmental approvals, ability to hire and retain qualified employees, weather, the imposition of tariffs on imported products, etc. The Company intends these forward-looking statements to speak only as of the time of the presentation and does not undertake any obligation to update or revise them after the date hereof or as more information becomes available.
Actual results may differ materially from anticipated results described in these forward-looking statements. As a result, all of the forward-looking statements made are qualified by these cautionary statements and those contained in the Risk Factors section of the Company’s Annual Report on Form 10-K for the fiscal year ended December 26, 2020, as filed with the Securities and Exchange Commission.

3

4
Q1 2021 Performance
Strong Sales Growth
$1.96B$2.79B
Q1 2020 Q1 2021
Net Sales Growth
+42.5%
4.3%
38.6%
Q1 2020 Q1 2021
Comp Sales Growth
HIGHLIGHTSRecord Level Sales Performance
Customer Traffic Increased 21.0%
Average Ticket Up 17.6%
Triple-Digit eCommerce Growth for the 4th
Consecutive Quarter

5
Broad-Based Strength in Customer Trends
New Customers
Q1 2021: +2.5M
Neighbor’s Club
Members20M+
6
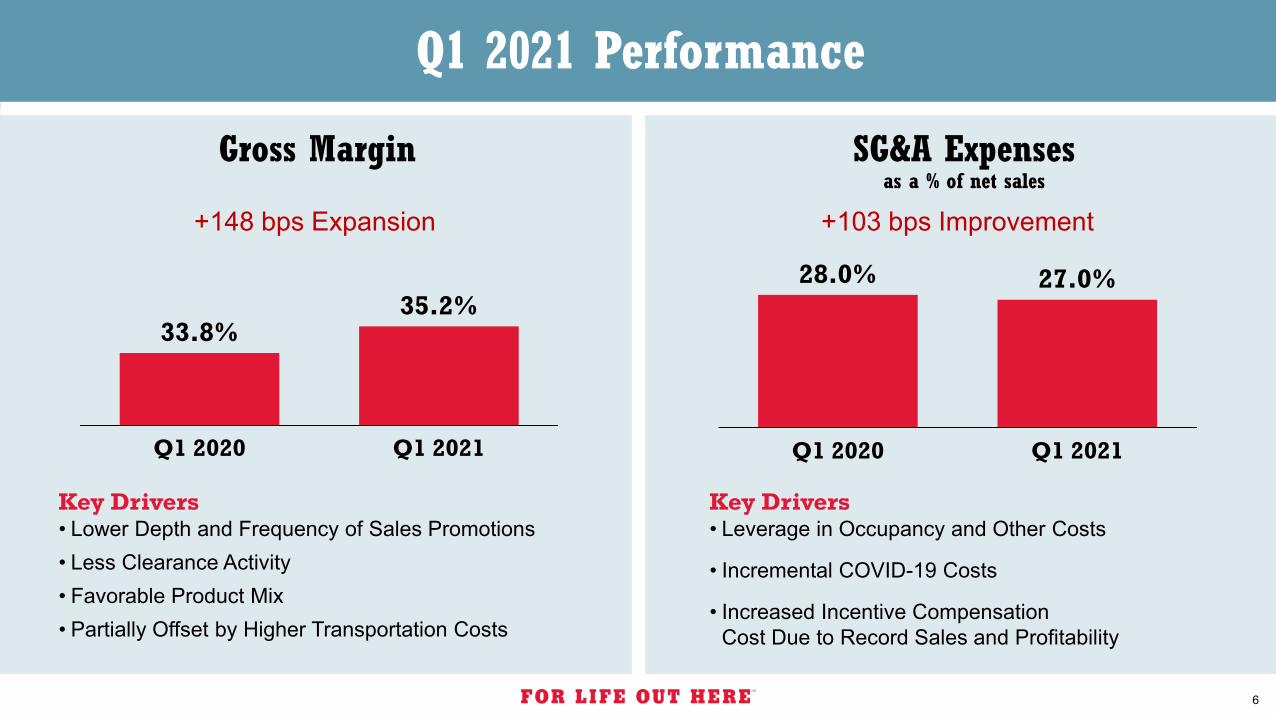
Q1 2021 Performance
33.8%35.2%
Q1 2020 Q1 2021
Gross Margin
+148 bps Expansion
Key Drivers • Lower Depth and Frequency of Sales Promotions• Less Clearance Activity• Favorable Product Mix • Partially Offset by Higher Transportation Costs
28.0% 27.0%
Q1 2020 Q1 2021
SG&A Expensesas a % of net sales
Key Drivers • Leverage in Occupancy and Other Costs
• Incremental COVID-19 Costs
• Increased Incentive Compensation Cost Due to Record Sales and Profitability
+103 bps Improvement

7
Q1 2021 PerformanceProfitability
5.8%
8.3%
Q1 2020 Q1 2021
Operating Margin+251 bps
Net Income
$84M
$181M
Q1 2020 Q1 2021
+116.5%
$0.71
$1.55
Q1 2020 Q1 2021
Diluted EPS+118.3%

8
Net Sales $11.4B to $11.7B
Comparable Store Sales +5% to +8%
Operating Margin Rate 9.4% to 9.7%
Net Income $820M to $860M
Diluted Earnings Per Share $7.05 to $7.40
Capital Expenditures $450M to $550M
Effective Tax Rate 22.1% to 22.4%
Share Repurchases $700M to $800M

9