Embed Size (px)
Citation preview
- i -
Financial Report 2014-2015

- ii -
- iii -
Table of Contents
Governors and Trustees ........................................................................................................................................................... iv
Letter from the Senior Vice President for Finance and Treasurer .......................................................................................... 1
Independent Auditors’ Report ................................................................................................................................................. 2
Management’s Discussion and Analysis (Unaudited) ............................................................................................................. 5
Basic Financial Statements
Statement of Net Position .............................................................................................................................................. 16
Statement of Revenues, Expenses, and Changes in Net Position ................................................................................ 18
Statement of Cash Flows ................................................................................................................................................ 20
Notes to the Financial Statements
1. Summary of Significant Accounting and Reporting Policies ........................................................................... 22
2. Adoption of Accounting Pronouncements ....................................................................................................... 26
3. Cash and Cash Equivalents and Investments ................................................................................................... 27
4. Accounts Receivable and Allowance for Doubtful Accounts ........................................................................... 31
5. Patient Service Revenues ................................................................................................................................... 31
6. Capital Assets ..................................................................................................................................................... 32
7. Accounts Payable and Accrued Expenses .......................................................................................................... 32
8. Noncurrent Liabilities ........................................................................................................................................ 33
9. Commercial Paper .............................................................................................................................................. 33
10. Long-Term Liabilities ......................................................................................................................................... 34
11. Derivative Financial Instruments ...................................................................................................................... 45
12. Commitments .................................................................................................................................................... 47
13. Natural Expenses by Functional Classification ................................................................................................. 48
14. Employee Benefits .............................................................................................................................................. 49
15. Compensated Absences ..................................................................................................................................... 54
16. Risk Management ............................................................................................................................................... 55
17. Contingencies ..................................................................................................................................................... 56
18. One Washington Park ....................................................................................................................................... 56
19. Component Unit – Rutgers University Foundation ........................................................................................ 57
20. Component Unit – University Physician Associates of New Jersey, Inc. and Affiliate ................................... 62
Required Supplementary Information (Unaudited)
Schedules of Employer Contributions ........................................................................................................................... 65
Schedules of Proportionate Share of the Net Pension Liability ................................................................................... 65
University Administrative Officers ......................................................................................................................................... 66
- iv -
Governors and Trustees During the Year Ended June 30, 2015 Board of Governors Greg Brown, Chair Kenneth M. Schmidt, Vice Chair Mark A. Angelson Robert L. Barchi, ex officio Dorothy W. Cantor Anthony J. DePetris Margaret T. Derrick Lora L. Fong Mark P. Hershhorn Gordon A. MacInnes
Susan M. McCue Martin Perez Dudley H. Rivers, Jr. Richard W. Roper Candace L. Straight William M. Tambussi Ann B. Gould, Faculty Representative
Samuel Rabinowitz, Faculty Representative Pamela A. Navrot, Student Representative OFFICERS OF THE BOARD J. Michael Gower, Treasurer Leslie A. Fehrenbach, Secretary Kimberlee M. Pastva, Associate Secretary
Board of Trustees Sandy J. Stewart, Chair M. Wilma Harris, Vice Chair Frank B. Hundley, Vice Chair Michael W. Azzara Rahn Kennedy Bailey Robert L. Barchi, ex officio Felix M. Beck, Emeritus Gregory Bender William E. Best Dominick J. Burzichelli John Herbert Carman, Emeritus Peter Cartmell, Emeritus Mary J. Chyb, Emerita Kevin J. Collins, Emeritus Hollis A. Copeland Anthony J. Covington Alan M. Crosta, Jr. Steven M. Darien Marisa A. Dietrich Carleton C. Dilatush, Emeritus Mary I. DiMartino Teresa A. Dolan James F. Dougherty Norman H. Edelman Robert P. Eichert, Emeritus Evelyn S. Field, Emerita Jeanne M. Fox, Emerita Ronald J. Garutti
Ronald W. Giaconia, Emeritus Rochelle Gizinski, Emerita Evangeline Gomez Leslie E. Goodman, Emeritus Carleton A. Holstrom, Emeritus Paul B. Jennings, Emeritus Nimesh S. Jhaveri Roberta Kanarick Tilak Lal Robert A. Laudicina, Emeritus Walter L. Leib, Emeritus Richard A. Levao, Emeritus Jennifer Lewis-Hall Debra Ann Lynch Rashida V. MacMurray-Abdullah Amy B. Mansue Robert E. Mortensen Patricia Nachtigal, Emerita Gene O'Hara, Emeritus John A. O’Malley Dean J. Paranicas, Emeritus Daniel J. Phelan Jose A. Piazza George A. Rears Norman Reitman, Emeritus James H. Rhodes Alejandro Roman Carole Sampson-Landers
Sidney D. Seligman Richard H. Shindell Susan Stabile Dorothy M. Stanaitis, Emerita Abram J. Suydam, Emeritus Kate Sweeney Heather C. Taylor Anne M. Thomas, Emerita Edgar Torres Michael R. Tuosto, Emeritus Laurel A. Van Leer Lucas J. Visconti Ronald D. Wilson Justine Yu Robert A. Schwartz, Faculty Representative Menahem Spiegel, Faculty Representative Francine M. Glaser, Student Representative OFFICERS OF THE BOARD J. Michael Gower, Treasurer Leslie A. Fehrenbach, Secretary Kimberlee M. Pastva, Associate Secretary
- 1-
Senior Vice President for Finance and Treasurer [email protected] Rutgers, The State University of New Jersey Phone: 848-932-4300 83 Somerset Street – Room 305 Fax: 732-932-4273 New Brunswick, New Jersey 08901-1281
December 17, 2015
President Robert L. Barchi
The Board of Governors
The Board of Trustees
of Rutgers, The State University of New Jersey
I am pleased to submit the Annual Financial Report of Rutgers, The State University of
New Jersey for the year ended June 30, 2015, the second year following the consolidation with units
formerly part of the University of Medicine and Dentistry of New Jersey. The report contains the
KPMG LLP Independent Auditors’ Report on the University’s financial statements. The financial
information presented in this report is designed to assist the reader in comprehending the scope of the
University’s use of resources in meeting its primary missions of instruction, research, public service,
and healthcare.
The report sets forth the complete and permanent record of the financial status of the University
for the year.
Respectfully submitted,
J. Michael Gower
Senior Vice President for Finance & Treasurer
- 2 -
KPMG LLP is a Delaware limited liability partnership, the U.S. member firm of KPMG International Cooperative (“KPMG International”), a Swiss entity.
- 3-
- 4 -
- 5-
Management’s Discussion and Analysis (unaudited) June 30, 2015 The following management’s discussion and analysis (MD&A) provides a comprehensive overview of the financial position of Rutgers, the State University of New Jersey (the university) at June 30, 2015 and its changes in financial position for the fiscal year then ended with fiscal year 2014 data presented for comparative purposes. Management has prepared the basic financial statements and related footnote disclosures along with this MD&A in accordance with generally accepted accounting principles as defined by the Governmental Accounting Standards Board for public colleges and universities. This MD&A should be read in conjunction with the audited financial statements and related footnotes of the university, which directly follow the MD&A. In fiscal 2015, the financial reporting entity of Rutgers included 34 degree granting schools, of which 25 offered graduate programs of study with over 66,000 students enrolled in these programs. These schools are located at Rutgers University–New Brunswick, Rutgers University–Newark, and Rutgers University–Camden. Rutgers Biomedical and Health Sciences, a division within Rutgers, is closely aligned with Rutgers University–New Brunswick. The university also maintains educational services in many other communities throughout the State of New Jersey. The university operates research and institutional facilities on 6,088 acres in all 21 counties and 78 municipalities. The university’s financial report includes three basic financial statements: the Statement of Net Position, the Statement of Revenues, Expenses, and Changes in Net Position, and the Statement of Cash Flows. These statements focus on the financial condition of the university, the changes in financial position, and cash flows of the university’s business type activities as a whole rather than the accountability of funds. The financial statements also include the financial activity of the units of the New Market Tax Credit (NMTC) Transaction (One Washington Park), which include One Washington Park Capital, LLC, RUN Investments, LLC, and One Washington Park Holdings, LLC. The One Washington Park units provide financing services to the university classifying it as a component unit blended with those of the university. The financial statements for the Rutgers University Foundation (the Foundation) and University Physicians Associates of New Jersey, Inc. and Affiliate (UPA) are presented discretely. The Foundation was formed to aid the university in obtaining private funds and other resources to meet the needs and achieve the goals of the university. UPA supports Rutgers Biomedical and Health Sciences through administrative assistance to clinical faculty of the New Jersey Medical School. Implementation of GASB 68 In June 2012, GASB issued Statement No. 68 Accounting and Financial Reporting for Pensions (GASB 68). This statement addresses accounting and financial reporting for pensions that are provided to the employees of state and local governmental employers through pension plans that are administered through trusts. The university participates in the Public Employees Retirement System (PERS) and the Police and Firemen’s Retirement System (PFRS) both defined benefit cost-sharing multiple-employer pension plans. GASB 68 requires that the proportionate share of the net pension liability be recognized by each participating employer in the plan. The net pension liability is the portion of the actuarial present value of projected benefit payments attributed to past periods of employee service net of the pension plan’s fiduciary net position. A cost-sharing employer is also required to recognize its proportionate share of pension expense and report deferred outflows and deferred inflows of resources for its proportionate share. The changes in net pension liability adjusted for the deferred inflows and deferred outflows of resources result in pension expense. Prior to this year, the university only recognized pension expense for these plans up to the amount contributed to the plan by the state as indicated within the fringe benefit rate provided by the state. In 2015, this contribution amounted to $12.6 million. Under GASB 68, the pension expense recorded is $80.6 million. Historically, the state has directly covered pension contributions on behalf of the university and has no current plans to change that. GASB 68 also required the recording of deferred outflow of resources of $73.8 million, a net pension liability of $1,354.7 million and a deferred inflow of resources of $67.7 million. The university was also required to adjust the beginning net unrestricted position by ($1,280.5) million to reflect the cumulative effect of implementation from prior years. In order to provide a comparison of 2015 to the prior year, the amounts recorded as a result of the implementation of GASB 68 have been shown separately.
- 6 -
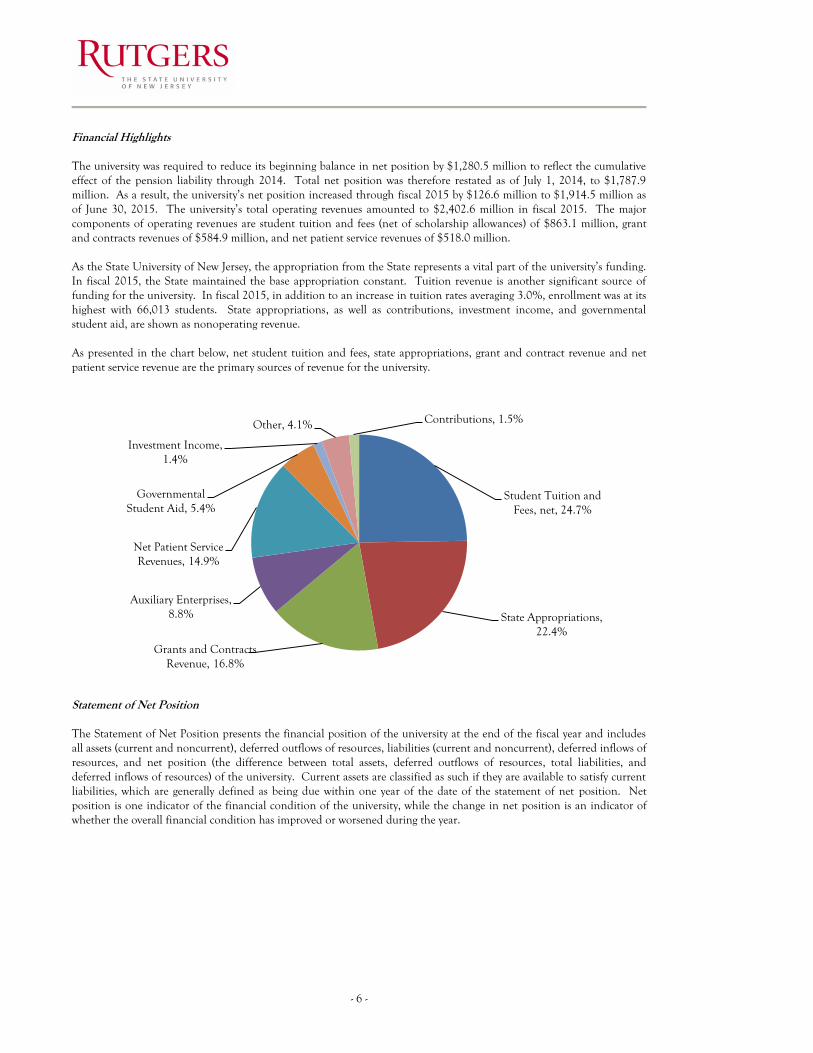
Financial Highlights The university was required to reduce its beginning balance in net position by $1,280.5 million to reflect the cumulative effect of the pension liability through 2014. Total net position was therefore restated as of July 1, 2014, to $1,787.9 million. As a result, the university’s net position increased through fiscal 2015 by $126.6 million to $1,914.5 million as of June 30, 2015. The university’s total operating revenues amounted to $2,402.6 million in fiscal 2015. The major components of operating revenues are student tuition and fees (net of scholarship allowances) of $863.1 million, grant and contracts revenues of $584.9 million, and net patient service revenues of $518.0 million. As the State University of New Jersey, the appropriation from the State represents a vital part of the university’s funding. In fiscal 2015, the State maintained the base appropriation constant. Tuition revenue is another significant source of funding for the university. In fiscal 2015, in addition to an increase in tuition rates averaging 3.0%, enrollment was at its highest with 66,013 students. State appropriations, as well as contributions, investment income, and governmental student aid, are shown as nonoperating revenue. As presented in the chart below, net student tuition and fees, state appropriations, grant and contract revenue and net patient service revenue are the primary sources of revenue for the university.
Statement of Net Position The Statement of Net Position presents the financial position of the university at the end of the fiscal year and includes all assets (current and noncurrent), deferred outflows of resources, liabilities (current and noncurrent), deferred inflows of resources, and net position (the difference between total assets, deferred outflows of resources, total liabilities, and deferred inflows of resources) of the university. Current assets are classified as such if they are available to satisfy current liabilities, which are generally defined as being due within one year of the date of the statement of net position. Net position is one indicator of the financial condition of the university, while the change in net position is an indicator of whether the overall financial condition has improved or worsened during the year.
Student Tuition and Fees, net, 24.7%
State Appropriations, 22.4%
Grants and Contracts Revenue, 16.8%
Auxiliary Enterprises, 8.8%
Net Patient Service Revenues, 14.9%
Governmental Student Aid, 5.4%
Investment Income, 1.4%
Other, 4.1% Contributions, 1.5%
- 7-
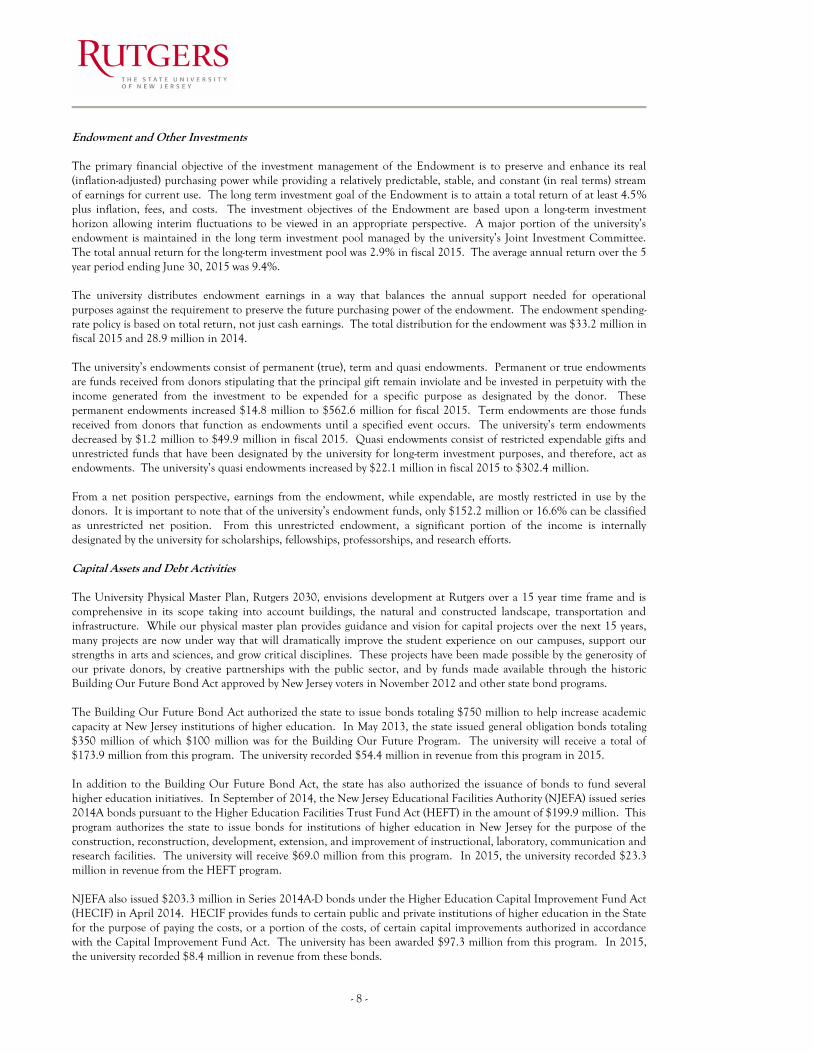
A summarized comparison of the university’s assets, deferred outflows of resources, liabilities, deferred inflows of resources, and net position at June 30, 2015 and 2014 is as follows (dollars in thousands):
2015
GASB 68 Adjustment
2015 Net of
GASB 68
2014 Assets
Current assets $1,240,318) $ —) $1,240,318)
$1,274,310) Noncurrent assets
Endowment, restricted and other
noncurrent cash and investments 1,350,224) —) 1,350,224)
1,415,327)
Capital assets, net 3,235,141) —) 3,235,141)
3,051,175) Other assets 126,989) —) 126,989)
128,957)
Total Assets 5,952,672) —) 5,952,672)
5,869,769)
Deferred Outflows of Resources 171,594) (73,845) 97,749)
97,582) Total Assets and Deferred Outflows of Resources 6,124,266) (73,845) 6,050,421)
5,967,351)
Liabilities
Current liabilities 598,164) —) 598,164)
653,819) Noncurrent liabilities 3,543,956) (1,354,656) 2,189,300)
2,245,178)
Total Liabilities 4,142,120) (1,354,656) 2,787,464)
2,898,997)
Deferred Inflows of Resources 67,660) (67,660) —) —) Net Position
Net investment in capital assets 1,457,539) —) 1,457,539)
1,351,416) Restricted - nonexpendable 563,890) —) 563,890)
548,115)
Restricted - expendable 470,931) —) 470,931)
460,048) Unrestricted (577,874) 1,348,471) 770,597)
708,775)
Total Net Position (Deficit) $1,914,486) $1,348,471) $3,262,957)
$3,068,354) Current Assets and Current Liabilities Current assets include unrestricted and restricted cash and cash equivalents, investments that mature within one year, receivables, inventories and other short-term assets. Noncurrent assets include unrestricted investments that mature in more than a year, as well as cash and cash equivalents and investments that are restricted by donors or external parties as to their use. Receivables deemed to be collectible in more than a year are also included as noncurrent. Current assets decreased $34.0 million in fiscal 2015. Deferred outflows of resources are the consumption of net position that is applicable to a future reporting period. Deferred outflows of resources increased $74.0 million primarily as a result of the adjustment for GASB 68. Without this adjustment, deferred outflows of resources only increased $0.2 million. Current liabilities include all liabilities that are payable within the next fiscal year. Unearned revenues, principally from summer programs and grant revenue received in advance, are also presented as current liabilities. Liabilities that are due to be paid beyond the next fiscal year are reported as noncurrent liabilities. Current liabilities decreased $55.7 million in fiscal 2015 primarily as a result of a reduction in the current portion of university debt issues. The university’s current assets cover current liabilities by a factor of 2.1 times, an indicator of good liquidity and the ability to bear short term demands on working capital. The university’s current assets also cover over four months of its total operating expenses, excluding depreciation.
- 8 -
Endowment and Other Investments The primary financial objective of the investment management of the Endowment is to preserve and enhance its real (inflation-adjusted) purchasing power while providing a relatively predictable, stable, and constant (in real terms) stream of earnings for current use. The long term investment goal of the Endowment is to attain a total return of at least 4.5% plus inflation, fees, and costs. The investment objectives of the Endowment are based upon a long-term investment horizon allowing interim fluctuations to be viewed in an appropriate perspective. A major portion of the university’s endowment is maintained in the long term investment pool managed by the university’s Joint Investment Committee. The total annual return for the long-term investment pool was 2.9% in fiscal 2015. The average annual return over the 5 year period ending June 30, 2015 was 9.4%. The university distributes endowment earnings in a way that balances the annual support needed for operational purposes against the requirement to preserve the future purchasing power of the endowment. The endowment spending-rate policy is based on total return, not just cash earnings. The total distribution for the endowment was $33.2 million in fiscal 2015 and 28.9 million in 2014. The university’s endowments consist of permanent (true), term and quasi endowments. Permanent or true endowments are funds received from donors stipulating that the principal gift remain inviolate and be invested in perpetuity with the income generated from the investment to be expended for a specific purpose as designated by the donor. These permanent endowments increased $14.8 million to $562.6 million for fiscal 2015. Term endowments are those funds received from donors that function as endowments until a specified event occurs. The university’s term endowments decreased by $1.2 million to $49.9 million in fiscal 2015. Quasi endowments consist of restricted expendable gifts and unrestricted funds that have been designated by the university for long-term investment purposes, and therefore, act as endowments. The university’s quasi endowments increased by $22.1 million in fiscal 2015 to $302.4 million. From a net position perspective, earnings from the endowment, while expendable, are mostly restricted in use by the donors. It is important to note that of the university’s endowment funds, only $152.2 million or 16.6% can be classified as unrestricted net position. From this unrestricted endowment, a significant portion of the income is internally designated by the university for scholarships, fellowships, professorships, and research efforts. Capital Assets and Debt Activities The University Physical Master Plan, Rutgers 2030, envisions development at Rutgers over a 15 year time frame and is comprehensive in its scope taking into account buildings, the natural and constructed landscape, transportation and infrastructure. While our physical master plan provides guidance and vision for capital projects over the next 15 years, many projects are now under way that will dramatically improve the student experience on our campuses, support our strengths in arts and sciences, and grow critical disciplines. These projects have been made possible by the generosity of our private donors, by creative partnerships with the public sector, and by funds made available through the historic Building Our Future Bond Act approved by New Jersey voters in November 2012 and other state bond programs. The Building Our Future Bond Act authorized the state to issue bonds totaling $750 million to help increase academic capacity at New Jersey institutions of higher education. In May 2013, the state issued general obligation bonds totaling $350 million of which $100 million was for the Building Our Future Program. The university will receive a total of $173.9 million from this program. The university recorded $54.4 million in revenue from this program in 2015. In addition to the Building Our Future Bond Act, the state has also authorized the issuance of bonds to fund several higher education initiatives. In September of 2014, the New Jersey Educational Facilities Authority (NJEFA) issued series 2014A bonds pursuant to the Higher Education Facilities Trust Fund Act (HEFT) in the amount of $199.9 million. This program authorizes the state to issue bonds for institutions of higher education in New Jersey for the purpose of the construction, reconstruction, development, extension, and improvement of instructional, laboratory, communication and research facilities. The university will receive $69.0 million from this program. In 2015, the university recorded $23.3 million in revenue from the HEFT program. NJEFA also issued $203.3 million in Series 2014A-D bonds under the Higher Education Capital Improvement Fund Act (HECIF) in April 2014. HECIF provides funds to certain public and private institutions of higher education in the State for the purpose of paying the costs, or a portion of the costs, of certain capital improvements authorized in accordance with the Capital Improvement Fund Act. The university has been awarded $97.3 million from this program. In 2015, the university recorded $8.4 million in revenue from these bonds.
- 9-
The university will also receive funds under the Technology Infrastructure Fund Act which created the Higher Education Technology Infrastructure Fund (HETI). HETI funds are required to be used to develop technology infrastructure within and among New Jersey’s institutions of higher education in order to provide access effectively and efficiently to information, educational opportunities and workforce training, and to enhance the connectivity of higher education institutions to libraries and elementary and secondary schools. NJEFA issued Series 2014 in the amount of $38.1 million in January 2014. Rutgers will receive a total of $3.3 million for several technology projects. The university recorded $2.4 million in revenue from this program in 2015. Finally, the state authorized NJEFA to issue Series 2014 Higher Education Equipment Leasing Fund bonds in the amount of $89.3 million under the Higher Education Equipment Leasing Fund Act (ELF). This act authorizes NJEFA to issue bonds to finance the purchase of any property consisting of, or relating to, scientific, engineering, technical, computer, communications, and instructional equipment for lease to public and private institutions of higher education in the State. The university has been awarded $43.8 million from this bond issue for the purchase of this type of equipment. In 2015, the university recorded $17.3 million in revenue from this program. On June 15, 2006, the Board of Governors and Board of Trustees of the university approved a comprehensive debt policy for the university to provide an internal strategic framework for capital planning and overall debt management. In 2008, the Board of Governors and the Board of Trustees of the university approved a commercial paper program. The commercial paper program is being used for the interim financing of capital projects and temporary funding of outstanding debt issues. In 2015, the university issued commercial paper in the amount of $30.7 million to refund Series 2003D and Series 2004COP. The funds received from these state programs, university bonds and other funds received by the university have resulted in the $184.0 million increase in fiscal 2015 in capital assets, net. Capital additions primarily comprise replacement, renovation and new construction of academic and research facilities as well as significant investments in equipment, including information technology. Several major projects completed during fiscal 2015 include: Conversion of 15 Washington Street Newark into a mixed use 260,000 sq. ft. residence to house 175 graduate and
185 undergraduate students on the Newark Campus. Upgrades of Wessels, Leupp, Pell, Hegeman Halls on the College Avenue Campus to meet current buildings codes
and address function efficiencies. In addition, at June 30, 2015, the university had various projects under construction or in the design stage. Significant projects include: Construction of a new facility for the Department of Chemistry and Chemical Biology on the Busch Campus that
will feature 145,000 square feet of flexible research space and classrooms designed to facilitate collaborative research and learning, providing a state-of-the-art facility to train the next generation of globally engaged scientists and support the needs of the chemical industry in New Jersey and beyond.
Construction of the first new academic building on College Avenue in more than 50 years. The Rutgers Academic Building is an approximately 175,000 square foot academic building for the Rutgers University School of Arts & Sciences consisting of approximately 2,500 seats of classroom space in the form of modern lecture halls as well as departmental office space.
Construction of an approximately 500 bed residence hall in New Brunswick for honors students including programming space, office space, common space and other amenities to enhance undergraduate honors research work. The Honors College will create an environment for our brightest students to share space with faculty and deans in order to foster mentorships, cultural exchanges and academic engagement.
Construction of a 78,000 square foot facility for the Institute for Food, Nutrition and Health on the Cook Campus that will contain state-of-the-art laboratories, community clinics, a children’s nutrition center and preschool as well as a dining facility offering health food options.
Renovation of 305 Cooper Street, the Genet Taylor House, includes renovation of the existing 6,685 sq. ft. as well as an addition to the building that will include stairs, elevator and offices for the Department of English on the Camden Campus.
- 10 -
Net Position Net Position represents the residual interest in the university’s assets and deferred outflows of resources after the deduction of its liabilities and deferred inflows of resources. The change in net position measures whether the overall financial condition has improved or deteriorated during the year. Net position consists of four major categories; net investment in capital assets, restricted net position (nonexpendable and expendable), and unrestricted net position. Prior to the pension adjustment required by GASB 68, the university’s net position increased by $194.6 million in 2015. As a result of the amounts recorded for pension expense under GASB 68, the July 1, 2013 net position was restated by $1,280.5 million and the fiscal year 2015 activity recorded was $68.0 million. The first category, net investment in capital assets, represents the university’s capital assets of land, buildings and equipment net of accumulated depreciation and net of outstanding principal balances of debt attributable to the acquisition, construction or improvement of those assets. The increase of $106.1 million in fiscal 2015 resulted primarily from the various construction projects listed above. The next category is restricted net position, which is divided into two categories, nonexpendable and expendable. Nonexpendable restricted net position are those resources that have been set aside and invested as required by the provider of the resources. These funds are not available for expenditures, but rather must be invested in perpetuity with the earnings on those investments to be used as specified by the external donor at the time the resources are received. The nonexpendable net position includes the permanent and term endowments mentioned previously under the Endowment and Other Investments section. The restricted nonexpendable net position increased by $15.8 million in fiscal 2015. Expendable restricted net position is available for expenditure by the university but must be spent for purposes as specified by external donors. This category includes contributions received from donors and unspent income from endowed funds. There was an increase of $10.9 million in fiscal 2015. The final category is unrestricted net position. Unrestricted net position is available to the institution for any lawful purpose. Substantially all of the university’s unrestricted net position has been designated by the governing boards or management to support specific programs such as student activities, research projects, continuing education and summer programs, agricultural experiment station activities, junior year abroad programs, auxiliary enterprises and other self-supporting organized activities relating to educational departments as well as capital projects. Many of these designations result from the funds being earned through special purpose fees charged for the specific purposes. The university, therefore, has an obligation to its students to maintain these funds for the purposes that they were received. Prior to the adjustments for GASB 68, there was an increase of $61.8 million in unrestricted net assets for 2015. The unrestricted net position beginning balance was adjusted by $1,280.5 million with the implementation of GASB 68 and the pension expense was increased by $68.0 million in 2015 resulting in a deficit unrestricted net position of ($577.9) million. This deficit is due to recording the university’s full pension expense under GASB 68. The state is expected to cover this cost. Statement of Revenues, Expenses, and Changes in Net Position The Statement of Revenues, Expenses, and Changes in Net Position presents the revenues earned and the expenses incurred during the fiscal year. Activities are classified as either operating, non-operating, or other. Revenues received and expenses incurred as a result of the university providing goods and services to its customers are considered operating. Non-operating revenues are those received for which goods and services are not directly provided. The financial reporting model classifies state appropriations and gifts as non-operating revenues. The operating deficit demonstrates the university’s dependency on state support and gifts. In addition, appropriations, grants and gifts received by the university, specifically for capital expenditures as well as gifts received from donors as endowments, are reported as other revenues.
- 11-
A summary of the university’s revenues, expenses, and changes in net position for the year ended June 30, 2015 and 2014 is as follows (dollars in thousands).
2015
GASB 68 Adjustment
2015 net of GASB 68
Adjustment 2014 Operating revenues
Student tuition and fees (net of scholarship allowances) $863,051) $ —) $863,051) $820,229)
Grants and contracts 584,867) )—) 584,867) 579,695) Auxiliary enterprises (net of scholarship
allowances) 306,260) —) 306,260) 291,460) Net patient service revenues 518,019) —) 518,019) 487,578) Other operating revenues 130,439) —) 130,439) 126,880)
Total operating revenues 2,402,636) —) 2,402,636) 2,305,842) Operating expenses 3,411,728) (67,973) 3,343,755) 3,324,016)
Operating loss
(1,009,092)
67,973)
(941,119) (1,018,174)
Nonoperating revenues (expenses) State appropriations (including fringe benefits paid directly by the state) 781,884) —) 781,884) 777,393)
Contributions 52,416) —) 52,416) 40,625) Endowment and investment income 23,287) —) 23,287) 15,678) Net increase in fair value of investments 24,212) —) 24,212) 102,931) Governmental Student Aid 188,707) —) 188,707) 174,104) Interest on capital asset related debt (80,214) —) (80,214) (83,053) Net other nonoperating revenues 11,715) —) 11,715) 17,760)
Net nonoperating revenues 1,002,007) —) 1,002,007) 1,045,438) Income before other revenues (7,085) 67,973) 60,888) 27,264) Other revenues 133,715) —) 133,715) 40,977) Increase in net position 126,630) 67,973) 194,603) 68,241)
Net position at beginning of year, as restated 1,787,856) 1,280,498) 3,068,354) 3,000,113)
Net position at end of year $1,914,486) $1,348,471) $3,262,957) $3,068,354)
Operating revenues represent 68.9% of total revenues. Significant components of operating revenues include the following: Student tuition and fees, net of scholarship allowances are the largest component of operating revenues. Tuition and fees are reflected net of scholarship allowances, which represent scholarships and fellowships applied to student accounts for tuition and residence fees. These scholarships and fellowships are funded through federal and state grant programs and gifts raised by the university. The university provided $248.6 million of a total $302.6 million of student aid directly to student accounts. The remaining $54.2 million was paid to students and is reflected as scholarships and fellowships expense. Scholarship allowances allocated to tuition and fees amounted to $205.3 million. Another $43.3 million was allocated to residence fees, which are included in auxiliary revenues. Tuition rates were increased in fiscal 2015 by an average of 3.0%, while student fees increased an average of 2.8% in New Brunswick and 3.8% in Camden. Enrollment reached a peak of 66,013 for fiscal 2015. In 2015, the university also changed its procedures for recognizing tuition revenue from its summer session programs. The university now recognizes the revenue earned from summer programs run prior to June 30 in the current year and defers revenue for courses held after June 30. In the past, all summer session revenue was deferred to the following year. This change has resulted in an increase in revenue of approximately $20.0 million this year. Grants and Contracts includes revenues for sponsored programs from federal, state and nongovernmental grants and contracts that normally provide for the recovery of direct and indirect costs, or expenses. While the university experienced significant challenges in novating awards after the merger and additional delays in awards as a result of sequestration in 2014, all awards from the former UMDNJ have been novated. Renewals and new awards are also now
- 12 -
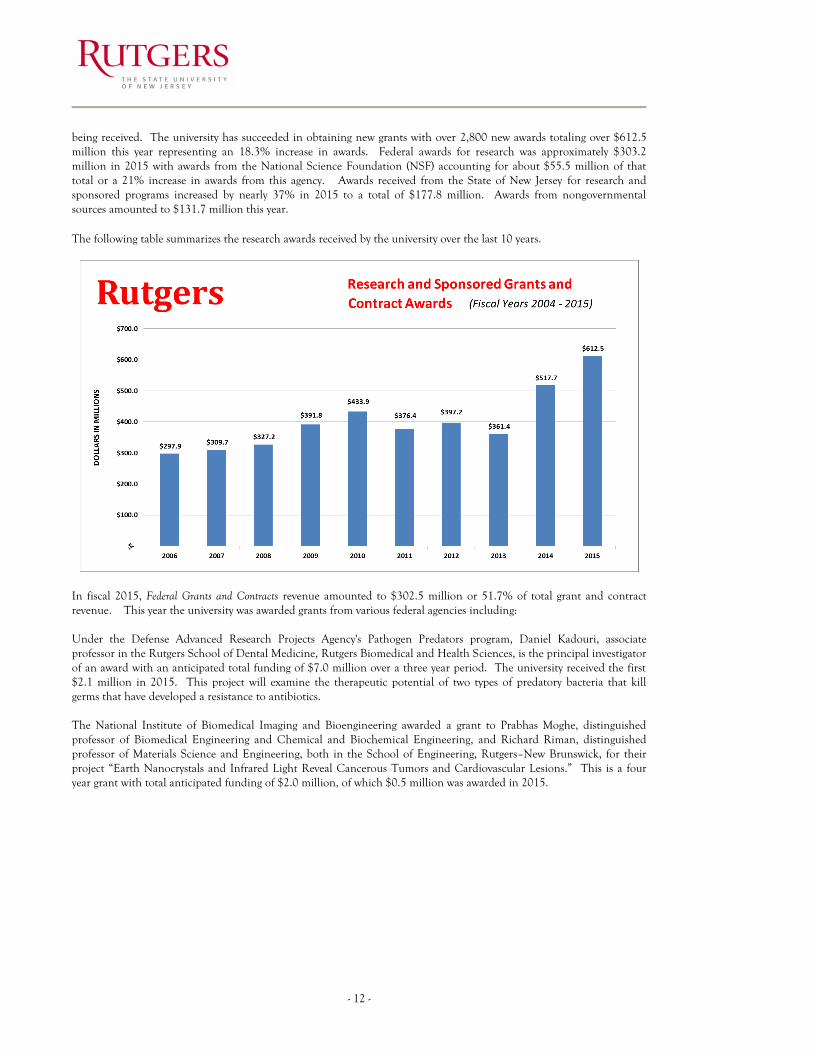
being received. The university has succeeded in obtaining new grants with over 2,800 new awards totaling over $612.5 million this year representing an 18.3% increase in awards. Federal awards for research was approximately $303.2 million in 2015 with awards from the National Science Foundation (NSF) accounting for about $55.5 million of that total or a 21% increase in awards from this agency. Awards received from the State of New Jersey for research and sponsored programs increased by nearly 37% in 2015 to a total of $177.8 million. Awards from nongovernmental sources amounted to $131.7 million this year. The following table summarizes the research awards received by the university over the last 10 years.
In fiscal 2015, Federal Grants and Contracts revenue amounted to $302.5 million or 51.7% of total grant and contract revenue. This year the university was awarded grants from various federal agencies including: Under the Defense Advanced Research Projects Agency's Pathogen Predators program, Daniel Kadouri, associate professor in the Rutgers School of Dental Medicine, Rutgers Biomedical and Health Sciences, is the principal investigator of an award with an anticipated total funding of $7.0 million over a three year period. The university received the first $2.1 million in 2015. This project will examine the therapeutic potential of two types of predatory bacteria that kill germs that have developed a resistance to antibiotics. The National Institute of Biomedical Imaging and Bioengineering awarded a grant to Prabhas Moghe, distinguished professor of Biomedical Engineering and Chemical and Biochemical Engineering, and Richard Riman, distinguished professor of Materials Science and Engineering, both in the School of Engineering, Rutgers–New Brunswick, for their project “Earth Nanocrystals and Infrared Light Reveal Cancerous Tumors and Cardiovascular Lesions.” This is a four year grant with total anticipated funding of $2.0 million, of which $0.5 million was awarded in 2015.
- 13-
In fiscal 2015, State and Municipal Grants and Contracts was $165.2 million or 28.2% of total grant and contract revenue. The following are some of the grants received this year from various state agencies. The State of New Jersey Department of Transportation awarded Ali Maher, professor in the Department of Civil and Environmental Engineering and director of the Center for Advanced Infrastructure and Transportation, Rutgers–New Brunswick, a $4.5 million grant from for “Utilization of Pneumatic Flow Tube Mixing Technique.” The New Jersey Department of Education awarded Cynthia Blitz, executive director of the Center for Effective School Practices and associate research professor in the Graduate School of Education, Rutgers–New Brunswick, a $7.4 million grant for her project, “New Jersey Early Learning Training Academy.” Distinguished professor of public policy and director of the Center for State Health Policy, Rutgers–New Brunswick, Joel Cantor, is the principal investigator of a $3 million award from the Centers for Medicare and Medicaid Services for work on “New Jersey State Healthcare Innovation Project.” Finally, in fiscal 2015, Nongovernmental Grants and Contracts was $117.2 million or 20.0% of total grant and contract revenue. Some of the awards received this year include the following: The Foundation for Newark’s Future awarded Roland Anglin, director of the Joseph Cornwall Center for Metropolitan Studies, Rutgers–Newark, $1.5 million for his project “New City of Learning Collaborative.” The Bill and Melinda Gates Foundation awarded Anushua Sinha, associate professor of preventive medicine and community health, Rutgers New Jersey Medical School, a $750,000 grant to support “Maternal Pertussis Immunization Cost Effectiveness Analysis.” The Hunt Alternatives Fund awarded a grant of $400,000 to Kelly Dittmar, assistant professor in the Department of Political Science, Faculty of Arts and Sciences, Rutgers–Camden, and scholar at the Center for American Women and Politics at the Eagleton Institute of Politics, Rutgers–New Brunswick, for her project “Women Representing in an Era of Party Polarization.” Auxiliary enterprise revenues include revenues from the university’s housing, dining facilities and other student related services, as well as other business type activities such as the bookstore and the golf course that provide support to the university’s primary missions of education, research and public service. Auxiliary revenues of $349.6 million were offset by scholarship allowances of $43.3 million. Housing and dining revenues totaled $210.8 million or 60.3% of total gross auxiliary revenues. Housing and dining rates were held flat in fiscal 2015. Housing and dining expenditures totaled $143.8 million or 49.8% of total auxiliary expenditures. Net patient services revenues include revenues related to patient care services, which are generated within RBHS behavioral healthcare, cancer and contract activities, under contractual arrangements with governmental payers and private insurers. This revenue increased by $30.4 million or 6.2% this year as a result of increased patient volume and higher affiliate revenues.
- 14 -
Operating expenses are reported by functional classification in the Statements of Revenue, Expenses, and Changes in Net Position and by natural classification in the notes to the financial statements (See Note 13). The following tables summarize the university’s operating expenses by functional and natural classification.
Operating Expenses by Functional Classification (dollars in thousands)
2015
GASB 68
Adjustment
2015 net of GASB 68
Adjustment 2014 Instruction $893,347 ($29,334) $864,013 $849,438 Sponsored Research 355,769 —) 355,769 358,231 Other Separately Budgeted Research 98,331 (2,550) 95,781 76,467 Other Sponsored Programs 206,779 —) 206,779 87,977 Extension and Public Service 50,395 (1,450) 48,945 146,128 Academic Support 115,343 (3,079) 112,264 123,342 Student Services 93,050 (2,333) 90,717 107,332 Operation and Maintenance of Plant 205,281 (4,674) 200,607 207,167 General Administration and Institutional 243,608 (7,314) 236,294 260,811 Scholarships and Fellowships 54,201 (215) 53,986 52,517 Depreciation 152,525 —) 152,525 147,629 Patient Care Services 653,446 (12,504) 640,942 613,492 Auxiliary Enterprises 288,869 (4,520) 284,349 292,991 Other Operating Expenses 784 —) 784 494 Total Operating Expenses $3,411,728 ($67,973) $3,343,755 $3,324,016
Operating Expenses by Natural Classification
(dollars in thousands)
2015
GASB 68 Adjustment
2015 net of GASB 68
Adjustment
2014 Salaries and Wages $1,775,349
$ —)
$1,775,349
$1,752,152
Fringe Benefits 582,430
(67,973)
514,457
543,132 Supplies and Services 838,553
—)
838,553
815,680
Scholarships and Fellowships 62,871
—)
62,871
65,423 Depreciation 152,525
—)
152,525
147,629
Total Operating Expenses $3,411,728
($67,973)
$3,343,755
$3,324,016
The natural classification of expenses demonstrates that the major expenditure of the university is salaries and wages accounting for more than 52.0% of total operating expenses with the GASB 68 adjustment and 53.1% without the adjustment. Negotiated salary increases were implemented this year resulting in an increase in salaries of 2.0%. Fringe benefits also increased significantly this year primarily resulting from the changes required under GASB 68. Prior to the implementation of GASB 68, the university’s pension expense amounted to $12.6 million. Pension expense under GASB 68 amounted to $80.6 million or an increase of $68.0 million. State appropriations, including fringe benefits paid directly by the State, represent approximately 22.4% of total revenues and is a significant source of funding for the university. The university received an appropriation from the New Jersey Department of State (DOS) totaling $409.2 million for the New Brunswick (including RBHS and the Agricultural Experiment Station), Newark and Camden campuses. In addition, the university received an appropriation from the New Jersey Department of Health in the amount of $28.0 million for the Rutgers Cancer Institute of New Jersey (CINJ). The university also received an appropriation from the New Jersey Department of Human Services (DHS) totaling $18.0 million for the Rutgers University Behavioral Health Care Centers (UBHC). Total appropriations for the year amounted to $455.2 million. Fringe benefits are also paid directly by the State and totaled $326.7 million in fiscal 2015.
- 15-
Governmental Student Aid is also a significant component of nonoperating revenues. The university’s students benefit from various federal programs, such as, Pell Grants and the Federal Supplemental Educational Opportunity Grants. In addition, the State provides aid through the Tuition Aid Grant (TAG) program and the Educational Opportunity Fund (EOF). The university received a total of $81.8 million from federal programs or a 5.4% increase over the $77.6 million received in 2014. The university also received $106.9 million from the state this year or an increase of 10.9% over the $96.4 million received in 2014. Other revenues and expenses consist of grants and gifts received by the university for capital projects, as well as additions to permanent endowments. The university received a total of $113.0 million from the State of New Jersey for capital projects in 2015. The university received $20.7 million in 2015 to add to our endowment as a result of the Foundations campaign.
Economic Factors that will affect the future The university continues to maintain a strong financial position without additional direct support from the state. While state funding to higher education was held level in the state budget, direct support to Rutgers has decreased by $15.3 million for 2016. In addition, the university increased tuition rates by only 2.4% for in-state students and 3.4% for out-of-state students in 2015. We will continue to meet our funding challenges through savings from increased efficiency and reduced administrative costs, revenue from nontraditional education programs, public-private partnerships, clinical care enterprises, increased grants and contracts, greater philanthropy and other sources. This year we have also implemented a new budgeting process, Responsibility Center Management (RCM), which should help the university make better use of its resources. The university foundation successfully completed its $1.0 billion campaign, raising $1,037.1 million, to help meet the university’s most pressing academic and financial needs. In total, more than 130,000 donors gave to the campaign, including more than 70,000 alumni. Funds raised through this campaign will be used to support academic initiatives and student services. The campaign also was able to meet its goal of doubling the university’s permanent endowment to ensure that permanent resources will be available to meet the needs of our students and faculty for the future. The university continues to attract high quality students. In fact, enrollment continues to increase with a total of 67,556 students enrolled for the fall 2015 semester. The university maintains a state, national, and global reach by attracting competitive applicants from all 50 states and over 140 countries. As a result of the various state bond programs and other financing sources, the university has numerous construction and renovation projects underway. This year will see the completion of the Honors College project which will further improve the university’s ability to attract high caliber students. Other projects, such as the Institute for Food, Nutrition and Health and the Rutgers Academic Building on College Avenue should be ready for the fall of 2016. These projects will provide additional space and resources for our growing institution.
- 16 -
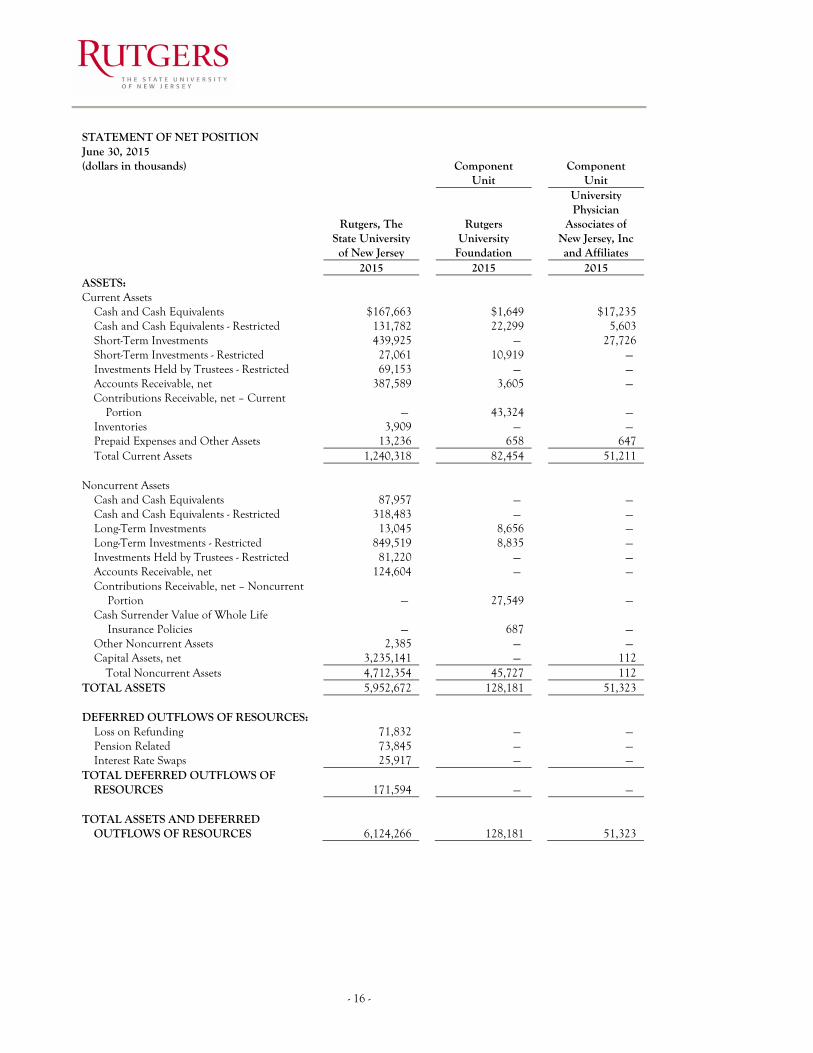
STATEMENT OF NET POSITION
June 30, 2015
(dollars in thousands)
Component Unit
Component Unit
Rutgers, The State University of New Jersey
Rutgers University
Foundation
University Physician
Associates of New Jersey, Inc and Affiliates
2015
2015
2015
ASSETS: Current Assets Cash and Cash Equivalents $167,663
$1,649
$17,235
Cash and Cash Equivalents - Restricted 131,782
22,299
5,603 Short-Term Investments 439,925
—)
27,726
Short-Term Investments - Restricted 27,061
10,919
—) Investments Held by Trustees - Restricted 69,153
—)
—)
Accounts Receivable, net 387,589
3,605
—) Contributions Receivable, net – Current
Portion —)
43,324
—) Inventories 3,909
—)
—)
Prepaid Expenses and Other Assets 13,236
658
647 Total Current Assets 1,240,318
82,454
51,211
) Noncurrent Assets Cash and Cash Equivalents 87,957
—)
—)
Cash and Cash Equivalents - Restricted 318,483
—)
—) Long-Term Investments 13,045
8,656
—)
Long-Term Investments - Restricted 849,519
8,835
—) Investments Held by Trustees - Restricted 81,220
—)
—)
Accounts Receivable, net 124,604
—)
—) Contributions Receivable, net – Noncurrent
Portion —)
27,549
—) Cash Surrender Value of Whole Life
Insurance Policies —)
687
—) Other Noncurrent Assets 2,385
—)
—)
Capital Assets, net 3,235,141
—)
112 Total Noncurrent Assets 4,712,354
45,727
112
TOTAL ASSETS 5,952,672
128,181
51,323 )
DEFERRED OUTFLOWS OF RESOURCES: Loss on Refunding 71,832
—)
—)
Pension Related 73,845
—)
—) Interest Rate Swaps 25,917
—)
—)
TOTAL DEFERRED OUTFLOWS OF RESOURCES 171,594
—)
—)
) TOTAL ASSETS AND DEFERRED
OUTFLOWS OF RESOURCES 6,124,266
128,181
51,323
- 17-
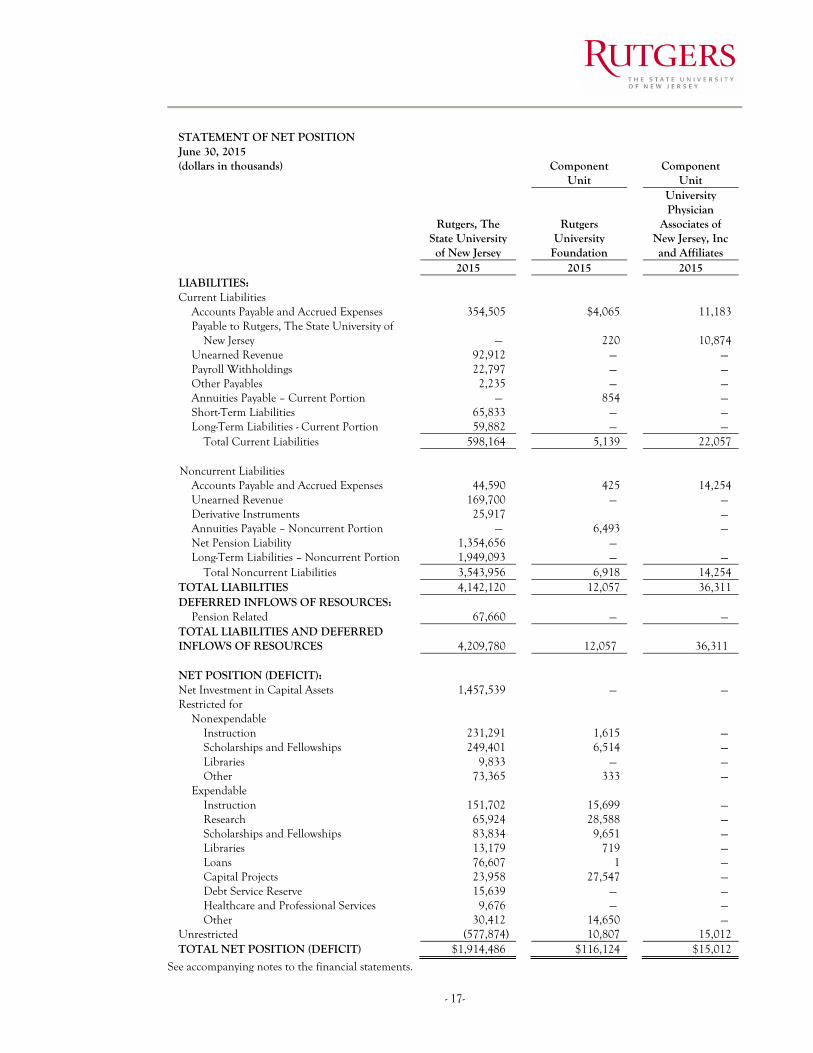
STATEMENT OF NET POSITION
June 30, 2015
(dollars in thousands)
Component Unit
Component Unit
Rutgers, The State University of New Jersey
Rutgers University
Foundation
University Physician
Associates of New Jersey, Inc and Affiliates
2015
2015
2015
LIABILITIES: Current Liabilities Accounts Payable and Accrued Expenses 354,505)
$4,065
11,183
Payable to Rutgers, The State University of New Jersey —))
220
10,874
Unearned Revenue 92,912)
—)
—) Payroll Withholdings 22,797)
—)
—)
Other Payables 2,235)
—)
—) Annuities Payable – Current Portion —))
854
—)
Short-Term Liabilities 65,833)
—)
—) Long-Term Liabilities - Current Portion 59,882)
—)
—)
Total Current Liabilities 598,164)
5,139
22,057 )
Noncurrent Liabilities Accounts Payable and Accrued Expenses 44,590)
425
14,254
Unearned Revenue 169,700)
—)
—) Derivative Instruments 25,917)
—)
Annuities Payable – Noncurrent Portion —))
6,493
—) Net Pension Liability 1,354,656) —) Long-Term Liabilities – Noncurrent Portion 1,949,093)
—)
—)
Total Noncurrent Liabilities 3,543,956)
6,918
14,254 TOTAL LIABILITIES 4,142,120)
12,057
36,311
DEFERRED INFLOWS OF RESOURCES: Pension Related 67,660) —) —)
TOTAL LIABILITIES AND DEFERRED INFLOWS OF RESOURCES 4,209,780)
12,057)
36,311)
) NET POSITION (DEFICIT): Net Investment in Capital Assets 1,457,539)
—)
—)
Restricted for Nonexpendable Instruction 231,291)
1,615
—)
Scholarships and Fellowships 249,401)
6,514
—) Libraries 9,833)
—)
—)
Other 73,365)
333
—) Expendable
Instruction 151,702)
15,699
—) Research 65,924)
28,588
—)
Scholarships and Fellowships 83,834)
9,651
—) Libraries 13,179)
719
—)
Loans 76,607)
1
—) Capital Projects 23,958)
27,547
—)
Debt Service Reserve 15,639)
—)
—) Healthcare and Professional Services 9,676)
—)
—)
Other 30,412)
14,650
—) Unrestricted (577,874)
10,807
15,012
TOTAL NET POSITION (DEFICIT) $1,914,486)
$116,124
$15,012
See accompanying notes to the financial statements.
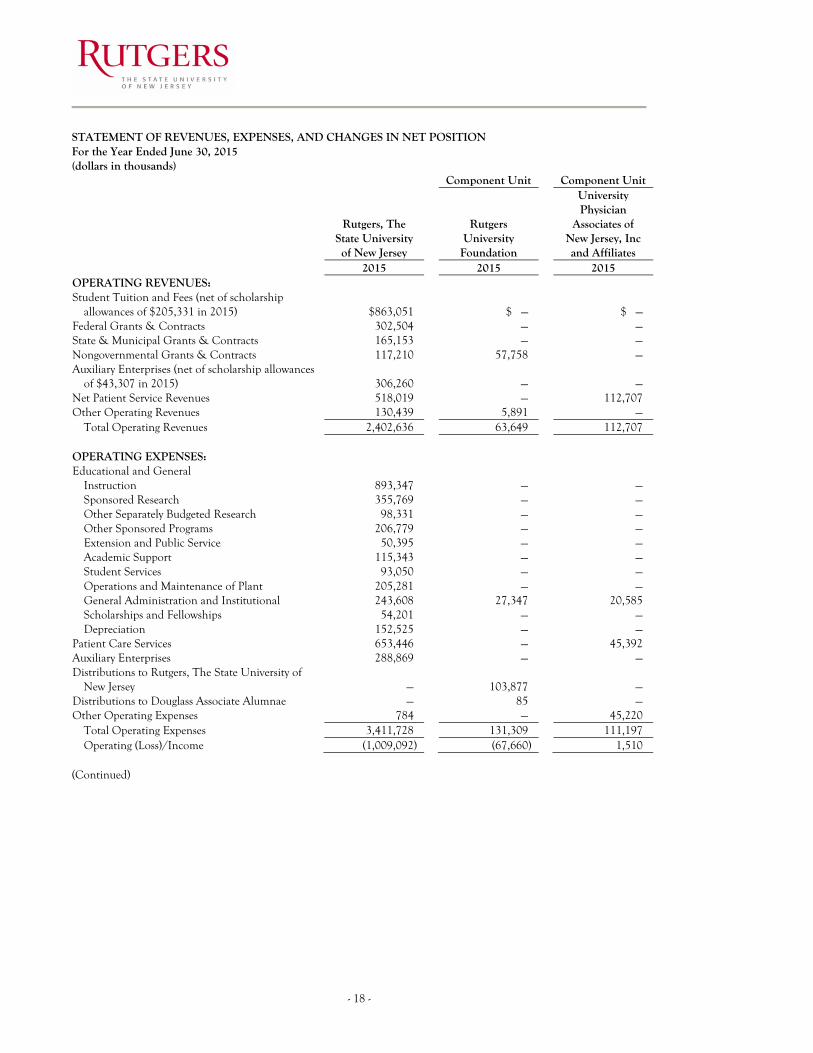
- 18 -
STATEMENT OF REVENUES, EXPENSES, AND CHANGES IN NET POSITION For the Year Ended June 30, 2015 (dollars in thousands)
Component Unit
Component Unit
Rutgers, The State University of New Jersey
Rutgers University
Foundation
University Physician
Associates of New Jersey, Inc and Affiliates
2015
2015
2015
OPERATING REVENUES: Student Tuition and Fees (net of scholarship
allowances of $205,331 in 2015) $863,051)
$ —)
$ —) Federal Grants & Contracts 302,504)
—)
—)
State & Municipal Grants & Contracts 165,153)
—)
—) Nongovernmental Grants & Contracts 117,210)
57,758)
—)
Auxiliary Enterprises (net of scholarship allowances of $43,307 in 2015) 306,260)
—)
—)
Net Patient Service Revenues 518,019)
—)
112,707) Other Operating Revenues 130,439)
5,891)
—)
Total Operating Revenues 2,402,636)
63,649)
112,707) )
OPERATING EXPENSES: Educational and General Instruction 893,347)
—)
—)
Sponsored Research 355,769)
—)
—) Other Separately Budgeted Research 98,331)
—)
—)
Other Sponsored Programs 206,779)
—)
—) Extension and Public Service 50,395)
—)
—)
Academic Support 115,343)
—)
—) Student Services 93,050)
—)
—)
Operations and Maintenance of Plant 205,281)
—)
—) General Administration and Institutional 243,608)
27,347)
20,585)
Scholarships and Fellowships 54,201)
—)
—) Depreciation 152,525)
—)
—)
Patient Care Services 653,446)
—)
45,392) Auxiliary Enterprises 288,869)
—)
—)
Distributions to Rutgers, The State University of New Jersey —)
103,877)
—)
Distributions to Douglass Associate Alumnae —)
85)
—) Other Operating Expenses 784)
—)
45,220)
Total Operating Expenses 3,411,728)
131,309)
111,197) Operating (Loss)/Income (1,009,092)
(67,660)
1,510)
(Continued)
- 19-
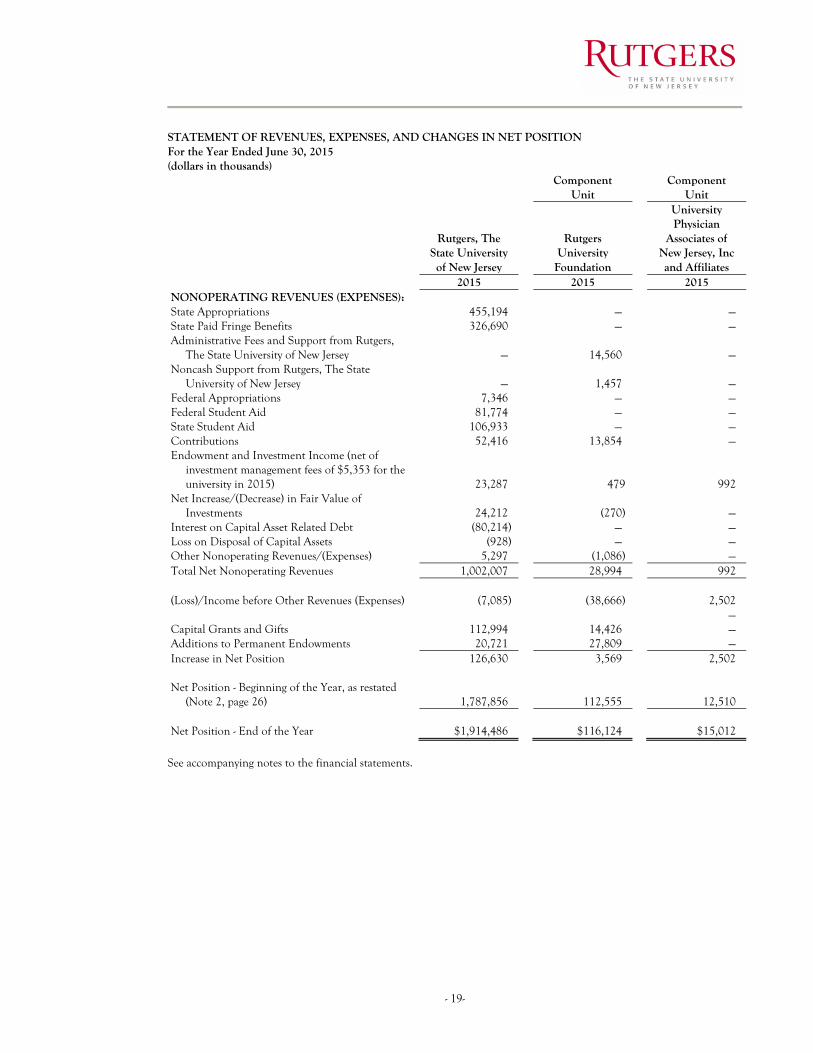
STATEMENT OF REVENUES, EXPENSES, AND CHANGES IN NET POSITION For the Year Ended June 30, 2015 (dollars in thousands)
Component Unit
Component Unit
Rutgers, The State University of New Jersey
Rutgers University
Foundation
University Physician
Associates of New Jersey, Inc and Affiliates
2015
2015
2015
NONOPERATING REVENUES (EXPENSES): State Appropriations 455,194)
—)
—)
State Paid Fringe Benefits 326,690)
—)
—) Administrative Fees and Support from Rutgers,
The State University of New Jersey —)
14,560)
—) Noncash Support from Rutgers, The State
University of New Jersey —)
1,457)
—) Federal Appropriations 7,346)
—)
—)
Federal Student Aid 81,774)
—)
—) State Student Aid 106,933)
—)
—)
Contributions 52,416)
13,854)
—) Endowment and Investment Income (net of
investment management fees of $5,353 for the university in 2015) 23,287)
479
992)
Net Increase/(Decrease) in Fair Value of Investments 24,212)
(270)
—)
Interest on Capital Asset Related Debt (80,214)
—)
—) Loss on Disposal of Capital Assets (928)
—)
—)
Other Nonoperating Revenues/(Expenses) 5,297)
(1,086)
—) Total Net Nonoperating Revenues 1,002,007)
28,994)
992)
) (Loss)/Income before Other Revenues (Expenses) (7,085)
(38,666)
2,502)
)
—) Capital Grants and Gifts 112,994)
14,426)
—)
Additions to Permanent Endowments 20,721)
27,809)
—) Increase in Net Position 126,630)
3,569)
2,502)
) Net Position - Beginning of the Year, as restated
(Note 2, page 26) 1,787,856)
112,555)
12,510) Net Position - End of the Year $1,914,486)
$116,124)
$15,012)
See accompanying notes to the financial statements.
- 20 -
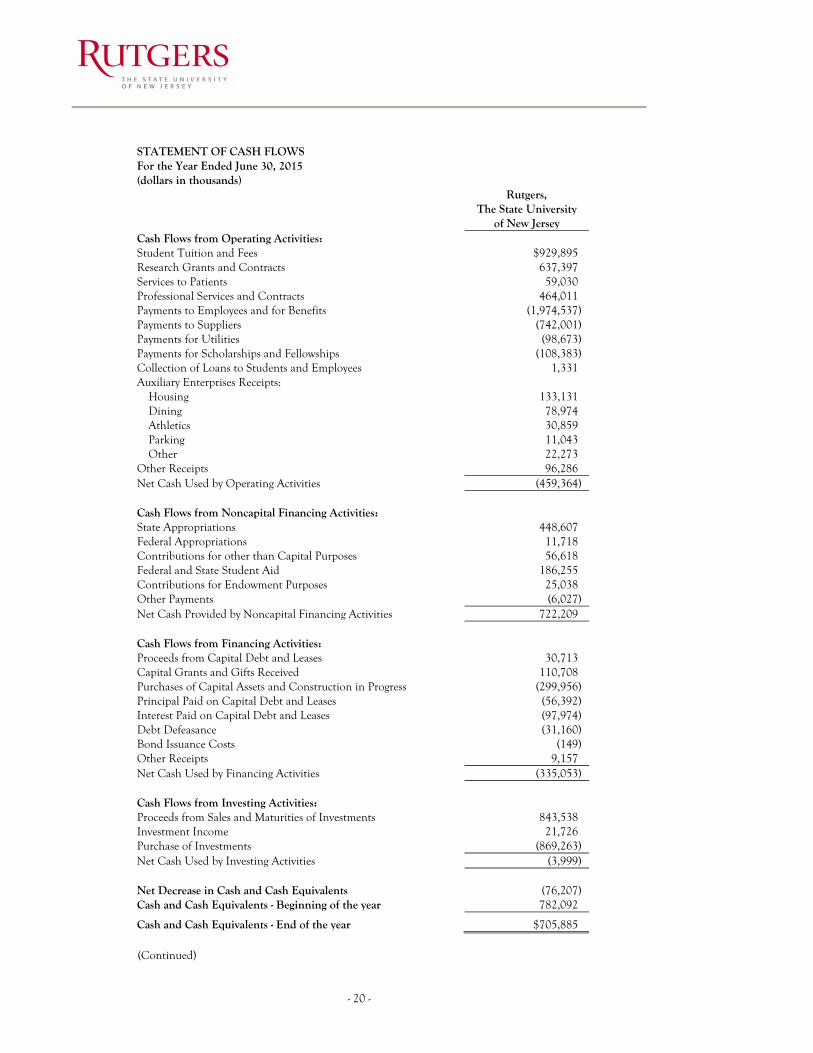
STATEMENT OF CASH FLOWS For the Year Ended June 30, 2015 (dollars in thousands)
Rutgers, The State University
of New Jersey Cash Flows from Operating Activities: Student Tuition and Fees $929,895) Research Grants and Contracts 637,397) Services to Patients 59,030) Professional Services and Contracts 464,011) Payments to Employees and for Benefits (1,974,537) Payments to Suppliers (742,001) Payments for Utilities (98,673) Payments for Scholarships and Fellowships (108,383) Collection of Loans to Students and Employees 1,331) Auxiliary Enterprises Receipts:
Housing 133,131) Dining 78,974) Athletics 30,859) Parking 11,043) Other 22,273)
Other Receipts 96,286) Net Cash Used by Operating Activities (459,364)
Cash Flows from Noncapital Financing Activities: State Appropriations 448,607) Federal Appropriations 11,718) Contributions for other than Capital Purposes 56,618) Federal and State Student Aid 186,255) Contributions for Endowment Purposes 25,038) Other Payments (6,027) Net Cash Provided by Noncapital Financing Activities 722,209)
Cash Flows from Financing Activities: Proceeds from Capital Debt and Leases 30,713) Capital Grants and Gifts Received 110,708) Purchases of Capital Assets and Construction in Progress (299,956) Principal Paid on Capital Debt and Leases (56,392) Interest Paid on Capital Debt and Leases (97,974) Debt Defeasance (31,160) Bond Issuance Costs (149) Other Receipts 9,157) Net Cash Used by Financing Activities (335,053)
Cash Flows from Investing Activities: Proceeds from Sales and Maturities of Investments 843,538) Investment Income 21,726) Purchase of Investments (869,263) Net Cash Used by Investing Activities (3,999)
Net Decrease in Cash and Cash Equivalents (76,207) Cash and Cash Equivalents - Beginning of the year 782,092)
Cash and Cash Equivalents - End of the year $705,885)
(Continued)
- 21-
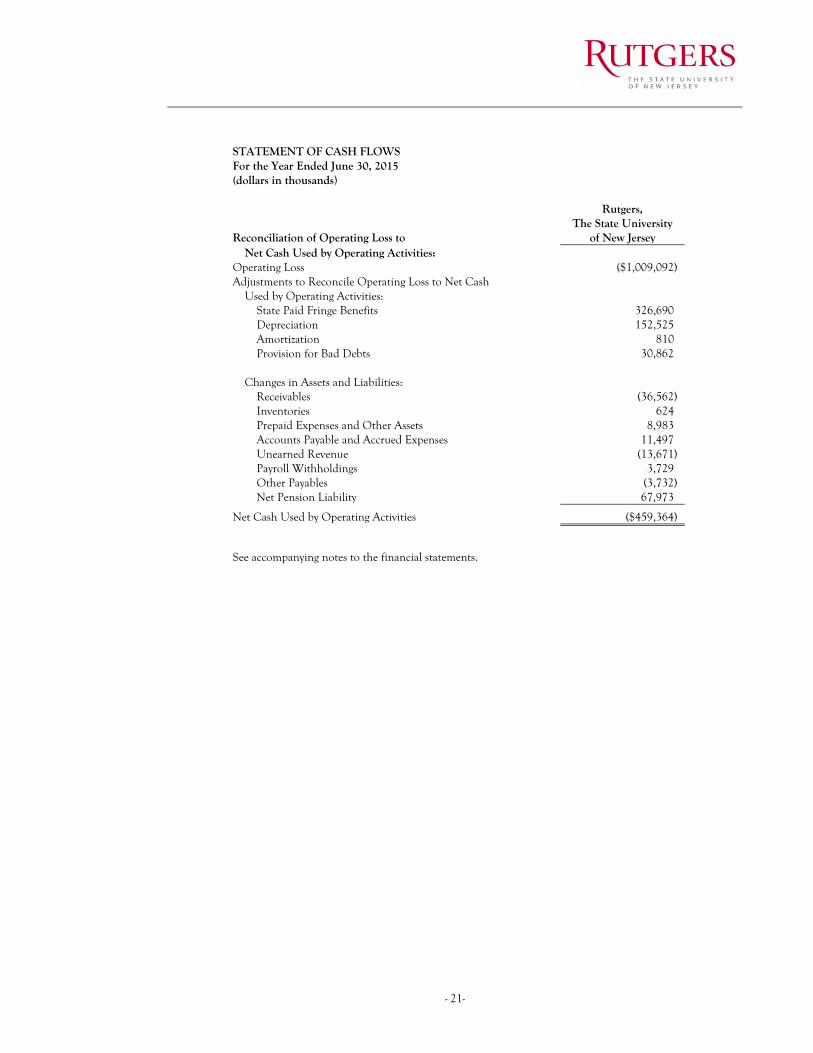
STATEMENT OF CASH FLOWS For the Year Ended June 30, 2015 (dollars in thousands)
Reconciliation of Operating Loss to
Rutgers, The State University
of New Jersey Net Cash Used by Operating Activities:
Operating Loss ($1,009,092) Adjustments to Reconcile Operating Loss to Net Cash
Used by Operating Activities: State Paid Fringe Benefits 326,690) Depreciation 152,525) Amortization 810) Provision for Bad Debts 30,862)
Changes in Assets and Liabilities:
Receivables (36,562) Inventories 624) Prepaid Expenses and Other Assets 8,983) Accounts Payable and Accrued Expenses 11,497) Unearned Revenue (13,671) Payroll Withholdings 3,729) Other Payables (3,732) Net Pension Liability 67,973)
Net Cash Used by Operating Activities ($459,364)
See accompanying notes to the financial statements.
- 22 -
NOTE 1 - SUMMARY OF SIGNIFICANT ACCOUNTING AND REPORTING POLICIES Organization Rutgers, The State University of New Jersey (the university), one of the nation’s nine colonial colleges, consists of 34 schools and colleges located at campuses in New Brunswick and adjacent areas, Newark and Camden, and maintains educational services in many other communities throughout the State of New Jersey (the State). The university is the State University of New Jersey and the Land Grant College of the State of New Jersey. The university was created as a body corporate and politic with the title “The Trustees of Queens College in New Jersey” by royal charter granted by King George III, on November 10, 1766. In 1945, an act of the State Legislature designated Rutgers as the State University of New Jersey to be utilized as an instrumentality of the State for providing public higher education and thereby increasing the efficiency of its public school system. The university’s title was changed to “Rutgers, The State University” and its charter was amended and supplemented by an act of the Legislature of the State in 1956 (the Rutgers Law). Effective July 1, 2013, the New Jersey Medical and Health Sciences Education Restructuring Act (the Act), (Chapter 45, P.L. 2012), went into effect. The Act integrated the Cancer Institute of New Jersey and all units of the University of Medicine and Dentistry of New Jersey (UMDNJ), except University Hospital (UH) in Newark and the School of Osteopathic Medicine (SOM) in Stratford, into Rutgers. The UMDNJ schools and units transferred to Rutgers joining the existing Rutgers School of Nursing, Rutgers Ernest Mario School of Pharmacy and the Rutgers Institute of Health, Health Care Policy and Aging Research to form the Rutgers Biomedical and Health Sciences (RBHS) division. Basis of Accounting The basic financial statements of the university have been prepared on the accrual basis of accounting, using the economic resources measurement focus, and in accordance with generally accepted accounting principles as prescribed by the Governmental Accounting Standards Board (GASB). The university reports as a special purpose government engaged only in business type activities as defined in GASB Statement No. 34 Basic Financial Statements – and Management’s Discussion and Analysis – for State and Local Governments as amended by GASB Statement No. 35 Basic Financial Statements – and Management’s Discussion and Analysis – Public Colleges and Universities. Business type activities are those that are financed in whole or in part by fees charged to external parties for goods or services. GASB Statement No. 34 requires that the financial statements be presented on a comprehensive entity-wide basis, reporting the university as an economic unit. Reporting Entity The university’s financial statements and notes thereto include the financial statements of the Rutgers University Foundation (the Foundation), the units of the New Market Tax Credit (NMTC) Transaction (One Washington Park), which include One Washington Park Capital, LLC, Parkside RUN Investments, LLC, One Washington Park Holdings, LLC, and Washington Park Fund, LLC, and the University Physician Association of New Jersey, Inc. and Affiliate (UPA). The Foundation is a legally separate, not-for-profit organization, which exists solely for the benefit of the university and was formed to aid the university to obtain private funds and other resources to meet the needs and achieve the goals of the university for which adequate funds may not be available from other sources. To fulfill this mission, the Foundation solicits and receives gifts and pledges from private sources including individuals, corporations, and foundations. All of the financial data for the Foundation is from their audited financial statements, reported in accordance with generally accepted accounting principles promulgated by GASB. The Foundation is discretely presented in the university’s financial report as it would be misleading to exclude them and they exist for the direct benefit of the university, its students, and faculty. Copies of the Foundation’s financial statements can be obtained by writing to the Foundation at Rutgers University Foundation, Winants Hall, 7 College Avenue, New Brunswick, NJ 08901. The governing body of the One Washington Park entities is primarily the same as that of the university, and they provide financing services to the university classifying them as blended component units. Copies of the financial statements for One Washington Park may be obtained by writing to the Executive Director of Business and Financial Services, 249 University Avenue, Room 306, Newark, NJ 07102-1896. UPA, a not-for-profit organization, was incorporated on August 16, 1984. Located in Newark, New Jersey, its primary purpose was to support the UMDNJ through administrative assistance to clinical faculty of the New Jersey Medical School (NJMS). An agreement between UPA and UMDNJ (the Affiliation Agreement) established activities to be
- 23-
performed by UPA in support of UMDNJ. During 1992, UPA established the Doctors’ Center Management Corporation (DCMC) to manage the Doctors Office Center. DCMC is considered an affiliate of UPA and is included in the UPA financial statements. Pursuant to the Act, UMDNJ ceased to exist and NJMS was incorporated within the university. Also effective July 1, 2013, the Affiliation Agreement between UPA and UMDNJ was amended to state that, as of that date, the parties to the Affiliation Agreement are Rutgers and UPA, the effect of which is that Rutgers succeeds to UMDNJ’s obligations under the agreement (which expires on October 31, 2018). The UPA became a component unit of the university due to the integration under the Act and meets the criteria to be reported as a component unit of the university since there is a financial benefit and the university has deemed the UPA misleading to exclude as a result of the nature and significance of their relationship. UPA’s combined financial statements were prepared on a modified basis of cash receipts and disbursements, which is a comprehensive basis of accounting other than accounting principles generally accepted in the United States of America. Separate financial statements for the UPA can be obtained by writing to the Executive Director/ Chief Executive Officer, University Physician Associates of New Jersey, Inc., 30 Bergen Street, ASMC 12, Room 1205, Newark, New Jersey 07107. Under GASB Statement No. 61, The Financial Reporting Omnibus, an amendment of GASB Statement No. 14, The Financial Reporting Entity, and GASB Statement No. 34, the university is considered a component unit of the State of New Jersey for financial reporting purposes. Accordingly, the university’s financial statements are included in the State of New Jersey’s Comprehensive Annual Financial Report. Cash and Cash Equivalents Current cash and cash equivalents, which are both unrestricted and restricted in nature, consist of cash on hand, and all highly liquid investments with an original maturity of three months or less except for those managed as a component of the university’s investment portfolio. Noncurrent unrestricted cash and cash equivalents consist of funds that are not externally restricted and are to be used to purchase plant related items not related to capital construction. Noncurrent restricted cash and cash equivalents are externally restricted to maintain sinking or reserve funds, purchase or construct capital or other noncurrent assets, or are related to endowed funds. Investments Investments are recorded at fair value in the statement of net position. Investments with a maturity greater than one year and investments externally restricted for endowment purposes, to maintain sinking or reserve funds, and to purchase or construct capital or other noncurrent assets, including investments held by trustees, are classified as noncurrent assets in the statement of net position. The fair value of marketable investments is based on the last sale price on the last business day of the fiscal year as quoted by an industry standard pricing service. Securities for which no sale was reported as of the close of the last business day of the fiscal year are valued by this pricing service based on market evaluations using standard trade publications and other quote devices. Investments in non-marketable securities are reported in the financial statements based upon net asset values or the equivalent provided by external investment managers which are reviewed and evaluated by the university’s management for reasonableness. The year-to-year change in the fair value of investments is reported in the statement of revenues, expenses, and changes in net position as net increase in fair value of investments. Funds Held in Trust Funds held in trust by others or not in the possession of, nor under the control of, the university are not included in the university’s accompanying financial statements because they do not meet eligibility requirements for recognition. The market value of such funds aggregated approximately $63.7 million at June 30, 2015. Income derived from such irrevocable trust funds held by others, aggregating approximately $2.2 million in 2015, is reported in the accompanying financial statements as nonoperating revenue. Prior to July 1, 2013, the New Jersey Health Foundation (NJHF) operated to support medical, dental and other healthcare education and research of UMDNJ and for other scientific, charitable, literary and educational purposes. As a result of the integration of UMDNJ, except for UH and SOM, into the university, the fundraising function for the resulting RBHS division was assumed by the Foundation on July 1, 2013. The NJHF is not considered a component unit within the university. However, the NJHF holds permanently restricted net assets for RBHS that consist of endowment
- 24 -
contributions from donors with income to be used for specific or general purposes, as well as temporarily restricted net assets for RBHS subject to donor imposed stipulations that will be met by actions of NJHF or by the passage of time. Inventories Inventories are stated at lower of cost or market. Cost is determined principally on a first-in, first-out basis. Capital Assets Capital assets consist of land, buildings, land improvements and infrastructure, equipment, construction in progress and art collections. Capital assets are recorded at cost at the date of acquisition, or fair market value on the date of gift if donated, and are shown net of accumulated depreciation. Depreciation on buildings, land improvements and infrastructure, and equipment is calculated using the straight-line method over the assets’ estimated useful lives, ranging from 5 to 50 years. Library books totaling approximately 6.0 million volumes have not been capitalized. The capitalization threshold is $5,000 and above. Works of art or historical treasures that are held for public exhibition, education, or research in furtherance of public service are capitalized at the fair market value of the item at the time of acquisition. Unearned Revenue Unearned revenue includes summer session activity for July and August which will be recognized as revenue and expense in the following fiscal year. In addition, capital State grants, including the Capital Improvement Fund (CIF), Equipment Leasing Fund (ELF), the Higher Education Technology Infrastructure (HETI), and the Higher Education Facilities Trust (HEFT), for which all eligibility requirements for revenue recognition have not been met, are included as noncurrent unearned revenue. Net Position (Deficit) Net position is the difference between the university’s assets and deferred outflows of resources, and its liabilities and deferred inflows of resources. These resources are classified for accounting and reporting purposes into four categories as follows: Net investment in capital assets represents the university’s investment in capital assets, net of outstanding debt obligations related to those capital assets. Restricted net position – nonexpendable consists of endowment and similar type funds for which donors or other outside sources have stipulated, as a condition of the gift instrument, that the principal is to be maintained inviolate and in perpetuity, and invested for the purpose of producing income, which may either be expended or added to principal. Restricted net position – expendable includes all resources for which the university is legally or contractually obligated to spend the resources in accordance with restrictions imposed by external third parties as well as Perkins loans and U.S. government grants refundable. Unrestricted net position (deficit) represents resources available to the university for educational and general operations and spendable endowment income. These resources are derived from student tuition and fees, state appropriations, net patient service revenue, and sales and services of educational departments and auxiliary enterprises. Auxiliary enterprises and several academic programs, such as summer session and continuing education, are substantially self-supporting activities that provide services for students, faculty and staff. Under the university’s decentralized management structure, it is the responsibility of individual departments to determine whether to first apply restricted or unrestricted resources when an expense is incurred for purposes for which both restricted and unrestricted net position is available.
- 25-
Revenue Recognition Revenues from student tuition and fees and auxiliary enterprises are presented net of scholarship allowances applied to student accounts and are recognized in the period earned. Other payments made directly to students are presented as scholarships and are included in operating expenses in the period incurred. Grants and contracts revenue is comprised mainly of funds received from grants from federal, State of New Jersey and municipal and other nongovernmental sources and is recognized when all eligibility requirements for revenue recognition are met, which is generally the period in which the related expenses are incurred. Net patient services revenues are generated from patient care services and include the university’s behavioral healthcare, cancer and contract activities and the operations of faculty practice plans. Net patient service revenues are recorded in the period in which the services are provided and are reported at estimated net realizable amounts from patients, third party payors and others. Amounts recorded are net of allowances to give recognition to differences between charges and reimbursement rates from third faculty practice party payors. Reimbursement from third party payors varies, depending upon the type and level of care provided. Certain net revenues received are subject to audit and retroactive adjustments for which amounts are accrued on an estimated basis in the period the related services are rendered and adjusted in future periods as final settlements are determined. Revenue from State appropriations is recognized in the fiscal year during which the State of New Jersey appropriates the funds to the university. The university is fiscally dependent upon these appropriations. Contributions are recognized as revenues when all eligibility requirements are met, which is generally in the period donated. Additions to permanent endowments are recognized upon receipt. Endowment and investment income is recognized in the period earned. Classification of Revenue The university’s policy for defining operating activities in the statement of revenues, expenses, and changes in net position are those that serve the university’s principal purpose and generally result from exchange transactions such as the payment received for services and payment made for the purchase of goods and services. Examples include (1) student tuition and fees, net of scholarship allowances, (2) auxiliary enterprises, net of scholarship allowances, (3) most federal, state and municipal and other nongovernmental grants and contracts, and (4) net patient services. Nonoperating revenues include activities that have the characteristics of nonexchange transactions, such as operating appropriations from the State, student aid, endowment and investment income and contributions. Interest on capital asset related debt is reported as nonoperating expenses. Scholarships and Fellowships Scholarships, fellowships or stipends include payments made directly to students in the form of student aid. Any aid applied directly to the students’ accounts in payment of tuition and fees, housing charges and dining services is reflected as a scholarship allowance and is deducted from the university’s revenues. Certain governmental grants, such as Pell grants, and other federal, state or nongovernmental programs, are recorded as nonoperating revenues in the university’s financial statements. To the extent that revenues from such programs are used to satisfy tuition and fees and other student charges, the university has recorded a scholarship discount and allowance. The university received $74.9 million during the year ended June 30, 2015 from the Federal Pell Grant program, and $92.7 million during the year ended June 30, 2015 from Tuition Aid Grants, from the State of New Jersey, the largest state student aid program. The university distributes loans to students under the Federal Direct Student Loan Program. Under this program, the U.S. Department of Education makes interest subsidized and unsubsidized loans, through schools, directly to students. During the year ended June 30, 2015, the university disbursed $409.6 million under the Federal Direct Student Loan Program. Direct student loans receivable are not included in the university’s statement of net position since they are repayable directly to the U.S. Department of Education.
- 26 -
Income Taxes The university is exempt from income taxes on related income pursuant to federal and state tax laws as an instrumentality of the State of New Jersey. Use of Estimates The preparation of financial statements in conformity with U.S. generally accepted accounting principles requires management to make estimates and assumptions that affect the reported amounts of assets and liabilities and disclosure of contingent assets and liabilities at the date of the financial statements and the reported amounts of revenues and expenses during the reporting period. Actual results could differ from those estimates. Accounting Pronouncements Applicable to the System, Issued but Not Yet Effective In February 2015, the GASB issued Statement No. 72, Fair Value Measurement and Application (GASB 72). The statement addresses accounting and financial reporting issues related to fair value measurements of assets and liabilities. GASB 72 identifies various approaches to measuring fair value and levels of inputs based on the objectivity of the data used to measure fair value. GASB 72 will be effective for periods beginning after June 15, 2015. The university is evaluating the impact of this new statement. In June 2015, the GASB issued Statement No. 73, Accounting and Financial Reporting for Pensions and Related Assets That Are Not Within the Scope of GASB Statement 68, and Amendments to Certain Provisions of GASB Statements 67 and 68 (GASB 73). This statement establishes requirements for defined benefit pensions and defined contribution pensions that are not within the scope of GASB 68 and amends certain provisions of GASB Statement No. 67, Financial Reporting for Pension Plans, and GASB 68. GASB 73 will be effective for periods beginning after June 15, 2015. The university is evaluating the impact of this new statement. In June 2015, the GASB issued Statement No 75, Accounting and Financial Reporting for Postemployment Benefits Other Than Pensions (GASB 75). The statement addresses accounting and financial reporting for other postemployment benefits (OPEB) that are provided to the employees of state and local governmental employers. GASB 75 establishes standards for recognizing and measuring liabilities, deferred outflows of resources, deferred inflows of resources, and expenses related to OPEB in the basic financial statements, in addition to requiring more extensive note disclosures and required supplementary information. GASB 75 will be effective for periods beginning after June 15, 2017. The university is evaluating the impact of this new statement. NOTE 2 – Adoption of Accounting Pronouncements The university adopted Governmental Accounting Standards Board (GASB) Statement No. 68, Accounting and Financial Reporting for Pensions – an amendment of GASB Statement No. 27 (GASB 68) in fiscal year 2015. GASB 68 addresses accounting and financial reporting for pensions that are provided to the employees of state and local governmental employers. This statement establishes standards for measuring and recognizing liabilities, deferred outflows of resources, deferred inflows of resources, and expense related to pensions. Note disclosure and required supplementary information requirements about pensions also are addressed. For defined benefit pensions, this statement also identifies the methods and assumptions that should be used to project benefit payments, discount projected benefit payments to their actuarial present value, and attribute that present value to periods of employee service. In accordance with the provisions of GASB 68, the university has reported its proportionate share of PERS and PFRS net pension liability, deferred outflows of resources, deferred inflows of resources, and pension expense.
- 27-
The university also adopted GASB Statement No. 71, Pension Transition for Contributions Made Subsequent to the Measurement Date – an amendment of GASB Statement No. 68 (GASB 71). GASB 71 amends paragraph 137 of GASB 68 to require that, at transition, a government recognize a beginning deferred outflow of resources for its pension contributions, if any, made subsequent to the measurement date of the beginning net pension liability. The provisions of GASB 68 and 71 have been applied to the beginning of the 2015 fiscal year net position. As a result of the implementation of GASB 68 and 71, beginning unrestricted net position as of July 1, 2014, was decreased by $1,280.5 million. The following is a reconciliation of the total net position as previously reported at June 30, 2014 to the total restated net position (in thousands) as of July 1, 2014:
Amount Total net position as previously reported as of June 30, 2014 $3,068,354) Restatement to beginning of year net position as of July 1, 2014 (1,280,498)
Total net position as of July 1, 2014 (restated) $1,787,856) NOTE 3 – CASH AND CASH EQUIVALENTS AND INVESTMENTS Cash and Cash Equivalents The university’s net cash and cash equivalents balance at June 30, 2015 includes a cash book balance of $172.0 million. The actual amount of cash on deposit in the university’s bank accounts at June 30, 2015 was $174.2 million. Of this amount, $2.3 million was insured by the Federal Deposit Insurance Corporation at June 30, 2015. At June 30, 2015, $171.9 million was collateralized in accordance with Chapter 64 of Title 18A of New Jersey Statutes, and no cash was uninsured and uncollateralized at June 30, 2015. The university’s cash and cash equivalents are carried in the financial statements at fair value and consist of the following at June 30, 2015 (dollars in thousands):
2015
Money Market Funds $329,515 Repurchase Agreements 31,948 Cash and Deposits 344,422
Total Cash and Cash Equivalents $705,885
- 28 -
Investments The Board of Governors and the Board of Trustees, through the Joint Committee on Investments, exercise authority over the investment of the university’s Long-Term Investment Pool. Professional investment managers manage the investment of funds in accordance with the Investment Policy as established by the Joint Committee on Investments, approved by the Board of Governors with the consent of the Board of Trustees. Additionally, a professional investment consultant monitors and reports on the Long-Term Investment Pool and the individual investment managers. Under the terms of the university’s bond indentures, bond proceeds and debt service funds may be invested and reinvested only in obligations which will by their terms mature on or before the date funds are needed for expenditure or withdrawal. The primary financial objective of the investment management of the university’s Long-Term Investment Pool is to preserve and enhance the Long-Term Investment Pool’s real purchasing power while providing a relatively constant stream of earnings for current use. The long-term investment objective for the Long-Term Investment Pool is to attain an average annual total return of at least 4.5%, net of inflation, fees, and costs. In 2015, the university’s annual spending policy is to spend an amount not to exceed 4.2750% of a trailing 13-quarter average of the Long-Term Investment Pool’s market values. Current earned income will be used for ongoing spending requirements. The university’s investments are exposed to various risks such as interest rate, market, and credit risks. Due to the level of risk associated with certain investments, it is at least reasonably possible that changes in the values of investments will occur in the near term and that such changes could materially affect the amounts reported in the statement of net position. The university’s investments are carried in the financial statements at fair value and consist of the following at June 30, 2015 (dollars in thousands):
2015
Commercial Paper $114,696 U.S. Government Treasury Securities 27,406 U.S. Government Agency Securities 144,283 Commodities 11,792 U.S. Corporate Equities 400,082 Foreign Corporate Equities 18,793 Mutual Funds 675,175 Real Estate 44,840 Corporate Bonds 2,858 Bonds – Other Holdings 35,452 Other Investments 4,546
Total Investments $1,479,923
- 29-
Interest Rate Risk Interest rate risk is the risk that changes in interest rates will adversely affect the fair value of an investment. The operating funds of the university are managed against the expected cash requirements of these funds. The university projects its cash requirements and arranges investment maturities accordingly. Special attention is given to the interest rate environment in times of economic growth or downturns. The table below reflects the operation of this process. Endowment funds have a much longer outlook and are invested by professional managers against an index as provided in the university’s investment guidelines. For the university, the following table summarizes the maturities of cash and cash equivalents and investments at June 30, 2015 (dollars in thousands): 2015
Investment Maturities (in years)
Fair
Less
More
Investment Type Value
Than 1
1-5
6-10
Than 10
Commercial Paper $114,696 $114,696 $ —) $ —) $ —) U.S. Government Treasury
Securities
27,406 24,950 —) 1,055 1,401 U.S. Government Agency
Securities
144,283 110,319 33,931 33 —) Corporate Bonds 2,858 145 546 1,544 623 Bonds – Other Holdings 35,452 35,452 —) —) —) Money Market Funds 329,515 329,515 —) —) —) Repurchase Agreements 31,948 31,948 —) —) —)
Total 686,158 $647,025 $34,477 $2,632 $2,024
U.S. Corporate Equities 400,082 Foreign Corporate Equities 18,793 Mutual Funds 675,175 Commodities 11,792 Real Estate 44,840 Other Investments 4,546
Total $1,841,386 Credit Risk Credit risk is the risk that an issuer or other counterparty to an investment will not fulfill its obligations. The university’s Investment Policy states that individual bonds shall be rated with an investment grade by at least two of the three rating agencies (Moody’s, Fitch, and Standard & Poor’s (S&P)). The average credit quality of the Core Fixed Income Fund shall be maintained at AA (by S&P or equivalent rating by Moody’s or Fitch) or higher. The prospect of credit risk or risk of permanent loss shall be avoided in the Core Fixed Income Fund. Issues of state or municipal agencies shall not be purchased except in unusual circumstances. A fixed income manager may invest in foreign securities up to a limit of 20% of the portfolio. At June 30, 2015, the university’s cash and cash equivalent and investment quality ratings as rated by Standard & Poor’s were as follows (dollars in thousands):
- 30 -
Investment Type Quality Rating
2015 Commercial Paper A-1+ $78,512 Commercial Paper A-1 36,184 U.S. Government Treasury and Agency Securities AA+
171,689
Corporate Bonds AAA
546 Corporate Bonds AA
64
Corporate Bonds AA– 623 Corporate Bonds A+ 551 Corporate Bonds A– 993 Corporate Bonds BBB 81 Bonds – Other Holdings N/R 35,452 Money Market Funds AAA
329,515
Repurchase Agreements N/R
31,948
Total
$686,158 Custodial Credit Risk Custodial credit risk for investments is the risk that, in the event of a failure of the counterparty, the university will not be able to recover the value of the investments that are in the possession of an outside party. Custodial credit risk should not be confused with market risk, which is the risk that the market value of a security may decline. The university’s investment securities are exposed to custodial credit risk if the securities are uninsured and unregistered and held by the counterparty, or by its trust department or agent but not in the university’s name. Money market funds are not subject to custodial credit risk because their existence is not evidenced by securities that exist in physical or book entry form. At June 30, 2015, the university had $913.7 million of investments that were uninsured and unregistered and not held by the outside party in the university’s name.
Investment Type 2015 U.S. Corporate Equities $306,738 Foreign Corporate Equities 1,920 Mutual Funds 512,927 Bonds – Other Holdings 35,452 Commodities 11,792 Real Estate 44,840
Total $913,669 Investments - Endowment Funds The majority of endowment funds assets are in the Long-Term Investment Pool. Each individual fund subscribes to or disposes of units in the pools on the basis of the per-unit market value at the beginning of the three-month period within which the transaction takes place. At June 30, 2015, the fair value of the Long-Term Investment Pool was $879.4. In addition, the aggregate endowment market value of funds separately invested was $36.8 million at June 30, 2015. The investment appreciation was $161.3 million at June 30, 2015. These amounts are included in restricted nonexpendable, restricted expendable and unrestricted net position. The university employs a spending policy which provides for annual spending at a stated rate determined by the Joint Investment Committee of the Board of Governors and the Board of Trustees. Income earned above the stated rate is reinvested and added to the endowment principal, while any shortfall is covered by capital appreciation. The university complies with the “Uniform Prudent Management of Institutional Funds Act” (UPMIFA) P.L. 2009, Chapter 64, adopted by New Jersey. This law speaks to the management and use of funds held by charitable institutions. Alternative Investments As part of its investment strategy, the university has committed to invest a total of $299.3 million to 62 non-marketable alternative asset partnerships, hedge funds and real estate funds at June 30, 2015. As of June 30, 2015, the university has $202.6 million of paid-in capital to these alternative assets and $101.9 million in unfunded commitments.
- 31-
NOTE 4 – ACCOUNTS RECEIVABLE AND ALLOWANCE FOR DOUBTFUL ACCOUNTS Accounts receivable are shown net of the allowance for doubtful accounts and are comprised of the following at June 30, 2015 (dollars in thousands):
Accounts Receivable
Allowance
Net 2015
Government Grants and Other Sponsored Programs Receivable $130,879 $1,714 $129,165
Plant Receivable 88,069 —) 88,069 Student Notes Receivable 75,596 6,089 69,507 Patient Accounts Receivable 59,912 12,574 47,338 Federal and State Governments Receivable 40,297 —) 40,297 Student Accounts Receivable 29,412 8,211 21,201 Affiliate Receivable 84,250 6,063 78,187 Other Receivable 39,826 1,397 38,429
Total $548,241 $36,048 $512,193
The allowances for doubtful accounts and notes are based upon management’s best estimate of uncollectible accounts and notes at June 30, 2015, considering type, age, collection history and other appropriate factors. NOTE 5 – NET PATIENT SERVICE REVENUES Net patient service revenues include revenues related to patient care services, which are generated within RBHS behavioral, cancer, and contract activities and the operations of faculty practice plans. In 2015, net revenues generated from faculty practice plans totaled $233.7 million, while revenues from a contract with the State of New Jersey Department of Corrections totaled $145.9 million, and revenues from other professional contracts and agreements totaled $80.0 million. University Behavioral Health Care (UBHC) provides care to patients who meet certain criteria defined by the New Jersey Department of Health and Senior Services and the Department of Human Services without charge or at amounts less than their established rates. UBHC and other units maintain records to identify and monitor the level of charity care they provide, which includes the amount of gross charges foregone for services and supplies furnished. Patient care revenues from these units totaled $58.4 million in 2015. Net patient service revenues are comprised of the following at June 30, 2015 (dollars in thousands):
2015 Gross Charges $820,281) Deductions from Gross Charges
Contractual and Other Allowances (271,400) Provision for Bad Debts (30,862)
Net Patient Service Revenues $518,019)
- 32 -
NOTE 6 – CAPITAL ASSETS The detail of capital assets activity for the year ended June 30, 2015 is as follows (dollars in thousands):
July 1, 2014
Additions
Retirements/ Capitalization
June 30, 2015
Capital Assets Not Being Depreciated: Land $74,088 $3,135 $ —) $77,223
Capitalized Art Collections 59,795 565 —) 60,360 Construction in Progress 222,478 260,806 112,432 370,852
Total 356,361 264,506 112,432 508,435 Capital Assets Being Depreciated:
Land Improvements 321,423 10,213 —) 331,636 Buildings 3,935,639 122,954 139 4,058,454 Equipment 876,268 54,209 12,504 917,973
Total 5,133,330 187,376 12,643 5,308,063 Less Accumulated Depreciation:
Land Improvements 242,516 13,030 —) 255,546 Buildings 1,499,076 94,737 105 1,593,708 Equipment 696,924 44,758 9,579 732,103
Total 2,438,516 152,525 9,684 2,581,357 Net Capital Assets Being Depreciated 2,694,814 34,851 2,959 2,726,706 Total Capital Assets, net $3,051,175 $299,357 $115,391 $3,235,141
During 2015, the university capitalized interest expense of $13.9 million in construction in progress in the accompanying statement of net position. NOTE 7 – ACCOUNTS PAYABLE AND ACCRUED EXPENSES Accounts payable and accrued expenses consist of the following at June 30, 2015 (dollars in thousands):
2015
Vendors $130,560 Accrued Salaries and Benefits 101,203 Compensated Absences 89,169 Workers Compensation 35,653 Interest Payable 10,155 Retainage 8,989 Other Accrued Expenses 23,366
Total Accounts Payable and Accrued Expenses $399,095
- 33-
NOTE 8 – NONCURRENT LIABILITIES Noncurrent liability activity for the year ended June 30, 2015 is as follows (dollars in thousands):
July 1, 2014 Additions Reductions June 30, 2015 Current Portion
Accounts Payable and Accrued Expenses $393,872 $35,669 $30,446 $399,095 $354,505
Net Pension Liabilities 1,292,754 79,778 17,876 1,354,656 —) Unearned Revenue 276,348 657 14,393 262,612 92,912 Long-Term Liabilities 2,138,182 —) 129,207 2,008,975 59,882 Total Noncurrent
Liabilities $4,101,156 $116,104 $191,992 $4,025,338 $507,299
At July 1, 2014, net pension liabilities were restated due to GASB 68. NOTE 9 – COMMERCIAL PAPER On February 28, 2007, the university instituted the commercial paper program to provide interim or short-term financing for the acquisition and construction of and improvements, repairs, replacements, additions and betterments to the facilities, and the acquisition of equipment, and other property in connection therewith, of the university, and the refinancing of certain outstanding obligations of the university. The commercial paper was to be issued either as Tax-Exempt Commercial Paper or as Taxable Commercial Paper. The commercial paper constitute direct general obligations of the university for the payment of which, as to both principal and interest, the full faith and credit of the university are pledged. Principal of the commercial paper, to the extent not paid from proceeds of general obligation bonds and proceeds of other commercial paper, and interest on the commercial paper is payable from other available university funds. The university has entered into a Standby Commercial Paper Purchase Agreement with Wells Fargo Bank, National Association (the Liquidity Provider) under which the Liquidity Provider is obligated to purchase newly issued commercial paper to pay the principal of other commercial paper, subject to suspension or termination upon the occurrence of certain events. The Standby Commercial Paper Purchase Agreement will terminate at the close of business on April 10, 2018, unless terminated prior to such date in accordance with its terms. Morgan Stanley & Co. Incorporated will be the exclusive dealer in connection with the offering and issuance of the Series A Tax-Exempt Commercial Paper, the Series C Taxable Commercial Paper and the Series D Extendable Commercial Paper. Merrill Lynch, Fenner & Smith Incorporated will be the dealer in connection with the offering and issuance of the Series B Tax-Exempt Commercial Paper. During fiscal year 2015, the university issued $30.7 million of General Obligation Commercial Paper Series A to refund in whole General Obligation Bonds 2003 Series D and Certificates of Participation Series 2004. The difference between the reacquisition price and the net carrying amount of the old debt of $0.4 million is being deferred and amortized as a reduction to interest expense through the year 2038 using the effective interest method. In 2015, $4 thousand has been amortized leaving $0.4 million as part of deferred outflows of resources. In addition, using proceeds from the issuance of General Obligation Bonds, 2013 Series L, the university redeemed $11.3 million of General Obligation Commercial Paper Series C. Furthermore, using university funds, the university redeemed $2.1 million of General Obligation Commercial Paper Series C. Commercial Paper activity as of June 30, 2015 is as follows (dollars in thousands):
July 1, 2014
Additions
Retirements
June 30, 2015
Series A $ —) $30,713 $ —) $30,713 Series C 48,475 —) 13,355 35,120
$48,475 $30,713 $13,355 $65,833
- 34 -
NOTE 10 - LONG-TERM LIABILITIES Long-term liability activity for the year ended June 30, 2015 is as follows (dollars in thousands):
July 1, 2014
Additions
Retirements
June 30, 2015
Current Portion
General Obligation Bonds Payable $1,625,787 $ —) $50,175 $1,575,612 $45,475
Lease Obligations 471,176 —) 39,468 431,708 13,915 Notes Payable 2,276 —) 621 1,655 492 Loans Payable 38,943 —) 38,943 —) —) Total Long-Term
Liabilities $2,138,182 $ —) $129,207 $2,008,975 $59,882
OTHER OBLIGATIONS OF THE UNIVERSITY Notes Payable Notes payable at June 30, 2015 consist of an unsecured note payable to the U.S. Department of Education with interest at 5.5%, final installment due January 1, 2021. In December 2004, the university entered into an enhanced Affiliation agreement with Robert Wood Johnson University Hospital (RWJUH), which provides for working capital requirements for Robert Wood Johnson Medical School (RWJMS) through a promissory note. The promissory note is a credit line of $10.0 million and can be drawn down for a period of five years. During 2006, the agreement was amended cancelling any further draws against the line of credit. Equal monthly repayments commence thirty days after the date of draw for ten years at an interest rate of prime. As of June 30, 2015, $4.0 million was drawn on the promissory note and principal payments were made in the amount of $3.7 million. Rutgers Community Park In 1999, the university and the City of Camden entered into an agreement for the acquisition, development and construction of an outdoor recreational complex designated the Rutgers Community Park which was made available to university students and the public. On June 26, 2002, the university agreed to assume the obligation for debt service payable on an aggregate of $1.0 million in loans that the City of Camden received from the Green Acres Program of the State of New Jersey in connection with the Rutgers Community Park, pursuant to an Amended and Restated Interlocal Services Agreement between the City of Camden and the university. The assumption of the debt service payable on the Green Acres Program of the State of New Jersey loan is a general obligation of the university secured by the full faith and credit of the university. At June 30, 2015, the outstanding amount due on the loans was $0.3 million.
- 35-
Guaranty of LEAP School Bond Financing The Delaware River Port Authority (the Authority) issued $8.5 million of Charter School Project Bonds, Series 2003 (LEAP Academy University Charter School, Inc.) on October 2, 2003 pursuant to the Compact, the New Jersey Act, the Pennsylvania Act and an Indenture of Trust dated as of September 1, 2003, by and between the Authority and Commerce Bank, National Association, as trustee (the Guaranty), for the purpose of financing the costs of the design, development, construction and equipping of the LEAP Academy University Charter School (the LEAP School) in Camden, New Jersey. The LEAP School will be owned and managed by the LEAP Academy University Charter School, Inc., a New Jersey not-for-profit corporation, and will serve approximately 216 students in grades 9-12. The LEAP School site is adjacent to the Camden Campus. The university’s obligations under the Guaranty are a general obligation of the university secured by the full faith and credit of the university. Loans Payable On May 30, 2007, One Washington Park Holdings, LLC (a university controlled Qualified Active Low-Income Community Business – QALICB) entered into two loan and security agreements with subsidiaries of New Jersey Community Capital Community Development Entity NJCC CDE I LLC and NJCC CDE II LLC in the amounts of $36.3 million and $2.6 million, respectively, to finance a portion of the acquisition and renovation of the property located at One Washington Park in Newark, NJ (See Note 17). The loans bear interest at a rate of 2.33% per annum and 1.45% per annum, respectively, and are payable every December 1. The principal amounts were due to NJCC CDE I LLC and NJCC CDE II LLC on December 1, 2014. On December 1, 2014, as part of the liquidation of the entire New Markets Tax Credit structure, through a series of Distribution Agreements and Assignment Agreements, One Washington Park Holdings, LLC acquired the membership interests and assets of NJCC CDE I LLC and NJCC CDE II LLC, including the loans. As both lender and borrower, the loans were forgiven and these loans are no longer outstanding as of June 30, 2015. Gateway Transit Village Property On December 15, 2010, the university entered into a lease agreement with Somerset Street Urban Renewal Associates, LLC for the Gateway Transit Village Property, which comprises the Rutgers University Bookstore, Rutgers University Press, and the common areas (the Rutgers Component). The university began rent payments on October 1, 2012, in the amount of $0.4 million and will continue to make quarterly payments due and payable on the first business day of each quarter during the term of the lease. For lease years 1 – 7, annual lease payments amounts will be $1.4 million, and for lease years 8 – 30, annual lease payment amounts will be $1.7 million. On December 23, 2010, the university entered into a loan arrangement for $16.1 million with Somerset Street Associates 2, LLC (SSA2) for the purpose of completing the Gateway Transit Village Property. The university began receiving interest only payments on October 1, 2012, in the amount of $0.4 million and will continue to receive such payments in quarterly installments on the first business day of each calendar quarter through January 1, 2018. Beginning April 1, 2018, SSA2 shall make quarterly payments of principal and interest in an amount sufficient to fully repay the sum of the principal amount then outstanding. Rutgers has the option to purchase all of the right, title and interest of the property in exchange of forgiving the loan to SSA2.
- 36 -
Bonds Payable – General Obligation A summary of bonds issued and outstanding at June 30, 2015 is as follows (dollars in thousands):
Date of Series
Original Amount
Outstanding June 30,
2015
General Obligation Refunding Bonds: 2002 Series A, variable-rate, due
serially to May 1, 2018 Feb. 1, 2002
$110,000
$33,000 2010 Series I, 3.46% effective, due
serially to May 1, 2025 and term bonds due May 1, 2029 Nov. 1, 2010
40,830
30,875 2013 Series J, 3.78% effective, due
serially to May 1, 2033 and term bonds due May 1, 2036 July 1, 2013
340,925
328,840 2013 Series K, 4.06% effective, due
serially to May 1, 2023 and term bonds due May 1, 2033 July 1, 2013
134,100
122,370 Total General Obligation Refunding
Bonds
625,855
515,085
General Obligation Bonds: 2003 Series D, 3.74% effective, due
serially to May 1, 2019 Dec. 1, 2003
24,805
—) 2009 Series F, 4.56% effective, due
serially to May 1, 2031 and term bonds due May 1, 2039 Feb.10, 2009
233,105
194,735 2009 Series G, variable-rate, due
serially to May 1, 2039 Apr. 29, 2009
80,000
70,490 2010 Series H, 3.70% effective, due
serially May 1, 2019 through May 1, 2022 and term bonds due May 1, 2029 and 2040 Nov. 1, 2010
390,990
390,990 2013 Series L, 4.44% effective, due
serially to May 1, 2033 and term bonds due May 1, 2038 and 2043 July 1, 2013
352,065
339,195
Total General Obligation Bonds 1,080,965 995,410
Total Bonds $1,706,820 $1,510,495
The General Obligation Bonds (GOB) Payable includes premium on bonds of $65.1 million at June 30, 2015 related to Series 2009 F, Series 2010 I, Series 2013 J, and Series 2013 L. General Obligation and General Obligation Refunding Bonds The General Obligation Refunding Bonds, 2002 Series A, were issued under an Indenture of Trust, dated February 1, 2002. These bonds were issued to finance a portion of the cost of the renovation, construction and equipping of certain academic, research support and other facilities, as well as infrastructure development and land acquisitions of the university. Under the terms of the indentures, all bonds issued are direct and general obligations of the university and are in no way an obligation of the State of New Jersey. On August 25, 2011, the university, along with First Union National Bank (predecessor to U.S. Bank, National Association), the Trustee, and TD Bank, N.A. (the Substitute Liquidity Facility), entered into a Standby Bond Purchase Agreement for General Obligation Refunding Bonds, 2002 Series A pursuant to Section 5.9(b) of the First Supplemental Indenture of Trust, dated as of February 1, 2002, which supplements the Indenture of Trust, dated as of February 1, 2002. This agreement carries an annual facility fee of 0.4% and expires in 2018. As of June 30, 2015, no funds have been drawn against this agreement.
- 37-
The General Obligation Bonds, 2003 Series D, were issued in the amount of $24.8 million and dated December 1, 2003. The 2003 Series D Bonds are secured under the provisions of the Indenture of Trust, dated as of February 1, 2002, as supplemented between the university and First Union National Bank (now known as Wells Fargo Bank, National Association), as Trustee and a Fourth Supplemental Indenture of Trust, dated as of December 1, 2003, between the university and the Trustee. In September 2006, Wachovia Bank (now known as Wells Fargo Bank) sold all trustee rights to U.S. Bank. The proceeds of the 2003 Series D Bonds were being used to finance (i) the costs of construction of certain deferred capital maintenance projects on the New Brunswick Campus, the Camden Campus and the Newark Campus, each project with a minimum economic life of ten years, and (ii) certain administrative, legal, financing and incidental expenses relating to the issuance of these Bonds. During fiscal year 2015, the university issued $5.5 million of General Obligation Commercial Paper Series A to refund in whole the General Obligation Bonds 2003 Series D Bonds. The General Obligation Bonds, 2009 Series F, were issued in the amount of $233.1 million on February 10, 2009. The bonds were issued under the terms of an Indenture of Trust, dated as of February 1, 2002 (the Master Indenture) as supplemented by and between the university and U.S. Bank National Association (successor to Wachovia Bank, National Association and First Union National Bank), as trustee (the Trustee), and a Sixth supplemental Indenture of Trust, dated as of February 1, 2009, by and between the university and the Trustee (the sixth supplemental Indenture, and together with the Master Indenture, the Indenture). The 2009 Series F Bonds were issued for (i) the refinancing of Commercial Paper which financed the construction of various capital projects, (ii) the financing of additional capital projects of the university, (iii) the refunding of certain outstanding bonds of the university, and (iv) the payment of certain administrative, legal, financing, and incidental expenses relating to the issuance of the bonds. The General Obligation Bonds, 2009 Series G, were issued in the amount of $80.0 million on April 29, 2009. The bonds are secured under the provisions of an Indenture of Trust, dated as of February 1, 2002, (the Master Indenture) as supplemented by and between the university and U.S. Bank National Association (successor to Wachovia Bank, National Association and First Union National Bank), as trustee (the Trustee), and a Seventh Supplemental Indenture of Trust, dated as of May 1, 2009, by and between the university and the Trustee (the Seventh Supplemental Indenture, together with the Master Indenture, the Indenture). The 2009 Series G Bonds are authorized under the provisions of Rutgers, The State University Law, constituting Chapter 65 of Title 18A of the New Jersey Statues Annotated (the Act), and the Indenture. The 2009 Series G Bonds were issued for (i) the refinancing of the Commercial Paper which financed the construction of various capital projects, (ii) the financing of additional capital projects of the university, and (iii) the payment of certain administrative, legal, financing, and incidental expenses relating to the issuance of these bonds. On May 6, 2009, the university, along with U.S. Bank National Association, entered into a Standby Bond Purchase Agreement for General Obligation Bonds 2009 Series G at an annual facility fee of 1.0%. This agreement was extended on April 30, 2015, expiring in 2018. The agreement carries an annual facility fee of 0.4% at the university’s current bond rating. As of June 30, 2015, no funds have been drawn against this agreement. The General Obligation Bonds, 2010 Series H, and the General Obligation Refunding Bonds, 2010 Series I (collectively the 2010 Series Bonds) were issued in the amount of $391.0 million and $40.8 million, respectively, on November 1, 2010. The bonds are secured under the provisions of an Indenture of Trust, dated as of February 1, 2002, (the Master Indenture) as supplemented by and between the university and U.S. Bank National Association, (successor to Wachovia Bank, National Association and First Union National Bank), as trustee (the Trustee), as supplemented and amended, including by the Eighth Supplemental Indenture of Trust, dated as of November 1, 2010, by and between the university and the Trustee (the Eighth Supplemental Indenture, together with the Master Indenture, the Indenture). The 2010 Series Bonds are authorized under the provisions of Rutgers, The State University Law, constituting Chapter 65 of Title 18A of the New Jersey Statutes Annotated, and the Indenture. The 2010 Series Bonds were issued to (i) finance and/or refinance a portion of the construction of various capital projects of the university (the 2010 Capital Projects), (ii) provide for the refinancing of (a) certain outstanding commercial paper of the university, and (b) the current and/or advance refunding of all or a portion of certain outstanding bonds of the university, and (iii) finance costs of issuance with respect to the 2010 Capital Projects. The General Obligation Refunding Bonds, 2013 Series J, the General Obligation Refunding Bonds 2013 Series K and 2013 Series L (collectively the 2013 Series Bonds), were issued in the amount of $340.9 million, $134.1 million, and $352.1 million, respectively, on July 1, 2013. The bonds are secured under the provisions of an Indenture of Trust, dated February 1, 2002 (the Master Indenture), as supplemented, by and between the university and U.S. Bank National Association (successor to Wachovia Bank, National Association and First Union National Bank) as trustee (the Trustee), and a Ninth Supplemental Indenture, dated as of July 1, 2013, by and between the university and the Trustee (the Ninth Supplemental Indenture, and together with the Master Indenture, the Indenture). The 2013 Series Bonds, among other things, were issued in furtherance of the New Jersey Medical and Health Sciences Education Restructuring Act, which was signed into law on August 22, 2012. Pursuant to the Restructuring Act, all rights to certain schools, institutes and
- 38 -
centers of UMDNJ, was transferred to the university effective July 1, 2013, and all debt issued by UMDNJ allocable to such schools, institutes and centers, were transferred to the university. A portion of the proceeds of the 2013 Series J Bonds and 2013 Series K Bonds were to be used to refund certain outstanding indebtedness of UMDNJ in connection with the transfer of such UMDNJ facilities and indebtedness to the university. The terms of the Restructuring Act, applicable to the university, were consented to and approved by the Board of Governors and the Board of Trustees of the university by resolutions adopted on November 19, 2012. The 2013 Series Bonds were issued to (i) refund certain outstanding indebtedness of the university and UMDNJ, (ii) finance and/or refinance, as the case may be, the payment of certain costs of construction of certain capital projects of the university (the 2013 Capital Projects), and (iii) finance costs of issuance with respect to the 2013 Capital Projects. The bonds which were refunded in whole included UMDNJ certificates of Participation 1997 Series A ($12.2 million), UMDNJ Certificates of Participation 1997 Series B ($3.1 million), NJEDA Lease Revenue Bonds Series 2000 ($38.3 million), UMDNJ Bonds 2002 Series A ($94.5 million), UMDNJ Certificates of Participation Series 2003 ($49.2 million), UMDNJ Certificates of Participation Series 2004 ($75.3 million), NJEFA Revenue Refunding Bonds Series 2009B ($214.9 million), General Obligation Bonds 2002 Series B ($24.1 million), General Obligation Refunding Bonds 2003 Series C ($26.4 million), and General Obligation Bonds 2004 Series E ($79.3 million). As part of the refunding, the university reduced its total debt service over the next 23 years by $106.7 million and obtained an economic gain (difference between the present values of the old and new debt service payments less escrow funds used) of $38.0 million. The difference between the acquisition price and the net carrying amount of the old debt of $76.6 million is being deferred and amortized as interest expense through the year 2036 using the effective interest method. In 2015, $3.8 million has been expensed leaving $69.0 million as part of deferred outflows of resources. Funds are on deposit with escrow agents to provide for the payment of principal, interest, and call premiums, when due, on NJEFA Revenue Refunding Bonds Series 2009B. Accordingly, these bonds are legally outstanding obligations of the university as of June 30, 2015, however are defeased for financial reporting; therefore, they are not reflected in the accompanying financial statements. The principal amounts of these bonds were $198.5 million as of June 30, 2015. All bonds bear interest at fixed-rates with the exception of 2002 Series A and 2009 Series G, which bear interest at a variable-rate. For 2002 Series A, the rates varied from a low of 0.01% to a high of 0.11% during fiscal year 2015. For 2009 Series G, the rates varied from a low of 0.01% to a high of 0.15% during fiscal year 2015. With the intention of fixing its effective interest rate related to 2002 Series A and Series 2009 G, the university entered into swap agreements with JP Morgan Chase, Merrill Lynch, and Bank of New York. (See NOTE 11 for additional information about derivatives.) The university is exposed to basis risk due to the difference between the floating rate on the bonds and the SIFMA/LIBOR rate. The following is the synthetic rate, related to the 2002 Series A bond, at the end of fiscal year 2015:
Terms
2015
Interest rate swap
Fixed payment to counterparty Fixed
3.96%
Variable payment from counterparty SIFMA
–0.08%
Net interest rate swap payments
3.88% Variable rate bond coupon payments
0.01%
Synthetic interest rate
3.89% The following is the synthetic rate, related to the 2009 Series G Bonds, at the end of fiscal year 2015:
Terms
Merrill Lynch
Terms
Bank of New York
Interest rate swap
Fixed payment to counterparty Fixed
4.08% Fixed 3.82%
Variable payment from counterparty 3 MO LIBOR
–0.28% SIFMA –0.08% Net interest rate swap payments
3.80%
3.74%
Variable rate bond coupon payments
0.02%
0.02%
Synthetic interest rate
3.82%
3.76%
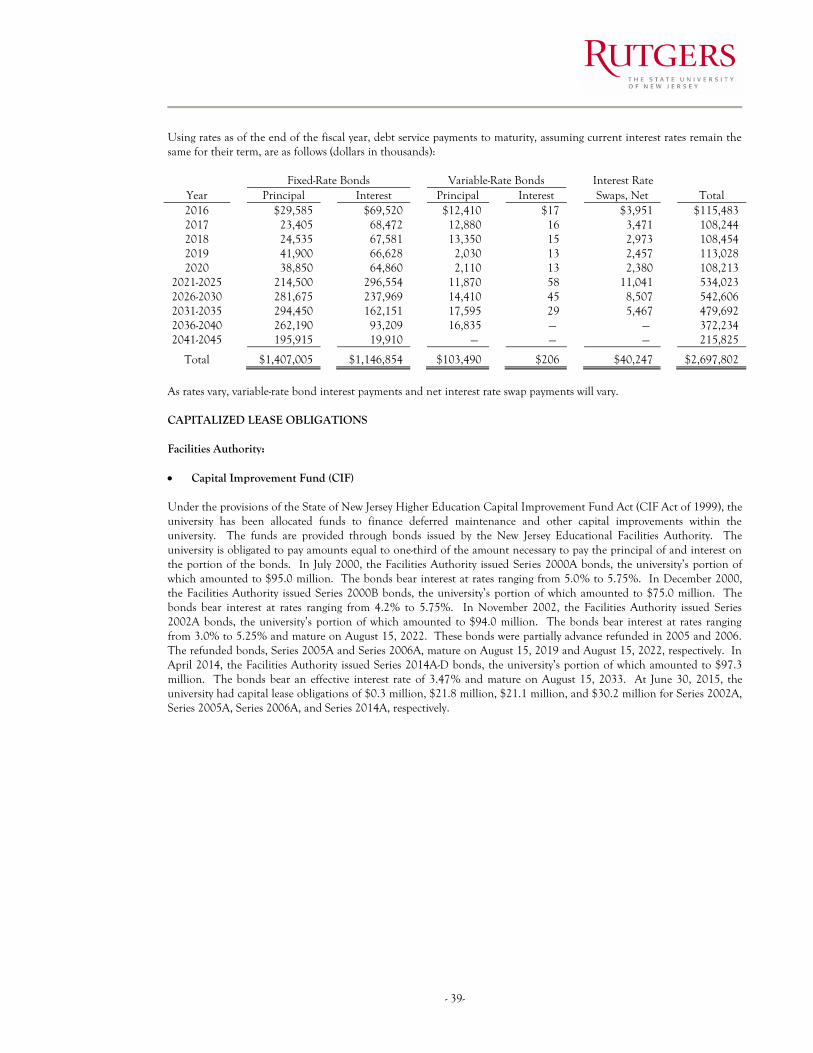
- 39-
Using rates as of the end of the fiscal year, debt service payments to maturity, assuming current interest rates remain the same for their term, are as follows (dollars in thousands):
Fixed-Rate Bonds
Variable-Rate Bonds
Interest Rate
Year
Principal
Interest
Principal
Interest
Swaps, Net
Total 2016
$29,585 $69,520 $12,410 $17 $3,951 $115,483
2017
23,405 68,472 12,880 16 3,471 108,244 2018
24,535 67,581 13,350 15 2,973 108,454
2019 41,900 66,628 2,030 13 2,457 113,028 2020 38,850 64,860 2,110 13 2,380 108,213
2021-2025
214,500 296,554 11,870 58 11,041 534,023 2026-2030
281,675 237,969 14,410 45 8,507 542,606
2031-2035
294,450 162,151 17,595 29 5,467 479,692 2036-2040
262,190 93,209 16,835 —) —) 372,234
2041-2045
195,915 19,910 —) —) —) 215,825
Total
$1,407,005 $1,146,854 $103,490 $206 $40,247 $2,697,802
As rates vary, variable-rate bond interest payments and net interest rate swap payments will vary. CAPITALIZED LEASE OBLIGATIONS Facilities Authority: Capital Improvement Fund (CIF) Under the provisions of the State of New Jersey Higher Education Capital Improvement Fund Act (CIF Act of 1999), the university has been allocated funds to finance deferred maintenance and other capital improvements within the university. The funds are provided through bonds issued by the New Jersey Educational Facilities Authority. The university is obligated to pay amounts equal to one-third of the amount necessary to pay the principal of and interest on the portion of the bonds. In July 2000, the Facilities Authority issued Series 2000A bonds, the university’s portion of which amounted to $95.0 million. The bonds bear interest at rates ranging from 5.0% to 5.75%. In December 2000, the Facilities Authority issued Series 2000B bonds, the university’s portion of which amounted to $75.0 million. The bonds bear interest at rates ranging from 4.2% to 5.75%. In November 2002, the Facilities Authority issued Series 2002A bonds, the university’s portion of which amounted to $94.0 million. The bonds bear interest at rates ranging from 3.0% to 5.25% and mature on August 15, 2022. These bonds were partially advance refunded in 2005 and 2006. The refunded bonds, Series 2005A and Series 2006A, mature on August 15, 2019 and August 15, 2022, respectively. In April 2014, the Facilities Authority issued Series 2014A-D bonds, the university’s portion of which amounted to $97.3 million. The bonds bear an effective interest rate of 3.47% and mature on August 15, 2033. At June 30, 2015, the university had capital lease obligations of $0.3 million, $21.8 million, $21.1 million, and $30.2 million for Series 2002A, Series 2005A, Series 2006A, and Series 2014A, respectively.
- 40 -
Dormitory Safety Trust Fund (DSTF) Under the provisions of the Dormitory Safety Trust Fund Act (the DSTF Act) (P.L. 2000, c.56), the university received a $29.0 million interest free loan to finance the installation of fire suppression systems in buildings used as student dormitories. The New Jersey Educational Facilities Authority issued two series of bonds on August 14, 2001 to finance these loans. Series 2001A (Tax Exempt) bears an effective interest rate of 4.8% per annum, and Series 2001B (Federally Taxable) bears an effective interest rate of 6.1% per annum. Both series mature on March 1, 2016. At June 30, 2015, the university had a capital lease obligation of $2.1 million. Equipment Leasing Fund (ELF) Under the provisions of the State of New Jersey Higher Education Equipment Leasing Fund Act (the ELF Act of 1993), the university has been allocated $43.8 million to finance the purchase of any property consisting of, or relating to, scientific, engineering, technical, computer, communications, and instructional equipment for lease. The bonds were issued by the New Jersey Educational Facilities Authority on January 30, 2014 and bear an effective interest rate of 1.89% and mature on June 1, 2023. The university is obligated to make annual lease payments equal to 25% of the amount necessary to pay the principal and interest on the portion of the bonds. Title to all equipment purchased under this lease agreement will be transferred to the university at the conclusion of the lease. At June 30, 2015, the university has a capital lease obligation of $8.4 million. Housing Authority In connection with a redevelopment project undertaken by the Housing and Urban Development Authority of the City of New Brunswick (the Housing Authority), a series of agreements were entered into by the university, the Housing Authority and Robert Wood Johnson University Hospital, Inc., the outcome of which was the construction of a student apartment complex, parking deck, health club facility and multi-unit retail center. Pursuant to the terms of the capital lease and agreement dated July 1, 1992 between the university and the Housing Authority, the Housing Authority issued bonds in the aggregate amount of $55.3 million on July 23, 1992, at an effective interest rate of 6.23% per annum, for the purpose of providing long-term financing for the project. On December 1, 1998, these bonds were refinanced in the aggregate amount of $54.5 million, at an effective interest rate of 4.83% per annum. On March 25, 2011, these bonds were refinanced, once again, in the aggregate amount of $31.3 million, at an effective interest rate of 3.2% per annum. The bonds mature serially from July 1, 2011, through July 1, 2020. In accordance with the agreement, the university is required to pay an annual rental to the Housing Authority over the life of the agreement in amounts necessary to retire the university’s portion of the bonds, including interest, to provide for sinking fund and reserve account requirements and to reimburse the Housing Authority for its administrative costs. Upon retirement of the bonds, title to the student apartment complex, parking deck, health club facility and the related common space will be transferred to the university. Accordingly, the land and facilities have been capitalized with a corresponding liability classified as a capital lease obligation. At June 30, 2015, this liability was $17.5 million. As discussed more fully below, a portion of this capital lease obligation is being funded under a sublease agreement.
- 41-
Hospital Sublease In conjunction with the Housing Authority capital lease and agreement, the university simultaneously entered into a sublease and agreement with the Robert Wood Johnson University Hospital, Inc. (the Hospital), dated July 1, 1992, whereby the Hospital agreed to lease a portion of the parking facility from the university. The sublease provides for an initial term of two years which commenced July 1992, renewable in six consecutive five year terms. In accordance with the sublease, the Hospital is required to pay an annual rental to the university over the life of the agreement, subject to termination payments to the university should the options to renew not be exercised. The payments received under this sublease are being used by the university to cover a proportional amount of the lease payments due to the Housing Authority. Upon retirement of the bonds, title to the Hospital’s portion of the parking deck will be transferred to the Hospital. At June 30, 2015, the estimated present value of the Hospital sublease over the full lease term, including renewal periods, amounted to $3.1 million. Payments required under the lease and agreement between the university and the Housing Authority are in no way conditional upon the receipt of payments from the Hospital under the sublease and agreement. Certificates of Participation, Series 2004 Pursuant to an Agent Agreement, dated April 1, 2004, between the university, as Lessee, Lower George Street University Redevelopment Associates, LLC, a New Jersey limited liability company, as Lessor, and Wachovia Bank, National Association (now known as Wells Fargo Bank, National Association), as Agent, Certificates of Participation were issued in the amount of $30.6 million on April 15, 2004. The Certificates of Participation represent undivided proportionate interests in the fixed rent payable by the university pursuant to the Master Lease Agreement, dated April 1, 2004, between the Lessee and Lower George Street University Redevelopment Associates, LLC. The university is obligated under the Lease to make payments of fixed rent that comprise amounts designated as interest and as principal and that are payable to the owners of the 2004 Certificates. The 2004 Certificates were issued to finance the acquisition of the land, the preparation of the land for construction, including demolition and clearing of existing improvements, and the construction of improvements and costs of acquisition and installation of equipment. This area will primarily serve as the university’s Division of Public Safety headquarters, provide additional office space for the university and provide a parking garage, all to support the university’s educational functions. In addition, the 2004 Certificates provided for capitalized interest on the 2004 Certificates from the dates of delivery to July 1, 2005 and to pay the costs of issuance associated with the authorization, sale, execution and delivery of the 2004 Certificates. During fiscal year 2015, the university issued $25.2 million of General Obligation Commercial Paper Series A to refund in whole the Certificates of Participation, Series 2004.
- 42 -
Economic Development Authority: College Avenue Redevelopment Project On September 12, 2013, the New Jersey Economic Development Authority (the Authority) offered $237.1 million of its General Obligation Lease Revenue Bonds, Series 2013. The bonds bear an effective interest rate of 4.927% and mature on June 15, 2046. The proceeds of the bonds will be loaned by the Authority to College Avenue Redevelopment Associates, LLC (the Company), whose sole and managing member is the New Brunswick Development Corporation (DEVCO), pursuant to a Loan Agreement dated September 1, 2013 to finance the educational facilities project being undertaken and constructed by the Company on behalf of the university. The Company is leasing the entire Property to the university pursuant to the Master Lease Agreement dated September 1, 2013. The Fixed-Rent payable by the university to the Company shall be sufficient to pay all interest and principal. The project generally entails the redevelopment and construction of (i) an approximately 175,900 square foot academic building for the Rutgers University School of Arts and Sciences (the Academic Building), consisting of approximately 2,500 seats of classroom space in the form of modern lecture halls ranging from 80 to 300 seats as well as departmental office space, and associated landscaped areas (the SAS improvements), (ii) a separate building consisting of an approximately 500-bed residence hall for honors students, including programming space, office space, common area space and other amenities to enhance undergraduate honors research work, and associated landscaped areas (the Honors College Improvements), (iii) an approximately 500-bed apartment-style residence building comprised of mainly apartments with four single-occupant bedrooms for Rutgers students as well as common area spaces, approximately 13,000 square feet of retail space, and a public plaza with new outdoor connections between the new and existing buildings on the Rutgers College Avenue Campus (the University Housing Improvements), and (iv) an approximately 300-space Rutgers multistory parking structure and surface lot (the University Parking Improvements), and together with the Academic Building, the SAS Improvements, the Honors College Improvements, and the University Housing Improvements, all necessary site and infrastructure improvements. At June 30, 2015, the university has a capital lease obligation of $237.1 million. 15 Washington Street On May 30, 2014, the New Jersey Economic Development Authority (the Authority) issued $58.3 million of its Revenue Notes, Series 2014. The notes bear an effective interest rate of 3.23% and mature on July 1, 2031. The proceeds of the notes will be loaned by the Authority to Washington Street University Housing Associates, LLC (the Landlord), whose sole and managing member is the New Brunswick Development Corporation (DEVCO), pursuant to a Loan Agreement dated May 30, 2014 to finance the renovation of the Residential Estate to provide housing for graduate and undergraduate students, including a total of approximately 335 beds in a variety of unit types including, double and single occupancy bedroom configurations, kitchen, living areas, and bathrooms (together with all necessary and appropriate site improvements and infrastructure). The Landlord is leasing the Property to the university pursuant to the Master Lease Agreement dated May 30, 2014. The Fixed-Rent payment by the university to the Company shall be sufficient to pay all interest and principal. At June 30, 2015, the university had a capital lease obligation of $58.3 million. Ambulatory Care Center On July 2, 2013, the university (subtenant) entered into a sublease agreement with University Hospital (sublandlord) to sublease the Ambulatory Care Center located at 140 Bergen Street, Newark, New Jersey. The sublease expiration date is May 31, 2089 and the base rent is $0.8 million per year. As of June 30, 2015, using a discount rate of 4.16%, the present value of the sublease was $17.6 million. New Jersey Medical School – Hospital Building On July 1, 2013, the university (subtenant) entered into a sublease agreement with University Hospital (sublandlord) to sublease a portion of the Hospital Building located at 150 Bergen Street, Newark, New Jersey. The sublease expiration date is May 31, 2089 and the base rent is $0.7 million per year. As of June 30, 2015, using a discount rate of 4.16%, the present value of the sublease was $14.9 million.
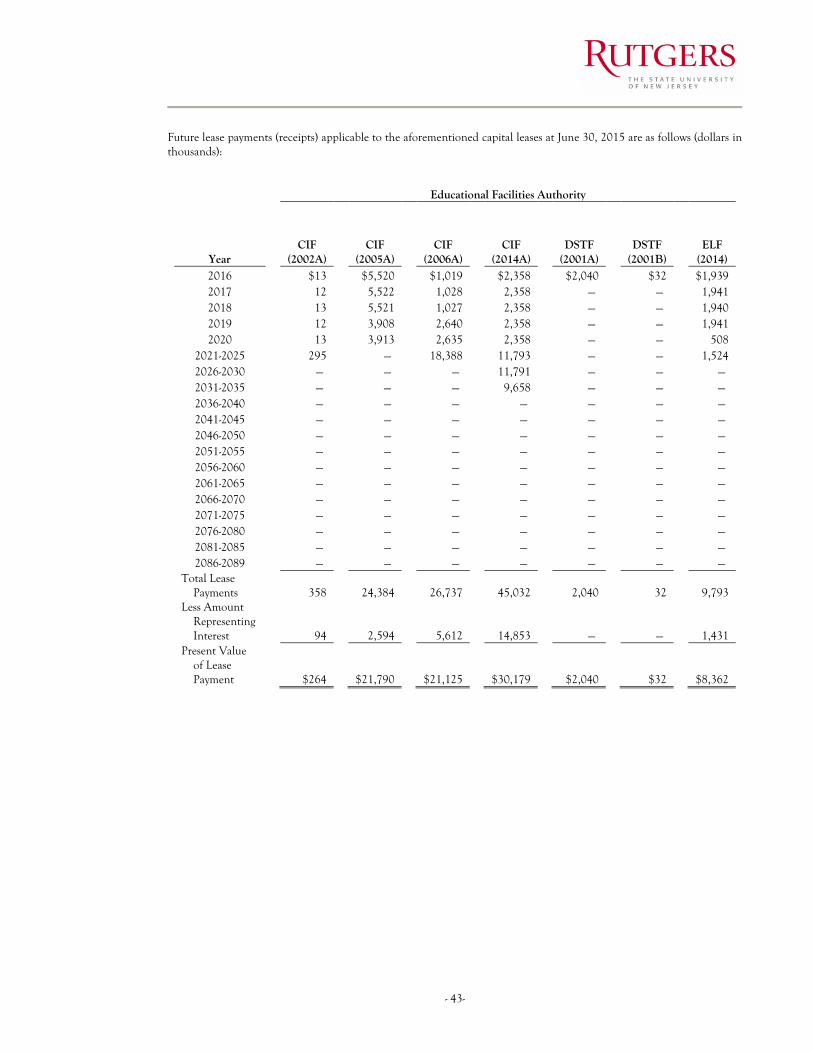
- 43-
Future lease payments (receipts) applicable to the aforementioned capital leases at June 30, 2015 are as follows (dollars in thousands):
Educational Facilities Authority
Year
CIF (2002A)
CIF (2005A)
CIF (2006A)
CIF (2014A)
DSTF (2001A)
DSTF (2001B)
ELF (2014)
2016 $13 $5,520 $1,019 $2,358 $2,040 $32 $1,939 2017 12 5,522 1,028 2,358 —) —) 1,941 2018 13 5,521 1,027 2,358 —) —) 1,940 2019 12 3,908 2,640 2,358 —) —) 1,941 2020 13 3,913 2,635 2,358 —) —) 508
2021-2025 295 —) 18,388 11,793 —) —) 1,524 2026-2030 —) —) —) 11,791 —) —) —) 2031-2035 —) —) —) 9,658 —) —) —) 2036-2040 —) —) —) —) —) —) —) 2041-2045 —) —) —) —) —) —) —) 2046-2050 —) —) —) —) —) —) —) 2051-2055 —) —) —) —) —) —) —) 2056-2060 —) —) —) —) —) —) —) 2061-2065 —) —) —) —) —) —) —) 2066-2070 —) —) —) —) —) —) —) 2071-2075 —) —) —) —) —) —) —) 2076-2080 —) —) —) —) —) —) —) 2081-2085 —) —) —) —) —) —) —) 2086-2089 —) —) —) —) —) —) —)
Total Lease Payments
358 24,384 26,737 45,032 2,040 32 9,793
Less Amount Representing Interest
94 2,594 5,612 14,853 —) —) 1,431 Present Value
of Lease Payment
$264 $21,790 $21,125 $30,179 $2,040 $32 $8,362
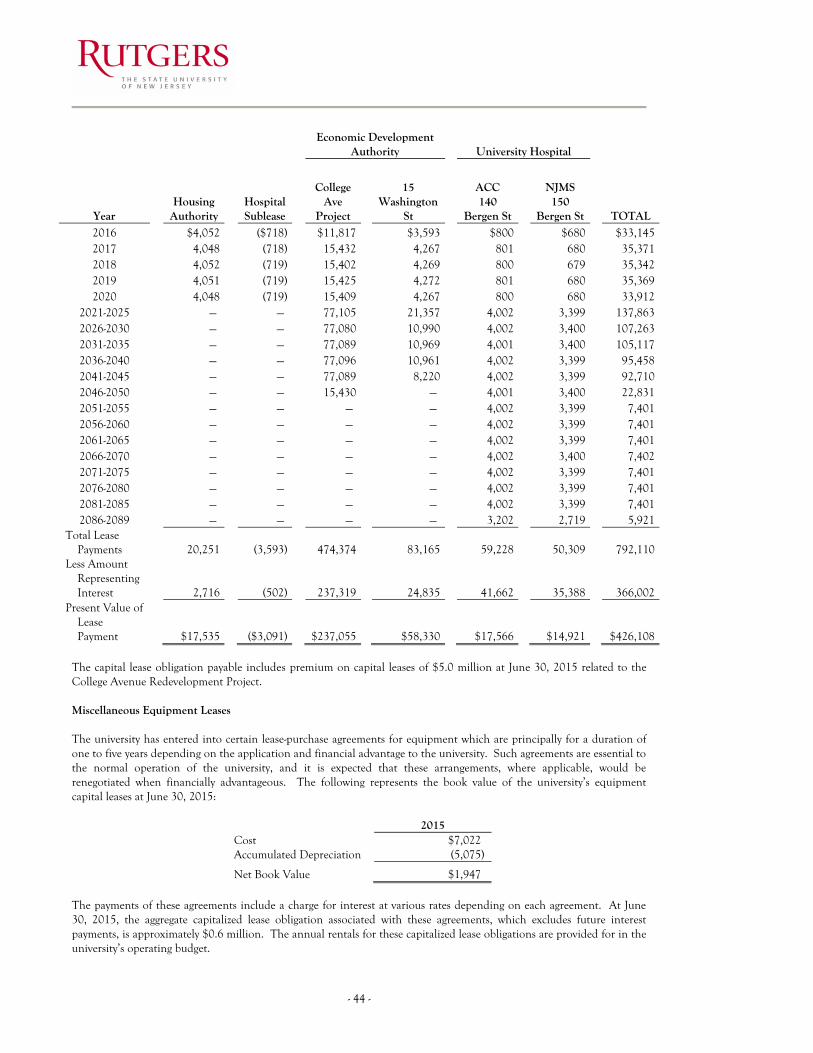
- 44 -
Economic Development
Authority
University Hospital
Year
Housing Authority
Hospital Sublease
College Ave
Project
15 Washington
St
ACC 140
Bergen St
NJMS 150
Bergen St
TOTAL 2016 $4,052 ($718) $11,817 $3,593 $800 $680 $33,145 2017 4,048 (718) 15,432 4,267 801 680 35,371 2018 4,052 (719) 15,402 4,269 800 679 35,342 2019 4,051 (719) 15,425 4,272 801 680 35,369 2020 4,048 (719) 15,409 4,267 800 680 33,912
2021-2025 —) —) 77,105 21,357 4,002 3,399 137,863 2026-2030 —) —) 77,080 10,990 4,002 3,400 107,263 2031-2035 —) —) 77,089 10,969 4,001 3,400 105,117 2036-2040 —) —) 77,096 10,961 4,002 3,399 95,458 2041-2045 —) —) 77,089 8,220 4,002 3,399 92,710 2046-2050 —) —) 15,430 —) 4,001 3,400 22,831 2051-2055 —) —) —) —) 4,002 3,399 7,401 2056-2060 —) —) —) —) 4,002 3,399 7,401 2061-2065 —) —) —) —) 4,002 3,399 7,401 2066-2070 —) —) —) —) 4,002 3,400 7,402 2071-2075 —) —) —) —) 4,002 3,399 7,401 2076-2080 —) —) —) —) 4,002 3,399 7,401 2081-2085 —) —) —) —) 4,002 3,399 7,401 2086-2089 —) —) —) —) 3,202 2,719 5,921
Total Lease Payments
20,251 (3,593) 474,374 83,165 59,228 50,309 792,110
Less Amount Representing Interest
2,716 (502) 237,319 24,835 41,662 35,388 366,002 Present Value of
Lease Payment
$17,535 ($3,091) $237,055 $58,330 $17,566 $14,921 $426,108 The capital lease obligation payable includes premium on capital leases of $5.0 million at June 30, 2015 related to the College Avenue Redevelopment Project. Miscellaneous Equipment Leases The university has entered into certain lease-purchase agreements for equipment which are principally for a duration of one to five years depending on the application and financial advantage to the university. Such agreements are essential to the normal operation of the university, and it is expected that these arrangements, where applicable, would be renegotiated when financially advantageous. The following represents the book value of the university’s equipment capital leases at June 30, 2015:
2015 Cost $7,022) Accumulated Depreciation (5,075)
Net Book Value $1,947) The payments of these agreements include a charge for interest at various rates depending on each agreement. At June 30, 2015, the aggregate capitalized lease obligation associated with these agreements, which excludes future interest payments, is approximately $0.6 million. The annual rentals for these capitalized lease obligations are provided for in the university’s operating budget.
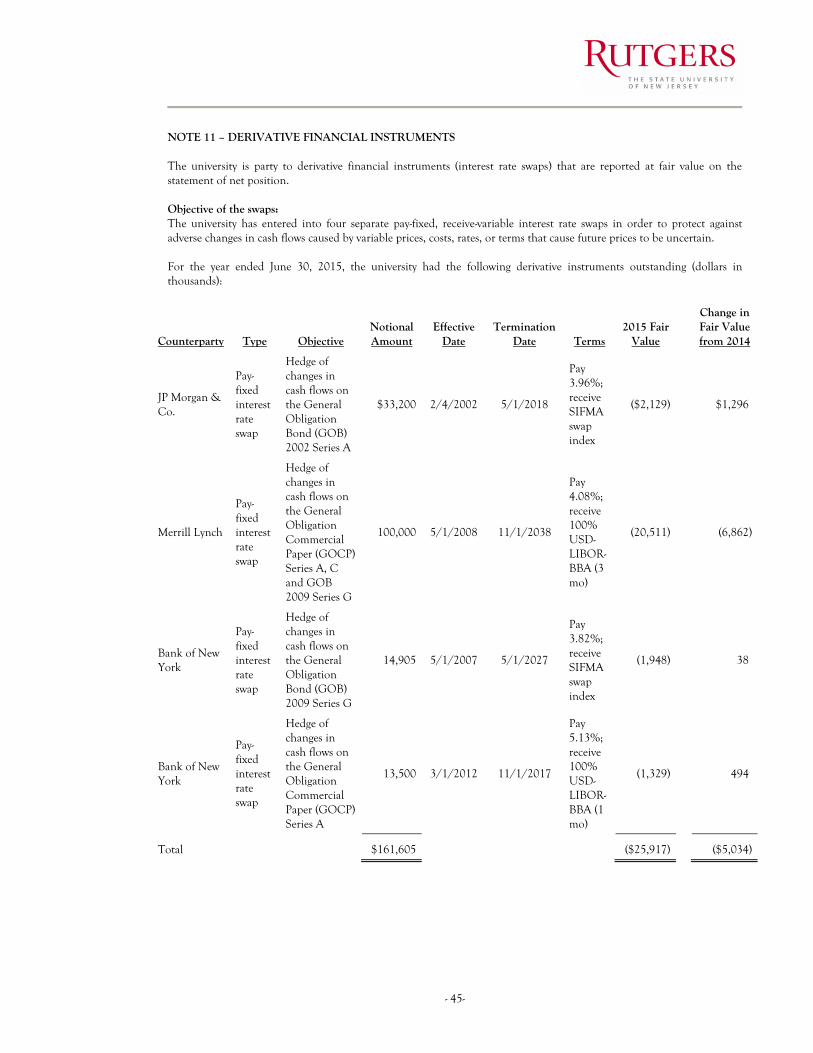
- 45-
NOTE 11 – DERIVATIVE FINANCIAL INSTRUMENTS The university is party to derivative financial instruments (interest rate swaps) that are reported at fair value on the statement of net position. Objective of the swaps: The university has entered into four separate pay-fixed, receive-variable interest rate swaps in order to protect against adverse changes in cash flows caused by variable prices, costs, rates, or terms that cause future prices to be uncertain. For the year ended June 30, 2015, the university had the following derivative instruments outstanding (dollars in thousands):
Counterparty Type Objective Notional Amount
Effective Date
Termination Date Terms
2015 Fair Value
Change in Fair Value from 2014
JP Morgan & Co.
Pay-fixed interest rate swap
Hedge of changes in cash flows on the General Obligation Bond (GOB) 2002 Series A
$33,200 2/4/2002 5/1/2018
Pay 3.96%; receive SIFMA swap index
($2,129)
$1,296)
Merrill Lynch
Pay-fixed interest rate swap
Hedge of changes in cash flows on the General Obligation Commercial Paper (GOCP) Series A, C and GOB 2009 Series G
100,000 5/1/2008 11/1/2038
Pay 4.08%; receive 100% USD-LIBOR-BBA (3 mo)
(20,511)
(6,862)
Bank of New York
Pay-fixed interest rate swap
Hedge of changes in cash flows on the General Obligation Bond (GOB) 2009 Series G
14,905 5/1/2007 5/1/2027
Pay 3.82%; receive SIFMA swap index
(1,948)
38)
Bank of New York
Pay-fixed interest rate swap
Hedge of changes in cash flows on the General Obligation Commercial Paper (GOCP) Series A
13,500 3/1/2012 11/1/2017
Pay 5.13%; receive 100% USD-LIBOR-BBA (1 mo)
(1,329)
494)
Total
$161,605
($25,917)
($5,034)
- 46 -
Fair Value: As of June 30, 2015, the swaps had a total negative fair value of $25.9 million. The fair value was provided by Prager, Sealy & Co., LLC and derived from proprietary models based on estimates about relevant future market conditions. As these are hedging derivatives, the aggregate change in fair value is reported as deferred outflows of resources (since the swaps are in a liability position) in the statement of net position. Credit Risk: As of June 30, 2015, the university was not exposed to credit risk with JP Morgan, Bank of New York and Merrill Lynch because all of the swaps had negative fair values. The credit ratings for each of the counterparties are as follows:
Derivative Instrument 2015 Counterparty
Credit Rating JP Morgan & Co. A+ Merrill Lynch A+ Bank of New York - SIFMA AA– Bank of New York - LIBOR AA–
The mark-to-market value of the swap will not require collateralization unless (i) the Qualified Swap Provider is downgraded by a nationally recognized rating agency below the two highest grade categories, and (ii) the market value of the swap exceeds the current collateralization threshold specified in the respective Agreement. Any such collateral shall consist of direct obligations of, or obligations which are guaranteed by, the United States of America or other securities weighted to take into account their relative security compared to such obligations of the United States of America. The amount of (i.e., value of) such collateral shall equal the market value of the swap in excess of the applicable collateral threshold based on the rating of such counterparty at such time. The table below shows when collateralization would be required or triggered.
Ratings by Moody’s and S&P
Merrill Lynch/ Bank of NY Collateral Threshold
JP Morgan Collateral Threshold
AAA/Aaa Infinite $30.0 million Aa3/AA– Infinite $25.0 million
A1/A+ $20.0 million Zero A2/A $10.0 million Zero
A3/A– $10.0 million Zero Baa1/BBB+ $5.0 million Zero Baa2/BBB $5.0 million Zero
Baa3/BBB– Zero Zero Below Baa3/BBB– or not rated Zero Zero
In the table above, neither Merrill Lynch nor Bank of NY is obligated to provide collateral if it has a credit rating in the highest two categories regardless of the mark-to-market value of the swap. Collateralization would be required, for example, if the Merrill Lynch or Bank of NY Counterparty was rated “A2/A” and the mark-to-market value of the swap exceeded $10.0 million. In this example, the collateral required would be equal to the amount by which the mark-to-market value of the swap exceeds $10.0 million, $0 for the JP Morgan Counterparty. Rutgers is subject to the same collateral requirements as the counterparty. If either S&P or Moody’s ceases to be in the business of rating debt securities and such business is not continued by a successor, a nationally recognized credit rating agency would be selected in substitution. Basis Risk: The pay-fixed receive-variable swaps expose the university to basis risk because the rates resulting from the Securities Industry and Financial Markets Association Index (SIFMA), for the GOB 2002 Series A and the GOB Series 2009 G swaps, 100% of USD-LIBOR-BBA (1 month and 3 month) for GOB Series 2009 G, GOCP Series A and C swaps are not the same rate the university pays on the hedged debt. The rates on the bonds are calculated daily by the remarketing agent, and for the commercial paper by a broker/dealer, at the lowest rate necessary to clear the market.
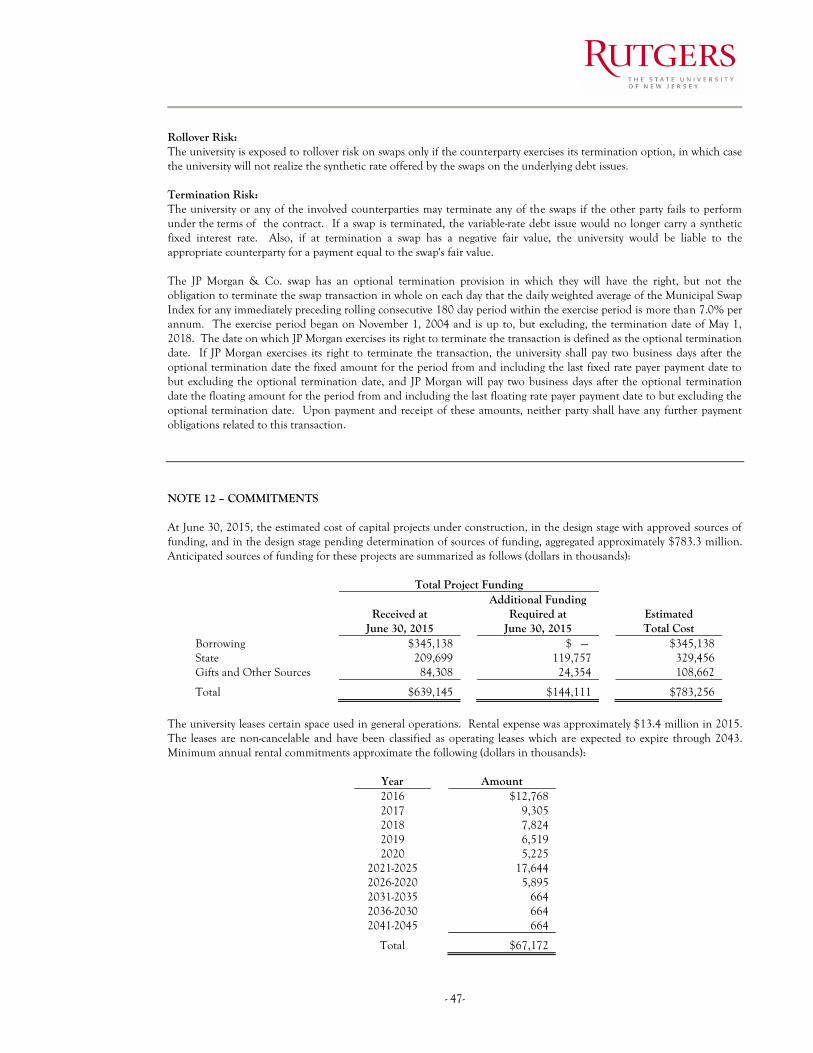
- 47-
Rollover Risk: The university is exposed to rollover risk on swaps only if the counterparty exercises its termination option, in which case the university will not realize the synthetic rate offered by the swaps on the underlying debt issues. Termination Risk: The university or any of the involved counterparties may terminate any of the swaps if the other party fails to perform under the terms of the contract. If a swap is terminated, the variable-rate debt issue would no longer carry a synthetic fixed interest rate. Also, if at termination a swap has a negative fair value, the university would be liable to the appropriate counterparty for a payment equal to the swap's fair value. The JP Morgan & Co. swap has an optional termination provision in which they will have the right, but not the obligation to terminate the swap transaction in whole on each day that the daily weighted average of the Municipal Swap Index for any immediately preceding rolling consecutive 180 day period within the exercise period is more than 7.0% per annum. The exercise period began on November 1, 2004 and is up to, but excluding, the termination date of May 1, 2018. The date on which JP Morgan exercises its right to terminate the transaction is defined as the optional termination date. If JP Morgan exercises its right to terminate the transaction, the university shall pay two business days after the optional termination date the fixed amount for the period from and including the last fixed rate payer payment date to but excluding the optional termination date, and JP Morgan will pay two business days after the optional termination date the floating amount for the period from and including the last floating rate payer payment date to but excluding the optional termination date. Upon payment and receipt of these amounts, neither party shall have any further payment obligations related to this transaction. NOTE 12 – COMMITMENTS At June 30, 2015, the estimated cost of capital projects under construction, in the design stage with approved sources of funding, and in the design stage pending determination of sources of funding, aggregated approximately $783.3 million. Anticipated sources of funding for these projects are summarized as follows (dollars in thousands):
Total Project Funding
Additional Funding
Received at
Required at
Estimated
June 30, 2015
June 30, 2015
Total Cost
Borrowing $345,138 $ —) $345,138 State 209,699 119,757 329,456 Gifts and Other Sources 84,308 24,354 108,662
Total $639,145 $144,111 $783,256
The university leases certain space used in general operations. Rental expense was approximately $13.4 million in 2015. The leases are non-cancelable and have been classified as operating leases which are expected to expire through 2043. Minimum annual rental commitments approximate the following (dollars in thousands):
Year Amount 2016 $12,768 2017 9,305 2018 7,824 2019 6,519 2020 5,225
2021-2025 17,644 2026-2020 5,895 2031-2035 664 2036-2030 664 2041-2045 664
Total $67,172
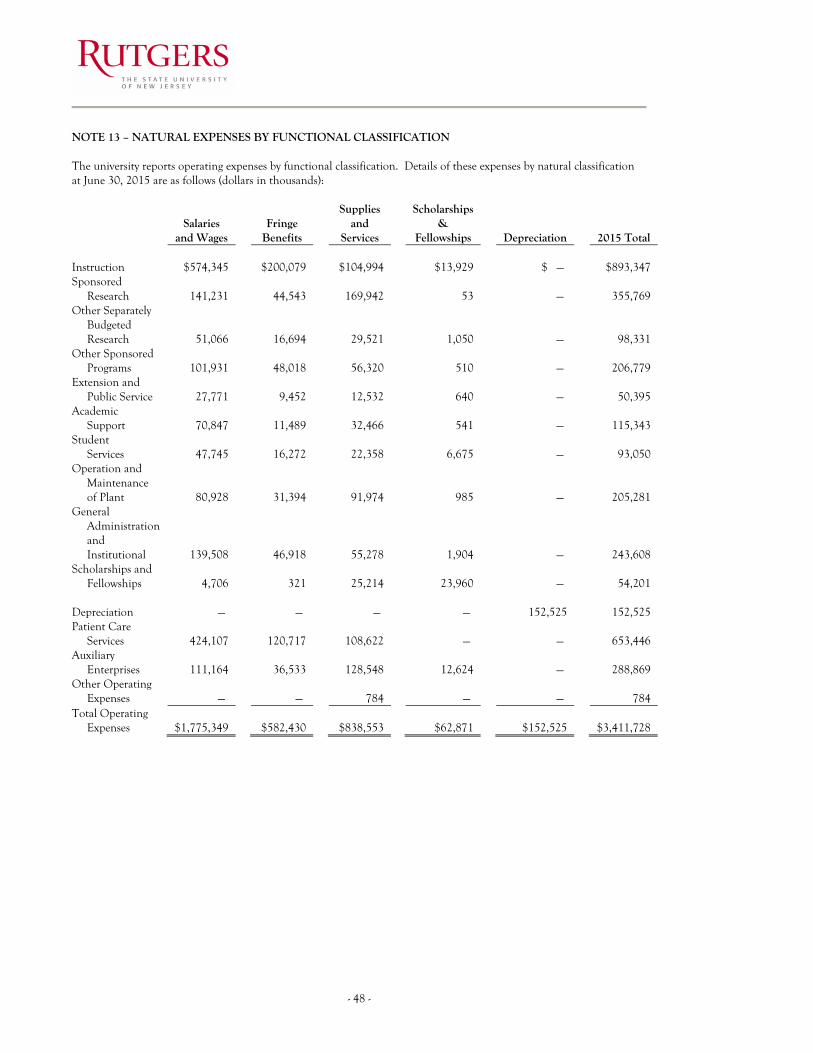
- 48 -
NOTE 13 – NATURAL EXPENSES BY FUNCTIONAL CLASSIFICATION The university reports operating expenses by functional classification. Details of these expenses by natural classification at June 30, 2015 are as follows (dollars in thousands):
Salaries and Wages
Fringe Benefits
Supplies and
Services
Scholarships &
Fellowships Depreciation
2015 Total
Instruction $574,345 $200,079 $104,994 $13,929 $ —) $893,347 Sponsored
Research 141,231 44,543 169,942 53 —) 355,769 Other Separately
Budgeted Research 51,066 16,694 29,521 1,050 —) 98,331
Other Sponsored Programs 101,931 48,018 56,320 510 —) 206,779
Extension and Public Service 27,771 9,452 12,532 640 —) 50,395
Academic Support 70,847 11,489 32,466 541 —) 115,343
Student Services 47,745 16,272 22,358 6,675 —) 93,050
Operation and Maintenance of Plant 80,928 31,394 91,974 985 —) 205,281
General Administration and Institutional 139,508 46,918 55,278 1,904 —) 243,608
Scholarships and Fellowships 4,706 321 25,214 23,960 —) 54,201
Depreciation —) —) —) —) 152,525 152,525 Patient Care
Services 424,107 120,717 108,622 —) —) 653,446 Auxiliary
Enterprises 111,164 36,533 128,548 12,624 —) 288,869 Other Operating
Expenses —) —) 784 —) —) 784 Total Operating
Expenses $1,775,349 $582,430 $838,553 $62,871 $152,525 $3,411,728
- 49-
NOTE 14 - EMPLOYEE BENEFITS Retirement Plans The university has primarily three retirement plans available to its employees, the State of New Jersey Public Employees Retirement System, and State of New Jersey Police and Firemen’s Retirement System, defined benefit plans, and the Alternate Benefit Program, a defined contribution plan. Under these plans, participants make annual contributions, and the State of New Jersey, makes employer contributions on behalf of the university for these plans. Reimbursement is based upon a composite fringe benefit rate provided by the State for all State plans. The university is charged for contributions on behalf of employees through a fringe benefits charge assessed by the State which is included within the state paid fringe benefits in the accompanying statement of revenues, expenses, and changes in net position. Summary information regarding these plans is provided below. Public Employees Retirement System (PERS) Plan Description — The State of New Jersey Public Employees’ Retirement System (PERS) is a cost-sharing multiple-employer defined benefit pension plan administered by the State of New Jersey, Division of Pensions and Benefits (the Division). For additional information about PERS, please refer to Division’s Comprehensive Annual Financial Report (CAFR) which can be found at www.state.nj.us/treasury/pensions/annrprts.shtml. Benefits — The vesting and benefit provisions are set by N.J.S.A. 43:15A. PERS provides retirement, death, and disability benefits. All benefits vest after ten years of service, except for medical benefits, which vest after 25 years of service or under the disability provisions of PERS. The following represents the membership tiers for PERS:
Tier Definition 1 Members who were enrolled prior to July 1, 2007 2 Members who were eligible to enroll on or after July 1, 2007 and prior to November 2, 2008 3 Members who were eligible to enroll on or after November 2, 2008 and prior to May 22, 2010 4 Members who were eligible to enroll on or after May 22, 2010 and prior to June 28, 2011 5 Members who were eligible to enroll on or after June 28, 2011
Service retirement benefits of 1/55th of final average salary for each year of service credit is available to tiers 1 and 2 members upon reaching age 60 and to tier 3 members upon reaching age 62. Service retirement benefits of 1/60th of final average salary for each year of service credit is available to tier 4 members upon reaching age 62 and tier 5 members upon reaching age 65. Early retirement benefits are available to tiers 1 and 2 members before reaching age 60, tiers 3 and 4 before age 62 with 25 or more years of service credit and tier 5 with 30 or more years of service credit before age 65. Benefits are reduced by a fraction of a percent for each month that a members retires prior to the age at which a member can receive full early retirement benefits in accordance with their respective tier. Tier 1 members can receive an unreduced benefit from age 55 to age 60 if they have at least 25 years of service. Deferred retirement is available to members who have at least 10 years of service credit and have not reached the service retirement age for the respective tier.
- 50 -
Contributions — Covered university employees were required by PERS to contribute 6.92% of their annual compensation during fiscal year 2015. The PERS contribution rate will increase by 0.14% each year until the 7.5% contribution rate is reached by July 1, 2018. The State contributes the remaining amounts necessary to pay benefits when due. The State contribution is based upon annual actuarially determined percentages of total compensation of all active members. The State’s pension contribution is based on an actuarially determined amount which includes the employer portion of the normal cost and an amortization of the unfunded accrued liability. A contribution on behalf of the university is included within the State’s contribution. The contribution requirements of the plan members and the university are established and may be amended by the State. Employees can also make voluntary contributions to two optional State of New Jersey tax-deferred investment plans, the Supplemental Annuity Collective Trust (SACT) and the Additional Contributions Tax Sheltered (ACTS) programs. Both plans are subject to limits within the Internal Revenue Code. The State issues publicly available financial reports that include financial statements and required supplementary information for PERS. These reports may be obtained by writing to the State of New Jersey, Division of Pensions and Benefits, PO Box 295, Trenton, NJ 08625-0295. Police and Firemen’s Retirement System (PFRS) Plan Description — The State of New Jersey Police and Firemen’s Retirement System (PFRS) is a cost-sharing multiple-employer defined benefit pension plan administered by the State of New Jersey, Division of Pensions and Benefits (the Division). For additional information about PFRS, please refer to Division’s Comprehensive Annual Financial Report (CAFR) which can be found at www.state.nj.us/treasury/pensions/annrpts.shtml. Benefits — The vesting and benefit provisions are set by N.J.S.A. 43:16A. PFRS provides retirement as well as death and disability benefits. All benefits vest after ten years of service, except disability benefits which vest after four years of service. The following represents the membership tiers for PFRS:
Tier Definition 1 Members who were enrolled prior to May 22, 2010 2 Members who were eligible to enroll on or after May 22, 2010 and prior to June 28, 2011 3 Members who were eligible to enroll on or after June 28, 2011
Service retirement benefits are available at age 55 and are generally determined to be 2% of final compensation for each year of creditable service, as defined, up to 30 years plus 1% for each year of service in excess of 30 years. Members may seek special retirement after achieving 25 years of creditable service, in which benefits would equal 65% (tiers 1 and 2 members) and 60% (tier 3 members) of final compensation plus 1% for each year of creditable service over 25 years but not to exceed 30 years. Members may elect deferred retirement benefits after achieving ten years of service, in which case benefits would begin at age 55 equal to 2% of final compensation for each year of service. Contributions — The State’s pension contribution is based on an actuarially determined amount which includes the employer portion of the normal cost and an amortization of the unfunded accrued liability. A contribution on behalf of the university is included within the State’s contribution. Pursuant to the provisions of Chapter 78, P.L. 2011, the active member contribution rate increased from 8.5% to 10.0% in October 2011. Net Pension Liability, Deferred Amounts Related to Pensions and Pension Expense The university’s respective net pension liability, deferred outflow of resources, deferred inflows of resources, and pension expense related to PERS and PFRS are calculated by the State of New Jersey Division of Pension and Benefits. At June 30, 2015, the university reported a liability of $1,292.2 million and $62.4 million for PERS and PFRS, respectively, for its proportionate share of the respective PERS and PFRS net pension liabilities. The total pension liability used to calculate the net pension liability was determined by an actuarial valuation as of June 30, 2013 and rolled forward to the measurement date of June 30, 2014 for both PERS and PFRS. The university’s proportionate share of the respective net pension liabilities for the fiscal year was based on actual contributions to PERS and PFRS on behalf of the university relative to the total contributions of participating state-group employers for each plan for fiscal 2014, which was 6.4% and 1.8% for PERS and PFRS, respectively. The university’s proportionate share of the respective net pension liabilities for the plan as a whole was 3.3% and 0.4% for PERS and PFRS, respectively.
- 51-
For purposes of measuring the net pension liability, deferred outflows of resources and deferred inflows of resources related to pensions, and pension expense, information about the respective fiduciary net position of the PERS and PFRS and additions to/deductions from PERS and PFRS’ respective fiduciary net position have been determined on the same basis as they are reported by PERS and PFRS. Accordingly, benefit payments (including refunds of employee contributions) are recognized when due and payable in accordance with the benefit terms. Investments are reported at fair value. For additional information about PERS and PFRS, please refer to the plan’s Comprehensive Annual Financial Report (CAFR) which can be found at www.state.nj.us/treasury/pensions/annrpts.shtml. The total pension liability for the June 30, 2014 measurement date was determined by an actuarial valuation as of Ju1y 1, 2013, which was rolled forward to June 30, 2014. This actuarial valuation used the following actuarial assumptions, applied to all periods in the measurement:
PERS PFRS Inflation Rate 3.01% 3.01% Salary Increases: 2012-2021 2.15-4.40% based on age 3.95-8.62% based on age Thereafter 3.15-5.40% based on age 4.95-9.62% based on age Investment rate of return 7.90% 7.90%
Mortality rates were based on the RP-2000 Combined Healthy Male and Female Mortality Tables (setback 1 year for females) with adjustments for mortality improvements from the base year of 2012 for PERS and 2011 for PFRS based on Projection Scale AA. The actuarial assumptions used in the July 1, 2013 valuation were based on the results of an actuarial experience study for the period July 1, 2008 to June 30, 2011 for PERS and July 1, 2007 to June 30, 2010 for PFRS. Long-Term Expected Rate of Return — The long-term expected rate of return on pension plan investments was determined using a building-block method in which best-estimate ranges of expected future real rate of return (expected returns, net of pension plans investment expense and inflation) are developed for each major asset class. These ranges are combined to produce the long-term expected rate of return by weighting the expected future real rates of return by the target asset allocation percentage and by adding expected inflation. Best estimates of arithmetic real rates of return for each major asset class included in PERS’s and PFRS’s target asset allocation as of June 30, 2014 are summarized in the following table:
Asset Class Target
Allocation
Long-Term Expected Real Rate of Return
Cash 6.00% 0.80% Core Bonds 1.00% 2.49% Intermediate-Term Bonds 11.20% 2.26% Mortgages 2.50% 2.17% High Yield Bonds 5.50% 4.82% Inflation-Indexed Bonds 2.50% 3.51% Broad US Equities 25.90% 8.22% Developed Foreign Equities 12.70% 8.12% Emerging Market Equities 6.50% 9.91% Private Equity 8.25% 13.02% Hedge Funds / Absolute Return 12.25% 4.92% Real Estate (Property) 3.20% 5.80% Commodities 2.50% 5.35%
Discount Rate — The discount rate used to measure the total pension liability for PERS was 5.39% and 5.55% as of June 30, 2014 and 2013, respectively. The discount rate used to measure the total pension liability for PFRS was 6.32% and 6.45% as of June 30, 2014 and 2013, respectively. This single blended discount rate was based on the long-term expected rate of return on pension plan investments of 7.9%, and a municipal bond rate of 4.29% and 4.63% as of June 30, 2014 and 2013, respectively, based on the Bond Buyer GO 20-Bond Municipal Bond Index which includes tax-exempt general obligation municipal bonds with an average rating of AA/Aa or higher. The projection of cash flows used to determine the discount rate assumed that contributions from plan members will be made at the current member contribution rates and that the contributions from employers will be made based on the average of the last five years of contributions made in relation to the last five years of actuarially recommended contributions. Based on those assumptions, the plan’s
- 52 -
fiduciary net position was projected to be available to make projected future benefit payments of current plan members through 2033 for PERS and 2045 for PFRS. Therefore, the long-term expected rate of return on plan investments was applied to projected benefit payments through 2033 for PERS and 2045 for PFRS, and the municipal bond rate was applied to projected benefit payments after that date in determining the total pension liability. Sensitivity of the Collective Net Pension Liability to Changes in the Discount Rate — The following presents the collective net pension liability of the university, measured as of June 30, 2014, calculated using the discount rate as disclosed above as well as what the collective net pension liability would be if it was calculated using a discount rate that is 1-percentage point lower or 1-percentage point higher than the current rate (dollars in thousands):
At 1%
Decrease At Current
Discount Rate At 1%
Increase PERS (4.39%, 5.39%, 6.39%, respectively) $1,526,266 $1,292,223 $1,095,943 PFRS (5.32%, 6.32%, 7.32%, respectively) 75,479 62,433 51,690 Total $1,601,745 $1,354,656 $1,147,633
Deferred Outflows of Resources and Deferred Inflows of Resources — The following presents a summary of the deferred outflows of resources and deferred inflows of resources reported at June 30, 2015 (dollars in thousands):
PERS PFRS Total Deferred Outflows of Resources
Changes of Assumptions $28,498 $ — $28,498 Changes in Proportionate Share 31,441 1,269 32,710 Contributions Subsequent to Measurement Date 10,080 2,557 12,637
Total $70,019 $3,826 $73,845
Deferred Inflows of Resources
Changes in Proportionate Share $21,989 $4,909 $26,898 Difference Between Projected and Actual Earnings on
Pension Plan Investments 39,219 1,543 40,762 Total $61,208 $6,452 $67,660
Included in deferred outflows of resources related to pensions is $12.6 million from contributions made on behalf of the university subsequent to the measurement date which will be recognized as a reduction of the net pension liability in the year ended June 30, 2016. Other amounts reported as deferred outflows of resources and deferred inflows of resources related to pensions will be recognized as pension expense as follows (dollars in thousands):
Years Ending June 30 PERS PFRS Total 2016 ($2,829) ($1,090) ($3,919) 2017 (2,829) (1,090) (3,919) 2018 (2,829) (1,090) (3,919) 2019 (2,829) (1,090) (3,919) 2020 6,978) (704) 6,274)
Thereafter 3,069) (119) 2,950) Total ($1,269) ($5,183) ($6,452)
- 53-
Annual Pension Expense — The university’s annual pension expense for PERS and PFRS for the year ended June 30, 2015 was approximately $76.7 million and $3.9 million, respectively. Alternate Benefit Program (ABP) Plan Description — ABP is an employer, defined contribution State retirement plan established as an alternative to PERS. The payroll for employees covered by ABP for the year ended June 30, 2015 was $1,018.8 million. Faculty, part-time lecturers, professional and administrative staff, and certain other salaried employees are eligible to participate in ABP. Employer contributions vest on reaching one year of credited service. The program also provides long-term disability and life insurance benefits. Benefits are payable upon termination at the member’s option unless the participant is re-employed in another institution which participates in ABP. Contributions — The employee mandatory contribution rate for ABP is 5.0% of base salary and is matched by the State at 8.0% of base salary. Contributions can be invested with up to seven investment carriers available under the plan for fiscal year 2015. Additional voluntary contributions may be made on a tax-deferred basis, subject to limits within the Internal Revenue Code. Employer contributions for the year ended June 30, 2015 were $81.5 million. Employee contributions for the year ended June 30, 2015 were $61.4 million. Effective July 1, 2010, Governor Christie signed Chapter 31, P.L. 2010 into law, which only allowed employer contributions to the Alternate Benefits Program (ABP) for salaries up to $141,000. In response to this state imposed limit, the university established the Alternate Benefits Program and Trust. Through this program, the university continues to make the full 8% employer ABP contributions for salaries in excess of $141,000, up to the Federal IRC Annual Compensation limit of $265,000. Other Retirement Plans The university has a small number of employees enrolled in two Federal retirement plans, the Civil Service Retirement System (CSRS) and the Federal Employees Retirement System (FERS). Both plans are defined benefit plans and cover the university’s police and selected positions related to the university’s Cook College/New Jersey Agricultural Experiment Station (CSRS or FERS). The university also has a small number of Rutgers University Foundation employees enrolled in a contributory retirement plan under arrangements with Teacher’s Insurance and Annuity Association and College Retirement Equities Fund (TIAA-CREF), which provides for the purchase of annuities for the covered employees. The university also has a small number of employees enrolled in the Defined Contribution Retirement Program (DCRP). The Defined Contribution Retirement Program (DCRP) was established under the provisions of Chapter 92, P.L. 2007 and expanded under the provisions of Chapter 89, P.L. 2008 and Chapter 1, P.L. 2010. The DCRP provides eligible members with a tax sheltered, defined contribution retirement benefit, along with life insurance and disability coverage. Employees who are ineligible for PERS and PFRS, because the hours of work are fewer than those required for PERS and PFRS membership, are eligible for enrollment in the DCRP provided the annual salary is $5,000 or higher. Employees enrolled in PERS on or after July 1, 2007, who earn salary in excess of established “maximum compensation” limits; and employees otherwise eligible to enroll in PERS on or after November 2, 2008, who do not earn the minimum annual salary (indexed annually) for PERS Membership but who earn a salary of at least $5,000 annually, are eligible to enroll in the DCRP. Eligible employees contribute 5.5% of base salary and the employer match is 3% of base salary. Participation in all of these plans is limited, and the associated amounts are not significant. Deferred Compensation Plan University employees with membership in PERS, ABP or PFRS are eligible to participate in the State of New Jersey’s Employees Deferred Compensation Plan created in accordance with Internal Revenue Code Section 457. The plan permits employees to elect pre-tax and/or after-tax Roth contributions to invest a portion of their base salary until future years. The deferred compensation is not available to employees until termination, retirement, death or unforeseeable emergency. The plan is administered by Prudential Financial. The plan does not include any matching employer (State) contributions. All amounts of compensation deferred under the plan, all property and rights purchased with those amounts and all income attributable to those amounts, property or rights, are held in trust by the State for the exclusive benefit of the participating employees and their beneficiaries.
- 54 -
Postemployment Benefits Other Than Pension In addition to providing pension benefits, the State provides certain health care and life insurance benefits for the university’s retired employees, in accordance with State statutes. Full health coverage is provided to eligible employees retiring with 25 years of service credited on or before June 30, 1997 in one of the State of New Jersey’s mandatory pension plans. Employees retiring with 25 years of service credited after June 30, 1997 may share in the cost of the health care provided under the State Plan according to the terms specified in the appropriate bargaining unit agreement in effect at the time the employee reaches 25 years of credited service. The rules governing the contribution rate are the same as that for active employees. Since the costs of these programs are the responsibility of the State and the retired employees, the amounts are not available to the university and no expenses or liabilities for these benefits are reflected in the university’s financial statements. NOTE 15 - COMPENSATED ABSENCES The university accounts for compensated absences as directed by GASB Statement No. 16, Accounting for Compensated Absences. A liability for compensated absences (i.e. unused vacation, sick leave, and paid leave bank days attributable to services already rendered and not contingent on a specific event that is outside the control of the employer and employee is accrued as employees earn the rights to the benefits. The university recorded a liability for accumulated vacation time in the amount of $68.8 million at June 30, 2015. The liability is calculated based upon employees’ accrued vacation time as of the statement of net position date and is recorded in accounts payable and accrued expenses in the accompanying statement of net position. Payments for accumulated sick leave balances are made to retiring employees upon regular retirement. The pay out to retirees for unused accumulated sick time is calculated at the lesser of ½ the value of earned time or $15,000. Employees separating from the university service prior to retirement are not entitled to payments for accumulated sick leave balances. The university recorded a liability for accumulated sick leave balances in the amount of $16.3 million at June 30, 2015 which is included in noncurrent accounts payable and accrued expenses in the accompanying statement of net position. The university also recorded a liability for paid leave bank days in the amount of $4.0 million at June 30, 2015, which is included in noncurrent accounts payable and accrued expenses in the accompanying statement of net position. Employees began using these days on July 1, 2010, and may continue for the duration of employment with the university. Once these days are exhausted, the employee will not be eligible for any additional days.
- 55-
NOTE 16 - RISK MANAGEMENT The university, jointly with 15 other higher education institutions, has established Genesis Ltd. (Genesis), a Class 2 reinsurer under the Insurance Act of 1978 of Bermuda. Genesis, a Captive Reinsurance Company, reinsures general liability, professional liability, and automobile liability risks of its shareholders. The university has approximately a 15.8% equity ownership of Genesis and receives a pro-rata share of the income generated. The university’s annual premium payments to the company for insurance coverage are based on actuarial studies and are charged to expenses. The insurance policies have deductibles that vary by policy, the most significant of which provides for the payment of general liability claims. In 2004, the university and its 15 partners formed a Vermont Reciprocal Risk Retention Group, Pinnacle Consortium of Higher Education, to further enhance and support the insurance programs and provide fronting services for Genesis. The primary purpose of this second alternate risk funding company is to reduce costs, reduce collateral requirements for Genesis and provide the flexibility to conduct business in the U.S. The university is self-insured for workers compensation and retains various deductibles for general liability, automobile liability, and all risk property insurance. The total liability at June 30, 2015 for these items is $35.6 million. The reserve balance recorded at June 30, 2015 is $32.5 million. No discount rate is used. The self insurance reserve represents the estimated ultimate cost of settling claims and related expenses resulting from events that have occurred. The reserve includes the amount that will be required for future payments of claims that have been reported and claims related to events that have occurred but have not been reported (IBNR). The university participates in the State’s Medical Malpractice Self-Insurance Fund (the Fund) which is used to pay malpractice claims and insurance premiums for the university. The contributions made during the current fiscal year by the university and its affiliate hospitals, UPA, Department of Corrections (DOC), and faculty practice plans are equal to the amount established in memoranda agreements between the Department of the Treasury and the university. If the contributions are insufficient to pay claims expenditures, the State’s General Fund will be used to pay remaining claims. Payment of claims from the Fund totaled $50.7 million in 2015. Contributions to the Fund from the State totaled $38.8 million in 2015, while contributions from RBHS affiliates, DOC, and faculty practice plans totaled $10.7 million in 2015. The university has accrued expenses for deductibles and incurred but not reported liabilities in the statement of net position. The accrued expenses are based on estimates by management and third party claims administrators and generally represent the present value of the unpaid claims including the estimates for claims incurred but not reported.
- 56 -
NOTE 17 - CONTINGENCIES The university is a party to various legal actions arising in the ordinary course of its operations. While it is not feasible to predict the ultimate outcome of these actions, it is the opinion of management that the resolution of these matters will not have a material adverse effect on the university’s financial statements. The university receives funds from federal, state and private agencies under grants and contracts for research, training and other activities. The costs, both direct and indirect, charged to these grants and contracts are subject to audit and possible disallowance by the sponsoring agency. It is the university’s belief that any disallowances or adjustments would not have a significant effect on the university’s financial statements. In connections with the settlement of two cases that initially resulted in a Deferred Prosecution Agreement with the United States Attorney for the District of New Jersey, the University of Medicine and Dentistry of New Jersey (UMDNJ) entered into a five year Corporate Integrity Agreement (CIA) with the Office of the Inspector General (OIG) of the Federal Department of Health and Human Services in September 2009. Under the terms of the CIA, UMDNJ agreed to adhere to requirements that ensure regulatory and legal compliance with all Federal healthcare programs. Pursuant to a letter agreement between the university and the OIG, the university assumed UMDNJ’s obligations under the CIA to the extent those obligations relate to the units of UMDNJ acquired by the university pursuant to the New Jersey Medical and Health Sciences Education Restructuring Act. In March 2015, the university received confirmation from the Office of the Inspector General (OIG) of the United States Department of Health and Human Services that RBHS fulfilled its requirements under the Corporate Integrity Agreement (CIA) (September 2009 through September 2014), originally between the University of Medicine and Dentistry of New Jersey (UMDNJ) and the OIG and subsequently between RBHS and OIG pursuant to the integration of UMDNJ and Rutgers, The State University of New Jersey. With the expiration of the CIA, RBHS is released from its reporting requirements to the OIG but will continue to implement its robust healthcare compliance program developed over the last six years. NOTE 18 – ONE WASHINGTON PARK In September 2006, the university’s Board of Governors authorized the negotiation and execution of a contract of purchase and sale and arrangement for construction financing for the Rutgers Newark Business School’s relocation to One Washington Park, Newark, New Jersey, where space was consolidated for faculty offices and classrooms. The building was converted into a condominium in which 11 floors of the building along with a 15,000 square foot addition located at grade level reconstituted as the Rutgers Business School space. The overall project budget included the following: (i) the acquisition of the Rutgers Business School Space, (ii) the construction costs needed to build out the interior and exterior of such space, (iii) the construction costs needed to improve and repair certain common elements and common building systems in the building, (iv) the fee required under the Architect’s Contract, and (v) other non-construction related costs. The overall project cost was $83.0 million. Funding for this project came from several sources, particularly, in fiscal year 2006, the State of New Jersey made a special appropriation to the university in the amount of $18.0 million earmarked specifically for the Business School. The university is also participating in the New Markets Tax Credit (NMTC) program administered by the U.S. Treasury’s Community Development Financial Institutions Fund (CDFI) and entered into a transaction with City National Bank of New Jersey, PNC Bank, National Community Investment Fund, and New Jersey Community Capital, also known as a Community Development Entity (CDE). The NMTC compliance period ended as of December 1, 2014. When the transaction was completed, the university controls the property indirectly through its blended component units, Parkside RUN Investments, LLC and One Washington Park Holdings, LLC (QALICB). On October 15, 2009, the new home of the Rutgers Business School at One Washington Park was officially opened. Classes began in the facility at the start of the 2009 fall semester. The building houses Rutgers Business school classes, faculty and staff offices, departments, centers, and a police substation for added security.
- 57-
NOTE 19 - COMPONENT UNIT - RUTGERS UNIVERSITY FOUNDATION Cash, Cash Equivalents, and Investments The Foundation’s cash and cash equivalents are carried in the financial statements at fair value and consist of the following as of June 30, 2015 (dollars in thousands):
2015 Money Market Account $1,753 Cash and Deposits 22,195
$23,948 The Board of Overseers, through its Investment Committee, has authority over the investment of Foundation funds. Professional investment managers are engaged by the Foundation to buy, sell, invest, and reinvest portions of the assets in accordance with the investment policies and objectives established by the Investment Committee. The primary financial objective of the Foundation’s investment management of assets for the General Endowment Fund is to earn the highest yield possible without unnecessary risk to principal. To achieve the goals of safety, liquidity, and return, the assets in the General Endowment Fund are invested in laddered high quality short term fixed income securities and/or an institutional money market fund. The objective for the Planned Giving Portfolio is to maximize long term total return through a combination of income and capital appreciation in a prudent manner. To achieve the goals of growth and income, the assets within the Planned Giving Portfolio are divided into an equity portion (equities including convertibles and cash devoted to equities) and a fixed income portion (bonds, notes, nonconvertible preferred stock, and cash devoted to fixed income). In addition, the Planned Fiving Portfolio is subject to state mandated investment restrictions for annuities issued in the states of Florida and California. Investments are carried in the financial statements at fair value, based on quoted market prices and consist of the following as of June 30, 2015 (dollars in thousands):
Investment Type 2015 U.S. Treasury Securities $3,125 Corporate Bonds 7,899 Municipal Bonds 608 Mortgage-backed Securities 4,700 Asset-backed Securities 572 Preferred Stock 271 Common Stock 9,528 Foreign Corporate Debt Securities 344 Bank Loans 308 Real Estate 15 Equity REITS 473 Mutual Funds 507 Privately Held Securities 60
$28,410
- 58 -
Custodial Credit Risk –The custodial credit risk associated with the Foundation’s cash and cash equivalents includes uncollateralized deposits, including any bank balance that is collateralized with securities held by pledging financial institutions, or by its trust department or agent, but not in the Foundation’s name. As of June 30, 2015, the amount on deposit with the banks was $22.1 million. As of June 30, 2015, the Foundation had insured deposits up to the Federal Deposit Insurance Corporation (FDIC) coverage limits totaling $0.3 million. Cash and cash equivalents in excess of those balances are uncollateralized. As of June 30, 2015, the Foundation’s investments were either insured, registered, or held by the Foundation’s agent in the Foundation’s name, except for money market and mutual funds, which are not subject to custodial credit risk because their existence is not evidenced by securities that exist in physical or book entry form. Concentration of Credit Risk –The Foundation limits the concentration of credit risk by placing a limit on the amount the investment managers may invest in any one issuer. No initial purchase of an equity or fixed income security in any one issuer should exceed 5% of the portion of the Foundation’s assets under management by each investment manager. In addition, no single equity security should be greater than 10% of the market value of the Foundation’s assets under management. As of June 30, 2015, there are no investments in any one issuer greater than 5% of total investments. Credit Risk – GASB Statement No. 40 requires that disclosure be made as to the credit rating of all fixed income securities except obligations of the U.S. government or obligations explicitly guaranteed by the U.S. government. The Foundation’s investment policy states that individual bonds shall be rated investment grade by at least two recognized or authorized rating agencies (Moody’s and Standard & Poor’s). The average credit quality of the fixed income securities must be maintained at a Class “BBB/Baa” or higher as rated by both standard services (Moody’s and Standard & Poor’s). Up to 10% of the investment manager’s portfolio may be invested in securities rated “BBB/Baa” or lower as rated by both standard services (Moody’s and Standard & Poor’s). The dollar-weighted average rating of the fixed income portfolio for each manager of marketable bonds shall be “A/A” or better.
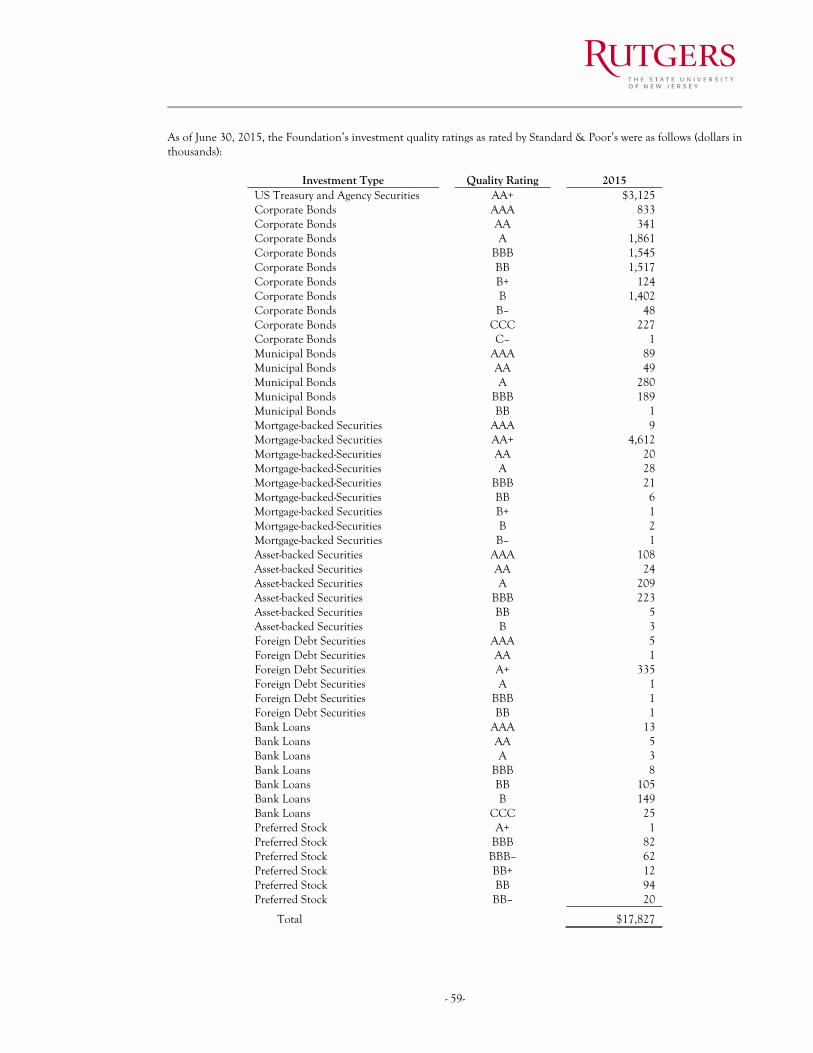
- 59-
As of June 30, 2015, the Foundation’s investment quality ratings as rated by Standard & Poor’s were as follows (dollars in thousands):
Investment Type Quality Rating 2015 US Treasury and Agency Securities AA+ $3,125 Corporate Bonds AAA 833 Corporate Bonds AA 341 Corporate Bonds A 1,861 Corporate Bonds BBB 1,545 Corporate Bonds BB 1,517 Corporate Bonds B+ 124 Corporate Bonds B 1,402 Corporate Bonds B– 48 Corporate Bonds CCC 227 Corporate Bonds C– 1 Municipal Bonds AAA 89 Municipal Bonds AA 49 Municipal Bonds A 280 Municipal Bonds BBB 189 Municipal Bonds BB 1 Mortgage-backed Securities AAA 9 Mortgage-backed Securities AA+ 4,612 Mortgage-backed-Securities AA 20 Mortgage-backed-Securities A 28 Mortgage-backed-Securities BBB 21 Mortgage-backed-Securities BB 6 Mortgage-backed Securities B+ 1 Mortgage-backed-Securities B 2 Mortgage-backed Securities B– 1 Asset-backed Securities AAA 108 Asset-backed Securities AA 24 Asset-backed Securities A 209 Asset-backed Securities BBB 223 Asset-backed Securities BB 5 Asset-backed Securities B 3 Foreign Debt Securities AAA 5 Foreign Debt Securities AA 1 Foreign Debt Securities A+ 335 Foreign Debt Securities A 1 Foreign Debt Securities BBB 1 Foreign Debt Securities BB 1 Bank Loans AAA 13 Bank Loans AA 5 Bank Loans A 3 Bank Loans BBB 8 Bank Loans BB 105 Bank Loans B 149 Bank Loans CCC 25 Preferred Stock A+ 1 Preferred Stock BBB 82 Preferred Stock BBB– 62 Preferred Stock BB+ 12 Preferred Stock BB 94 Preferred Stock BB– 20
Total $17,827
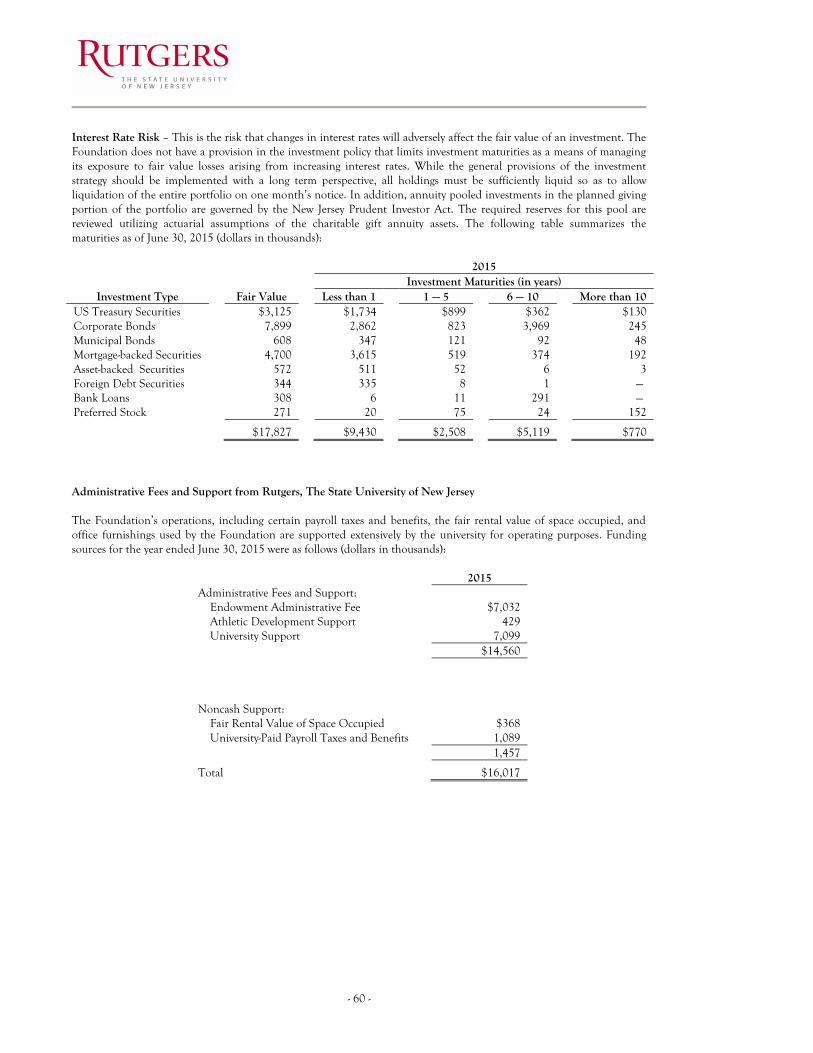
- 60 -
Interest Rate Risk – This is the risk that changes in interest rates will adversely affect the fair value of an investment. The Foundation does not have a provision in the investment policy that limits investment maturities as a means of managing its exposure to fair value losses arising from increasing interest rates. While the general provisions of the investment strategy should be implemented with a long term perspective, all holdings must be sufficiently liquid so as to allow liquidation of the entire portfolio on one month’s notice. In addition, annuity pooled investments in the planned giving portion of the portfolio are governed by the New Jersey Prudent Investor Act. The required reserves for this pool are reviewed utilizing actuarial assumptions of the charitable gift annuity assets. The following table summarizes the maturities as of June 30, 2015 (dollars in thousands):
2015 Investment Maturities (in years)
Investment Type Fair Value Less than 1 1 — 5 6 — 10 More than 10 US Treasury Securities $3,125 $1,734 $899 $362 $130 Corporate Bonds 7,899 2,862 823 3,969 245 Municipal Bonds 608 347 121 92 48 Mortgage-backed Securities 4,700 3,615 519 374 192 Asset-backed Securities 572 511 52 6 3 Foreign Debt Securities 344 335 8 1 —) Bank Loans 308 6 11 291 —) Preferred Stock 271 20 75 24 152
$17,827 $9,430 $2,508 $5,119 $770 Administrative Fees and Support from Rutgers, The State University of New Jersey The Foundation’s operations, including certain payroll taxes and benefits, the fair rental value of space occupied, and office furnishings used by the Foundation are supported extensively by the university for operating purposes. Funding sources for the year ended June 30, 2015 were as follows (dollars in thousands):
2015 Administrative Fees and Support:
Endowment Administrative Fee $7,032 Athletic Development Support 429 University Support 7,099
$14,560 Noncash Support:
Fair Rental Value of Space Occupied $368 University-Paid Payroll Taxes and Benefits 1,089 1,457
Total $16,017
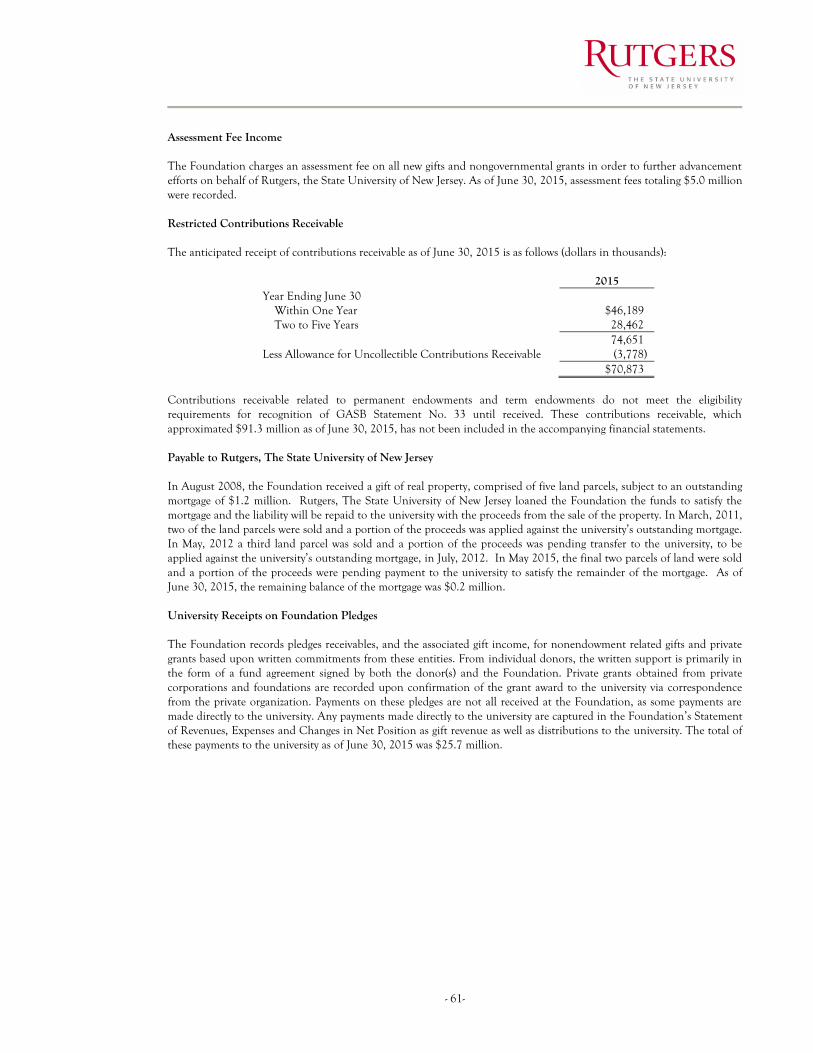
- 61-
Assessment Fee Income The Foundation charges an assessment fee on all new gifts and nongovernmental grants in order to further advancement efforts on behalf of Rutgers, the State University of New Jersey. As of June 30, 2015, assessment fees totaling $5.0 million were recorded. Restricted Contributions Receivable The anticipated receipt of contributions receivable as of June 30, 2015 is as follows (dollars in thousands):
2015 Year Ending June 30
Within One Year $46,189) Two to Five Years 28,462)
74,651) Less Allowance for Uncollectible Contributions Receivable (3,778) $70,873)
Contributions receivable related to permanent endowments and term endowments do not meet the eligibility requirements for recognition of GASB Statement No. 33 until received. These contributions receivable, which approximated $91.3 million as of June 30, 2015, has not been included in the accompanying financial statements. Payable to Rutgers, The State University of New Jersey In August 2008, the Foundation received a gift of real property, comprised of five land parcels, subject to an outstanding mortgage of $1.2 million. Rutgers, The State University of New Jersey loaned the Foundation the funds to satisfy the mortgage and the liability will be repaid to the university with the proceeds from the sale of the property. In March, 2011, two of the land parcels were sold and a portion of the proceeds was applied against the university’s outstanding mortgage. In May, 2012 a third land parcel was sold and a portion of the proceeds was pending transfer to the university, to be applied against the university’s outstanding mortgage, in July, 2012. In May 2015, the final two parcels of land were sold and a portion of the proceeds were pending payment to the university to satisfy the remainder of the mortgage. As of June 30, 2015, the remaining balance of the mortgage was $0.2 million. University Receipts on Foundation Pledges The Foundation records pledges receivables, and the associated gift income, for nonendowment related gifts and private grants based upon written commitments from these entities. From individual donors, the written support is primarily in the form of a fund agreement signed by both the donor(s) and the Foundation. Private grants obtained from private corporations and foundations are recorded upon confirmation of the grant award to the university via correspondence from the private organization. Payments on these pledges are not all received at the Foundation, as some payments are made directly to the university. Any payments made directly to the university are captured in the Foundation’s Statement of Revenues, Expenses and Changes in Net Position as gift revenue as well as distributions to the university. The total of these payments to the university as of June 30, 2015 was $25.7 million.
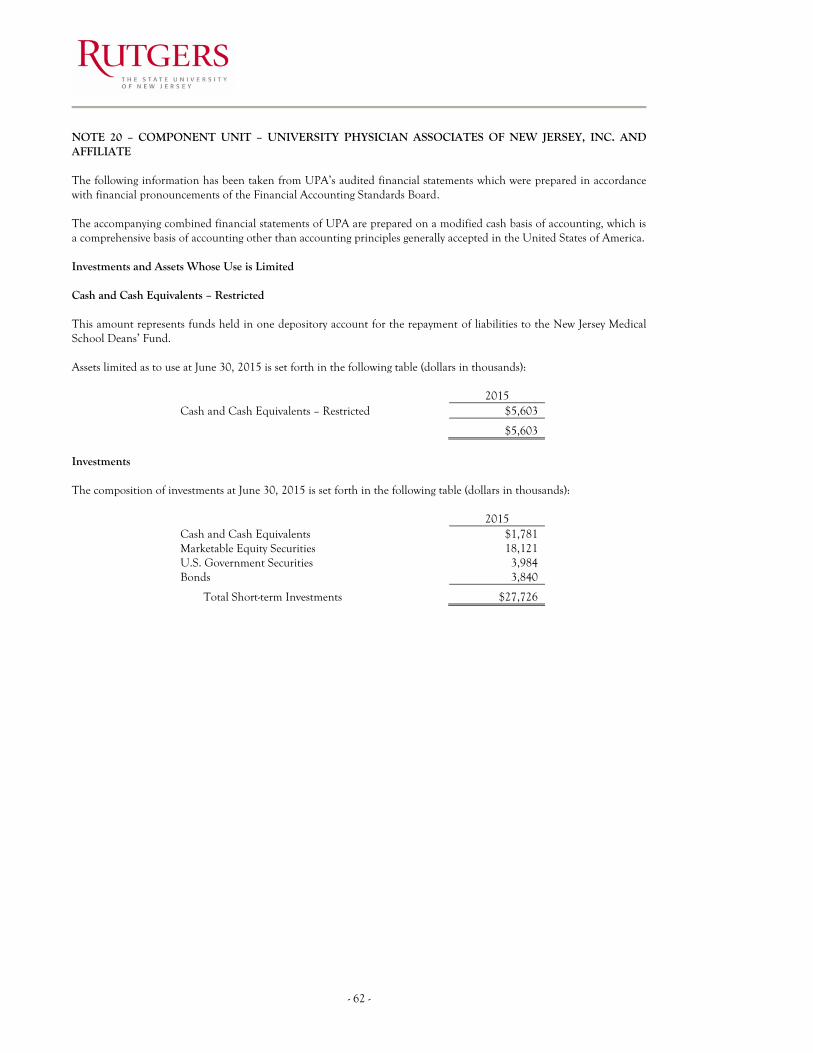
- 62 -
NOTE 20 – COMPONENT UNIT – UNIVERSITY PHYSICIAN ASSOCIATES OF NEW JERSEY, INC. AND AFFILIATE The following information has been taken from UPA’s audited financial statements which were prepared in accordance with financial pronouncements of the Financial Accounting Standards Board. The accompanying combined financial statements of UPA are prepared on a modified cash basis of accounting, which is a comprehensive basis of accounting other than accounting principles generally accepted in the United States of America. Investments and Assets Whose Use is Limited Cash and Cash Equivalents – Restricted This amount represents funds held in one depository account for the repayment of liabilities to the New Jersey Medical School Deans’ Fund. Assets limited as to use at June 30, 2015 is set forth in the following table (dollars in thousands):
2015 Cash and Cash Equivalents – Restricted $5,603
$5,603 Investments The composition of investments at June 30, 2015 is set forth in the following table (dollars in thousands):
2015 Cash and Cash Equivalents $1,781 Marketable Equity Securities 18,121 U.S. Government Securities 3,984 Bonds 3,840
Total Short-term Investments $27,726
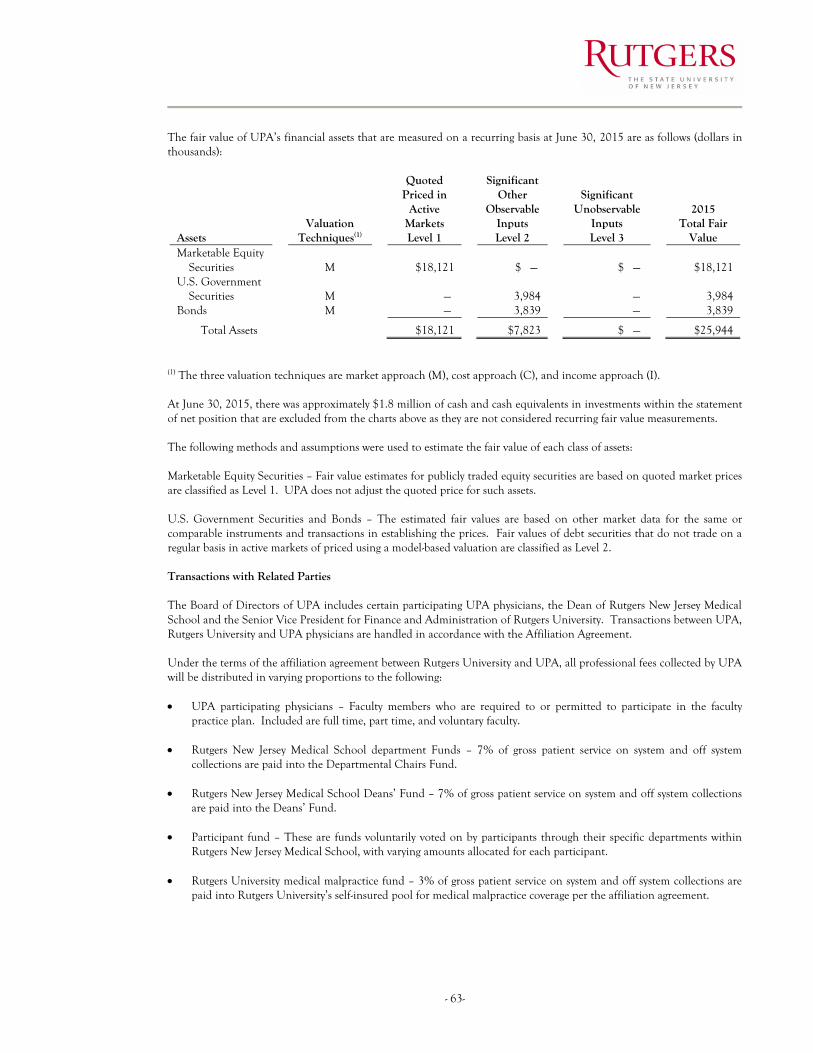
- 63-
The fair value of UPA’s financial assets that are measured on a recurring basis at June 30, 2015 are as follows (dollars in thousands):
Assets Valuation
Techniques(1)
Quoted Priced in
Active Markets Level 1
Significant Other
Observable Inputs Level 2
Significant Unobservable
Inputs Level 3
2015 Total Fair
Value Marketable Equity
Securities
M $18,121 $ —) $ —) $18,121 U.S. Government
Securities
M —) 3,984 —) 3,984 Bonds M —) 3,839 —) 3,839
Total Assets $18,121 $7,823 $ —) $25,944 (1) The three valuation techniques are market approach (M), cost approach (C), and income approach (I). At June 30, 2015, there was approximately $1.8 million of cash and cash equivalents in investments within the statement of net position that are excluded from the charts above as they are not considered recurring fair value measurements. The following methods and assumptions were used to estimate the fair value of each class of assets: Marketable Equity Securities – Fair value estimates for publicly traded equity securities are based on quoted market prices are classified as Level 1. UPA does not adjust the quoted price for such assets. U.S. Government Securities and Bonds – The estimated fair values are based on other market data for the same or comparable instruments and transactions in establishing the prices. Fair values of debt securities that do not trade on a regular basis in active markets of priced using a model-based valuation are classified as Level 2. Transactions with Related Parties The Board of Directors of UPA includes certain participating UPA physicians, the Dean of Rutgers New Jersey Medical School and the Senior Vice President for Finance and Administration of Rutgers University. Transactions between UPA, Rutgers University and UPA physicians are handled in accordance with the Affiliation Agreement. Under the terms of the affiliation agreement between Rutgers University and UPA, all professional fees collected by UPA will be distributed in varying proportions to the following: UPA participating physicians – Faculty members who are required to or permitted to participate in the faculty
practice plan. Included are full time, part time, and voluntary faculty.
Rutgers New Jersey Medical School department Funds – 7% of gross patient service on system and off system collections are paid into the Departmental Chairs Fund.
Rutgers New Jersey Medical School Deans’ Fund – 7% of gross patient service on system and off system collections are paid into the Deans’ Fund.
Participant fund – These are funds voluntarily voted on by participants through their specific departments within Rutgers New Jersey Medical School, with varying amounts allocated for each participant.
Rutgers University medical malpractice fund – 3% of gross patient service on system and off system collections are paid into Rutgers University’s self-insured pool for medical malpractice coverage per the affiliation agreement.
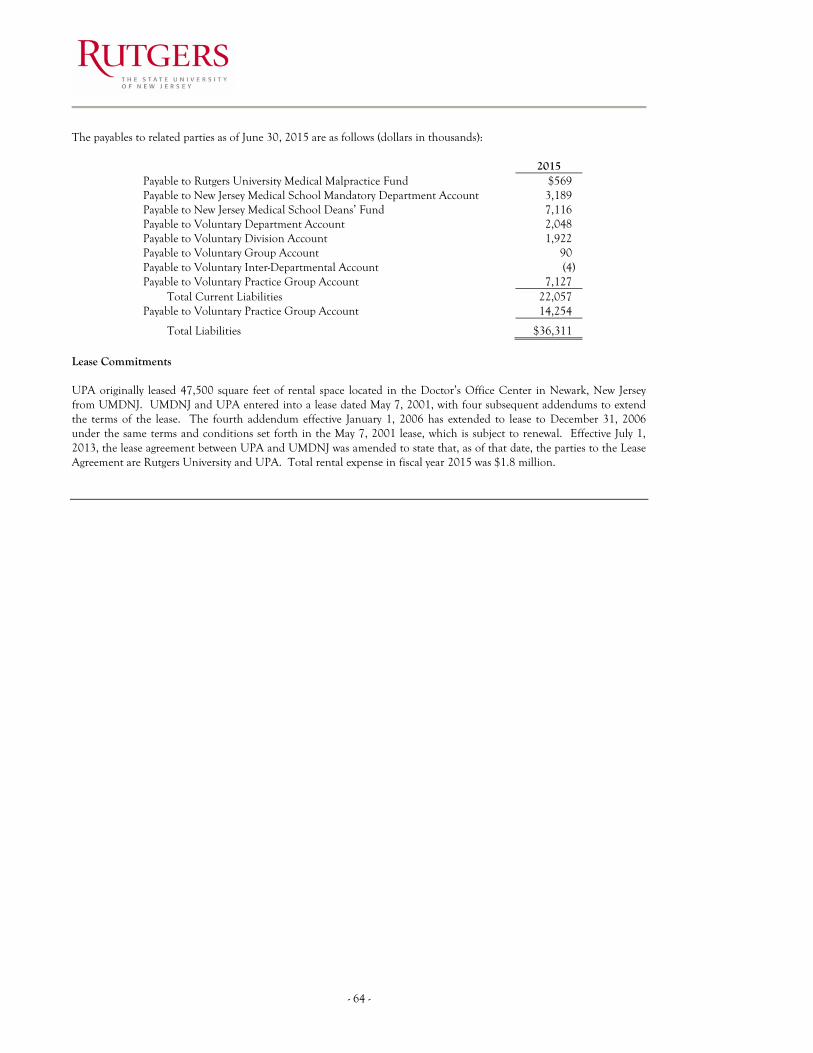
- 64 -
The payables to related parties as of June 30, 2015 are as follows (dollars in thousands):
2015 Payable to Rutgers University Medical Malpractice Fund $569) Payable to New Jersey Medical School Mandatory Department Account 3,189) Payable to New Jersey Medical School Deans’ Fund 7,116) Payable to Voluntary Department Account 2,048) Payable to Voluntary Division Account 1,922) Payable to Voluntary Group Account 90) Payable to Voluntary Inter-Departmental Account (4) Payable to Voluntary Practice Group Account 7,127)
Total Current Liabilities 22,057) Payable to Voluntary Practice Group Account 14,254)
Total Liabilities $36,311) Lease Commitments UPA originally leased 47,500 square feet of rental space located in the Doctor’s Office Center in Newark, New Jersey from UMDNJ. UMDNJ and UPA entered into a lease dated May 7, 2001, with four subsequent addendums to extend the terms of the lease. The fourth addendum effective January 1, 2006 has extended to lease to December 31, 2006 under the same terms and conditions set forth in the May 7, 2001 lease, which is subject to renewal. Effective July 1, 2013, the lease agreement between UPA and UMDNJ was amended to state that, as of that date, the parties to the Lease Agreement are Rutgers University and UPA. Total rental expense in fiscal year 2015 was $1.8 million.
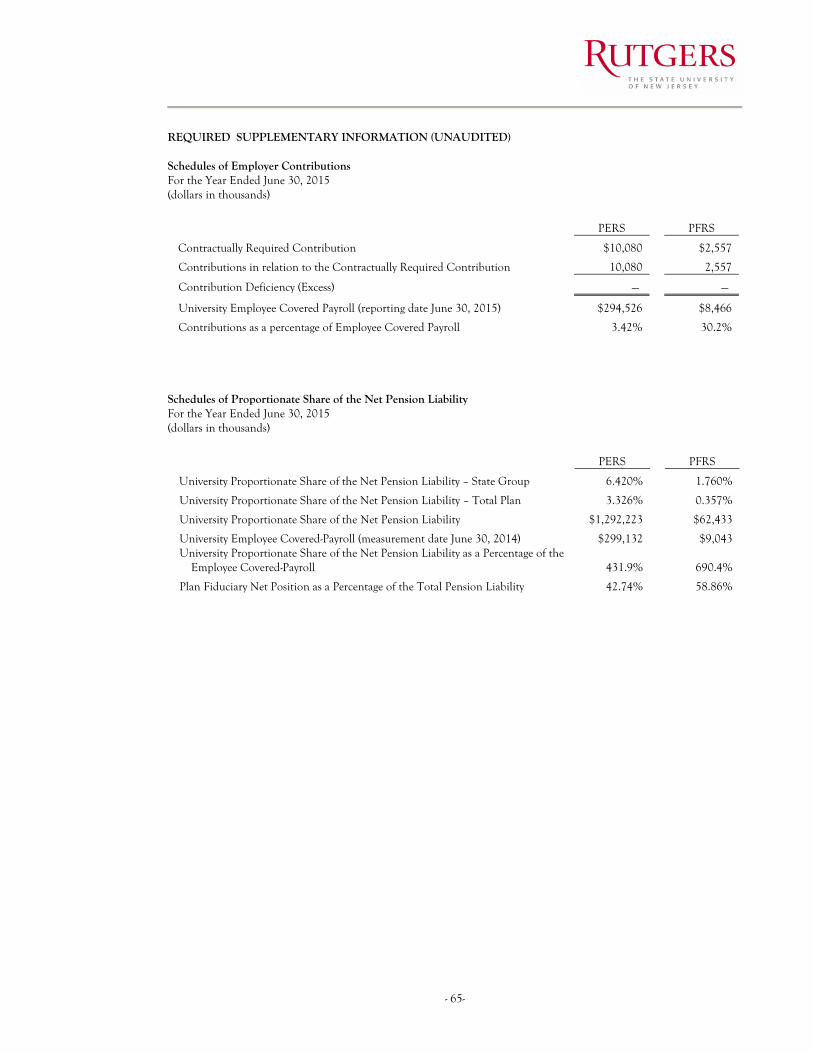
- 65-
REQUIRED SUPPLEMENTARY INFORMATION (UNAUDITED) Schedules of Employer Contributions For the Year Ended June 30, 2015 (dollars in thousands)
PERS
PFRS
Contractually Required Contribution $10,080
$2,557
Contributions in relation to the Contractually Required Contribution 10,080
2,557
Contribution Deficiency (Excess) —)
—)
University Employee Covered Payroll (reporting date June 30, 2015) $294,526 $8,466
Contributions as a percentage of Employee Covered Payroll 3.42%
30.2% Schedules of Proportionate Share of the Net Pension Liability For the Year Ended June 30, 2015 (dollars in thousands)
PERS
PFRS
University Proportionate Share of the Net Pension Liability – State Group 6.420%
1.760%
University Proportionate Share of the Net Pension Liability – Total Plan 3.326% 0.357%
University Proportionate Share of the Net Pension Liability $1,292,223
$62,433
University Employee Covered-Payroll (measurement date June 30, 2014) $299,132
$9,043 University Proportionate Share of the Net Pension Liability as a Percentage of the
Employee Covered-Payroll 431.9% 690.4%
Plan Fiduciary Net Position as a Percentage of the Total Pension Liability 42.74%
58.86%
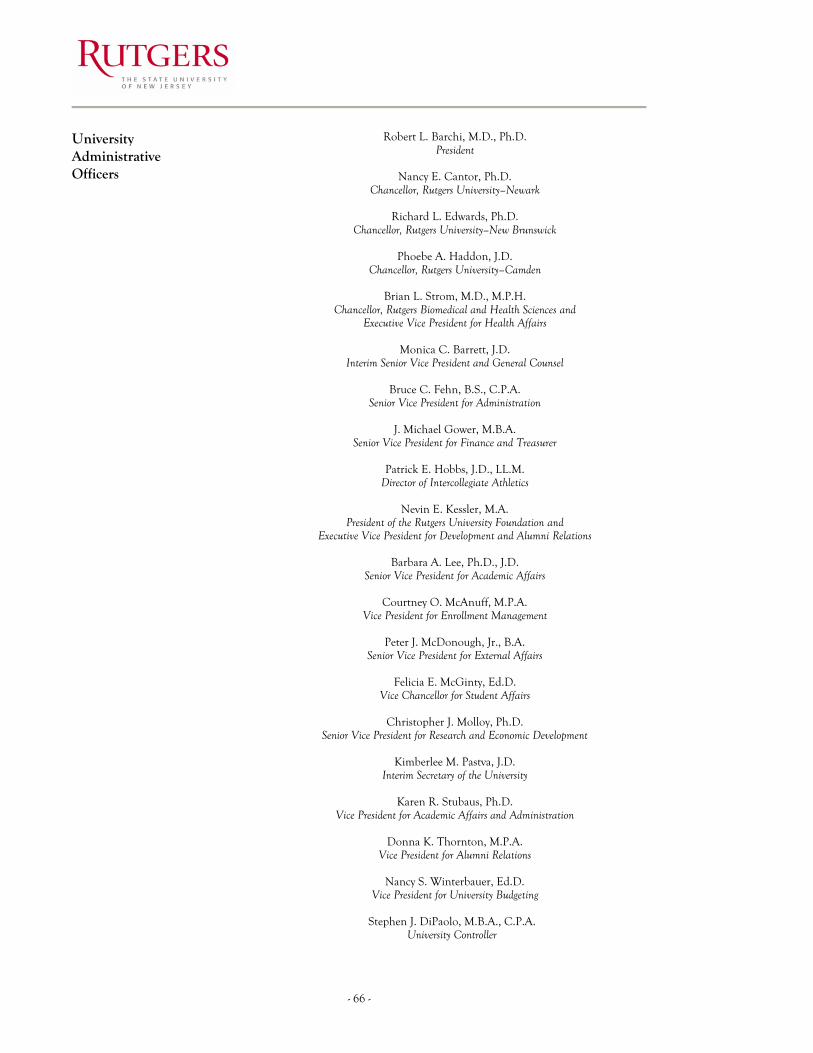
- 66 -
University Administrative Officers
Robert L. Barchi, M.D., Ph.D. President
Nancy E. Cantor, Ph.D.
Chancellor, Rutgers University–Newark
Richard L. Edwards, Ph.D. Chancellor, Rutgers University–New Brunswick
Phoebe A. Haddon, J.D.
Chancellor, Rutgers University–Camden
Brian L. Strom, M.D., M.P.H. Chancellor, Rutgers Biomedical and Health Sciences and
Executive Vice President for Health Affairs
Monica C. Barrett, J.D. Interim Senior Vice President and General Counsel
Bruce C. Fehn, B.S., C.P.A.
Senior Vice President for Administration
J. Michael Gower, M.B.A. Senior Vice President for Finance and Treasurer
Patrick E. Hobbs, J.D., LL.M.
Director of Intercollegiate Athletics
Nevin E. Kessler, M.A. President of the Rutgers University Foundation and
Executive Vice President for Development and Alumni Relations
Barbara A. Lee, Ph.D., J.D. Senior Vice President for Academic Affairs
Courtney O. McAnuff, M.P.A.
Vice President for Enrollment Management
Peter J. McDonough, Jr., B.A. Senior Vice President for External Affairs
Felicia E. McGinty, Ed.D.
Vice Chancellor for Student Affairs
Christopher J. Molloy, Ph.D. Senior Vice President for Research and Economic Development
Kimberlee M. Pastva, J.D.
Interim Secretary of the University
Karen R. Stubaus, Ph.D. Vice President for Academic Affairs and Administration
Donna K. Thornton, M.P.A.
Vice President for Alumni Relations
Nancy S. Winterbauer, Ed.D. Vice President for University Budgeting
Stephen J. DiPaolo, M.B.A., C.P.A.
University Controller