Embed Size (px)
Citation preview

FINANCIAL REFORMS AND THE DECOMPOSITION OF ECONOMIC GROWTH: AN INVESTIGATION OF THE CHANGING ROLE OF
THE FINANCIAL SECTOR IN TURKEY
by
Öner Günçavdı* and Suat Küçükçifçi Faculty of Management and
Technology and Economic Development Research Centre (TEDRC) Istanbul Technical University
80680 Maçka – Istanbul, Turkey
13 August 2002
Abstract
Turkey undertook a far-reaching structural adjustment programme in 1980. As an integral element of this programme, financial liberalisation aimed at increasing domestic savings and directing them efficiently towards financing investment projects, which will be likely to have positive impacts on economic growth. After 20 years the performance of these reforms in financial markets is still a matter of concern among academics. The aim of this paper is to examine the role of the financial sector in the whole economy and to assess the sources of gross output of the sector. By doing that we are able to connect financial reforms with different source of growth, and analyse the impacts of reforms on the production of financial services in the pre- and pro-liberalisation periods. To accomplish this aim, we introduce a new methodology, which is based upon the Leontief’s input-output models. The results imply that the production sector of the Turkish economy has increasingly become independent from the use of financial service produced by the banking and insurance sector particularly in the post-reform period. JEL Classification : D57, F14, O16, R15 Key Words : Financial reforms, economic growth, input-outputs, Turkey
* Corresponding to Öner Günçavdı, Istanbul Technical University, Faculty of Management, Department of Management Engineering, Spor cd. No. 2, 80680 Maçka – Istanbul; Fax: +212-240 72 60; email: [email protected]. Authors are Associate Professor and Assistant Professor respectively.

2
I INTRODUCTION The Turkish economy has undergone intense waves of economic problems since
the mid-1990, but particularly since the beginning of 2000, when the exchange-
rate-based disinflation programme was interrupted by two successive financial
crises (see Akyüz and Boratav, 2002 and Uygur, 2001). The crises manifested
themselves by overvalued domestic currency, unsustainable trade deficits and
massive capital outflows as a result, and led the country to facing the severest
economic crisis in her history. The financial sector has mainly been considered,
by many experts, as responsible for these crisis because of its shallow and fragile
structure together with a weak prudential regulation on the banking sector, and
because it was not adequate for handling a large surge of financial capital in- and
out-flows (e.g. see Yeldan, 2001). However, in the beginning of the 1980s when
the government of the time launched financial reforms, the expectation was to
create a more efficient and flexible financial system, capable of directing domestic
savings to the use of the productive sectors at the lowest cost, and in turn
generating economic growth (see, Cizre-Sakallıoğlu and Yeldan, 2000; Arıcanlı
and Rodrik, 1990; Celasun and Rodrik, 1989). After nearly 20 years of
experience with financially deregulated markets, the Turkish financial sector still
appears to raise some concerns, as generating either economic crises or output
growth, about its direct/indirect contributions to the Turkish economy.
Some studies in the Turkish literature have evaluated the performance of
financial liberalisation (Akyüz, 1990, Ritenberg, 1991, Chhibber and van
Wijnbergen, 1992, Uygur, 1993, Atiyas et al., 1993, Günçavdı et al., 1999, 1998
and Günçavdı and Küçükçifçi, 2001). Akyüz (1990), for example, shows that the
financial reforms were not accompanied by any significant change in the
financing behaviour of the corporations and did not lead to a cheap cost of
investment. Regarding the impact of financial liberalisation on investment,
Günçavdı et al. (1998) and (1999) argue that the Turkish economy has benefited
from the reform policies in the long run by relaxing credit constraints. Earlier
studies (Ritenberg, 1991, Chhibber and van Wijnbergen, 1992, Uygur, 1993) have
also found similar results. Atiyas et al. (1993), on the other hand, report that
although financial liberalisation was successful in eliminating exogenous

3
constraints created by interest rate controls, credit constraints still operate in the
banking sector, basically because of asymmetric information and the agency cost
problem. A recent study by Günçavdı and Küçükçifçi (2002) has revealed that
despite common neoclassical expectations (Fry, 1989; McKinnon, 1974 and
Shaw, 1974), the interdependence between the financial sector and the rest of the
economy has drastically weakened, and the financial sector lost its importance, as
producing financial service inputs for the production of the other sectors in the
post-liberalisation period. Compared with the pre-liberalisation period,
productive sectors (such as agriculture, manufacturing and non-financial services)
in the economy have begun to demand less financial inputs from the financial
sector mainly because of less funds available for their uses and because the cost of
uses of financial services is very high. In support of these evidence, Cizre-
Sakallıoğlu and Yeldan (2000) also report that innovations in the increasingly
unregulated Turkish financial market helped the public sector in the end meeting
its fiscal requirements. Consequently the public sector debt instruments
dominated the financial markets and constituted the main source of output growth
in the financial sector.
Many research on the Turkish liberalisation policies have mainly
investigated changes in the legislative and institutional framework created by the
reform programme and their impacts largely on the supply of financial service
output. A few studies, so far, have attempted to examine the factors affecting
demand for financial service output. Of course, the availability of financial funds
is undeniably crucial for economic activities (see Demetriades and Luintel, 2001,
Benhabib and Spiegel, 2000, King and Levine, 1993). However any financial
reform cannot be regarded as successful unless the availability of funds increased
by the reform are used for productive purposes. This paper hence attempts to
examine the sources of demand for financial service output and their changing
importance in the economy along with economic reforms. In doing so, we
introduce a new method of analysis that has not so far been used in the literature
to examine the financial sector. This method benefits largely from input-output
tables and a useful decomposition of the standard input-output model (see

4
Bulmer-Thomas, 1982).1 The approach identifies the output and factor use
required economy-wide to produce the final output for each destination (e.g.
domestic consumption and exports) and from each sector. By giving the central
role to inter-sectoral linkages covering entire economy it captures the transmission
effects on sources of output.
Following this introductory section, the remainder of the paper is
organised as follows. Section II presents a general account of main developments
in the Turkish economy and financial policies before and after the financial
liberalisation in Turkey. We then present the methodology and the model used in
the paper in Section III. Section IV includes empirical results derived from the
application of the methodology developed in the previous section. A short
summary and concluding remarks are included in Section V.
II ECONOMIC BACKROUND AND FINANCIAL REFORMS IN TURKEY
Turkey began to deregulate her financial markets in 1980 (see Celasun and
Rodrik, 1989 and Atiyas and Ersel, 1995). In the period of the pre-deregulation,
Turkish financial markets were considered as financially repressed, with different
public involvements in the financial markets in the forms of fixing interest rate
and exchange rates, heavy tax burden on financial earnings, high liquidity and
reserve requirement ratios, preferential credit allocation, limiting the entry to the
Turkish financial market etc. (see Fry, 1979). Low and fix interest rates and high
inflation, created mainly by expansionary fiscal policies, led to negative real
interest rates and discouraged households to deposit their savings in the formal
banking sector. The low levels of domestic savings and in turn loanable funds in
the banking sector, resulted from fixed interest rates, encouraged Turkish banks to
develop a rationing mechanism in allocating loans among alternative demanders
in a way of minimising the default risk of their loans. Ambitiously high levels of
targeted economic growth rates and insufficiency of domestic savings to finance
1 Input-output methodology was very popular in the 1970s, and partly in the 1980, to do sectoral analysis investigating structural changes in mostly agriculture and manufacturing sectors, but not for the financial sector. However increasing importance of the financial sector, that is expected to

5
these rates inevitably resulted in increases in the dependence on foreign savings of
the economy. However, particularly in an inhospitable international economic
environment of the late 1970s, foreign borrowing of the country became
increasingly difficult, causing macroeconomic imbalances. In the period 1979-
1980, Turkey finally experienced severe economic crises, which inevitably paved
the way for changing the industrialisation strategy drastically from import
substitution to outward orientation.
In January 1980, Turkey undertook a very comprehensive and far-reaching
structural adjustment programme. The structural aspect of the programme was
first to solve Turkey’s internal and external disequilibrium problems, and to
reduce the stringency of economic constraints imposed by this disequilibrium
(Arıcanlı and Rodrik, 1990; Nas and Odekon, 1992). The initial steps of the
programme in this respect involved trade and financial reforms. On the trade side,
the determination of foreign exchange rates was liberalised, all quantitative
controls on imports, such as quota and licensing system, were removed (Baysan
and Blitzer, 1990). Various measures, such as tax rebates and subsidised credit,
were implemented to promote export earnings. An improvement in the balance of
payments was of great importance to the government in this period to gain
creditworthiness that was needed to attract international financial funds from the
IMF and the World Bank.
Recognising the role of finance for growth in a financially repressed
economy (see Demetriades and Luintel, 2001, Benhabib and Spiegel, 200, King
and Levine, 1993), financial liberalisation became very much part of a package of
policy reforms, which initially succeeded in restoring growth and significantly
increased the openness of the economy. The reform initially aimed at eliminating
exogenous financial constraints, which had been created mainly by intensive
government interventions and administratively controlled interest rates (see Atiyas
and Ersel, 1995, Akyüz, 1990 for detailed survey of the issue). First, interest rates
were freed, allowing real interest rates to become positive in the pro-liberalisation
period. New financial institutions, such as the Istanbul Stock Exchange and the
constitute a channel between savings (domestic and foreign) and production, in the Turkish economy pays the way for similar research.

6
Capital Market Board, were introduced in order to improve the allocation of
financial resources through more efficiently operating financial markets, and to
reduce the reliance of the corporate sector on internal finance and bank credit.
The restriction on the entry into the Turkish financial market by foreign banks
was removed, then the number of foreign banks operating in Turkey, as a result,
reached 21 compared with 4 in the pre-liberalisation period (Esen, 2000).2 An
interbank money market was established in 1986. The Central Bank started open
market operations first time in 1987. Liberalisation of external capital account
finally took place with issuing Decree No. 32 in 1989 (see Ekinci, 2000). With
this decree, all controls on capital in- and out-flows were removed, and residences
(non-residences) were allowed to buy and sell foreign exchange (TL) and foreign
securities (Turkish securities). Turkish commercial banks were allowed to extend
foreign currency credit to foreign trade companies. With the application to the
IMF for full convertibility of the TL, this liberalisation episode was completed in
April 1990. The relaxation of capital controls was eventually used by the
government to attract international capital to Turkey to finance public sector
deficits, rather than private sector projects, and generated a rapid expansion of
replacement of the Turkish Lira by to foreign currencies (see Selçuk, 1994).3
2 The Turkish private and public banking sectors have gone through a considerable amount of adjustment in the post-liberalisation period. Since one of the aim of the liberalisation was to increase the efficiency and competition in the banking sector, which was dominated mainly by commercial banks. Zaim (1995) evaluated the improvement in the technical and allocative efficiencies (or inefficiencies) of the Turkish banking sector. Regarding inducement in the technical efficiency of the financial liberalisation the banking sector has increased the technical efficiency by 10 percent from 1981 to 1990. Also differences in technical efficiencies between banks have decreased over time. He reports that technically state-owned banks appear to be more efficient compared to the private banking sector. The gap between the public and private sector banks decreased due to increased competition in the overall banking sector. However the public sector banks show efficiencies because of irrational credit allocation. Another empirical study of Işık and Hassan (2002) covering the period of 19888-1996, indicates that “…cost and profit efficiencies of the Turkish banks are 72 and 83 percent respectively, implying that on average, about 40 percent of the bank resources and about 20 percent of the potential bank profits are wasted during the production of banking services.” (Işık and Hassan, 2002, p. 761). The empirical findings of Aydoğan (1993), on the other hand, pointed out that the Turkish banks have market power in the deposit market and financial liberalisation was not successful to achieve a competitive banking sector. Aydoğan’s result was supported by the positive effects of inflation and excess demand for loan in the determination of the spread. 3 Currency substitution became more evident in 1991 with the 7.2 percent share of foreign exchange deposits in GNP from 1.2 percent in 1984. This is particularly important for the government because demand for reserve money establishes a base for seigniorage revenue of the public sector, and exhibits a decreasing pattern over the period between 1984 and 1991. Rodrik

7
(Table 1 and Figure 1 about here)
The primary aim of financial reforms was to fill the resource gaps between
investment and savings by increasing the availability of financial securities in the
economy, and hence to allowed the country to reach high economic growth rates.
The overall growth performance of the economy was quite remarkable over the
reform period between 1983 and 1993. Following an annual average growth rate
of 1.3 per cent per annum over the period of 1977-1980, the economy grew at an
average annual rate of nearly 5 per cent until 1994. The share of exports in GDP
rose to approximately 8 per cent in 1981-1983 from 3.3 per cent in the period
1977-80, while the share of imports also rose to nearly 14 per cent in the 1981-83
period from 9 per cent in the 1977-1980 period. Table 1 also reveals that foreign
trade balance improve in the period of 1984-1988, with 12 percent share of
exports in GDP as imports was only16 percent of GDP. However just before the
financial crises broke in 1994, trade balance had begun to deteriate and the gap
between exports and imports had widened again for the period of 1989-1993. The
resource gap between saving and investment, as a share of GDP, declined from
5.2 per cent in the 1977-80 period, first to 1.2 percent in 1981-1983, and then to
0.6 per cent in 1984-1988 (SPO, 1998).
One sign of the vulnerability of Turkish macroeconomic balances in the
pre-reform period was continuously increasing public sector borrowing
requirment (PSBR). Fiscal imbalances, measured by the ratio of PSBR to GDP,
inreased from 4 percent in early 1980 to 9 percent in the period of 1989-1993, and
led the public sector to competing for the financial funds available in the economy
with the private sector. Figure 1 shows the amount of financial funds, measured
by the ratio of total financial assets available in the economy to GNP, which
appears to have increased substaintially after 1980. This can be attributed to
financial deepining and output growth in the Turkish financial sector in the pre-
reform period. Figure 1 also indicates that the public sector securities are mainly
(1991) accordingly indicates that 1.5-3 percent of GNP was generally used to have been financed public sector deficits through revenue from money creation (or seigniorage) and inflation taxes in Turkey. Therefore declines in the demand for reserve money restricted the possible use of seigniorage as a mean of financing fiscal deficits.

8
responsible for this dramatic shift in the total amount of financial assets in the
market, particularly after 1993.
As far as capital account is concerned, the main feature of the post-
liberalisation period was a gradual shift in the sources of foreign capital. In the
early year of the reform, finance capital was provided largely by multilateral
international organisations, such as the World Bank and IMF,4 and bilaterial
creditors. Begining in 1987, and mostly after the announcement of convertibility
of TL in 1989, Turkey eventually found a number of new financing opportunities
in international capital markets, and finally in December 1988 entered the
Eurodollar market for the first time in several years (see Ersen, 2000). The
reliance on private financial funds, since then, has exhibited increasingly crucial
roles in credit expansions in the economy in the 1990s.
An important aspect of the financial reforms in the 1980s was to increase
the availability of financial funds and accordingly to design institutional
environment. As stated above, the Turkish financial liberalisation throughout the
1980s, to some extent, reduced the strincency of financial constraints on economic
activities, and increased the availability of funds. However the use of these funds
have been influenced by other macroeconomic developments, most importantly
by public sector behaviour, in the economy. In order to assess whether the
Turkish financial reform has had sustainably positive contributions to entire
economic growrth of the country, it is necessary to examine the sources of output
growth. Changing role of the financial services, as an intermediate input, in the
production of other sector can constitutes a good indication regarding how
important each sector is for the economy. These changes in growth can then be
attributed to the following factors:
The first factor for output gains and/or losses can be considered as import
penetration in the Turkish economy after the trade and financial reforms. Trade
reforms ease the flow of goods while capital account liberalisation allows
residences, as well as non-residences, to transfer capital across borders freely.
4 Between 1980 and 1984, the World Bank granted Turkey five one-year structural adjustment loans (SALs), amounting $1.6 billion. They were all used in supporting policy reforms proposed by the adjustment programme (see Kirkpatrick and Öniş, 1991).

9
Increased import competition in a particular sector after trade and capital account
liberalisation, for example, causes the domestic production to loss market share
with a decline in its output level.
The contracting-out effect can be considered as the second reform-related
causes for changing in output growth. Deregulation in markets, along with other
measures of reforms, increases the weights of the market mechanism for the
efficient allocations of economic resources. Deregulation in financial markets, for
example, is expected to encourage firms to rely increasingly on specialised
suppliers, such as banks and equity market, instead of producing their own
financial. This contracting-out behaviour, of course, creates extra demand for the
production of other sectors and positively contributes to the overall economic
growth of the country. Financial development achieved by liberalisation in this
sense is expected to make the other sectors to obtain financial inputs easily, and to
create even more demand for financial sector output. Financial innovations that
financial liberalisation brings about can be considered as a stimuli to create
additional demand for sectoral financial output.
Import substitution in final and intermediate good demand (indicating a
rise in the home share in the demand for final and intermediate goods) could be
another source for output gains, and can be named here as the import-substitution
effect. Capital account liberalisation, for example, could lead to import
penetration by foreign financial organisations and hence to a drop in financial
output.
In the following section we present an empirical framework to show these
compositional structural changes in output growth in the financial sector.
III METHODOLOGY
In this section we introduce the accounting approach to the analysis of patterns of
economic growth pioneered by Chenery et al. (1962) using input-output
framework (also see Gregory et al., 2001; Albala-Bertrand, 1999; Schumann,
1990 and Chenery et al., 1986). We then apply this framework to the Turkish
input-output tables in order to investigate the source of economic growth in the
financial sector. Input-output models are based on some restrictive assumptions
10
of fixed input-output coefficients with constant returns to scale, fixed factor shares
in production and perfectly elastic supplies of factors of production (see Bulmer-
Thomas, 1982). The Leontief production function is often criticised for its
assumption of fixed coefficients in input use. Since we utilise input-output tables
observed at two separate dates we obtain direct measures of the change in input
use over time. Therefore, the only necessary assumption on the production
function is constant returns to scale across all inputs at each point in time. In a
standard input-output framework the flows of all goods in an economy with n
industries can be written as follows:
( ) ( )efAIx +−= −1 (1)
where I and A respectively are the unit matrix and the matrix of input-output
coefficients, whose element aij represents the unit-input requirement of the jth
industry for the output of the ith industry, all with ( )nn × dimension. x is the
column vector of sectoral production, with ( )1×n dimension. f and e,
respectively, are the vectors of total final demand and exports, both with ( )1×n
dimension.
The balance equation for the flow of domestic output can be written as
follows:
efwx d ++= d (2)
where fd: the vector of flows of domestic final use; wd: the vector of flows to
domestic intermediate use, which is given by:
xAw dd = (3)
Upon substituting (3) into (2),
efxAx d ++= d (4)
Imports are included in this framework by assuming that imported goods for
intermediate and final uses are in fixed proportion of total. In other words,
hAA =d and sff =d (5)
11
where A: the matrix of input-output coefficients, h: domestic supply ratio in
intermediate uses, s: domestic supply ratio in final uses. Substituting (4) into (3)
renders the following:
esfhAxx ++= (6)
Solving (6) with respect to x gives
( ) ( )esfhAIx +−= −1 (7)
This relationship holds for any point in time, and differencing it with respect to
time and rearranging the resulting expression give us the change in gross output
between any two periods of time. This final expression allows us explicitly to see
the sources of these changes in gross output as follows:
AxRhhAxReRfRssfRx ∆+∆+∆+∆+∆=∆ (8)
where ∆ denotes the change over time; ( ) 1−−= hAIR is the Leontief inverse
matrix. The level terms in equation (5) can be evaluated as beginning and end
values, which are similar to Paasche and Laspeyres index weighting. The
derivation of the formula for either use is analogous (see Günçavdı and
Küçükçifçi, 2001), and yields the following two results for Paasche and
Laspeyres index weighting respectively:5
00100111101 AxhRxhAReRfsRsfRx ∆+∆+∆+∆+∆=∆ (9a) 10011000010 AxhRxhAReRfsRsfRx ∆+∆+∆+∆+∆=∆ (9b)
where the subscript 0 and 1 represent the initial and terminal years respectively.
Equation (9) allocates the change in gross output among changes in the various
components of its use: the changes in domestic final demand (∆f); the changes in
exports (∆e); the changes in the home shares in final consumption (import
substitution in final demand) (∆s); and the changes in the home shares in
intermediate goods (import substitution in intermediate goods) (∆h). The term ∆A
explicitly allows the input-use coefficients to vary over time in a way that will be
determined by the data.. These changes in Leontief coefficients are interpreted as
5 The formal derivation in detail is available in Appendix A.

12
technical changes in the production. In what follows, equation (9) is then applied
to the data of the Turkish economy.
IV EVALUATING THE EMPIRICAL RESULTS
The aim of this section is to examine the macroeconomic sources of changes in
the production of the financial sector6 before and after the liberalisation of
financial markets, and to relate the changes in the sources of financial output
productions to macroeconomic policies. Our main expectations regarding the
impacts of financial reforms are to see upon the availability of financial funds in
the economy. We expect that the financial reform increases the funds available for
the use of other sectors and stimulates the production of the financial sectors in
the economy. According to neoclassical expectation, increases in the availability
of financial funds relax the stringency of financial constraints in the supply side of
the economy and contribute the overall growth performance of the economy
positively.
We employ mainly four available input-output tables, which reflect the
different structures of the Turkish economy before and after the financial reforms.
The first table is for 1973, a period of the pre-liberalisation. The second one is for
1985, which is used to examine the immediate impacts of early liberalisation
episode. The third one is the table for 1990, which is the first table after the
implementation of convertibility of Turkish Lira. Finally the last one has recently
published for 1996, which can be used to examine the effects of capital account
liberalisation. Although another table is available for the pre-liberalisation period
for 1979, the results based on this table lacks credibility because this year was a
year of foreign exchange shortage, which caused various constraints on the supply
side of the economy (e.g. see Bilginsoy, 1993).
An investigate influences of financial reforms on the sources of output in
the financial sectors requires an intertemporal comparisons of the sources of
6 In the formal input-output tables of Turkey, there is only one entity regarding the financial sector, which compromise banking and insurance sector. However the importance of insurance sector in the Turkish economy is very small, the figure for this entity can be interpreted as reflecting mainly production relationship of the banking sector with the rest of the economy. From now on, this sector is named as the financial sector.
13
outputs in the Turkish economy. This comparison however necessitates handling
changes in price levels, particularly in a highly inflationary country such as
Turkey. The price adjustment procedure is introduced in Appendix B just to keep
the discussions in this section as simple as possible (see also Günlük-Şenesen and
Küçükçifçi, 1994). The first three input-output tables include 64 sub-sectors while
the recent one contains 97 sectors. Nevertheless we must first aggregate them to
24 sub-sectors because price indices, which are required to produce the real
values, are only available at this aggregation level. However, we further reduce
the number of sectors to 5 merely to see the influence of reforms on the economy
clearly.7 These main sectors are namely agriculture, mining, manufacturing, non-
financial services and financial services. The price indices for manufacturing are
wholesale price indices for services compiled from the Sate Institute of Statistics
(SIS) for 1990. The price indices for services are implicit GNP deflator computed
from SIS data. All index values are, however, adjusted to the based year 1973 for
our purpose.8
Results
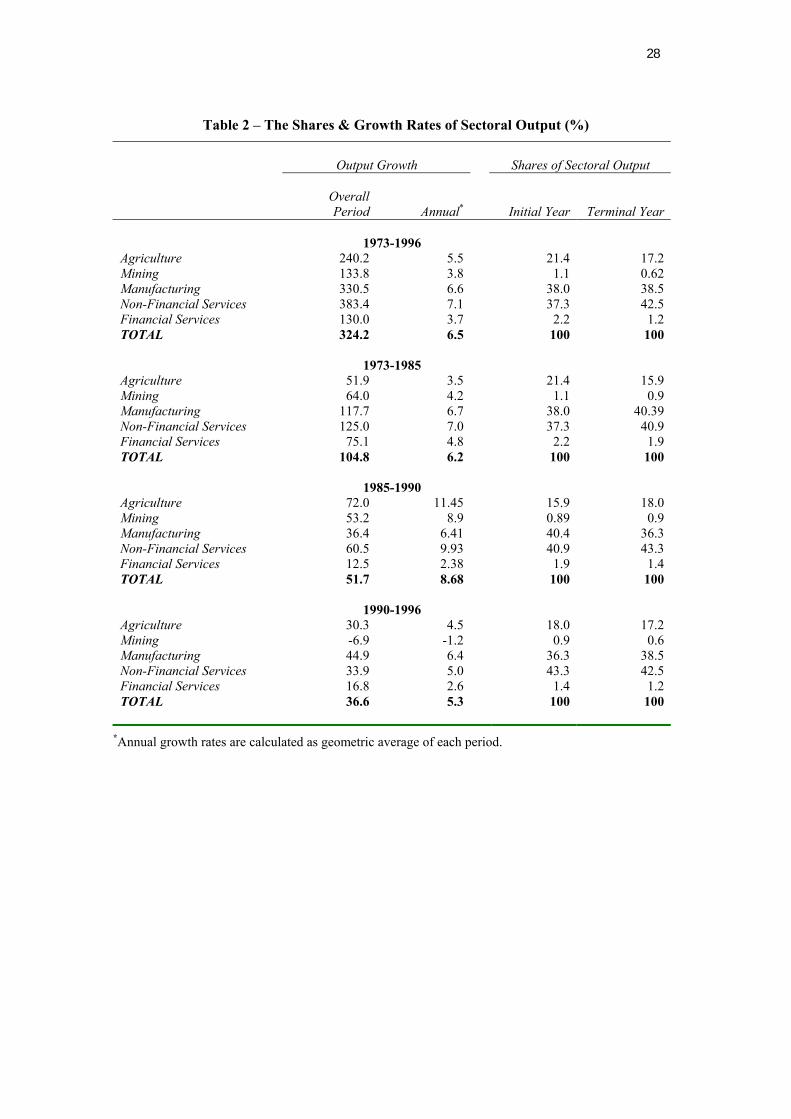
Overall Economy Table 2 shows the total and sectoral growth rates and the shares of sectoral
outputs. Over the 24 year of period between 1973 and 1996, the economy seems
to grow almost 324 percent with, on average, about 7 percent growth rate per
annum.9 The striking feature of the growth rates over the sub-periods is that the
economy grew more rapid per annum in the period of 1985-1990 than other
7 Αggregation for 24 sectors are presented in Appendix C. 8 According to the State Institute of Statistics (SIS), the price level for the financial sector for a certain year is derived through dividing the nominal value of the sectoral output level for this particular year by the nominal value of the sectoral output calculated for a given base year. The SIS, however, is not able to measure the value of the sectoral output in the Turkish financial sector directly. Instead, it relies, in the calculation, on a very restrictive assumption that the financial sector output grows at the same rate as employment (SIS, 1994). This method, naturally, arises some concerns. The method ignores the effects on output growth of labour-saving technical improvement. In particular the finance sector has achieved continuously to increase technological efficiency, which has brought about reductions in employment (or no change). In such cases where employment is stagnant or decreasing after output technological improvement, the sectoral output level will wrongly calculated as stagnant or decreasing according the method used by the SIS. However, despite this defect, the output level calculated by the SIS is the only available data for the financial sector in Turkey. 9 Annual growth rates are calculated as geometric average of each corresponding period.

14
periods. In the period of 1973-1985 covering the initial episode of structural
adjustment, this rate is 6 percent while it is only 5 percent in the period of capital
account liberalisation.
The financial sector, on the other hand, appear to have performed very
well in the first sub- period of 1973-1985 with almost 5 percent average output
growth rate per annum. However, this performance seems eventually to have
diminished in the following two periods and reached around 2.5 percent.
Although it plays an important role in the formation of current crises, the share of
the financial sector output level noticeably very small, and this share appeared to
have declined over time.
(Table 2 about here)
To assess the reason behind these changes in the gross output growth we
examine the determinants of total and sectoral output growth by applying equation
(9) to the Turkish data. The results based on two different weighting are reported
in Table 3a and Table 3b. Each table consists of four different panels, which
present the sources of output growths in five main sectors as well as the overall
economy. Among them, the first panel includes overall changes in the output
growth from 1973 to 1996, which help us assessing the change in the engines of
output growth over a whole period. The second one is reported to show the
effects of financial reforms in the early 1980s. The effects of external account
liberalisation and expansion in the volume of domestic credit on the financial as
well as other sectors can be seen in the third and fourth panels. Another important
observation from these tables is that although the calculated values are different,
the chose of different weighting does not cause any changes in our qualitative
interpretations.
(Table 3a and Table 3b about here)
The figures in Table 3a are the percentage shares of each source in the
total output growth. In an overall assessment of the whole period of 1973-1996,
final demand10 appears to be accounted for almost 79 percent of total changes in
aggregate output, while another demand component, exports, explains nearly 20

15
percent of total output growth. Import substitution in final demand is responsible
only for the 2 percent of total changes in output, as import penetration in
intermediate goods causes only a 1 percent reduction. With these figures, it seems
that the great extent of changes in total output growth is originated from final
domestic demand and exports in the Turkish economy. Surprisingly, change in
technology, which one expects to happen in such a long period, provides only 0.1
percent of total output growth in Turkey.
In the first sub-period of 1973-1985 final demand appears to be the leading
source of the output growth with the almost 77 percent shares. When another
component of final demand, exports, was considered, the final demand explains
91 percent of total changes in output over the period of 1973-1985. It is also clear
in the table that contribution of export demand to overall output growth in this
period is 24 percent, which was the highest value that the Turkish economy had
performed so far. This high performance of exports was achieved mainly through
export promotion policies in the early 1980s. One crucial factor that could be
regarded as important as incentive structure, created by these polices, was the
presence of under-utilised-production capacity that had been created in he 1970s,
but had not been used because of foreign exchange shortages (see Bilginsoy,
1993).
The share of import substitution in final demand appears to be very
limited, but positive with 1.3 percent in total output growth. The figure in Table
(3a) importantly shows that the pace of import substitution in intermediate goods
seems to be very slow, which resulted in 0.6 percent reduction in output growth.
This finding is, however, not surprising because trade liberalisation is expected to
encourage imports of intermediate goods rather than producing them domestically
in the early liberalisation period.
Technological changes in the production structure of the economy that
appeared to happen over the period of 1973-1985 were against the domestic
production. From the figures in the table, technological changes reduced overall
growth rates by 1.7 percent. This result can also be read as domestic economy
had eventually increased its dependence level of production on foreign goods.
10 Final demand here includes domestic consumption, investment and government expenditure.

16
The period of 1985-1990 was marked with capital account liberalisation
and huge capital inflow to Turkey. While final demand continued to be the main
leading stimuli for output growth exports lost its earlier pace in this period. This
slowdown drastically reduced the contribution of exports from 24 percent in the
earlier period to 3 percent in the 1985-1990 period. However, import substitution
in final demand accelerated in this period and became responsible for the 10
percent of overall output growth. This is clear evidence that imported final goods
had been replaced by domestic production. On the other hand the economy
continued to import intermediate goods which accounted for 3.1 percent decline in
growth. Changes in technology of production seem to have shifted toward the one
requiring more domestically produced goods, which explains almost 13 percent of
output growth in the period.
In the 1990-1996 period final demand and exports explain more than 100
percent of gross output growth. Surprisingly exports possess the highest influence
on output growth, with 32 percent, in this period when export promotion policies
have central importance and TL overvalued time to time. As import substitution
lost its pace compared with the earlier period, output loss created by changes in
technology became responsible for almost 15 percent decline in gross output
growth.
In sum, final demand and exports generally appear to be two leading
forces behind output growth in the Turkish economy. Import substitution seems
not to have been crucial factors in period of time in Turkey, particularly in the
period of 1973-1985 in which the import substitution industrialisation strategy
was considered as the engine of output growth until 1980.
Financial Sector
Decomposition of the changes (Table 3a and 3b) reveals that over the whole
period, rising domestic final demand, exports and rising home share in the final
demand (i.e. import substitution in final demand) were positive influences for
output growth, and import penetration in intermediate goods and changing
Leontief coefficients were negative influence in the financial sector. Final
demand made the largest contribution to the growth of gross output in the

17
financial service with the share of more than 100 percent. Exports boom seems
to have the second important positive contribution to financial output growth with
almost 24 percent. The extra output generated by rising home share in final
demand, on the other hand, was broadly cancelled out by the loss of import
penetration in intermediate goods. In particular import substitution in final
demand explains only 2 percent of output growth as import penetration in
intermediate goods appears to be responsible only 1.3 percent decline in output
growth. Interestingly technological changes measured by changes in Leontief
coefficients in this period accounted for 41 percent decline in total output growth.
High cost of borrowing and instability in financial markets in the post-
liberalisation period can be considered as the discouraging factors for the other
sector demanding financial sector output.
There are some sharp differences between the periods underlined by
different economic policies. When we examine the entire period closely, the
period of 1973-1985 includes the influence of the early episode of liberalisation,
in which deregulation in financial markets along with other commodity markets
and trade reforms took place. During the period of 1981-1983 for example,
inflation was moderately high with almost 57 percent rate, despite a mild drop
from 62 percent in the earlier period of 1977-80. Real exchange rate depreciated
almost 12 percent in the same period, which must have influenced the domestic
productions negatively, particularly, in the sectors with high imported input
dependence. Liberalisation efforts together with real depreciation of Turkish Lira
also influenced the export performance of the country with almost 8 percent of
GDP in the period of 1981-1983, while imports share in GDP jumped from about
9 percent in the period of 1977-1980 to 14 percent. Real interest rates as a simple
indication of cost of financial services, were positive and very high in the post-
liberalisation period.
During the first sub-period of 1973-1985, almost 93 percent of sectoral
output growth in the financial sector is provided by the final demand while
approximately 33 percent arose from export booms which took place in the first
years of the liberalisation period. Despite the sharp increase in the share of
aggregate imports in GDP, the share of home goods in final demand appears to
18
have slightly increased financial sector output by 1.5 percent, while import
penetration in intermediate goods declined only 1 percent. This stands out as the
fact that rising imports in this period has caused, albeit general expectations, no
output losses and deindustrialisation in the financial sector. Results in the table
reveal the role of inter-industry demands for financial services. Despite the
introduction of new and expending financial services in the early liberalisation
period, inter-industry demand for financial services seems to have decreased by
almost 26 percent, as other sectors lowered the financing and insurance
components of their products.
The second sub-period of 1985-1990 was marked by capital account
liberalisation and policy reversals in some reforms (see Yentürk, 2002 and
Yentürk and Ülengin, 2001). The most striking feature of this period is the output
growth rate of the finance sector, 12.5 percent, which appears to be the lowest
compared with other periods. While inflation soared about 50 percent, domestic
currency lost its competitive position and started being over valued. Table 1
shows that domestic currency overvalued by 0.67 percent in the period of 1984-
1988 and 6.45 percent in the period of 1989-93. As an immediate effect of this
movement in the value of TL, the share of exports in GDP declined from almost
12 percent in the 1984-88 period to 9 percent in the period of 1989-93. Together
with the decline in total exports in the economy, the contribution of export
demand to the sectoral output growth became negative with the 14 percent share.
The most striking feature of the period is that output gains by final demand in the
financial sector, 295 percent, were dramatically cancelled out by the loss of
changing Leontief coefficients, which was almost -198 percent. Some of the
decline in the growth of demand for financial services undoubtedly reflects that
firms in other sectors met their demand for financial services within firm,11 and
eventually became less and less independent from the service provided by the
11 Trade credits in this and the following periods were an important source of finance of the Turkish firms. Using a large data set of the Central Bank of Turkey, Özatay et al (1996) states that the rate of trade credit in total debt of a typical firm is 29 percent in 1991, 31 percent in 1992 and 33 percent in 1993. In a smaller data set, which includes firms registrated in Istanbul Stock Exchange, the ratio of short-term trade credit to total liabilities is 12 percent for the period of 1989-96 (Günçavdı et al, 1999). This research also shows that the 50 percent of total liabilities of the firms in the stock exchange was financed through internal finanacial sources in the same period.

19
financial sector. In particular Ersel and Öztürk (1993) enlighten this feature of the
Turkish corporate sector, and noted a noticeable decline in the share of bank loans
in the post liberalisation period. One reason for this might have mainly been high
and volatile interest rates in the post-liberalisation period. Increase public sector
demand for financial funds to finance the public deficits increased drastically in
this period. While, the ratio of public sector borrowing requirement to GDP in the
period of 1984-88 was about 5 percent, this ratio rose almost 80 percent and
reached 9 percent of GDP in the period of 1989-93. As this drastic change in the
demand for financial funds crowed out the private sector from the demand pool of
loans from the financial sector through restricting the availability of financial
funds for the use of the private sector, it also put increasing pressure on the cost of
borrowing from the formal financial market.
Rising home share in final demand appears to have accounted for 23
percent of the output growth. Import penetration in intermediate goods was, on
the other hand, still negative and around 7 percent.
The share of sectoral output in total in 1996 appear to decline to 1,19
percent from 1.4 percent in 1990. The sector grew from 1990 to 1993 almost by
17 percent which was still less than that of the early liberalisation period.
Estimates in the table show that almost 150 percent of this negligible growth rate
in financial service output was accounted for final demand. During this period
when the TL was substantially below its fundamental equilibrium exchange rate
for the most of this time period (see Table 1), export booms created an extra
demand for financial services by the amount of 62 percent, and import
substitution in final demand led to 2.5 percent of total financial sector output
growth.
Empirical results imply that final demand and exports particularly in the
last period seem to be two crucial deriving factors that provides financial output
growth in the banking and insurance sector. However, their positive effects are
mostly largely counterbalanced by the impact of decreasing financial service
inputs requirements per unit of gross output of the other sectors. This clearly
indicates that the use of financial output as input increasingly becomes negligible
20
in the domestic production. This however contradicts with the general
expectation from the financial reform.
V CONCLUSION
Turkey undertook a large scale structural adjustment programme with financial
reforms as an integral part in the 1980s. Empirical results show that the economy
responded to these reforms very well and the total output in the economy
increased more than 100 percent from 1973 to 1985. Financial reforms also
worked to increase the out put level of the financial sector by 75 percent, the
highest amongst those rates of the other sub-periods after the liberalisation.
However, the output growth rates of the finance sector later on dropped
drastically, and never reached its earlier levels. The paper puts forward that
changes in macroeconomic policies and instability of the economy created mainly
by high public involvements into financial markets. Restricting the availability of
loanable funds by high public demand for funds and high and instable interest
rates appear to have crowed out the private sector from the formal financial
markets.
Despite undistinguished growth performance of the financial sector in the
post-liberalisation period, final demand became to be accounted for the majority
of output growth. However, it is also evident from changing Leontief coefficients
(whish is named as technological changes) that there were genuine declines in
intermediate demands of the other sectors for services from banks and insurance
companies, as they decreased the financing service components of their
production. This postulates that the Turkish corporate sector increasingly became
independent from the use of the output produced by the financial sector and
eventually relied upon other sources of financing such as internal finance and/or
trade credits. Additionally this pattern became more evident in the period after
the capital account liberalisation.
In conclusion, the reforms in financial markets helped the economy grown
rapidly in the early period of liberalisation, but the financial sector seems not to
have contributed to the overall growth rate of the economy in the later periods.

21
Final demand and exports demand come out as an important factors contributing
to the output growth of the sector. Besides, creating strong and stable financial
markets, which can encourage the other sectors to increase financial service
components of their production, seem to increase the output growth of the
financial sector.
REFERENCES
Akyüz, Y. and K. Boratav (2002), “The Making of the Turkish Financial Crisis”, University of Ankara, mimeo. Available on line at (www.bagimsizsosyalbilimciler.org/yazilar/AkyuzBoratav.htm).
Akyüz, Y. (1990),”Financial System and Policies in Turkey in the 1980s”, Political Economy of Turkey: Debt, Adjustment and Sustainability in T. Arıcanlı and D. Rodrik (der.), s. 98-131, (New York: MacMillan).
Albala-Bertrand, J.M. (1999), “Structural Changes in Chile: 1960-1990”, Economic System Research 11 (3): 301-319.
Arıcanlı, T. and D. Rodrik (1990), The Political Economy of Turkey: Debt, Adjustment and Sustainability, (London: MacMillan Press).
Atiyas, I. and H. Ersel (1995), “The Impacts of Financial Reforms: The Turkish Experience”,, in Financial Reform: Theory and Evidence, G. Caprio, I. Atiyas and J. Hansson (eds.), (New York: Cambridge University Press).
Atiyas, I., H. Ersel and E. Öztürk (1993), “Customer Pattern and Credit rationing in Turkish Banks”, Research Department Discussion Papers No. 9301, (Ankara: Central Bank of Turkey).
Aydoğan, K. (1993), “The Competitive Structure of the Turkish Banking Sector”, in Y. Aşıkoğlu and H. Ersel (eds.), Financial Liberalisation in Turkey, pp. 167-180, (Ankara: central Bank of Turkey).
Benhabib, J. and M.M. Spiegel (2000), “The Role of Financial Development in Growth and Investment”, Journal of Economic Growth 5: 341-360.
Bilginsoy, C. (1993), “Inflation, growth, and import bottlenecks in the Turkish manufacturing industry”, Journal of Development Economics 42: 111-131.
Bulmer-Thomas, V. (1982), Input-Output Analysis in Developing Countries, (New York: Wiley). Chenery, H., S. Rabinson, and M. Syrquin (1986), Industrialisation and Growth: A Comparative
Study, (Oxford and New York: World Bank and Oxford University Press). Chenery, H., S. Shishido and T. Watanabe (1962), “The Pattern of Japanese Growth 1914-54”,
Econometrica 30 (1): 98-131. Celasun, M. and D. Rodrik (1989), “Debt, Adjustment and Growth: Turkey”, in J.D. Sach and
S.M. Collins (eds.), Developing County Debt and economic Performance: Country Studies-Indonesia, Korea, Philippines, Turkey, (Chicago; University of Chicago Press).
Chhibber, A and S. van Wijnbergen (1992), “Public Policy and Private Investment in Turkey”, in A. Chhibber, M. Dailami, and N. Shafik (eds.), Reviving Private Investment in Developing Countries, (Amsterdam: North-Holland).
Cizre-Sakallıoğlu, Ü. And E. Yeldan (2000), “Politics, Society and Financial Liberalisation: Turkey in the 1990s”, Development and Change 31 (2): 481-508.
Demetriades, P. O. and K.B. Luintel (2001), “Financial Restraints in the South Korean Miracle”, Journal of Development Economics 64: 459-479.
Ekinci, N. K. (1998), “The Dynamics and Adjustment of Economic Crises in the Post-1980 period in Turkey”, Toplum ve Bilim (Society and Science), 77. (in Turkish)
Ersel, H. and E. Öztürk (1993), “Liberalisation Attempts and the Financial Structure of Turkish Corporations”, in Financial Liberalisation in Turkey, Y. Aşıkoğlu and H. Ersel (eds.), Central Bank of Turkey, Ankara.
Esen, O. (2000), “Financial Openness in Turkey”, International Review of Applied Economics 14

22
(1), pp. 5-23. Fry, M. (1988), Money, Interest and Banking in Economic Development, (Baltimore: John
Hopkins University Press). Fry, M. (1979), “The Cost of Financial Repression in Turkey”, Saving and Development no. 2:
127-135. Günçavdı, Ö., H. Levent and M. Bolak (1999), Determinants of Financial Structure of
Manufacturing Firms in the Istanbul Stock Exchange, Turkish Bank Association, Publication No. 209. (in Turkish)
Günçavdı, Ö., M. Bleaney ve A. McKay (1999), “Private Investment and Structural Adjustment - A Case Study of Turkey”, Journal of International Development, 11: 221-239.
Günçavdı, Ö., M. Bleaney and A. McKay (1998), “Financial Liberalisation and Private Investment: Evidence from Turkey”, Journal of Development Economics, 57: 443-455.
Günçavdı, Ö. and S. Küçükçifçi (2002), “An Assessment on the Performance of Financial Liberalisation and Financial Markets in Turkey”, Forthcoming in METU Studies in Development (in Turkish).
Günlük-Şenesen, G. and S. Küçükçifçi (1994), “Decomposition of Structural Change into Technology and Price Components: Turkey, 1973/1985”, Economic Systems Research 6 (2): 199-215.
Gregory, M., B. Zissimos and C. Greenhalgh (2001), “Jobs for the Skilled: How Technology, Trade, and Domestic Demand Changed the Structure of UK Employment, 1979-990”, Oxford Economic Papers 53: 20-46.
King, R. and R. Levine (1993), “Finance, Enterpreneurship and Growth: Theory and Evidence”, Journal of Monetary Economics 32 (3): 513-542.
Kirkpatrick, C. and Z. Öniş, (1991), “Turkey”, in P. Mosley and J. Harrigan, and J. Toye (eds.), Aid and Power: The World Bank and Policy-Based Lending, Vol. 2, Case Studies (London: Routledge).
Işık, I and M.K. Hassan (2002), “Technical, Scale and Allocative Efficiencies of Turkish Banking Industry”, Journal of Banking & Finance 26: 719-766.
Martin, J. and J. Evans (1981), “Notes on Measuring the Employment Displacement Effects of Trade by the Accounting Procedure”, Oxford Economic Papers 33 (1): 154-164.
McKinnon, R.I. (1974), Money and Capital in Economic Development, (Washington: Brooking Institution).
Nas, T. and M. Odekon (1992), Economics and Politics of Turkish Liberalisation, (Bethlehem: Lehigh University Press).
Rodrik, D. (1991), “Premature Liberalisation, Incomplete Stabilisation: The Özal Decade in Turkey”, in M. Bruno, S. Fischer, E. Helpman, and N. Liviatan with L.R. Meridor (eds.), Lessons of Economic Stabilisation and Its Aftermath, (Cambridge, M.A.: The MIT).
Rittenberg, L. (1991), “Investment Spending and Interest Rate Policy: the Case of Financial Liberalisation in Turkey”, Journal of Development Studies 27 (2): 151-167.
Özatay, F (2000) “A Quarterly Macroeconometric Model for a Highly İnflationary and Indebted Country: Turkey”, Economic Modelling 17: 1-11.
Özatay, F., E. Öztürk, and G. Sak (1996), Problems of the Turkish Corporate Sector and Alternative Sources of Finance, TUSIYAD, Publication No. TUSIYAD-T/96-1/192, Istanbul. (in Turkish).
Schumann, J. (1990), “On Some Basic Issues of Input-Output Economics: Technical Structure, Prices, Imputations, Structural Decomposition, Applied General Equilibrium”, Economic System Research 2 (3): 229-239.
Selçuk, F. (1994), “Currency Substitution in Turkey”, Applied Economics 26: 509-518. Shaw, E. (1974), Financing Deepening in Economic Development, (New York: Oxford University
Press). State Institute of Statistics (1994), Gross National Product: Concepts, Methods and Sources,
(Ankara: SIS), (in Turkish). State Planning Organization (1998), Economic and Social Indicators (1950-1997), Ankara: SPO. Uygur, E. (2001), “Turkey from Crisis to Crisis: November 2000 and February 2001 Crises”,
Turkish Economic Institution Discussion Paper, No. 2001/1. (in Turkish) Uygur, E. (1993), Financial Liberalisation and Economic Performance in Turkey, (Ankara:
Central Bank).

23
Yeldan, E. (2001), “On the IMF-Directed Disinflation Programme in Turkey: a Program for Stabilisation and Austerity or a Recipe for Impoverishment and Financial Chaos?”, Bilkent University Department of Economics, mimeo..
Yentürk, N. (2002), “Last 20 Years of the Turkish Economy”, İstanbul Technical University, Department of Management, mimeo..
Yentürk, N. and B. Ülengin (2001), “Impacts of Capital Inflows on Aggregate Spending Categories: the Case of Turkey”, Applied Economics 33: 1321-1328.
Zaim, O. (1995), “The Effect of Financial Liberalisation on the Efficiency of Turkish Commercial Banks”, Applied Financial Economics 5: 257-264.
Appendix A: Derivation of Equation (9) in Detail
We start the formal derivation from equation (7)
( ) ( )esfhAIx +−= −1 (B-1) For simplicity and tractability, let ( )hAID −= and ( )esfg += , and write equation (B-1) as follows:
gDx 1−= (B-2) Equation (B-2) holds for any point in time with x, A, f, e, h and s. Then differencing (B-2) yields
0xxx 1 −=∆ ( )gD 1−∆= = ( ) ( )01
011
1 gDgD −− − (B-3)
Equation (B-3) can be expressed in a way that each terms on the right-hand side of the equation
increase by the amounts of ∆D-1 and ∆g respectively between time 0 to time 1. We then obtain
( )( ) 01
0011
0 gDggDDx −−− −∆+∆+=∆ (B-4)
Upon expanding (B-4), we get
01
01
011
001
0 gDgDgDgDgDx −−−−− −∆∆+∆+∆+=∆ (B-5)
Cancelling out the similar terms, we finally derive the following expression:
gDgDgDx ∆∆+∆+∆=∆ −−− 1110 0
(B-6)
In calculating equation (B-6), it is quite important the way we handle the last interactive term (see
Martin and Evens, 1981). Some similar studies in the literature recognise the presence of the last
term, but none explicitly calculate it, preferring instead to calculate it as a residual. However, we
here follow a different way. In the present context, we assume that either the first or the second
tem on the right hand side of (B-6) can compromise this last term. If the first term includes the

24
last term, then equation (B-6) become weighted by the terminal year of the structural D-1 and the
base year of the volume g, and vice versa if the this term is absorbed by the second one. This is
rather similar to Paasche and Laspeyres index weightings respectively. Given this explanation,
equation (B-6) respectively can be re-written as follows:
011
1 gDgDx −− ∆+∆=∆ (B-7)
111
0 gDgDx −− ∆+∆=∆ (B-8)
Despite the fact that the calculations using both weighting yield the analogous, we use the
Laspeyres weighting for presentation. However, the same derivation can be repeated for the
Paasche weighting. For the our present purpose, the first term on the right-hand side of (B-8) can
be decomposed as follows:
( ) ( )[ ]0001111
01
0 efsefsDgD +−+=∆ −− (B-9)
Adding and subtracting the term s0f1 from the right-hand side of (B-9) yields:
( )efssfDgD ∆+∆+∆=∆ −−01
10
10 (B-10)
The second-term on the right-hand side of (B-8), on the other hand, can be decomposed as:
( ) 11
01
111 gDDgD −−− −=∆ (B-11)
Since multiplying the first and the second term in the bracket on the right-hand side of (B-11) by
(D0-1D0) and (D1D1
-1) does not change equation (B-11), the following can also be written:
( ) 11
111
01
101
011 gDDDDDDgD −−−−− −=∆ (B-12)
Upon re-written (B-12),
( ) 11
111
101
011 gDDDDDgD −−−− −=∆ (B-13)
From (B-13), the following can also be derived:
( ) 11
1101
011 gDDDDgD −−− −=∆ (B-14)
From equation (B-2), let 111
1 xgD =− and write (B-14) as follows:
( ) 1101
011 xDDDgD −=∆ −− (B-15)

25
Substituting the definition of D0 and D1 in the (B-15) yields
( ) ( )[ ] 11001
011 xAhIAhIDgD −−−=∆ −− (B-16)
Re-arranging (B-16) gives us equation (B-17) below
( ) 111001
011 xAhIAhIDgD +−−=∆ −−
( ) 100111
011 xAhAhDgD −=∆ −− (B-17)
Adding and subtracting the same term h0A1 from (B-17),
( ) 1101000111
011 xAhAhAhAhDgD −+−=∆ −− (B-18)
Re-arranging the resulting equation (B-18) gives,
( )10111
011 AxhxhADgD ∆+∆=∆ −− (B-19)
Finally substituting (B-10) and (B-19) into (B-8) yields the following:
( ) ( )10111
0011
0 AxhxhADefssfDx ∆+∆+∆+∆+∆=∆ −− (B-20)
Letting 01
0 RD =− we can derive equation (9b) in the text:
10011000010 AxhRxhAReRfsRsfRx ∆+∆+∆+∆+∆=∆ (B-21)
Using Paasche weighting the derivation of equation (9a) is also analogous to (B-21).
Appendix B: Price Adjustment Procedure
The examination of the effects of structural changes in the economy requires an interpemporal
comparison by handling changes in price levels. Using two input-output matrices for different
years in current prices, we attempt to adjust coefficient matrices for s based matrices to the base
year t (s>t) (e.g. see Günlük-Şenesen and Küçükçifçi, 1994). The deflating procedure involves
expressing As, the matrix of technical coefficients, in the price of the year t. We define Ast as As
deflated with year s prices, so that
Ast=Ps
-1AsPs (A-1)
where Ps is the diagonal matrix of industrial price indices capturing changes in price levels from
year t to s. From A-1, the typical element of Ast is

26
is
js
js
ijstijs P
Pxx
a,
,
,
,, = (A-2)
where Ps,i and Ps,j are changes in industrial price indices of sector i and sector j from year t to year
s respectively, and the (Ps,j/Ps,i) term on the right-hand side captures the relative prices from year t
to year s.
Appendix C: Sectoral Aggregation The Turkish input-output tables before 1996 comprised sixty-four sectors. The available latest table, on the other hand, possesses 97 sectors. Due to lack of the data on the price indices at this aggregation level, we aggregated sectors to the 24 sectors. However, it has been necessary to aggregate them further to 7 sectors to examine some hypothesis advanced in the text. In what follows, we first present the aggregation of the 64✕ 64 input-output table to the 24✕ 24 one, then introduce the smaller table with further aggregation to 7 sectors. The sectors in the 24✕ 24 tables SECTORS
Sector numbers in the 64✕ 64 input-
output table
Sector numbers in the 97✕ 97 input-
output table
1- Agriculture 1-4 1-7 2- Mining 5-10 8-12 3- Food-Beverage 11-19 13-25 4- Textiles 20-24 26-32 5- Wood-Furniture 25-26 33-34 and 67 6- Paper-Printing 27-28 35-37 7- Chemicals 29-31 39-43 8- Oil-Refining 32-33 38 9- Rubber-Plastics 34-35 44-45 10- Glass-Cement 36-38 46-49 11- Iron-Steel 39-40 50-52 12- Metal Product 41 53-54 13- Machinery 42-43 55-58 14- Electrical-Machinery 44 59-60 15- Transportation-Vehicles 45-48 62-66 16- Other manufacturing 49 61 and 68 17- Utilities 50-51 69-71 18- Construction 52-53 72 19- Trade 54-55 73-77 20- Transportation Service 56-60 78-83 21- Banking and Insurance 61 84-85 22- Personal Services 62 86-95 23- Public Services 63 96 24- Housing 64 97

27
Table 1 Main Macroeconomic Indicators
1973-76
1977-80
1981-83
1984-88
1989-93
1994-96
(Period Average in %) Real GDP growth rate 7.2 1.3 4.0 5.9 5.2 3.1 Savings/GDP 20.8 17.3 17.3 21.7 21.9 21.4 Investment/GDP 21.4 22.5 18.5 22.3 23.7 23.9 Exports/GDP 3.7 3.3 7.8 11.5 9.1 13.3 Imports/GDP 9.2 8.6 13.7 16.4 14.7 21.1 Total PSBR/GDP1 --- 6.9 4.1 4.7 9.1 7.6
Main prices Inflation (average in %) 19.2 61.9 56.6 48.5 65.1 93.4 Real exchange rate2 (% average) -3.9 7.4 12.0 -0.69 -6.45 5.72 Real interest rate (average in %) -10.7 -43.4 -13.2 2.96 4.66 24.4
1 CAB and PSBR respectively stand for current account balance and public sector borrowing requirement. 2 Calculated as e(P*/P), where e is the nominal exchange rate, P* and P are the consumer price indices of the USA and Turkey respectively. Negative numbers indicate the overvaluation of currency, and vice versa. 3 This aggregated sector includes agriculture, mining, energy and services. Sources: Economic and Social Indicators (1950-1998), Ankara: State Planning Organisation, 1997, and F. Özatay (2000) “A Quarterly Macroeconometric Model for a Highly İnflationary and Indebted Country: Turkey”, Economic Modelling 17: 1-11.
Figure 1 Total Financial Assets / GNP
0
10
20
30
40
50
60
1970
1972
1974
1976
1978
1980
1982
1984
1986
1988
1990
1992
1994
1996
Fina
nsal
Der
inleşm
e G
öste
rgel
eri (
%
TOP.MALİ V./ GSMH M2 / GSMH M2Y / GSMH
28
Table 2 – The Shares & Growth Rates of Sectoral Output (%)
Output Growth
Shares of Sectoral Output
Overall Period Annual*
Initial Year Terminal Year
1973-1996 Agriculture 240.2 5.5 21.4 17.2Mining 133.8 3.8 1.1 0.62Manufacturing 330.5 6.6 38.0 38.5Non-Financial Services 383.4 7.1 37.3 42.5Financial Services 130.0 3.7 2.2 1.2TOTAL 324.2 6.5 100 100
1973-1985 Agriculture 51.9 3.5 21.4 15.9Mining 64.0 4.2 1.1 0.9Manufacturing 117.7 6.7 38.0 40.39Non-Financial Services 125.0 7.0 37.3 40.9Financial Services 75.1 4.8 2.2 1.9TOTAL 104.8 6.2 100 100
1985-1990 Agriculture 72.0 11.45 15.9 18.0Mining 53.2 8.9 0.89 0.9Manufacturing 36.4 6.41 40.4 36.3Non-Financial Services 60.5 9.93 40.9 43.3Financial Services 12.5 2.38 1.9 1.4TOTAL 51.7 8.68 100 100
1990-1996 Agriculture 30.3 4.5 18.0 17.2Mining -6.9 -1.2 0.9 0.6Manufacturing 44.9 6.4 36.3 38.5Non-Financial Services 33.9 5.0 43.3 42.5Financial Services 16.8 2.6 1.4 1.2TOTAL 36.6 5.3 100 100
*Annual growth rates are calculated as geometric average of each period.

29
Table 3a - The Source of Changes in Gross Output: Paasche Weighting (%)
Final demand
Exportsdemand
Import substitution
in final demand
Import substitution
in intermediate
goods
Changes in Technology
1973-1996
Agriculture 91.7 12.9 2.3 -2.2 -4.7 Mining 106.4 30.7 8.2 -42.1 -3.2 Manufacturing 69.0 27.4 4.2 -1.7 1.1 Non-Financial services 83.1 14.8 0.4 -0.2 1.8 Financial services 116.5 23.8 1.9 -1.3 -40.9 TOTAL 79.4 19.5 2.2 -1.3 0.1
1973-1985
Agriculture 101.5 22.9 2.8 -2.0 -25.2 Mining 102.5 49.6 -1.2 -78.3 27.3 Manufacturing 63.1 32.1 2.1 0.5 2.1 Non-Financial services 82.7 16.4 0.2 -0.1 0.8 Financial services 92.9 32.9 1.5 -1.0 -26.3 TOTAL 76.6 24.3 1.3 -0.6 -1.7
1985-1990
Agriculture 84.1 2.9 5.3 -3.2 11.0 Mining -1.7 -0.3 115.4 7.0 -20.4 Manufacturing 59.4 3.4 23.7 -7.4 21.0 Non-Financial services 84.0 3.7 2.0 -0.6 10.9 Financial services 294.7 -13.7 23.2 -6.7 -197.5 TOTAL 77.2 3.3 10.0 -3.1 12.6
1990-1996 Agriculture 94.9 23.3 5.2 -7.6 -15.9 Mining -252.4 -116.7 94.0 116.4 208.8 Manufacturing 79.9 39.1 2.3 -10.1 -11.2 Non-Financial services 76.1 24.9 0.3 -1.3 0.0 Financial services 149.2 62.5 2.5 -80.1 -106.2 TOTAL 81.6 31.5 1.8 -6.5 -8.4

30
Table 3b - The Source of Changes in Gross Output: Laspeyres Weighting (%)
Final demand
Exportsdemand
Import substitution
in final demand
Import substitution
in intermediate
goods
Changes in Technology
1973-1996
Agriculture 99.8 19.5 11 -8.9 -21.4 Mining 165.4 71.7 62.5 -163.6 -36.0 Manufacturing 61.7 28 13.0 -7.8 5.2 Non-Financial services 77.0 14.1 1.4 -1.0 8.5 Financial services 208.3 56.3 20.6 -17.8 -167.4 TOTAL 76.2 21.0 7.9 -5.8 0.7
1973-1985
Agriculture 118.8 30.7 5.6 -2.1 -53.0 Mining 157.6 68.1 -16.3 -285.1 175.6 Manufacturing 60.5 31.3 3.5 1.4 3.2 Non-Financial services 81.8 16.3 0.4 -0.2 1.7 Financial services 115.7 40.3 2.7 -7.7 -51.1 TOTAL 77.7 25.0 2.2 -1.7 -3.1
1985-1990
Agriculture 78.0 2.7 6.9 -4.9 17.3 Mining 25.5 -0.3 88.9 4.2 -18.3 Manufacturing 51.9 3.2 26.3 -12.1 30.7 Non-Financial services 79.5 3.5 1.9 -0.8 15.9 Financial services 331.6 -9.6 46.7 -20.0 -248.8 TOTAL 71.9 3.2 11.0 -5.0 18.9
1990-1996
Agriculture 102.4 28.4 7.2 -11.7 -26.3 Mining -397.8 -173.1 108.7 190.1 372.1 Manufacturing 86.0 42.4 3.8 -13.9 -18.3 Non-Financial services 77.1 25.7 0.6 -2.1 -1.3 Financial services 185.1 77.9 4.7 -14.8 -152.8 TOTAL 86.3 34.2 2.9 -9.2 -14.2


![Hakan TUNAHAN∗∗ ABSTRACTehrbar/erc2002/pdf/P103.pdf · 2002. 9. 19. · önemli etkisi, firmaların finansal kararları üzerine olmaktadır [Bolton ve Frexias, 2000: 3]. Para](https://img.pdfslide.us/doc/110x75/60d9b9fe909ca8637943aa6b/hakan-tunahanaa-abstract-ehrbarerc2002pdfp103pdf-2002-9-19-nemli.jpg)