Embed Size (px)
Citation preview

1
Financial Management Practices of College Students from States with Varying Financial
Education Mandates
FINAL DRAFT

2
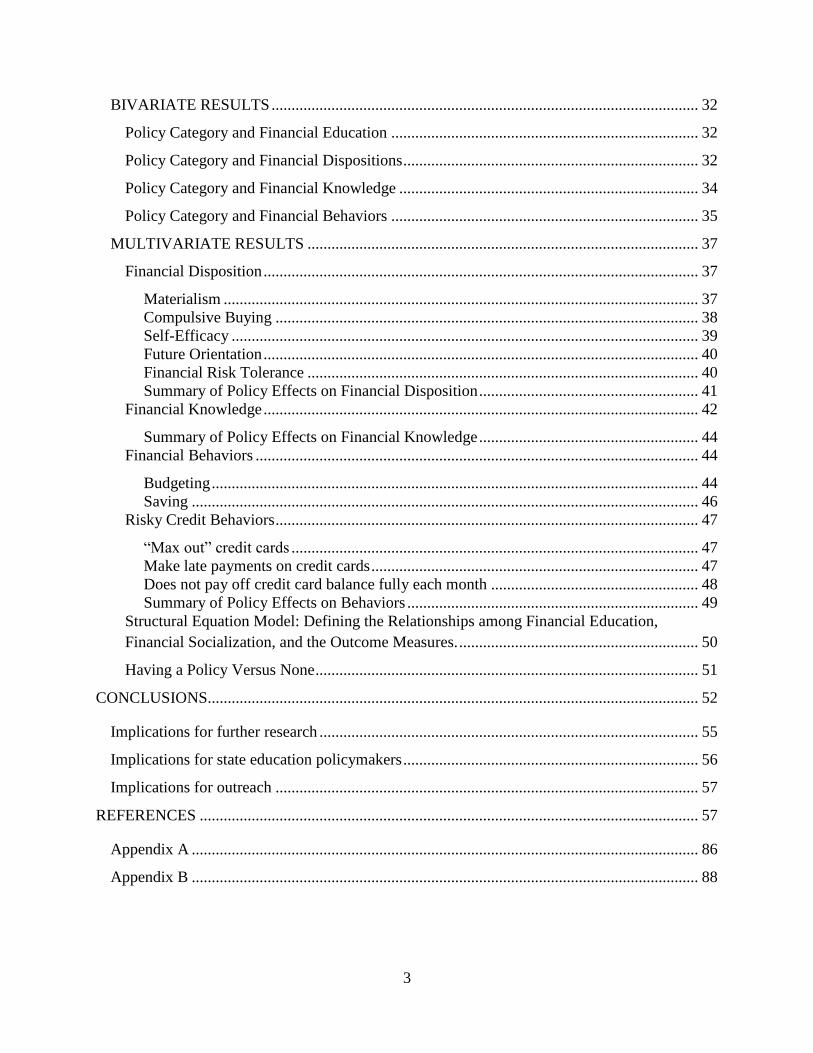
CONTENTS
LIST OF TABLES .......................................................................................................................... 4
LIST OF FIGURES ........................................................................................................................ 5
SUMMARY .................................................................................................................................... 6
INTRODUCTION ........................................................................................................................ 13
LITERATURE REVIEW ............................................................................................................. 16
Financial Education and Financial Knowledge ......................................................................... 17
Conceptualizing and Measuring Financial Knowledge ......................................................... 17
Relationship between Financial Education and Financial Knowledge ................................. 18
Financial Education and Financial Dispositions ....................................................................... 20
Conceptualizing and Measuring Financial Dispositions ....................................................... 20
Relationship between Financial Education and Financial Dispositions ................................ 20
Financial Education and Financial Behavior ............................................................................ 21
Conceptualizing and Measuring Financial Behavior ............................................................. 21
Relationship between Financial Education and Financial Behavior ..................................... 21
Hypotheses ................................................................................................................................ 22
METHOD ..................................................................................................................................... 23
Data ........................................................................................................................................... 23
Procedure ................................................................................................................................... 24
Measurement of Variables ........................................................................................................ 24
Independent Variables ........................................................................................................... 24
Demographic variable. ...................................................................................................... 24
Financial variables. ........................................................................................................... 24
Financial Education. ......................................................................................................... 24
Policy Categories .............................................................................................................. 25
Financial Social Learning Opportunities: ......................................................................... 25
Dependent Variables .............................................................................................................. 26
Financial Dispositions ....................................................................................................... 26
Financial Knowledge ........................................................................................................ 28
Financial Behaviors .......................................................................................................... 29
Analyses .................................................................................................................................... 30
RESULTS ..................................................................................................................................... 32
3
BIVARIATE RESULTS ........................................................................................................... 32
Policy Category and Financial Education ............................................................................. 32
Policy Category and Financial Dispositions .......................................................................... 32
Policy Category and Financial Knowledge ........................................................................... 34
Policy Category and Financial Behaviors ............................................................................. 35
MULTIVARIATE RESULTS .................................................................................................. 37
Financial Disposition ............................................................................................................. 37
Materialism ....................................................................................................................... 37
Compulsive Buying .......................................................................................................... 38
Self-Efficacy ..................................................................................................................... 39
Future Orientation ............................................................................................................. 40
Financial Risk Tolerance .................................................................................................. 40
Summary of Policy Effects on Financial Disposition ....................................................... 41
Financial Knowledge ............................................................................................................. 42
Summary of Policy Effects on Financial Knowledge ....................................................... 44
Financial Behaviors ............................................................................................................... 44
Budgeting .......................................................................................................................... 44
Saving ............................................................................................................................... 46
Risky Credit Behaviors .......................................................................................................... 47
―Max out‖ credit cards ...................................................................................................... 47
Make late payments on credit cards .................................................................................. 47
Does not pay off credit card balance fully each month .................................................... 48
Summary of Policy Effects on Behaviors ......................................................................... 49
Structural Equation Model: Defining the Relationships among Financial Education,
Financial Socialization, and the Outcome Measures. ............................................................ 50
Having a Policy Versus None ................................................................................................ 51
CONCLUSIONS........................................................................................................................... 52
Implications for further research ............................................................................................... 55
Implications for state education policymakers .......................................................................... 56
Implications for outreach .......................................................................................................... 57
REFERENCES ............................................................................................................................. 57
Appendix A ............................................................................................................................... 86
Appendix B ............................................................................................................................... 88

4
LIST OF TABLES
Table 1. Financial Risk Tolerance by Policy ................................................................................ 64 Table 2. Perceive Financial Knowledge by Policy Category ....................................................... 66
Table 3. Information about Credit Card by Policy Category ....................................................... 67 Table 4. Credit Cards Uses by Policy Category ........................................................................... 69 Table 5. Risky Credit Card Behaviors by Policy Category .......................................................... 70 Table 6. Budgeting by Policy Categories ..................................................................................... 71 Table 7. Saving by Policy Categories ........................................................................................... 72
Table 8. OLS Regression of Financial Disposition ...................................................................... 73 Table 9. Logistic Regression of Willingness to Take Financial Risk Tolerance .......................... 75 Table 10. OLS Regression of Financial Knowledge .................................................................... 77 Table 11. Logistic Regression of Perceive Financial Knowledge ................................................ 78
Table 12. Logistic Regression of Financial Behaviors ................................................................. 79 Table 13. Logistic Regression of Risky Credit Behaviors............................................................. 81
Table 14. Logistic Regression of Risky Credit Behaviors............................................................. 82 Table 15. Coefficients between Manifest Measures and Latent Constructs ................................. 84

5
LIST OF FIGURES
Figure 1. Personal Finance Taught in High School by Policy Category ..................................... 61 Figure 2. Personal Finance in Community by Policy Category ................................................... 62
Figure 3. Compulsive Buying by Policy Category ........................................................................ 62 Figure 4. Future Orientation by Policy Category ......................................................................... 63 Figure 5. Financial Self-efficacy by Policy Category ................................................................... 63 Figure 6. Materialism by Policy Category .................................................................................... 64 Figure 7. Financial Quiz by Policy Category ............................................................................... 65
Figure 8. Self-Reported Financial Knowledge by Policy Category .............................................. 65
Figure 9. Hybrid Structural Equation Model for Financial Behavior………………………………52

6
Financial Management Practices of College Students from States with Varying Financial
Education Mandates
SUMMARY
Introduction
This study uses three categories of financial outcome indicators (financial knowledge,
financial dispositions, and financial behaviors) to assess the effectiveness of state policies
regarding high school financial education. States were categorized into one of six categories
based on their financial education policies; no standards, standards with no required
implementation, standards requiring implementation, courses required but not testing, testing
required but no courses, course and testing required. An effective policy category would ideally
produce students with high levels of financial knowledge, positive financial dispositions (i.e. low
materialism, high financial self-efficacy, high future orientation, and some willingness to take
investment risk), and positive financial behaviors (i.e. saving regularly, using a budget, engaging
in responsible credit use).
Hypotheses
Our first hypothesis is that differences in the rigor of state financial education policies
will lead to differences in outcomes related to financial disposition, financial knowledge, and
financial behavior. Our second hypothesis is that the increasing rigor of state policies will be
associated with healthier financial outcomes.
Method
We collected data via a web survey from 15 college campuses, representing all six policy
categories and various regions of the U.S. A stratified random sampling method was employed,
with a total of 172,412 emails being sent out, yielding 16,872 respondents. After removing
students who were educated abroad, educated by home school, received a GED, or did not
indicate their state of high school attendance, the final sample was 15,797 students.
Analysis
Preliminary exploration of the hypotheses includes simple bivariate comparisons utilizing
a cross-tabulation table and chi-square test to examine whether or not financial education, risk
tolerance, financial knowledge and financial behaviors differed by policy category for the state in
which they graduate high school. One–way analysis of variance was then computed to compare
means among categories of subjects on financial disposition, financial quiz scales and self-
reported financial knowledge variables by policy categories. When the F-test indicated
significant (.05) mean differences on a given variable, the Scheffe multiple comparison test was
used to isolate the specific between-category means that were significantly different.
OLS Regression was used to estimate models for performance on a financial assessment,
subjective knowledge, and various psychometrics. Cumulative logistic regression was used to
estimate models for relative financial knowledge and willingness to take financial risk. The data
analysis for the behavioral outcomes utilized two logistic regression models. For the reduced
model, variables include demographics, financial resources, financial education (including policy
category), and financial knowledge. The full model included two additional variables: financial
7
social learning opportunities and financial dispositions. Behavioral outcomes included
budgeting, saving, maxing out credit cards, making late payments on credit cards, and not paying
off credit cards monthly. After the likelihood ratio test was conducted, the reduced model was
rejected in favor of the full model. In addition, structural equation modeling was used to test
relationships among some of the concepts such as financial education, social learning, and
financial behavior to name a few.
Results and Conclusions
Overall, this study shows that financial behaviors of college students vary by state policy
on financial education, even when controlling for demographics, financial resources, financial
education, financial knowledge, financial social learning opportunities and financial dispositions.
Social learning is an important determinant of dispositions. The results show that both social
learning and formal education are important determinants of financial behaviors including
savings. In a structural equation model, several important relationships were shown including a
significant relationship of financial education on financial knowledge. Further, knowledge along
with dispositions was an important predictor of behavior.
In addition, college students will be engaged in various financial transactions out of
necessity. Thus regardless of having had a class, many students will need checking accounts and
will opt to learn to use them through self-education, social learning opportunities, or simply from
trial and error (experience). However, lack of any formal education can lead to false financial
knowledge and as such social learning and self education by themselves may be problematic.
Yet, financial knowledge is seen as a key predictor of financial behavior, while financial
education is a key predictor of knowledge. Thus, since having standards was a key tipping point
in our measures of financial knowledge, having standards should be considered a minimum, with
requiring courses and assessment being the ideal, since that had an even stronger impact on
knowledge. One important takeaway is that the goal of improving financial knowledge is an
important goal in and of itself. It may also be the appropriate goal for financial education.
The following tables summarize the effects of each policy category on each outcome
indicator for financial dispositions, financial knowledge, and financial behaviors. The final table
in this section focuses on whether having any policy is better than none at all. Each significant
positive indicator is marked with an ―X.‖ Each significant negative indicator is marked with an
“O.‖
Understanding Executive Summary Bivariate Findings by State Policy Category
Finding
Category of State Position on High School Financial Education
No
Policy
Standards
only
Standards with
required
Course
required
Assessment
required
Course &
assessment

8
implementation required
Financial Disposition by
Policy Category
Students have lower
tendency toward
compulsive buying
X
Students with a higher
financial disposition toward
future orientation
X
Students with a higher
financial disposition toward
financial self-efficacy
X
Students with a higher
financial disposition
toward materialism
O O
More students have average
financial risk X
Financial Knowledge by
Policy Category
Lower financial quiz score than the other 5 categories
O
Higher financial quiz scores
than the other 4 categories X X
Higher self-reported
financial knowledge score
than the other 5 categories
X
Students more likely to
believe their level of
financial knowledge to be
better than others.
X
Financial Behaviors by
Policy Categories
Within all policy categories,
most students have one
credit card
X X X X X X
Within all policy categories,
most students acquired their
credit card from a
bank/financial institution in
person
X X X X X X
Within all policy categories,
most students have not
missed a credit card
payment by 30 days or
more
X
X
X
X
X
X
Most students within all
policy categories did not
have any risky credit
behavior (―max out‖, ―make
late payments, and ―do not pay off‖)
X X X X X X
More students budgeting X X X X

9
More students saving X X X X X
Understanding Executive Summary Multivariate Findings by State Policy Category (Reduced
Model)
Finding
Category of State Position on High School Financial Education
No
Policy
Standards
only
Standards with
required
implementation
Course
required
Assessment
required
Course &
assessment
required

10
Financial Disposition by
Policy Category
Students were less
compulsive buyer
X X
Students with a higher
financial disposition toward
future orientation
n.s n.s n.s n.s n.s n.s
Students have lower
financial self-efficacy
score
O O O
Students were significantly
less materialistic than the
other 5 categories.
X
Students were less likely to
be willing to take above
average financial risk
X X X
Students were more likely
to be willing to take
average financial risk
X X X
Students were more likely
not be willing to take any
financial risk
O
Financial Knowledge by
Policy Category
Lower financial quiz score than the other 5 categories
O
O
Higher financial quiz scores
than the other 4 categories X
Higher self-reported
financial knowledge score
than the other 5 categories
X X
Students more likely to
believed their level of
financial knowledge to be
better than others.
n.s n.s n.s n.s n.s n.s
Financial Behaviors by
Policy Categories
Students were more likely
to budget
X X X
Students were less likely
to budget O
Students were more likely
to saving X X X
Student were less likely to
―max out‖ credit cards X X
Students were less likely to
make late payments X X
Students were more likely
paying their cards off fully
each months
X X X X

11
Understanding Executive Summary Multivariate Findings by State Policy Category (Full Model)
Finding
Category of State Position on High School Financial Education
No
Policy
Standards
only
Standards with
required
implementation
Course
required
Assessment
required
Course &
assessment
required
Financial Disposition by X X

12
Policy Category
Students were less
compulsive buyer
Students with a higher
financial disposition toward
future orientation
n.s n.s n.s n.s n.s n.s
Students have higher
financial self-efficacy
score
X
Students have lower
financial self-efficacy
score
O O
Students were significantly
less materialistic than the
other 5 categories.
X
Students were less likely to
be willing to take above
average financial risk
X X X
Students were more likely
to be willing to take
average financial risk
X X X
Students were more likely
not be willing to take any
financial risk
O
Financial Knowledge by
Policy Category
Lower financial quiz score than the other 5 categories
O
O
Higher financial quiz scores
than the other 4 categories X
Higher self-reported
financial knowledge score
than the other 5 categories
X X
Highest percentage of
students who believed their
level of financial
knowledge to be better than
others.
n.s n.s n.s n.s n.s n.s
Financial Behaviors by
Policy Categories
Students were more likely
to budget
X X X X
Students were less likely
to budget O
Students were more likely
to saving X X
Student were less likely to
―max out‖ credit cards X
Students were less likely to
make late payments X
Students were more likely
paying their cards off fully X X X X

13
each months
Understanding Executive Summary Multivariate Findings by Indicator of any State Policy
Having any Policy
Finding Reduced Model Full Model
Financial Disposition by Policy
Category
Students were less compulsive
buyer
X X
Students with a higher financial
disposition toward future orientation n.s n.s
Students have lower financial self-
efficacy score O n.s
Students were significantly less
materialistic. n.s n.s
Students were less likely to be
willing to take above average
financial risk
O O
Students were more likely to be
willing to take average financial risk X X
Financial Knowledge by Policy
Category
Higher self-reported financial
knowledge score
n.s n.s
Students more likely to believed
their level of financial knowledge to
be better than others.
n.s n.s
Financial Behaviors by Policy
Categories
Students were more likely to budget
X n.s
Students were more likely to be
saving X X
Student were less likely to ―max
out‖ credit cards X X
Students were less likely to make
late payments X n.s
Students were more likely paying
their cards off fully each months X X
INTRODUCTION
Over the last several years a great deal of attention and concern has been placed on the
financial behaviors of emerging adults (18-24). The concern stems from the fact that young
adults often begin their college careers without ever having been solely responsible for their own

14
personal finances (Cunningham, 2000). There is general consensus from several previous studies
that students lack basic financial knowledge (Bakken, 1967; Chen & Volpe, 1998; Danes & Hira,
1987; Jump$tart, 1997, 2002; Kim, 2000; Volpe, Chen, & Pavlicko, 1996). Thus, states across
the U.S. have been discussing the need for financial education, with states taking different
measures ranging from doing nothing to requiring classes and testing.
At the high school level, mixed findings have been reported with regard to financial
education programming. Over the last several decades, many states have adopted personal
financial programs on topics such as money management and credit and debt management for
delivery to high school students. The following table documents the changes in state policies
over the last decade. There has been a clear trend towards states moving to having a policy as
well as greater rigor within those policies.
States with Personal Finance Education in High Schools: A Comparative Look (1998-2007)
Topics 1998 2000 2002 2004 2007 Increase
(1998-2007)
Include personal finance in their standards 21 40 31 34 40 19
Standards required to be implemented 14 16 16 20 28 14
Course required to be offered 0 7 7 7 9 9
Course required to be taken 1 4 4 6 7 6
Testing of personal finance concepts
required 1 6 6 8 9 8
NCEE, 2007
Currently, 40 states in the U.S. mandate standards for personal finance education, 28 of
which require those standards to be implemented. However, only 9 states require a course with
personal finance content, 7 states require students to take a personal finance course, and 9 states
test personal finance knowledge (NCEE, 2007). With current policies still mainly affecting those
in high schools, the current study divided 50 states and the District of Columbia into 6 categories
of mandate policies based on the 2004 National Council on Economic Education report for 2008
data collection. We do this because 2007 standards would not affect most students who were in

15
college during 2008 unless they existed earlier. Further, since it has been established that the
behavioral effects of financial education policies, at least savings (Bernheim, Garrett, & Maki,
1997), tends to lag the education, we focus on this earlier point.
Although there are many financial education programs and curricula for teens, a few
published studies have examined the effectiveness of these programs and have collectively
shown that personal finance courses have varied impact on students‘ financial knowledge and
behavior (Peng, Bartholomae, Fox, & Cravener 2007). This study seeks to measure the
effectiveness of six different high school financial education policy categories in the United
States. These policy categories range from no policy at all to required courses and testing.
The outcome variables being measured include financial knowledge, financial
dispositions, and financial behaviors. A ―successful‖ policy category would ideally produce
students with high levels of financial knowledge, positive financial dispositions (i.e. low
materialism, high financial self-efficacy, high future orientation, and some willingness to take
investment risk), and positive financial behaviors (i.e. saving regularly, using a budget, engaging
in responsible credit use). These variables and others were measured and assessed by policy
category to determine which policy categories are the most successful.
According to Social Cognitive Theory, behavior is an interaction of personal factors,
behavior, and the environment (Bandura, 1977; Bandura, 1986). This suggests that an evaluation
of behavioral change needs to consider the factors of people, behavior, and the environment
including social environment and physical environment. This theory, then, provides direction
within the study when considering the influence of different factors on learned behaviors.
Therefore, the final purpose of this study is to introduce a model, which is based on Bandura‘s
social cognitive theory and previous research, which describes the interaction of demographic

16
factors, financial resources, social learning, financial disposition, financial knowledge, policy
category, and financial behaviors.
Thus, several guiding research questions are evident:
1. What are the college students‘ profiles of financial education, financial
knowledge, financial disposition, and financial behaviors?
2. Do the profiles of financial knowledge, financial disposition, and financial
behaviors differ by the financial education policy categories?
3. What is the relationship of the financial education policy category on financial
behaviors when controlling for demographics, financial resources, financial
education, and financial knowledge?
4. How are financial socialization and financial dispositions related to financial
behaviors?
LITERATURE REVIEW
The purpose of this section is to define the outcome measures of interest and discuss their
known relationships to financial education. Each concept mentioned earlier has multiple
dimensions. Financial knowledge will be thought of objectively, subjectively, and relatively.
Financial dispositions include factors affecting consumption, savings, and debt use. Financial
behaviors themselves include basic money management (budgeting), savings, and credit
behavior measures that would influence one‘s credit score. The next sections will discuss each of
these in more detail and then describe established relationships from previous studies.

17
Financial Education and Financial Knowledge
Conceptualizing and Measuring Financial Knowledge
Financial knowledge was described by Bowen (2002) as ―understanding key financial
terms and concepts needed to function daily in American society. It includes knowledge about
items related to banking, auto, life, health and homeowners insurance, using credit, taxes, and
investing. While there are other important areas related to personal finance, these are areas most
American adults encounter as they make daily financial transactions and decisions‖ (p.93).
Researchers indicated that well informed, financially educated consumers are better able to make
good decisions for their families and thus are in a position to increase their economic security
and well-being. Knowledgeable consumers who make informed choices are essential to an
effective and efficient marketplace. The number and types of financial education programs have
grown since the mid-1990s. Many of these programs focus on providing information to
consumers and operate under the implicit assumption that increases in information and
knowledge will lead to changes in financial management practices and behaviors (Hilgert,
Hogarth & Beverly, 2003).
Financial knowledge has been conceptualized and measured in several ways. Financial
knowledge could cover a variety of subjects and could range from basic awareness through
mastery of a subject. It can be thought of as true knowledge or perceived knowledge. For
instance, knowledge has been directly measured. One widely known example of this is the
Jump$tart Survey conducted every other year. It uses a set of questions used as a benchmark of
financial literacy of high school students. The survey has been conducted nationally and tests
both students who have and have not had financial education courses while in high school. Such
knowledge tests are common with a great deal of variability in what topics are truly assessed.

18
Self-reported financial knowledge was also utilized where respondents are asked how
they rate their level of knowledge on a particular personal finance topic. These are often
measured as scales. While the efficacy of this measure has not been clearly established, it was
still included as it may represent confidence in one‘s knowledge level.
A final measure employed for financial knowledge was a relative measurement. These try
to establish one‘s perception of their own knowledge relative to a specific reference group, often
as compared to a peer group. This measure may also help to establish confidence in one‘s
knowledge.
Relationship between Financial Education and Financial Knowledge
There has been a link established between financial knowledge and financial education
(Barrese, Garner, & Thrower, 1998; Tennyson & Nguyen, 2001). Several earlier studies
(Langrehr, 1979; Langrehr & Mason, 1978; Peterson, 1992) found that taking a specific course
in consumer education or economics significantly improved students‘ knowledge in the subject
area studied. Borden, Lee, Serido, and Collins (2008) found that a seminar effectively increased
students‘ financial knowledge regarding credit. A study of the NEFE High School Financial
Planning Program (HSFPP) in 2003-2004, found that immediately after studying the HSFPP,
students reported significant improvement in their financial knowledge (Danes & Haberman,
2004). The result was similar to a study by Danes, Huddleston-Casas, and Boyce (1999) which
indicated that immediately after studying the curriculum about 60% of the students increased
their knowledge about the cost of credit, auto insurance, and investments. At a three-month
follow-up, it was found that students showed statistically significant increases on all questions
except the one about their investment knowledge.
19
Tennyson and Nguyen‘s study (2001) analyzed the relationship between high school
students' scores on a test of personal financial literacy and their state's personal finance policy.
The data for this study was from the 1997 survey of high school students conducted by the
Jump$tart Coalition for Personal Financial Literacy. There were thirty-one states included in this
study, and twenty states had some kind of educational policy in the area of personal finance. The
results of the study showed that the scores of students in those states that required specific
financial education coursework were significantly higher than those in states with either a
general mandate or a non-mandate. However, their study showed association, not causation.
Schug, Wynn, and Posnanski (2002) described an economic education program
(Milwaukee Economic Education Partnership) for urban schools. They found that the education
program had a positive effect on improving the economic knowledge of the students in urban
schools. They suggested that the program provided a good start to address the gap of economic
education in urban areas. However, they also thought that it was difficult to expand this kind of
program to large urban school districts and the schools and community agencies need to continue
to work on expanding economic education for minority youth.
Varcoe, Allen, Devitto, and Go (2005) evaluated the impact of the Money Talks
curriculum on financial knowledge and behavior of 323 teens. Money Talks was a series of four
newsletters which was developed by a Cooperative Extension workgroup. The curriculum
covered different topics including saving habits, shopping tips, car costs, and money values. The
findings indicated that the curriculum increased the financial knowledge and financial behavior
of high school students. For example, self-reported data indicated that general financial
knowledge increased significantly from a pre-test to post test.

20
Financial Education and Financial Dispositions
Conceptualizing and Measuring Financial Dispositions
An additional outcome that has been commonly measured is one‘s psychological
characteristics with respect to personal finance issues. Several measurements are used in the
literature and are often tied to consumption-oriented issues such as materialism or behavior-
oriented issues such as self-efficacy. Financial education also aims to improve understanding
about risk and resource allocation over time. Understanding about risk and risk preferences are
important factors influencing decision making under uncertainty. Thus risk tolerance for example
would influence risk management and insurance decisions as well as investment decisions.
Relationship between Financial Education and Financial Dispositions
Although many studies examined links between psychological factors and financial
behavior (Bandura & Adams, 1977; Bandura, 1997; Katona, 1975; Rook & Fisher, 1995;
Tokunaga, 1993; Joo, Grable, & Bagwell, 2003; Rha, Montalto, & Hanna, 2001), little is known
about the effectiveness of financial education or the curricula used on financial disposition. For
example, Huddleston-Casas, Danes, and Boyce (1999) used a five-tiered approach to evaluate
the impact of the High School Financial Planning Program (HSFPP) Curriculum on high school
students‘ financial behaviors. The results of this study demonstrated that personal financial
programs had a positive impact on students‘ financial literacy and self-efficacy levels. Danes and
Haberman (2004) found that immediately after studying the HSFPP, students reported significant
improvement in their confidence. Varcoe, Allen, Devitto, and Go (2005) found that the saving
scale of participants increased significantly from pre-test to post-test which meant that students‘
saving attitude increased after participating in the curriculum. Norum (2008) indicated that
financial or consumer education programs could provide beneficial information to students by

21
covering appropriate credit card use, and the relationship between credit card use and compulsive
buying. Borden, Lee, Serido, and Collins (2008) found that the seminar effectively increased
students‘ responsible attitudes toward credit and decreased avoidant attitudes towards credit from
pre-test to post-test.
Financial Education and Financial Behavior
Conceptualizing and Measuring Financial Behavior
There are many behaviors worthy of study; however there are several core behaviors seen
commonly in the literature. Bernheim, Garrett, and Maki (1997) explored the effectiveness of
high school mandates using savings as the outcome measure. Budgeting is seen as another
important behavior that, while not often included in evaluation, has been an established learning
objective in many financial education programs, including those in high schools. Credit
behaviors, especially those affecting the FICO score such as late payments, credit utilization, and
carrying a balance are commonly studied behaviors.
Relationship between Financial Education and Financial Behavior
Those who are taught about personal finances at a younger age tend to do better
financially than those who were not (Lyons, 2003, 2004; Varcoe, Peterson, Garrett, Martin,
Rene, & Costello, 2001). Danes, Huddleston-Casas, and Boyce (1999) found that immediately
after studying the High School Financial Planning Program (HSFPP) curriculum about 40% of
the students began to write goals to manage their money, to save money for their needs and
wants, and to track their expenses. At a three-month follow-up, it was found that around 60% of
the students indicated that they had changed their spending patterns and that they now only get
things they really need and they spend more wisely. Also 60% of the students had changed their
savings patterns, 80% indicated they now save for what they really need or want, and 20%

22
indicated that they now save every time they get money. Danes and Haberman (2004) also
evaluated the HSFPP and found that students who studied the program reported significant
improvement in their financial behavior immediately after studying the HSFPP. In a study
evaluating the Money Talks curriculum, Varcoe, Allen, Devitto, and Go (2005) found that saving
behavior increased after participating in the curriculum. Participants‘ shopping behavior also
improved after exposure to the curriculum because participants were more likely to compare
prices and wait until items were on sale after the program.
Using a 1995 telephone survey of a nationally representative data set, Bernheim, Garrett,
and Maki (1997) compared states with no financial education programs to other states with
programs at different times to measure the long term effects of financial curricula in high schools
across the country. They found that mandated personal finance education has a positive effect on
students‘ financial behaviors (self-reported rates of saving and accumulated wealth) over the
long term, thus the effect was not observable in short run behavior but lagged exposure to
financial education. Borden et al. (2008) found that at post-test, students reported intending to
engage in significantly more effective financial behaviors and fewer risky financial behaviors.
Additionally, Lyons (2008) found that students who had taken, or were currently taking a formal
course in personal finance, were significantly less likely to engage in risky financial behavior.
Hypotheses
There are clear links in the literature among financial education and what are seen as core
outcome measures including financial knowledge, financial dispositions, and financial behaviors.
1. Differences in the rigor of state policies with respect to financial education will
lead to different financial behavior related outcomes including:
a. Differences in financial knowledge

23
b. Differences in financial disposition
c. Differences in financial behaviors
2. Greater rigor of state policies will be associated with healthier financial outcomes.
3. Social learning is an important determinant of financial dispositions and financial
behaviors
METHOD
Data
The ideal population for this study in terms of importance and access was college
students from the United States. Thus, data was collected during spring and fall of 2008 using a
web survey of college students throughout the United States. This would indicate that these
students would typically have graduated high school over the years 2004 through spring 2008.
Thus the policies in place during 2004 may have affected many of these students. While policy
changes such as those after may not have affected many of the students currently in college.
This study used a stratified sampling technique. The 50 states and the District of Columbia were
divided into 6 categories of mandate policies based on the 2004 National Council on Economic
Education report to determine college students‘ states policies during their high school years.
Then, using random numbers, states were selected from each of the categories with the target
campuses being large state universities; a total of 15 campuses were sampled. A breakdown of
the sample by campus is summarized in the table in Appendix A. Random lists of student email
addresses were obtained for each campus (in some instances, entire student populations were
made available). The sample was limited to currently enrolled college students age 18 and over.
Students were emailed three times over a course of one month to request their participation;
172,412 students received emails three times and 16,876 students completed the survey. Students

24
in ―educated abroad‖ and ―homeschooled/GED‖ categories have distinct characteristics which
separate them from the six main policy categories; therefore, they were excluded from the
analyses. This resulted in a final sample size of 15,797. The average age of the students was
21.3, and almost all were full-time students (94.3%). About two-thirds (65.8%) were female,
83.3 % were white, 85.7% were single, and 27.4% were senior class-rank. This sample profile is
reasonable when compared to the national averages for college students (62.7% female, 69.8%
white, 58.1% single, and 27.8% senior). Thus, this sample is similar to the overall demographics
of the college students, although students in this sample were more likely to be white and single
than the general student population (NASPA, 2008).
Procedure
Student participation was requested using emails delivered to their email addresses of
record. Students were informed that every one thousandth completed survey would receive a
$100 gift card. The email students received, which contained an informed consent document,
took them to the survey, where they had to affirm their assent to the informed consent statement
prior to beginning the study.
Measurement of Variables
Independent Variables
Demographic variable: The study involved college students‘ demographic variables:
age, gender, race, school rank, and marital status.
Financial variables: Financial variables were measured using monthly income, being
listed as a dependent on their parents‘ tax return, financial aid, and amount of debt.
Financial Education: Financial education was used to both check policy category and
capture the different forms of financial education. These questions were: ―Were you taught

25
about personal finances in high school?‖ and ―Have you ever taken a course, program, or
seminar on personal finance issues in your community, religious institution, or 4H-in other
words not through school?‖ Responses included yes or no. While a state may not have required
personal finance, individual school districts may have chosen to do so.
Policy Categories: The 50 states and the District of Columbia were divided into 6
categories of mandate policies based on the 2004 National Council on Economic Education
report.
Policy Category Coding Key
No
standards.
No testing
and no overt
policies, no
testing
Standards in
place.
Implementation
not required
Standards
must be
implemented
Course
required.
assessment not
mandatory
Course not
required.
assessment mandatory
Course
required.
assessment mandatory
1 2 3 4 5 6
Note: for brevity, the above numbers or captions are consistently used on all tables and figures.
Financial Social Learning Opportunities: The financial social learning opportunities
score was a composite measure based on four dimensions: discussions with parents, discussions
with peers, observing parents, and observing peers. The score utilized responses to eight items
representing these four dimensions. Scores for each dimension ranged from 8 to 40. This
measure was based on the work of Gutter and Garrison (2008).
Discussion: Students were asked how frequently in the past five years their parents and friends
or other students had discussed the following with them: manage expenses and avoid
overspending; check their credit report; pay bills on time; saving and investing; working with a
mainstream financial institution; buying and maintaining health insurance, auto insurance and
renter‘s insurance. The student answered by using a 5 point scale from 1=never to 5=often. The
average ―discuss finances with parent‖ score for students was 21.90 (SD=7.84) and the average

26
―discuss finances with friends‖ score was 17.05 (SD=6.68). In order to test the reliability of the
measure, Cronbach‘s Alpha was selected. Cronbach‘s Alpha internal consistency reliability was
calculated to be .86 for both discussion with parents and discussion with friends. This result
suggests that the inner consistency of the inventory was high.
Observing: Students were asked how frequently in the past five years they observed their
parents/caregivers and friends or other students involved in the following: managing expenses
and avoiding overspending; checking credit report; paying bills on time; saving and investing;
working with a mainstream financial institution; buying and maintaining health insurance, auto
insurance and renter‘s insurance. The student answered by using a 5 point scale from 1=never to
5=often. The average ―observing parents‘ financial behavior‖ score was 26.99 (SD=8.77), and
―observing friends‘ financial behavior‖ 17.26 (SD= 7.24). The inter-item reliability was high for
both observing parents (Cronbach‘s alpha = .87) and observing friends (Cronbach‘s alpha = .86).
Dependent Variables
Financial Dispositions:
Materialism: The Materialism Scale (Richins & Dawson, 1992) examines three factors
related to materialism: centrality, happiness, and success. The 18-item scale is measured on a 5-
point scale ranging from 1 (strongly agree) to 5 (strongly disagree). We used 15 items to measure
for college students materialism from Richins and Dawson‘ (1992) scale. We did not use three
items (―I don‘t pay much attention to the material objects other people own,‖ ―I usually buy only
things I need,‖ and ―I enjoy spending money on things that aren‘t practical‖) for analysis in this
study because students‘ responses were not fit for these three items. A participant can score from
15 to 75 on the scale. Some items were reverse-coded so that lower scores reflect lower levels of

27
materialism and higher scores reflect higher levels of materialism. The inter-item reliability was
high for college students (alpha = .86).
Compulsive Buying: The Compulsive Buying Scale (CBS), developed by Faber and
O‘Guinn (1992), is a screening instrument utilized to identify compulsive buyers. The CBS
consists of seven statements representing specific behaviors and feelings related to compulsive
buying. Six of the statements (e.g., ‗‗Felt others would be horrified if they knew of my spending
habits,‘‘ ‗‗Bought myself something in order to make myself feel better,‘‘ and ‗‗Felt anxious or
nervous on days I didn‘t go shopping‘‘) are rated on a scale from l=very often to 5=never. More
severe compulsive buying will result in lower scores on the scale. One of the statement (―If I
have any money left at the end of the pay period, I just have to spend it‖) rated on a scale from
1=strongly agree to 5=strongly disagree. We did not use this last item for analysis in the current
study because students‘ responses were not fit for this item. Cronbach‘s Alpha internal
consistency reliability was calculated to be .80.
Self-efficacy: Financial self-efficacy perceptions were assessed for 6 items. Two of the
items were generated from the original Money Ethic Scale (MES)‘ ―budget‖ factor; developed
by Tang (1992). These were: ―I budget my money very well‖ and ―I use my money very
carefully.‖. The following items were also used: To what extent do you see yourself as being
capable of . . .‘or ‗How confident are you that you will be able to . . . ’; Students answered by
using a 7-point, Likert-type scale where 1 meant strongly disagree and 7 meant strongly agree.
This indicated that higher level of self-efficacy perceptions will result in higher scores on the
scale. Cronbach‘s Alpha reliability of the scale was calculated as .96.

28
Future Orientation: Future orientation was measured by Strathman, Gleicher, Boninger
and Edwards‘s (1994) ‗‗Consideration of Future Consequences‘‘ (CFC) scale. This is a measure
of the extent to which people consider distant versus immediate consequences of possible
behaviors. The scale had 12 items. Respondents had to indicate the extent to which each
statement described them on a 5 point scale from 1 (doesn‘t describe me at all) to 5 (describes
me very well). Some items were reverse coded, thus a lower score indicated that students are
more present orientated while a higher score indicated that students are more future orientated.
Cronbach‘s Alpha internal consistency reliability was calculated to be .78
Willingness to Take Financial Risks: Willingness to take risks was measured with the
question, ―Which of the statements on this page come closest to the amount of financial risk that
you are willing to take when you save or make investments? Responses included: ―Take
substantial financial risks expecting to earn substantial returns‖, ―Take above average financial
risks expecting to earn above average returns‖, ―Take average financial risks expecting to earn
average returns‖, and ―Not willing to take any financial risks‖. This measure is commonly used
to account for the risk tolerance of the individual. Risk tolerance as a preference is known to
influence decision making under uncertainty such as insurance and investment decisions. For the
analyses take substantial financial risks and take above average financial risks were combined as
take above average financial risks. This measure of willingness to take financial risk is from the
Survey of Consumer Finances. The measure asks about willingness to take a risk proportional to
the expected benefit or return.
Financial Knowledge: Financial knowledge was measured with three statements; ―Rate
their level of knowledge on financial subjects‖, ―Financial knowledge quiz score‖ and ―Overall,
rate their knowledge of financial management compared to other people‖

29
Financial Behaviors: Financial behavior can be defined as any human behavior that is
relevant to money management. Common financial behaviors include budgeting, credit
utilization, and saving (Xiao, 2008; Xiao, Sorhaindo & Garman, 2006). For the purpose of this
study, information about credit card (number of credit card, using frequency, obtain time of first
credit card, amount of credit card, missed payment, acquire the credit card, and paying with
credit card), credit usage behaviors, budgeting, and saving were considered as financial
behaviors. Credit usage behaviors that can negatively impact one‘s credit score including:
making late payments, using full capacity of credit, and being a frequent revolver. Behavior can
be measured as a binary variable, whether or not to perform the behavior (Xiao, 2008). In the
present study, students were asked how frequently in the past year they had done the following:
maxed out their credit, been delinquent, and carried a balance. Responses included ‗0‘, ‗1-2‘, ‗3-
5‘, and ‗6 or more‘. Students without a credit card would have responded Not Applicable (N/A).
The more frequently students engaged in each behavior the higher their credit risk score was.
Budgeting was measured with the questions, ―Do you currently use a system to manage expenses
and avoid overspending?‖ and ―Have you used a budget in the past?‖ Saving was measured with
the questions, ―Are you currently depositing/investing money on a regular basis into some sort of
account (includes employer plans, mutual funds, individual retirement account (IRA), savings,
CDs)?‖ and ―saving in the past and plan to continue saving in the future‖. Responses included
yes or no. Financial behaviors include students‘ intentions toward budgeting and saving.
Responses included ―plan to next month‖, ―plan to next six months‖, ―plan to after I graduate‖
and ―I have no plan‖.
The following table summarizes these variables.
Demographic
(College
Students)
Financial Financial Education
(Yes or No questions)
Financial Social
Learning
Opportunities
Financial
Dispositions
Financial
Knowledge
Financial
Behaviors

30
Age Monthly
income
Were you taught about personal finances in high
school?
Discussion
Materialism
Based on responses about
centrality,
happiness, & success on the
18-item
Materialism Scale (Richins
and Dawson
1992)
Self-
reported
financial knowledge
Checking credit
report
Gender
Listed as
dependent on
parents‘ tax return
Have you ever taken a course, program, or seminar
on personal finance issues in
your community, religious institute, or 4H—in other
words not through school?
Observing
Compulsive
Buying
Based on
responses to 6-statement
Compulsive
Buying Scale (Faber and O‘
Guinn 1992)
Financial
quiz
Risky credit card
behaviors
Race Financial aid
Self-Efficacy
Based responses on Likert-type 7-degree scale to 6 statements
Perceived financial
knowledge
compared to other
people
Budgeting
School rank Amount of
debt
Future
Orientation
Based on 12-item Consideration of
Future
Consequences scale (Stratham,
Gleicher,
Boninger, and Edwards 1994)
Saving
Marital status Willingness to
Take Financial
Risks
Analyses
Preliminary exploration of the hypotheses includes simple bivariate comparisons utilizing
a cross-tabulation table and chi-square test to examine whether or not financial education,
financial disposition (risk tolerance), financial knowledge and financial behaviors differed by
policy category for the state in which they graduate high school. One–way analysis of variance
was then computed to compare means among categories of subjects on financial disposition
(materialism, compulsive buying, financial self-efficacy and future orientation) financial quiz
scales and self-reported financial knowledge variables by policy categories. When the F-test

31
indicated significant (.05) mean differences on a given variable, the Scheffe multiple comparison
test was used to isolate the specific between-category means that were significantly different.
This was followed by ordinary least squares regression for continuous measures and
binary logistic regression for the dichotomous measures. The dependent variables include
financial disposition, financial knowledge, students‘ use of a budget, saving and risky credit
behaviors. The factors that influence financial dispositions include demographics, financial
resources, financial education (including policy categories), financial social learning
opportunities and financial knowledge. The factors influencing financial knowledge include
demographics, financial resources, financial education (including policy categories), and
financial social learning opportunities.
The logistic regressions are used to test the relationship of policy category for their state
of high school graduation on financial behaviors. It was also important to examine the context of
high school education thus we compare a full and reduced model to determine whether factors
such as dispositions and social learning improved the model. This was tested using a likelihood
ratio test. The two models are summarized in the following table.
Reduced Model (Model 1) Full Model (2)
Demographics Demographics
Financial Resources Financial Resources
Financial Education
(including policy)
Financial Education (including
policy)
Financial Knowledge Financial Knowledge
Financial social learning
opportunities
Financial dispositions
A third model was estimated post analysis accounting for median state income, poverty
rates, and states economic productivity; these factors were not significant. Finally, structural
equation modeling techniques were used to examine the relationships among students‘

32
demographic, financial resources, social learning opportunities, financial disposition, financial
knowledge, policy category and financial behaviors. We employed AMOS 16.0 for overall
measurement model fit. The path model consists of links between demographic, financial
resources, social learning opportunities, financial knowledge, financial disposition, policy
category and financial behaviors.
RESULTS
BIVARIATE RESULTS
Policy Category and Financial Education
According to the results, most students were not taught personal finance in high school
within almost all policy categories (63.4%-67.8%), except the ―course required‖ category where
61.8% of students were taught personal finance in school (Figure 1). It is indicative of the fact
that personal finance is likely not taught unless somehow proscribed in the standards. Given the
state of many school budgets, there are many rationales provided as to why this is the case.
However this statistic should be monitored to be sure that it is increasing with policy changes.
This drives the significance test showing the variability of having had a class by category (²=
602.285; df = 5; p < .001). As can be seen in Figure 2, typically most students within all
categories (89.3%-92.0%) were not exposed to personal finance information in their
communities.
[Insert Figure 1, 2 about here]
Policy Category and Financial Dispositions
Figure 3 shows the results of a one-way ANOVA for differences in compulsive buying
among the policy categories. Among the six policy categories, compulsive buying scores are

33
almost the same. Students in states with ―standards only‖ with higher mean scores would
indicate that they were less prone to compulsive buying than those of other categories. However,
according to post-hoc analysis results, the students from states with ―standards only‖ had higher
mean scores (M=24.89) than those from states with ―no policy‖ (M=24.34), ―course required‖
(M=24.15), ―assessment required‖ (M=24, 24), and ―course and assessment required‖ (M=24.21)
(F=9.298, p<.001). As seen in Figure 4, students‘ future orientation scores in the ―course
required‖ category had a higher mean (M=23.09) than other policy categories. However, among
the six main policy categories, there are no significant differences on future orientation scores
(F=1.373, p>.05). The means of students‘ financial self-efficacy scores in ―standards only‖ were
higher (M=29.95) than those of other categories. According to post-hoc analysis results, there are
significant differences between ―standards only‖ and ―course required‖, ―assessment required‖,
―course and assessment required‖ policy category and ―no policy‖ and ―assessment required‖
category (F=8.040, p<.001). Results on materialism scores also showed significant differences
with mean scores of the ―course required‖ (M=41.63), and ―course and assessment required‖
(M=41.61) categories being higher, while ―standard with required implementation‖ category
being lower (M=40.03) than those of the other categories (F=5.322, p<.001). In general,
students had average risk tolerance within all policy categories. While chi-square test results
indicate that there was a significant difference in risk tolerance across categories, students in the
―standards only‖ category had the highest percentage of ―average risk tolerance‖ (61.0%) within
all policy categories (²=39.931, df=10, p<.001).
[Insert Figure 3, 4, 5, 6 about here]
[Insert Table 1about here]

34
Policy Category and Financial Knowledge
The differences in financial knowledge among the policy categories are shown in Figure
7. As can be seen, students‘ financial quiz scores were about the same in every category,
excluding: ―assessment required‖ (M=11.95). This category had significantly lower means than
other policy categories (F=11.711, p<.001). According to post-hoc analysis results for the six
policy categories, students in states with ―standards only‖ and ―standards that are required to be
implemented‖ had significantly higher financial quiz scores (M=12.48) than students in states
with a ―course only‖ (M=12.13) or an ―assessment only‖ (M=11.95). In addition, students in
states with ―no policies‖ had significantly higher financial quiz scores (M=12.38) than students in
states with a ―course only‖ (M=12.13) or an ―assessment only‖ (M=11.95) (F=11.711, p<.001).
Students‘ self-reported financial knowledge level scores also showed significant differences with
mean scores of the students in states with the most rigorous policy (course and assessment
required) being higher (M=25.53) than students in states with ―no policies‖ (M=24.75),
―standards only‖ (M=24.74), and a ―course only‖ (M=24.80) (F=5.210, p<.001). According to
the bivariate analysis results, it is possible to say that generally students believe they had ―better‖
knowledge of financial management compared to other people within all policy categories.
Among the six main categories, those in states with the most rigorous policies had the highest
percentage (59.2%) of students who perceived their level of financial knowledge to be ―better‖
than others; whereas states with ―assessment only‖ had the lowest percentage (54.7%) of students
who perceive their level of financial knowledge to be ―better‖ than others. However there were no
significant differences in perceiving financial knowledge among the six policy categories (²
=13.980, df=10, p>.05).
[Insert Figure 7, 8 about here]

35
[Insert Table 2 about here]
Policy Category and Financial Behaviors
Students‘ credit card numbers were relatively consistent across policy categories, but the
―standards only‖ category has a significantly higher percentage of students with one credit card
(42.5%) as compared to the other categories. The results show that almost one-third of the
students were using their credit card ―rarely‖ within the policy categories ―course required‖ and
―course and assessment required;‖ one-third of the students were using their credit card ―a few
times a month‖ within the policy categories ―no stated policy‖, ―standard only‖, ―standards with
required implementation‖, and ―assessment required.‖ Among the six policy categories, there are
significant differences with the highest percentage (44.9%) of students obtaining their first credit
card before college within the ―course required‖ policy category. While the levels of student
credit card balances was consistent across policy categories, states with ―standards only‖ had a
significantly higher percentage (54.4%) of credit card balance as ―$0‖, and states with ―no
policy‖ category had a significantly higher percentage (25.2%) of credit card balance as ―$1-
$499‖.
The vast majority of all students reported not missing a payment. Among the
six categories, states with ―standards only‖ had the significantly highest percentage (95.9%) of
students who did not miss a payment on a credit card bill by 30 days or more. As can be seen in
Table 3, the highest percentage of students in each category acquired their credit card from a
bank/financial institution in person. States with ―course required‖ had the significantly highest
percentage (47.3%) of students acquiring their credit card from a bank/financial institution.
[Insert Table 3 about here]

36
Approximately one-third to one-half of the students in each category usually use their
credit card for ―textbooks/school supplies‖, ―clothes and other personal items‖, ―groceries‖,
―eating out‖, and ―gas/auto, maintenance/auto repair‖ (p<.001).
[Insert Table 4 about here]
Most students within all policy categories did not have any risky credit behaviors (―max
out‖, ―make late payments‖, and ―do not pay off‖) behaviors. Among the six categories, states
with ―assessment required‖ had a significantly lower percentage of students reporting ―0‖ risky
credit behaviors than other categories (p<.05).
[Insert Table 5 about here]
Budgeting varies in a meaningful way by policy category. Generally more than half of
the students were not budgeting. The results show that significantly higher percentages of
students were budgeting within the policy categories ―course and assessment required‖ (52.9%),
―standards with required implementation‖ (51.4%), ―assessment required‖ (50.7%), and ―course
required‖ (50.3%).‖ Most students (39.7%- 46.1%) within all policy categories who were
budgeting reported that they had been using a budget for at least six months. Results on students‘
intentions towards budgeting showed significant differences across categories. Within each
category, the highest percentage of students who were not budgeting plan to do so after they
graduate (18.4 %- 26.9%), with the ―standards only‖ group having the highest percentage of
students that plan to do so after they graduate .
[Insert Table 6 about here]
Saving varies in a meaningful way by policy categories. Generally more than half of the
students reported that they save, except ―no state policy‖ category (49.9%). The results show that
the percentage of students in the policy categories who were saving was within the range of

37
51.8% (―course and assessment required‖) to 56.1% (―assessment required‖). Most of the
students who save reported that they plan to continue making the same regular contribution(s) to
saving in the future within all policy categories. While most of the students reported that they
had been saving for a year or more within all policy categories, states with ―standards only‖ and
―course only‖ had a significantly higher percentage (48.5%-48.4%) of students reporting they
had been saving or investing for a year or more. In regards to students‘ intentions towards
saving, the majority of students in each category who are not saving do plan to start saving after
graduation.
[Insert Table 7 about here]
MULTIVARIATE RESULTS
Financial Disposition
Materialism
Table 8 summarizes the results of OLS regressions predicting college students‘ financial
disposition. Male students were significantly more materialistic than female students. Older,
white, and graduate/professional/other students were significantly less materialistic than
younger and other ethnicity students. Students with lower income ($1-499) and students who had
federal work-study, scholarships, and tuition waivers also were significantly less materialistic
than those who have no income and financial aid. However, students with lower debt ($1-999),
higher debt ($5,000 or more) and not sure about debt, and students who had federal student loans
were significantly more materialistic than those who have no debt and financial aid. Students
who had a personal finance course in their community were significantly less materialistic than
those who had not personal finance in the community. Social learning opportunities also related
to materialism. Students who had discussed financial management with their parents and friends

38
were significantly more materialistic than those who had not had these discussions with others.
Students who had higher self-reported financial knowledge were significantly less materialistic
than those who had lower self-reported financial knowledge.
Students within ―standards with required implementation‖ policy category were
significantly less materialistic than those without any state policies.
Compulsive Buying
Older, sophomore, junior, senior and graduate/professional/other students were
significantly more prone to compulsive buying. However, white and male students were
significantly less prone to compulsive buying than other ethnicity and female students. Students
who have taken a personal finance course at high school were significantly more prone to
compulsive buying than those who have not taken. Financial characteristics were also related to
compulsive buying. Students with higher income ($500-1,000 or more) and students with all
levels of debt including those unsure of balances were significantly more prone to compulsive
buying than those who have no income and debt. Students who had federal student loans and
need-based financial aid were more prone to compulsive buying, while students who had
scholarships were less prone to compulsive buying than those who had not financial aid.
Students who had discussed financial management with their parents or friends or observed their
friends behavior were more prone to compulsive buying. Students who observed their parents
financial behavior were significantly less likely to compulsively buy than those who were not
observed. Thus modeling seemed to have a distinct impact from discussions; in this instance a
positive influence. Students who had a higher financial quiz score and higher self-reported
financial knowledge were less prone to compulsive buying than those who had a lower financial
quiz score and self-reported financial knowledge.

39
Students within ―standards only‖ and ―standards with required implementation‖ policy
categories scored better on the compulsive buying measure than those without any state policies.
Self-Efficacy
White and male students had significantly higher levels of financial self-efficacy than
other ethnicity and, female students. Younger and graduate/professional/ other students had
significantly lower levels of financial self-efficacy than older and freshman students. Students
with $500-999 income and students with all levels of debt had significantly lower levels of self-
efficacy than those who have no income and debt. Students who were listed as dependents on
their parents‘ tax return had significantly higher levels of financial self-efficacy than those who
were not dependent and not sure. Students who had federal student loans and need-based aid
displayed lower levels of self-efficacy, while students who had scholarships displayed higher
levels of self-efficacy than those who had not financial aid. Social learning is significantly
related to self-efficacy. Students who had discussed financial management with their parents and
observed their friends‘ financial behavior demonstrated significantly lower levels of self-efficacy
than those who had not discussed with their parents and not observed their friends financial
behavior. Students who had a higher score of self-reported financial knowledge and financial
quiz had significantly higher levels of self-efficacy than those who had a lower score of self-
reported financial knowledge and financial quiz.
Students within ―assessment required‖ and ―course and assessment required‖ had
significantly lower levels of financial self-efficacy, while students within ―standards only‖ had
significantly higher levels of financial self-efficacy than those in without any state policies.

40
Future Orientation
Demographic characteristics, financial characteristics and social learning opportunities
were significantly related to time orientation. Male and single students were more future-oriented
than female and married/separated/divorced students; however junior, senior and
graduate/professional/other students were present oriented. Students with lower debt ($1-999)
were more future-oriented, while students who had need-based funding and scholarships were
more present oriented. Students who had discussed financial management with their parents and
observed their friends financial behavior displayed significant future orientation. Students who
had higher financial quiz score and higher self-reported financial knowledge tended to be more
present oriented. Policy category was not related to this measure.
[Insert Table 8 about here]
Financial Risk Tolerance
Table 9 summarizes the results of the cumulative logistic regressions predicting college
students‘ financial risk tolerance. This modeled the likelihood that one would be willing to take
any financial risk, average financial risk, or above-average financial risk. Students who had
discussed financial management with their friends were more likely to be willing to take above
average financial risk than those who had not discussed. Financial knowledge positively related
to the likelihood of being willing to take above average financial risk. Students within ―standards
only‖, ―course required‖, and ―course and assessment required‖ policy categories were less likely
to be willing to take above average financial risk than those without any state policies.
Students who had a personal finance course in high school were more likely to be willing
to take average financial risk than other levels of risk compared to those who did not have a
course. Students who had a personal finance course in their community were less likely to be in

41
that category. Students within ―standards only‖, ―standards with required implementation‖, and
―course and assessment required‖ were more likely to be willing to take average financial risk
than those without any state policies.
Greater financial knowledge increased the likelihood one would be more willing to take
any financial risk as opposed to no financial risk. Students who had discussed financial
management with their friends were more likely to be willing to take any financial risk than
those who did not. Students who were ―course required‖ were more likely not to be willing to
take any financial risk than those without any state policies.
[Insert Table 9 about here]
Summary of Policy Effects on Financial Disposition
Students within the ―standards only‖ policy category were less compulsive buyers, less
likely to be willing to take above average financial risk and more likely to be willing to take
average financial risk and had higher levels of financial self-efficacy than those in without any
state policies. Students within the ―standards with required implementation‖ policy category
were significantly less materialistic, less compulsive buyers, and were more likely to be willing
to take average financial risk than those without any state policies. Students within ―course
required‖ policy category were less likely to be willing to take above average financial risk and
more likely to not be willing to take any financial risk those without any state policies. Students
within the ―assessment required‖ policy category had significantly lower financial self-efficacy
than without any state policies. Students within the ―course and assessment required‖ policy
category had significantly lower financial self-efficacy, were less likely to be willing to take
above average financial risk and were more likely to be willing to take average financial risk

42
than those without any state policies. Policy category had no significant effect on college
students‘ future orientation.
Financial Knowledge
Table 10 summarizes the results of OLS regressions predicting college students‘ financial
knowledge. Demographic, financial characteristics, financial education, social learning
opportunities and policy category were significantly predictive of college students financial quiz
score. Financial quiz score was significantly higher among students who had discussed financial
management with their friends and observed their parents financial behavior. However, financial
quiz scores were significantly lower among students who had discussed with their parents and
observed friends financial behavior.
Students who had taken a personal finance course in their community scored significantly
higher scores on the financial quiz than others. Students within the ―standards only‖ category had
significantly higher quiz scores. Students within the ―course required‖ and ―assessment required‖
policy categories had significantly lower financial quiz score than those without any state
policies. This may mean that peer learning and informal learning may be successful strategies. In
addition, the fact that people selected into the programs may also be indicative of difference in
readiness to learn; this would be a potential self-selection bias. Similar to financial quiz score
demographic, financial characteristics, financial education, social learning opportunities and
policy category were significantly predictive of college students‘ self-reported financial
knowledge. Social learning was also significantly related to self-reported financial knowledge.
Students who had discussed financial management with their parents and friends and observed
their friends‘ financial behavior had a higher self-reported financial knowledge score than those
who did not. Students who had taken a personal finance course at high school and in their

43
community had significantly higher self-reported financial knowledge score than those who did
not. Students within ―standards only‖ and ―course and assessment required‖ policy categories
had significantly higher self-reported financial knowledge score than those without any state
policies.
[Insert Table 10 about here]
Table 11 summarizes the results of the cumulative logistic regressions predicting college
students‘ perceived financial knowledge compared to other people. Demographic, financial
characteristics, financial education, and social learning opportunities were significantly
predictive of college students‘ perceived financial knowledge. Students who had discussed
financial management with their parents and friends and observed their parents financial
behavior had higher perceived knowledge. Those who observed friends financial behavior were
less likely to think of their knowledge as better than those who were not observed. Students who
had taken a personal finance course in high school and in their community were more likely to
perceive their financial knowledge as better than those who had not taken any personal finance
course. Policy category was not a significant factor for students‘ perceived financial knowledge
as better than others.
Demographic and financial characteristics, financial education, social learning
opportunities were significantly predictive of perceive students financial knowledge as same
with other people. Students who had discussed financial management with their parents and
friends and observed their parents financial behavior were less likely and students who observed
their friends‘ behavior more likely perceived their financial knowledge as same with others.
Students who had taken a personal finance course in their community were less likely to perceive

44
their financial knowledge as the same as others. Policy category was not a significant predictor
for students‘ perceived financial knowledge as the same as others.
Demographic and financial characteristics, financial education, and social learning
opportunities were significantly predictive of perceive college students‘ financial knowledge as
worse than others. Students who had discussed financial management with their parents and
friends and observed their parents‘ financial behavior less likely perceived their financial
knowledge as worse than others. As expected, financial education negatively related to perceived
financial knowledge as worse than others; policy category was not significant related. Social
learning negatively related to perceive financial knowledge as worse than others.
[Insert Table 11 about here]
Summary of Policy Effects on Financial Knowledge
Students within the ―standards only‖ category had significantly higher financial quiz
scores than those in other policy categories and those without any state policies. They also had
significantly higher self-reported knowledge than all other categories, with the exception of
―course and assessment required.‖ Students within the ―course required‖ and ―assessment
required‖ policy categories had significantly lower quiz scores than students with no state
policies. As we see here, just having a standard at all and having the most rigorous standard
correlate with higher levels of financial quiz and self-reported financial knowledge.
Financial Behaviors
Budgeting
Table 12 summarizes the logistic regression results predicting budgeting and saving
behaviors. According to first model of logistic regression analysis results; gender, school rank,
marital status, and taking a personal finance course were significantly related to budgeting.
45
Students who had a higher score of self-reported financial knowledge were more likely to
budget, and students who perceive their financial knowledge as worse compared to other people
were less likely, and students who perceive their financial knowledge as better compared to other
people were more likely to budget than those who perceive their financial knowledge as same
compared to other people.
Students within ―standards with required implementation,‖ ―assessment required,‖ and
―course and assessment required,‖ policy categories were more likely to budget, however
students within ―standards only‖ policy category were less likely to budget than those in ―no
state policy‖ category.
In the second model we tested whether financial social learning opportunities and
financial behavior related to budgeting or not. Students who had discussed financial management
with their parents and friends were more likely to budget than those who had not discussed with
their parents and friends. Financial dispositions were significantly related to budgeting, with
higher levels of self-efficacy being positively related to budgeting, and higher levels of future
orientation and materialism being negatively related to budgeting. The relationship between
budgeting and efficacy is likely reflective of association. Those who budget feel better about
their situation and are likely asserting some control over it and feel better about the usefulness of
this activity. However, those more interested in the future and material objects may be less likely
to focus on managing current day to day and instead are thinking more long term. Policy
category was significantly related to budgeting when adding in financial dispositions and
financial social learning opportunities. Students within ―standards with required
implementation,‖ ―course required‖, ―assessment required,‖ and ―course and assessment

46
required‖ policy categories were more likely to budget, however students within ―standards
only‖ policy category were less likely to budget than those in the no state policy category.
Saving
According to reduced model, race, gender, school rank, marital status, and taking a
course on personal finance in the community were significantly related to the likelihood of
saving. Financial knowledge was significantly related to the likelihood of saving. Students who
had higher self-reported financial knowledge and students who perceive their financial
knowledge as better than other people were more likely to be saving, and students who perceive
their financial knowledge as worse than other people were less likely saving than others.
Students within the ―standards only‖, ―course required‖ and ―assessment required‖ policy
categories were more likely to be saving than those without any state policies..
In the second model, social learning was an important determinant of saving. Students
who had discussed financial management with their parents and friends were more likely saving
than those who had not discussed with their parents and friends. Financial disposition also was a
predictor of saving. Higher levels of compulsive buying and self-efficacy were positively related
to saving. Students who were not willing to take any financial risk were less likely to be saving
than those who were willing to take average financial risks. Students who had higher levels of
financial self efficacy and who were less prone to compulsive buying were more likely saving
than those who had lower levels of financial self-efficacy and who were more prone to
compulsive buying .
Policy category was significantly related to saving when adding in financial dispositions
and financial social learning opportunities. Students within the ―course required‖ and

47
―assessment required‖ policy categories were more likely to be saving than those in the no state
policy category.
[Insert Table 12 about here]
Risky Credit Behaviors
“Max out” credit cards
Table 13 summarizes the results of logistic regressions predicting risky credit behaviors
about ―max out‖, make late payments on credit cards, and do not pay off credit card balance fully
each month. A higher score of self-reported financial knowledge negatively related to ―max out‖
credit cards. Students within ―standards only‖ and ―course required‖ policy categories were less
likely to ―max out‖ credit cards than those without any state policies.
In the second model financial disposition and social learning opportunities significantly
related to ―max out‖ credit cards, Students who were less prone to compulsive buying was
lower the likelihood of having maxed out their credit cards. Greater self-efficacy was negatively
related to the likelihood of having maxed out their credit cards. Those who had observed their
parents financial behaviors were less likely to have maxed out their credit cards. Policy
category was significantly related to ―max out‖ credit cards when adding in financial social
learning opportunities and financial dispositions. Students within ―course required‖ policy
category were less likely to ―max out‖ credit cards than those with no state policies.
Make late payments on credit cards
As expected higher score of financial quiz, self-reported financial knowledge, and
perceived financial knowledge better than others negatively related to make late payments.
Students within ―standards only‖ and ―course required‖ were less likely to make late payments
than those without any state policies.

48
In the second model, financial social learning and financial disposition significantly
related to make late payment. Students who had observed their parents‘ financial behavior were
less likely to make late payments on their credit cards. This would be consistent with the
implications of Social Learning Theory, modeling behaviors is a key aspect of the social learning
process. Students who were less prone to compulsive buying were less likely to make late
payments on their credit cards. Students with higher levels of self-efficacy were less likely to
make late payments on their credit cards. Policy category also was significantly related to
making late payments in the second model. Students within ―course and assessment required‖
policy category were less likely to make late payments on their credit cards than those without
any state policies.
Does not pay off credit card balance fully each month
Students within the ―standards only‖, ―standards with required implementation‖, ―course
required‖, and ―course and assessment required‖ categories were more likely to be paying their
cards off fully each month than those with no state policy categories.
In the second model, financial disposition significantly related to do not pay off balance
fully. Students who were less prone to compulsive buying were more likely to pay off their
credit cards balance fully each month. Additionally, students who had higher levels of self-
efficacy and who were more future-oriented were more likely to pay off their credit cards
balance fully each month. Similar to first model, students within the ―standards only‖, ―standards
with required implementation‖, ―course required‖, and ―course and assessment required‖
categories were more likely to be paying their cards off fully each month than those without any
state policies s in the second model.
[Insert Table 13, 14 about here]

49
Summary of Policy Effects on Behaviors
When not accounting for social learning opportunities and financial dispositions, students
in states with ―standards with required implementation,‖ ―assessment required,‖ and ―course and
assessment required,‖ were more likely to budget. Students in states with ―standards only‖ were
less likely to budget than students in other policy categories. Students within the ―standards
only‖, ―course required‖ and ―assessment required‖ policy categories were more likely to be
saving than all other categories. Students within ―standards only‖ and ―course required‖ policy
categories were less likely to ―max out‖ credit cards than other policy categories. Students within
―standards only‖ and ―course required‖ were less likely to make late payments than other policy
categories. Students within the ―standards only‖, ―standards with required implementation‖,
―course required‖, and ―course and assessment required‖ categories were more likely to pay off
their credit card balance fully each month than all other policy categories. The significance of
policy categories in the second model should be taken to mean that there is a significant role
being played by school-based or formal financial education. The complex role that both social
learning and financial education play in terms of shaping knowledge, dispositions, and behaviors
is best modeled in regression. When accounting for social learning opportunities and financial
dispositions, students in states with ―standards with required implementation,‖ ―course required‖,
―assessment required,‖ and ―course and assessment required,‖ were more likely to budget.
Students in states with ―standards only‖ were less likely to budget than students in other policy
categories. Students within the ―course required‖ and ―assessment required‖ policy categories
were more likely to be saving than all other categories. Students within ―course required‖ policy
category were less likely to ―max out‖ credit cards than other policy categories. Students within
―course and assessment required‖ were less likely to make late payments than other policy

50
categories. Students within the ―standards only‖, ―standards with required implementation‖,
―course required‖, and ―course and assessment required‖ categories were more likely to pay off
their credit card balance fully each month than all other policy categories.
The following section will show the direct and indirect relationships of financial
education and social learning in shaping behaviors. . In understanding the complex nature of
financial behavior, the following analysis uses Structural Equation Modeling.
Structural Equation Model: Defining the Relationships among Financial Education,
Financial Socialization, and the Outcome Measures.
To conduct structural equation modeling, we employed AMOS 16.0. Figure 9 contains
the Hybrid Structural Equation Model in graphic form. Table 15 presents the results of the
structural model. The CFA results for overall measurement model fit were as follows:
²=7149.077, p<0.0001; CFI=.922; IFI=.922; TLI= .895; GFI=.968; RMSEA= .041. These
indices are all indicative of a strong fit of the model to the data. The paths represent a direct link
from demographic variables to social learning, financial knowledge, financial disposition, and
financial behavior; a direct link from financial resources to social learning, financial knowledge,
financial disposition, and financial behavior; a direct link from social learning to financial
knowledge, financial disposition, and financial behavior; a direct link from financial knowledge
to financial disposition and financial behavior; a direct link from financial disposition to
financial behavior; and a direct link from policy category to financial behavior. All of these paths
are significant. This finding indicates that college students‘ demographics, financial resources,
financial knowledge, financial dispositions, social learning opportunities and state policy
categories directly influence their financial behaviors.
Figure 9. Hybrid Structural Equation Model for Financial Behavior

51
FIn Beh
budget FB11
1
creditreport FB2
1
savettm FB3
1
Demog
schoolrankD4
11 sexmaritalD3
1
ageD1
1
FinKnow
finknowlevel
FK2
1
1fguizre
FK1
1
SocLearn
fsoclearnparentdisSL1
fsoclearnfriendisSL2
fsoclearnparentobserSL3
fsoclearnfriendobserSL4
11
1
1
1
FinRes
loanamountFR4
parentssupportFR3
incomeFR2
workhoursFR1
11111
Fin Disp
materialism FD1
1
1
combuying FD2
1
f inselfefficacy FD3
1
futureorientation FD4
1
overfinknowre
FK3
1
otherdebtFR5
1 rentins FB4
1
healthins FB5
1
autoins FB6
1
SL5
1
FD6
1
FB7
1
FK4
1
policycat
[Insert Table 15 about here]
Having a Policy Versus None
An additional set of regressions were estimated to determine simply whether having any
policy led to greater behavioral outcomes. This analysis used a logistic regression and the results
are briefly summarized in this section.
In the reduced model, compared to having no policy, students in states that did have a
policy were significantly less likely to engage in compulsive buying and less likely to have lower
financial self-efficacy. In addition, they were more likely to be willing to take average and above
average financial risk. These students were also more likely to budget, save, and pay their credit
cards off fully each month and less likely to max out credit cards and make late payments.
In the full model, students in states that did have a policy were significantly less likely to
engage in compulsive buying In addition, they were more likely to be willing to take average

52
and above average financial risk. These students were also more likely to save and pay their
credit cards off fully each month and less likely to max out credit cards.
CONCLUSIONS
This study focused on the relationships among state financial education policies, student
characteristics, social learning opportunities, financial dispositions, financial knowledge and
student financial behaviors. It used data from a web survey collected during 2008 from college
campuses across the United States to explore these relationships. Bivariate relationships were
proposed and explored using cross tabulations and mean-comparison techniques. Then, OLS
regression and logistic regression were used to identify the relationships between policy category
and indicators of financial dispositions, financial knowledge, and financial behaviors when
controlling for other factors, financial characteristics, financial education, financial social
learning opportunities, financial knowledge and financial dispositions. Finally, structural
equation modeling was used to define the model of financial behavior. The multivariate results
of this study provide several key conclusions.
Financial education and policy category are significantly related to some financial
dispositions. Students who were taught personal finance in high school were more prone to
compulsive buying than those who were not taught. Students within ―standards with required
implementation‖ category were less materialistic than those without any state policies. Students
within ―standards only‖ and ―standards with required implementation‖ categories were less
prone to compulsive buying than those with no state policies. Students in the ―assessment
required‖ and ―course and assessment required‖ categories had lower levels of self-efficacy and
students in the ―standards only‖ category had higher levels of self-efficacy than those with no
state policies. We found that policy category did not influence students‘ future orientation scores.

53
Students within ―standards only‖, ―standards with required implementation‖, and ―course and
assessment required‖ were more willing to take average financial risk than those without any
state policies.
Financial education and policy category are significantly related to financial knowledge.
Students who taken personal finance course in high school and in their community had higher
level of self-reported financial knowledge and students who taken personal finance course in
their community had higher level of financial quiz score than those who had not taken personal
finance course . Also students who were taught personal finance course both in high school and
in their community perceived their financial knowledge as better than those who were not taught
personal finance. One interesting result was that students in the ―course required‖ and
―assessment required‖ policy categories had lower financial quiz scores than students in the other
categories, and students in the ―standards only‖ policy category had higher financial quiz score
than other five policy categories. On the other hand, students in states with the ―standards only‖
and ―course and assessment required‖ had higher self-reported financial knowledge scores than
other four policy categories. In the both regression model, financial education and financial
education policies were significantly related to financial behaviors. In the reduced model,
students who taken personal finance course in their community were more likely to be budgeting
and saving than those who had not. Students within the ―standards with required
implementation,‖ ―assessment required,‖ and ―course and assessment required‖ policy categories
were more likely to budget than students in states with ―no policy‖. Students in the ―standards
only‖, ―course required‖, and ―assessment required‖ more likely to be saving than students in
states with ―no policy. Policy category also significantly related to risky credit card behaviors.
Students in the ―standards only‖ and ―course required‖ were less likely to ―max out‖ and make

54
late payments on their credit cards than students in states with ―no policy‖. Students in the
―standards only‖, ―standards with required implementation‖, ―course required‖ and ―course and
assessment required‖ were more likely to pay their credit cards off fully each month than
students in states with ―no policy‖ category.
When controlling for social learning and financial dispositions, again financial education
and policy category were significantly related to financial behaviors. In the full model, students
who had taken a personal finance course in school and in their community were more likely to be
budgeting and students who had taken a personal finance course in their community were more
likely saving than those who had not. Students within the ―standards with required
implementation,‖ ―course required‖, ―assessment required,‖ and ―course and assessment
required‖ policy categories were more likely to budget, however, students within standards only‖
were less likely budget than students in states with ―no policy‖ category. Students in the ―course
required‖ and ―assessment required‖ were more likely to be saving than students in states with
―no policy‖ category. Similar to reduced model, policy category also significantly related to
risky credit card behaviors. Students in the ―course required‖ were less likely to ―max out‖ and
students in the ―course and assessment required‖ were less likely to make late payments on their
credit cards than students in states with ―no policy‖ category. Students in the ―standards only‖,
―standards with required implementation‖, ―course required‖ and ―course and assessment
required‖ were more likely to pay their credit cards off fully each month than students in states
with ―no policy‖ category.
The SEM analysis clarifies this issue greatly. The results of the SEM capture the role that
each of these factors does play. The primary influences on financial behaviors include policy
category, financial dispositions, and financial knowledge. The regression for financial

55
knowledge shows that policy category was predictive of both higher performance on the
knowledge assessment and higher levels of self-reported knowledge. In particular having a
standard was a key tipping point for financial knowledge with only the most rigorous policy of
having both a course and assessment required producing higher levels of self-reported
knowledge. Thus, the remaining states without policies should clearly consider adopting
standards at the minimum.
Overall, this study shows that financial behaviors of college students vary by state policy
on financial education, even when controlling for demographics, financial resources, financial
education, financial knowledge, financial social learning opportunities and financial disposition.
Social learning was an important determinant of financial dispositions.
In addition, college students will be engaged in various financial transactions out of
necessity. Thus regardless of having had a class, many students will need checking accounts and
will opt to learn to use them through self-education, social learning opportunities, or simply from
trial and error (experience). However, lack of any formal education can lead to false financial
knowledge and as such social learning and self education by themselves may be problematic.
Yet, financial knowledge is seen as a key predictor of financial behavior, while financial
education is a key predictor of knowledge. Thus, since having standards was a key tipping point
in our measures of financial knowledge, having standards should be considered a minimum, with
requiring courses and assessment being the ideal, since that had an even stronger impact on
knowledge.
Implications for further research
The results of this study can reasonably be generalized to students from these states who
attended four year universities. This study should be replicated to determine if similar patterns

56
exist for the other half of US High school students who did not or do not go to college. Students
were not randomly assigned to receive financial education or not. Further research would benefit
from some attempts at randomized treatment for subjects.
An important follow-up study should use the results of this study to consider the potential
dollar impact of financial education mandate to a community or a state. In other words, if states
were to change a policy, what would be the expected return on investment?
Following up with individual states to evaluate specific curriculum use would be a key
piece in further identifying the best practices in terms of policies. This would include both
classroom experiences and hands-on experiences, such as having a credit union in the school.
Additional question are raised. What factors moderate the influence of social learning on
dispositions; does this vary by gender, race/ethnicity, rural vs. urban vs. suburban status? How
does community education versus formal education relate; is the relationship on knowledge the
same regardless?
One limitation of this study was the lack of control for teacher background. Are all
teachers equally prepared for providing this education? How does implementation of financial
education vary among schools? How do the various state standards match up with teacher
preparation standards in those states?
Implications for state education policymakers
There is clear evidence that students from states with no policies tend to fare worse on the
majority of outcome measures (dispositions, knowledge, and behavior) than students from other
states. It is not clear that all states should require a class. However what is clear is that having
some standard with mandatory implementation or better seems to be a tipping point with respect
to many of our outcome measures. States should be encouraged to achieve this minimum. More

57
rigorous polices would continue to be encouraged beyond this minimum but effort is best spent
in moving more states to meet this minimum first.
In addition, the possibility that education may need to compete with social learning and
personal experience points to the need for financial education to be an ongoing process
beginning at earlier ages before poor habits may take root. One implication of this may be to
have personal finance education standards in place for younger ages.
Implications for outreach
Building on the previous point, community educators should be aware of the need to
provide programming across the lifespan beginning with youth. This may also prompt a need for
additional programming and evaluation of such youth oriented programs.
Further, the significance of the Social Learning Opportunities measure points to the
importance of financial socialization. In order to encourage and perhaps guide such processes, it
is important to create, pilot, and evaluate family-oriented or social learning opportunity oriented
financial education. There is a need to encourage greater sharing; parents need to explain
behaviors to children not just model them. This message could be distributed through social
marketing as well.
REFERENCES
Bakken, R. (1967). Money management understandings of tenth grade students. National
Business Education Quarterly, 36, 6.
Bandura, A. (1977). Social learning theory. New York: General Learning Press.
Bandura, A. (1986). Social foundations of thought and action: A social cognitive theory.
Englewood Cliffs, NJ: Prentice Hall.
Bandura, A. (1997). Self-efficacy: The exercise of control. New York: W.H. Freeman.
Bandura, A., & Adams, N. E. (1977). Analysis of self-efficacy theory of behavioral change.
Cognitive Therapy and Research, 1(4): 287-310.

58
Barrese, J., Garner, L., & Thrower, E. (1998). Changing attitudes about insurance through
education. CPCU Journal, 51(3): 144-159.
Bernheim, B. D., Garrett, D. M., & Maki, D. M. (2001). Education and saving: The long-term
effects of high school financial curriculum mandates. Journal of Public Economics, 80(3):
435–465.
Bernheim, B. D., Garrett, D. M., & Maki, D. M. (1997). Education and saving: The long-term
effects of high school financial curriculum mandates. Cambridge, MA: National Bureau of
Economic Research.
Borden, L., Lee, S., Serido, J., & Collins, D. (2008). Changing college students‘ financial
knowledge, attitudes and behavior through seminar participation. Journal of Family and
Economic Issues, 29(1), 23–40.
Bowen, C. F. (2002). Financial knowledge of teens and their parents. Financial Counseling and
Planning, 13(2), 93-102.
Chen, H., & Volpe, R. P. (1998). An analysis of personal financial literacy among college
students. Financial Services Review, 7(2): 107-128.
Cunningham, J. (2000). College student credit card usage and the need for on-campus financial
counseling and planning services. Undergraduate Research Journal for the Human
Sciences. http://www.kon.org/urc/cunningham.html.
Danes, S. M., & Haberman, H. (2004). 2003-2004 evaluation of the NEFE HSFPP. Retrieved
December 10, 2004, from
http://www.nefe.org/hsfppportal/includes/main/home.asp?page=4000#evaluation2
Danes, S. M., & Hira, T. K. (1987). Money management knowledge of college students. Journal
of Student Financial Aid, 17(1): 4-16.
Danes, S. M., Huddleston-Casas, C. A., & Boyce, L. (1999). Financial planning curriculum for
teens: Impact evaluation. Financial Counseling and Planning, 10(1): 25-37.
Faber, R. J., & O‘Guinn, T. C. (1992). A clinical screener for compulsive buying. Journal of
Consumer Research, 19 (3): 459-469
Gutter, M.S. & Garrison, S. (2008). Perceived norms, financial education, and college student
credit card behavior. Journal of Consumer Education, 24, 73-88.
Hilgert, M. A., Hogarth, J. M. & Beverly, S. G. (2003). Household financial management: The
connection between knowledge and behavior. Federal Reserve Bulletin,
http://www.nefe.org/hsfppportal/includes/main/home.asp?page=4000#ExecutiveSummary2

59
Huddleston Casas, C. A., Danes, S. M., & Boyce, L. (1999). Impact evaluation of a financial
literacy program: Evidence for needed educational policy changes. Consumer Interests
Annual, 45, 109–114.
Joo, S., Grable, J. E., & Bagwell, D. C. (2003). Credit card attitudes and behaviors of college
students. College Student Journal, 37(3): 405-419.
Jump$tart Coalition. (1997). High school seniors lack financial smarts shows survey. American
Savings Education Council News Release.
Jump$tart Coalition. (2002). Financial literacy declining among 12th graders, coalition urges
states to include personal finance in curriculum standards. Retrieved November 10, 2006,
from http://www.jumpstartcoalition.org
Katona, G. (1975). Psychological economics. New York: Elsevier.
Kim, J. 2000. The effects of workplace financial education on personal finances and work
outcomes. Unpublished doctoral dissertation Virginia Polytechnic Institute and State:
Blacksburg.
Langrehr, F. W. (1979). Consumer education: Does it change students' competencies and
attitudes? Journal of Consumer Affairs, 13(1): 14-53.
Langrehr, F. W., & Mason, J. B. (1978). The influence of formal instruction in consumer
education academic units on attitudes toward the marketplace: A case study of Illinois
students. Journal of Economic Education, 9, 133-134.
Lyons, A. C. (2003). Credit practices and financial education needs of Midwest college students.
Champaign, IL: Department of Agricultural and Consumer Economics, University of
Illinois at Urbana-Champaign.
Lyons, A. C. (2004). A profile of financially at-risk college students. Journal of Consumer
Affairs, 38(1): 56-80.
Lyons, A. C. 2008. Risky credit card behavior of college students. In J.J. Xiao (Ed.), Handbook
of Consumer Finance Research (pp. 185-208). New York: Springer.
National Council on Economic Education (NCEE). (2005). Survey of the States: Economic and
Personal Finance Education in Our Nation‘s Schools in 2004. New York: National Council
on Economic Education.
National Council on Economic Education (NCEE). (2007). Survey of the States: Economic and
Personal Finance Education in Our Nation‘s Schools in 2007. New York: National Council
on Economic Education.
http://www.cfed.org/imageManager/_documents/NCEESurvey2007.pdf
60
Norum, P. (2008). The role of time preference and credit card usage in compulsive buying
behavior. International Journal of Consumer Studies, 32, 269-275.
Peng, T. M., Bartholomae, S., Fox, J. J., & Cravener, G. (2007). The impact of personal financial
education delivered in high school and college courses. Journal of Family & Economic
Issues, 28, 265-284
Peterson, N. A. (1992). The high school economics course and its impact on economic
knowledge. Journal of Economic Education, 23(1): 5-16.
Rha, J-Y., Montalto, C. P. & Hanna, S. D. (2001). The effect of saving goals and expectations on
household saving behavior. Paper presented at the Academy of Financial Services.
Richins, M. L., & Dawson, S. (1992). A consumer values orientation for materialism and its
measurement: Scale development and validation. Journal of Consumer Research, 19 (3):
303-316.
Rook, D. W., & Fisher, R. J. (1995). Differences in self-control among spenders and savers.
Psychology: A Journal of Human Behavior, 32(2): 8-17.
Schug, M. C., Wynn, R. L., & Posnanski, T. J. (2002). Improving economic and
financial education: A program for urban schools. Social Education, 66(4): 239-244.
Strathman, A., Gleicher, F., Boninger, D. S., & Edwards, C. S. (1994). The consideration of future
consequences: Weighing immediate and distant outcomes of behavior. Journal of Personality of
Social Psychology, 66 (4): 742-752
Tennyson, S., & Nguyen, C. (2001). State curriculum mandates and student knowledge of
personal finance. Journal of Consumer Affairs, 35(2): 241-262.
Tokunaga, H. (1993). The use and abuse of consumer credit: Application of psychological theory
and research. Journal of Economic Psychology, 14, 285-316.
Xiao, J. J. (2008). Applying behavior theories in financial behaviors. In J. J. Xiao (Ed.),
Handbook of Consumer Finance Research (pp. 69-81). New York: Springer.
Xiao, J.J., Sorhaindo, B., & Garman, E.T. 2006. Financial behaviors of consumer in credit
counseling. International Journal of Consumer Studies 30(2), 108-121.
Varcoe, K. P., Allen, M., Devitto, Z., & Go, C. (2005). Using a financial education curriculum
for teens. The Journal of the Association for Financial Counseling and Planning Education,
16, 63-71.
Varcoe, K. P., Peterson, S., Garrett, C., Marten, A., Rene, P., & Costello, C. (2001). What teens
want to know about financial management. Journal of Family and Consumer Sciences,
93(2): 30-34.

61
Volpe, R. P., Chen, H., & Pavlicko, J. J. (1996). Personal investment literacy among college
students: A survey. Financial Practice and Education, 6(2): 86-94.
Figure 1. Personal Finance Taught in High School by Policy Category

62
0%
10%
20%
30%
40%
50%
60%
70%
80%
90%
100%
policy 1 policy 2 policy 3 policy 4 policy 5 policy 6
67.8 65.2 63.8
38.2
66 63.4
32.2 34.8 36.2
61.8
34 36.6
Yes
No
Figure 2. Personal Finance in Community by Policy Category
82%
84%
86%
88%
90%
92%
94%
96%
98%
100%
policy 1 policy 2 policy 3 policy 4 policy 5 policy 6
90.192.0
90.491.4
89.391.0
9.98.0
9.68.6
10.79.0
Yes
No
Figure 3. Compulsive Buying by Policy Category

63
23.5
24.0
24.5
25.0
policy 1policy 2
policy 3policy 4
policy 5policy 6
24.34
24.89
24.58
24.15 24.2424.21
Compulsive Buying
Compulsive Buying
Figure 4. Future Orientation by Policy Category
22.90
22.92
22.94
22.96
22.98
23.00
23.02
23.04
23.06
23.08
23.10
policy 1
policy 2
policy 3
policy 4
policy 5
policy 6
23.01
22.9922.97
23.09
23.03
22.97
Future Orientation
Future Orientation
Figure 5. Financial Self-efficacy by Policy Category

64
Figure 6. Materialism by Policy Category
Table 1. Financial Risk Tolerance by Policy

65
Policy Categories
Financial Risk Tolerance %
No risk Average
risk
Above average and
substantial risk
No stated policy 16.6 56.1 27.3
Standards only 14.7 61.0 24.3
Standards with required
implementation 15.0 58.4 26.6
Course required 19.6 56.3 24.1
Assessment required 20.5 53.0 26.5
Course and assessment required 16.1 59.9 24.0
Total 16.5 57.8 25.6
²=39.931, df=10, p<.001
Figure 7. Financial Quiz by Policy Category
11.6
11.7
11.8
11.9
12.0
12.1
12.2
12.3
12.4
12.5
policy 1 policy 2 policy 3 policy 4 policy 5 policy 6
12.38
12.48 12.48
12.13
11.95
12.37
Financial Quiz
Financial Quiz
Figure 8. Self-Reported Financial Knowledge by Policy Category

66
24.2
24.4
24.6
24.8
25.0
25.2
25.4
25.6
policy 1
policy 2
policy 3
policy 4
policy 5
policy 6
24.75 24.74
25.00
24.80 24.78
25.53
Self-Reported Financial Knowledge
Sel-Reported Financial Knowledge
Table 2. Perceive Financial Knowledge by Policy Category
Policy Categories Perceive Financial Knowledge %
Worse Same Better
No stated policy 13.8 27.9 58.4
Standards only 12.8 30.2 57.0
Standards with required
implementation 12.5 29.1 58.5
Course required 13.3 30.5 56.3
Assessment required 15.1 30.2 54.7
Course and assessment required 12.7 28.1 59.2
Total 13.2 29.0 57.8
²= 13.980; df = 10; p> .05

67
Table 3. Information about Credit Card by Policy Category
Policy categories
Total No
stated
policy
Standards
only
Standards with
required
implementation
Course
required
Assessment
required
Course
and
assessment
required
Credit card
number %
None 24.9 27.6 23.6 26.7 31.7 26.5 26.0
1 38.1 41.0 42.5 39.6 35.0 39.2 39.5
2 19.0 18.3 19.2 17.6 17.1 16.6 18.2
3 10.0 8.0 8.4 9.2 8.8 8.9 9.1
4 or more 8.0 5.2 6.3 6.9 7.5 8.9 7.2
Total 100.0 100.0 100.0 100.0 100.0 100.0 100.0 ²=57.857, df=20, p<.001
Credit card
frequency%
Emergency 13.7 14.4 14.0 19.4 19.4 18.3 15.6
Rarely 25.3 21.9 26.1 27.9 27.1 27.5 25.5
A few times a
month 28.6 30.3 28.6 24.2 28.1 25.1 27.7
A few times a
week 19.8 23.7 19.8 20.2 15.6 19.9 20.5
Almost daily 12.7 9.7 11.5 8.2 9.7 9.2 10.7
Total 100.0 100.0 100.0 100.0 100.0 100.0 100.0 ²=97.083, df=20, p<.001
First credit
card %
Before college 42.1 41.0 38.7 44.9 38.7 41.5 41.6
First year of
college 34.7 32.2 36.9 28.1 36.1 32.9 33.4
After first year
of college 23.2 26.8 24.4 27.0 25.2 25.6 25.0
Total 100.0 100.0 100.0 100.0 100.0 100.0 100.0 ²=30.867, df=10, p<.001
Credit card
amount %
$0 45.6 54.4 47.7 50.6 49.0 52.4 49.5
$1-499 25.2 24.9 24.8 24.5 21.4 21.1 24.2
$500-999 8.3 7.1 7.8 8.0 8.0 6.7 7.7
$1000-2999 9.8 7.4 10.0 8.3 8.0 9.2 9.0
$3000-4999 4.3 2.8 3.9 3.5 5.3 4.2 3.9
$5000 or more 5.3 2.7 5.0 3.8 5.8 5.4 4.6
Not sure 1.6 0.7 0.8 1.3 2.4 1.1 1.2
Total 100.0 100.0 100.0 100.0 100.0 100.0 100.0 ²=92.379, df=30, p<.001

68
Missed
Payment %
No 93.8 95.9 95.2 93.7 93.2 94.2 94.4
Yes 6.2 4.1 4.8 6.3 6.8 5.8 5.6
Total 100.0 100.0 100.0 100.0 100.0 100.0 100.0 ²=12.979, df=5, p<.05
Acquire
credit card
%
Mail 18.3 17.4 12.9 15.9 15.8 15.7 16.6
Campus table 3.9 2.3 2.8 3.3 2.6 4.1 3.3
Bank/financial
Institution 36.1 44.9 47.3 36.9 34.0 36.5 39.3
Retail store 5.9 5.4 4.1 6.8 5.5 7.3 5.9
Phone 1.7 1.3 0.9 1.3 1.8 1.2 1.4
Online 12.9 11.2 10.0 12.5 14.0 12.0 12.1
Parents 16.3 12.9 16.2 16.8 19.0 17.1 16.0
Other 4.9 4.6 5.8 6.5 7.1 6.0 5.4
Total 100.0 100.0 100.0 100.0 100.0 100.0 100.0 ²=125.582, df=35, p<.001
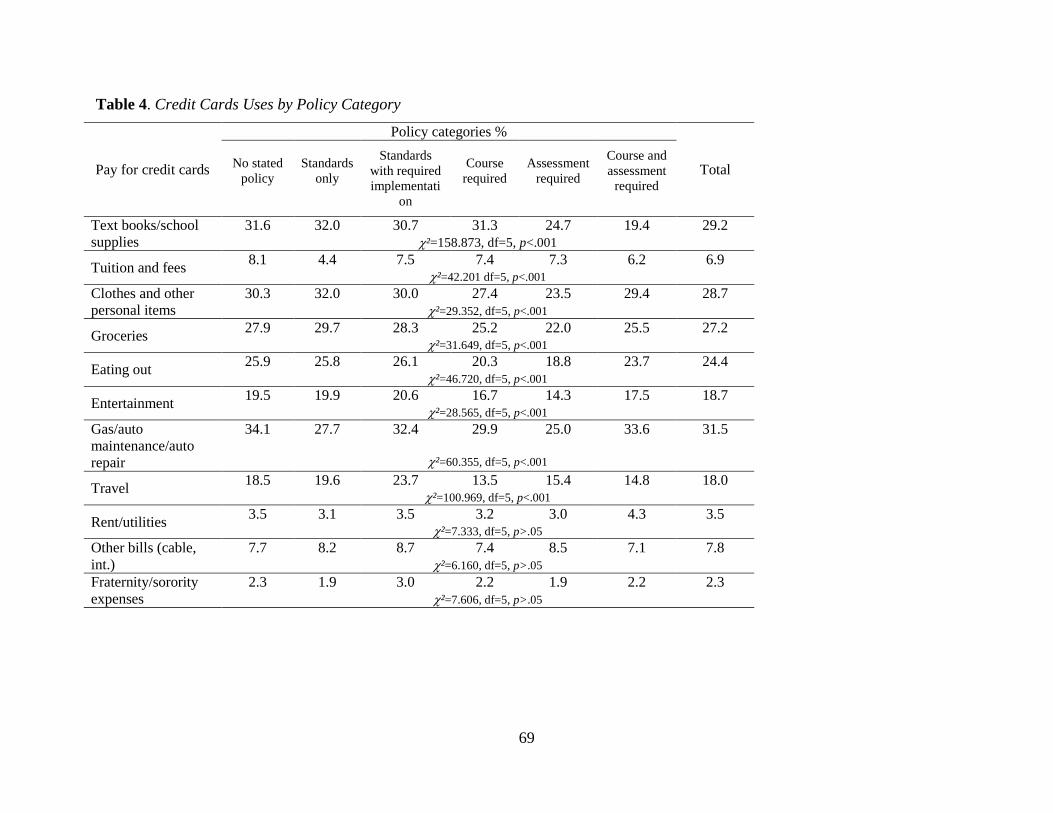
69
Table 4. Credit Cards Uses by Policy Category
Pay for credit cards
Policy categories %
Total No stated
policy
Standards
only
Standards
with required
implementati
on
Course
required
Assessment
required
Course and
assessment
required
Text books/school
supplies
31.6 32.0 30.7 31.3 24.7 19.4 29.2
²=158.873, df=5, p<.001
Tuition and fees 8.1 4.4 7.5 7.4 7.3 6.2 6.9
²=42.201 df=5, p<.001
Clothes and other
personal items
30.3 32.0 30.0 27.4 23.5 29.4 28.7
²=29.352, df=5, p<.001
Groceries 27.9 29.7 28.3 25.2 22.0 25.5 27.2
²=31.649, df=5, p<.001
Eating out 25.9 25.8 26.1 20.3 18.8 23.7 24.4
²=46.720, df=5, p<.001
Entertainment 19.5 19.9 20.6 16.7 14.3 17.5 18.7
²=28.565, df=5, p<.001
Gas/auto
maintenance/auto
repair
34.1 27.7 32.4 29.9 25.0 33.6 31.5
²=60.355, df=5, p<.001
Travel 18.5 19.6 23.7 13.5 15.4 14.8 18.0
²=100.969, df=5, p<.001
Rent/utilities 3.5 3.1 3.5 3.2 3.0 4.3 3.5
²=7.333, df=5, p>.05
Other bills (cable,
int.) 7.7 8.2 8.7 7.4 8.5 7.1 7.8
²=6.160, df=5, p>.05
Fraternity/sorority
expenses
2.3 1.9 3.0 2.2 1.9 2.2 2.3
²=7.606, df=5, p>.05

70
Table 5. Risky Credit Card Behaviors by Policy Category
Risky
Credit
Card
Behaviors
How many
times during
the last year
Policy categories
Total
%
No
stated
policy
%
Standards
only
%
Standards with
required
implementation
%
Course
required
%
Assessment
required
%
Course
and
assessment
required
%
‗Max
ou
t‘ y
ou
r
cred
it c
ard
s
0 69.7 72.8 73.3 73.2 65.1 70.4 71.1
1-2 11.3 8.4 9.7 9.1 12.1 9.8 10.0
3-5 2.8 1.6 2.4 1.8 2.0 2.8 2.4
6 or more 1.3 .8 1.1 1.0 .4 .7 1.0
N/A 14.9 16.4 13.4 15.0 20.4 16.3 15.5
Total 100.0 100.0 100.0 100.0 100.0 100.0 100.0 ²=47.603, df=20, p<.001
Mak
e la
te
pay
men
ts o
n
yo
ur
cred
it c
ard
s 0 68.8 70.4 71.0 69.5 63.6 68.8 69.2
1-2 12.7 10.8 11.8 11.3 12.4 11.2 11.8
3-5 2.4 2.0 2.4 3.1 2.5 2.5 2.4
6 or more 1.3 .5 1.3 1.0 .7 1.3 1.1
N/A 14.8 16.3 13.6 15.0 20.9 16.3 15.5
Total 100.0 100.0 100.0 100.0 100.0 100.0 100.0 ²=34.320, df=20, p<.05
Do
no
t p
ay o
ff
yo
ur
cred
it c
ard
s 0 50.7 57.8 56.0 55.8 45.9 52.0 53.4
1-2 11.4 8.2 9.1 9.9 12.3 9.8 10.3
3-5 6.8 5.8 6.3 6.1 6.7 6.0 6.4
6 or more 16.2 11.9 15.2 13.1 14.8 15.8 14.7
N/A 15.0 16.3 13.4 15.1 20.4 16.5 15.3
Total 100.0 100.0 100.0 100.0 100.0 100.0 100.0 ²=69.508, df=20, p<.001

71
Table 6. Budgeting by Policy Categories
Financial Behavior
Policy categories
Total
%
No
stated
policy
%
Standards
only
%
Standards with
required
implementation
%
Course
required
%
Assessment
required
%
Course
and
assessment
required
%
Use
budget
No 53.3 56.7 48.6 49.7 49.3 47.1 51.7
Yes 46.7 43.3 51.4 50.3 50.7 52.9 48.3
Total 100.0 100.0 100.0 100.0 100.0 100.0 100.0
²=47.550, df=5, p<.001
If yes,
use
budget at
least 6
months
No 4.9 3.6 5.3 7.1 7.6 7.5 5.5
Yes 41.8 39.7 46.1 43.2 43.1 45.4 42.8
Total 46.7 43.3 51.4 50.3 50.7 52.9 48.3
²=25.599, df=5, p<.001
If no,
budgeting
intention
No plan 15.0 15.5 11.9 11.2 14.4 12.4 13.8
After
graduate 21.0 26.9 22.5 22.5 18.4 19.0 22.1
Next
sixth
months
10.7 9.7 9.7 9.8 8.7 9.9 10.0
Next
month 6.6 4.6 4.6 6.2 7.8 5.8 5.8
Total 53.3 56.7 48.6 49.7 49.3 47.1 51.7 ²=50.383, df=15, p<.001

72
Table 7. Saving by Policy Categories
Financial Behavior
Policy categories
Total
%
No
stated
policy
%
Standards
only
%
Standards with
required
implementation
%
Course
required
%
Assessment
required
%
Course
and
assessment
required
%
Saving
No 50.1 46.3 47.5 45.3 43.9 48.2 47.8
Yes 49.9 53.7 52.5 54.7 56.1 51.8 52.2
Total 100.0 100.0 100.0 100.0 100.0 100.0 100.0 ²=15.685, df=5, p<.01
Saving
plan in
the
future
No 2.7 2.6 1.8 2.7 3.1 2.0 2.5
Yes 47.2 51.1 50.7 52.0 53.0 49.8 49.7
Total 49.9 53.7 52.5 54.7 56.1 51.8 52.2
²=6.114, df=5, p>.05
Saving
for a
year or
more
No 6.2 5.2 6.8 6.3 9.8 7.1 6.4
Yes 43.7 48.5 45.7 48.4 46.3 44.7 45.8
Total 49.9 53.7 52.5 54.7 56.1 51.8 52.2
²=16.536, df=5, p<.05
Saving
intention
No plan 3.5 3.0 2.6 3.0 2.5 2.8 3.1
After
graduate
30.7 29.5 30.6 28.0 26.1 29.8 29.7
Next 6
months
11.5 9.8 10.8 9.8 9.7 11.9 10.9
Next
month
4.4 4.0 3.5 4.5 5.5 3.7 4.1
Total 50.1 46.3 47.5 45.3 43.9 48.2 47.8 ²=14.090, df=15, p>.05

73
Table 8. OLS Regression of Financial Disposition
Independent variables Materialism Compulsive
Buying
Fin. Self-
Efficacy
Future
Orientation
Demographic Variables Age -.197*** -.086*** -.233*** -.007 White -1.372*** .806*** .850*** .044 Male .639** .800*** .698*** .355*** Sophomore -.111 -.330** -.189 -.098 Junior -.191 -.545*** .014 -.216*** Senior -.179 -.743*** -.247 -.139* Graduate/professional/other -1.454** -.624*** -.744* -.273** Single .513 .143 .044 .208***
Financial Education Personal Finance in HS -.183 -.178* .139 .054 Personal Finance in
Community -.998** .226 -.085 -.009
Financial Variables Income $1-$499 -.518* -.112 -.169 .051 $500-$999 -.597 -.378*** -.662** .009 $1,000 or more .053 -.553*** -.469 .148 Debt $1-$999 1.123** -2.094*** -2.890*** .229** $1,000-$4,999 .251 -1.621*** -1.986*** -.133 $5,000 or more 1.681*** -1.669*** -2.471*** .040 Not sure 1.508* -1.025*** -1.838*** .126 Dependent parents‘ tax
return .765** .173 .365* -.029
Federal students loan .914*** -.850*** -1.261*** .066 Federal work- study -.896* .336* .443 .040 Need-based -.055 -.311** -.434* -.157*** Scholarships -1.528*** .755*** .998*** -.172*** Tuition waiver -1.239** .150 .504 -.101
Social Learning Discuss finance with parent .037* -.042*** -.063*** .010*** Discuss finance with
friends .061** -.044*** -.008 .004
Observing parents -.006 .018*** .015 -.005 Observing friends .010 -.037*** -.064*** .014*** Financial Knowledge Financial quiz -.072 .152*** .099** -.047*** Self-reported financial
knowledge -.133*** .156*** .630*** -.047***
Policy Category Standards only -.127 .595*** .494* -.094 Standards with required
implementation -.909** .412*** -.421 -.061

74
Course required -.167 .205 -.159 -.078 Assessment required -.128 .058 -1.068** -.167 Course and assessment
required .555 .063 -.643** -.042
Constant 48.730*** 22.037*** 19.451*** 24.162***
F 13.50*** 70.03*** 99.65*** 15.69***
Adj.R2 .045 .192 .253 .043
Unstandardized coefficients are reported. Note: *p < .05, **p<.01, ***p < .001

75
Table 9. Logistic Regression of Willingness to Take Financial Risk Tolerance
Independent variables Above Average
Risk Tolerance
Average Risk
Tolerance
No Risk Tolerance
Demographic Variables Age .008 -.011 .009 White -.224*** .334*** -.282*** Male .946*** -.415*** -.740*** Sophomore -.030 .066 -.062 Junior -.110 .188** -.167 Senior -.081 .195** -.226* Graduate/professional/other -.166 .399*** -.503*** Single .105 .071 -.287***
Financial Education Personal Finance in HS -.081 .137** -.139* Personal Finance in
Community .294*** -.175* -.182
Financial Variables Income $1-$499 -.112 .049 .058 $500-$999 -.039 .005 .045 $1,000 or more .096 -.057 -.106 Debt $1-$999 .046 -.044 .009 $1,000-$4,999 .180 -.216* .133 $5,000 or more .293*** -.113 -.257* Not sure .109 -.228 .221 Dependent parents‘ tax
return .069 -.001 -.090
Federal students loan .000 -.041 .075 Federal work- study .003 .001 -.028 Need-based -.134* -.048 .248*** Scholarships -.176*** .168*** -.069 Tuition waiver -.114 .003 .175
Social Learning Discuss finance with parent .000 .004 -.008 Discuss finance with
friends .013** -.003 -.014*
Observing parents .002 -.001 .000 Observing friends .002 .000 -.002 Financial Knowledge Financial quiz .046*** .029** -.113*** Self-reported financial
knowledge .031*** -.011** -.023***
Policy Category Standards only -.152* .195*** -.155 Standards with required
implementation -.101 .162* -.180

76
Course required -.246** .061 .200* Assessment required -.047 -.068 .163 Course and assessment
required -.296*** .181** .072
Constant -2.918*** -.056 1.458***
² 714.05*** 249.37*** 468.36*** Unstandardized coefficients are reported. Note: *p < .05, **p<.01, ***p < .001
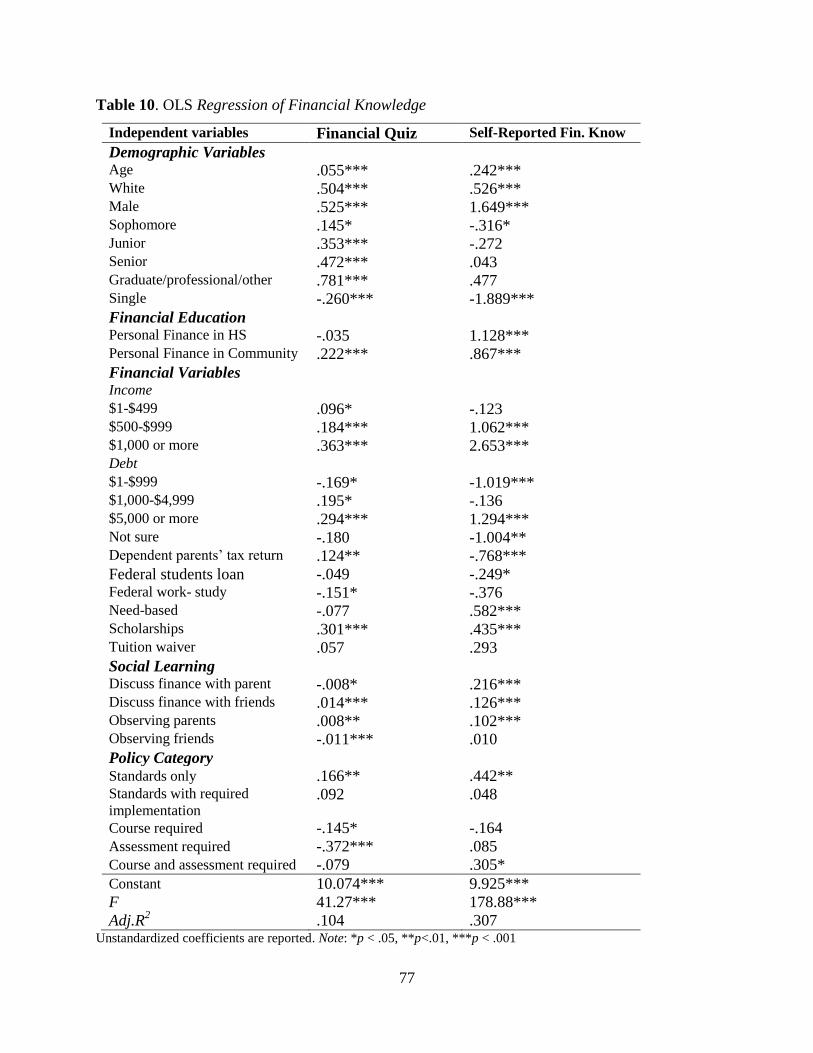
77
Table 10. OLS Regression of Financial Knowledge
Independent variables Financial Quiz Self-Reported Fin. Know
Demographic Variables Age .055*** .242*** White .504*** .526*** Male .525*** 1.649*** Sophomore .145* -.316* Junior .353*** -.272 Senior .472*** .043 Graduate/professional/other .781*** .477 Single -.260*** -1.889***
Financial Education Personal Finance in HS -.035 1.128*** Personal Finance in Community .222*** .867***
Financial Variables Income $1-$499 .096* -.123 $500-$999 .184*** 1.062*** $1,000 or more .363*** 2.653*** Debt $1-$999 -.169* -1.019*** $1,000-$4,999 .195* -.136 $5,000 or more .294*** 1.294*** Not sure -.180 -1.004** Dependent parents‘ tax return .124** -.768***
Federal students loan -.049 -.249* Federal work- study -.151* -.376 Need-based -.077 .582*** Scholarships .301*** .435*** Tuition waiver .057 .293
Social Learning Discuss finance with parent -.008* .216*** Discuss finance with friends .014*** .126*** Observing parents .008** .102*** Observing friends -.011*** .010
Policy Category Standards only .166** .442** Standards with required
implementation .092 .048
Course required -.145* -.164 Assessment required -.372*** .085 Course and assessment required -.079 .305*
Constant 10.074*** 9.925***
F 41.27*** 178.88***
Adj.R2 .104 .307
Unstandardized coefficients are reported. Note: *p < .05, **p<.01, ***p < .001

78
Table 11. Logistic Regression of Perceive Financial Knowledge
Independent variables Perceive Fin. Know.
Better
Perceive Fin. Know.
Same
Perceive Fin. Know.
Worse
Demographic Variables Age .020** -.007 -.026* White .268*** -.114* -.309*** Male .618*** -.355*** -.664*** Sophomore .029 -.029 .010 Junior .176** -.118 -.113 Senior .195** -.123 -.134 Graduate/professional/other .197 -.060 -.292 Single -.404*** .294*** .314**
Financial Education Personal Finance in HS .301*** -.005 -.664*** Personal Finance in
Community .294*** -.157* -.427***
Financial Variables Income $1-$499 .091* .008 -.188** $500-$999 .395*** -.171** -.523*** $1,000 or more .781*** -.493*** -.818*** Debt $1-$999 -.385*** .090 .575*** $1,000-$4,999 -.081 .009 .168 $5,000 or more .160* -.146 -.085 Not sure -.542*** .078 .710*** Dependent parents‘ tax return -.021 .015 .032
Federal students loan -.202*** .204*** .033 Federal work- study -.241*** .172* .145 Need-based .203*** -.086 -.234** Scholarships .213*** -.079 -.281*** Tuition waiver .020 .033 -.108
Social Learning Discuss finance with parent .046*** -.019*** -.066*** Discuss finance with friends .041*** -.032*** -.029*** Observing parents .020*** -.010*** -.020*** Observing friends -.016*** .014*** .006
Policy Category Standards only .036 .046 -.154 Standards with required
implementation .004 .055 -.102
Course required -.099 .089 .057 Assessment required -.045 .044 -.001 Course and assessment
required .007 .021 -.046
Constant -2.538*** .209 1.695***

79
² 1649.20*** 483.67*** 1060.77*** Unstandardized coefficients are reported. Note: *p < .05, **p<.01, ***p < .001
Table 12. Logistic Regression of Financial Behaviors
Independent variables MODEL 1 MODEL 2
Budgeting Saving Budgeting Saving Demographic Variables Age -013 .002 .001 .022** White .112 .173** .074 .128 Male -249*** -.157*** -.227*** -.204*** Sophomore -.051 -.267*** -.032 -.280*** Junior -.130 -.483*** -.139 -.453*** Senior -.309*** -.769*** -.310*** -.751*** Graduate/professional/other -.327** -.660*** -.280* -.654*** Single -.180** -.139* -155* -.202**
Financial Education Personal Finance in HS .089 .010 .097* .021 Personal Finance in
Community .349*** .339*** .375*** .301***
Financial Variables Income $1-$499 -.063 .472*** -.097 .504*** $500-$999 -.009 .532*** .016 .560*** $1,000 or more .148 934*** .212* 1.008*** Debt $1-$999 -.060 -.397*** .120 -.240* $1,000-$4,999 -.062 -.362*** .060 -.239* $5,000 or more -.067 -.295*** .086 -.142 Not sure -.092 -.149 -.032 -.096 Dependent parents‘ tax
return -.002 -.033 -.047 -.044
Federal students loan .017 -.391*** .110* -.312*** Federal work- study .034 -.032 .047 -.045 Need-based -.003 -.287*** .001 -.252*** Scholarships .101* .148** .036 .089 Tuition waiver .112 -.035 .065 .000
Financial Knowledge Financial quiz -.004 .011 -.006 .004 Self-reported financial
knowledge .051*** .046*** .018*** .021***
Perceive financial
knowledge worse -.405*** -.200** -.320*** -.087
Perceive financial
knowledge better .327*** .344*** .078 .191***
Policy Category Standards only -.136* .156* -.189** .116
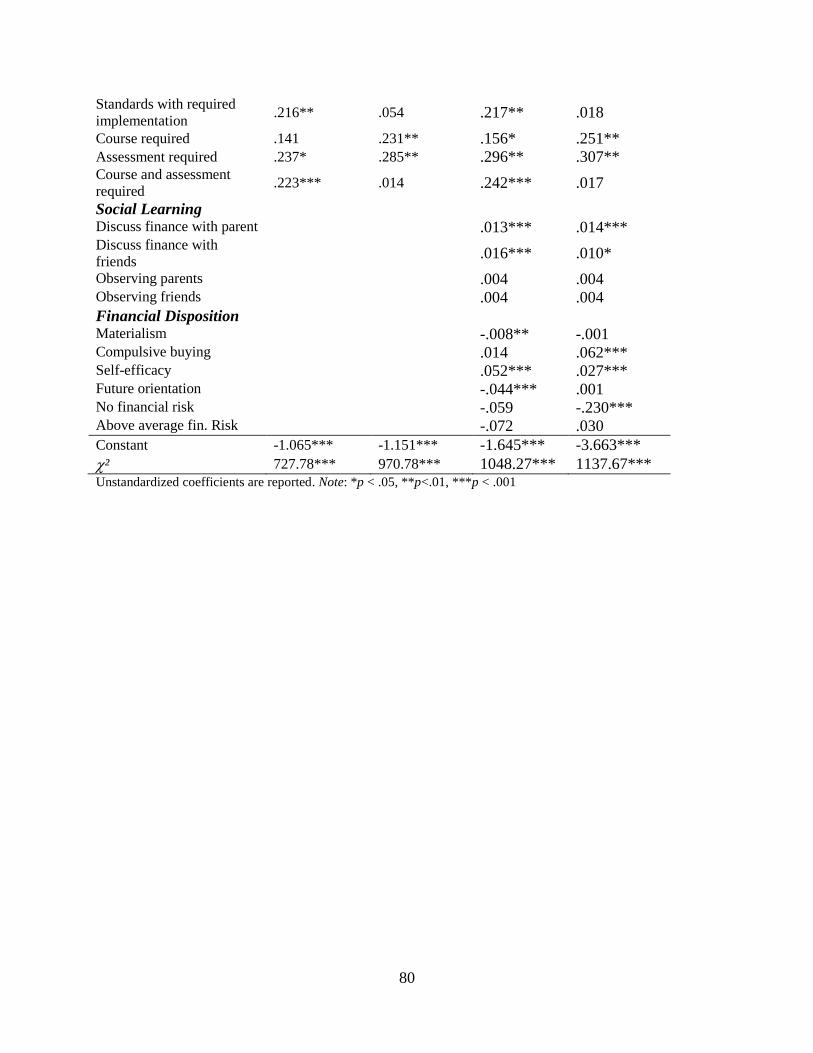
80
Standards with required
implementation .216** .054 .217** .018
Course required .141 .231** .156* .251** Assessment required .237* .285** .296** .307** Course and assessment
required .223*** .014 .242*** .017
Social Learning Discuss finance with parent .013*** .014*** Discuss finance with
friends .016*** .010*
Observing parents .004 .004 Observing friends .004 .004
Financial Disposition Materialism -.008** -.001 Compulsive buying .014 .062*** Self-efficacy .052*** .027*** Future orientation -.044*** .001 No financial risk -.059 -.230*** Above average fin. Risk -.072 .030
Constant -1.065*** -1.151*** -1.645*** -3.663***
² 727.78*** 970.78*** 1048.27*** 1137.67*** Unstandardized coefficients are reported. Note: *p < .05, **p<.01, ***p < .001

81
Table 13. Logistic Regression of Risky Credit Behaviors
Independent variables MODEL 1
Max Out Make Late Payments Do not Pay off
Demographic Variables Age .002 .026*** .038*** White -.588*** -.624*** -.412*** Male .148* -.076 -.209*** Sophomore .499*** .507*** .618*** Junior .690*** .936*** 1.084*** Senior .812*** 1.175*** 1.323*** Graduate/professional/other .315 1.169*** 1.156*** Single -.093 .133 -.166*
Financial Education Personal Finance in HS .056 .065 .017 Personal Finance in
Community .147 .088 -.016
Financial Variables Income $1-$499 -.081 .160* .208** $500-$999 .272** .332*** .637*** $1,000 or more .311** .576*** .679*** Debt $1-$999 .963*** .992*** 1.094*** $1,000-$4,999 .948*** .703*** .839*** $5,000 or more .932*** .568*** .692*** Not sure .218 .051 .195 Dependent parents‘ tax
return -.418*** -.240** -.240***
Federal students loan .371*** .372*** .648***
Federal work- study -.059 -.159 -.222* Need-based .459*** .381*** .481*** Scholarships -.092 -.304*** -.324*** Tuition waiver .014 -.381** -.081
Financial Knowledge Financial quiz -.022 -.064*** -.014 Self-reported financial
knowledge -.023*** -.051*** -.010
Perceive financial
knowledge worse .302** -.003 -.080
Perceive financial
knowledge better -.129 -.177* -.093
Policy Category Standards only -.326*** -.254** -.520*** Standards with required
implementation -.158 .092 -.337***
Course required -.347** -.237* -.446*** Assessment required -.141 -.108 -.234 Course and assessment
required -.145 -.150 -.274***
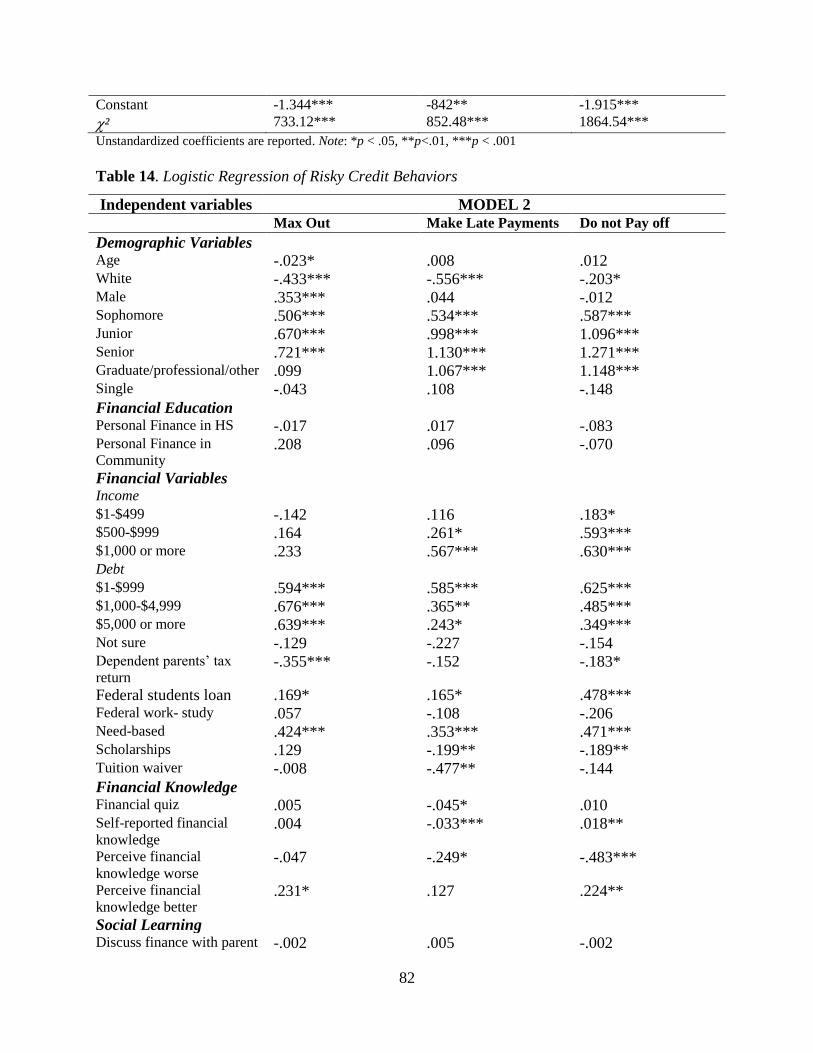
82
Constant -1.344*** -842** -1.915***
² 733.12*** 852.48*** 1864.54***
Unstandardized coefficients are reported. Note: *p < .05, **p<.01, ***p < .001
Table 14. Logistic Regression of Risky Credit Behaviors
Independent variables MODEL 2
Max Out Make Late Payments Do not Pay off
Demographic Variables Age -.023* .008 .012 White -.433*** -.556*** -.203* Male .353*** .044 -.012 Sophomore .506*** .534*** .587*** Junior .670*** .998*** 1.096*** Senior .721*** 1.130*** 1.271*** Graduate/professional/other .099 1.067*** 1.148*** Single -.043 .108 -.148
Financial Education Personal Finance in HS -.017 .017 -.083 Personal Finance in
Community .208 .096 -.070
Financial Variables Income $1-$499 -.142 .116 .183* $500-$999 .164 .261* .593*** $1,000 or more .233 .567*** .630*** Debt $1-$999 .594*** .585*** .625*** $1,000-$4,999 .676*** .365** .485*** $5,000 or more .639*** .243* .349*** Not sure -.129 -.227 -.154 Dependent parents‘ tax
return -.355*** -.152 -.183*
Federal students loan .169* .165* .478*** Federal work- study .057 -.108 -.206 Need-based .424*** .353*** .471*** Scholarships .129 -.199** -.189** Tuition waiver -.008 -.477** -.144
Financial Knowledge Financial quiz .005 -.045* .010 Self-reported financial
knowledge .004 -.033*** .018**
Perceive financial
knowledge worse -.047 -.249* -.483***
Perceive financial
knowledge better .231* .127 .224**
Social Learning Discuss finance with parent -.002 .005 -.002

83
Discuss finance with
friends .003 .002 .008
Observing parents -.013* -.014** -.018*** Observing friends -.008 -.001 -.003
Financial Disposition Materialism .001 -.010* -.005 Compulsive buying -.216*** -.175*** -.271*** Self-efficacy -.030*** -.023*** -.023*** Future orientation .012 .020 -.066*** No financial risk .041 .066 -.051 Above average fin. Risk -.005 .056 -.027
Policy Category Standards only -.186 -.095 -.416*** Standards with required
implementation -.083 -.043 -.270**
Course required -.362** -.193 -.474*** Assessment required -.159 -.053 -.221 Course and assessment
required -.170 -.214* -.326***
Constant 3.845*** 3.662*** 6.752***
² 1443.94*** 1327.13*** 2960.19*** Unstandardized coefficients are reported. Note: *p < .05, **p<.01, ***p < .001

84
Table 15. Coefficients between Manifest Measures and Latent Constructs
Panel A
Construct Path Path
coefficients t values Completely
standardized
Demographic School rank 1.000 .672
Sex-marital -.348 -17.004*** -.152
Age 3.764 59.914*** .760
Financial Resources Loan amount 1.000 .134
Parent support -1.822 -15.255*** -.257
Income 6.750 15.657*** .989
Work hours 5.808 15.694*** .881
Debt 1.844 15.400*** .261
Social Learning Observing parents .988 59.767*** .739
Observing friends .517 34.905*** .465
Finance discuss with parents 1.000 .821
Finance discuss with friends .505 34.799*** .481
Financial Knowledge Self-reported financial
knowledge level
1.000 .917
Financial quiz .129 32.485*** .413
Perceive financial
knowledge
.074 59.125*** .620
Financial Disposition Materialism 1.000 .230
Compulsive buying -2.707 -21.667*** -.861
Financial self-efficacy -1.585 -24.197*** -.402
Future orientation .348 20.312*** .209
Financial Behavior Rental insurance .521 19.909*** .247
Health insurance .227 12.925*** .147
Auto insurance .310 16.157*** .194
Budget 1.000 .365
Credit Report .595 18.530*** .270
Saving 1.049 25.417*** .372 Note: *p < .05, **p<.01, ***p < .001

85
Panel B
Path Coefficients for Latent Constructs
Construct Path Path
coefficients t values Completely
standardized
Demographic Social learning -1.814 -17.030*** -.255
Financial knowledge 2.201 26.560*** .337
Financial disposition .429 15.461*** .347
Financial behavior -.048 -3.894*** -.098
Financial Resources Social learning 2.098 6.438*** .086
Financial knowledge 1.432 5.847*** .064
Financial disposition .230 4.201*** .054
Financial behavior -.262 -7.699*** -.156
Social Learning Financial knowledge .456 35.867*** .498
Financial disposition .069 16.727*** .397
Financial behavior -.009 -5.761*** -.124
Financial Knowledge Financial disposition -.123 -20.510*** -.647
Financial behavior -.023 -11.249*** -.308
Financial Disposition Financial behavior .150 14.202*** .378
Policy Category Financial behavior -.004 -2.198* -.027 Note: *p < .05, **p<.01, ***p < .001
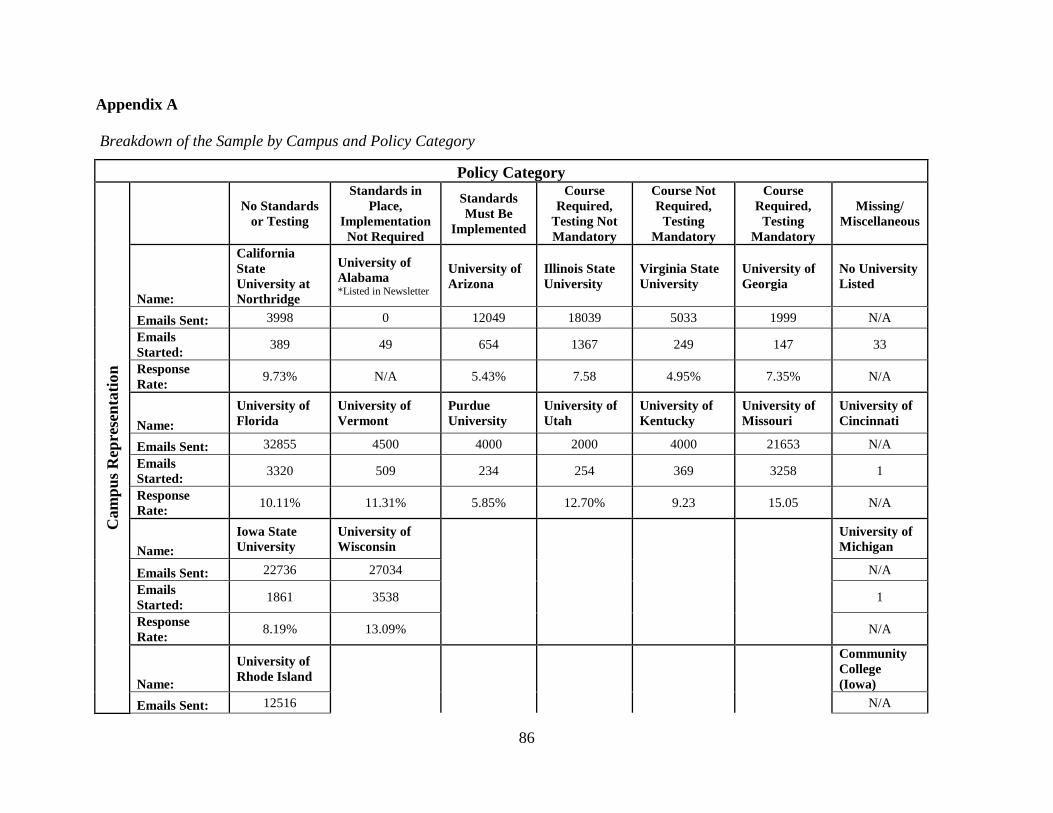
86
Appendix A
Breakdown of the Sample by Campus and Policy Category
Policy Category
Cam
pu
s R
epre
sen
tati
on
No Standards
or Testing
Standards in
Place,
Implementation
Not Required
Standards
Must Be
Implemented
Course
Required,
Testing Not
Mandatory
Course Not
Required,
Testing
Mandatory
Course
Required,
Testing
Mandatory
Missing/
Miscellaneous
Name:
California
State
University at
Northridge
University of
Alabama *Listed in Newsletter
University of
Arizona
Illinois State
University
Virginia State
University
University of
Georgia
No University
Listed
Emails Sent: 3998 0 12049 18039 5033 1999 N/A
Emails
Started: 389 49 654 1367 249 147 33
Response
Rate: 9.73% N/A 5.43% 7.58 4.95% 7.35% N/A
Name:
University of
Florida
University of
Vermont
Purdue
University
University of
Utah
University of
Kentucky
University of
Missouri
University of
Cincinnati
Emails Sent: 32855 4500 4000 2000 4000 21653 N/A
Emails
Started: 3320 509 234 254 369 3258 1
Response
Rate: 10.11% 11.31% 5.85% 12.70% 9.23 15.05 N/A
Name:
Iowa State
University
University of
Wisconsin
University of
Michigan
Emails Sent: 22736 27034 N/A
Emails
Started: 1861 3538 1
Response
Rate: 8.19% 13.09% N/A
Name:
University of
Rhode Island
Community
College
(Iowa)
Emails Sent: 12516 N/A

87
Emails
Started: 639 1
Response
Rate: 5.11% N/A
Totals Emails Sent: 172,412 Surveys Started: 16,873 Response Rate: 9.79% Average Response Rate: 8.98%

88
Appendix B
Having any Policy: Reduced Model
Compared to having no policy, students in states that did have a policy were significantly less likely to engage in compulsive buying
and less likely to have lower financial self-efficacy. In addition, they were more likely to be willing to take average and above average
financial risk. These students were also more likely to budget, save, and pay their credit cards off fully each month and less likely to
max out credit cards and make late payments.
Having any Policy: Full Model
Compared to having no policy, students in states that did have a policy were significantly less likely to engage in compulsive buying.
In addition, they were more likely to be willing to take average and above average financial risk. These students were also more likely
to save, and pay their credit cards off fully each month and less likely to max out credit cards. Reduced Model Full Model
Finding Having any Policy Having any Policy
Financial Disposition by Policy Category
Students were less compulsive buyer X X
Students with a higher financial disposition
toward future orientation n.s n.s
Students have lower financial self-efficacy
score O n.s
Students were significantly less materialistic. n.s n.s
Students were less likely to be willing to take
above average financial risk O O
Students were more likely to be willing to take
average financial risk X X
Financial Knowledge by Policy Category
Higher self-reported financial knowledge
score
n.s n.s
Students more likely to believed their level of
financial knowledge to be better than others. n.s n.s
Financial Behaviors by Policy Categories
Students were more likely to budget X n.s
Students were more likely to be saving X X
Student were less likely to ―max out‖ credit
cards X X
Students were less likely to make late X n.s

89
payments
Students were more likely paying their cards
off fully each months X X