Embed Size (px)
Citation preview
FINANCIAL MANAGEMENT: A COURSE FOR
SCHOOL NUTRITION DIRECTORS
Gilbert Requena, FNP Specialist
National Food Service Management Institute February 06, 2014
Acknowledgement Statement 2
You understand and acknowledge that:
The training you are about to receive does not
cover the entire scope of the program; and that
You are responsible for knowing and understanding
all handbooks, manuals, alerts, notices and
guidance, as well as any other forms of
communication that provide further guidance,
clarification or instruction on operating the program
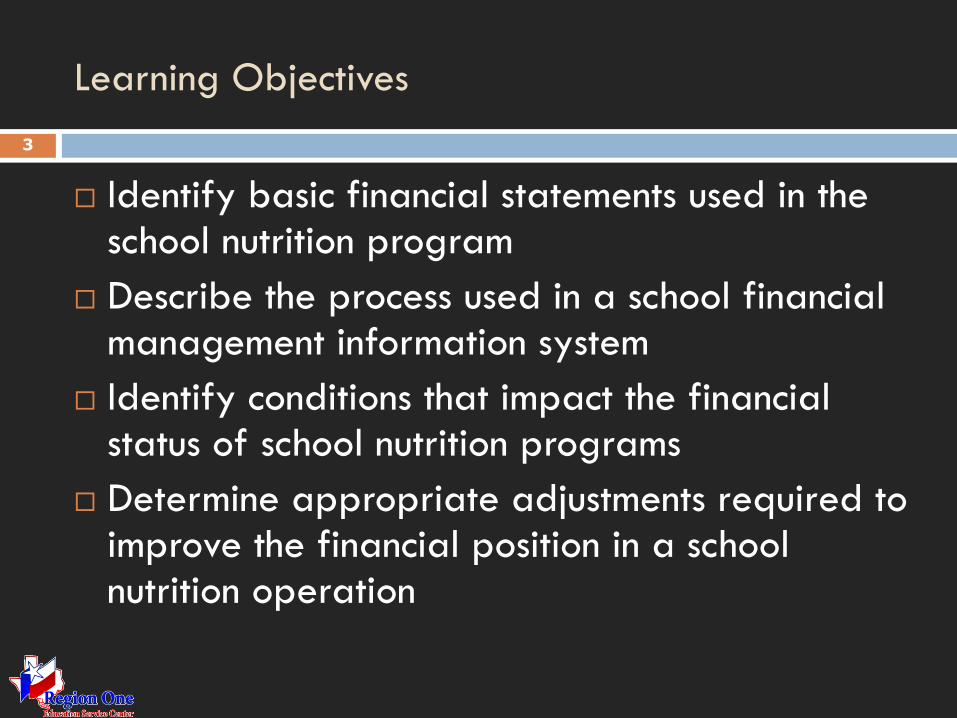
Learning Objectives
3
Identify basic financial statements used in the school nutrition program
Describe the process used in a school financial management information system
Identify conditions that impact the financial status of school nutrition programs
Determine appropriate adjustments required to improve the financial position in a school nutrition operation
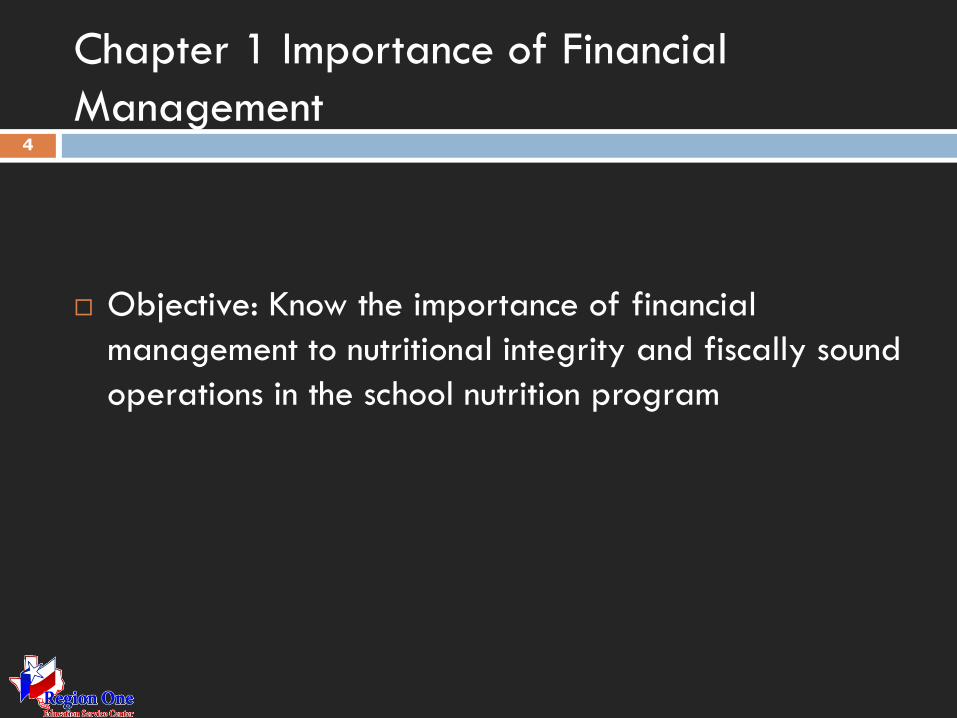
Chapter 1 Importance of Financial
Management 4
Objective: Know the importance of financial
management to nutritional integrity and fiscally sound
operations in the school nutrition program
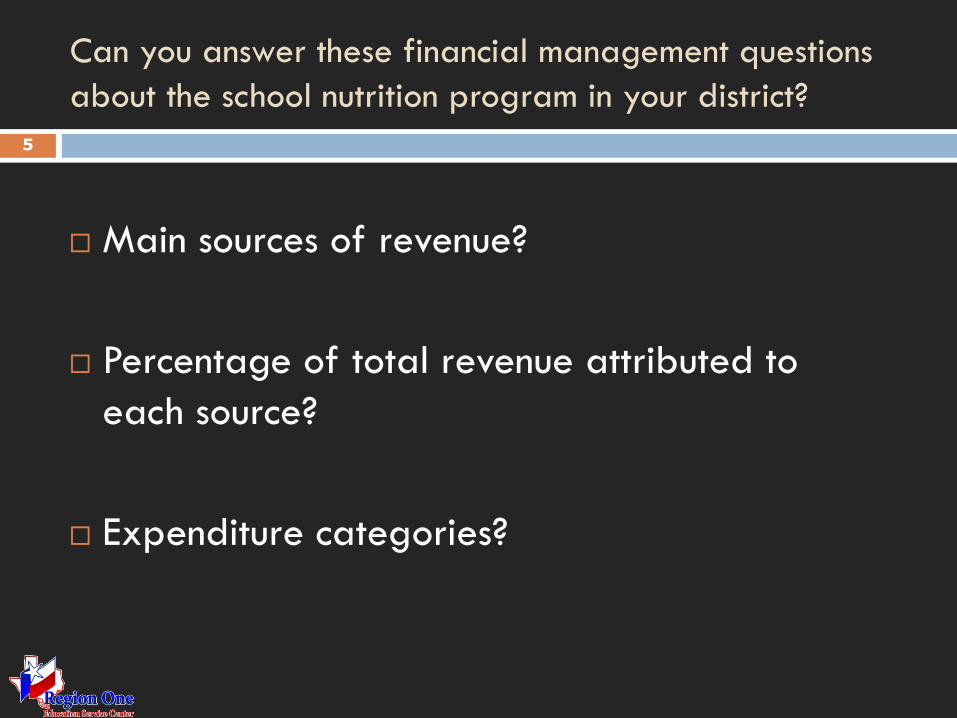
Can you answer these financial management questions
about the school nutrition program in your district?
5
Main sources of revenue?
Percentage of total revenue attributed to
each source?
Expenditure categories?
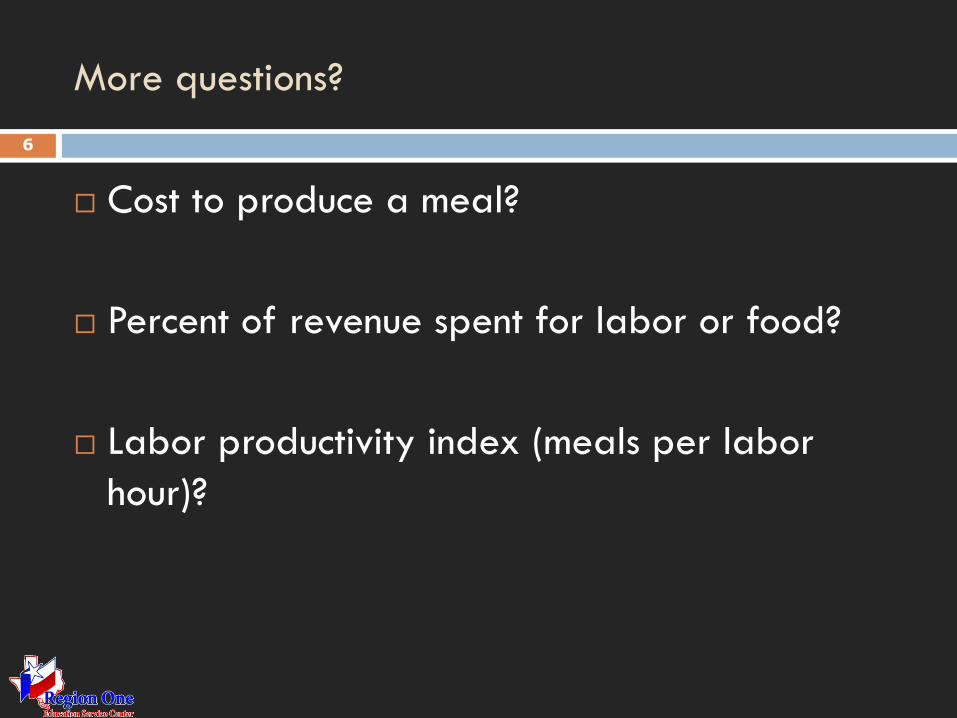
More questions?
6
Cost to produce a meal?
Percent of revenue spent for labor or food?
Labor productivity index (meals per labor
hour)?
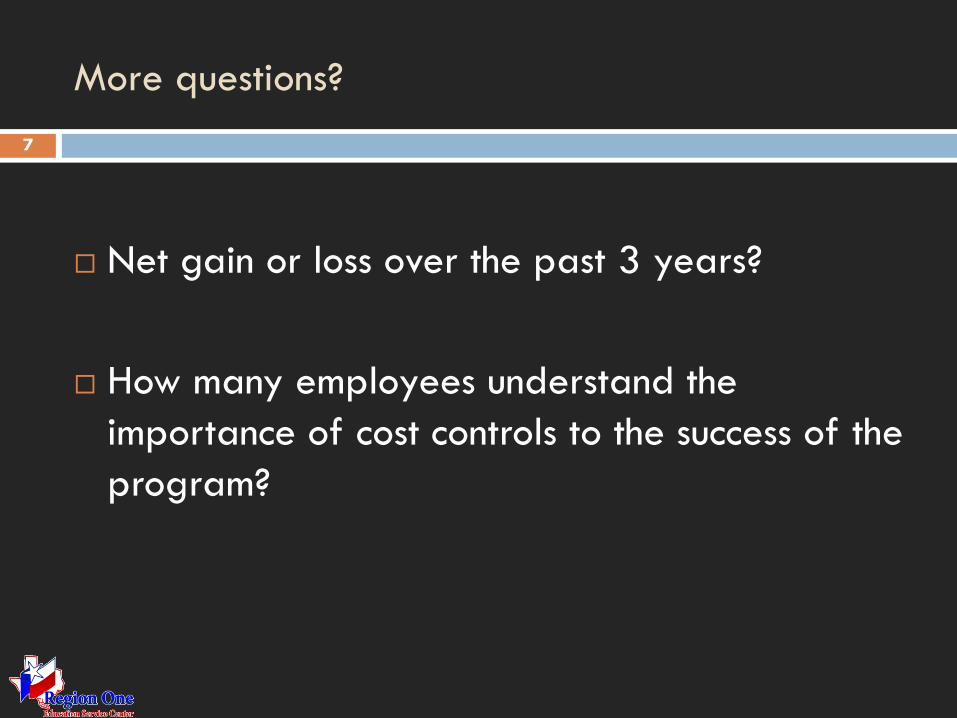
More questions?
7
Net gain or loss over the past 3 years?
How many employees understand the
importance of cost controls to the success of the
program?
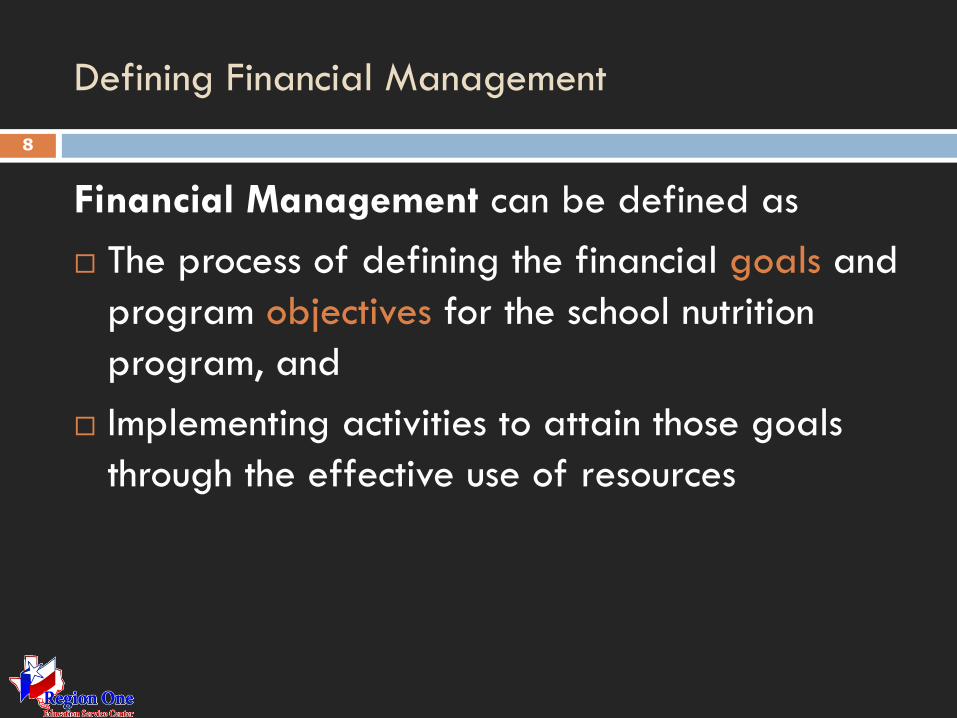
Defining Financial Management
8
Financial Management can be defined as
The process of defining the financial goals and
program objectives for the school nutrition
program, and
Implementing activities to attain those goals
through the effective use of resources
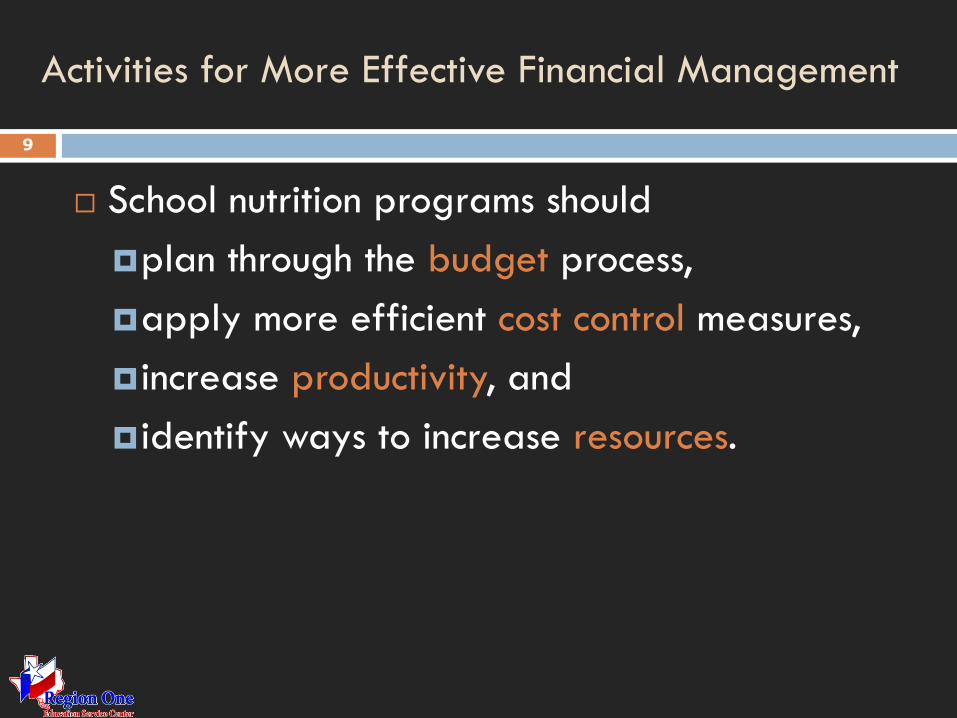
Activities for More Effective Financial Management
9
School nutrition programs should
plan through the budget process,
apply more efficient cost control measures,
increase productivity, and
identify ways to increase resources.
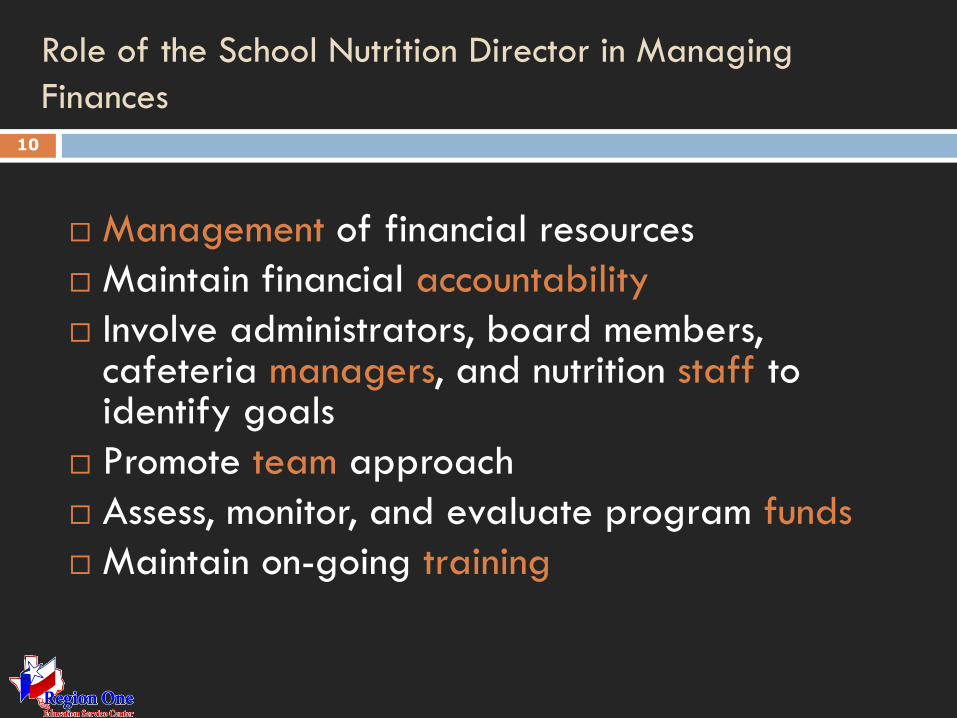
Role of the School Nutrition Director in Managing
Finances 10
Management of financial resources
Maintain financial accountability
Involve administrators, board members, cafeteria managers, and nutrition staff to identify goals
Promote team approach
Assess, monitor, and evaluate program funds
Maintain on-going training
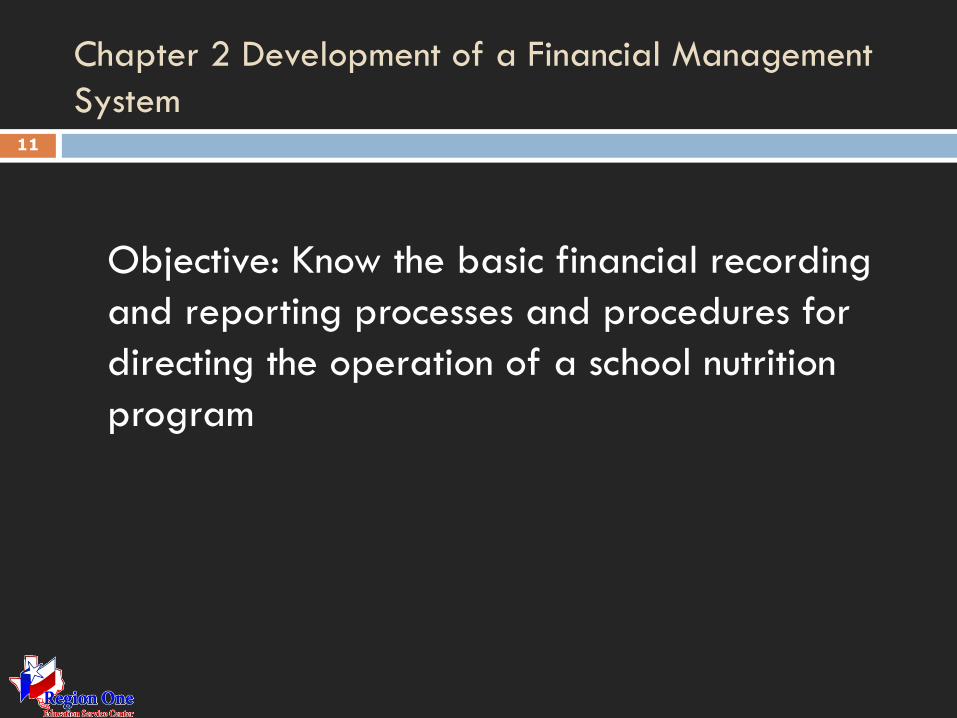
Chapter 2 Development of a Financial Management
System 11
Objective: Know the basic financial recording
and reporting processes and procedures for
directing the operation of a school nutrition
program
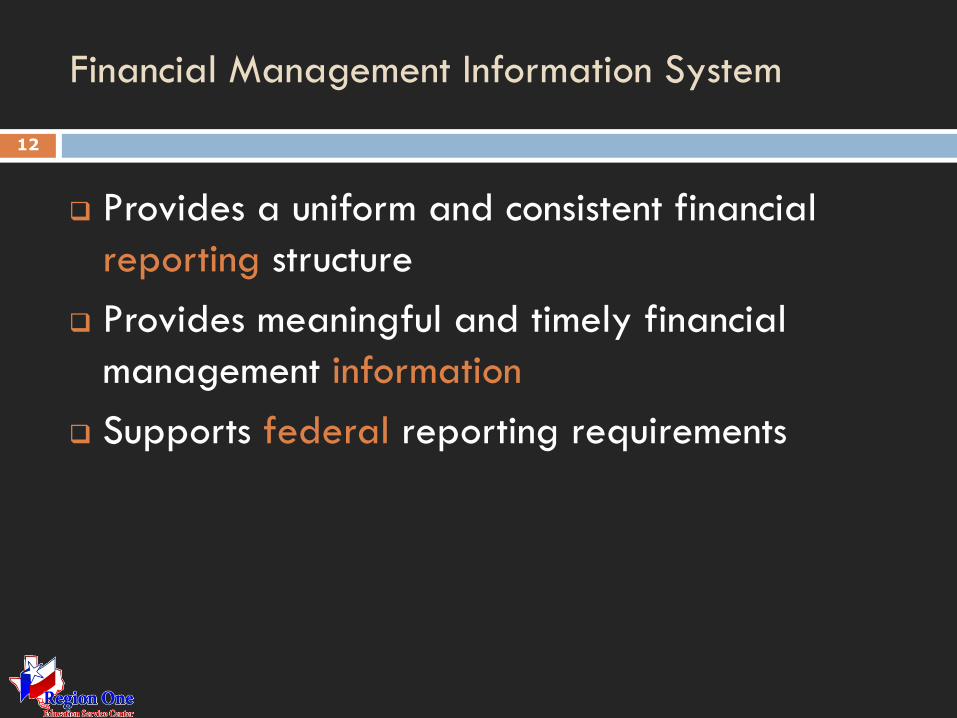
Financial Management Information System
12
Provides a uniform and consistent financial
reporting structure
Provides meaningful and timely financial
management information
Supports federal reporting requirements
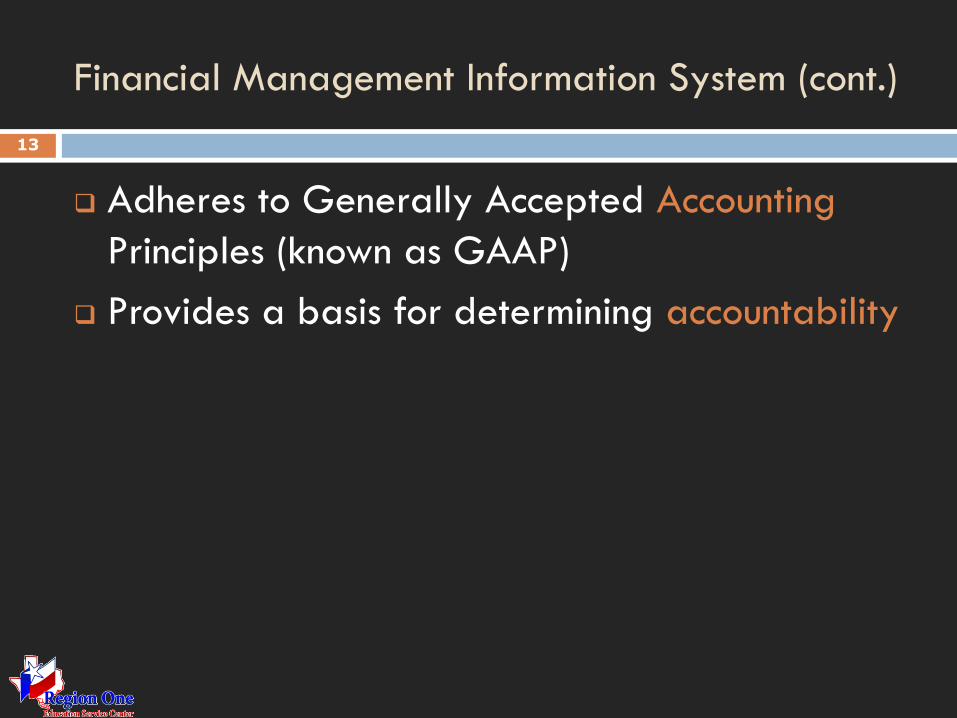
Financial Management Information System (cont.)
13
Adheres to Generally Accepted Accounting
Principles (known as GAAP)
Provides a basis for determining accountability
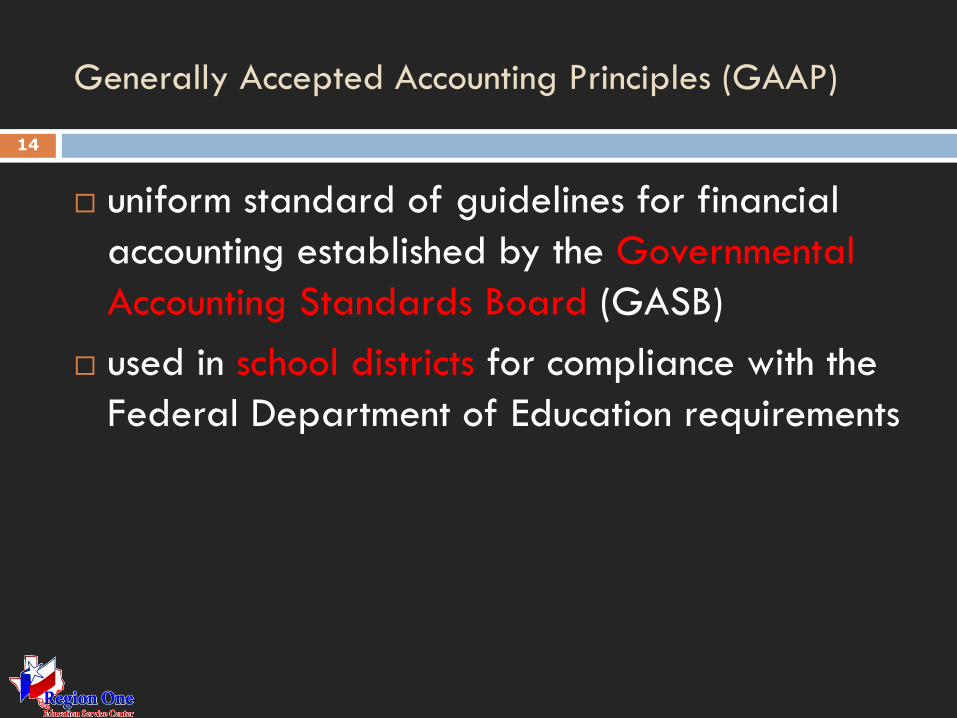
Generally Accepted Accounting Principles (GAAP)
14
uniform standard of guidelines for financial
accounting established by the Governmental
Accounting Standards Board (GASB)
used in school districts for compliance with the
Federal Department of Education requirements
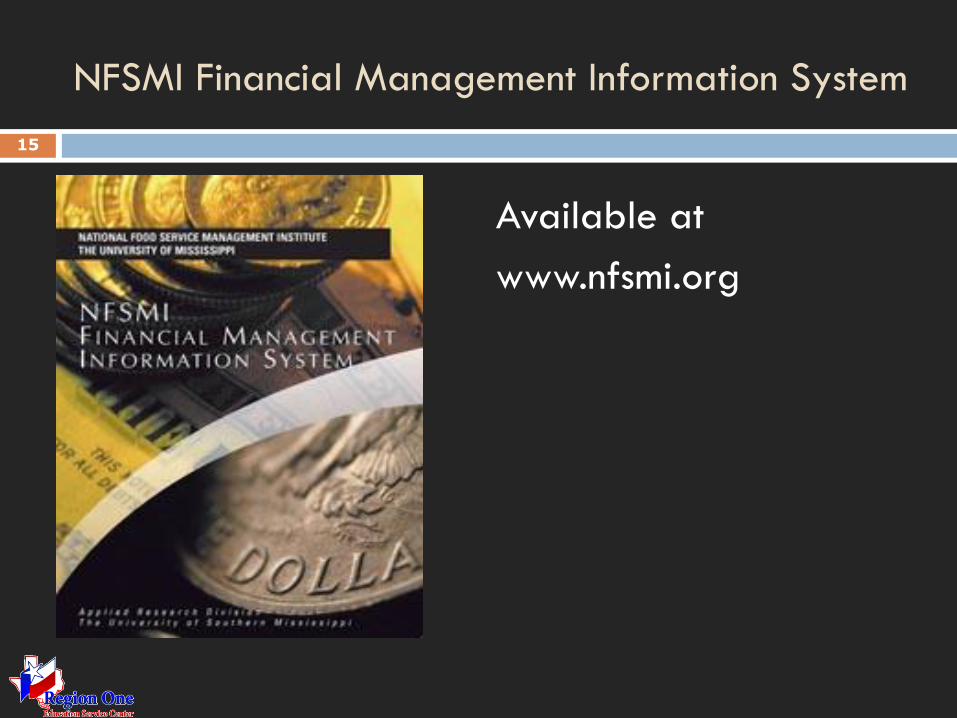
NFSMI Financial Management Information System
Available at
www.nfsmi.org
15
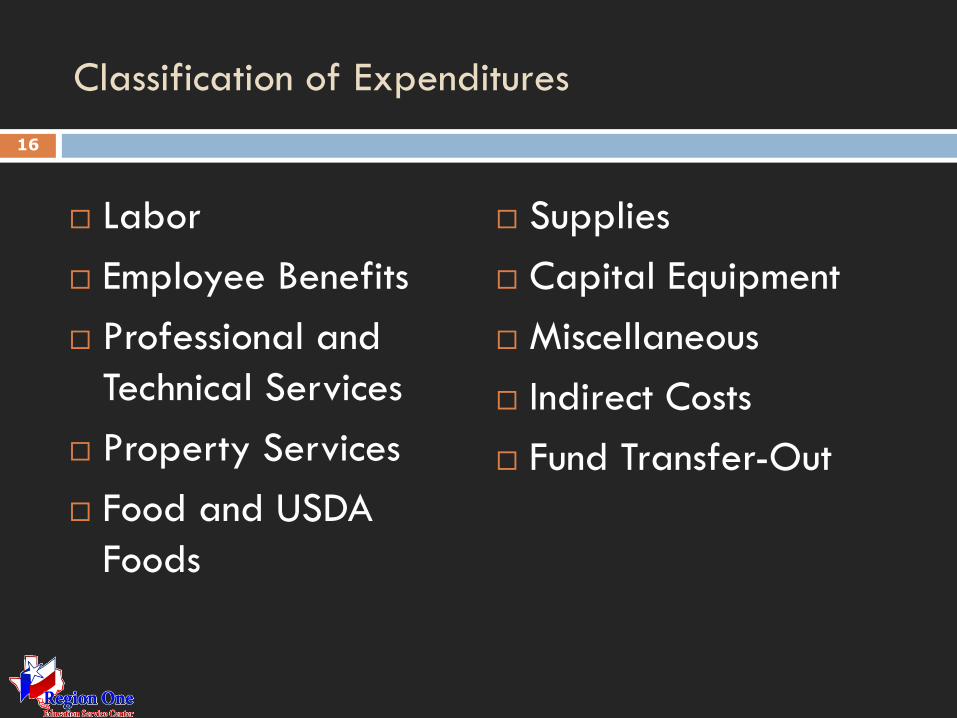
Classification of Expenditures
Labor
Employee Benefits
Professional and
Technical Services
Property Services
Food and USDA
Foods
Supplies
Capital Equipment
Miscellaneous
Indirect Costs
Fund Transfer-Out
16
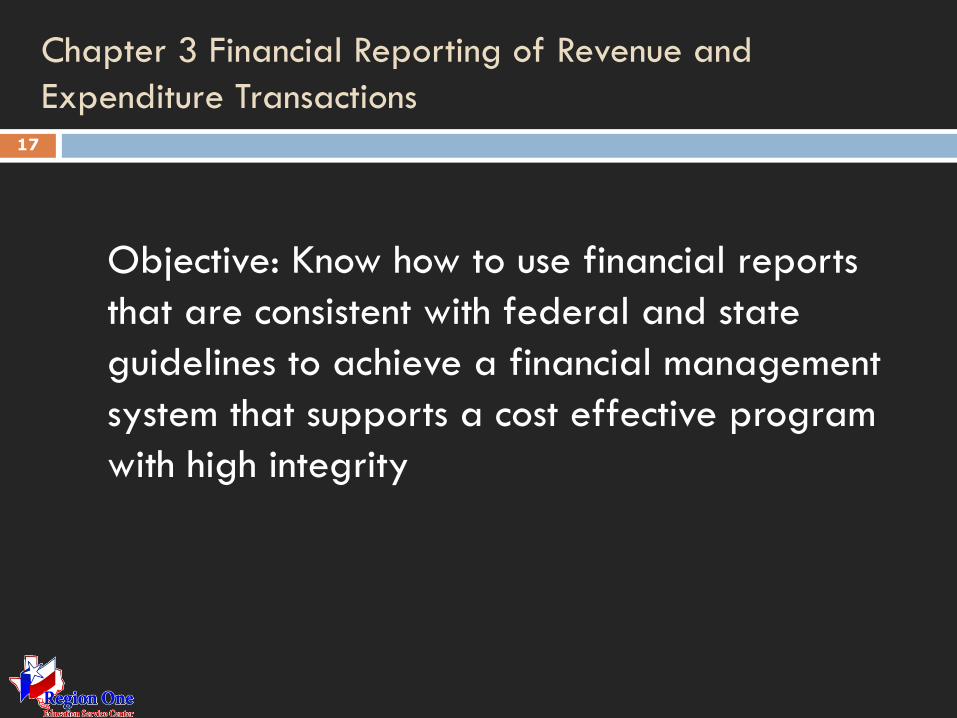
Chapter 3 Financial Reporting of Revenue and
Expenditure Transactions 17
Objective: Know how to use financial reports
that are consistent with federal and state
guidelines to achieve a financial management
system that supports a cost effective program
with high integrity
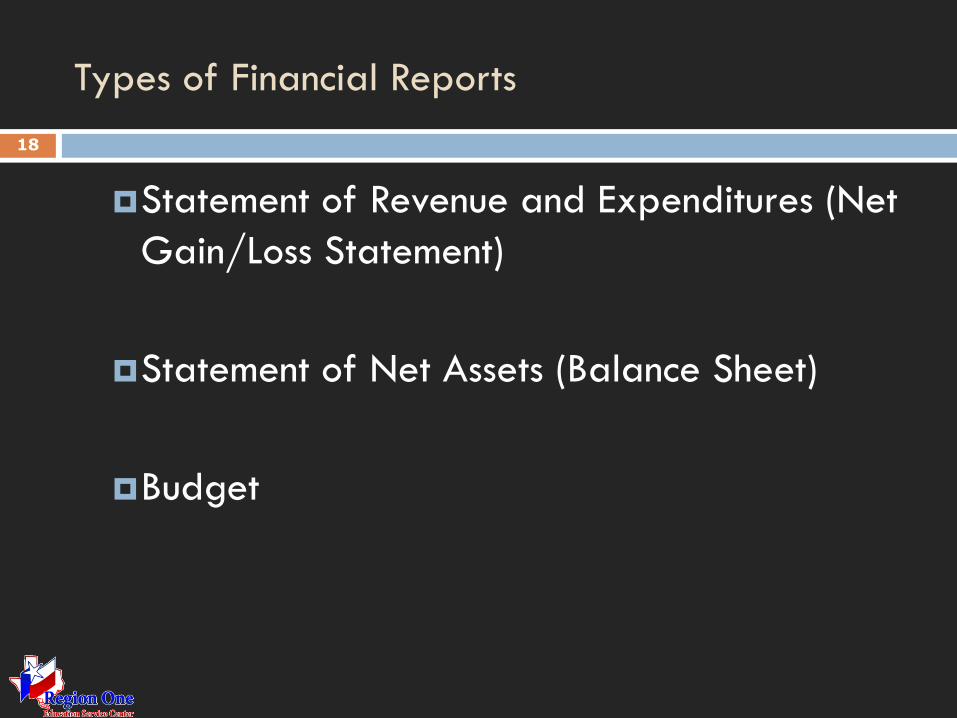
Types of Financial Reports
18
Statement of Revenue and Expenditures (Net
Gain/Loss Statement)
Statement of Net Assets (Balance Sheet)
Budget
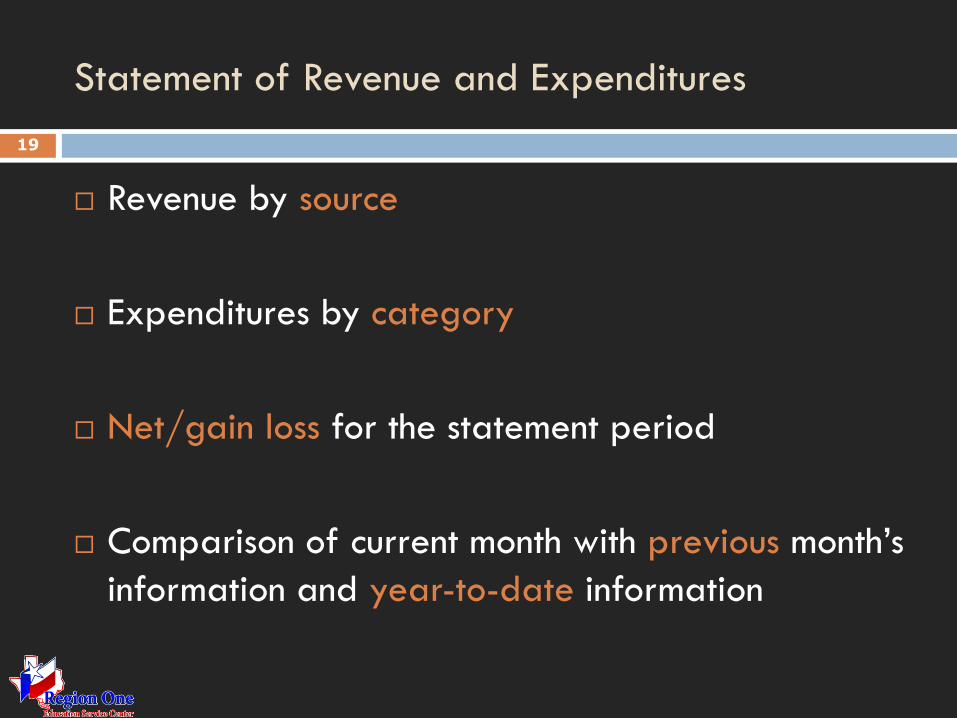
Statement of Revenue and Expenditures
19
Revenue by source
Expenditures by category
Net/gain loss for the statement period
Comparison of current month with previous month’s
information and year-to-date information
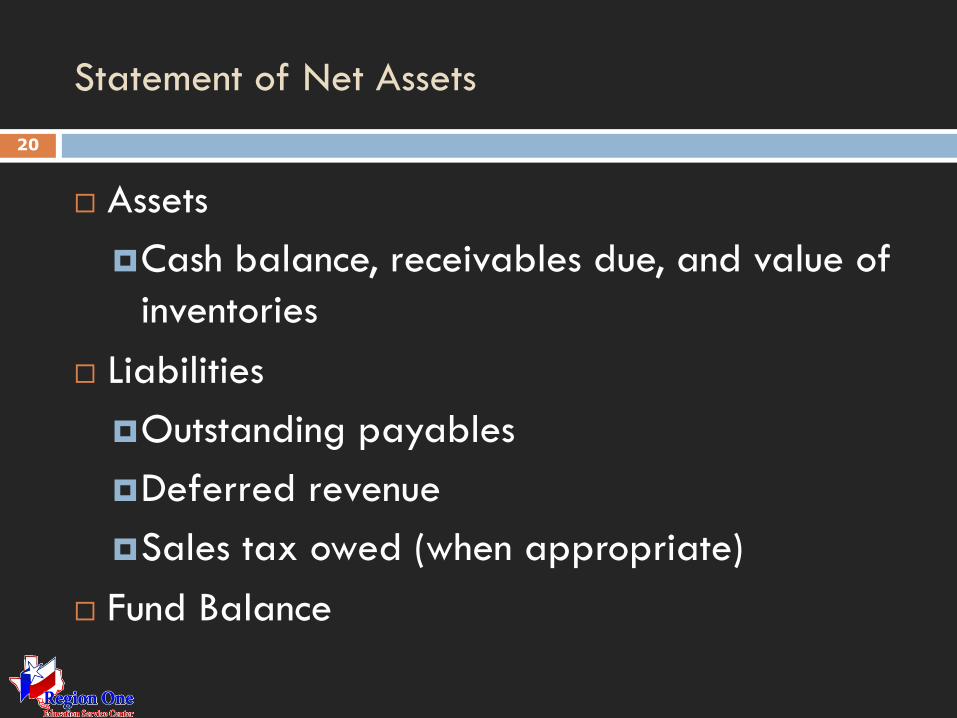
Statement of Net Assets
20
Assets
Cash balance, receivables due, and value of
inventories
Liabilities
Outstanding payables
Deferred revenue
Sales tax owed (when appropriate)
Fund Balance
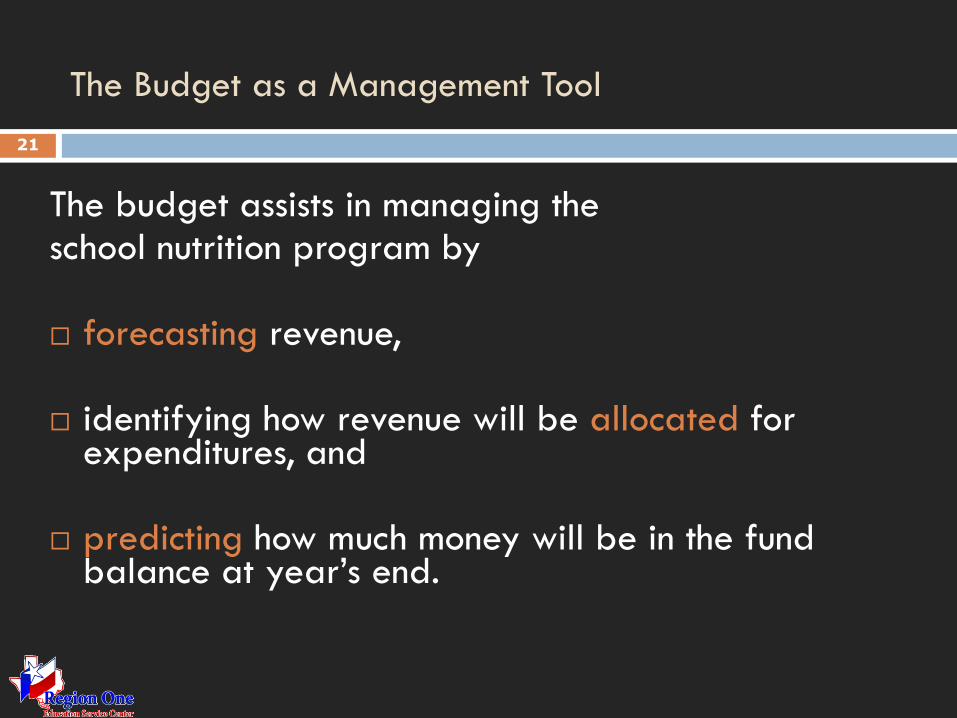
The Budget as a Management Tool
21
The budget assists in managing the school nutrition program by forecasting revenue,
identifying how revenue will be allocated for
expenditures, and
predicting how much money will be in the fund balance at year’s end.
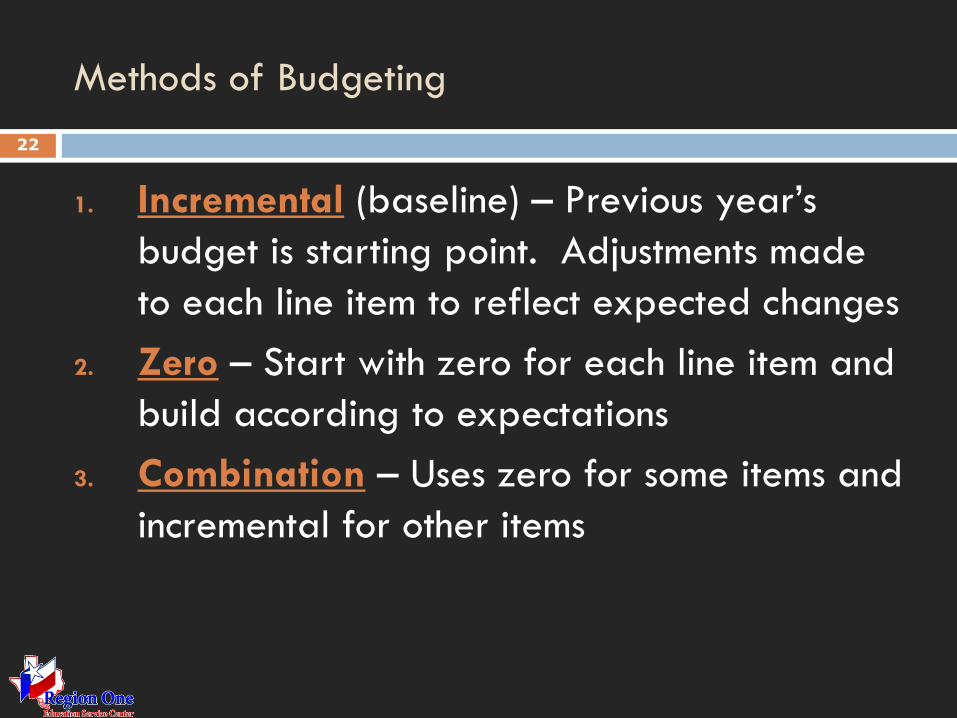
Methods of Budgeting
22
1. Incremental (baseline) – Previous year’s
budget is starting point. Adjustments made
to each line item to reflect expected changes
2. Zero – Start with zero for each line item and
build according to expectations
3. Combination – Uses zero for some items and
incremental for other items
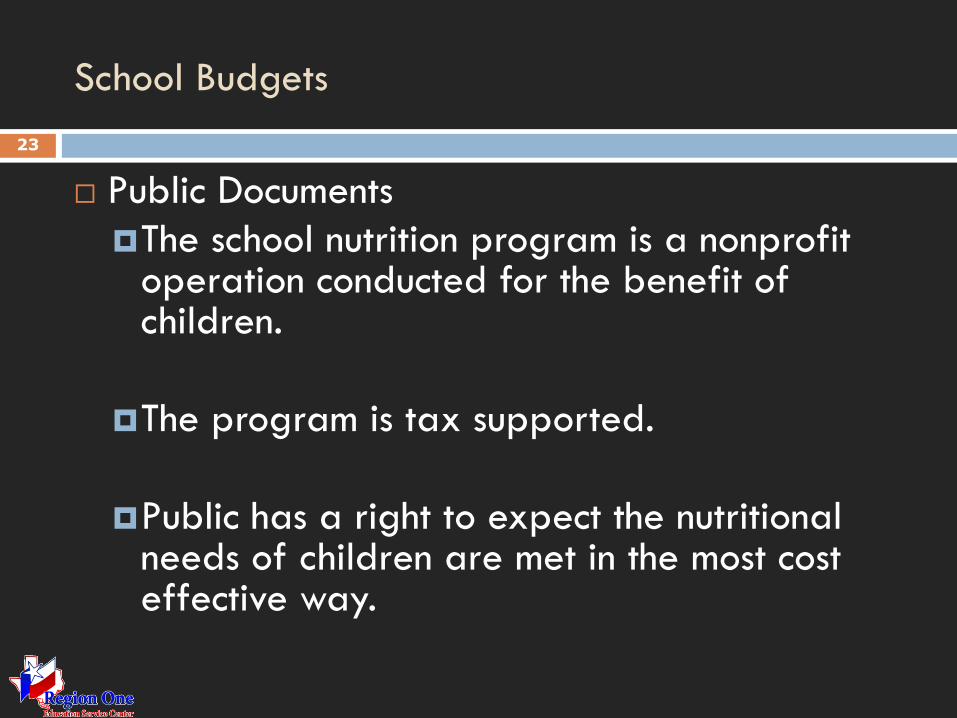
School Budgets
23
Public Documents
The school nutrition program is a nonprofit operation conducted for the benefit of children.
The program is tax supported.
Public has a right to expect the nutritional needs of children are met in the most cost effective way.
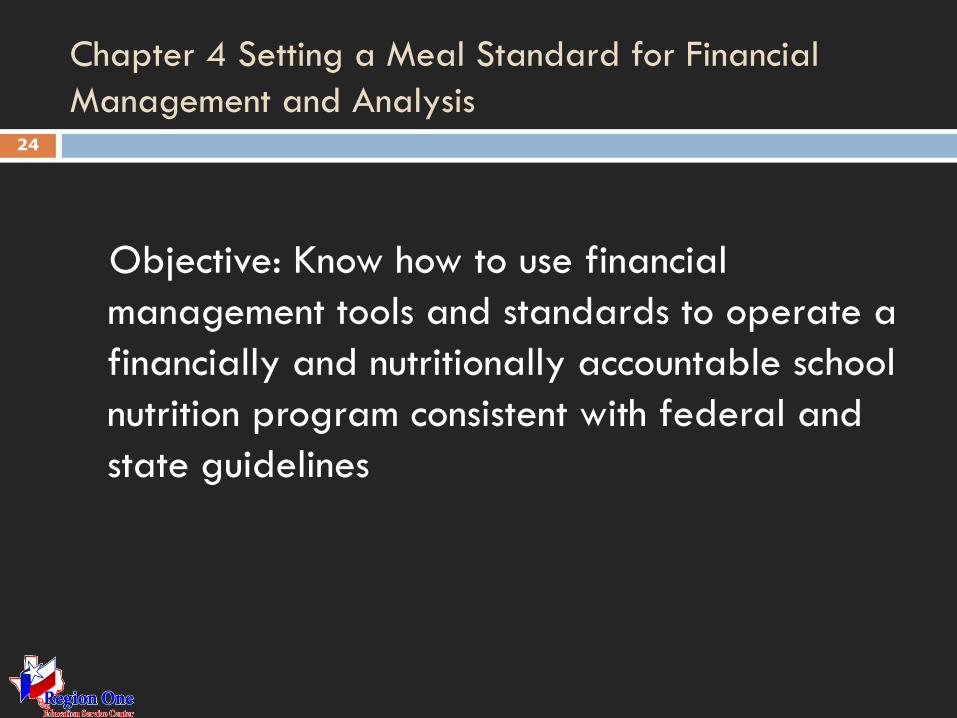
Chapter 4 Setting a Meal Standard for Financial
Management and Analysis 24
Objective: Know how to use financial
management tools and standards to operate a
financially and nutritionally accountable school
nutrition program consistent with federal and
state guidelines
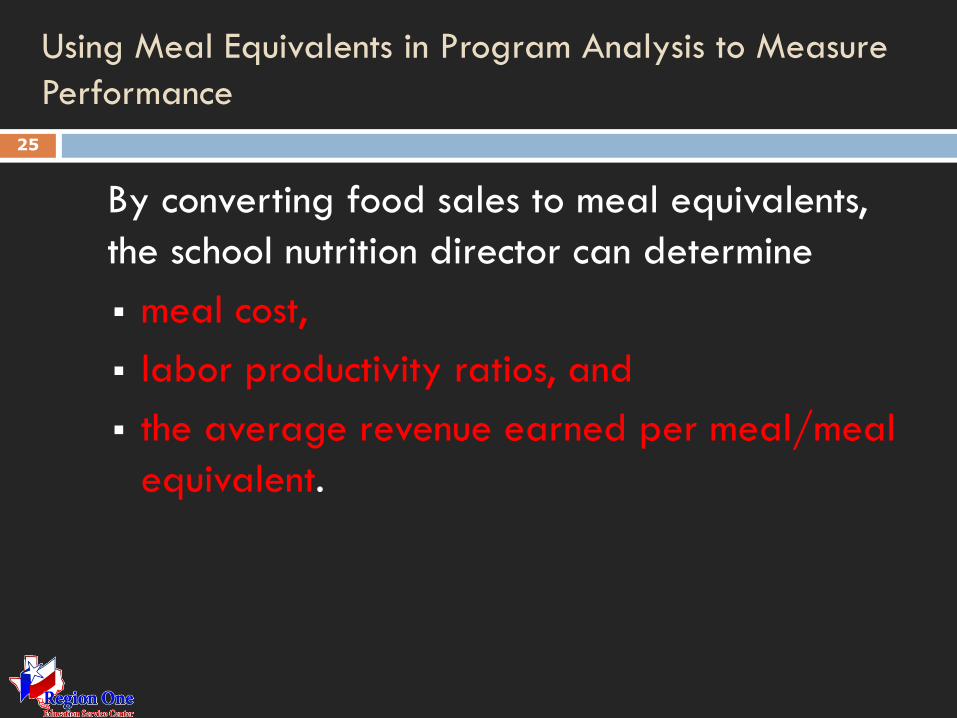
Using Meal Equivalents in Program Analysis to Measure
Performance
25
By converting food sales to meal equivalents,
the school nutrition director can determine
meal cost,
labor productivity ratios, and
the average revenue earned per meal/meal
equivalent.
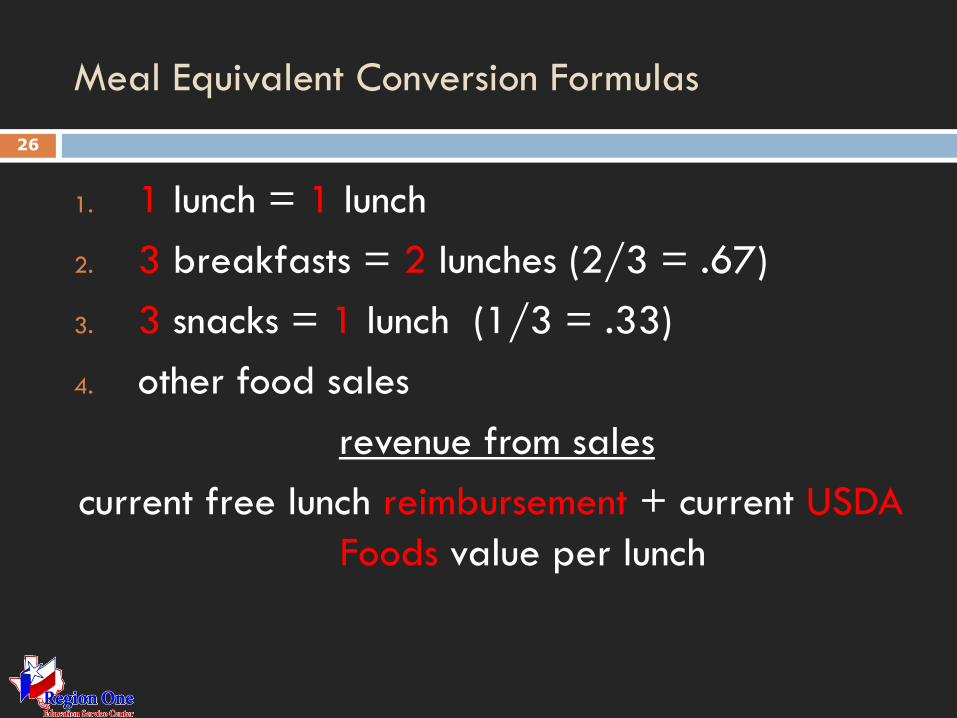
Meal Equivalent Conversion Formulas
26
1. 1 lunch = 1 lunch
2. 3 breakfasts = 2 lunches (2/3 = .67)
3. 3 snacks = 1 lunch (1/3 = .33)
4. other food sales
revenue from sales
current free lunch reimbursement + current USDA
Foods value per lunch
Chapter 5 Managing Revenue in School Nutrition
Programs 27
Objective: Know how to analyze, interpret, and
use revenue data for program evaluation and
improvement
Revenue Accountability
28
USDA mandates accountability
for all revenue received,
how that revenue is dispersed, and
that the revenue generated is sufficient to
sustain a nutrition program that serves food
high in quality and nutritional value.
Revenue Analysis
29
Calculate average revenue per meal or meal
equivalent
Establish consistent guidelines for pricing
meals and other food items for sale
Compare revenue generated per meal with
costs per meal
Why it’s important to compare revenue earned with
meal cost
30
This comparison is useful because
it helps determine if and where revenue
needs to be increased,
it allows you to analyze revenue by source,
and
it identifies areas in which revenue should be
monitored for revenue loss.
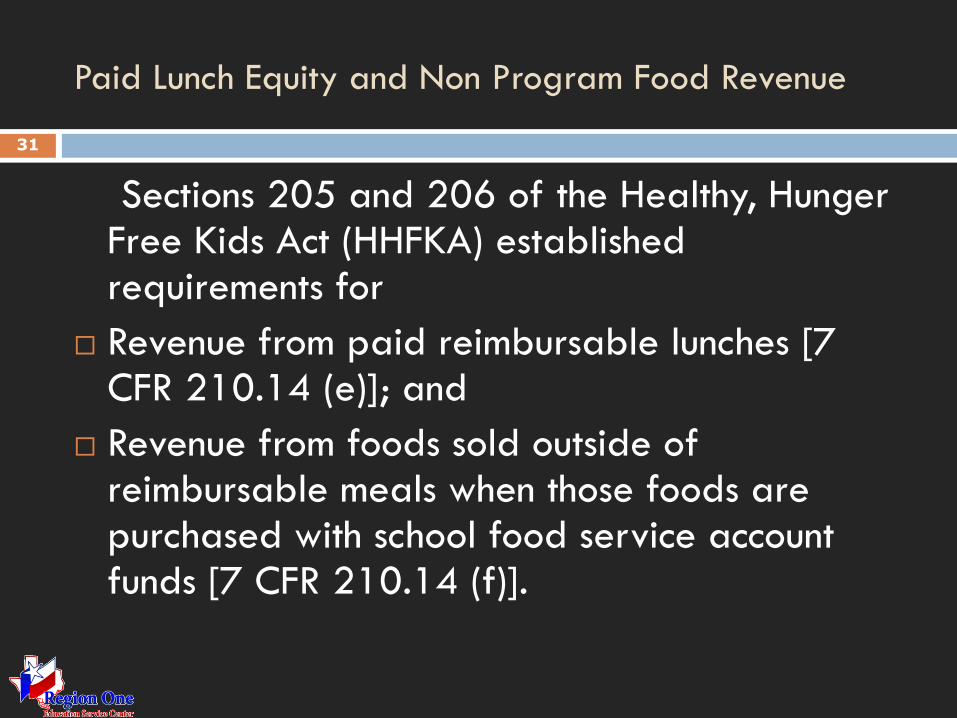
Paid Lunch Equity and Non Program Food Revenue
31
Sections 205 and 206 of the Healthy, Hunger Free Kids Act (HHFKA) established requirements for
Revenue from paid reimbursable lunches [7 CFR 210.14 (e)]; and
Revenue from foods sold outside of reimbursable meals when those foods are purchased with school food service account funds [7 CFR 210.14 (f)].
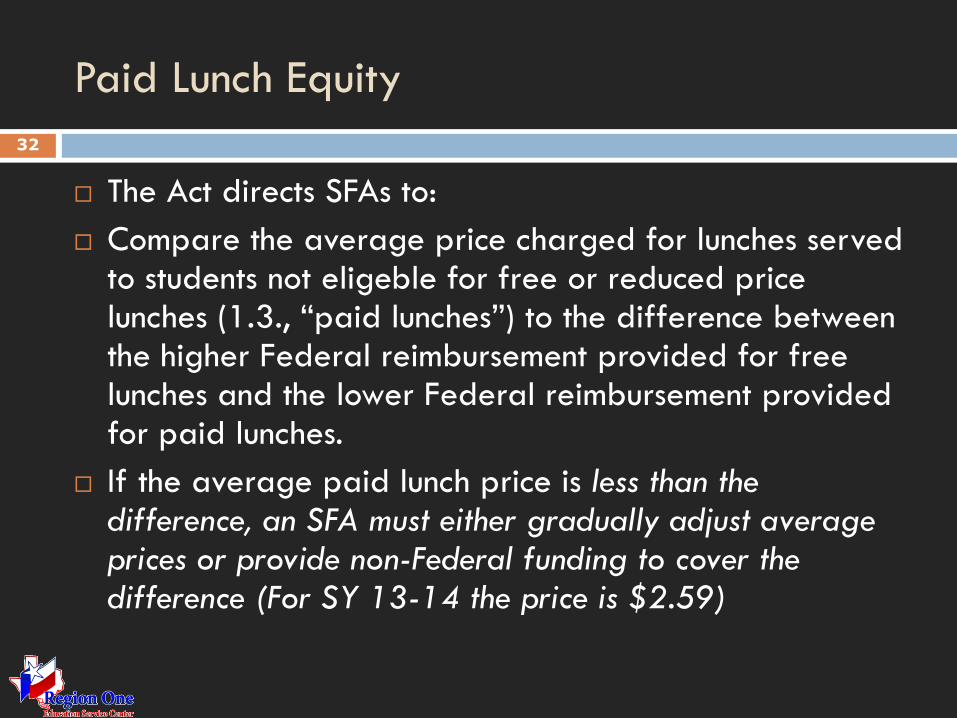
Paid Lunch Equity
32
The Act directs SFAs to:
Compare the average price charged for lunches served to students not eligeble for free or reduced price lunches (1.3., “paid lunches”) to the difference between the higher Federal reimbursement provided for free lunches and the lower Federal reimbursement provided for paid lunches.
If the average paid lunch price is less than the difference, an SFA must either gradually adjust average prices or provide non-Federal funding to cover the difference (For SY 13-14 the price is $2.59)
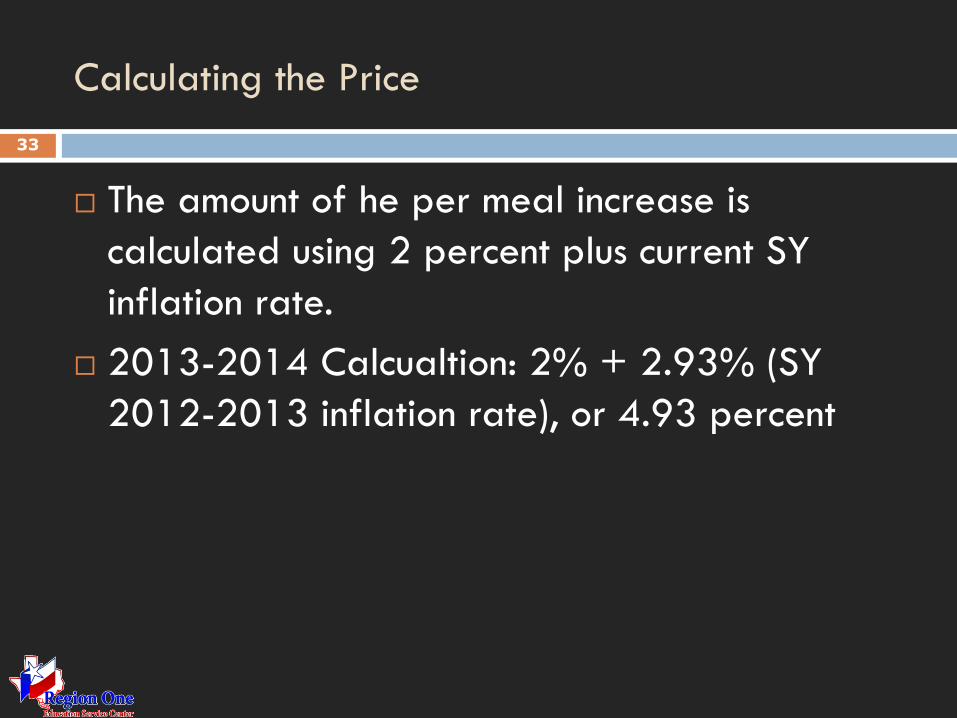
Calculating the Price
33
The amount of he per meal increase is
calculated using 2 percent plus current SY
inflation rate.
2013-2014 Calcualtion: 2% + 2.93% (SY
2012-2013 inflation rate), or 4.93 percent
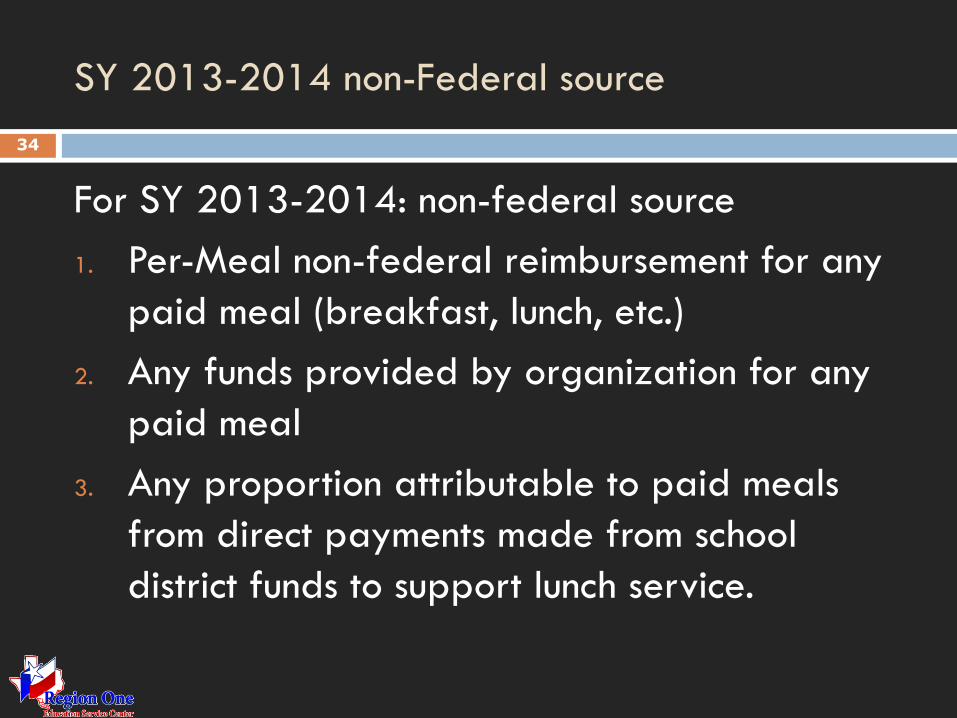
SY 2013-2014 non-Federal source
34
For SY 2013-2014: non-federal source
1. Per-Meal non-federal reimbursement for any
paid meal (breakfast, lunch, etc.)
2. Any funds provided by organization for any
paid meal
3. Any proportion attributable to paid meals
from direct payments made from school
district funds to support lunch service.
Three-month operating balance 35
For SY 2013-2014 State agencies, upon request by
an SFA, should exempt an SFA from the paid lunch
Revenue requirements if the SFA: has been certified
as meeting the meal pattern requirements, and; can
demonstrate that the required increase to paid
lunch prices or revenue contributions would cause
the SFA to exceed the three-month operating
balance limit.
Paid Lunch Equity: 2013-2014 36
While flexibilities are available for SY 2013-2014,
FNS will carefully evaluate the information and
data gathered from State agencies regarding how
these policies are being implemented in order to
better understand their impact on school food
service revenue and whether they further the goals
of the HHFKA.
SY 2013-14 PLE tool 37
A PLE tool is available on the FNS website to help
SFAs calculate the price of lunch
The tool can be retrieved at
http://www.fns.usda.gov/cnd/governance/policy.htm
Revenue from Nonprogram Food 38
Section 206 of the Healthy, Hunger-Free Kids Act of
2010 requires that the proportion of total school
food service revenue provided by the sale of
nonprogram foods to the total revenue of the school
food service account must be equal to or greater
than the proportion of total food cost associated
with obtaining nonprogram foods to the total costs
associated with obtaining program and nonprogram
foods from the account.
Revenue From Nonprogram Foods 39
Intent: To ensure that revenues from the sale of
nonprogram foods generate at least the same
proportion as they contribute to SFA foods costs
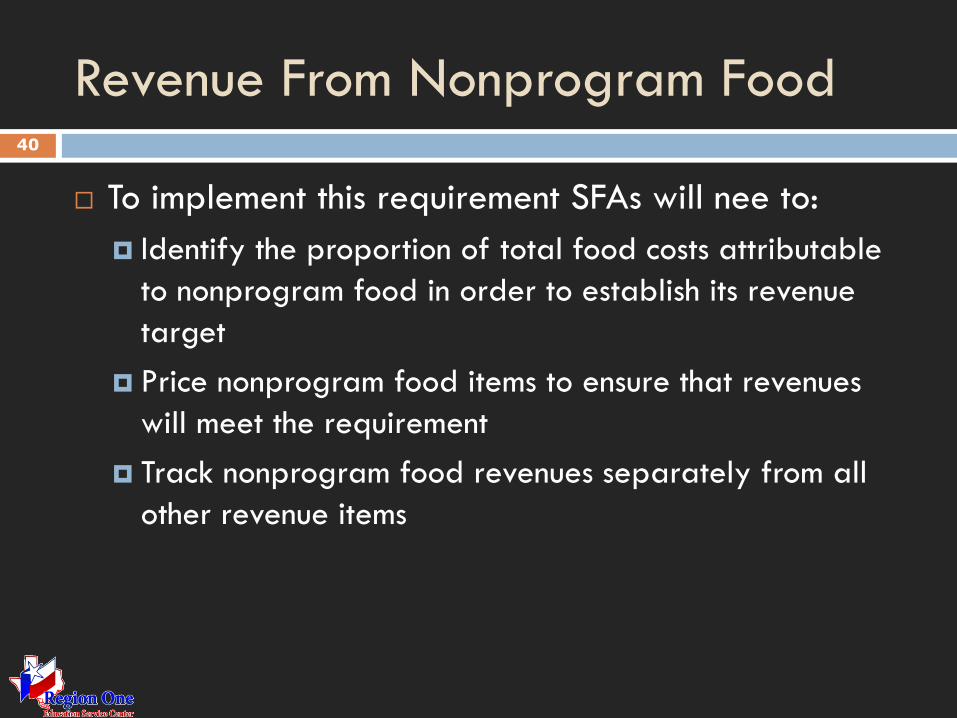
Revenue From Nonprogram Food 40
To implement this requirement SFAs will nee to:
Identify the proportion of total food costs attributable
to nonprogram food in order to establish its revenue
target
Price nonprogram food items to ensure that revenues
will meet the requirement
Track nonprogram food revenues separately from all
other revenue items
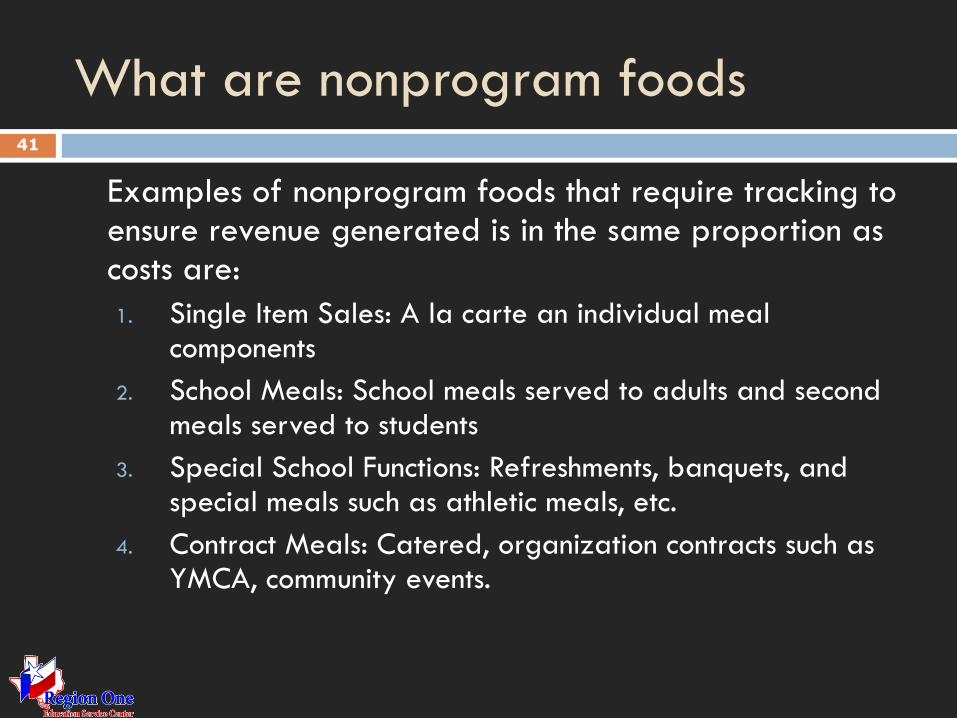
What are nonprogram foods 41
Examples of nonprogram foods that require tracking to ensure revenue generated is in the same proportion as costs are:
1. Single Item Sales: A la carte an individual meal components
2. School Meals: School meals served to adults and second meals served to students
3. Special School Functions: Refreshments, banquets, and special meals such as athletic meals, etc.
4. Contract Meals: Catered, organization contracts such as YMCA, community events.
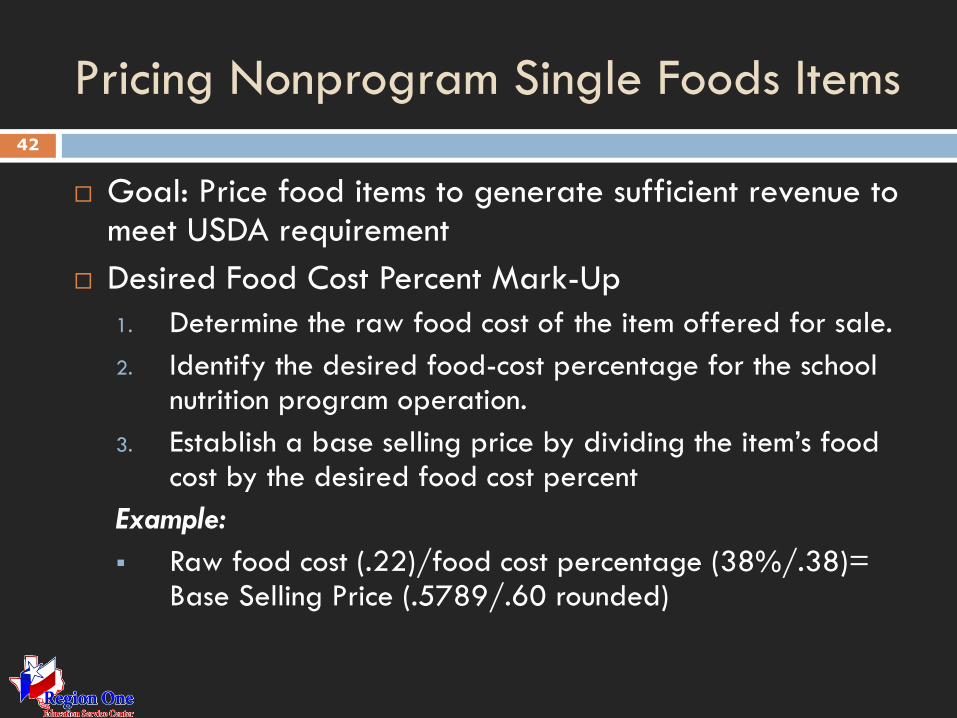
Pricing Nonprogram Single Foods Items 42
Goal: Price food items to generate sufficient revenue to meet USDA requirement
Desired Food Cost Percent Mark-Up
1. Determine the raw food cost of the item offered for sale.
2. Identify the desired food-cost percentage for the school nutrition program operation.
3. Establish a base selling price by dividing the item’s food cost by the desired food cost percent
Example:
Raw food cost (.22)/food cost percentage (38%/.38)= Base Selling Price (.5789/.60 rounded)
Pricing Nonprogram Single Food Items 43
Handout 1
Example: Calculating A la carte and Individual Menu
Components
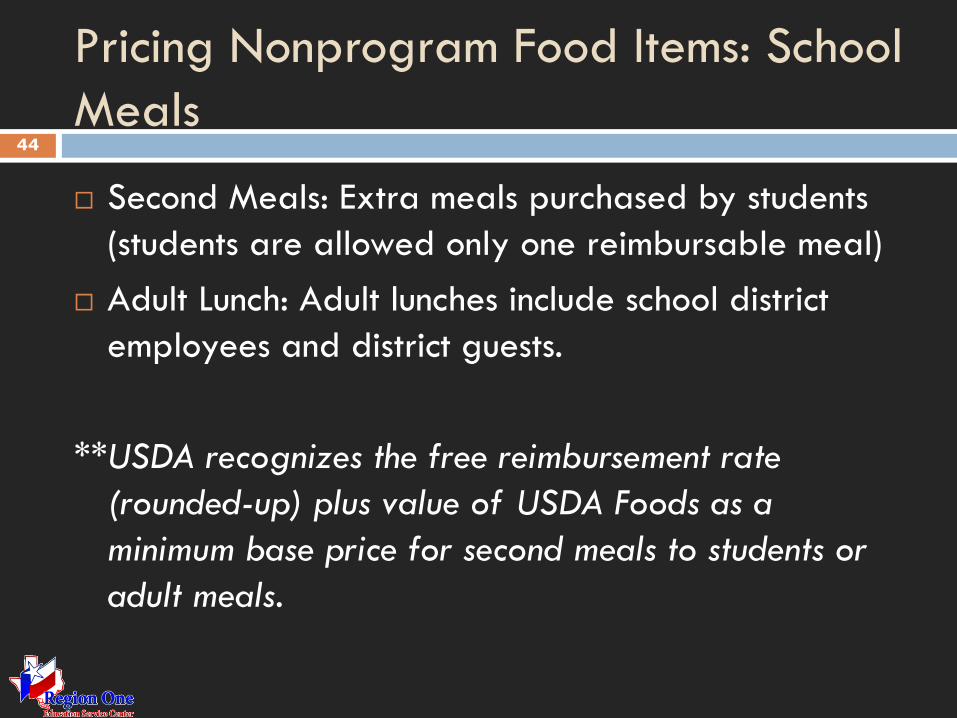
Pricing Nonprogram Food Items: School
Meals 44
Second Meals: Extra meals purchased by students
(students are allowed only one reimbursable meal)
Adult Lunch: Adult lunches include school district
employees and district guests.
**USDA recognizes the free reimbursement rate
(rounded-up) plus value of USDA Foods as a
minimum base price for second meals to students or
adult meals.
Pricing Non-Program Food Items:
School Meals 45
Handout 2
Example: Calculating Nonoprogram School Meals
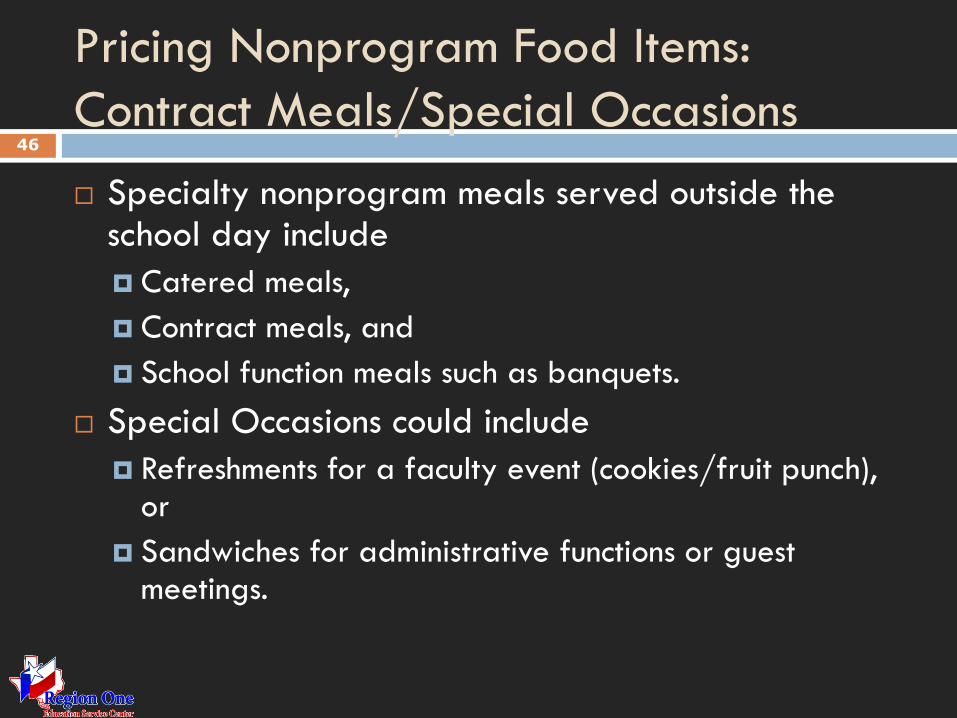
Pricing Nonprogram Food Items:
Contract Meals/Special Occasions 46
Specialty nonprogram meals served outside the school day include
Catered meals,
Contract meals, and
School function meals such as banquets.
Special Occasions could include
Refreshments for a faculty event (cookies/fruit punch), or
Sandwiches for administrative functions or guest meetings.
Pricing NonProgram Food Items:
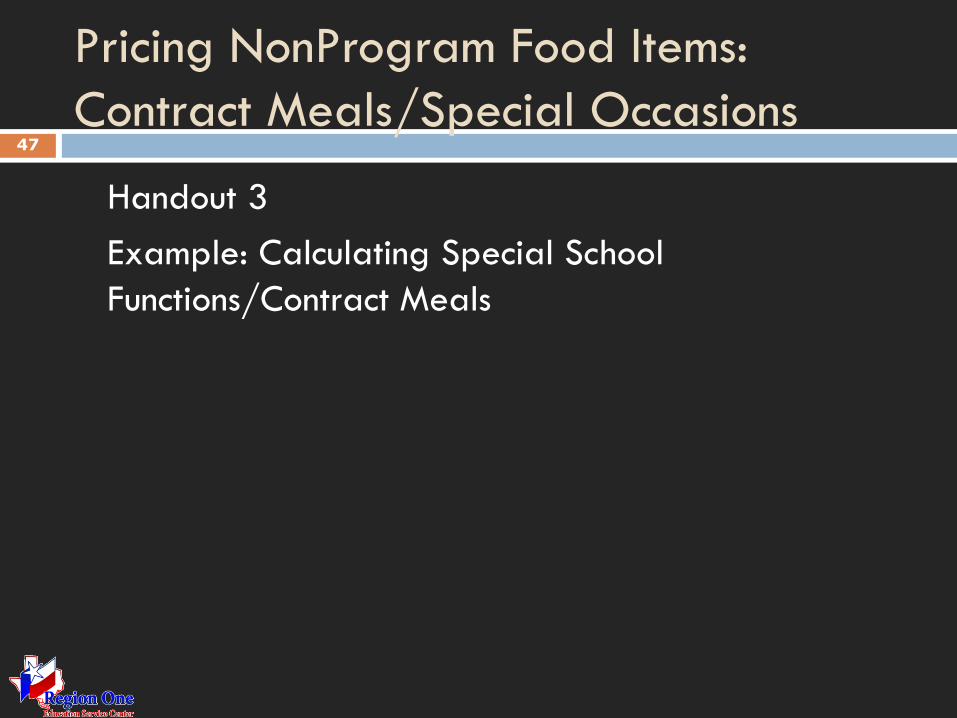
Contract Meals/Special Occasions 47
Handout 3
Example: Calculating Special School
Functions/Contract Meals
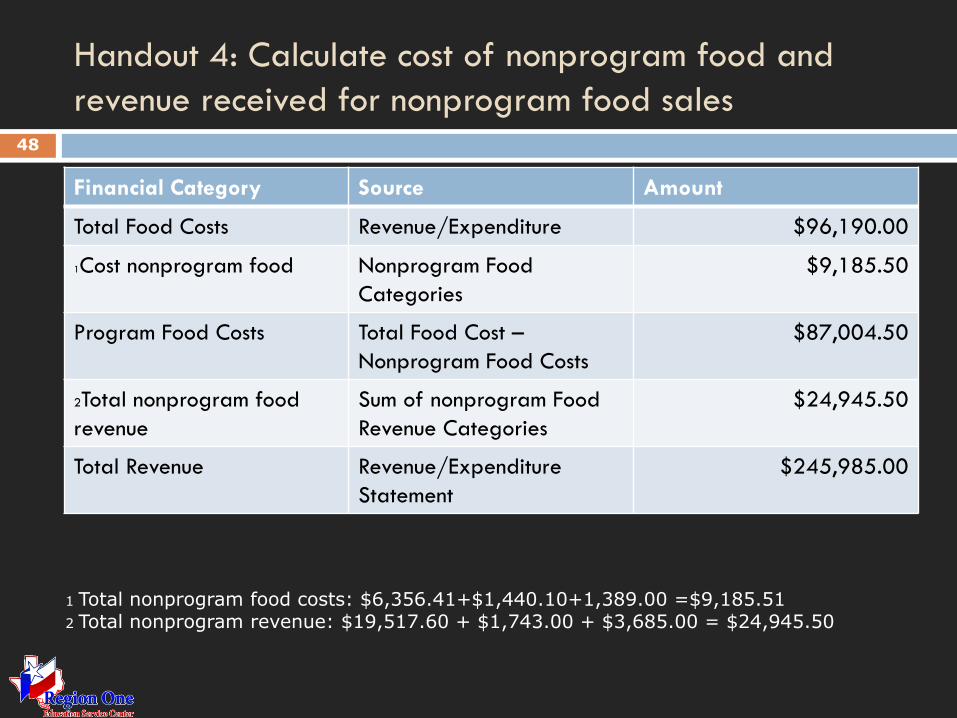
Handout 4: Calculate cost of nonprogram food and
revenue received for nonprogram food sales 48
Financial Category Source Amount
Total Food Costs Revenue/Expenditure $96,190.00
1Cost nonprogram food Nonprogram Food
Categories
$9,185.50
Program Food Costs Total Food Cost –
Nonprogram Food Costs
$87,004.50
2Total nonprogram food
revenue
Sum of nonprogram Food
Revenue Categories
$24,945.50
Total Revenue Revenue/Expenditure
Statement
$245,985.00
1 Total nonprogram food costs: $6,356.41+$1,440.10+1,389.00 =$9,185.51 2 Total nonprogram revenue: $19,517.60 + $1,743.00 + $3,685.00 = $24,945.50
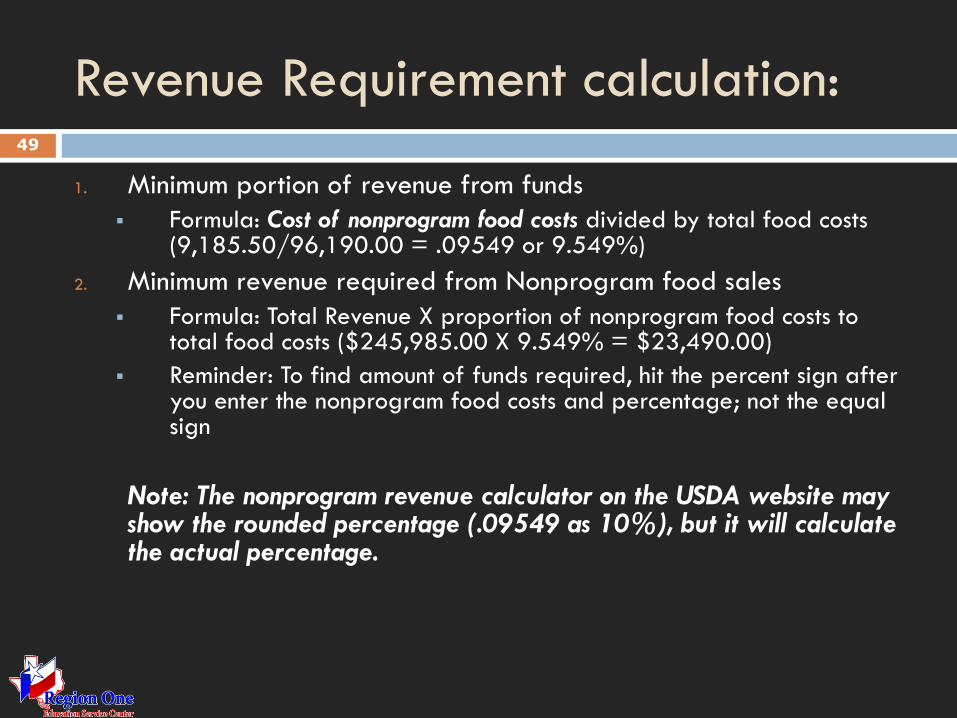
Revenue Requirement calculation: 49
1. Minimum portion of revenue from funds
Formula: Cost of nonprogram food costs divided by total food costs (9,185.50/96,190.00 = .09549 or 9.549%)
2. Minimum revenue required from Nonprogram food sales
Formula: Total Revenue X proportion of nonprogram food costs to total food costs ($245,985.00 X 9.549% = $23,490.00)
Reminder: To find amount of funds required, hit the percent sign after you enter the nonprogram food costs and percentage; not the equal sign
Note: The nonprogram revenue calculator on the USDA website may show the rounded percentage (.09549 as 10%), but it will calculate the actual percentage.
Checking Compliance 50
http://www.fns.usda.gov/cnd/governance/legislation/
CNR_2010.hmt
Focus of School Nutrition Programs 51
The main focus of the school nutrition program is to
provide good nutrition that promotes the health and
wellness of students so they can be more productive
in the classroom.
Chapter 6 Managing Expenditures in the School
Nutrition Program
52
Objective: Know how to analyze, interpret, and
use expenditure data for program evaluation
and improvement
Expenditure Analysis
53
Analyzing financial reports can provide
information about
patterns or trends,
significant changes in costs categories,
deviations from financial goals,
possible abuse or theft, and
transaction errors.
Types of Expenditure Analysis
54
Total costs to produce a meal
Meal costs per expenditure category
Percentages of operational costs to total
revenue
Costs to produce a meal compared with the
average revenue generated per meal
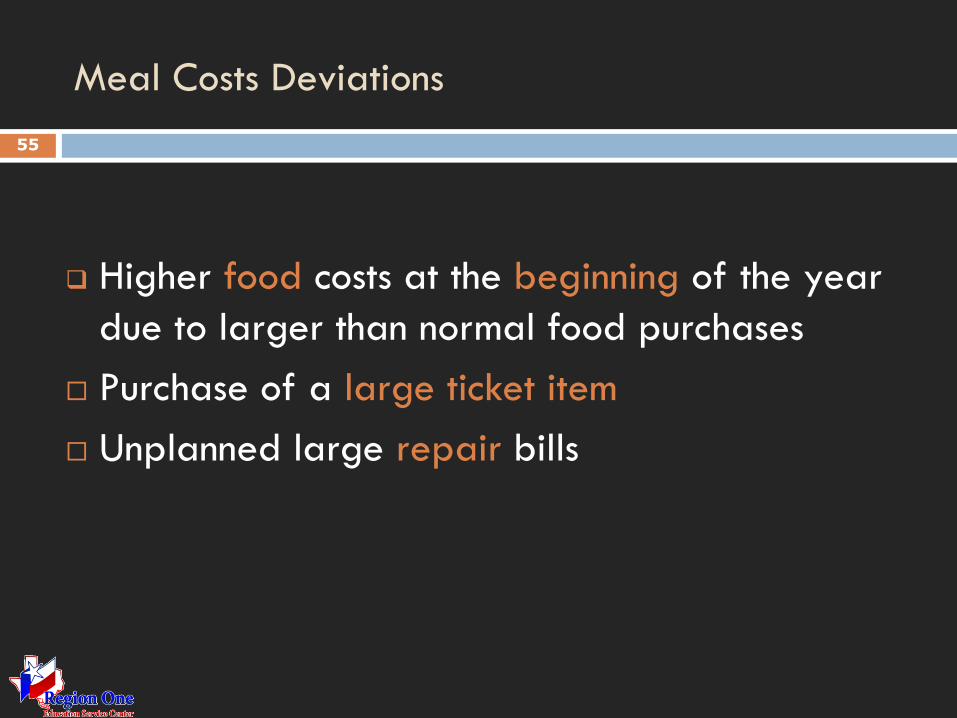
Meal Costs Deviations
55
Higher food costs at the beginning of the year
due to larger than normal food purchases
Purchase of a large ticket item
Unplanned large repair bills
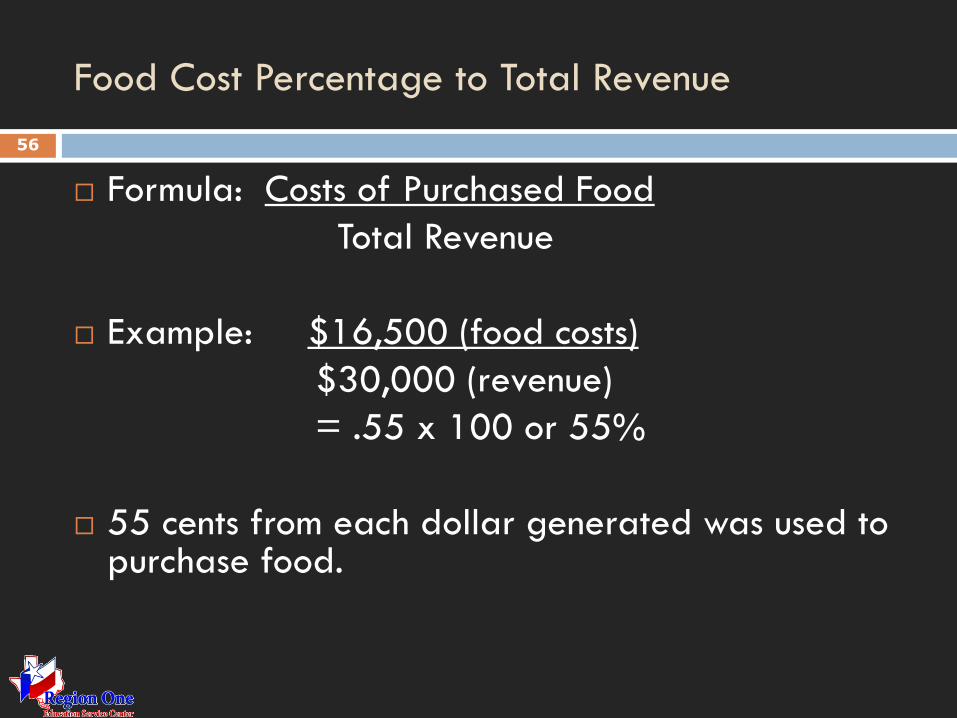
Food Cost Percentage to Total Revenue
56
Formula: Costs of Purchased Food
Total Revenue
Example: $16,500 (food costs)
$30,000 (revenue)
= .55 x 100 or 55%
55 cents from each dollar generated was used to purchase food.
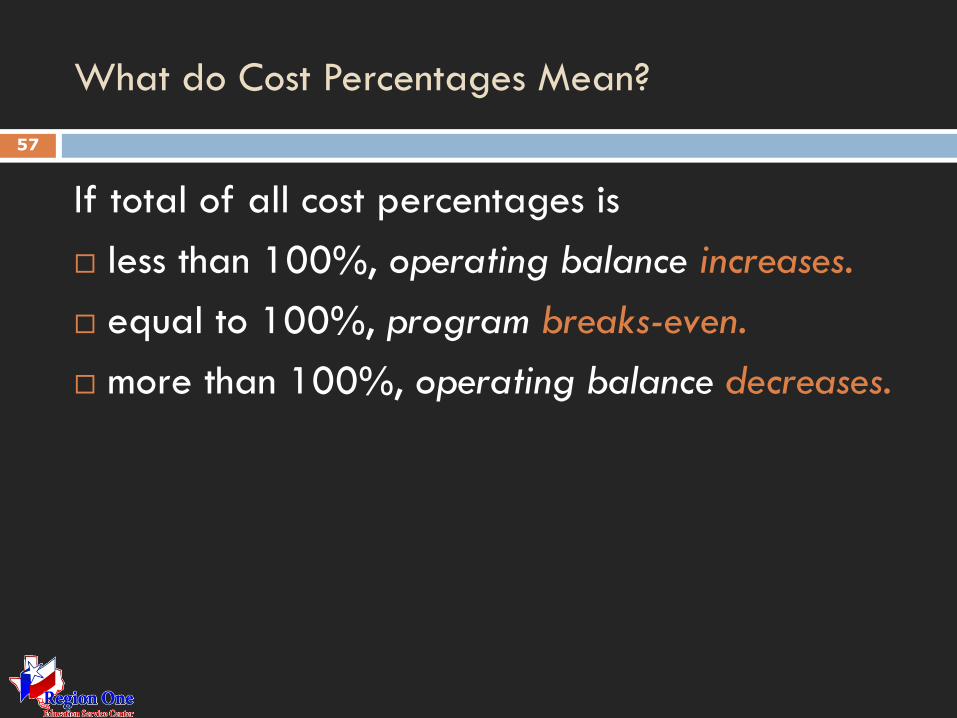
What do Cost Percentages Mean?
57
If total of all cost percentages is
less than 100%, operating balance increases.
equal to 100%, program breaks-even.
more than 100%, operating balance decreases.
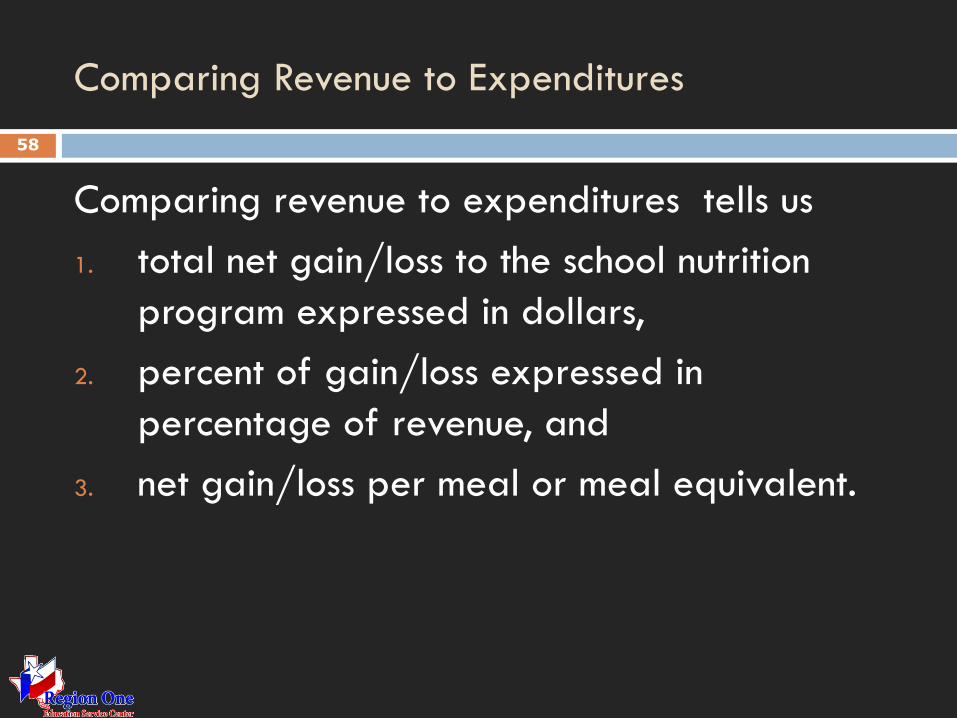
Comparing Revenue to Expenditures
58
Comparing revenue to expenditures tells us
1. total net gain/loss to the school nutrition
program expressed in dollars,
2. percent of gain/loss expressed in
percentage of revenue, and
3. net gain/loss per meal or meal equivalent.
Chapter 7 Controlling Food and Labor Costs in School
Nutrition Programs 59
Objective: Know how to apply cost control
measures to operate a financially sound
program with nutritional integrity
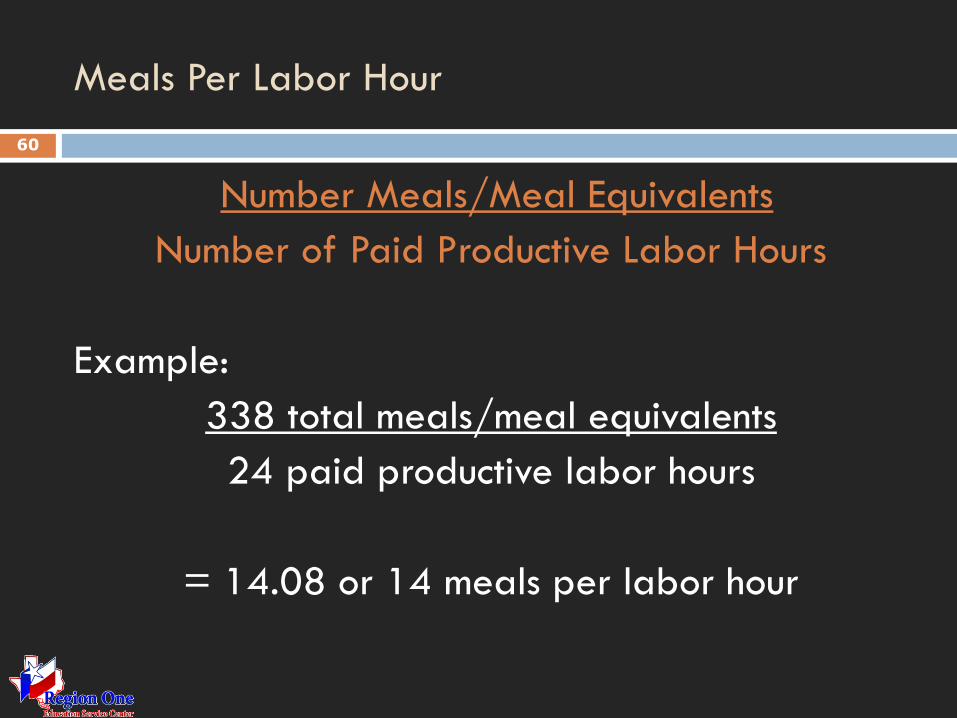
Meals Per Labor Hour
60
Number Meals/Meal Equivalents
Number of Paid Productive Labor Hours
Example:
338 total meals/meal equivalents
24 paid productive labor hours
= 14.08 or 14 meals per labor hour
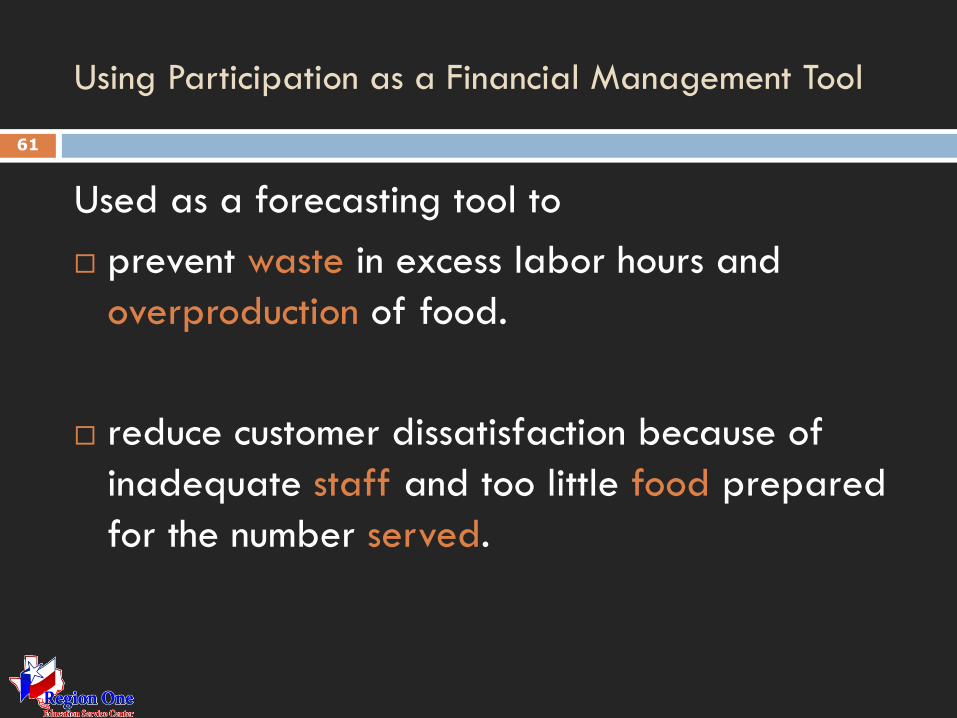
Using Participation as a Financial Management Tool
61
Used as a forecasting tool to
prevent waste in excess labor hours and
overproduction of food.
reduce customer dissatisfaction because of
inadequate staff and too little food prepared
for the number served.
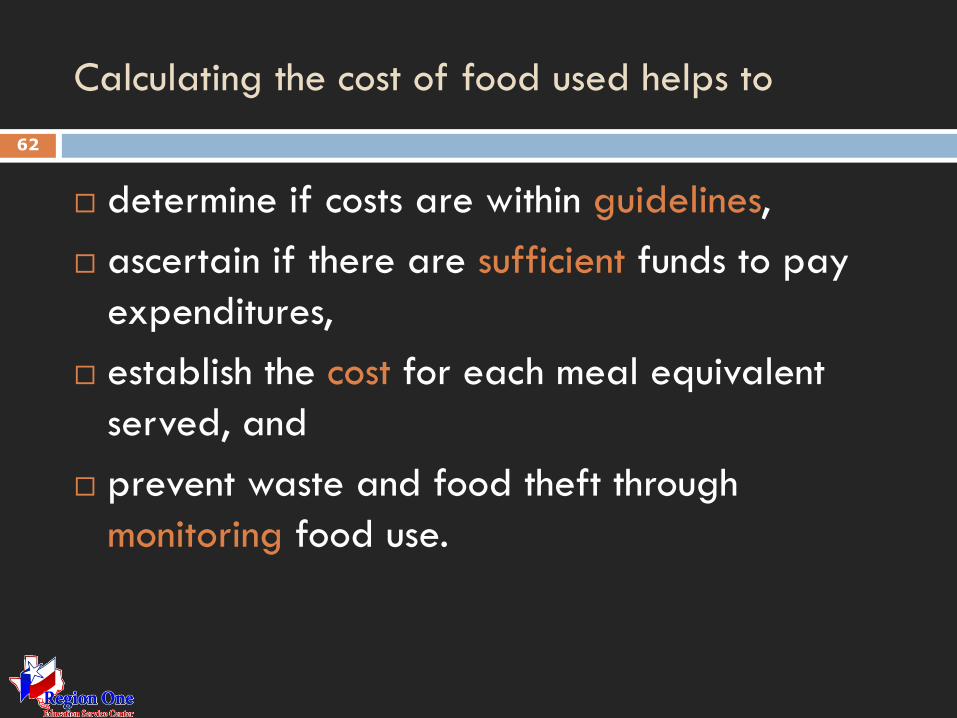
Calculating the cost of food used helps to
62
determine if costs are within guidelines,
ascertain if there are sufficient funds to pay
expenditures,
establish the cost for each meal equivalent
served, and
prevent waste and food theft through
monitoring food use.
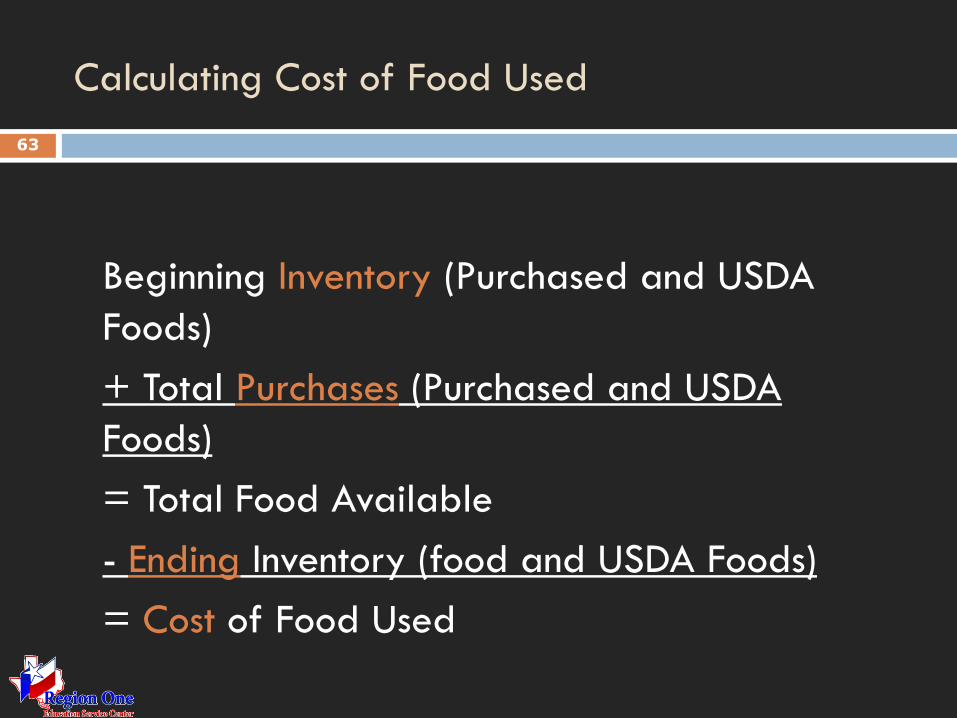
Calculating Cost of Food Used
63
Beginning Inventory (Purchased and USDA
Foods)
+ Total Purchases (Purchased and USDA
Foods)
= Total Food Available
- Ending Inventory (food and USDA Foods)
= Cost of Food Used
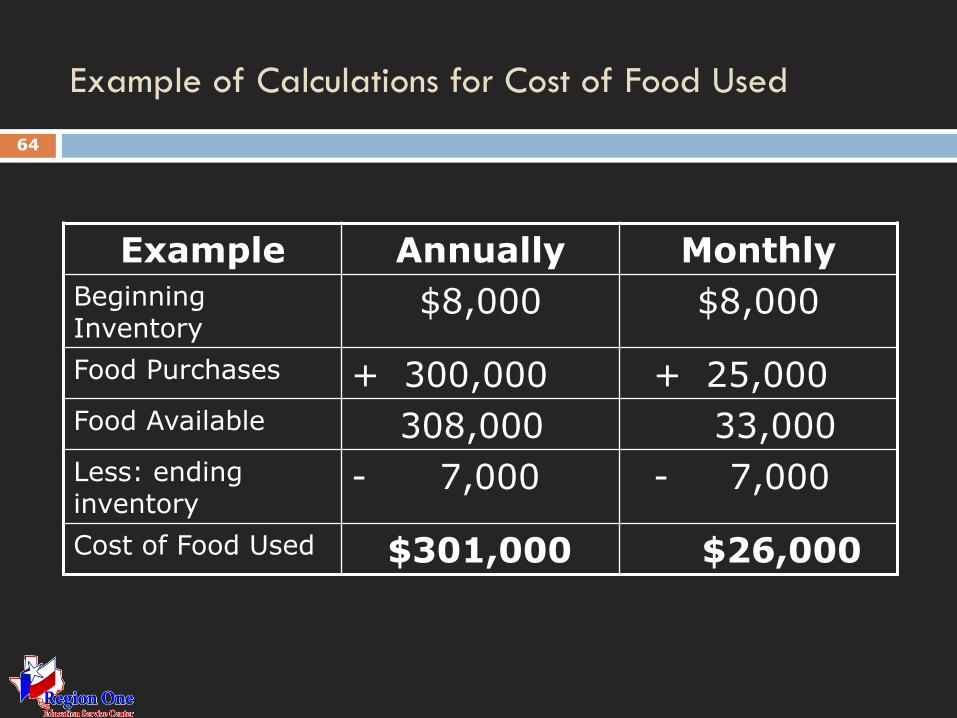
Example of Calculations for Cost of Food Used
Example Annually Monthly
Beginning Inventory
$8,000 $8,000
Food Purchases + 300,000 + 25,000
Food Available 308,000 33,000
Less: ending inventory
- 7,000 - 7,000
Cost of Food Used $301,000 $26,000
64
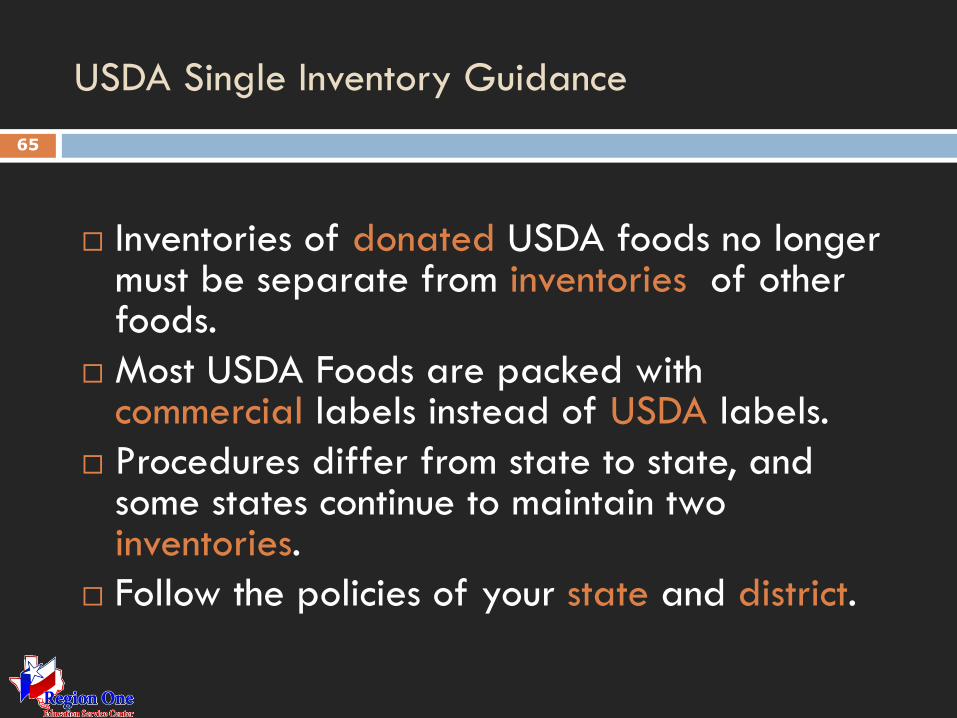
USDA Single Inventory Guidance
65
Inventories of donated USDA foods no longer must be separate from inventories of other foods.
Most USDA Foods are packed with commercial labels instead of USDA labels.
Procedures differ from state to state, and some states continue to maintain two inventories.
Follow the policies of your state and district.
Chapter 8 Developing and Analyzing a School Nutrition
Budget
66
Objective: Understand the importance of using
the budget as an analysis tool and control
document
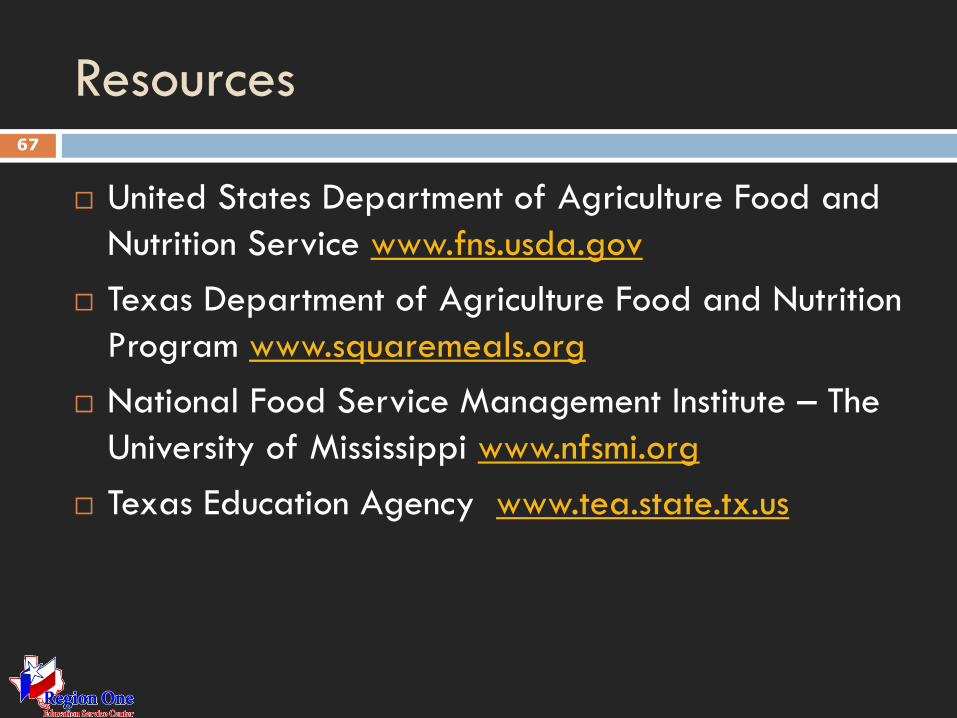
Resources 67
United States Department of Agriculture Food and
Nutrition Service www.fns.usda.gov
Texas Department of Agriculture Food and Nutrition
Program www.squaremeals.org
National Food Service Management Institute – The
University of Mississippi www.nfsmi.org
Texas Education Agency www.tea.state.tx.us
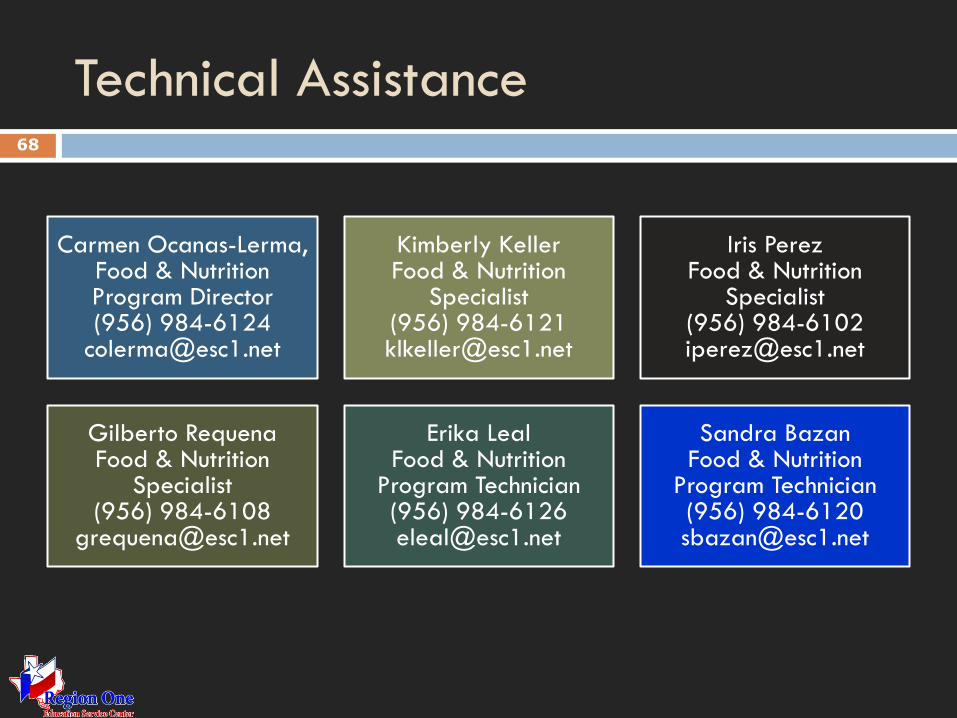
Technical Assistance 68
Carmen Ocanas-Lerma, Food & Nutrition Program Director (956) 984-6124
Kimberly Keller Food & Nutrition
Specialist (956) 984-6121 [email protected]
Iris Perez Food & Nutrition
Specialist (956) 984-6102 [email protected]
Gilberto Requena Food & Nutrition
Specialist (956) 984-6108
Erika Leal Food & Nutrition
Program Technician (956) 984-6126 [email protected]
Sandra Bazan Food & Nutrition
Program Technician (956) 984-6120 [email protected]

Acknowledgement Statement
You understand and acknowledge that:
The training you are about to receive does not
cover the entire scope of the program; and that
You are responsible for knowing and understanding
all handbooks, manuals, alerts, notices and
guidance, as well as any other forms of
communication that provide further guidance,
clarification or instruction on operating the program.
Thank You
“This service (or product) is provided through the Texas Department of
Agriculture's school nutrition education, and outreach program funded
by the U. S. Department of Agriculture, Food and Nutrition Service. In
accordance with Federal Law and U.S. Department of Agriculture
policy, this institution is prohibited from discriminating on the basis of
race, color, national origin, sex, age, or disability. To file a complaint of
discrimination, write USDA, Director, Office of Adjudication, 1400
Independence Avenue, SW, Washington, D.C. 20250-9410 or call toll
free (866) 632-9992 (Voice). Individuals who are hearing impaired or
have speech disabilities may contact USDA through the Federal Relay
Service at (800) 877-8339; or (800) 845-6136 (Spanish). USDA is an
equal opportunity provider and employer” (USDA, 2011).


![GENC'{ ],GIn; [x]NUTRITION DIRECTORS (X ]HFAP · [x]NUTRITION DIRECTORS [ ] ... Wild Blueberry Assn. of North America. BROCCOLI; ... California Raisin Advisory Board Califomia Redi](https://img.pdfslide.us/doc/110x75/5b3c22b07f8b9a5e1f8d31d9/genc-gin-xnutrition-directors-x-hfap-xnutrition-directors-.jpg)