Embed Size (px)
Citation preview
FINANCIAL LITERACY SURVEY
Report on the Key Findings of the Survey Prepared for the World Bank
June 2010
Sofia, Bulgaria
54 Iskar Str., 1000 Sofia, Bulgaria
phone/fax: [+ 359 2] 983 60 67 phone/fax: [+ 359 2] 9869075
e-mail: [email protected]
http://www.aresearch.org
1
Pub
lic D
iscl
osur
e A
utho
rized
Pub
lic D
iscl
osur
e A
utho
rized
Pub
lic D
iscl
osur
e A
utho
rized
Pub
lic D
iscl
osur
e A
utho
rized
CONTENTS INTRODUCTION ........................................................................................................................ 4 I. PART ONE: METHODOLOGICAL REPORT........................................................................ 5
1. METHODOLOGICAL APPROACH AND RELEVANT ACTIONS................................. 5 1.1 Preparation of the survey questionnaire.......................................................................... 5 1.2 Definition of sample size and sample frame................................................................... 5 1.3 Implementation of the sampling procedure .................................................................... 5 1.4 Development of training materials, delivery of trainings for supervisors and interviewers. Conducting a pilot survey. .............................................................................. 6 1.5 Fieldwork/Interviewing process...................................................................................... 6 1.6 Quality control and logic check ...................................................................................... 6 1.7 Creation of the required software and instructions for data entering. Entering and ....... 6 1.8 Preparation of Preliminary Technical Report. ................................................................ 7 1.9 Preparation of Key Findings Report and Presentation of the survey results (power point format) for the Dissemination Workshop. ............................................................................ 7
2. SOCIO-DEMOGRAPHIC STRUCTURE OF THE SAMPLE............................................ 8 II. PART TWO: ANALYSIS OF THE SURVEY RESULTS ................................................... 10
1. LEVEL OF CONFIDENCE IN THE FINANCIAL SECTOR........................................... 10 1.1. Confidence in the public institutions related with the financial sector........................ 10 1.2.Confidence in private financial institutions and expectations to the development of the financial markets................................................................................................................. 12 1.3. Dynamics of the confidence to the main financial institutions and expectations for their development................................................................................................................ 15 1.4. Confidence in the reaction of the institutions to emerging problems in the use of financial services................................................................................................................. 16
2. AWARENESS AND CONSUMER RIGHTS IN THE USE OF FINANCIAL PRODUCTS................................................................................................................................................. 18
2.1. Sources of information................................................................................................. 18 2.2.Interest in financial information.................................................................................... 21 2.3. Intensity of the communication on financial matters................................................... 24
3. FINANCIAL LITERACY .................................................................................................. 26 3.1. Self-assessment of the financial literacy...................................................................... 26 3.2. Objective assessment of the financial literacy of the Bulgarian citizens..................... 27 3.3. Attitudes to the financial literacy program .................................................................. 30
4. HOUSEHOLD FINANCIAL MANAGEMENT................................................................ 32 4.1. Financial status of the Bulgarian households............................................................... 32 4.2. Management of household budget ............................................................................... 33 4.3. Financial strategies and investment activity ................................................................ 36
5. USE AND INTEREST IN FINANCIAL PRODUCTS...................................................... 38 6. KEY FINDINGS AND RECOMMENDATIONS ............................................................. 41
Recommendations....................................................................................................................... 45 ANEXES..................................................................................................................................... 47
2
ABBREVIATIONS AND ACCRONIMS USAID US Agency for International Development BNB Bulgarian National Bank APR Annual Percentage Rate EU European Union FLS Financial Literacy Survey CCP Commission for Consumer Protection FSC Financial Supervision Commission MHA Mutual Help Associations NGO Non-governmental organization NSI National Statistical Institute NUTS Nomenclature of Territorial Units for Statistics WB World Bank % Percentage BDIF Bulgarian Deposit Insurance Fund
3
INTRODUCTION The Financial Literacy survey is part of a World Bank Financial Governance/Consumer Protection in Financial Services Program in ECCU5 Countries. The Program aims to improve the levels of consumer protection and financial literacy in these countries—and thereby strengthen consumer confidence in the financial sectors. To this end the World Bank commissioned to the Alpha Research a baseline national representative survey. The objective of the study is to assess the level of financial literacy and consumer confidence of households and to outline the peculiarities in different target groups prior to the implementation of the action plan for increasing the financial literacy of the general population and in particular of the low-income groups. The fieldwork was accomplished in the period 17-25 May 2010 in Bulgaria. A total of 1432 respondents from a general population (18+) were interviewed in their homes. Additional booster sample of 186 youth aged 16-17 was implemented. The questionnaire is based on the model Financial literacy survey questionnaire used in Romania in order to achieve comparison of the results between the countries. The graphs and tables included in the report are based on the data, collected by the Financial Literacy survey in Bulgaria. In the cases where comparisons are made with other surveys, the source is duly referenced. The views expressed herein are those of Alpha Research experts and can therefore in no way be taken to reflect the official opinion of the World Bank. The report is structured in two main parts and 3 Annexes:
Part one is methodological and has two chapters – Methodological approach and research activities; Socio-demographic structure of the sample.
Part two presents the survey results in six chapters: Level of confidence in the financial sector; Awareness and Consumer rights in the use of Financial Products; Financial literacy; Household Financial management; Interest and use of financial products. Chapter six summarizes the Key findings and Recommendations.
Annex 1 – Survey questionnaire. Annex 2 – Frequencies of the survey questions – results from the main sample and from
the booster (age 16-17). Annex 3 – cross-tabulations of all the questions by socio-demographic profile of the
respondents.
4
I. PART ONE: METHODOLOGICAL REPORT
1. METHODOLOGICAL APPROACH AND RELEVANT ACTIONS Following methodological approach and actions were taken in the implementation of the Financial Literacy Survey: 1.1 Preparation of the survey questionnaire
The questionnaire is based on the model Financial Literacy Survey questionnaire used in Romania in order to achieve comparison of the results between the countries.
Questions from previous surveys on financial literacy issues conducted in Bulgaria have been included in the questionnaire as well. This allows comparison of the survey results with those of previous studies.
The questionnaire was reviewed with the relevant institutions – Bulgarian National Bank, Ministry of Economy, Energy and Tourism, World Bank.
1.2 Definition of sample size and sample frame 2.1. Sample size: based on statistical calculations in order to obtain max. standard deviation +/- 2.5% .
Main sample - 1500 respondents general population Booster – 300 respondents 16-17 years old
2.2. Sample frame: random, two-staged stratified sample with probability, proportional to the size of the location. The sample include both urban and rural areas and is based on two stratification criteria:
NUTS region (6 regions – North-West, North-Central, North-East, South-West, South-Central, South-East)
Type of location (5 groups – Capital; Regional center with more than 100000 citizens, Regional center with less than 100000 citizens, Small town, Village)
1.3 Implementation of the sampling procedure
All NUTS regions in Bulgaria have been ranged in descending order according to the size of the population.
At the first stage the sample was distributed proportionally on the size of population in each of the 30 (6 NUTS X 5 type of location groups) strata different from zero.
A cumulative column with the number of locations in each region was prepared. This cumulative column is used for defining the number of the sample points at the second stage of the sample and respectively – the number of the respondents in each location (proportionally to its’ size).
The sample step was calculated according to the following formula: Sample step = Number of population in the region (N) divided on the number of respondents in the sample.
A random starting number was defined. A number of 10 respondents in each sample nest have been set in order to minimize the
influence of correlation error within the sample nest. The largest locations include a higher number of sample nests.
The number of sample nests and the number of respondents in each location have been defined, proportionally to their size.
At a second-stage, using the random selection based on the “last birthday in the household”, the respondents were selected within each sample point.
The sample is representative for the adult population (18+). Additional sample booster of young people (16-17 years old) was prepared according to
the same criteria.
5
1.4 Development of training materials, delivery of trainings for supervisors and interviewers. Conducting a pilot survey.
The team was been given a special briefing session before the beginning of the study. They were acquainted with the survey objectives and tasks, the instruction for conducting the interview and the peculiarities of the questionnaire’s structure.
15 pilot interviews were conducted in order to test how the questionnaire would work in a local environment. Average length of the interview: 60 minutes. The shortest interview was 40 minutes and the longest - 90 minutes.
The general observations from the pilot test were: o The questionnaire was twice longer than the 30 minutes length pointed out in the
TOR. o There were long options that required repeat of question. The suggestion was to
use a show card with the possible answers that could be shown to the respondents.
1.5 Fieldwork/Interviewing process The fieldwork was conducted by the team of 75 interviewers from Alpha Research. The
average number of interviews per interviewer was 21. The fieldwork manager in the head office in Sofia was in permanent contact with the
regional supervisors. There were no significant difficulties during the survey fieldwork. The interviews were conducted face-to-face at respondents’ homes during the following
time schedule: o On weekdays – between 9.00 – 12.00h and 17:30 - 20:30h o During the weekend – between 10:00 - 20:00h o The average length of one interview was 55 minutes
A total number of 1800 respondents were reached and 1618 interviews were conducted: o Main sample: total number of 1500 respondents were reached and 1432 were
conducted: Response rate – 95% Refusal rate - 5% Main reason for refusals: the length of interview
o Booster sample of young citizens aged 16 – 17 y.o.: total number of 300 respondents were reached and 186 interviews were conducted:
Response rate – 62% Refusal rate – 38% Main reason for refusals: the subject of the survey
1.6 Quality control and logic check
The supervisors’ team did quality control on the interviewers’ work from the head office in Sofia. 20% (325 respondents) of the total sample were back checked by phone:
o 295 respondents were contacted personally and confirmed that they were interviewed.
o 30 respondents were not available at the time of control, but another member of the household confirmed that the interview was conducted.
Consistence and logic check on all completed questionnaires was carried out by the central office staff.
No weighting procedures were applied. 1.7 Creation of the required software and instructions for data entering. Entering and cleaning data and preparation of clean data file (SPSS) for the main sample and for the booster.
6

1.8 Preparation of Preliminary Technical Report. 1.9 Preparation of Key Findings Report and Presentation of the survey results (power point format) for the Dissemination Workshop.
7

2. SOCIO-DEMOGRAPHIC STRUCTURE OF THE SAMPLE The sample designed and implemented by Alpha Research for the purposes of the Financial Literacy Survey ensures the national representativeness of the general population. The surveyed population has a similar pattern to the national demographic status. The sample structure reproduces the structure of the population in Bulgaria done by the census data of the National Statistical Institute (NSI). Table: Socio-demographic structure of the sample
Type of residence Total
Sofia Regional center Smaller town Village
Count Col % Count Col % Count Col % Count Col % Count Col %
Male 123 45,7% 235 48,6% 131 47,5% 193 47,9% 682 47,6% Gender
Female 146 54,3% 249 51,4% 145 52,5% 210 52,1% 750 52,4%
18-30 71 26,4% 116 24,0% 62 22,5% 62 15,4% 311 21,7%
31-40 52 19,3% 93 19,2% 40 14,5% 58 14,4% 243 17,0%
41-50 46 17,1% 98 20,2% 51 18,5% 58 14,4% 253 17,7%
51-60 47 17,5% 77 15,9% 49 17,8% 84 20,8% 257 17,9%
Age
60 + 53 19,7% 100 20,7% 74 26,8% 141 35,0% 368 25,7%
Finished bachelor, master or higher degree
114 42,3% 97 20,1% 23 8,3% 9 2,2% 243 16,9%
Finished college 9 3,4% 21 4,3% 5 1,8% 3 0,7% 38 2,7%
Finished secondary school
127 47,2% 248 51,1% 149 54,0% 162 40,0% 686 47,8%
Highest level of education achieved
Finished elementary and lower
19 7,1% 118 24,4% 99 35,9% 229 57,0% 465 32,6%
Bulgarian 264 98,1% 443 91,5% 226 81,9% 269 66,7% 1202 83,9%
Turkish - - 21 4,3% 24 8,7% 101 25,1% 146 10,2%
Roma 2 0,7% 17 3,5% 21 7,6% 22 5,5% 62 4,3% Ethnicity
Other 3 1,1% 3 0,6% 5 1,8% 11 2,5% 22 1,5%
No income 21 7,8% 49 10,1% 27 9,8% 38 9,4% 135 9,4%
Less than 250 BGN 24 8,9% 92 19,0% 81 29,3% 157 39,0% 354 24,7%
251-500 BGN 66 24,5% 122 25,2% 78 28,3% 104 25,8% 370 25,8%
501-750 BGN 23 8,6% 43 8,9% 20 7,2% 10 2,5% 96 6,7%
751-1000 BGN 33 12,3% 14 2,9% 3 1,1% 2 0,5% 52 3,6%
More than 1000 BGN
18 6,7% 6 1,2% 2 0,7% 3 0,7% 29 2,0%
Don't know 2 0,7% 14 2,9% 12 4,3% 9 2,2% 37 2,6%
Personal monthly income
NA 82 30,5% 144 29,8% 53 19,2% 80 19,9% 359 25,1%
South-West 269 100,0% 42 8,7% 31 11,2% 40 9,9% 382 26,7%
South Central - - 121 25,0% 65 23,6% 82 20,3% 268 18,7%
South East - - 88 18,2% 63 22,8% 64 15,9% 215 15,0%
North East - - 85 17,6% 24 8,7% 56 13,9% 165 11,5%
North Central - - 82 16,9% 40 14,5% 96 23,8% 218 15,2%
Region
North West - - 66 13,6% 53 19,2% 65 16,1% 184 12,8%
Total 269 100,0% 484 100,0% 276 100,0% 403 100,0% 1432 100,0%
8
Having in mind the peculiarities of the socio-demographic structure of the Bulgarian population and respectively, of the surveyed sample, the following characteristics should be taken into consideration:
The women slightly outnumber the men (52%:48%). 72% of the country’s population lives in the urban area: one-fifth in the capital city and
another 34% in the regional centers. The most densely populated NUTS is the Southwest (includes the capital), where a little
over a quarter of the country’s population resides. The regions with the least population density are the Northeast and the Northwest, which according to the NSI data are also the regions with the least developed economy and the highest unemployment rates.
26% of the population are people over 60, mostly residing in the small towns and villages. The young age groups are predominant in the capital and the large cities, while the middle-aged – in the regional centers.
The biggest part of the population (48%) has secondary education; every third citizen has only basic. The lower level of education is the most widespread among the elder people living in the villages and especially the ethnic minorities; 95% of the Roma have basic or lower education. People with higher education form about one-fifth of the country’s population.
The main ethnic group is the Bulgarian (84%). The Turks are 10% and the Roma around 4%. Both minority groups and the Roma in particular have lower educational, social and economic status.
9
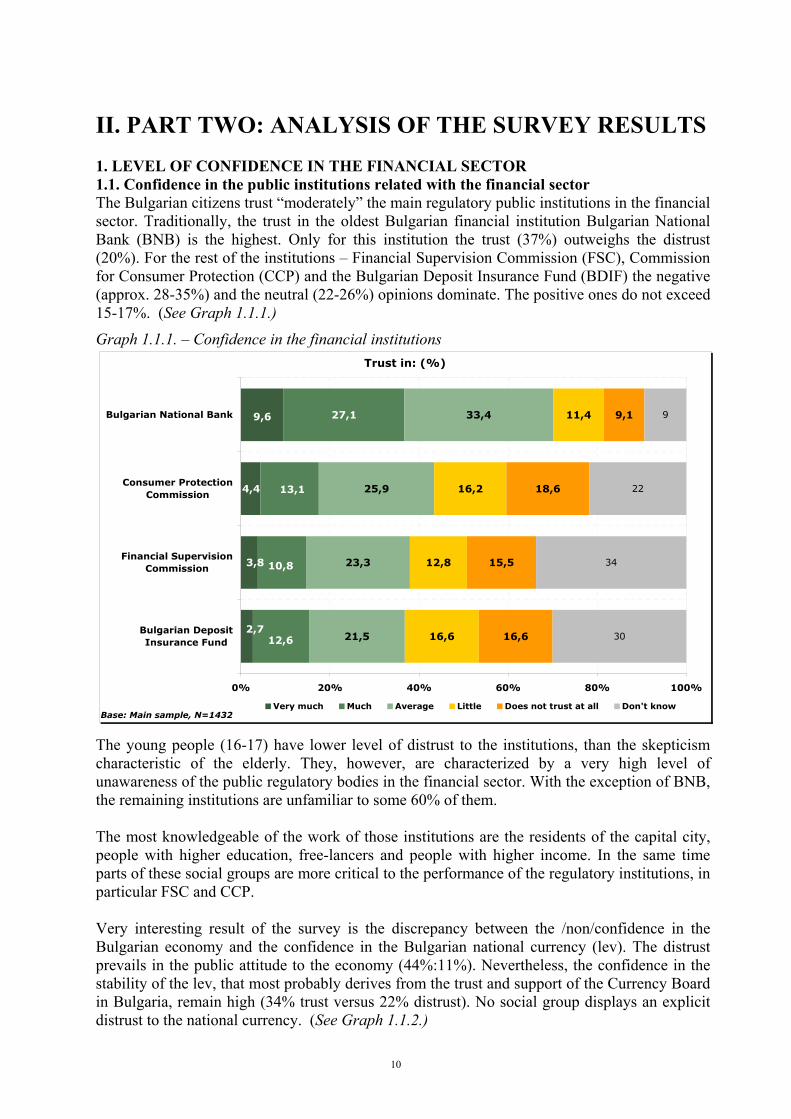
II. PART TWO: ANALYSIS OF THE SURVEY RESULTS 1. LEVEL OF CONFIDENCE IN THE FINANCIAL SECTOR 1.1. Confidence in the public institutions related with the financial sector The Bulgarian citizens trust “moderately” the main regulatory public institutions in the financial sector. Traditionally, the trust in the oldest Bulgarian financial institution Bulgarian National Bank (BNB) is the highest. Only for this institution the trust (37%) outweighs the distrust (20%). For the rest of the institutions – Financial Supervision Commission (FSC), Commission for Consumer Protection (CCP) and the Bulgarian Deposit Insurance Fund (BDIF) the negative (approx. 28-35%) and the neutral (22-26%) opinions dominate. The positive ones do not exceed 15-17%. (See Graph 1.1.1.) Graph 1.1.1. – Confidence in the financial institutions
Trust in: (%)
27,1
21,5
23,3
25,9
33,4
16,6
12,8
16,2
11,4
16,6
15,5
18,6
9,1
30
34
22
9
2,7
3,8
4,4
9,6
12,6
10,8
13,1
0% 20% 40% 60% 80% 100%
Bulgarian DepositInsurance Fund
Financial SupervisionCommission
Consumer ProtectionCommission
Bulgarian National Bank
Base: Main sample, N=1432Very much Much Average Little Does not trust at all Don't know
The young people (16-17) have lower level of distrust to the institutions, than the skepticism characteristic of the elderly. They, however, are characterized by a very high level of unawareness of the public regulatory bodies in the financial sector. With the exception of BNB, the remaining institutions are unfamiliar to some 60% of them. The most knowledgeable of the work of those institutions are the residents of the capital city, people with higher education, free-lancers and people with higher income. In the same time parts of these social groups are more critical to the performance of the regulatory institutions, in particular FSC and CCP. Very interesting result of the survey is the discrepancy between the /non/confidence in the Bulgarian economy and the confidence in the Bulgarian national currency (lev). The distrust prevails in the public attitude to the economy (44%:11%). Nevertheless, the confidence in the stability of the lev, that most probably derives from the trust and support of the Currency Board in Bulgaria, remain high (34% trust versus 22% distrust). No social group displays an explicit distrust to the national currency. (See Graph 1.1.2.)
10
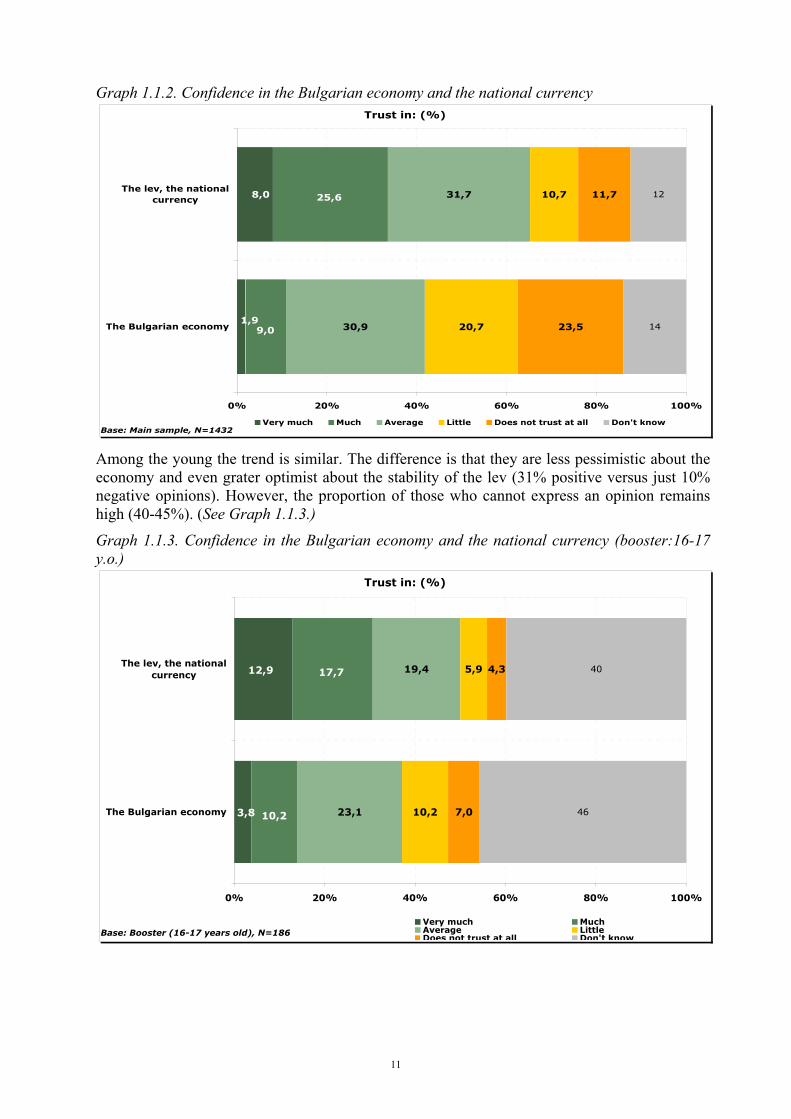
Graph 1.1.2. Confidence in the Bulgarian economy and the national currency Trust in: (%)
30,9
31,7
20,7
10,7
23,5
11,7
14
12
1,9
8,0
9,0
25,6
0% 20% 40% 60% 80% 100%
The Bulgarian economy
The lev, the nationalcurrency
Base: Main sample, N=1432Very much Much Average Little Does not trust at all Don't know
Among the young the trend is similar. The difference is that they are less pessimistic about the economy and even grater optimist about the stability of the lev (31% positive versus just 10% negative opinions). However, the proportion of those who cannot express an opinion remains high (40-45%). (See Graph 1.1.3.)
Graph 1.1.3. Confidence in the Bulgarian economy and the national currency (booster:16-17 y.o.)
Trust in: (%)
23,1
19,4
10,2
5,9
7,0
4,3
46
40
3,8
12,9
10,2
17,7
0% 20% 40% 60% 80% 100%
The Bulgarian economy
The lev, the nationalcurrency
Base: Booster (16-17 years old), N=186Very much MuchAverage LittleDoes not trust at all Don't know
11
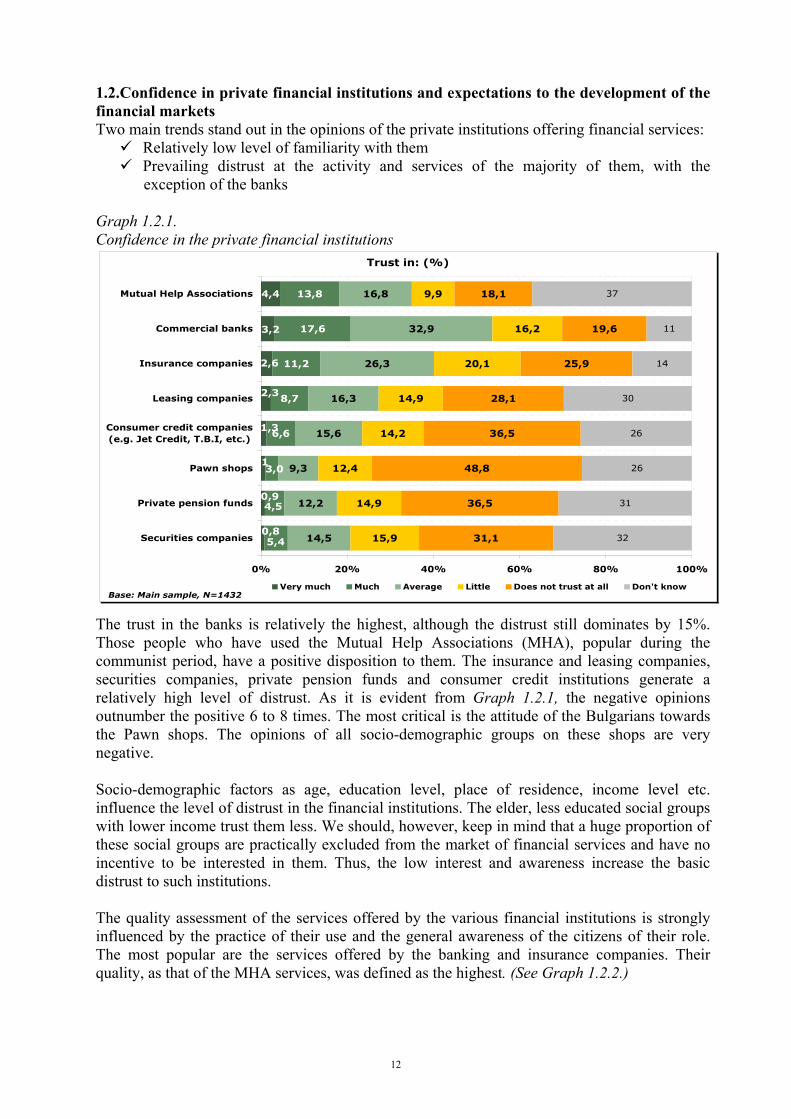
1.2.Confidence in private financial institutions and expectations to the development of the financial markets Two main trends stand out in the opinions of the private institutions offering financial services:
Relatively low level of familiarity with them Prevailing distrust at the activity and services of the majority of them, with the
exception of the banks Graph 1.2.1. Confidence in the private financial institutions
Trust in: (%)
4,4
6,6
8,7
11,2
17,6
13,8
14,5
12,2
9,3
15,6
16,3
26,3
32,9
16,8
15,9
14,9
12,4
14,2
14,9
20,1
16,2
9,9
31,1
36,5
48,8
36,5
28,1
25,9
19,6
18,1
32
31
26
26
30
14
11
37
3,2
2,6
0,8
0,9
1
1,3
2,3
5,4
4,5
3,0
0% 20% 40% 60% 80% 100%
Securities companies
Private pension funds
Pawn shops
Consumer credit companies(e.g. Jet Credit, T.B.I, etc.)
Leasing companies
Insurance companies
Commercial banks
Mutual Help Associations
Base: Main sample, N=1432Very much Much Average Little Does not trust at all Don't know
The trust in the banks is relatively the highest, although the distrust still dominates by 15%. Those people who have used the Mutual Help Associations (MHA), popular during the communist period, have a positive disposition to them. The insurance and leasing companies, securities companies, private pension funds and consumer credit institutions generate a relatively high level of distrust. As it is evident from Graph 1.2.1, the negative opinions outnumber the positive 6 to 8 times. The most critical is the attitude of the Bulgarians towards the Pawn shops. The opinions of all socio-demographic groups on these shops are very negative. Socio-demographic factors as age, education level, place of residence, income level etc. influence the level of distrust in the financial institutions. The elder, less educated social groups with lower income trust them less. We should, however, keep in mind that a huge proportion of these social groups are practically excluded from the market of financial services and have no incentive to be interested in them. Thus, the low interest and awareness increase the basic distrust to such institutions. The quality assessment of the services offered by the various financial institutions is strongly influenced by the practice of their use and the general awareness of the citizens of their role. The most popular are the services offered by the banking and insurance companies. Their quality, as that of the MHA services, was defined as the highest. (See Graph 1.2.2.)
12
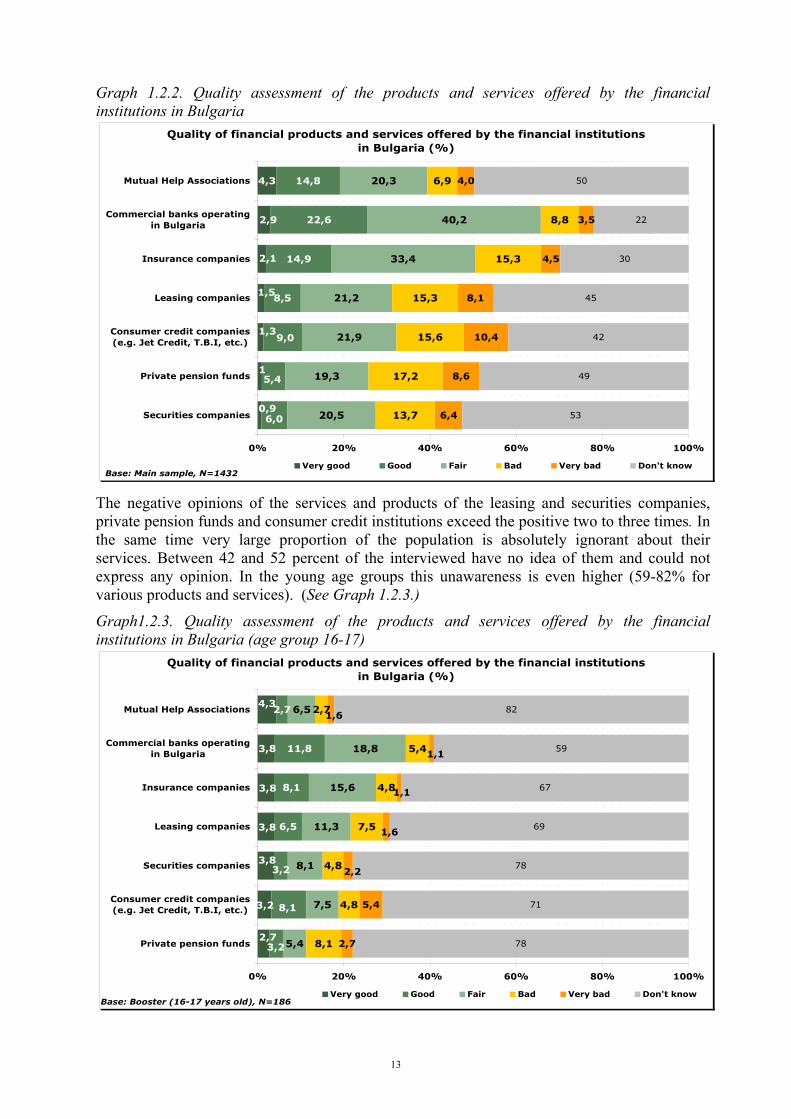
Graph 1.2.2. Quality assessment of the products and services offered by the financial institutions in Bulgaria
Quality of financial products and services offered by the financial institutions in Bulgaria (%)
4,3
8,5
14,9
22,6
14,8
20,5
19,3
21,9
21,2
33,4
40,2
20,3
13,7
17,2
15,6
15,3
15,3
6,9
6,4
8,6
10,4
8,1
4,5
3,5
4,0
53
49
42
45
30
22
50
2,9
0,9
1
1,3
1,5
2,1
6,0
5,4
9,0
8,8
0% 20% 40% 60% 80% 100%
Securities companies
Private pension funds
Consumer credit companies(e.g. Jet Credit, T.B.I, etc.)
Leasing companies
Insurance companies
Commercial banks operatingin Bulgaria
Mutual Help Associations
Base: Main sample, N=1432Very good Good Fair Bad Very bad Don't know
The negative opinions of the services and products of the leasing and securities companies, private pension funds and consumer credit institutions exceed the positive two to three times. In the same time very large proportion of the population is absolutely ignorant about their services. Between 42 and 52 percent of the interviewed have no idea of them and could not express any opinion. In the young age groups this unawareness is even higher (59-82% for various products and services). (See Graph 1.2.3.)
Graph1.2.3. Quality assessment of the products and services offered by the financial institutions in Bulgaria (age group 16-17)
Quality of financial products and services offered by the financial institutions in Bulgaria (%)
6,5
8,1
11,8
2,7
5,4
7,5
8,1
11,3
15,6
18,8
6,5
8,1
4,8
4,8
7,5
4,8
2,7
2,7
5,4
78
71
78
69
67
59
824,3
3,8
2,7
3,2
3,8
3,8
3,8
3,2
8,1
3,2
5,4
2,2
1,6
1,1
1,1
1,6
0% 20% 40% 60% 80% 100%
Private pension funds
Consumer credit companies(e.g. Jet Credit, T.B.I, etc.)
Securities companies
Leasing companies
Insurance companies
Commercial banks operatingin Bulgaria
Mutual Help Associations
Base: Booster (16-17 years old), N=186Very good Good Fair Bad Very bad Don't know
13

In spite of the critical turn in the people’s opinions of the economic situation, the expectations for their personal economic situation and the stability of the financial markets in general are positive. (See Graph 1.2.4.) Graph 1.2.4. – Expectations for the personal life – comparison between main sample and booster
How do you think your life is going to be over the next 12 months? (%)
2,6
27,5
37,6
22,7
5,6 4,09,1
46,2
28,5
8,1
1,1
7,0
0
20
40
60
80
100
Much better Better The same Worse Much worse Don't know
Base: Main sample (N=1432), Booster (N=186)
Main sample Booster
The majority of the interviewed expect their present situation either to remain the same (38%), or to improve (30%). Among the youngest the expectations are even much more positive – 55% expect an improvement versus only 9% - deterioration. Analogous, although to a lesser extent, are the expectations in the group of 18-30 year’ old, in Sofia, among the people with higher education and personal income exceeding 700 lv. In the group of economically active population the most anxious are the company owners for whom the economic recovery has not started yet. The expectations as regards the financial and banking sector are similarly – preservation of the current level and further development. (See Graph 1.2.5). Graph 1.2.5. – Expectations as regards the development of the financial markets
Expectations to the development of: (%)
13,9
16,6
17,3
18,6
28,8
54,1
50,6
52,9
58,9
54,9
21,3
20,4
19,8
13,7
10,7
11
12
10
9
6
0% 20% 40% 60% 80% 100%
Private Pension Funds
The capital market
Consumer credit companies(e.g. Jet Credit, T.B.I, etc.)
Insurance companies
Banking sector in Bulgaria
Base: Main sample, N=1432It will remain stable and develop in a positive direction No change
Destabilization and negative development Don't know
14
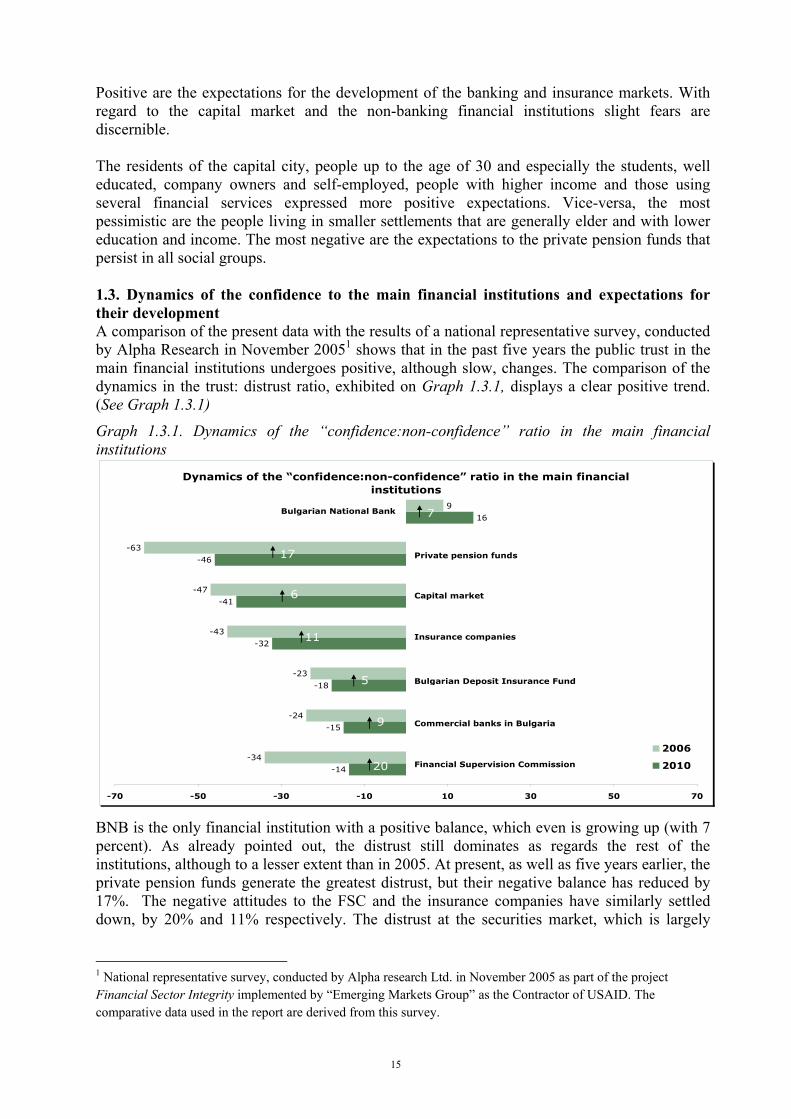
Positive are the expectations for the development of the banking and insurance markets. With regard to the capital market and the non-banking financial institutions slight fears are discernible. The residents of the capital city, people up to the age of 30 and especially the students, well educated, company owners and self-employed, people with higher income and those using several financial services expressed more positive expectations. Vice-versa, the most pessimistic are the people living in smaller settlements that are generally elder and with lower education and income. The most negative are the expectations to the private pension funds that persist in all social groups. 1.3. Dynamics of the confidence to the main financial institutions and expectations for their development A comparison of the present data with the results of a national representative survey, conducted by Alpha Research in November 20051 shows that in the past five years the public trust in the main financial institutions undergoes positive, although slow, changes. The comparison of the dynamics in the trust: distrust ratio, exhibited on Graph 1.3.1, displays a clear positive trend. (See Graph 1.3.1) Graph 1.3.1. Dynamics of the “confidence:non-confidence” ratio in the main financial institutions
Dynamics of the �“confidence:non-confidence�” ratio in the main financial institutions
-14
-15
-18
-32
-41
-46
16
-34
-24
-23
-43
-47
-63
9
-70 -50 -30 -10 10 30 50 70
2006
2010
Private pension funds
Capital market
Insurance companies
Bulgarian Deposit Insurance Fund
Bulgarian National Bank
Commercial banks in Bulgaria
Financial Supervision Commission
17
6
11
5
9
20
7
BNB is the only financial institution with a positive balance, which even is growing up (with 7 percent). As already pointed out, the distrust still dominates as regards the rest of the institutions, although to a lesser extent than in 2005. At present, as well as five years earlier, the private pension funds generate the greatest distrust, but their negative balance has reduced by 17%. The negative attitudes to the FSC and the insurance companies have similarly settled down, by 20% and 11% respectively. The distrust at the securities market, which is largely
1 National representative survey, conducted by Alpha research Ltd. in November 2005 as part of the project Financial Sector Integrity implemented by “Emerging Markets Group” as the Contractor of USAID. The comparative data used in the report are derived from this survey.
15
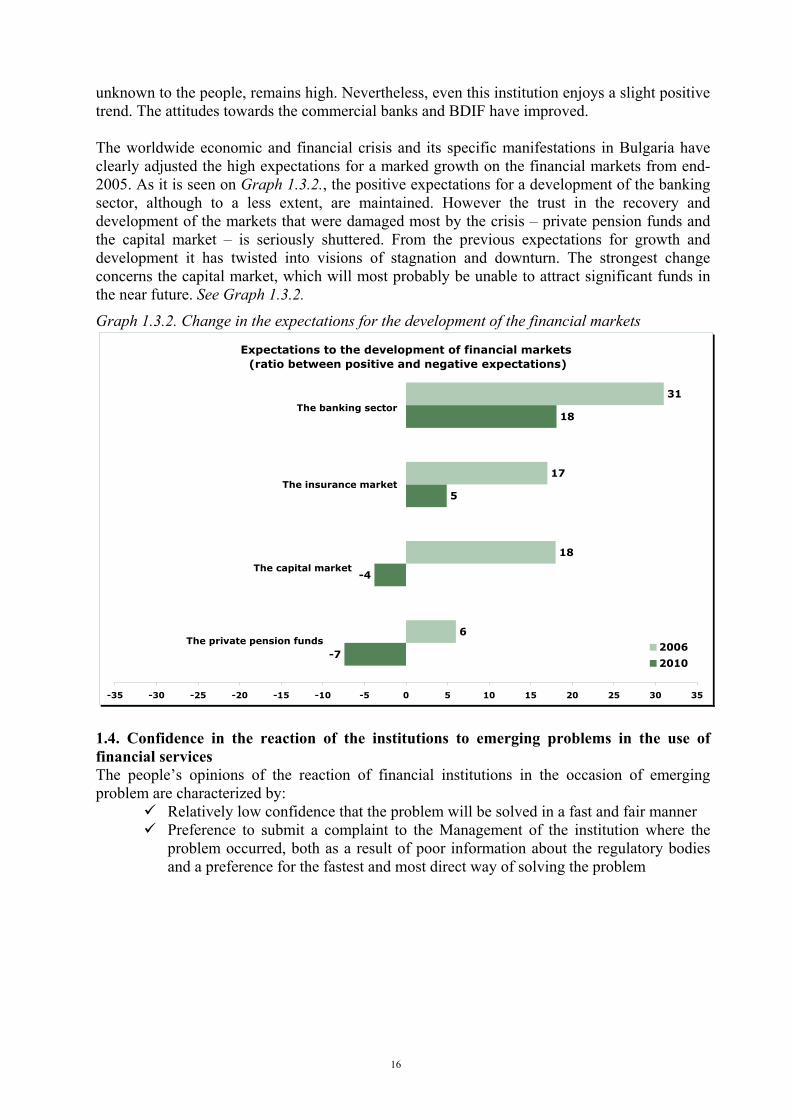
unknown to the people, remains high. Nevertheless, even this institution enjoys a slight positive trend. The attitudes towards the commercial banks and BDIF have improved. The worldwide economic and financial crisis and its specific manifestations in Bulgaria have clearly adjusted the high expectations for a marked growth on the financial markets from end-2005. As it is seen on Graph 1.3.2., the positive expectations for a development of the banking sector, although to a less extent, are maintained. However the trust in the recovery and development of the markets that were damaged most by the crisis – private pension funds and the capital market – is seriously shuttered. From the previous expectations for growth and development it has twisted into visions of stagnation and downturn. The strongest change concerns the capital market, which will most probably be unable to attract significant funds in the near future. See Graph 1.3.2. Graph 1.3.2. Change in the expectations for the development of the financial markets
Expectations to the development of financial markets (ratio between positive and negative expectations)
-7
-4
5
18
6
18
17
31
-35 -30 -25 -20 -15 -10 -5 0 5 10 15 20 25 30 35
2006
2010
The private pension funds
The capital market
The insurance market
The banking sector
17
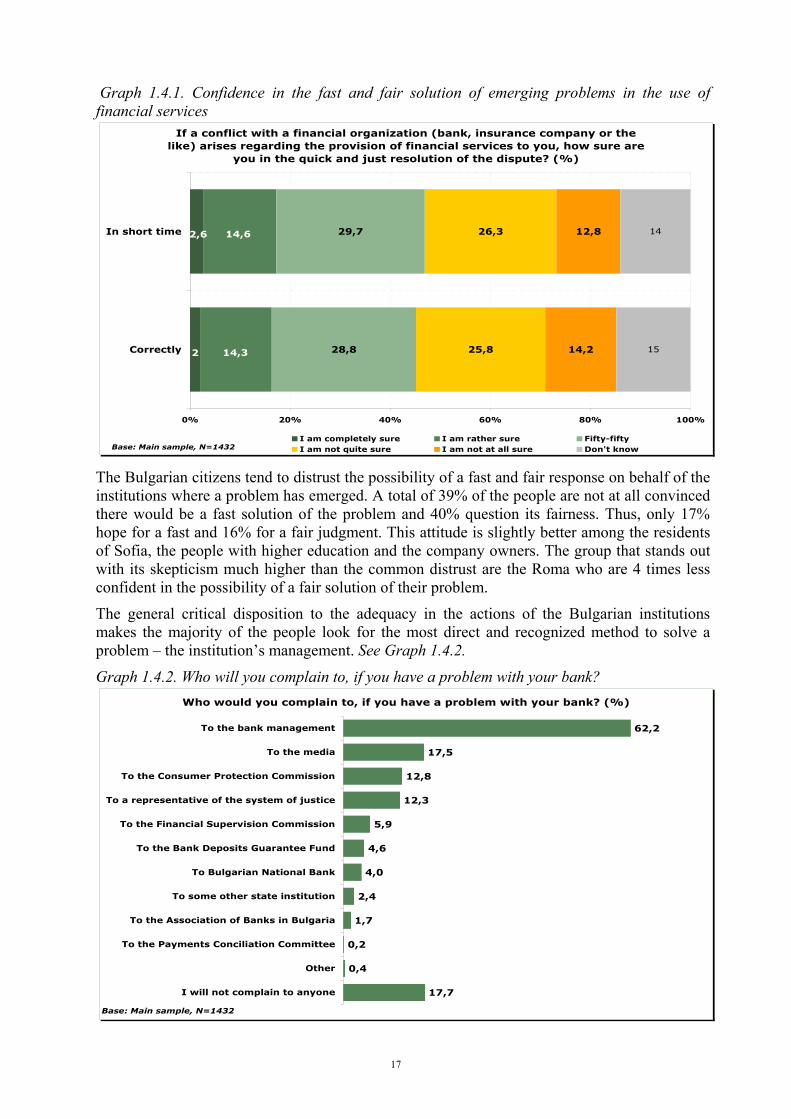
1.4. Confidence in the reaction of the institutions to emerging problems in the use of financial services The people’s opinions of the reaction of financial institutions in the occasion of emerging problem are characterized by:
Relatively low confidence that the problem will be solved in a fast and fair manner Preference to submit a complaint to the Management of the institution where the
problem occurred, both as a result of poor information about the regulatory bodies and a preference for the fastest and most direct way of solving the problem
16
Graph 1.4.1. Confidence in the fast and fair solution of emerging problems in the use of financial services
If a conflict with a financial organization (bank, insurance company or the like) arises regarding the provision of financial services to you, how sure are
you in the quick and just resolution of the dispute? (%)
28,8
29,7
25,8
26,3
14,2
12,8
15
14
2
2,6
14,3
14,6
0% 20% 40% 60% 80% 100%
Correctly
In short time
Base: Main sample, N=1432I am completely sure I am rather sure Fifty-fiftyI am not quite sure I am not at all sure Don't know
The Bulgarian citizens tend to distrust the possibility of a fast and fair response on behalf of the institutions where a problem has emerged. A total of 39% of the people are not at all convinced there would be a fast solution of the problem and 40% question its fairness. Thus, only 17% hope for a fast and 16% for a fair judgment. This attitude is slightly better among the residents of Sofia, the people with higher education and the company owners. The group that stands out with its skepticism much higher than the common distrust are the Roma who are 4 times less confident in the possibility of a fair solution of their problem.
The general critical disposition to the adequacy in the actions of the Bulgarian institutions makes the majority of the people look for the most direct and recognized method to solve a problem – the institution’s management. See Graph 1.4.2. Graph 1.4.2. Who will you complain to, if you have a problem with your bank?
Who would you complain to, if you have a problem with your bank? (%)
17,7
0,4
0,2
1,7
2,4
4,0
4,6
5,9
12,3
12,8
17,5
62,2
I will not complain to anyone
Other
To the Payments Conciliation Committee
To the Association of Banks in Bulgaria
To some other state institution
To Bulgarian National Bank
To the Bank Deposits Guarantee Fund
To the Financial Supervision Commission
To a representative of the system of justice
To the Consumer Protection Commission
To the media
To the bank management
Base: Main sample, N=1432
17
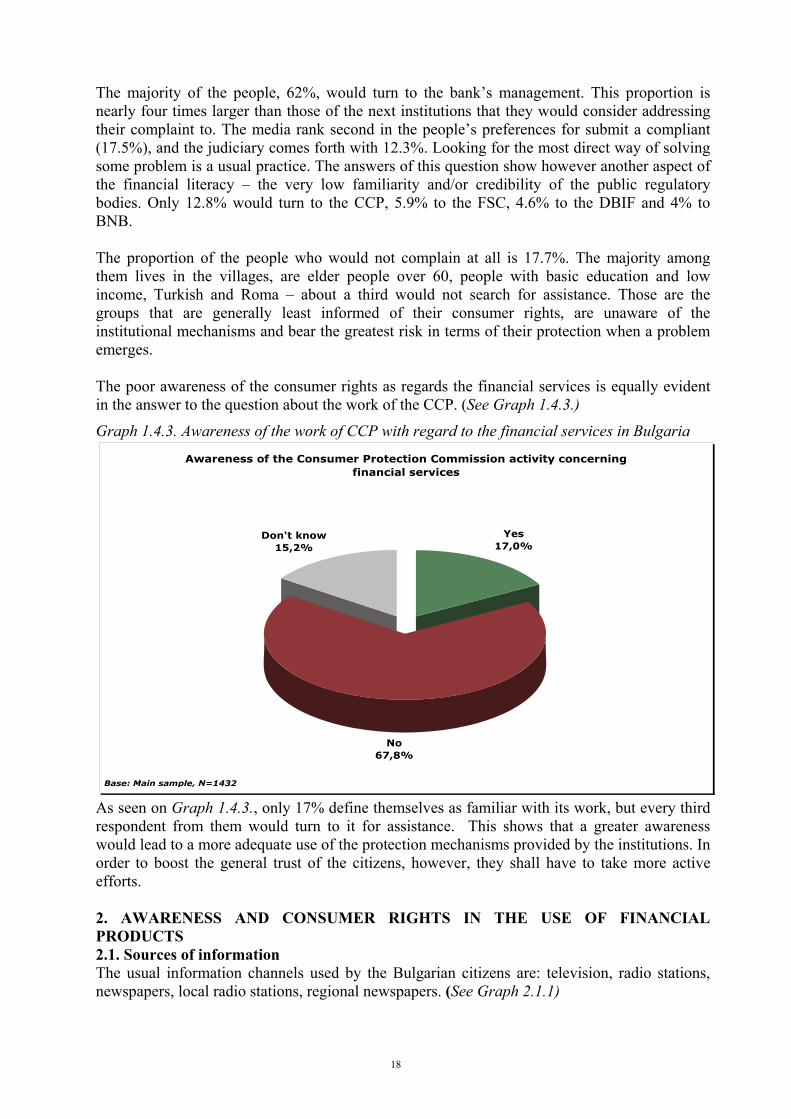
The majority of the people, 62%, would turn to the bank’s management. This proportion is nearly four times larger than those of the next institutions that they would consider addressing their complaint to. The media rank second in the people’s preferences for submit a compliant (17.5%), and the judiciary comes forth with 12.3%. Looking for the most direct way of solving some problem is a usual practice. The answers of this question show however another aspect of the financial literacy – the very low familiarity and/or credibility of the public regulatory bodies. Only 12.8% would turn to the CCP, 5.9% to the FSC, 4.6% to the DBIF and 4% to BNB. The proportion of the people who would not complain at all is 17.7%. The majority among them lives in the villages, are elder people over 60, people with basic education and low income, Turkish and Roma – about a third would not search for assistance. Those are the groups that are generally least informed of their consumer rights, are unaware of the institutional mechanisms and bear the greatest risk in terms of their protection when a problem emerges. The poor awareness of the consumer rights as regards the financial services is equally evident in the answer to the question about the work of the CCP. (See Graph 1.4.3.) Graph 1.4.3. Awareness of the work of CCP with regard to the financial services in Bulgaria
Awareness of the Consumer Protection Commission activity concerning financial services
No67,8%
Don't know15,2%
Yes17,0%
Base: Main sample, N=1432
As seen on Graph 1.4.3., only 17% define themselves as familiar with its work, but every third respondent from them would turn to it for assistance. This shows that a greater awareness would lead to a more adequate use of the protection mechanisms provided by the institutions. In order to boost the general trust of the citizens, however, they shall have to take more active efforts.
2. AWARENESS AND CONSUMER RIGHTS IN THE USE OF FINANCIAL PRODUCTS 2.1. Sources of information The usual information channels used by the Bulgarian citizens are: television, radio stations, newspapers, local radio stations, regional newspapers. (See Graph 2.1.1)
18
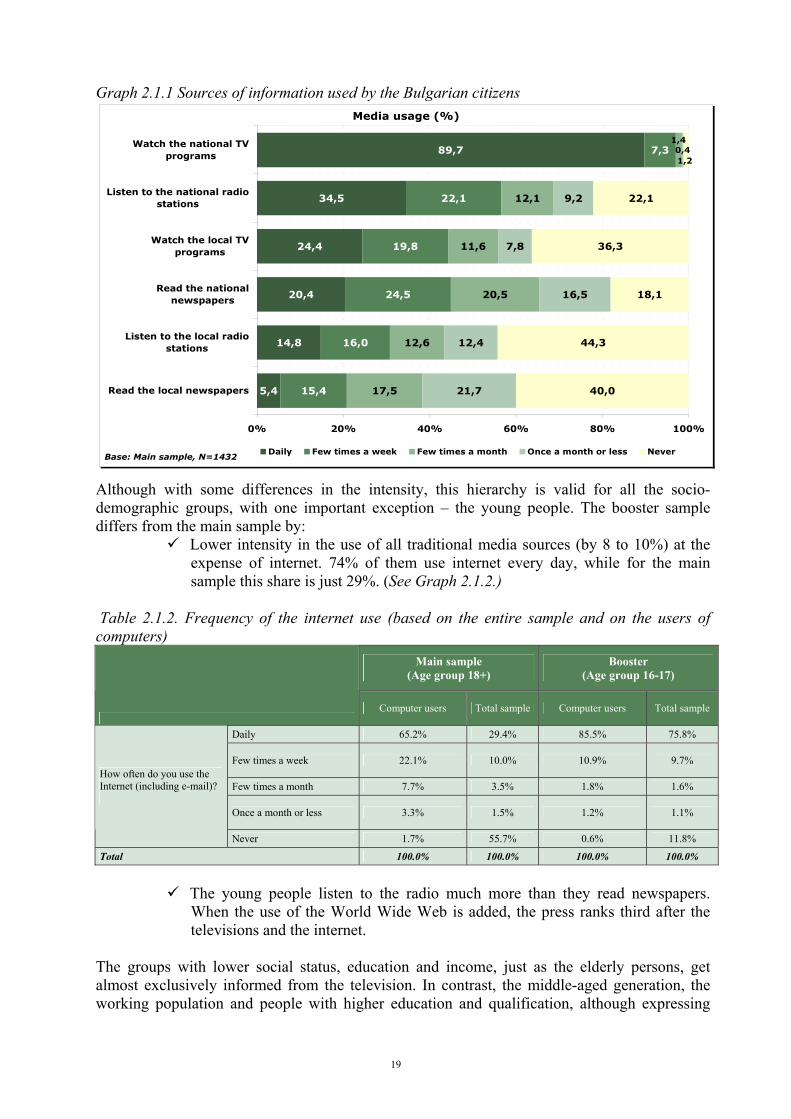
Graph 2.1.1 Sources of information used by the Bulgarian citizens Media usage (%)
5,4
14,8
20,4
24,4
34,5
89,7
15,4
16,0
24,5
19,8
22,1
7,3
17,5
12,6
20,5
11,6
12,1
21,7
12,4
16,5
7,8
9,2
40,0
44,3
18,1
36,3
22,1
1,40,41,2
0% 20% 40% 60% 80% 100%
Read the local newspapers
Listen to the local radiostations
Read the nationalnewspapers
Watch the local TVprograms
Listen to the national radiostations
Watch the national TVprograms
Base: Main sample, N=1432 Daily Few times a week Few times a month Once a month or less Never
Although with some differences in the intensity, this hierarchy is valid for all the socio-demographic groups, with one important exception – the young people. The booster sample differs from the main sample by:
Lower intensity in the use of all traditional media sources (by 8 to 10%) at the expense of internet. 74% of them use internet every day, while for the main sample this share is just 29%. (See Graph 2.1.2.)
Table 2.1.2. Frequency of the internet use (based on the entire sample and on the users of computers)
Main sample (Age group 18+)
Booster (Age group 16-17)
Computer users Total sample Computer users Total sample
Daily 65.2% 29.4% 85.5% 75.8%
Few times a week 22.1% 10.0% 10.9% 9.7%
Few times a month 7.7% 3.5% 1.8% 1.6%
Once a month or less 3.3% 1.5% 1.2% 1.1%
How often do you use the Internet (including e-mail)?
Never 1.7% 55.7% 0.6% 11.8%
Total 100.0% 100.0% 100.0% 100.0%
The young people listen to the radio much more than they read newspapers.
When the use of the World Wide Web is added, the press ranks third after the televisions and the internet.
The groups with lower social status, education and income, just as the elderly persons, get almost exclusively informed from the television. In contrast, the middle-aged generation, the working population and people with higher education and qualification, although expressing
19
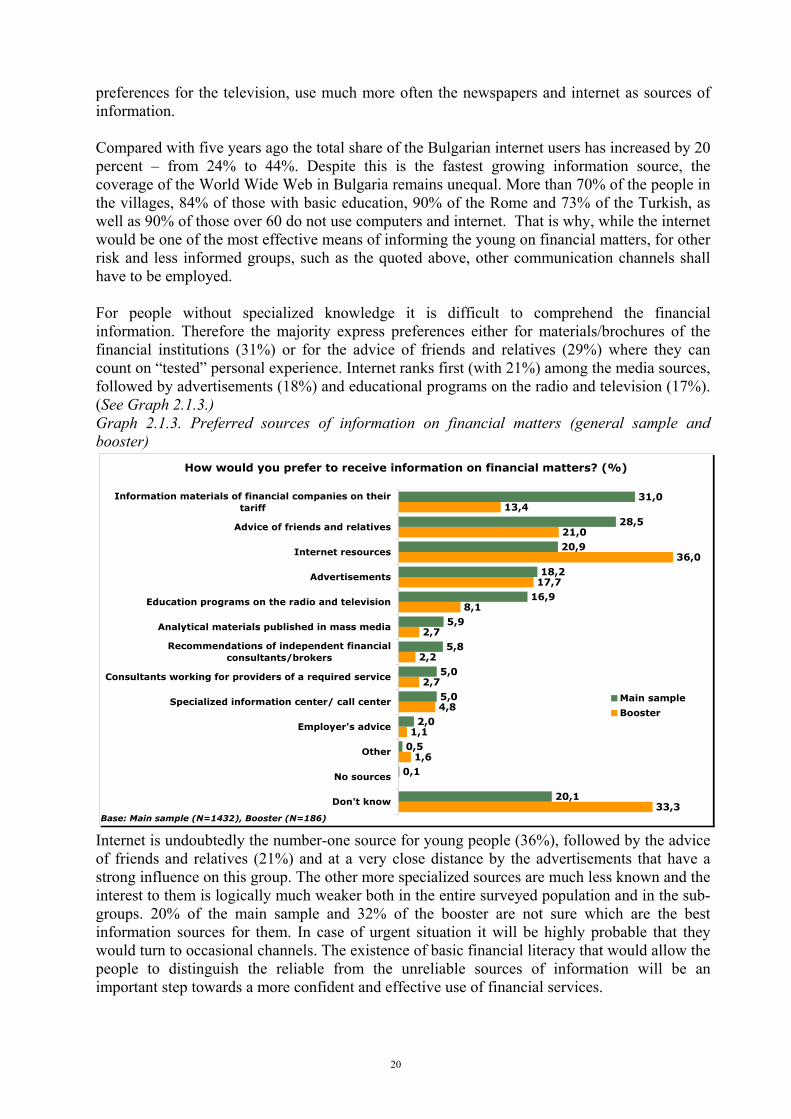
preferences for the television, use much more often the newspapers and internet as sources of information. Compared with five years ago the total share of the Bulgarian internet users has increased by 20 percent – from 24% to 44%. Despite this is the fastest growing information source, the coverage of the World Wide Web in Bulgaria remains unequal. More than 70% of the people in the villages, 84% of those with basic education, 90% of the Rome and 73% of the Turkish, as well as 90% of those over 60 do not use computers and internet. That is why, while the internet would be one of the most effective means of informing the young on financial matters, for other risk and less informed groups, such as the quoted above, other communication channels shall have to be employed. For people without specialized knowledge it is difficult to comprehend the financial information. Therefore the majority express preferences either for materials/brochures of the financial institutions (31%) or for the advice of friends and relatives (29%) where they can count on “tested” personal experience. Internet ranks first (with 21%) among the media sources, followed by advertisements (18%) and educational programs on the radio and television (17%). (See Graph 2.1.3.) Graph 2.1.3. Preferred sources of information on financial matters (general sample and booster)
How would you prefer to receive information on financial matters? (%)
33,3
1,6
1,1
4,8
2,7
2,2
2,7
8,1
17,7
36,0
21,0
13,4
20,1
0,1
0,5
2,0
5,0
5,0
5,8
5,9
16,9
18,2
20,9
28,5
31,0
Don't know
No sources
Other
Employer's advice
Specialized information center/ call center
Consultants working for providers of a required service
Recommendations of independent financialconsultants/brokers
Analytical materials published in mass media
Education programs on the radio and television
Advertisements
Internet resources
Advice of friends and relatives
Information materials of financial companies on theirtariff
Base: Main sample (N=1432), Booster (N=186)
Main sample
Booster
Internet is undoubtedly the number-one source for young people (36%), followed by the advice of friends and relatives (21%) and at a very close distance by the advertisements that have a strong influence on this group. The other more specialized sources are much less known and the interest to them is logically much weaker both in the entire surveyed population and in the sub-groups. 20% of the main sample and 32% of the booster are not sure which are the best information sources for them. In case of urgent situation it will be highly probable that they would turn to occasional channels. The existence of basic financial literacy that would allow the people to distinguish the reliable from the unreliable sources of information will be an important step towards a more confident and effective use of financial services.
20
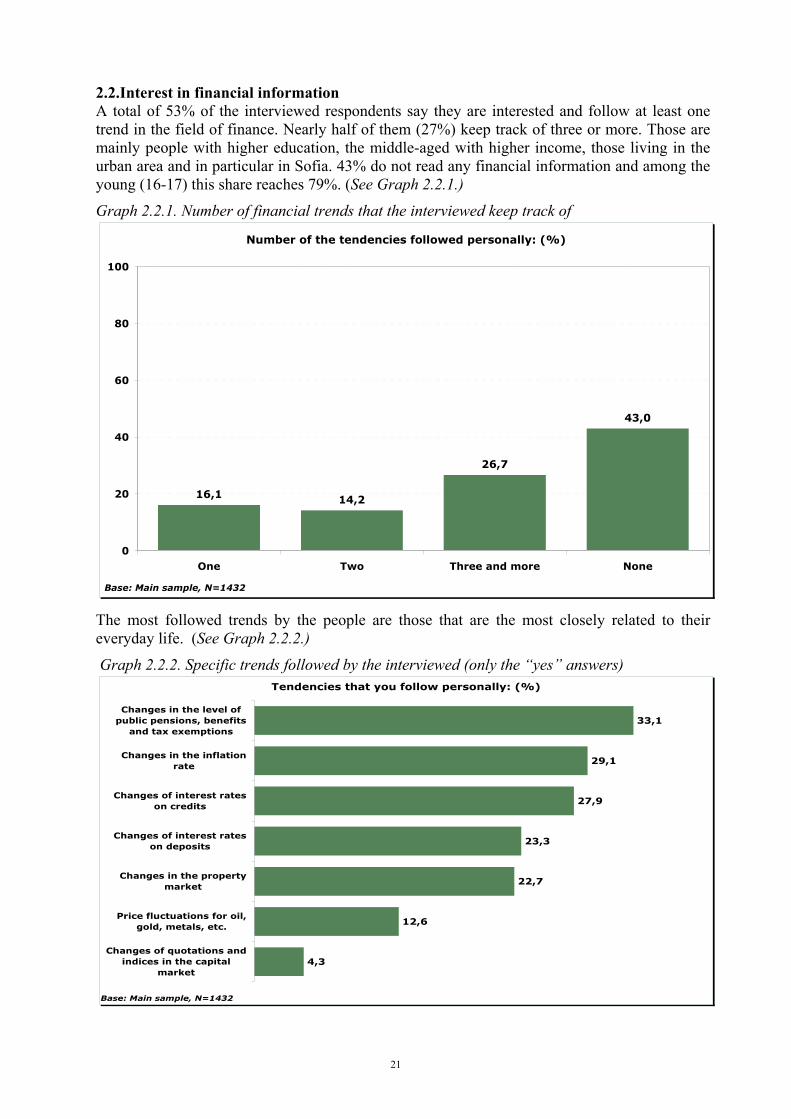
2.2.Interest in financial information A total of 53% of the interviewed respondents say they are interested and follow at least one trend in the field of finance. Nearly half of them (27%) keep track of three or more. Those are mainly people with higher education, the middle-aged with higher income, those living in the urban area and in particular in Sofia. 43% do not read any financial information and among the young (16-17) this share reaches 79%. (See Graph 2.2.1.)
Graph 2.2.1. Number of financial trends that the interviewed keep track of
Number of the tendencies followed personally: (%)
16,1 14,2
26,7
43,0
0
20
40
60
80
100
One Two Three and more None
Base: Main sample, N=1432
The most followed trends by the people are those that are the most closely related to their everyday life. (See Graph 2.2.2.) Graph 2.2.2. Specific trends followed by the interviewed (only the “yes” answers)
Tendencies that you follow personally: (%)
4,3
12,6
22,7
23,3
27,9
29,1
33,1
Changes of quotations andindices in the capital
market
Price fluctuations for oil,gold, metals, etc.
Changes in the propertymarket
Changes of interest rateson deposits
Changes of interest rateson credits
Changes in the inflationrate
Changes in the level ofpublic pensions, benefits
and tax exemptions
Base: Main sample, N=1432
21
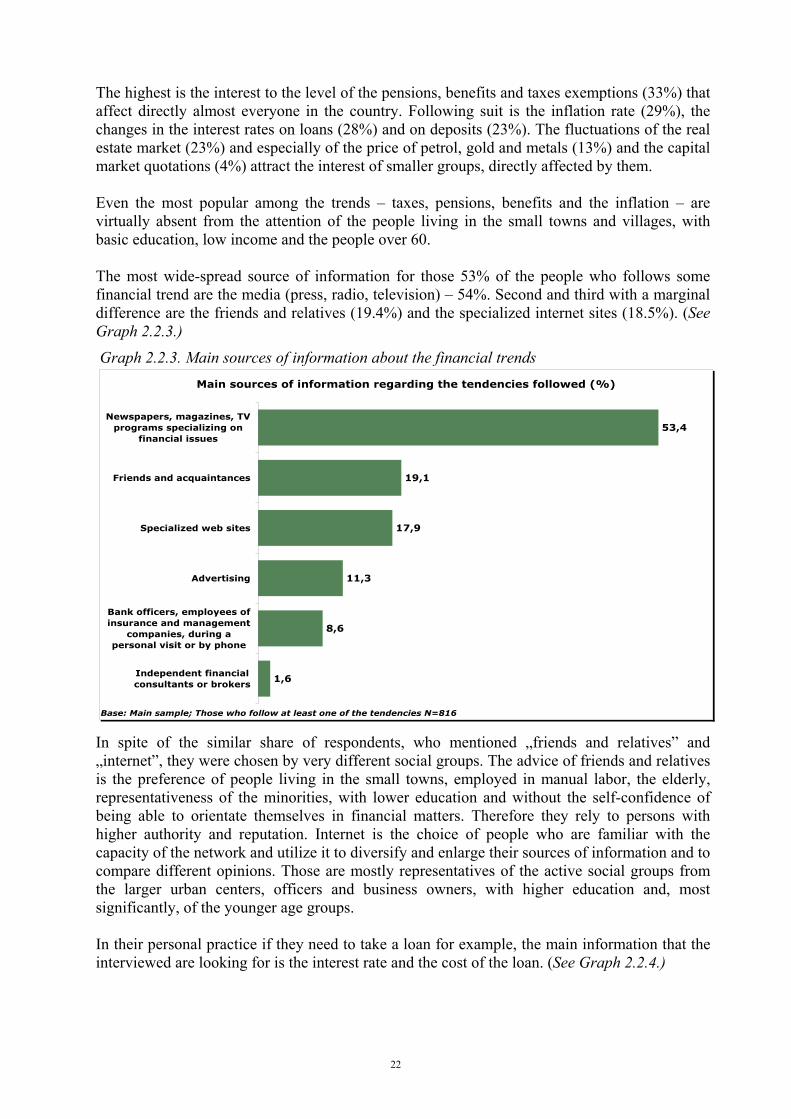
The highest is the interest to the level of the pensions, benefits and taxes exemptions (33%) that affect directly almost everyone in the country. Following suit is the inflation rate (29%), the changes in the interest rates on loans (28%) and on deposits (23%). The fluctuations of the real estate market (23%) and especially of the price of petrol, gold and metals (13%) and the capital market quotations (4%) attract the interest of smaller groups, directly affected by them. Even the most popular among the trends – taxes, pensions, benefits and the inflation – are virtually absent from the attention of the people living in the small towns and villages, with basic education, low income and the people over 60. The most wide-spread source of information for those 53% of the people who follows some financial trend are the media (press, radio, television) – 54%. Second and third with a marginal difference are the friends and relatives (19.4%) and the specialized internet sites (18.5%). (See Graph 2.2.3.) Graph 2.2.3. Main sources of information about the financial trends
Main sources of information regarding the tendencies followed (%)
1,6
8,6
11,3
17,9
19,1
53,4
Independent financialconsultants or brokers
Bank officers, employees ofinsurance and management
companies, during apersonal visit or by phone
Advertising
Specialized web sites
Friends and acquaintances
Newspapers, magazines, TVprograms specializing on
financial issues
Base: Main sample; Those who follow at least one of the tendencies N=816 In spite of the similar share of respondents, who mentioned „friends and relatives” and „internet”, they were chosen by very different social groups. The advice of friends and relatives is the preference of people living in the small towns, employed in manual labor, the elderly, representativeness of the minorities, with lower education and without the self-confidence of being able to orientate themselves in financial matters. Therefore they rely to persons with higher authority and reputation. Internet is the choice of people who are familiar with the capacity of the network and utilize it to diversify and enlarge their sources of information and to compare different opinions. Those are mostly representatives of the active social groups from the larger urban centers, officers and business owners, with higher education and, most significantly, of the younger age groups. In their personal practice if they need to take a loan for example, the main information that the interviewed are looking for is the interest rate and the cost of the loan. (See Graph 2.2.4.)
22
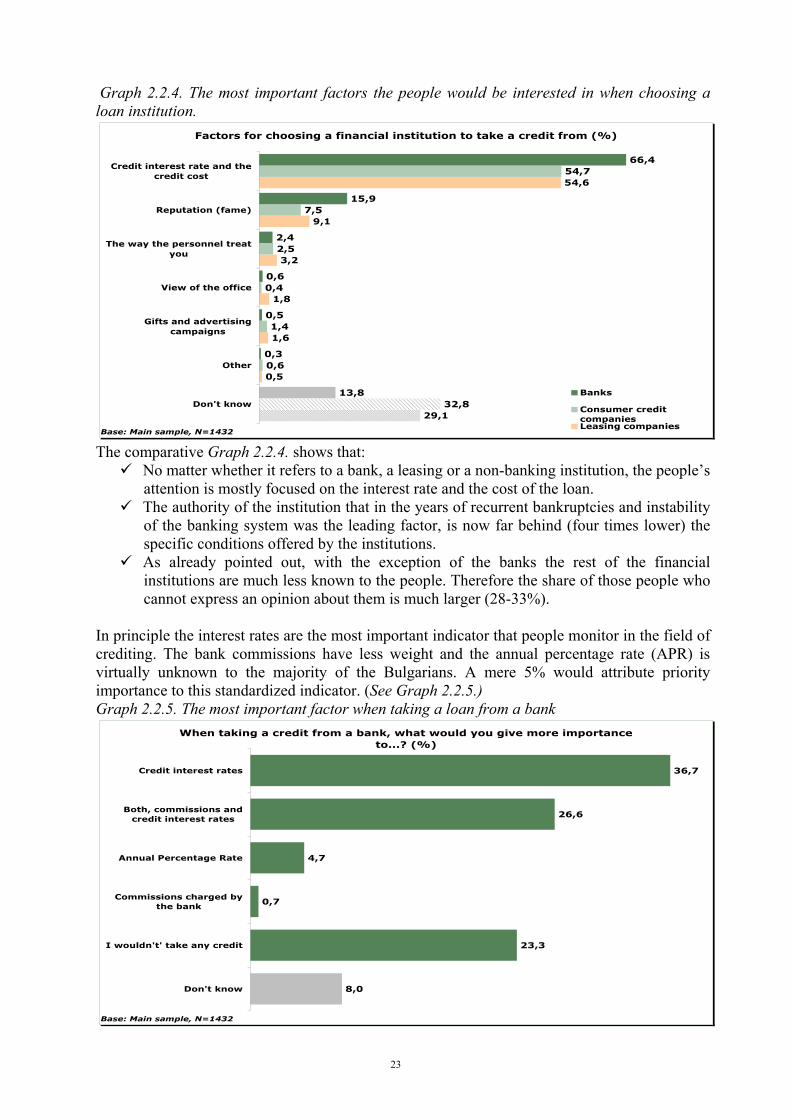
Graph 2.2.4. The most important factors the people would be interested in when choosing a loan institution.
Factors for choosing a financial institution to take a credit from (%)
29,1
0,5
1,6
1,8
3,2
9,1
54,6
32,8
0,6
1,4
0,4
2,5
7,5
54,7
13,8
0,3
0,5
0,6
2,4
15,9
66,4
Don't know
Other
Gifts and advertisingcampaigns
View of the office
he way the personnel treatyou
Reputation (fame)
Credit interest rate and thecredit cost
Base: Main sample, N=1432
Banks
Consumer creditcompaniesLeasing companies
The comparative Graph 2.2.4. shows that:
No matter whether it refers to a bank, a leasing or a non-banking institution, the people’s attention is mostly focused on the interest rate and the cost of the loan.
The authority of the institution that in the years of recurrent bankruptcies and instability of the banking system was the leading factor, is now far behind (four times lower) the specific conditions offered by the institutions.
As already pointed out, with the exception of the banks the rest of the financial institutions are much less known to the people. Therefore the share of those people who cannot express an opinion about them is much larger (28-33%).
In principle the interest rates are the most important indicator that people monitor in the field of crediting. The bank commissions have less weight and the annual percentage rate (APR) is virtually unknown to the majority of the Bulgarians. A mere 5% would attribute priority importance to this standardized indicator. (See Graph 2.2.5.) Graph 2.2.5. The most important factor when taking a loan from a bank
When taking a credit from a bank, what would you give more importance to...? (%)
8,0
23,3
0,7
4,7
26,6
36,7
Don't know
I wouldn't' take any credit
Commissions charged bythe bank
Annual Percentage Rate
Both, commissions andcredit interest rates
Credit interest rates
Base: Main sample, N=1432
23
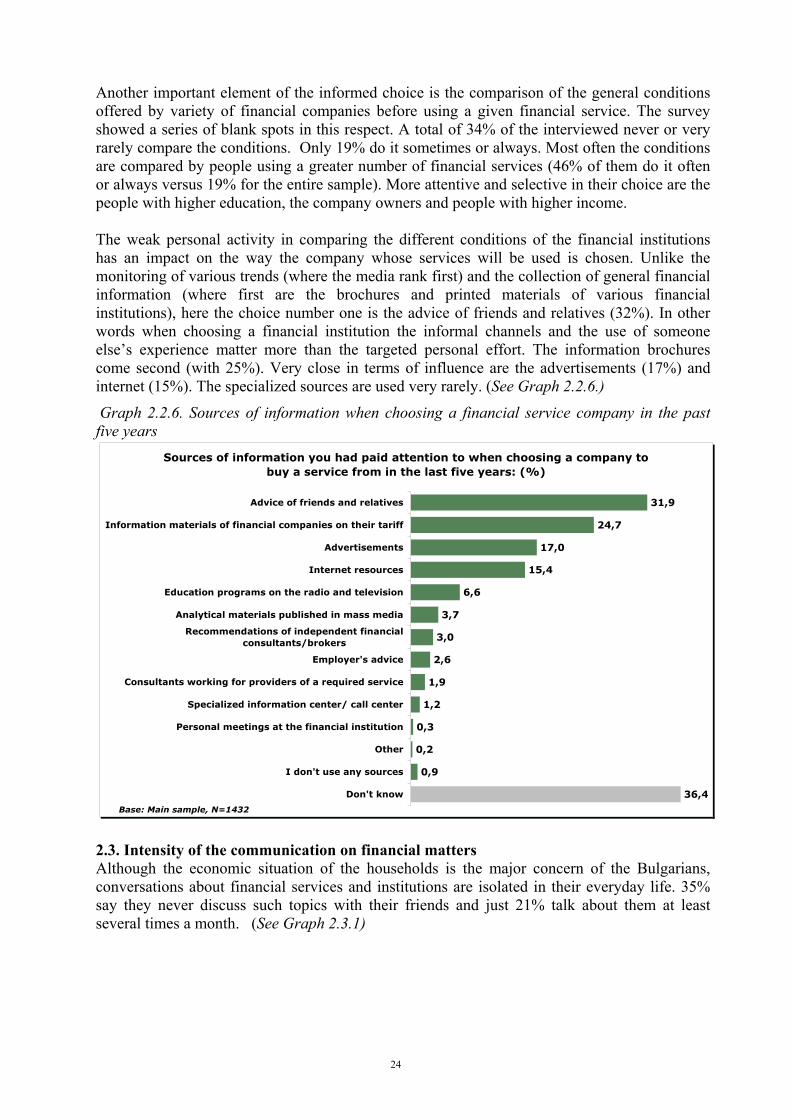
Another important element of the informed choice is the comparison of the general conditions offered by variety of financial companies before using a given financial service. The survey showed a series of blank spots in this respect. A total of 34% of the interviewed never or very rarely compare the conditions. Only 19% do it sometimes or always. Most often the conditions are compared by people using a greater number of financial services (46% of them do it often or always versus 19% for the entire sample). More attentive and selective in their choice are the people with higher education, the company owners and people with higher income. The weak personal activity in comparing the different conditions of the financial institutions has an impact on the way the company whose services will be used is chosen. Unlike the monitoring of various trends (where the media rank first) and the collection of general financial information (where first are the brochures and printed materials of various financial institutions), here the choice number one is the advice of friends and relatives (32%). In other words when choosing a financial institution the informal channels and the use of someone else’s experience matter more than the targeted personal effort. The information brochures come second (with 25%). Very close in terms of influence are the advertisements (17%) and internet (15%). The specialized sources are used very rarely. (See Graph 2.2.6.)
Graph 2.2.6. Sources of information when choosing a financial service company in the past five years
Sources of information you had paid attention to when choosing a company to buy a service from in the last five years: (%)
36,4
0,9
0,2
0,3
1,2
1,9
2,6
3,0
3,7
6,6
15,4
17,0
24,7
31,9
Don't know
I don't use any sources
Other
Personal meetings at the financial institution
Specialized information center/ call center
Consultants working for providers of a required service
Employer's advice
Recommendations of independent financialconsultants/brokers
Analytical materials published in mass media
Education programs on the radio and television
Internet resources
Advertisements
Information materials of financial companies on their tariff
Advice of friends and relatives
Base: Main sample, N=1432 2.3. Intensity of the communication on financial matters Although the economic situation of the households is the major concern of the Bulgarians, conversations about financial services and institutions are isolated in their everyday life. 35% say they never discuss such topics with their friends and just 21% talk about them at least several times a month. (See Graph 2.3.1)
24
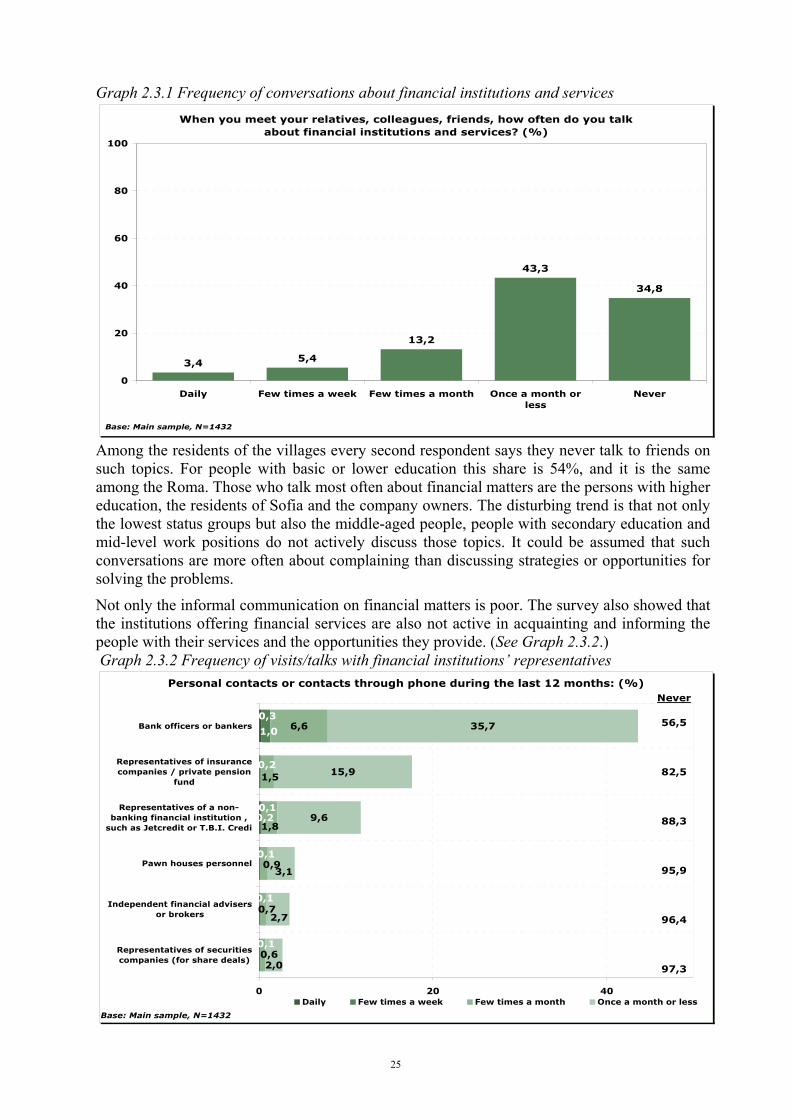
Graph 2.3.1 Frequency of conversations about financial institutions and services When you meet your relatives, colleagues, friends, how often do you talk
about financial institutions and services? (%)
3,4 5,4
13,2
43,3
34,8
0
20
40
60
80
100
Daily Few times a week Few times a month Once a month orless
Never
Base: Main sample, N=1432
Among the residents of the villages every second respondent says they never talk to friends on such topics. For people with basic or lower education this share is 54%, and it is the same among the Roma. Those who talk most often about financial matters are the persons with higher education, the residents of Sofia and the company owners. The disturbing trend is that not only the lowest status groups but also the middle-aged people, people with secondary education and mid-level work positions do not actively discuss those topics. It could be assumed that such conversations are more often about complaining than discussing strategies or opportunities for solving the problems.
Not only the informal communication on financial matters is poor. The survey also showed that the institutions offering financial services are also not active in acquainting and informing the people with their services and the opportunities they provide. (See Graph 2.3.2.) Graph 2.3.2 Frequency of visits/talks with financial institutions’ representatives
Personal contacts or contacts through phone during the last 12 months: (%)
6,6
9,6
15,9
35,7
0,1
0,3
0,1
0,1
0,1
0,2
0,2
1,0
0,7
0,9
1,8
1,5
0,62,0
2,7
3,1
0 20 40
Representatives of securitiescompanies (for share deals)
Independent financial advisersor brokers
Pawn houses personnel
Representatives of a non-banking financial institution ,
such as Jetcredit or T.B.I. Credi
Representatives of insurancecompanies / private pension
fund
Bank officers or bankers
Base: Main sample, N=1432
Daily Few times a week Few times a month Once a month or less
Never
56,5
82,5
88,3
95,9
96,4
97,3
25
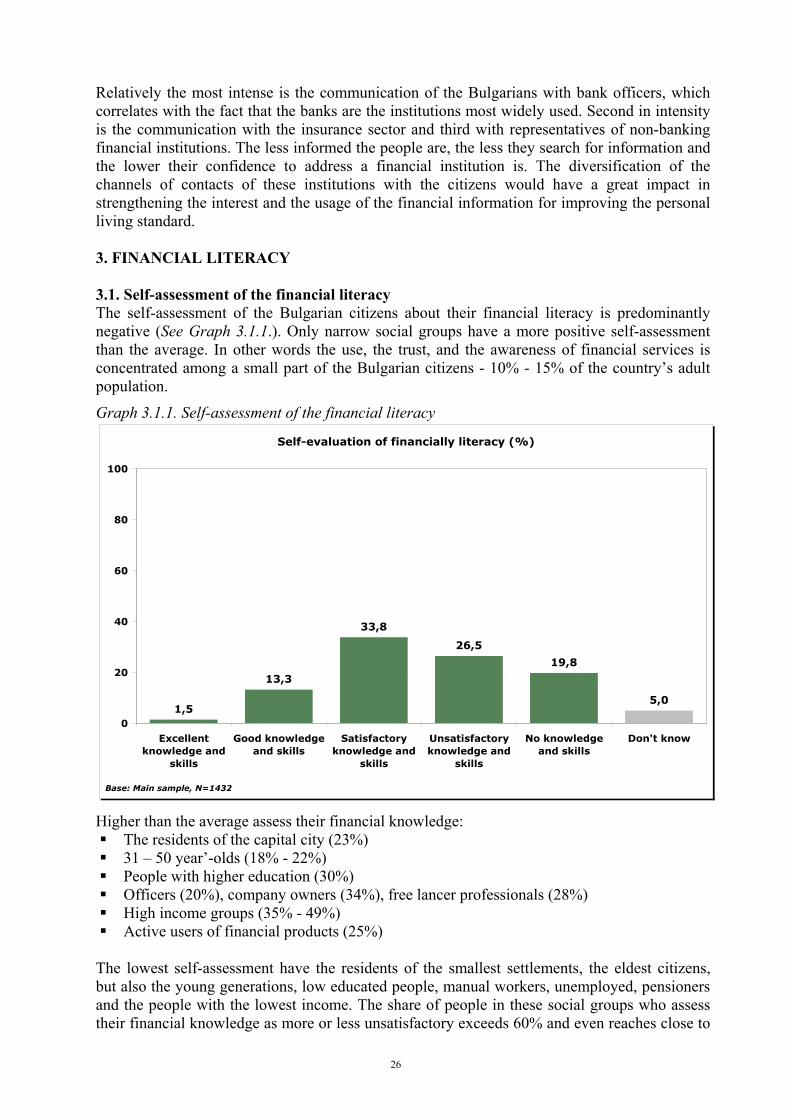
Relatively the most intense is the communication of the Bulgarians with bank officers, which correlates with the fact that the banks are the institutions most widely used. Second in intensity is the communication with the insurance sector and third with representatives of non-banking financial institutions. The less informed the people are, the less they search for information and the lower their confidence to address a financial institution is. The diversification of the channels of contacts of these institutions with the citizens would have a great impact in strengthening the interest and the usage of the financial information for improving the personal living standard. 3. FINANCIAL LITERACY 3.1. Self-assessment of the financial literacy The self-assessment of the Bulgarian citizens about their financial literacy is predominantly negative (See Graph 3.1.1.). Only narrow social groups have a more positive self-assessment than the average. In other words the use, the trust, and the awareness of financial services is concentrated among a small part of the Bulgarian citizens - 10% - 15% of the country’s adult population.
Graph 3.1.1. Self-assessment of the financial literacy
Self-evaluation of financially literacy (%)
1,5
13,3
33,8
26,5
19,8
5,0
0
20
40
60
80
100
Excellentknowledge and
skills
Good knowledgeand skills
Satisfactoryknowledge and
skills
Unsatisfactoryknowledge and
skills
No knowledgeand skills
Don't know
Base: Main sample, N=1432
Higher than the average assess their financial knowledge: The residents of the capital city (23%) 31 – 50 year’-olds (18% - 22%) People with higher education (30%) Officers (20%), company owners (34%), free lancer professionals (28%) High income groups (35% - 49%) Active users of financial products (25%)
The lowest self-assessment have the residents of the smallest settlements, the eldest citizens, but also the young generations, low educated people, manual workers, unemployed, pensioners and the people with the lowest income. The share of people in these social groups who assess their financial knowledge as more or less unsatisfactory exceeds 60% and even reaches close to
26
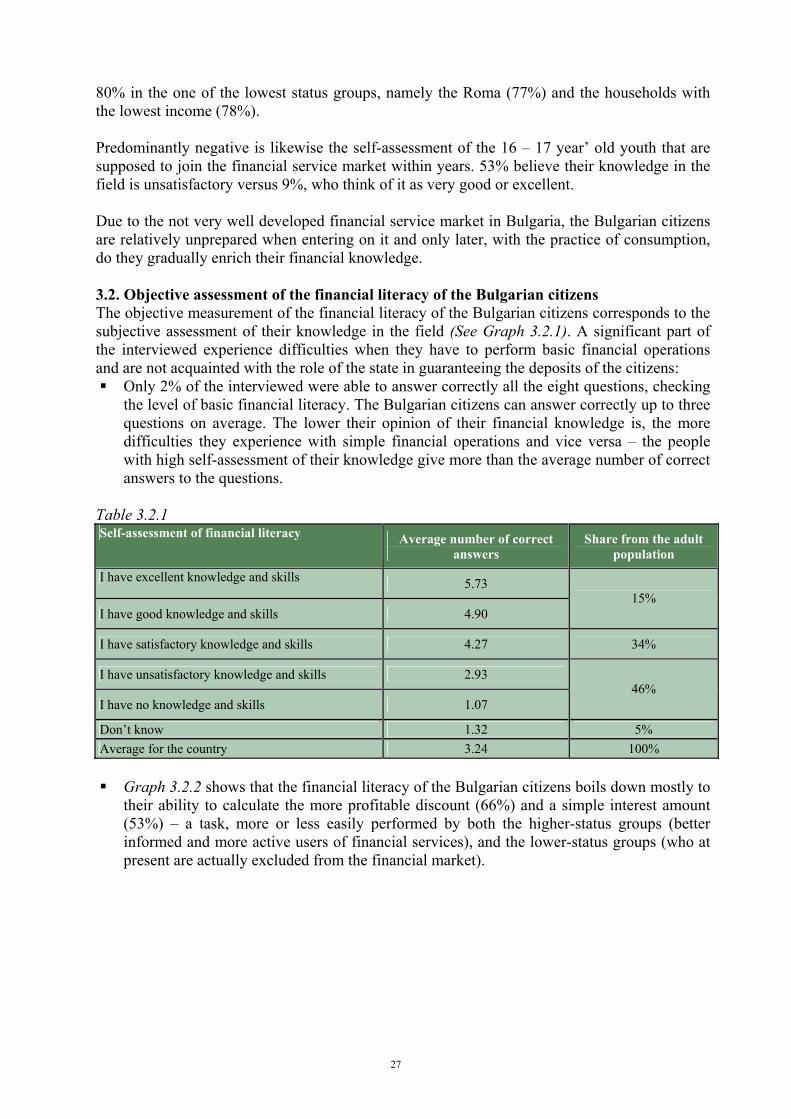
80% in the one of the lowest status groups, namely the Roma (77%) and the households with the lowest income (78%). Predominantly negative is likewise the self-assessment of the 16 – 17 year’ old youth that are supposed to join the financial service market within years. 53% believe their knowledge in the field is unsatisfactory versus 9%, who think of it as very good or excellent. Due to the not very well developed financial service market in Bulgaria, the Bulgarian citizens are relatively unprepared when entering on it and only later, with the practice of consumption, do they gradually enrich their financial knowledge. 3.2. Objective assessment of the financial literacy of the Bulgarian citizens The objective measurement of the financial literacy of the Bulgarian citizens corresponds to the subjective assessment of their knowledge in the field (See Graph 3.2.1). A significant part of the interviewed experience difficulties when they have to perform basic financial operations and are not acquainted with the role of the state in guaranteeing the deposits of the citizens:
Only 2% of the interviewed were able to answer correctly all the eight questions, checking the level of basic financial literacy. The Bulgarian citizens can answer correctly up to three questions on average. The lower their opinion of their financial knowledge is, the more difficulties they experience with simple financial operations and vice versa – the people with high self-assessment of their knowledge give more than the average number of correct answers to the questions.
Table 3.2.1 Self-assessment of financial literacy Average number of correct
answers Share from the adult
population
I have excellent knowledge and skills 5.73
I have good knowledge and skills 4.90 15%
I have satisfactory knowledge and skills 4.27 34%
I have unsatisfactory knowledge and skills 2.93
I have no knowledge and skills 1.07 46%
Don’t know 1.32 5% Average for the country 3.24 100%
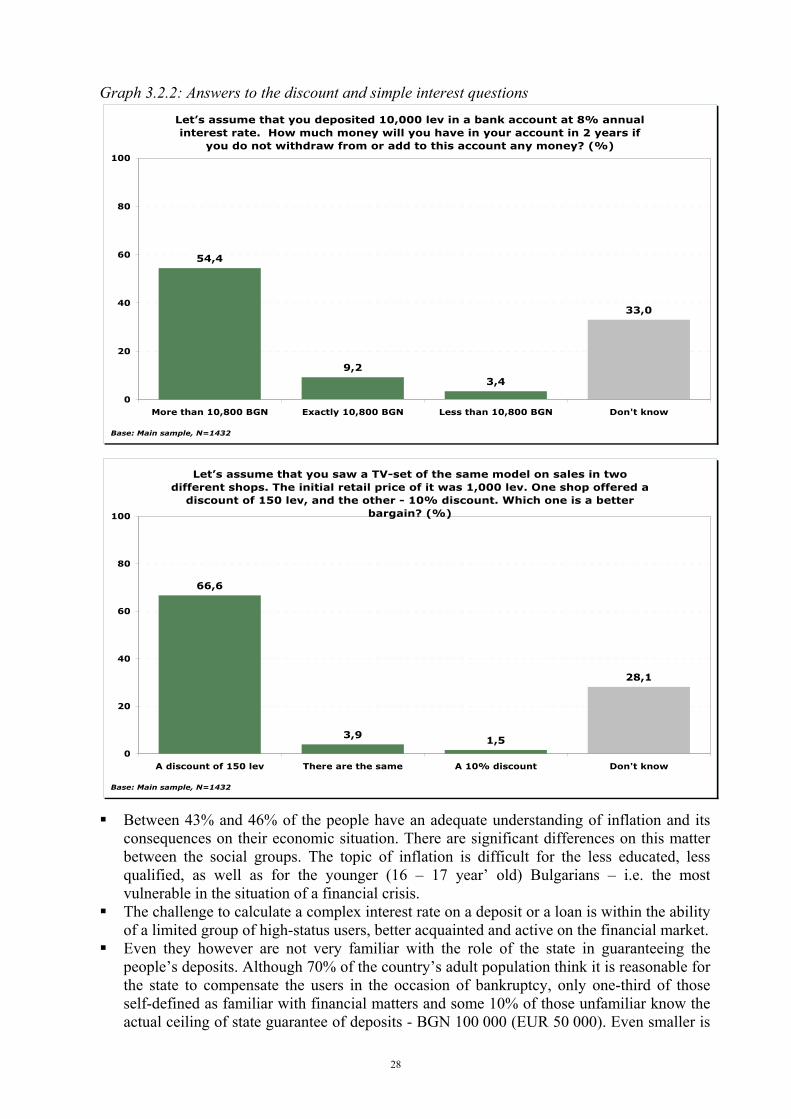
Graph 3.2.2 shows that the financial literacy of the Bulgarian citizens boils down mostly to their ability to calculate the more profitable discount (66%) and a simple interest amount (53%) – a task, more or less easily performed by both the higher-status groups (better informed and more active users of financial services), and the lower-status groups (who at present are actually excluded from the financial market).
27
Graph 3.2.2: Answers to the discount and simple interest questions Let�’s assume that you deposited 10,000 lev in a bank account at 8% annual interest rate. How much money will you have in your account in 2 years if
you do not withdraw from or add to this account any money? (%)
54,4
9,23,4
33,0
0
20
40
60
80
100
More than 10,800 BGN Exactly 10,800 BGN Less than 10,800 BGN Don't know
Base: Main sample, N=1432
Let�’s assume that you saw a TV-set of the same model on sales in two different shops. The initial retail price of it was 1,000 lev. One shop offered a
discount of 150 lev, and the other - 10% discount. Which one is a better bargain? (%)
66,6
3,9 1,5
28,1
0
20
40
60
80
100
A discount of 150 lev There are the same A 10% discount Don't know
Base: Main sample, N=1432
Between 43% and 46% of the people have an adequate understanding of inflation and its
consequences on their economic situation. There are significant differences on this matter between the social groups. The topic of inflation is difficult for the less educated, less qualified, as well as for the younger (16 – 17 year’ old) Bulgarians – i.e. the most vulnerable in the situation of a financial crisis.
The challenge to calculate a complex interest rate on a deposit or a loan is within the ability of a limited group of high-status users, better acquainted and active on the financial market.
Even they however are not very familiar with the role of the state in guaranteeing the people’s deposits. Although 70% of the country’s adult population think it is reasonable for the state to compensate the users in the occasion of bankruptcy, only one-third of those self-defined as familiar with financial matters and some 10% of those unfamiliar know the actual ceiling of state guarantee of deposits - BGN 100 000 (EUR 50 000). Even smaller is
28
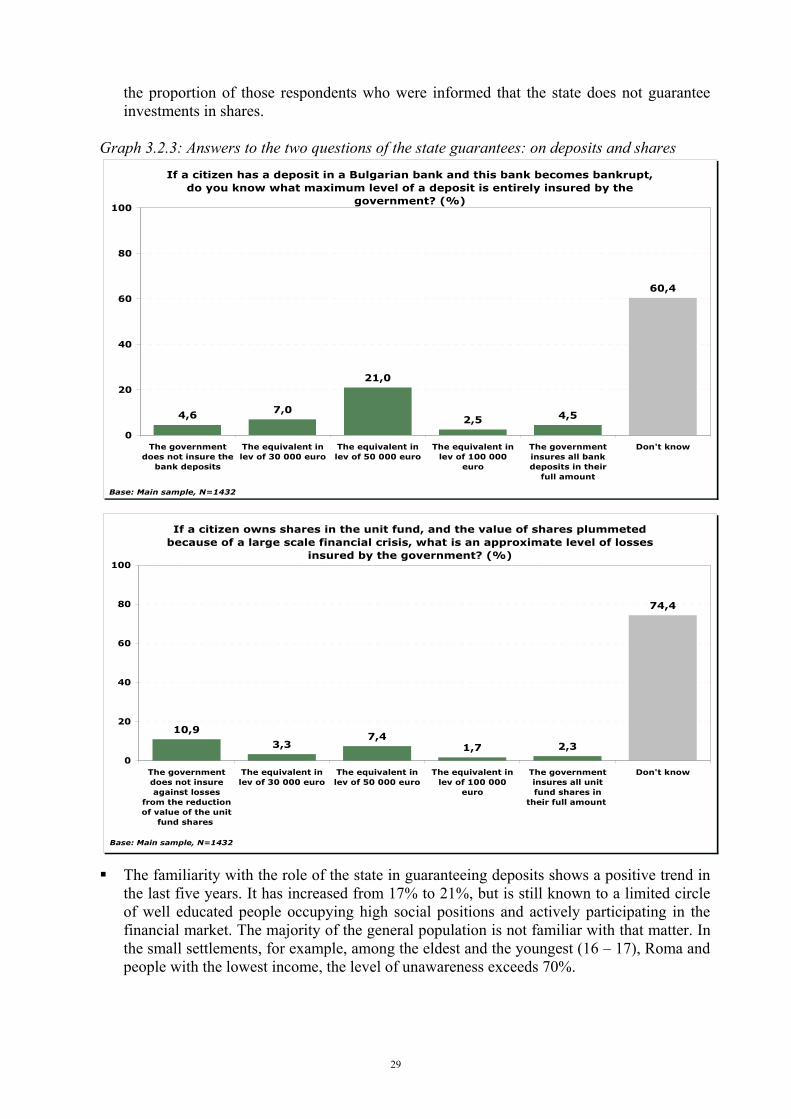
the proportion of those respondents who were informed that the state does not guarantee investments in shares.
Graph 3.2.3: Answers to the two questions of the state guarantees: on deposits and shares
If a citizen has a deposit in a Bulgarian bank and this bank becomes bankrupt, do you know what maximum level of a deposit is entirely insured by the
government? (%)
4,6 7,0
21,0
2,5 4,5
60,4
0
20
40
60
80
100
The governmentdoes not insure the
bank deposits
The equivalent inlev of 30 000 euro
The equivalent inlev of 50 000 euro
The equivalent inlev of 100 000
euro
The governmentinsures all bankdeposits in their
full amount
Don't know
Base: Main sample, N=1432
If a citizen owns shares in the unit fund, and the value of shares plummeted because of a large scale financial crisis, what is an approximate level of losses
insured by the government? (%)
10,9
3,37,4
1,7 2,3
74,4
0
20
40
60
80
100
The governmentdoes not insureagainst losses
from the reductionof value of the unit
fund shares
The equivalent inlev of 30 000 euro
The equivalent inlev of 50 000 euro
The equivalent inlev of 100 000
euro
The governmentinsures all unitfund shares in
their full amount
Don't know
Base: Main sample, N=1432
The familiarity with the role of the state in guaranteeing deposits shows a positive trend in
the last five years. It has increased from 17% to 21%, but is still known to a limited circle of well educated people occupying high social positions and actively participating in the financial market. The majority of the general population is not familiar with that matter. In the small settlements, for example, among the eldest and the youngest (16 – 17), Roma and people with the lowest income, the level of unawareness exceeds 70%.
29
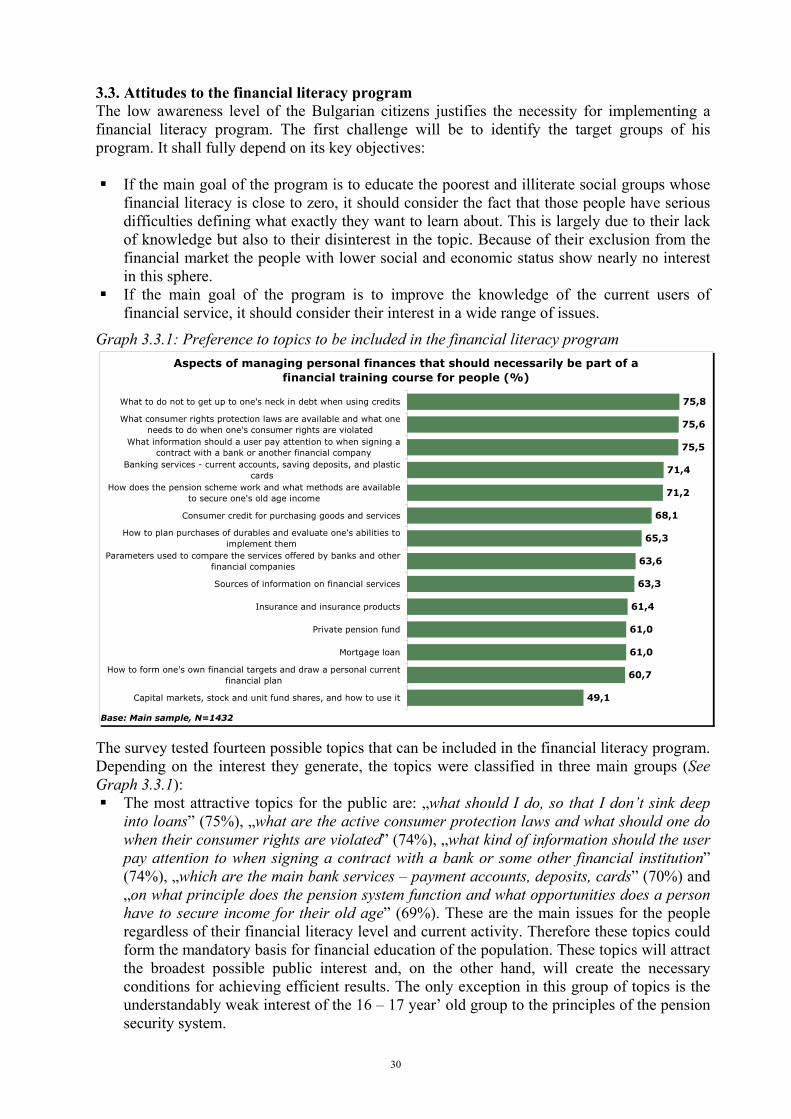
3.3. Attitudes to the financial literacy program The low awareness level of the Bulgarian citizens justifies the necessity for implementing a financial literacy program. The first challenge will be to identify the target groups of his program. It shall fully depend on its key objectives:
If the main goal of the program is to educate the poorest and illiterate social groups whose financial literacy is close to zero, it should consider the fact that those people have serious difficulties defining what exactly they want to learn about. This is largely due to their lack of knowledge but also to their disinterest in the topic. Because of their exclusion from the financial market the people with lower social and economic status show nearly no interest in this sphere.
If the main goal of the program is to improve the knowledge of the current users of financial service, it should consider their interest in a wide range of issues.
Graph 3.3.1: Preference to topics to be included in the financial literacy program Aspects of managing personal finances that should necessarily be part of a
financial training course for people (%)
49,1
60,7
61,0
61,0
61,4
63,3
63,6
65,3
68,1
71,2
71,4
75,5
75,6
75,8
Capital markets, stock and unit fund shares, and how to use it
How to form one's own financial targets and draw a personal currentfinancial plan
Mortgage loan
Private pension fund
Insurance and insurance products
Sources of information on financial services
Parameters used to compare the services offered by banks and otherfinancial companies
How to plan purchases of durables and evaluate one's abilities toimplement them
Consumer credit for purchasing goods and services
How does the pension scheme work and what methods are availableto secure one's old age income
Banking services - current accounts, saving deposits, and plasticcards
What information should a user pay attention to when signing acontract with a bank or another financial company
What consumer rights protection laws are available and what oneneeds to do when one's consumer rights are violated
What to do not to get up to one's neck in debt when using credits
Base: Main sample, N=1432 The survey tested fourteen possible topics that can be included in the financial literacy program. Depending on the interest they generate, the topics were classified in three main groups (See Graph 3.3.1):
The most attractive topics for the public are: „what should I do, so that I don’t sink deep into loans” (75%), „what are the active consumer protection laws and what should one do when their consumer rights are violated” (74%), „what kind of information should the user pay attention to when signing a contract with a bank or some other financial institution” (74%), „which are the main bank services – payment accounts, deposits, cards” (70%) and „on what principle does the pension system function and what opportunities does a person have to secure income for their old age” (69%). These are the main issues for the people regardless of their financial literacy level and current activity. Therefore these topics could form the mandatory basis for financial education of the population. These topics will attract the broadest possible public interest and, on the other hand, will create the necessary conditions for achieving efficient results. The only exception in this group of topics is the understandably weak interest of the 16 – 17 year’ old group to the principles of the pension security system.
30
The second group includes questions related to information about specific products and services – how can you get a consumer or mortgage loan, how to utilize the insurance products, what should one pay attention to when comparing the offers of various banks and insurance companies, how differentiate between advertising and objective information. The interest to these topics is greater among the actual users of financial services: the better educated and economically active residents of the urban centers who utilize most actively the opportunities created by the financial market. Therefore it would be best to include them in the program mostly in the form of practical examples and cases, helping the users get orientated in a life situation.
The third group includes development of skills for financial goal-setting and planning, private pension security funds, opportunities for joining the capital market. They were pointed out by the best informed citizens for whom the participation on this market is a form of investment. Those are the people with the highest income and high ranking positions in the occupational hierarchy and generally speaking the most attractive clients of the financial institutions. It would be most effective for the program respectively to include such topics in the form of consulting rather than training.
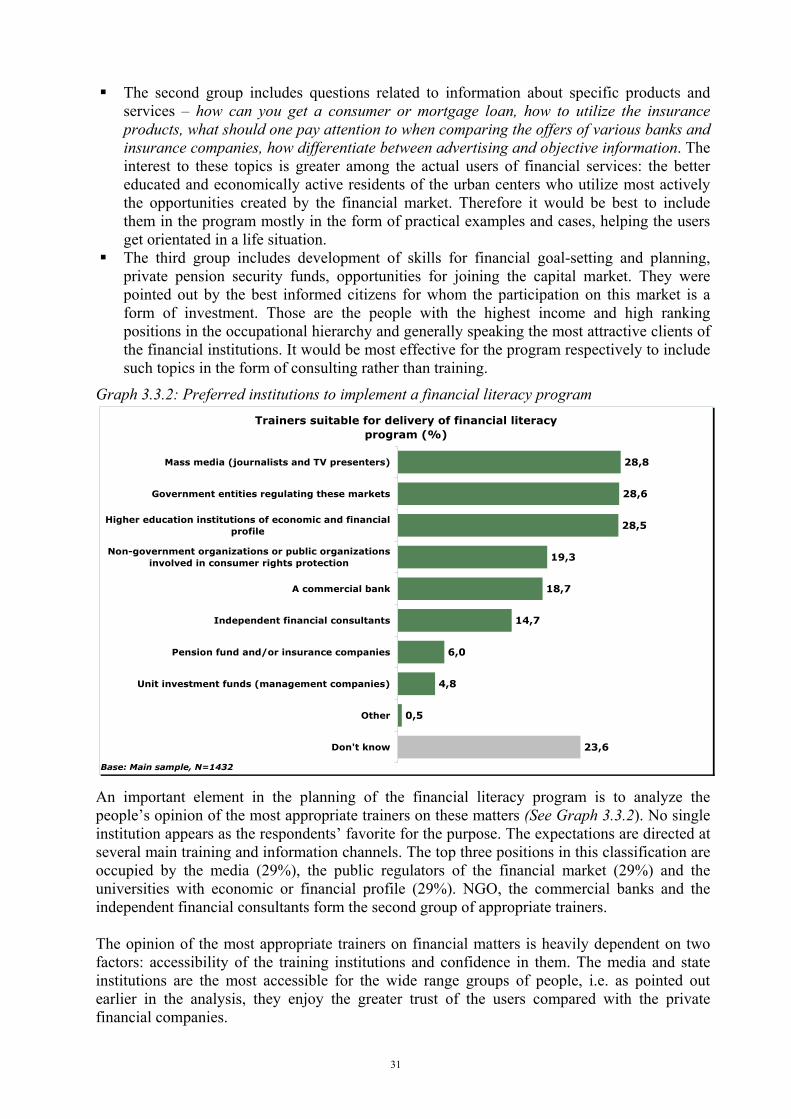
Graph 3.3.2: Preferred institutions to implement a financial literacy program Trainers suitable for delivery of financial literacy
program (%)
23,6
0,5
4,8
6,0
14,7
18,7
19,3
28,5
28,6
28,8
Don't know
Other
Unit investment funds (management companies)
Pension fund and/or insurance companies
Independent financial consultants
A commercial bank
Non-government organizations or public organizationsinvolved in consumer rights protection
Higher education institutions of economic and financialprofile
Government entities regulating these markets
Mass media (journalists and TV presenters)
Base: Main sample, N=1432 An important element in the planning of the financial literacy program is to analyze the people’s opinion of the most appropriate trainers on these matters (See Graph 3.3.2). No single institution appears as the respondents’ favorite for the purpose. The expectations are directed at several main training and information channels. The top three positions in this classification are occupied by the media (29%), the public regulators of the financial market (29%) and the universities with economic or financial profile (29%). NGO, the commercial banks and the independent financial consultants form the second group of appropriate trainers. The opinion of the most appropriate trainers on financial matters is heavily dependent on two factors: accessibility of the training institutions and confidence in them. The media and state institutions are the most accessible for the wide range groups of people, i.e. as pointed out earlier in the analysis, they enjoy the greater trust of the users compared with the private financial companies.
31
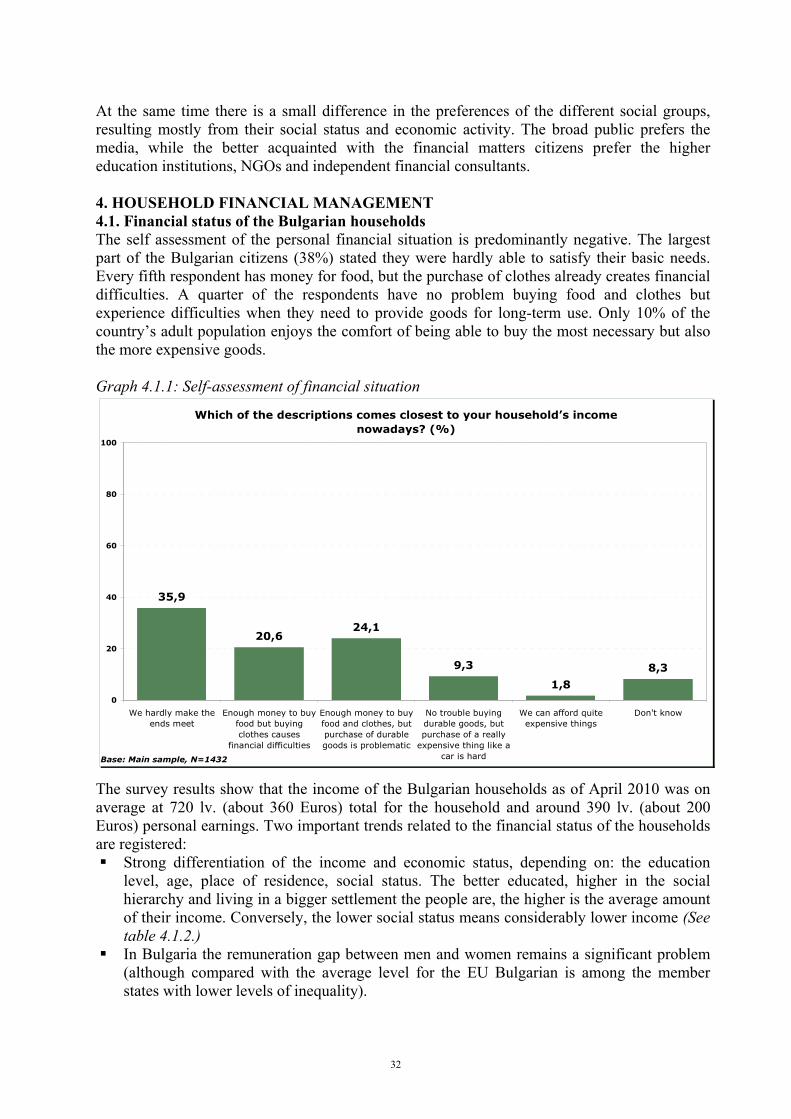
At the same time there is a small difference in the preferences of the different social groups, resulting mostly from their social status and economic activity. The broad public prefers the media, while the better acquainted with the financial matters citizens prefer the higher education institutions, NGOs and independent financial consultants. 4. HOUSEHOLD FINANCIAL MANAGEMENT 4.1. Financial status of the Bulgarian households The self assessment of the personal financial situation is predominantly negative. The largest part of the Bulgarian citizens (38%) stated they were hardly able to satisfy their basic needs. Every fifth respondent has money for food, but the purchase of clothes already creates financial difficulties. A quarter of the respondents have no problem buying food and clothes but experience difficulties when they need to provide goods for long-term use. Only 10% of the country’s adult population enjoys the comfort of being able to buy the most necessary but also the more expensive goods. Graph 4.1.1: Self-assessment of financial situation
Which of the descriptions comes closest to your household�’s income nowadays? (%)
35,9
20,624,1
9,3
1,8
8,3
0
20
40
60
80
100
We hardly make theends meet
Enough money to buyfood but buyingclothes causes
financial difficulties
Enough money to buyfood and clothes, butpurchase of durablegoods is problematic
No trouble buyingdurable goods, butpurchase of a really
expensive thing like acar is hard
We can afford quiteexpensive things
Don't know
Base: Main sample, N=1432 The survey results show that the income of the Bulgarian households as of April 2010 was on average at 720 lv. (about 360 Euros) total for the household and around 390 lv. (about 200 Euros) personal earnings. Two important trends related to the financial status of the households are registered:
Strong differentiation of the income and economic status, depending on: the education level, age, place of residence, social status. The better educated, higher in the social hierarchy and living in a bigger settlement the people are, the higher is the average amount of their income. Conversely, the lower social status means considerably lower income (See table 4.1.2.)
In Bulgaria the remuneration gap between men and women remains a significant problem (although compared with the average level for the EU Bulgarian is among the member states with lower levels of inequality).
32
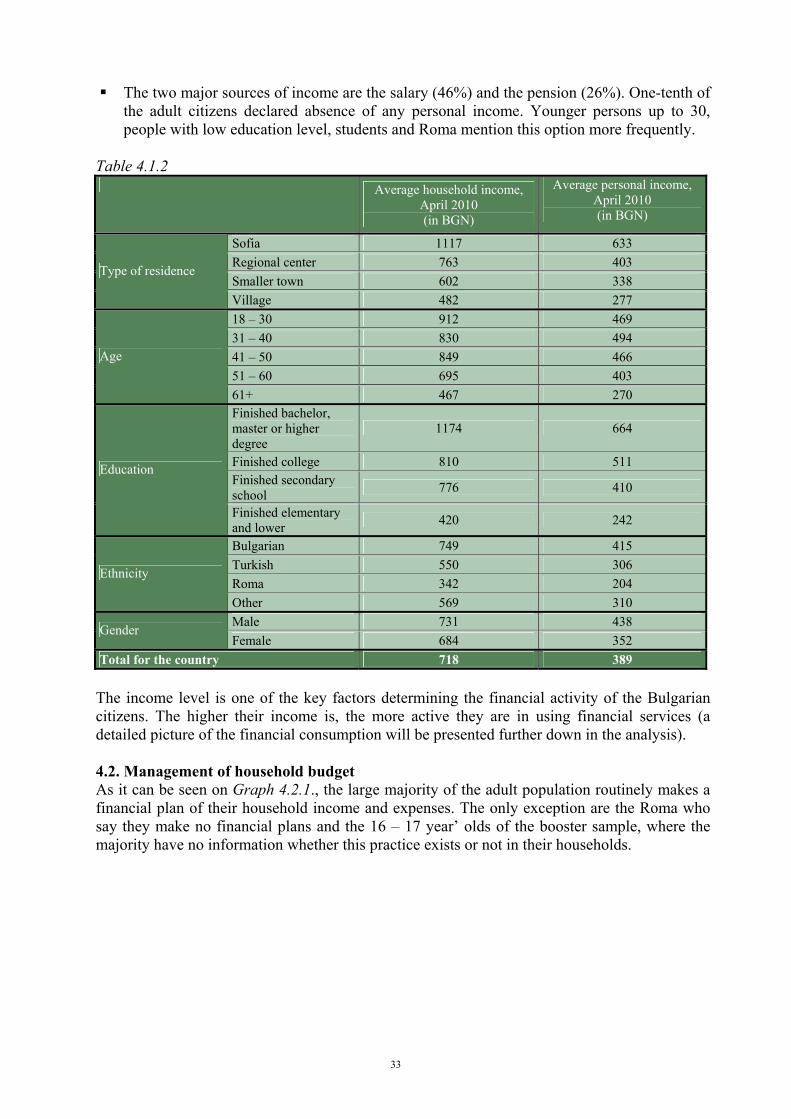
The two major sources of income are the salary (46%) and the pension (26%). One-tenth of the adult citizens declared absence of any personal income. Younger persons up to 30, people with low education level, students and Roma mention this option more frequently.
Table 4.1.2 Average household income,
April 2010 (in BGN)
Average personal income, April 2010 (in BGN)
Sofia 1117 633 Regional center 763 403 Smaller town 602 338
Type of residence
Village 482 277 18 – 30 912 469 31 – 40 830 494 41 – 50 849 466 51 – 60 695 403
Age
61+ 467 270 Finished bachelor, master or higher degree
1174 664
Finished college 810 511 Finished secondary school 776 410
Education
Finished elementary and lower 420 242
Bulgarian 749 415 Turkish 550 306 Roma 342 204
Ethnicity
Other 569 310 Male 731 438 Gender Female 684 352
Total for the country 718 389 The income level is one of the key factors determining the financial activity of the Bulgarian citizens. The higher their income is, the more active they are in using financial services (a detailed picture of the financial consumption will be presented further down in the analysis). 4.2. Management of household budget As it can be seen on Graph 4.2.1., the large majority of the adult population routinely makes a financial plan of their household income and expenses. The only exception are the Roma who say they make no financial plans and the 16 – 17 year’ olds of the booster sample, where the majority have no information whether this practice exists or not in their households.
33
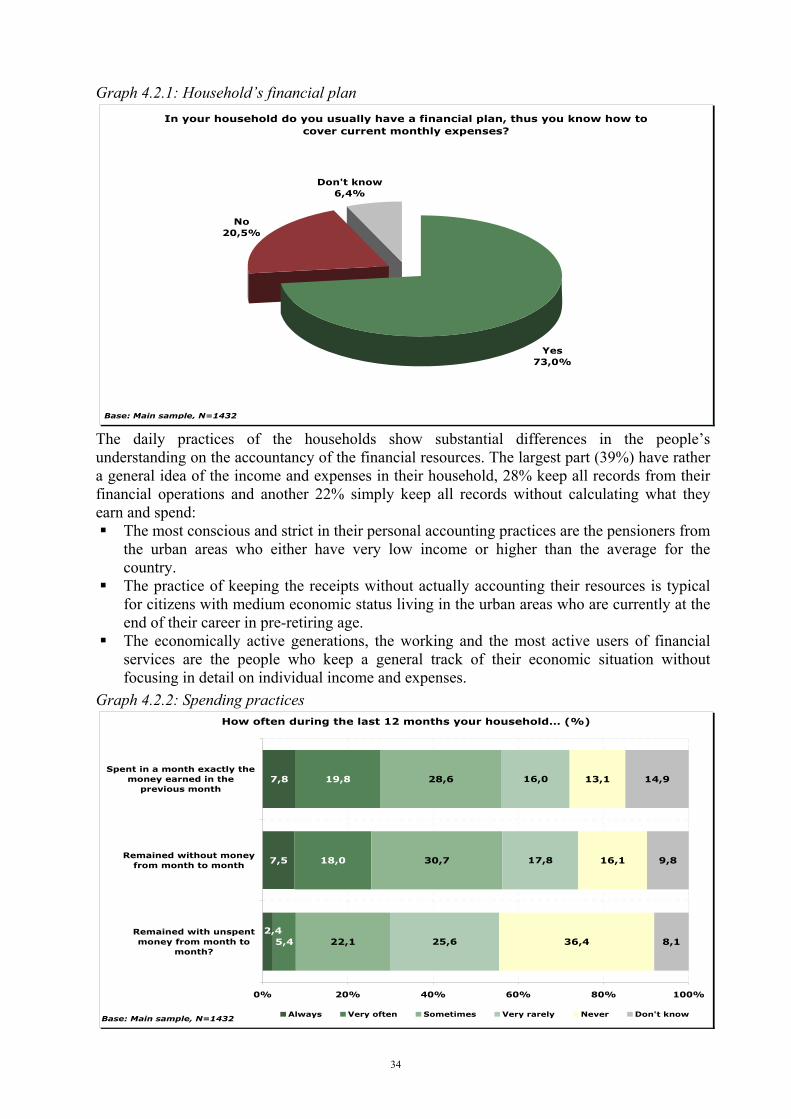
Graph 4.2.1: Household’s financial plan In your household do you usually have a financial plan, thus you know how to
cover current monthly expenses?
No20,5%
Don't know6,4%
Yes73,0%
Base: Main sample, N=1432
The daily practices of the households show substantial differences in the people’s understanding on the accountancy of the financial resources. The largest part (39%) have rather a general idea of the income and expenses in their household, 28% keep all records from their financial operations and another 22% simply keep all records without calculating what they earn and spend:
The most conscious and strict in their personal accounting practices are the pensioners from the urban areas who either have very low income or higher than the average for the country.
The practice of keeping the receipts without actually accounting their resources is typical for citizens with medium economic status living in the urban areas who are currently at the end of their career in pre-retiring age.
The economically active generations, the working and the most active users of financial services are the people who keep a general track of their economic situation without focusing in detail on individual income and expenses.
Graph 4.2.2: Spending practices How often during the last 12 months your household�… (%)
7,5
7,8
5,4
18,0
19,8
22,1
30,7
28,6
25,6
17,8
16,0
36,4
16,1
13,1
8,1
9,8
14,9
2,4
0% 20% 40% 60% 80% 100%
Remained with unspentmoney from month to
month?
Remained without moneyfrom month to month
Spent in a month exactly themoney earned in the
previous month
Base: Main sample, N=1432 Always Very often Sometimes Very rarely Never Don't know
34
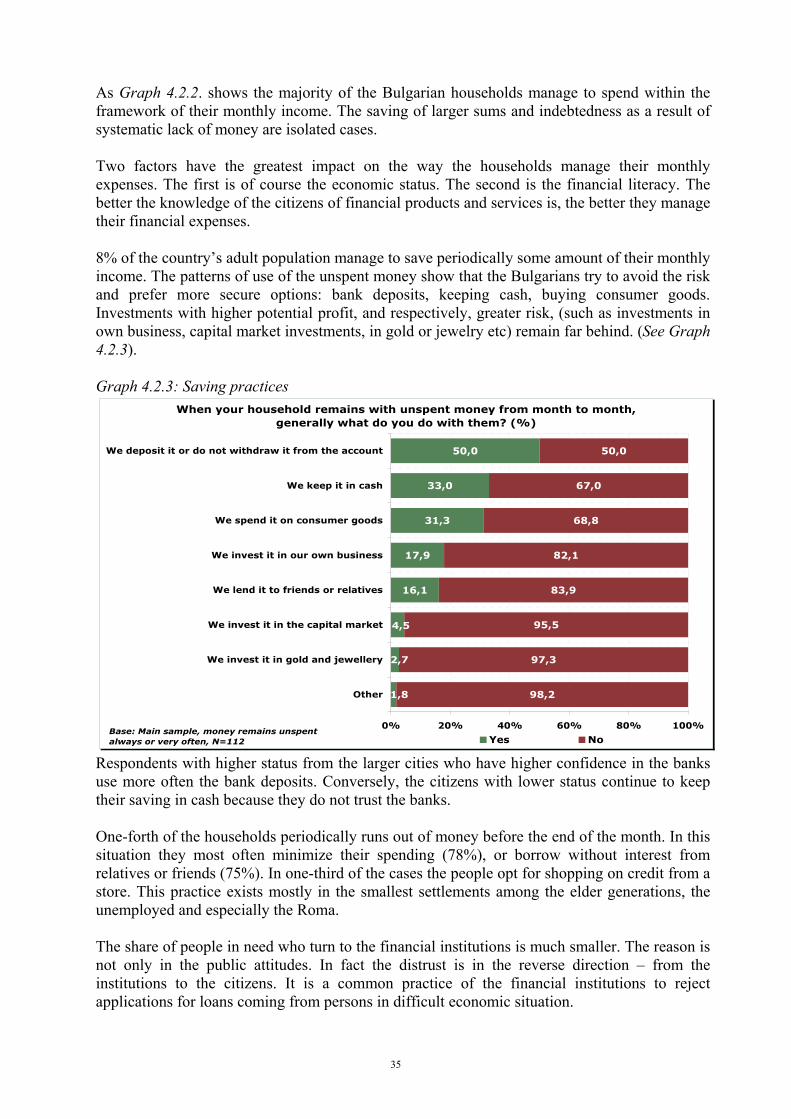
As Graph 4.2.2. shows the majority of the Bulgarian households manage to spend within the framework of their monthly income. The saving of larger sums and indebtedness as a result of systematic lack of money are isolated cases. Two factors have the greatest impact on the way the households manage their monthly expenses. The first is of course the economic status. The second is the financial literacy. The better the knowledge of the citizens of financial products and services is, the better they manage their financial expenses. 8% of the country’s adult population manage to save periodically some amount of their monthly income. The patterns of use of the unspent money show that the Bulgarians try to avoid the risk and prefer more secure options: bank deposits, keeping cash, buying consumer goods. Investments with higher potential profit, and respectively, greater risk, (such as investments in own business, capital market investments, in gold or jewelry etc) remain far behind. (See Graph 4.2.3). Graph 4.2.3: Saving practices
When your household remains with unspent money from month to month, generally what do you do with them? (%)
16,1
17,9
31,3
33,0
50,0
98,2
97,3
95,5
83,9
82,1
68,8
67,0
50,0
1,8
2,7
4,5
0% 20% 40% 60% 80% 100%
Other
We invest it in gold and jewellery
We invest it in the capital market
We lend it to friends or relatives
We invest it in our own business
We spend it on consumer goods
We keep it in cash
We deposit it or do not withdraw it from the account
Base: Main sample, money remains unspent always or very often, N=112 Yes No
Respondents with higher status from the larger cities who have higher confidence in the banks use more often the bank deposits. Conversely, the citizens with lower status continue to keep their saving in cash because they do not trust the banks. One-forth of the households periodically runs out of money before the end of the month. In this situation they most often minimize their spending (78%), or borrow without interest from relatives or friends (75%). In one-third of the cases the people opt for shopping on credit from a store. This practice exists mostly in the smallest settlements among the elder generations, the unemployed and especially the Roma. The share of people in need who turn to the financial institutions is much smaller. The reason is not only in the public attitudes. In fact the distrust is in the reverse direction – from the institutions to the citizens. It is a common practice of the financial institutions to reject applications for loans coming from persons in difficult economic situation.
35
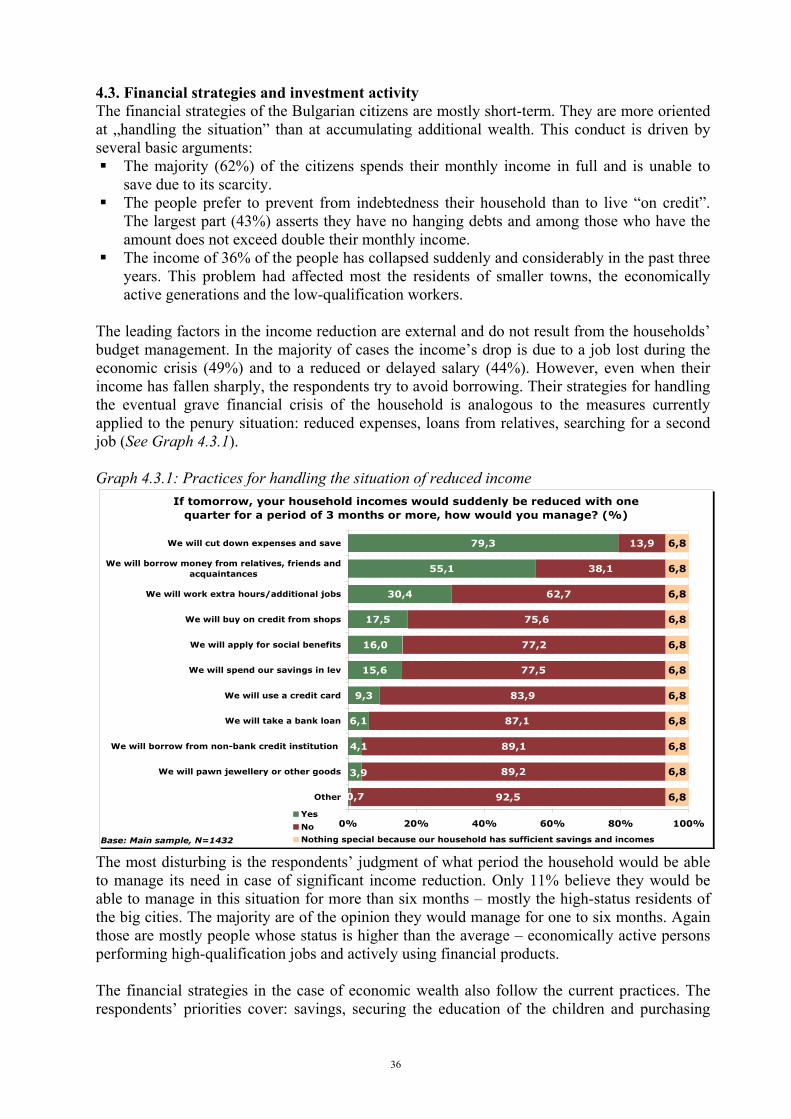
4.3. Financial strategies and investment activity The financial strategies of the Bulgarian citizens are mostly short-term. They are more oriented at „handling the situation” than at accumulating additional wealth. This conduct is driven by several basic arguments:
The majority (62%) of the citizens spends their monthly income in full and is unable to save due to its scarcity.
The people prefer to prevent from indebtedness their household than to live “on credit”. The largest part (43%) asserts they have no hanging debts and among those who have the amount does not exceed double their monthly income.
The income of 36% of the people has collapsed suddenly and considerably in the past three years. This problem had affected most the residents of smaller towns, the economically active generations and the low-qualification workers.
The leading factors in the income reduction are external and do not result from the households’ budget management. In the majority of cases the income’s drop is due to a job lost during the economic crisis (49%) and to a reduced or delayed salary (44%). However, even when their income has fallen sharply, the respondents try to avoid borrowing. Their strategies for handling the eventual grave financial crisis of the household is analogous to the measures currently applied to the penury situation: reduced expenses, loans from relatives, searching for a second job (See Graph 4.3.1). Graph 4.3.1: Practices for handling the situation of reduced income
If tomorrow, your household incomes would suddenly be reduced with one quarter for a period of 3 months or more, how would you manage? (%)
6,1
9,3
15,6
16,0
17,5
30,4
55,1
79,3
92,5
89,2
89,1
87,1
83,9
77,5
77,2
75,6
62,7
38,1
13,9
6,8
6,8
6,8
6,8
6,8
6,8
6,8
6,8
6,8
6,8
6,8
0,7
3,9
4,1
0% 20% 40% 60% 80% 100%
Other
We will pawn jewellery or other goods
We will borrow from non-bank credit institution
We will take a bank loan
We will use a credit card
We will spend our savings in lev
We will apply for social benefits
We will buy on credit from shops
We will work extra hours/additional jobs
We will borrow money from relatives, friends andacquaintances
We will cut down expenses and save
Base: Main sample, N=1432
Yes
No
Nothing special because our household has sufficient savings and incomes The most disturbing is the respondents’ judgment of what period the household would be able to manage its need in case of significant income reduction. Only 11% believe they would be able to manage in this situation for more than six months – mostly the high-status residents of the big cities. The majority are of the opinion they would manage for one to six months. Again those are mostly people whose status is higher than the average – economically active persons performing high-qualification jobs and actively using financial products. The financial strategies in the case of economic wealth also follow the current practices. The respondents’ priorities cover: savings, securing the education of the children and purchasing
36
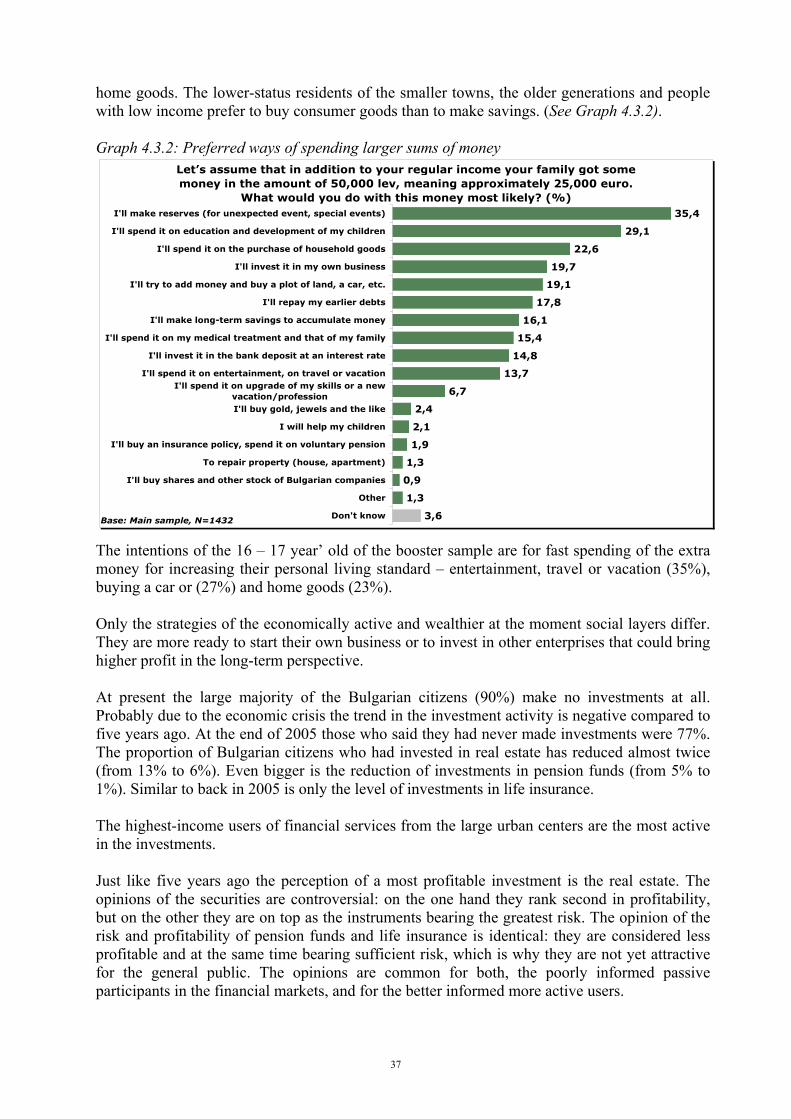
home goods. The lower-status residents of the smaller towns, the older generations and people with low income prefer to buy consumer goods than to make savings. (See Graph 4.3.2). Graph 4.3.2: Preferred ways of spending larger sums of money
Let�’s assume that in addition to your regular income your family got some money in the amount of 50,000 lev, meaning approximately 25,000 euro.
What would you do with this money most likely? (%)
3,6
1,3
0,9
1,3
1,9
2,1
2,4
6,7
13,7
14,8
15,4
16,1
17,8
19,1
19,7
22,6
29,1
35,4
Don't know
Other
I'll buy shares and other stock of Bulgarian companies
To repair property (house, apartment)
I'll buy an insurance policy, spend it on voluntary pension
I will help my children
I'll buy gold, jewels and the like
I'll spend it on upgrade of my skills or a newvacation/profession
I'll spend it on entertainment, on travel or vacation
I'll invest it in the bank deposit at an interest rate
I'll spend it on my medical treatment and that of my family
I'll make long-term savings to accumulate money
I'll repay my earlier debts
I'll try to add money and buy a plot of land, a car, etc.
I'll invest it in my own business
I'll spend it on the purchase of household goods
I'll spend it on education and development of my children
I'll make reserves (for unexpected event, special events)
Base: Main sample, N=1432 The intentions of the 16 – 17 year’ old of the booster sample are for fast spending of the extra money for increasing their personal living standard – entertainment, travel or vacation (35%), buying a car or (27%) and home goods (23%). Only the strategies of the economically active and wealthier at the moment social layers differ. They are more ready to start their own business or to invest in other enterprises that could bring higher profit in the long-term perspective. At present the large majority of the Bulgarian citizens (90%) make no investments at all. Probably due to the economic crisis the trend in the investment activity is negative compared to five years ago. At the end of 2005 those who said they had never made investments were 77%. The proportion of Bulgarian citizens who had invested in real estate has reduced almost twice (from 13% to 6%). Even bigger is the reduction of investments in pension funds (from 5% to 1%). Similar to back in 2005 is only the level of investments in life insurance. The highest-income users of financial services from the large urban centers are the most active in the investments. Just like five years ago the perception of a most profitable investment is the real estate. The opinions of the securities are controversial: on the one hand they rank second in profitability, but on the other they are on top as the instruments bearing the greatest risk. The opinion of the risk and profitability of pension funds and life insurance is identical: they are considered less profitable and at the same time bearing sufficient risk, which is why they are not yet attractive for the general public. The opinions are common for both, the poorly informed passive participants in the financial markets, and for the better informed more active users.
37
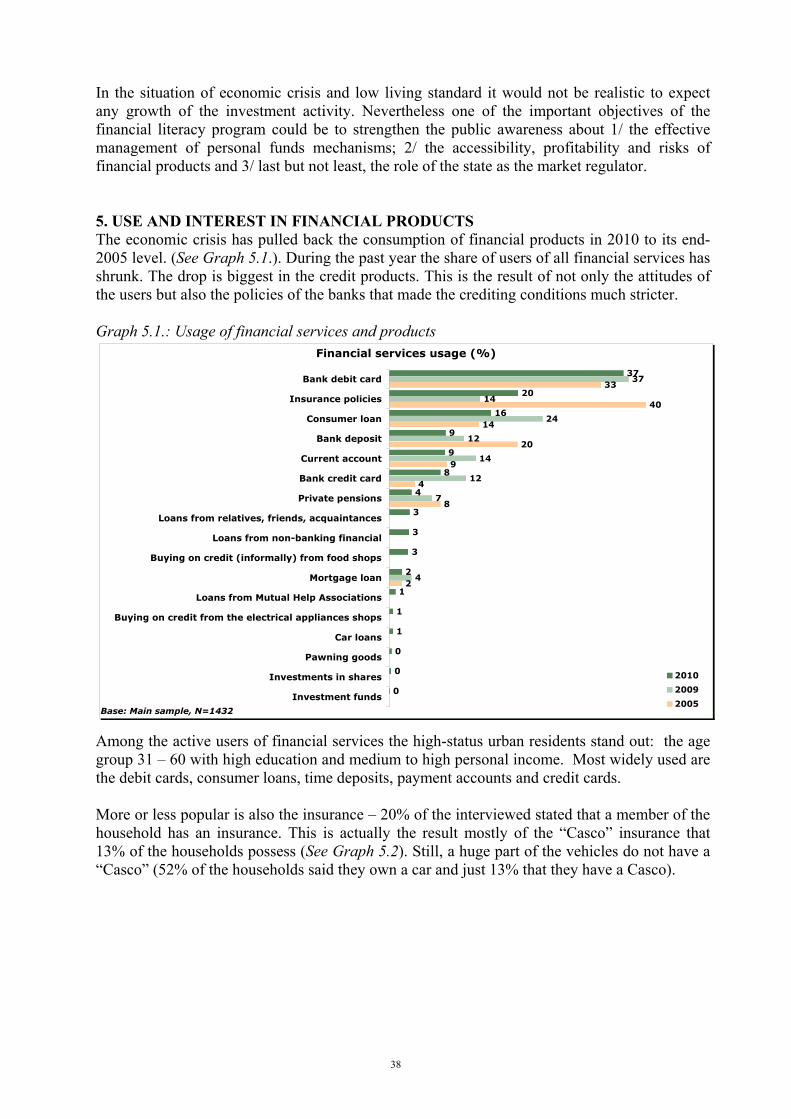
In the situation of economic crisis and low living standard it would not be realistic to expect any growth of the investment activity. Nevertheless one of the important objectives of the financial literacy program could be to strengthen the public awareness about 1/ the effective management of personal funds mechanisms; 2/ the accessibility, profitability and risks of financial products and 3/ last but not least, the role of the state as the market regulator. 5. USE AND INTEREST IN FINANCIAL PRODUCTS The economic crisis has pulled back the consumption of financial products in 2010 to its end-2005 level. (See Graph 5.1.). During the past year the share of users of all financial services has shrunk. The drop is biggest in the credit products. This is the result of not only the attitudes of the users but also the policies of the banks that made the crediting conditions much stricter. Graph 5.1.: Usage of financial services and products
Financial services usage (%)
2
8
4
9
20
14
40
33
4
7
12
14
12
24
14
37
0
0
0
1
1
1
2
3
3
3
4
8
9
9
16
20
37
Investment funds
Investments in shares
Pawning goods
Car loans
Buying on credit from the electrical appliances shops
Loans from Mutual Help Associations
Mortgage loan
Buying on credit (informally) from food shops
Loans from non-banking financial
Loans from relatives, friends, acquaintances
Private pensions
Bank credit card
Current account
Bank deposit
Consumer loan
Insurance policies
Bank debit card
Base: Main sample, N=1432
2010
2009
2005
Among the active users of financial services the high-status urban residents stand out: the age group 31 – 60 with high education and medium to high personal income. Most widely used are the debit cards, consumer loans, time deposits, payment accounts and credit cards. More or less popular is also the insurance – 20% of the interviewed stated that a member of the household has an insurance. This is actually the result mostly of the “Casco” insurance that 13% of the households possess (See Graph 5.2). Still, a huge part of the vehicles do not have a “Casco” (52% of the households said they own a car and just 13% that they have a Casco).
38
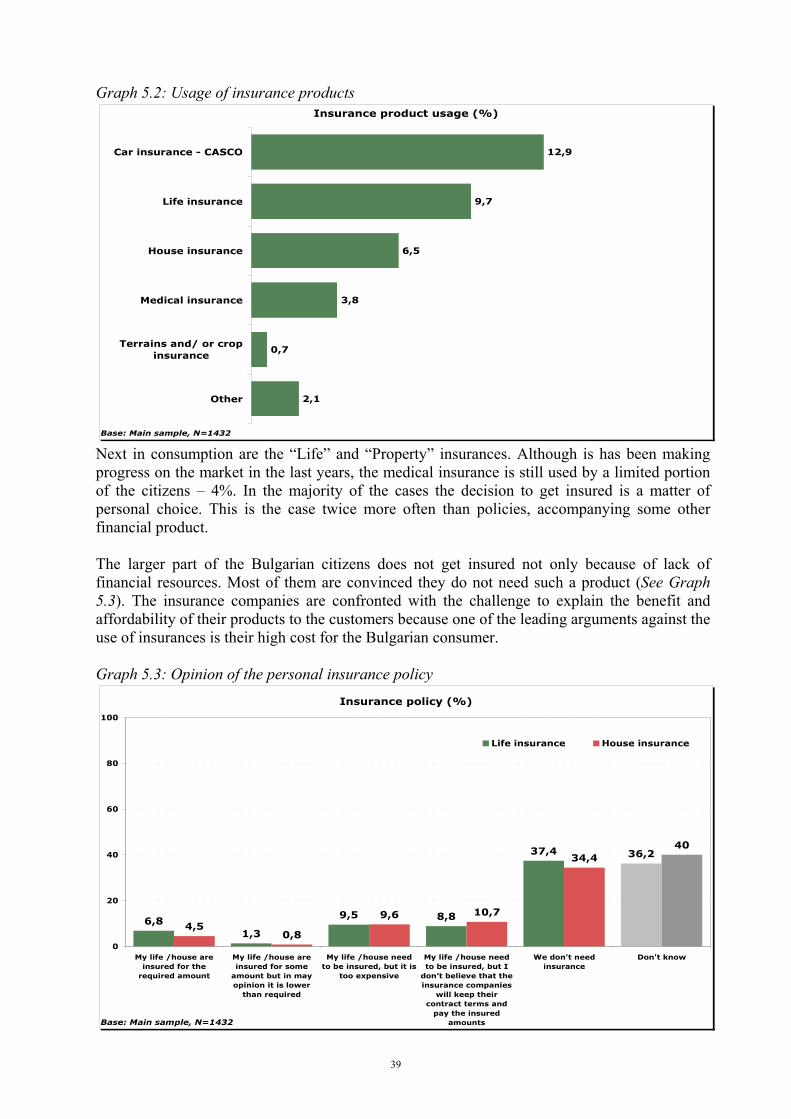
Graph 5.2: Usage of insurance products Insurance product usage (%)
2,1
0,7
3,8
6,5
9,7
12,9
Other
Terrains and/ or cropinsurance
Medical insurance
House insurance
Life insurance
Car insurance - CASCO
Base: Main sample, N=1432 Next in consumption are the “Life” and “Property” insurances. Although is has been making progress on the market in the last years, the medical insurance is still used by a limited portion of the citizens – 4%. In the majority of the cases the decision to get insured is a matter of personal choice. This is the case twice more often than policies, accompanying some other financial product. The larger part of the Bulgarian citizens does not get insured not only because of lack of financial resources. Most of them are convinced they do not need such a product (See Graph 5.3). The insurance companies are confronted with the challenge to explain the benefit and affordability of their products to the customers because one of the leading arguments against the use of insurances is their high cost for the Bulgarian consumer. Graph 5.3: Opinion of the personal insurance policy
Insurance policy (%)
6,81,3
9,5 8,8
37,4 36,2
4,50,8
9,6 10,7
34,440
0
20
40
60
80
100
My life /house areinsured for the
required amount
My life /house areinsured for some
amount but in mayopinion it is lower
than required
My life /house needto be insured, but it is
too expensive
My life /house needto be insured, but I
don�’t believe that theinsurance companies
will keep theircontract terms and
pay the insuredamounts
We don't needinsurance
Don't know
Base: Main sample, N=1432
Life insurance House insurance
39
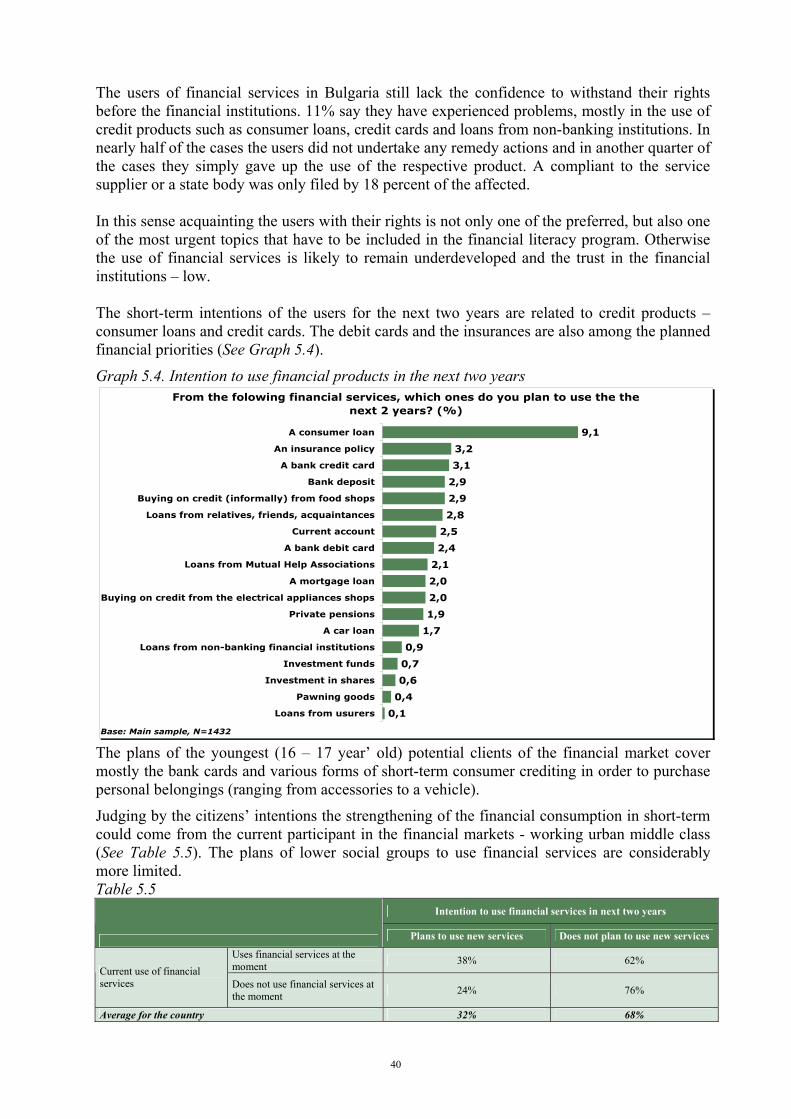
The users of financial services in Bulgaria still lack the confidence to withstand their rights before the financial institutions. 11% say they have experienced problems, mostly in the use of credit products such as consumer loans, credit cards and loans from non-banking institutions. In nearly half of the cases the users did not undertake any remedy actions and in another quarter of the cases they simply gave up the use of the respective product. A compliant to the service supplier or a state body was only filed by 18 percent of the affected. In this sense acquainting the users with their rights is not only one of the preferred, but also one of the most urgent topics that have to be included in the financial literacy program. Otherwise the use of financial services is likely to remain underdeveloped and the trust in the financial institutions – low. The short-term intentions of the users for the next two years are related to credit products – consumer loans and credit cards. The debit cards and the insurances are also among the planned financial priorities (See Graph 5.4).
Graph 5.4. Intention to use financial products in the next two years From the folowing financial services, which ones do you plan to use the the
next 2 years? (%)
0,1
0,4
0,6
0,7
0,9
1,7
1,9
2,0
2,0
2,1
2,4
2,5
2,8
2,9
2,9
3,1
3,2
9,1
Loans from usurers
Pawning goods
Investment in shares
Investment funds
Loans from non-banking financial institutions
A car loan
Private pensions
Buying on credit from the electrical appliances shops
A mortgage loan
Loans from Mutual Help Associations
A bank debit card
Current account
Loans from relatives, friends, acquaintances
Buying on credit (informally) from food shops
Bank deposit
A bank credit card
An insurance policy
A consumer loan
Base: Main sample, N=1432 The plans of the youngest (16 – 17 year’ old) potential clients of the financial market cover mostly the bank cards and various forms of short-term consumer crediting in order to purchase personal belongings (ranging from accessories to a vehicle).
Judging by the citizens’ intentions the strengthening of the financial consumption in short-term could come from the current participant in the financial markets - working urban middle class (See Table 5.5). The plans of lower social groups to use financial services are considerably more limited. Table 5.5
Intention to use financial services in next two years
Plans to use new services Does not plan to use new services
Uses financial services at the moment 38% 62%
Current use of financial services Does not use financial services at
the moment 24% 76%
Average for the country 32% 68%
40
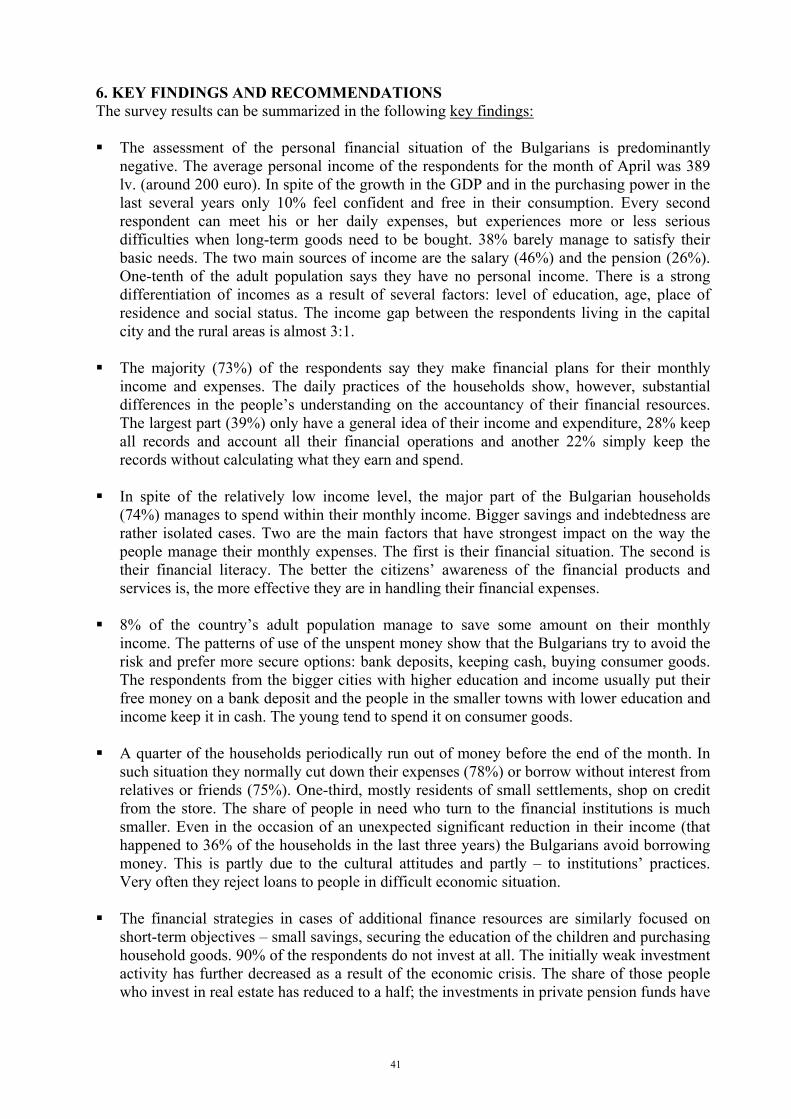
6. KEY FINDINGS AND RECOMMENDATIONS The survey results can be summarized in the following key findings: The assessment of the personal financial situation of the Bulgarians is predominantly
negative. The average personal income of the respondents for the month of April was 389 lv. (around 200 euro). In spite of the growth in the GDP and in the purchasing power in the last several years only 10% feel confident and free in their consumption. Every second respondent can meet his or her daily expenses, but experiences more or less serious difficulties when long-term goods need to be bought. 38% barely manage to satisfy their basic needs. The two main sources of income are the salary (46%) and the pension (26%). One-tenth of the adult population says they have no personal income. There is a strong differentiation of incomes as a result of several factors: level of education, age, place of residence and social status. The income gap between the respondents living in the capital city and the rural areas is almost 3:1.
The majority (73%) of the respondents say they make financial plans for their monthly income and expenses. The daily practices of the households show, however, substantial differences in the people’s understanding on the accountancy of their financial resources. The largest part (39%) only have a general idea of their income and expenditure, 28% keep all records and account all their financial operations and another 22% simply keep the records without calculating what they earn and spend.
In spite of the relatively low income level, the major part of the Bulgarian households (74%) manages to spend within their monthly income. Bigger savings and indebtedness are rather isolated cases. Two are the main factors that have strongest impact on the way the people manage their monthly expenses. The first is their financial situation. The second is their financial literacy. The better the citizens’ awareness of the financial products and services is, the more effective they are in handling their financial expenses.
8% of the country’s adult population manage to save some amount on their monthly income. The patterns of use of the unspent money show that the Bulgarians try to avoid the risk and prefer more secure options: bank deposits, keeping cash, buying consumer goods. The respondents from the bigger cities with higher education and income usually put their free money on a bank deposit and the people in the smaller towns with lower education and income keep it in cash. The young tend to spend it on consumer goods.
A quarter of the households periodically run out of money before the end of the month. In
such situation they normally cut down their expenses (78%) or borrow without interest from relatives or friends (75%). One-third, mostly residents of small settlements, shop on credit from the store. The share of people in need who turn to the financial institutions is much smaller. Even in the occasion of an unexpected significant reduction in their income (that happened to 36% of the households in the last three years) the Bulgarians avoid borrowing money. This is partly due to the cultural attitudes and partly – to institutions’ practices. Very often they reject loans to people in difficult economic situation.
The financial strategies in cases of additional finance resources are similarly focused on short-term objectives – small savings, securing the education of the children and purchasing household goods. 90% of the respondents do not invest at all. The initially weak investment activity has further decreased as a result of the economic crisis. The share of those people who invest in real estate has reduced to a half; the investments in private pension funds have
41
shrunk from 5% to 1% and only the share of people with life insurance has remained more or less unchanged (5%).
The economic crisis has also decreased the overall consumption of financial services, which
has dropped back to its end-2005 level. In April 2010 54% of the population use some financial service. More active users are the residents of the bigger cities in the age group 31 – 60, with higher education and medium to high personal income. The short-term intentions for the next two years are mostly for renewed use of bank credit products – consumer loans (9%), insurances and credit cards (3%), followed by debit cards (2.4%).
In spite of the positive trend in the last five years, the trust in the main financial institutions
remains relatively low. A large part of the Bulgarians, especially the young generations, is not familiar with the activity of either the private financial institutions or the state regulatory bodies in the field. The only institution that enjoys stable trust (37%) is the BNB. Among the private institutions relatively the most popular and best trusted are the banks, followed by the insurance companies. The greatest is the distrust to the pawn shops.
The people’s estimation of the quality of services offered by the financial institutions
depend on the level they use them and they are aware of them. The most popular and best trusted are the services of the banks and insurance companies. The negative opinions of the services and products of leasing and securities companies, the private pension funds and the consumer crediting institutions prevail the positive ones two to three times. Between 42% and 52% of the general population and between 59% and 82% of the young people do not know them at all. The survey results show that, those who are excluded from the financial service market are more distrustful and critical in their attitude.
Regardless of the declared distrust to most financial institutions and the Bulgarian economy in general, the expectations for stability of the Bulgarian currency (lev), and for the development of the financial markets remain positive. The attitudes to the market development of banks and insurance companies are predominantly optimistic. The fears are biggest towards the capital market and the non-banking financial institutions. Compared with five years ago, the confidence in the recovery and development of the markets most affected by the crisis – private pension funds and the capital market – is seriously shuttered. From expectations for growth and development they have converged into estimations of stagnation and decline.
An indirect indicator of trust to the most developed and used financial sector, the banking, is the fact that the main factors for respondents when choosing a financial institution are the specific conditions it offers (64%). The reputation (fame) of the institution that during the years of bankruptcies and instability of the banking system were leading factors are now lagging far behind with about 4 time lower percentages.
Judging by the current citizens’ intentions and plans, any short-term increase of the
financial consumption would come mostly from the people with medium and higher status living in the urban areas and to a much lesser extent from the inclusion in this market of the poor, low educated and low qualified residents of the smaller towns and villages. The fact however that 25% of those not using any financial services intend to use such in the years to come shows, that the financial education of the “new users” is particularly important in order to strengthen their opportunities to use financial services without risking the financial stability of their families.
42
The self-assessment of the Bulgarian citizens of their financial literacy is predominantly negative (27% say they have unsatisfactory knowledge and skills in this matter and 20% declare they have no at all). More than 60% of the residents of villages, the eldest population and the younger generations (16-17), the less educated, low qualified and unemployed assess their financial knowledge as very poor. The objective indicators measuring the financial literacy correspond to this assessment. Only 2% of the interviewed were able to give correct answers to all the eight questions aiming to check the basic financial literacy of the population. The majority of the interviewed have the skills to calculate a more profitable discount (66%) and a simply interest amount (53%), but calculating a complex interest on a deposit or a loan creates serious difficulties for most of the respondents. Furthermore, although in the last five years the number of people aware of the role of the state in guaranteeing the bank deposits has increased, their proportion remains relatively low (increase from 17% to 21%).
The majority of the respondents are not familiar with their rights when using financial services. The poor knowledge goes hand in hand with the distrust in the adequate reaction of the institutions to an emerging problem. 39% of the people are not convinced their problem could find a fast solution, and 40% it could find a fair solution. Of the opposite opinion are 2.5 times less persons. Therefore half of those who had encountered a problem did not undertake any action and a quarter simply gave up on the product. A complaint to the service provider or to a state body was filed by 18 percent of the affected.
The low awareness and trust of the Bulgarian citizens towards the financial institutions and services justify the necessity for a financial literacy program. Depending on the interest in the tested financial topics three priority areas were outlined: 1/ Topics related to basic financial knowledge – household budgeting, planning a loan, consumer rights, the opportunities of bank services, principles of the pension system etc. A broad group of citizens are interested in the above topics, mostly people with a lower economic and educational status, not using actively any financial services; 2/ Information about specific products and services. Interest in them was demonstrated by the urban residents, employees, people with medium income and status, using some financial services who would like to develop their consumption. 3/ Acquiring skills for financial goal-setting and planning, private pension funds, opportunities to join the capital market. The latter are the focus of the citizens with the best knowledge of financial matters. For them the participation on this market is a form of investment.
The main sources of information used by the Bulgarian citizens are: television (90%), radio stations (35%), newspapers (20%), and for 16-17 year’ old internet (74% - use it every day versus 29% for the main sample). In spite of the fast penetration of the world wide web in the country (its users have increased from 24% to 44% in five years), the huge part of the people with poor financial literacy, coming from the low-status social groups, do not use computers and internet and only pay attention to the television.
Bulgarians are not active in the search of specific financial information. 35% never discuss financial services with friends and relatives. The financial institutions are as well not active in informing the people of their services and products. 57% have never talked with bank officers and 83% - with insurance agents.
For the majority of the Bulgarians the financial information is too specialized and difficult to understand. Therefore, depending on the specific cases and needs, they use different sources of information. Thus for example those 53% of the Bulgarians who follow some
43

financial trends (mostly the fluctuations in the taxes, securities, pensions and inflation rate and, to a lesser extent, interest rates on loans and deposits), use mainly the media. When information about financial services is needed, the people prefer the brochures of the financial institutions and for a choice of a bank or other institution – “the advice of friends and relatives”.
The absence of clear information preferences is evident in the people’s opinions of which will be the most appropriate training institution to implement a financial literacy program. The broad public has preference for the media and the state regulatory institutions, while the citizens more knowledgeable of financial matters are more in favor of the higher education institutions and independent financial consultants.
44
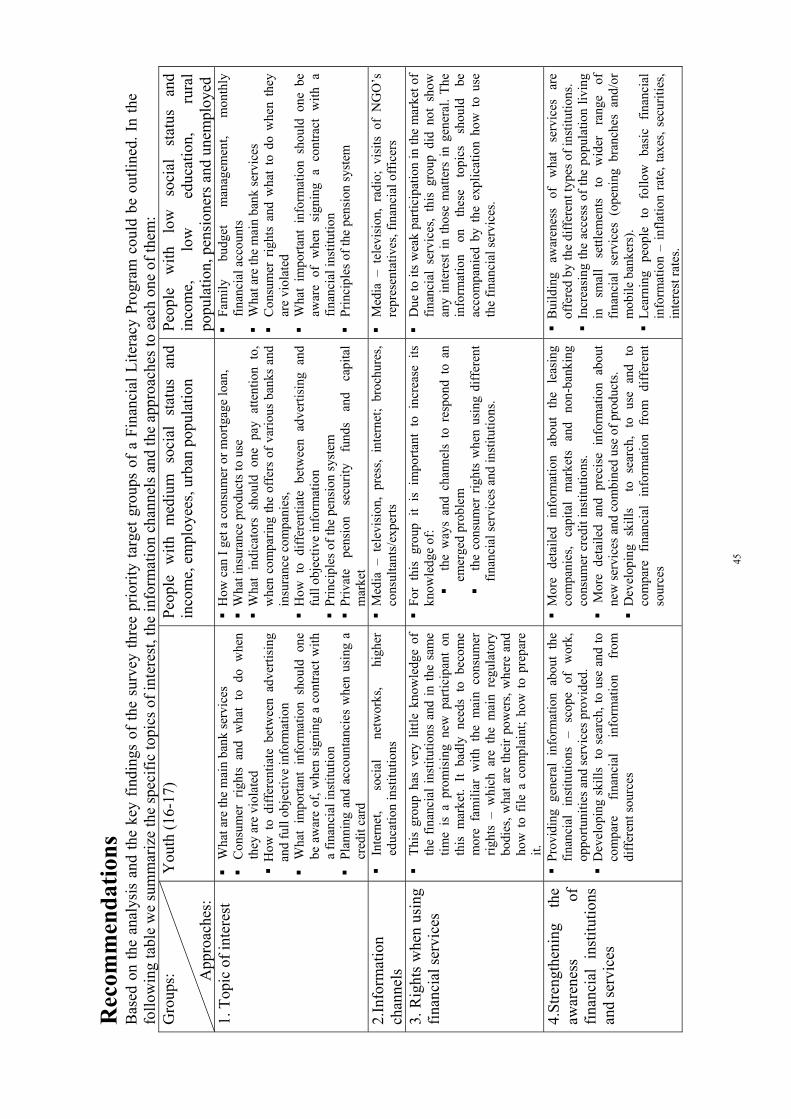
Rec
omm
enda
tions
B
ased
on
the
anal
ysis
and
the
key
findi
ngs
of th
e su
rvey
thre
e pr
iorit
y ta
rget
gro
ups
of a
Fin
anci
al L
itera
cy P
rogr
am c
ould
be
outli
ned.
In
the
follo
win
g ta
ble
we
sum
mar
ize
the
spec
ific
topi
cs o
f int
eres
t, th
e in
form
atio
n ch
anne
ls a
nd th
e ap
proa
ches
to e
ach
one
of th
em:
Gro
ups:
App
roac
hes:
You
th (1
6-17
) Pe
ople
with
med
ium
so
cial
st
atus
an
d in
com
e, e
mpl
oyee
s, ur
ban
popu
latio
n
Peop
le
with
lo
w
soci
al
stat
us
and
inco
me,
lo
w
educ
atio
n,
rura
l po
pula
tion,
pen
sion
ers a
nd u
nem
ploy
ed
1. T
opic
of i
nter
est
W
hat a
re th
e m
ain
bank
serv
ices
Con
sum
er r
ight
s an
d w
hat
to d
o w
hen
they
are
vio
late
d
How
to
diff
eren
tiate
bet
wee
n ad
verti
sing
an
d fu
ll ob
ject
ive
info
rmat
ion
Wha
t im
porta
nt i
nfor
mat
ion
shou
ld o
ne
be a
war
e of
, whe
n si
gnin
g a
cont
ract
with
a
finan
cial
inst
itutio
n
Plan
ning
and
acc
ount
anci
es w
hen
usin
g a
cred
it ca
rd
How
can
I ge
t a c
onsu
mer
or m
ortg
age
loan
, W
hat i
nsur
ance
pro
duct
s to
use
W
hat
indi
cato
rs s
houl
d on
e pa
y at
tent
ion
to,
whe
n co
mpa
ring
the
offe
rs o
f var
ious
ban
ks a
nd
insu
ranc
e co
mpa
nies
, H
ow t
o di
ffer
entia
te b
etw
een
adve
rtisi
ng a
nd
full
obje
ctiv
e in
form
atio
n
Prin
cipl
es o
f the
pen
sion
syst
em
Priv
ate
pens
ion
secu
rity
fund
s an
d ca
pita
l m
arke
t
Fa
mily
bu
dget
m
anag
emen
t, m
onth
ly
finan
cial
acc
ount
s
Wha
t are
the
mai
n ba
nk se
rvic
es
C
onsu
mer
rig
hts
and
wha
t to
do
whe
n th
ey
are
viol
ated
Wha
t im
porta
nt i
nfor
mat
ion
shou
ld o
ne b
e aw
are
of w
hen
sign
ing
a co
ntra
ct w
ith a
fin
anci
al in
stitu
tion
Pr
inci
ples
of t
he p
ensi
on sy
stem
2.In
form
atio
n ch
anne
ls
In
tern
et,
soci
al
netw
orks
, hi
gher
ed
ucat
ion
inst
itutio
ns
Med
ia –
tel
evis
ion,
pre
ss,
inte
rnet
; br
ochu
res,
cons
ulta
nts/
expe
rts
M
edia
– t
elev
isio
n, r
adio
; vi
sits
of
NG
O’s
re
pres
enta
tives
, fin
anci
al o
ffic
ers
3. R
ight
s w
hen
usin
g fin
anci
al se
rvic
es
Th
is g
roup
has
ver
y lit
tle k
now
ledg
e of
th
e fin
anci
al in
stitu
tions
and
in th
e sa
me
time
is a
pro
mis
ing
new
par
ticip
ant
on
this
mar
ket.
It ba
dly
need
s to
bec
ome
mor
e fa
mili
ar w
ith t
he m
ain
cons
umer
rig
hts
– w
hich
are
the
mai
n re
gula
tory
bo
dies
, wha
t are
thei
r pow
ers,
whe
re a
nd
how
to
file
a co
mpl
aint
; ho
w t
o pr
epar
e it.
For
thi
s gr
oup
it is
im
porta
nt t
o in
crea
se i
ts
know
ledg
e of
:
the
way
s an
d ch
anne
ls t
o re
spon
d to
an
emer
ged
prob
lem
the
cons
umer
rig
hts
whe
n us
ing
diff
eren
t fin
anci
al se
rvic
es a
nd in
stitu
tions
.
D
ue to
its
wea
k pa
rtici
patio
n in
the
mar
ket o
f fin
anci
al s
ervi
ces,
this
gro
up d
id n
ot s
how
an
y in
tere
st in
thos
e m
atte
rs in
gen
eral
. The
in
form
atio
n on
th
ese
topi
cs
shou
ld
be
acco
mpa
nied
by
the
expl
icat
ion
how
to
use
the
finan
cial
serv
ices
.
4.St
reng
then
ing
the
awar
enes
s of
fin
anci
al i
nstit
utio
ns
and
serv
ices
Pro
vidi
ng g
ener
al i
nfor
mat
ion
abou
t th
e fin
anci
al
inst
itutio
ns
– sc
ope
of
wor
k,
oppo
rtuni
ties a
nd se
rvic
es p
rovi
ded.
D
evel
opin
g sk
ills
to s
earc
h, to
use
and
to
com
pare
fin
anci
al
info
rmat
ion
from
di
ffer
ent s
ourc
es
Mor
e de
taile
d in
form
atio
n ab
out
the
leas
ing
com
pani
es,
capi
tal
mar
kets
an
d no
n-ba
nkin
g co
nsum
er c
redi
t ins
titut
ions
.
Mor
e de
taile
d an
d pr
ecis
e in
form
atio
n ab
out
new
serv
ices
and
com
bine
d us
e of
pro
duct
s. D
evel
opin
g sk
ills
to
sear
ch,
to u
se a
nd t
o co
mpa
re f
inan
cial
inf
orm
atio
n fr
om d
iffer
ent
sour
ces
Bui
ldin
g aw
aren
ess
of
wha
t se
rvic
es
are
offe
red
by th
e di
ffer
ent t
ypes
of i
nstit
utio
ns.
Inc
reas
ing
the
acce
ss o
f the
pop
ulat
ion
livin
g in
sm
all
settl
emen
ts
to
wid
er
rang
e of
fin
anci
al s
ervi
ces
(ope
ning
bra
nche
s an
d/or
m
obile
ban
kers
). L
earn
ing
peop
le t
o fo
llow
bas
ic f
inan
cial
in
form
atio
n –
infla
tion
rate
, tax
es, s
ecur
ities
, in
tere
st ra
tes.
45
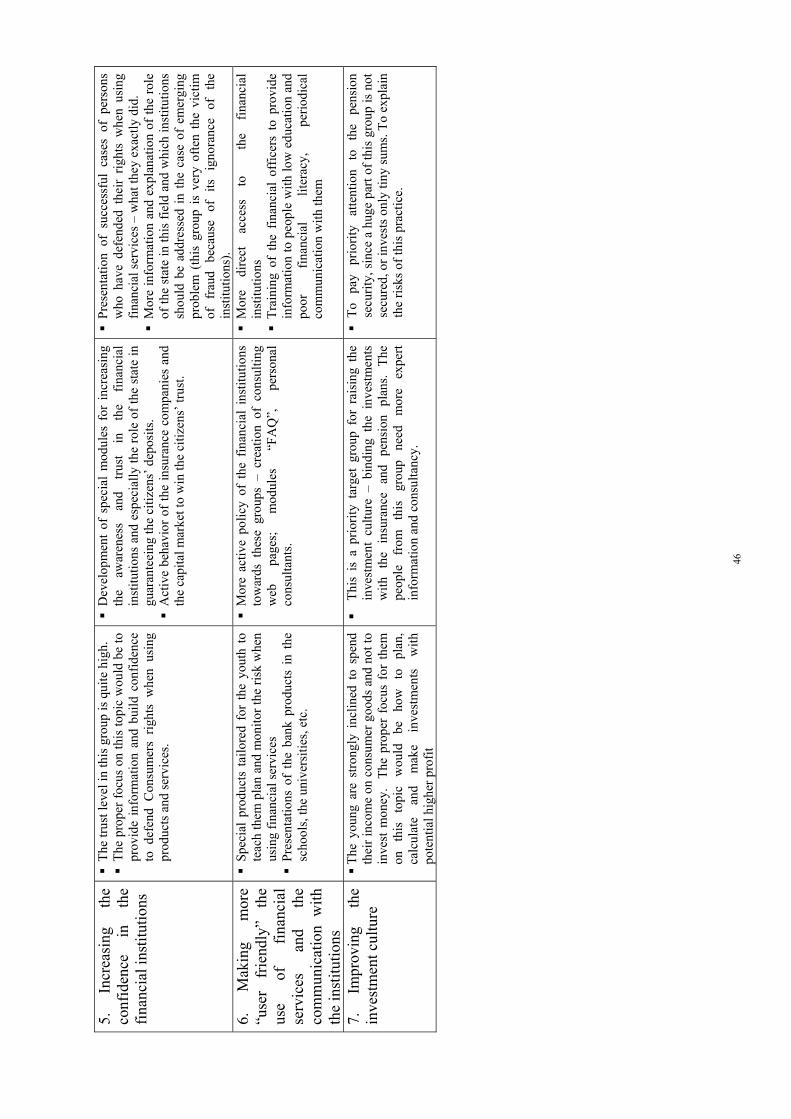
5.
Incr
easi
ng
the
conf
iden
ce
in
the
finan
cial
inst
itutio
ns
The
trus
t lev
el in
this
gro
up is
qui
te h
igh.
T
he p
rope
r foc
us o
n th
is to
pic
wou
ld b
e to
pr
ovid
e in
form
atio
n an
d bu
ild c
onfid
ence
to
def
end
Con
sum
ers
right
s w
hen
usin
g pr
oduc
ts a
nd se
rvic
es.
Dev
elop
men
t of
spe
cial
mod
ules
for
inc
reas
ing
the
awar
enes
s an
d tru
st
in
the
finan
cial
in
stitu
tions
and
esp
ecia
lly th
e ro
le o
f the
sta
te in
gu
aran
teei
ng th
e ci
tizen
s’ d
epos
its.
Act
ive
beha
vior
of t
he in
sura
nce
com
pani
es a
nd
the
capi
tal m
arke
t to
win
the
citiz
ens’
trus
t.
Pre
sent
atio
n of
suc
cess
ful
case
s of
per
sons
w
ho h
ave
defe
nded
the
ir rig
hts
whe
n us
ing
finan
cial
serv
ices
– w
hat t
hey
exac
tly d
id.
Mor
e in
form
atio
n an
d ex
plan
atio
n of
the
role
of
the
stat
e in
this
fiel
d an
d w
hich
inst
itutio
ns
shou
ld b
e ad
dres
sed
in th
e ca
se o
f em
ergi
ng
prob
lem
(th
is g
roup
is
very
ofte
n th
e vi
ctim
of
fra
ud b
ecau
se o
f its
ign
oran
ce o
f th
e in
stitu
tions
). 6.
M
akin
g m
ore
“use
r fr
iend
ly”
the
use
of
finan
cial
se
rvic
es
and
the
com
mun
icat
ion
with
th
e in
stitu
tions
Spe
cial
pro
duct
s ta
ilore
d fo
r th
e yo
uth
to
teac
h th
em p
lan
and
mon
itor t
he ri
sk w
hen
usin
g fin
anci
al se
rvic
es
Pre
sent
atio
ns o
f th
e ba
nk p
rodu
cts
in t
he
scho
ols,
the
univ
ersi
ties,
etc.
Mor
e ac
tive
polic
y of
the
fin
anci
al i
nstit
utio
ns
tow
ards
the
se g
roup
s –
crea
tion
of c
onsu
lting
w
eb
page
s;
mod
ules
“F
AQ
”,
pers
onal
co
nsul
tant
s.
Mor
e di
rect
ac
cess
to
the
finan
cial
in
stitu
tions
T
rain
ing
of t
he f
inan
cial
off
icer
s to
pro
vide
in
form
atio
n to
peo
ple
with
low
edu
catio
n an
d po
or
finan
cial
lit
erac
y,
perio
dica
l co
mm
unic
atio
n w
ith th
em
7.
Impr
ovin
g th
e in
vest
men
t cul
ture
T
he y
oung
are
stro
ngly
inc
lined
to
spen
d th
eir i
ncom
e on
con
sum
er g
oods
and
not
to
inve
st m
oney
. Th
e pr
oper
foc
us f
or th
em
on
this
to
pic
wou
ld
be
how
to
pl
an,
calc
ulat
e an
d m
ake
inve
stm
ents
w
ith
pote
ntia
l hig
her p
rofit
Th
is i
s a
prio
rity
targ
et g
roup
for
rai
sing
the
in
vest
men
t cu
lture
– b
indi
ng t
he i
nves
tmen
ts
with
the
ins
uran
ce a
nd p
ensi
on p
lans
. Th
e pe
ople
fr
om
this
gr
oup
need
m
ore
expe
rt in
form
atio
n an
d co
nsul
tanc
y.
To
pay
prio
rity
atte
ntio
n to
th
e pe
nsio
n se
curit
y, si
nce
a hu
ge p
art o
f thi
s gro
up is
not
se
cure
d, o
r inv
ests
onl
y tin
y su
ms.
To e
xpla
in
the
risks
of t
his p
ract
ice.
46

ANEXES
47
48
Interview operator name and signature
........ Voting section: |__|__|__||__|__|__| Position on the sampling list: |__|__|__| Interview date: |__|__| |__|__| 2010 Interview start time: |__|__|:|__|__|
Interview result |___| RI 1 interview accepted 2 refusal 3 person who is not in the locality the entire month 4 person who is abroad 5 person who is in the locality but could not be contacted after 3 visits 6 person who is impossible to be contacted (ex. deceased) 7 empty dwellings 8 other situation, namely............................
Financial literacy and financial services in Bulgaria
NRCHEST |__|__|__|__|__| Use the questionnaire number from the sampling list
May-June 2010
Q45. As a whole, how satisfied are you with your life nowadays?
Very satisfied Rather satisfied Rather dissatisfied Very dissatisfied know
4 3 2 1 9 Q46. How do you think your life is going to be over the next 12 months?
Much better
Better The same Worse Much worse know
5 4 3 2 1 9
Daily Few times a week
Few times a month
Once a month or less
Never
P1. read the national newspapers 4 3 2 1 0 P1a. read the local newspapers 4 3 2 1 0 P2. listen to the national radio stations 4 3 2 1 0 P2a. listen to the local radio stations 4 3 2 1 0 P3. watch the national TV programs 4 3 2 1 0 P3a. watch the local TV programs 4 3 2 1 0 PP6. Do you know to use a computer? 1. Yes 2. No
For those who know to use the computer (Code 1 at PP6)
Daily Few times a week
Few times a month
Once a month or less Never
P6. use the Internet (including e-mail)
4 3 2 1 0

49
A) Attitudes and opinions regarding the financial market
Very much Much Average Little Very little know
T1. Commercial banks operating in Bulgaria 5 4 3 2 1 9 T2. Insurance companies 5 4 3 2 1 9 T3. Securities companies 5 4 3 2 1 9 T4. Mutual Help Associations 5 4 3 2 1 9 T5. Leasing companies 5 4 3 2 1 9 T6. Pawn shops 5 4 3 2 1 9 T7. Private pension funds 5 4 3 2 1 9 T8. Consumer credit companies (e.g. Jet Credit, T.B.I, etc.) 5 4 3 2 1 9
T9. Other, non-banking financial institutions 5 4 3 2 1 9 T9. The Bulgarian economy 5 4 3 2 1 9
T10. Bulgarian National Bank 5 4 3 2 1 9 T11. Financial Supervision Commission 5 4 3 2 1 9 T12. Consumer Protection Commission 5 4 3 2 1 9 T13. Bulgarian Deposit Insurance Fund 5 4 3 2 1 9 T14. The lev, the national currency 5 4 3 2 1 9 Generally, the quality of financial products services offered by the financial institutions
Very good Good Fair Bad Very bad know
AO1. Commercial banks operating in Bulgaria 5 4 3 2 1 9 AO2. Insurance companies 5 4 3 2 1 9 AO3. Mutual Help Associations 5 4 3 2 1 9 AO4. Securities companies 5 4 3 2 1 9 AO5. Private pension funds 5 4 3 2 1 9 A06. Leasing companies 5 4 3 2 1 9 A07. Consumer credit companies (e.g. Jet Credit, T.B.I, etc.) 5 4 3 2 1 9
What are your expectations to the
It will remain stable and develop in a positive direction
No change Destabilization and negative development
know
BG1. Banking sector in Bulgaria 1 2 3 BG2. Private Pension Funds 1 2 3 BG3. Insurance companies 1 2 3 BG4. The capital market 1 2 3 BG5. Consumer credit companies (e.g. Jet Credit, T.B.I, etc.) 1 2 3
50
BG5. Who would you complain to, if you have a problem with your bank? Multiple response
1. To the bank management 2. To a representative of the system of justice 3. To Bulgarian National Bank 4. To the Bank Deposits Guarantee Fund 5. To the Association of Banks in Bulgaria 6. To the Consumer Protection Commission 7. To the Financial Supervision Commission 8. To the Payments Conciliation Committee 9. To some other state institution 10. To the media 11. Other (please 12. I will not complain to anyone
AO8. If a conflict with a financial organization (bank, insurance company or the like) arises regarding the provision of financial services to you, how sure are you in the quick and just resolution of the dispute? A. in short time |__| B. correctly |__| Use the corresponding code from the scale
5. I am completely sure 4. I am rather sure 3. Fifty-fifty 2. I am not quite sure 1. I am not at all sure
A09. What do you think deserves primary attention when one has to compare between the credit institutions to choose the one where to take a credit from?
A.Bank B.Leasing company
C.Consumer Credit Company
1. Reputation (fame) 1 1 1 2. View of the office 2 2 2 3. The way the personnel treat you 3 3 3 4. Credit interest rate and the credit cost 4 4 4 5. Gifts and advertising campaigns 5 5 5 6. Other.................................................. 6 6 6 9.
One answer only
9 9 9
AO10. If you considered taking a credit from a bank, what would you prefer? Do not read answer 3
1. A credit in lev 2. A credit in a foreign currency
AO11. When taking a credit from a bank, what would you give more importance to...? Do not read answer 5
1. Commissions charged by the bank 2. Credit interest rates 3. Both, commissions charged by the bank and credit interest rates 4. Annual Percentage Rate
credit
51
AO12. When do you think buying on credit is justified? Here the credit refers to the use of a credit card, the use of a consumer credit or buying on credit (informally -
1. If a shop has sales for the goods you need 2. If a person needs to pay for education which would allow to get a better paid job 3. If a person really needs a vacation but does not have money at the moment 4. Other, namely.......................................................
Do not read
B) Information on Financial Services
ISF1. What tendencies from the ones given below you follow personally?
Yes No
If Yes ISF1a. What is the main source of information:
1. Advertising 2.Newspapers, magazines, TV programs specializing on financial issues 3. Specialized web sites 4. Bank officers, employees of insurance and management companies, during a personal visit or by phone 5. Independent financial consultants or brokers 6. Friends and acquaintances
ISF1X. |__| ISF1Y. |__|
a. Changes in the property market 1 2 b. Changes of quotations and indices in the capital market 1 2 c. Changes of interest rates on deposits 1 2 d. Changes of interest rates on credits 1 2 e. Changes in the inflation rate 1 2 f. Changes in the level of public pensions, benefits and tax exemptions 1 2
g. Price fluctuations for oil, gold, metals, etc. 1 2
ISF2. Are you aware of the Consumer Protection Commission activity concerning financial services? 1. Yes 2. No 9.
know
ISF3. During the last 12 months, how many visits / personal contacts or through phone did you have with...?
Daily Few times a week
Few times a month
Once a month or less Never
a. bank officers or bankers 4 3 2 1 0 b. representatives of insurance companies / private pension fund 4 3 2 1 0
c. representatives of securities companies (for share deals) 4 3 2 1 0
d. independent financial advisers or brokers 4 3 2 1 0 e. representatives of a non-banking financial institution , such as Jetcredit or T.B.I. Credit 4 3 2 1 0
f. pawn houses personnel 4 3 2 1 0
ISF4. When you meet your relatives, colleagues, friends, how often do you talk about financial institutions and services?
Daily Few times a week
Few times a month
Once a month or less Never
4 3 2 1 0 ISF5. In the last five years, how often do you compare the terms and conditions for provision of financial services by various companies before you buy such a service?
4. Always 3. Sometimes 2. Rarely 1. Never 97. I do not use any
financial service Do not read
99. know
52
ISF6. In the last five years, what sources of information do you pay attention to when choosing a company to buy a service from (pension plan, investment, savings, credit, etc.)? Multiple Response
1. Advertisements 7. Advice of friends and relatives 2. Information materials of financial companies on their tariffs and services of various types 8. Internet resources
3. Advice of consultants working for providers of a required service 9. Education programs on the radio and television
4. Recommendations of independent financial consultants or brokers 10. Specialized information center/ call center
5. Analytical materials published in mass media 11. Other.........................................
BG8. How would you prefer to receive information on financial matters? Multiple Response
1. Advertisements 7. Advice of friends and relatives 2. Information materials of financial companies on their tariffs and services of various types 8. Internet resources
3. Advice of consultants working for providers of a required service 9. Education programs on the radio and television
4. Recommendations of independent financial consultants or brokers 10. Specialized information center/ call center
5. Analytical materials published in mass media 11. Other.........................................
C) Financial literacy CSF1. Do you consider yourself a financially literate person?
5. Excellent knowledge and
skills
4. Good knowledge and
skills
3. Satisfactory knowledge and
skills
2. Unsatisfactory knowledge and
skills
1. No knowledge and
skills 9.
CSF2. lev in a bank account at 8% annual interest rate. How much money will you have in your account in 2 years if you do not withdraw from or add to this account any money?
1. More than 18,000 BGN 2. Exactly 18,000 BGN 3. Less than 18,000 BGN 9.
CSF3. lev in a bank account at 10% annual interest rate. The interest will be earned at the end of each year and will be added to the principal. How much money will you have in your account in 5 years if you do not withdraw either the principal or the interest?
1. More than 15,000 BGN 2. Exactly 15,000 BGN 3. Less than 15,000 BGN 9. CSF4. Imagine, than you deposited the money in a bank account at 8% interest rate, while the annual inflation rate was 10%. Do you think the money from your account can buy more or less, or the same amount of goods and services on average now as a year ago?
1. More than a year ago 2. The same 3. Less than a year ago 9.
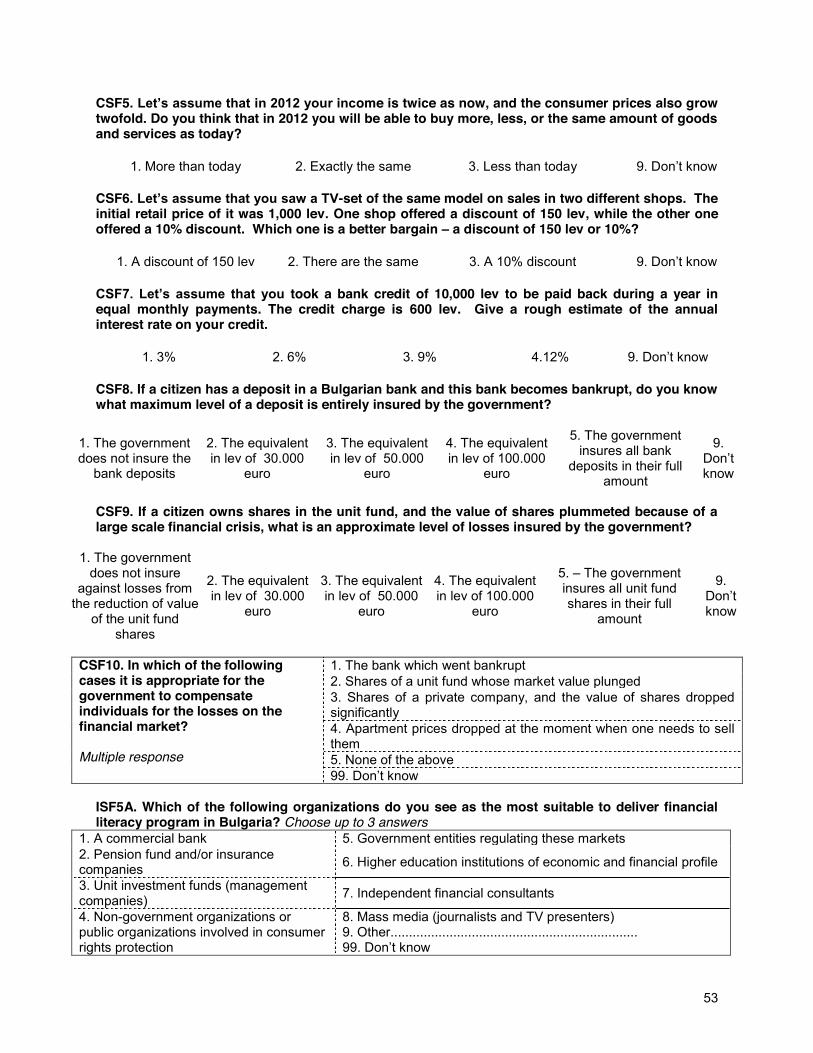
53
CSF5. ome is twice as now, and the consumer prices also grow twofold. Do you think that in 2012 you will be able to buy more, less, or the same amount of goods and services as today?
1. More than today 2. Exactly the same 3. Less than today 9. CSF6. -set of the same model on sales in two different shops. The initial retail price of it was 1,000 lev. One shop offered a discount of 150 lev, while the other one offered a 10% discount. Which one is a better bargain a discount of 150 lev or 10%?
1. A discount of 150 lev 2. There are the same 3. A 10% discount 9.
took a bank credit of 10,000 lev to be paid back during a year in equal monthly payments. The credit charge is 600 lev. Give a rough estimate of the annual interest rate on your credit.
1. 3% 2. 6% 3. 9% 4.12% 9. CSF8. If a citizen has a deposit in a Bulgarian bank and this bank becomes bankrupt, do you know what maximum level of a deposit is entirely insured by the government?
1. The government does not insure the
bank deposits
2. The equivalent in lev of 30.000
euro
3. The equivalent in lev of 50.000
euro
4. The equivalent in lev of 100.000
euro
5. The government insures all bank
deposits in their full amount
9.
know
CSF9. If a citizen owns shares in the unit fund, and the value of shares plummeted because of a large scale financial crisis, what is an approximate level of losses insured by the government?
1. The government does not insure
against losses from the reduction of value
of the unit fund shares
2. The equivalent in lev of 30.000
euro
3. The equivalent in lev of 50.000
euro
4. The equivalent in lev of 100.000
euro
5. The government insures all unit fund shares in their full
amount
9.
know
CSF10. In which of the following cases it is appropriate for the government to compensate individuals for the losses on the financial market? Multiple response
1. The bank which went bankrupt 2. Shares of a unit fund whose market value plunged 3. Shares of a private company, and the value of shares dropped significantly 4. Apartment prices dropped at the moment when one needs to sell them 5. None of the above 99
ISF5A. Which of the following organizations do you see as the most suitable to deliver financial literacy program in Bulgaria? Choose up to 3 answers
1. A commercial bank 5. Government entities regulating these markets 2. Pension fund and/or insurance companies 6. Higher education institutions of economic and financial profile
3. Unit investment funds (management companies) 7. Independent financial consultants
4. Non-government organizations or public organizations involved in consumer rights protection
8. Mass media (journalists and TV presenters) 9. Other...................................................................
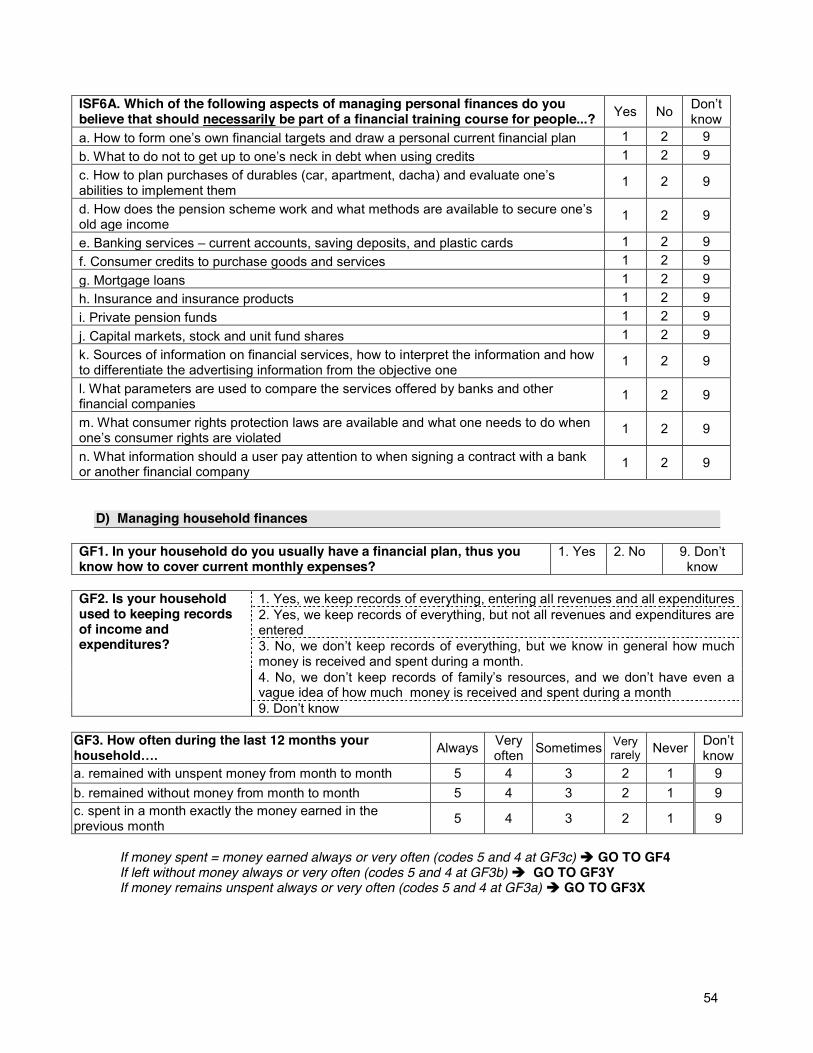
54
ISF6A. Which of the following aspects of managing personal finances do you believe that should necessarily be part of a financial training course for people...? Yes No know
1 2 9 1 2 9
c. How to plan purchases of durables (car, apartment, dachaabilities to implement them
1 2 9
d. old age income
1 2 9
e. Banking services current accounts, saving deposits, and plastic cards 1 2 9 f. Consumer credits to purchase goods and services 1 2 9 g. Mortgage loans 1 2 9 h. Insurance and insurance products 1 2 9 i. Private pension funds 1 2 9 j. Capital markets, stock and unit fund shares 1 2 9 k. Sources of information on financial services, how to interpret the information and how to differentiate the advertising information from the objective one
1 2 9
l. What parameters are used to compare the services offered by banks and other financial companies
1 2 9
m. What consumer rights protection laws are available and what one needs to do when
1 2 9
n. What information should a user pay attention to when signing a contract with a bank or another financial company
1 2 9
D) Managing household finances
GF1. In your household do you usually have a financial plan, thus you know how to cover current monthly expenses?
1. Yes 2. No 9. know
GF2. Is your household used to keeping records of income and expenditures?
1. Yes, we keep records of everything, entering all revenues and all expenditures 2. Yes, we keep records of everything, but not all revenues and expenditures are entered
money is received and spent during a month. 4. No, we vague idea of how much money is received and spent during a month
GF3. How often during the last 12 months your Always Very
often Sometimes Very rarely Never know
a. remained with unspent money from month to month 5 4 3 2 1 9 b. remained without money from month to month 5 4 3 2 1 9 c. spent in a month exactly the money earned in the previous month 5 4 3 2 1 9
If money spent = money earned always or very often (codes 5 and 4 at GF3c) GO TO GF4 If left without money always or very often (codes 5 and 4 at GF3b) GO TO GF3Y If money remains unspent always or very often (codes 5 and 4 at GF3a) GO TO GF3X
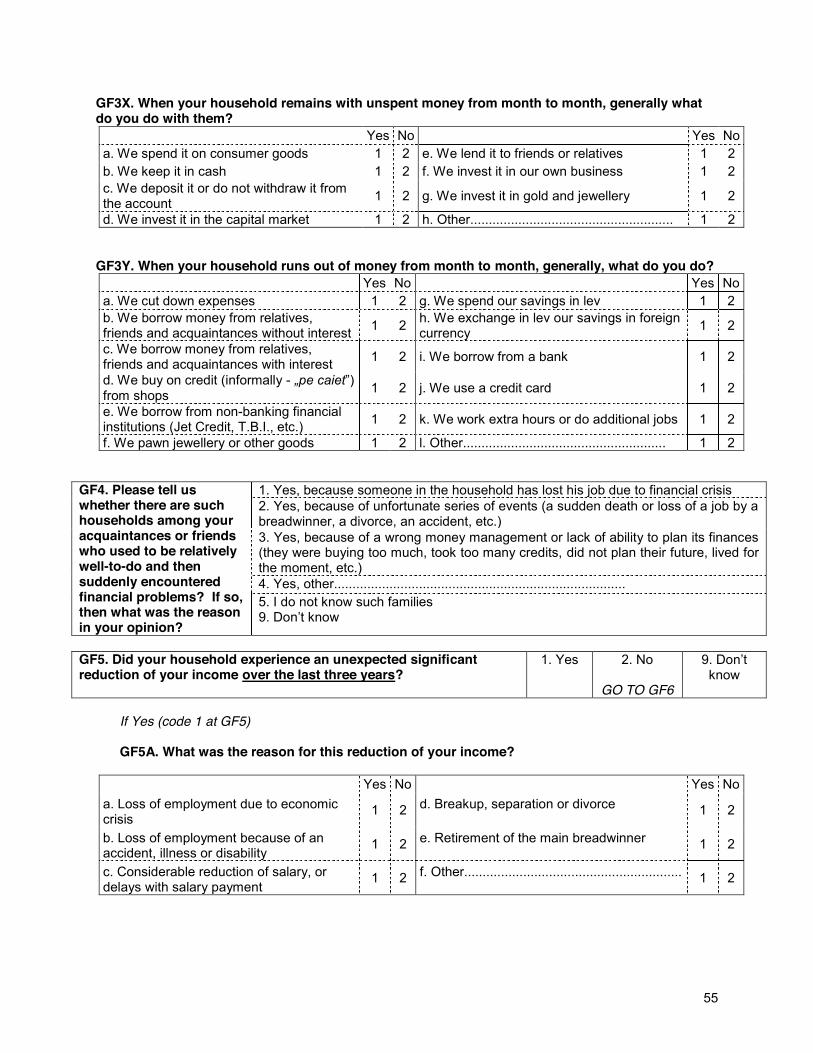
55
GF3X. When your household remains with unspent money from month to month, generally what do you do with them? Yes No Yes No a. We spend it on consumer goods 1 2 e. We lend it to friends or relatives 1 2 b. We keep it in cash 1 2 f. We invest it in our own business 1 2 c. We deposit it or do not withdraw it from the account 1 2 g. We invest it in gold and jewellery 1 2
d. We invest it in the capital market 1 2 h. Other....................................................... 1 2 GF3Y. When your household runs out of money from month to month, generally, what do you do? Yes No Yes No a. We cut down expenses 1 2 g. We spend our savings in lev 1 2 b. We borrow money from relatives, friends and acquaintances without interest 1 2 h. We exchange in lev our savings in foreign
currency 1 2
c. We borrow money from relatives, friends and acquaintances with interest 1 2 i. We borrow from a bank 1 2
d. We buy on credit (informally - from shops 1 2 j. We use a credit card 1 2
e. We borrow from non-banking financial institutions (Jet Credit, T.B.I., etc.) 1 2 k. We work extra hours or do additional jobs 1 2
f. We pawn jewellery or other goods 1 2 l. Other....................................................... 1 2
GF4. Please tell us whether there are such households among your acquaintances or friends who used to be relatively well-to-do and then suddenly encountered financial problems? If so, then what was the reason in your opinion?
1. Yes, because someone in the household has lost his job due to financial crisis 2. Yes, because of unfortunate series of events (a sudden death or loss of a job by a breadwinner, a divorce, an accident, etc.) 3. Yes, because of a wrong money management or lack of ability to plan its finances (they were buying too much, took too many credits, did not plan their future, lived for the moment, etc.) 4. Yes, other............................................................................... 5. I do not know such families
GF5. Did your household experience an unexpected significant reduction of your income over the last three years?
1. Yes 2. No
GO TO GF6
9. know
If Yes (code 1 at GF5) GF5A. What was the reason for this reduction of your income?
Yes No Yes No a. Loss of employment due to economic crisis
1 2 d. Breakup, separation or divorce 1 2
b. Loss of employment because of an accident, illness or disability
1 2 e. Retirement of the main breadwinner 1 2
c. Considerable reduction of salary, or delays with salary payment
1 2 f. Other........................................................... 1 2
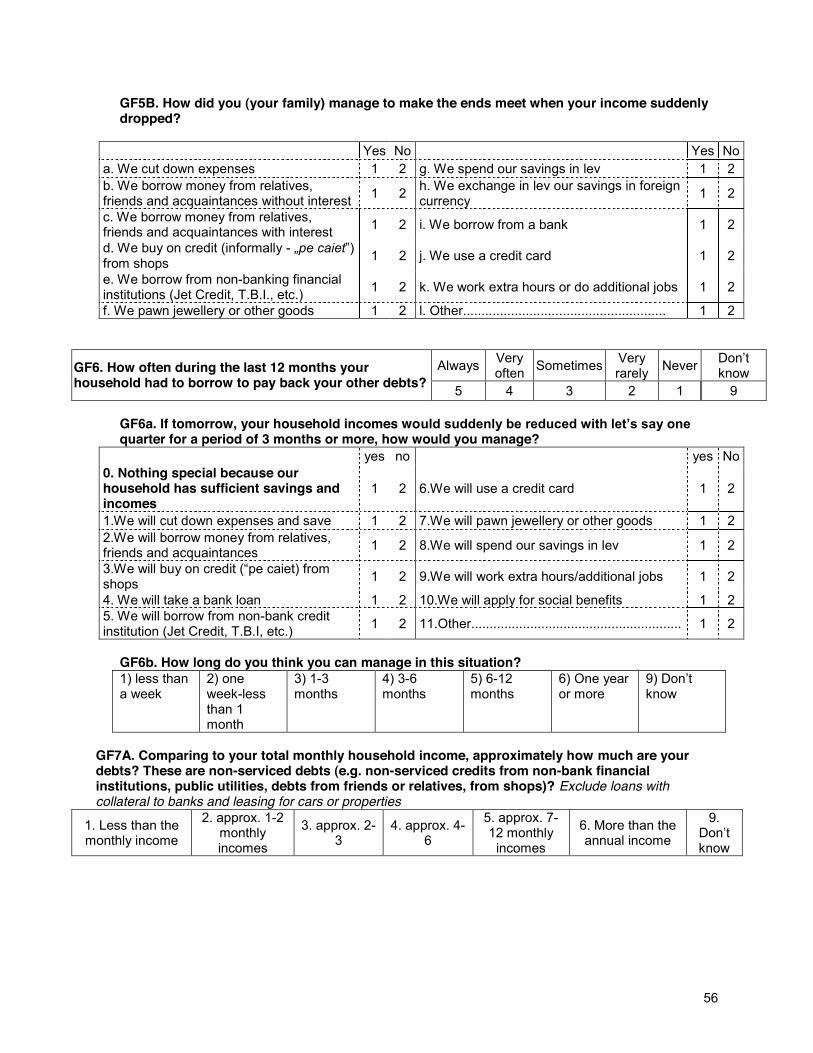
56
GF5B. How did you (your family) manage to make the ends meet when your income suddenly dropped?
Yes No Yes No a. We cut down expenses 1 2 g. We spend our savings in lev 1 2 b. We borrow money from relatives, friends and acquaintances without interest 1 2 h. We exchange in lev our savings in foreign
currency 1 2
c. We borrow money from relatives, friends and acquaintances with interest 1 2 i. We borrow from a bank 1 2
d. We buy on credit (informally - ) from shops 1 2 j. We use a credit card 1 2
e. We borrow from non-banking financial institutions (Jet Credit, T.B.I., etc.) 1 2 k. We work extra hours or do additional jobs 1 2
f. We pawn jewellery or other goods 1 2 l. Other....................................................... 1 2
GF6. How often during the last 12 months your household had to borrow to pay back your other debts?
Always Very often Sometimes Very
rarely Never know 5 4 3 2 1 9
GF6a. If tomorrow, your household incomes woquarter for a period of 3 months or more, how would you manage?
yes no yes No 0. Nothing special because our household has sufficient savings and incomes
1 2 6.We will use a credit card 1 2
1.We will cut down expenses and save 1 2 7.We will pawn jewellery or other goods 1 2 2.We will borrow money from relatives, friends and acquaintances 1 2 8.We will spend our savings in lev 1 2
shops 1 2 9.We will work extra hours/additional jobs 1 2
4. We will take a bank loan 1 2 10.We will apply for social benefits 1 2 5. We will borrow from non-bank credit institution (Jet Credit, T.B.I, etc.) 1 2 11.Other......................................................... 1 2
GF6b. How long do you think you can manage in this situation? 1) less than a week
2) one week-less than 1 month
3) 1-3 months
4) 3-6 months
5) 6-12 months
6) One year or more
9) know
GF7A. Comparing to your total monthly household income, approximately how much are your debts? These are non-serviced debts (e.g. non-serviced credits from non-bank financial institutions, public utilities, debts from friends or relatives, from shops)? Exclude loans with collateral to banks and leasing for cars or properties
1. Less than the monthly income
2. approx. 1-2 monthly incomes
3. approx. 2-3
4. approx. 4-6
5. approx. 7-12 monthly
incomes
6. More than the annual income
9.
know
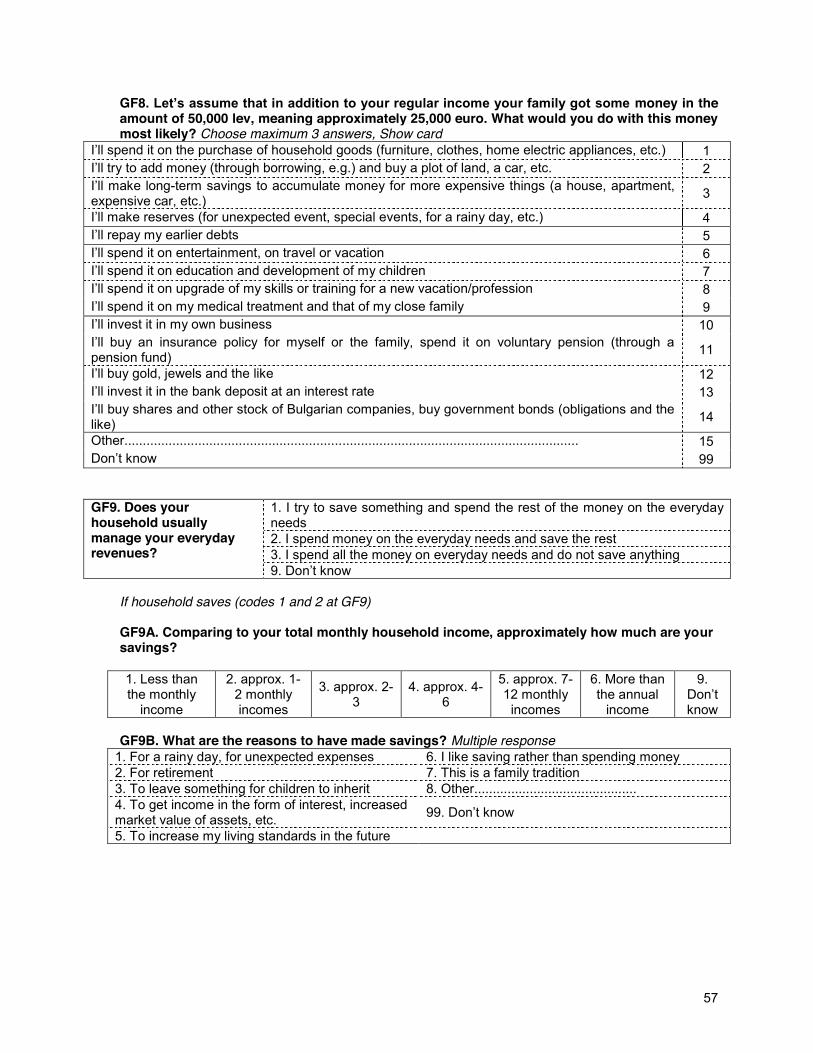
57
GF8. money in the amount of 50,000 lev, meaning approximately 25,000 euro. What would you do with this money most likely? Choose maximum 3 answers, Show card
1 2
-term savings to accumulate money for more expensive things (a house, apartment, expensive car, etc.) 3
ial events, for a rainy day, etc.) 4 5
6 7
on/profession 8 9
10
pension fund) 11
ewels and the like 12 13
like) 14
Other........................................................................................................................... 15 99
GF9. Does your household usually manage your everyday revenues?
1. I try to save something and spend the rest of the money on the everyday needs 2. I spend money on the everyday needs and save the rest 3. I spend all the money on everyday needs and do not save anything
If household saves (codes 1 and 2 at GF9) GF9A. Comparing to your total monthly household income, approximately how much are your savings? 1. Less than the monthly
income
2. approx. 1-2 monthly incomes
3. approx. 2-3
4. approx. 4-6
5. approx. 7-12 monthly
incomes
6. More than the annual
income
9.
know GF9B. What are the reasons to have made savings? Multiple response
1. For a rainy day, for unexpected expenses 6. I like saving rather than spending money 2. For retirement 7. This is a family tradition 3. To leave something for children to inherit 8. Other............................................ 4. To get income in the form of interest, increased market value of assets, etc. 99.
5. To increase my living standards in the future
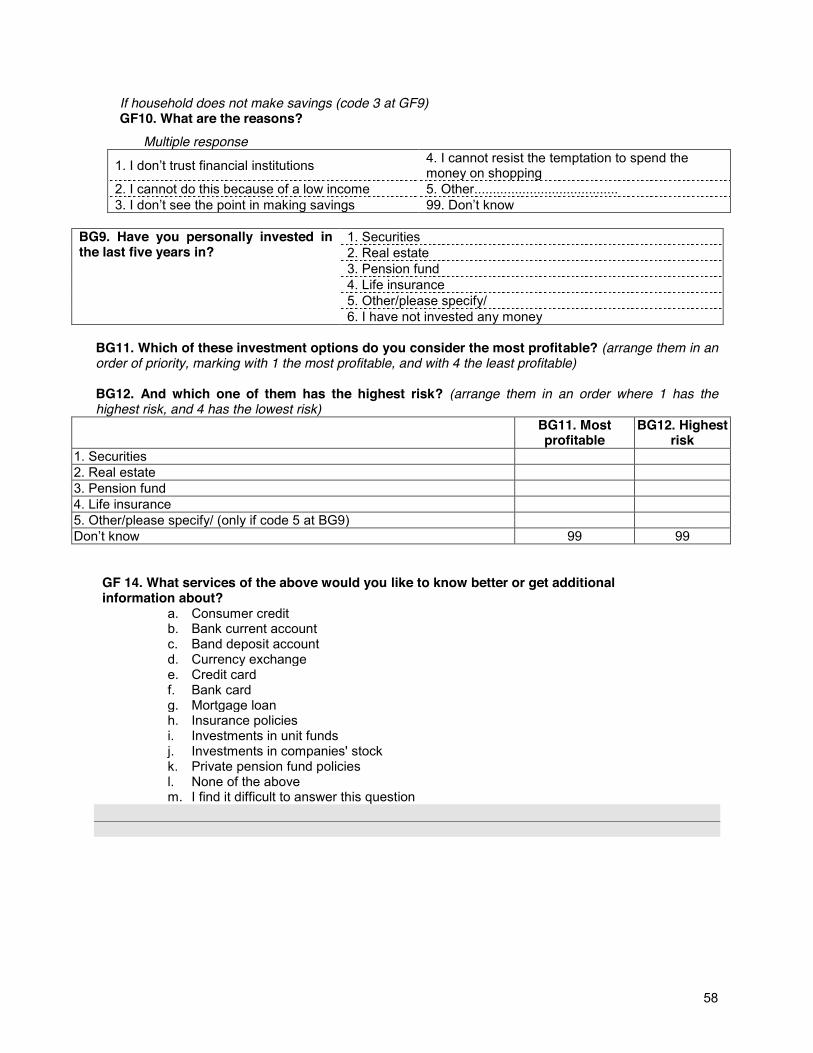
58
If household does not make savings (code 3 at GF9) GF10. What are the reasons?
Multiple response
financial institutions 4. I cannot resist the temptation to spend the money on shopping
2. I cannot do this because of a low income 5. Other.......................................
BG9. Have you personally invested in the last five years in?
1. Securities 2. Real estate 3. Pension fund 4. Life insurance 5. Other/please specify/ 6. I have not invested any money
BG11. Which of these investment options do you consider the most profitable? (arrange them in an order of priority, marking with 1 the most profitable, and with 4 the least profitable) BG12. And which one of them has the highest risk? (arrange them in an order where 1 has the highest risk, and 4 has the lowest risk)
BG11. Most profitable
BG12. Highest risk
1. Securities 2. Real estate 3. Pension fund 4. Life insurance 5. Other/please specify/ (only if code 5 at BG9) Don t know 99 99
GF 14. What services of the above would you like to know better or get additional information about?
a. Consumer credit b. Bank current account c. Band deposit account d. Currency exchange e. Credit card f. Bank card g. Mortgage loan h. Insurance policies i. Investments in unit funds j. Investments in companies' stock k. Private pension fund policies l. None of the above m. I find it difficult to answer this question
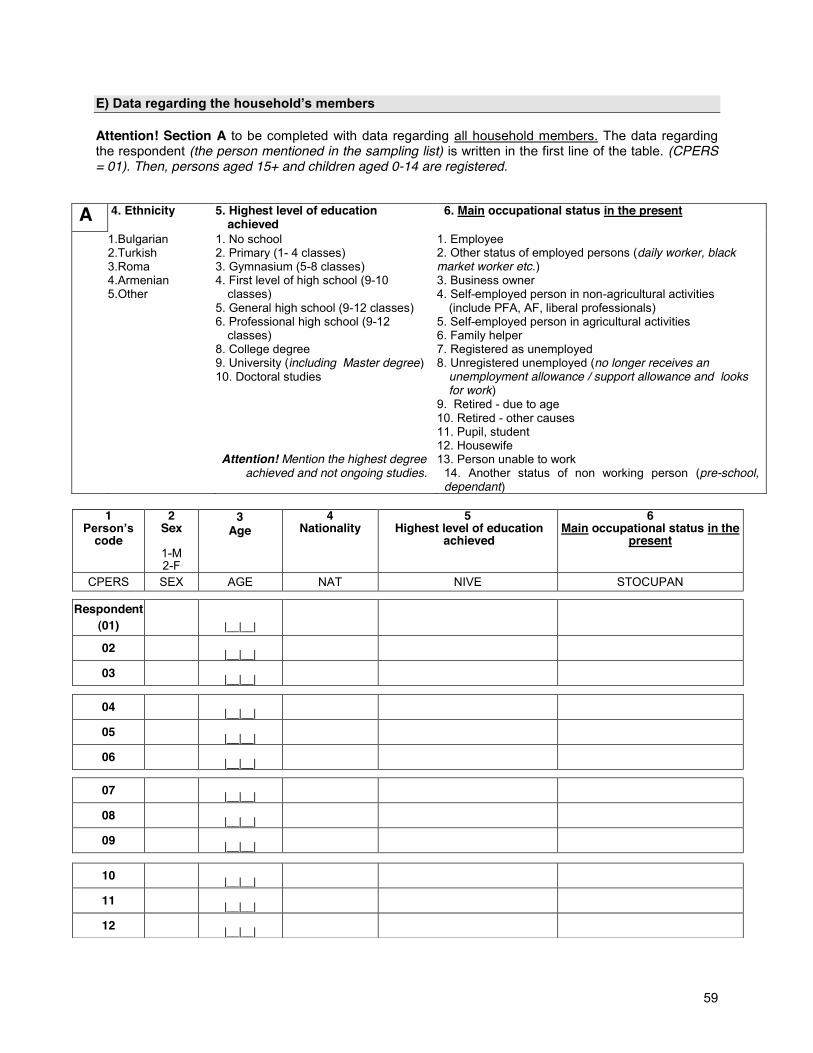
59
E) Attention! Section A to be completed with data regarding all household members. The data regarding the respondent (the person mentioned in the sampling list) is written in the first line of the table. (CPERS = 01). Then, persons aged 15+ and children aged 0-14 are registered.
A 4. Ethnicity 5. Highest level of education achieved
6. Main occupational status in the present
1.Bulgarian 2.Turkish 3.Roma 4.Armenian 5.Other
1. No school 2. Primary (1- 4 classes) 3. Gymnasium (5-8 classes) 4. First level of high school (9-10
classes) 5. General high school (9-12 classes) 6. Professional high school (9-12
classes) 8. College degree 9. University (including Master degree) 10. Doctoral studies
Attention! Mention the highest degree
achieved and not ongoing studies.
1. Employee 2. Other status of employed persons (daily worker, black market worker etc.) 3. Business owner 4. Self-employed person in non-agricultural activities
(include PFA, AF, liberal professionals) 5. Self-employed person in agricultural activities 6. Family helper 7. Registered as unemployed 8. Unregistered unemployed (no longer receives an
unemployment allowance / support allowance and looks for work)
9. Retired - due to age 10. Retired - other causes 11. Pupil, student 12. Housewife 13. Person unable to work
14. Another status of non working person (pre-school, dependant)
1
code
2 Sex
1-M 2-F
3 Age
4 Nationality
5 Highest level of education
achieved
6 Main occupational status in the
present
CPERS SEX AGE NAT NIVE STOCUPAN
Respondent (01)
|__|__|
02 |__|__|
03 |__|__|
04 |__|__|
05 |__|__|
06 |__|__|
07 |__|__|
08 |__|__|
09 |__|__|
10 |__|__|
11 |__|__|
12 |__|__|

60
Attention! Section B to be completed only for the persons aged 15+, members of the household.
B 7. Main occupation FOR PERSONS WITH OCCUPATION ONLY (codes 1 to 6, column 6)
1. Managers, business owners, entrepreneurs, mayor, local counsellor 2. Intellectual occupations: teacher, physician, economist, lawyer, etc. 3. Technicians or foremen: nurses, primary school teachers, accountant with secondary studies, etc. 4. Clerks: secretary, librarian, cashier etc. 5. Workers in services and commerce: train conductor, fire fighter, policeman etc. 6. qualified farmers or self-employed in agriculture 7. Craftsmen and maintenance mechanics: builders, carpenters, plumbers, electricians, painters, mechanics,
welders, blacksmiths, locksmith, textile workers, workers in the leather or food industry etc. 8. Skilled workers and operators 9. Unskilled workers in non-agricultural sectors: doormen, janitors, dustmen, sweepers, maid, etc. 10. Daily workers/black market workers in agriculture, silviculture and fishery 11. Daily workers/black market workers in non-agricultural activities 12. Military officer
1
code
7 Main occupation
8 Main source of
income
CPERS OCP VEN
Respondent (01)
02
03
04
05
06
07
08
09
10
11
12
8. Main source of income
0. No income 1. Salary/ wages (including wages for medical leave,
maternity leave and in-kind incomes) 3. Income from self-employed authorized non-agricultural activities (including profit, incomes from crafts, services, liberal professions, rights of intellectual property) 4. Daily paid or occasional incomes, inclusively black market employment 5. Old age pension 6. Disability, illness, veteran pension 7. Agricultural (CAP) pension 8. Unemployment/redundancy benefit 9. Scholarship 10. Child allowance 11. The minimum guaranteed income, social allowance 12. Other social transfers (incl. emergency benefits, allowance for fire wood, food, other assistance DPC) 13. Money received from relatives who work, permanently or temporarily, abroad 14. Private transfers (e.g. child support, donations from parents/ other persons) 15. Income from investments, savings or proprieties 16. Income from self-employment agricultural activities 17. Other
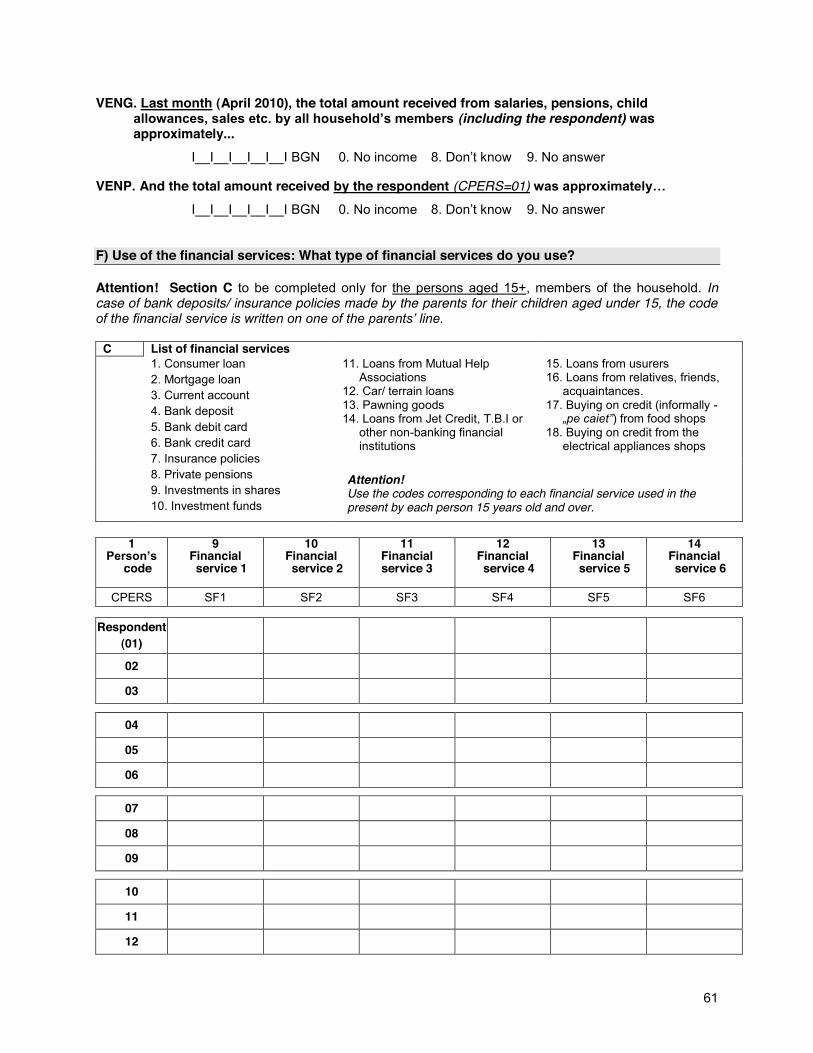
61
VENG. Last month (April 2010), the total amount received from salaries, pensions, child (including the respondent) was
approximately... I__I__I__I__I__I BGN 0. No income 8. 9. No answer VENP. And the total amount received by the respondent (CPERS=01) I__I__I__I__I__I BGN 0. No income 8. 9. No answer F) Use of the financial services: What type of financial services do you use? Attention! Section C to be completed only for the persons aged 15+, members of the household. In case of bank deposits/ insurance policies made by the parents for their children aged under 15, the code
C List of financial services 1. Consumer loan
2. Mortgage loan 3. Current account 4. Bank deposit 5. Bank debit card 6. Bank credit card 7. Insurance policies 8. Private pensions 9. Investments in shares 10. Investment funds
11. Loans from Mutual Help Associations
12. Car/ terrain loans 13. Pawning goods 14. Loans from Jet Credit, T.B.I or
other non-banking financial institutions
15. Loans from usurers 16. Loans from relatives, friends,
acquaintances. 17. Buying on credit (informally -
) from food shops 18. Buying on credit from the
electrical appliances shops
Attention! Use the codes corresponding to each financial service used in the
present by each person 15 years old and over.
1
code
9 Financial service 1
10 Financial service 2
11 Financial service 3
12 Financial service 4
13 Financial service 5
14 Financial service 6
CPERS SF1 SF2 SF3 SF4 SF5 SF6
Respondent (01)
02
03
04
05
06
07
08
09
10
11
12
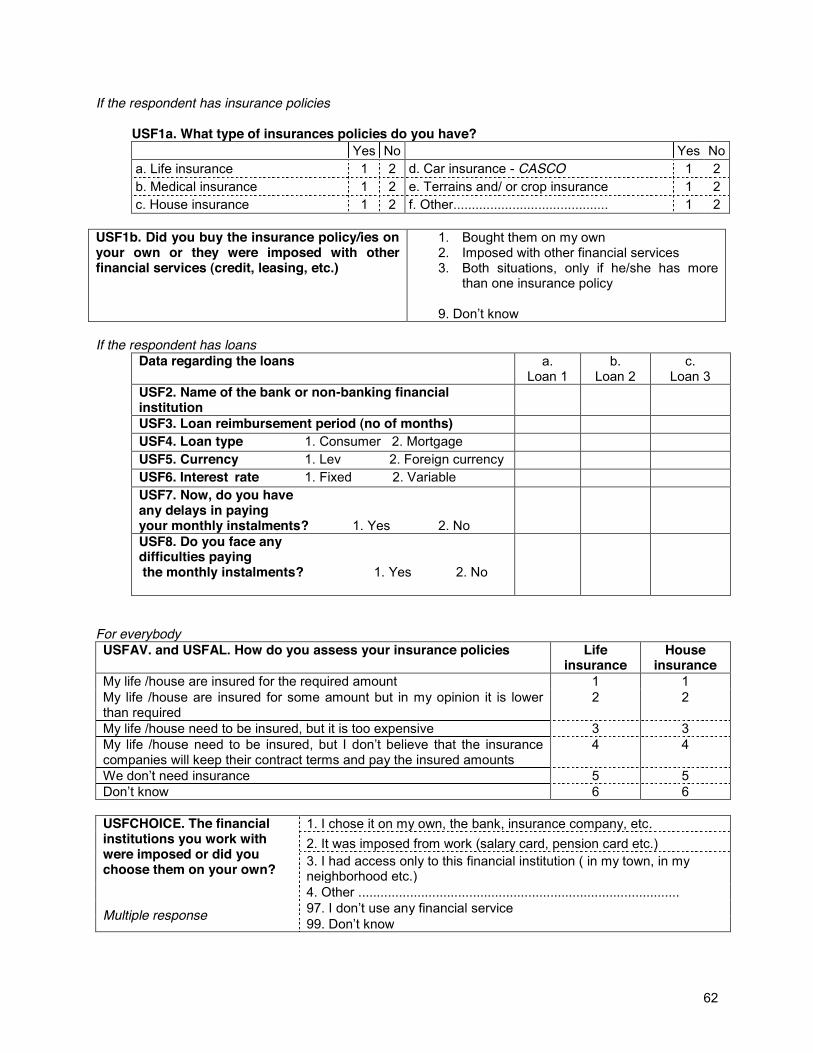
62
If the respondent has insurance policies USF1a. What type of insurances policies do you have? Yes No Yes No a. Life insurance 1 2 d. Car insurance - CASCO 1 2 b. Medical insurance 1 2 e. Terrains and/ or crop insurance 1 2 c. House insurance 1 2 f. Other.......................................... 1 2
USF1b. Did you buy the insurance policy/ies on your own or they were imposed with other financial services (credit, leasing, etc.)
1. Bought them on my own 2. Imposed with other financial services 3. Both situations, only if he/she has more
than one insurance policy
If the respondent has loans
Data regarding the loans a. Loan 1
b. Loan 2
c. Loan 3
USF2. Name of the bank or non-banking financial institution
USF3. Loan reimbursement period (no of months) USF4. Loan type 1. Consumer 2. Mortgage USF5. Currency 1. Lev 2. Foreign currency USF6. Interest rate 1. Fixed 2. Variable USF7. Now, do you have any delays in paying your monthly instalments? 1. Yes 2. No
USF8. Do you face any difficulties paying the monthly instalments? 1. Yes 2. No
For everybody USFAV. and USFAL. How do you assess your insurance policies Life
insurance House
insurance My life /house are insured for the required amount 1 1 My life /house are insured for some amount but in my opinion it is lower than required
2 2
My life /house need to be insured, but it is too expensive 3 3 My life /house need to be insured, but I companies will keep their contract terms and pay the insured amounts
4 4
5 5 6 6
USFCHOICE. The financial institutions you work with were imposed or did you choose them on your own?
Multiple response
1. I chose it on my own, the bank, insurance company, etc. 2. It was imposed from work (salary card, pension card etc.) 3. I had access only to this financial institution ( in my town, in my neighborhood etc.) 4. Other ....................................................................................... 97.
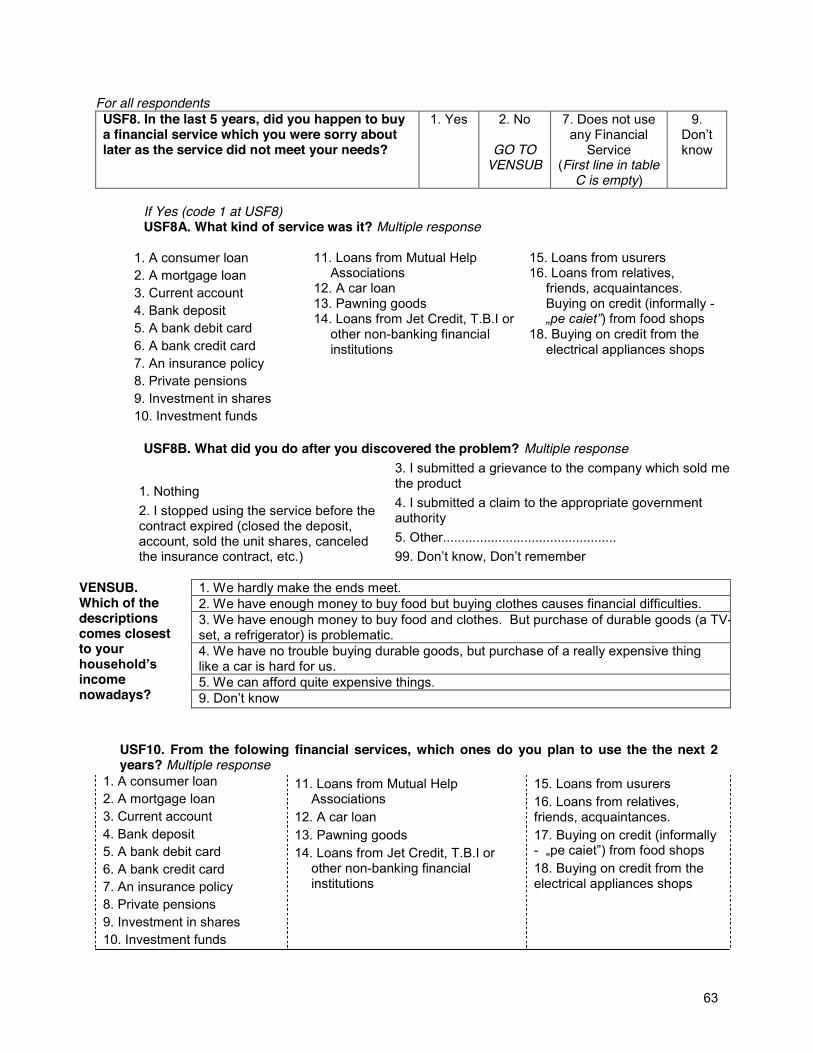
63
For all respondents USF8. In the last 5 years, did you happen to buy a financial service which you were sorry about later as the service did not meet your needs?
1. Yes 2. No
GO TO VENSUB
7. Does not use any Financial
Service (First line in table
C is empty)
9.
know
If Yes (code 1 at USF8) USF8A. What kind of service was it? Multiple response
1. A consumer loan 2. A mortgage loan 3. Current account 4. Bank deposit 5. A bank debit card 6. A bank credit card 7. An insurance policy 8. Private pensions 9. Investment in shares 10. Investment funds
11. Loans from Mutual Help Associations
12. A car loan 13. Pawning goods 14. Loans from Jet Credit, T.B.I or
other non-banking financial institutions
15. Loans from usurers 16. Loans from relatives,
friends, acquaintances. Buying on credit (informally -
) from food shops 18. Buying on credit from the
electrical appliances shops
USF8B. What did you do after you discovered the problem? Multiple response
1. Nothing 2. I stopped using the service before the contract expired (closed the deposit, account, sold the unit shares, canceled the insurance contract, etc.)
3. I submitted a grievance to the company which sold me the product 4. I submitted a claim to the appropriate government authority 5. Other...............................................
VENSUB. Which of the descriptions comes closest to your
income nowadays?
1. We hardly make the ends meet. 2. We have enough money to buy food but buying clothes causes financial difficulties. 3. We have enough money to buy food and clothes. But purchase of durable goods (a TV-set, a refrigerator) is problematic. 4. We have no trouble buying durable goods, but purchase of a really expensive thing like a car is hard for us. 5. We can afford quite expensive things.
USF10. From the folowing financial services, which ones do you plan to use the the next 2 years? Multiple response
1. A consumer loan 2. A mortgage loan 3. Current account 4. Bank deposit 5. A bank debit card 6. A bank credit card 7. An insurance policy 8. Private pensions 9. Investment in shares 10. Investment funds
11. Loans from Mutual Help Associations
12. A car loan 13. Pawning goods 14. Loans from Jet Credit, T.B.I or
other non-banking financial institutions
15. Loans from usurers 16. Loans from relatives, friends, acquaintances. 17. Buying on credit (informally - 18. Buying on credit from the electrical appliances shops
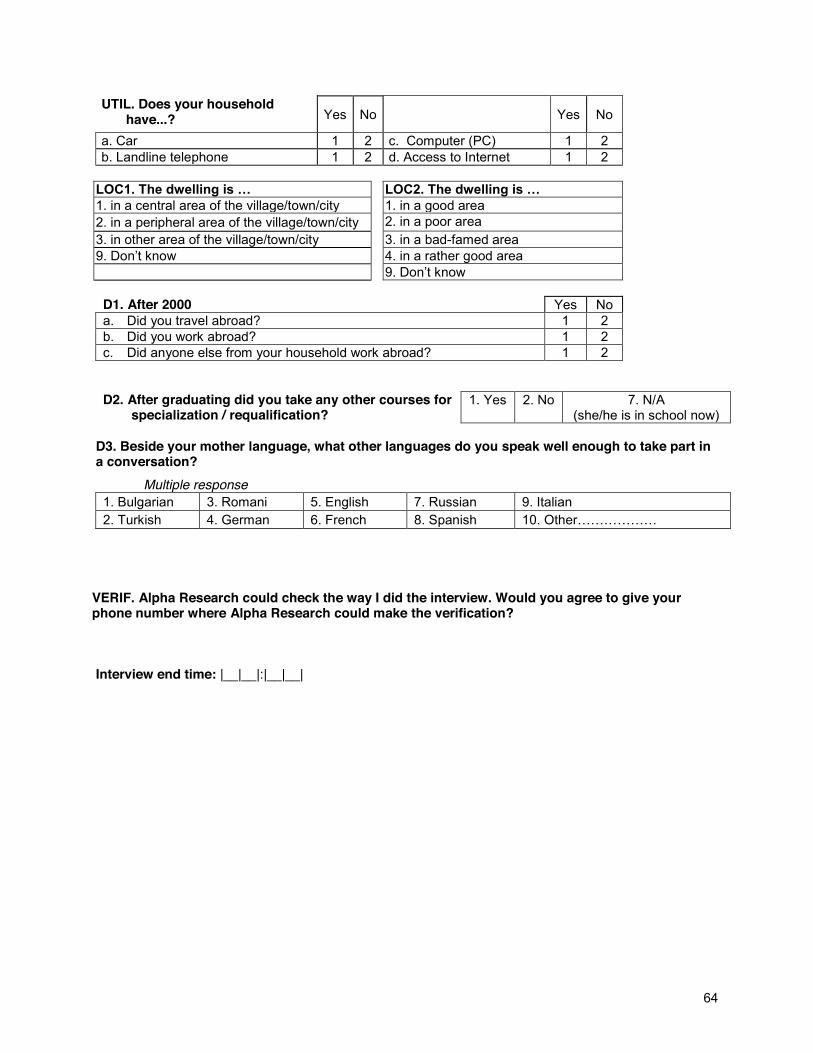
64
UTIL. Does your household have...? Yes No
Yes No
a. Car 1 2 c. Computer (PC) 1 2 b. Landline telephone 1 2 d. Access to Internet 1 2
1. in a central area of the village/town/city 1. in a good area 2. in a peripheral area of the village/town/city 2. in a poor area 3. in other area of the village/town/city 3. in a bad-famed area
4. in a rather good area D1. After 2000 Yes No a. Did you travel abroad? 1 2 b. Did you work abroad? 1 2 c. Did anyone else from your household work abroad? 1 2
D2. After graduating did you take any other courses for
specialization / requalification? 1. Yes 2. No 7. N/A
(she/he is in school now)
D3. Beside your mother language, what other languages do you speak well enough to take part in a conversation?
Multiple response 1. Bulgarian 3. Romani 5. English 7. Russian 9. Italian 2. Turkish 4. German 6. French 8. Spanish
VERIF. Alpha Research could check the way I did the interview. Would you agree to give your phone number where Alpha Research could make the verification?
Interview end time: |__|__|:|__|__|

65
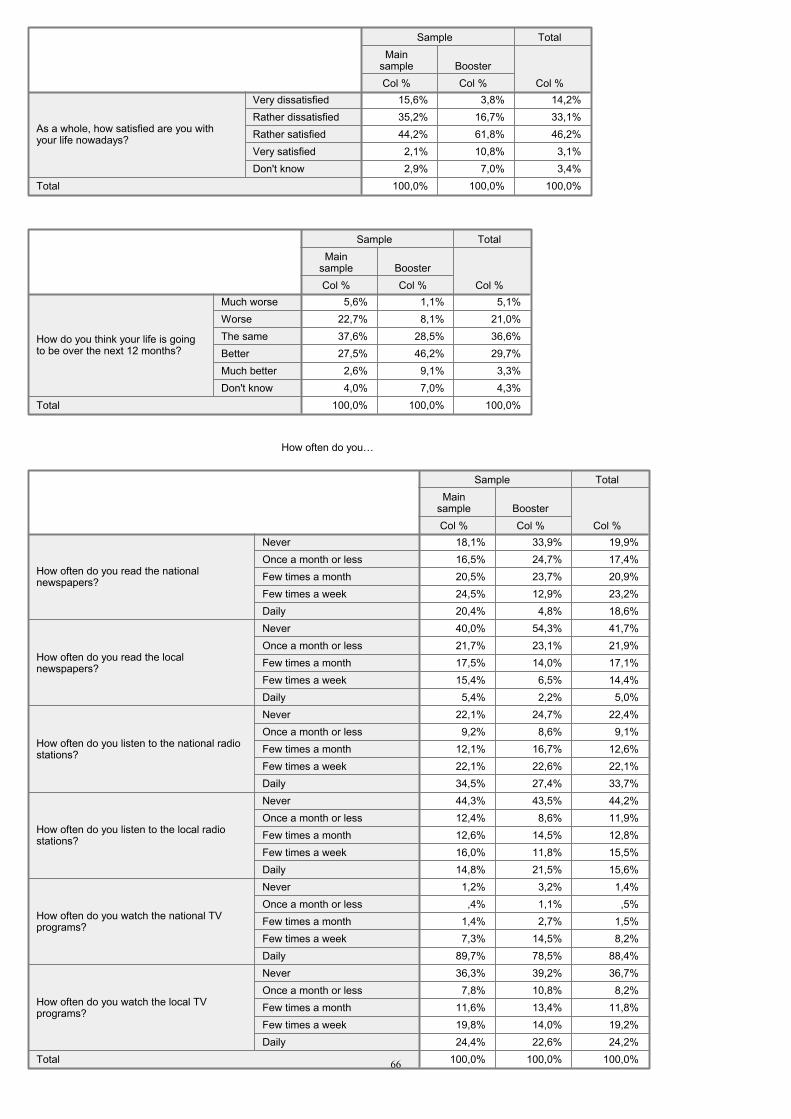
15,6% 3,8% 14,2%35,2% 16,7% 33,1%44,2% 61,8% 46,2%2,1% 10,8% 3,1%2,9% 7,0% 3,4%
100,0% 100,0% 100,0%
Very dissatisfiedRather dissatisfiedRather satisfiedVery satisfiedDon't know
As a whole, how satisfied are you withyour life nowadays?
Total
Col %
Mainsample
Col %Booster
Sample
Col %
Total
5,6% 1,1% 5,1%22,7% 8,1% 21,0%37,6% 28,5% 36,6%27,5% 46,2% 29,7%2,6% 9,1% 3,3%4,0% 7,0% 4,3%
100,0% 100,0% 100,0%
Much worseWorseThe sameBetterMuch betterDon't know
How do you think your life is goingto be over the next 12 months?
Total
Col %
Mainsample
Col %Booster
Sample
Col %
Total
How often do you�…
18,1% 33,9% 19,9%16,5% 24,7% 17,4%20,5% 23,7% 20,9%24,5% 12,9% 23,2%20,4% 4,8% 18,6%40,0% 54,3% 41,7%21,7% 23,1% 21,9%17,5% 14,0% 17,1%15,4% 6,5% 14,4%5,4% 2,2% 5,0%
22,1% 24,7% 22,4%9,2% 8,6% 9,1%
12,1% 16,7% 12,6%22,1% 22,6% 22,1%34,5% 27,4% 33,7%44,3% 43,5% 44,2%12,4% 8,6% 11,9%12,6% 14,5% 12,8%16,0% 11,8% 15,5%14,8% 21,5% 15,6%1,2% 3,2% 1,4%,4% 1,1% ,5%
1,4% 2,7% 1,5%7,3% 14,5% 8,2%
89,7% 78,5% 88,4%36,3% 39,2% 36,7%7,8% 10,8% 8,2%
11,6% 13,4% 11,8%19,8% 14,0% 19,2%24,4% 22,6% 24,2%
100,0% 100,0% 100,0%
NeverOnce a month or lessFew times a monthFew times a weekDaily
How often do you read the nationalnewspapers?
NeverOnce a month or lessFew times a monthFew times a weekDaily
How often do you read the localnewspapers?
NeverOnce a month or lessFew times a monthFew times a weekDaily
How often do you listen to the national radiostations?
NeverOnce a month or lessFew times a monthFew times a weekDaily
How often do you listen to the local radiostations?
NeverOnce a month or lessFew times a monthFew times a weekDaily
How often do you watch the national TVprograms?
NeverOnce a month or lessFew times a monthFew times a weekDaily
How often do you watch the local TVprograms?
Total
Col %
Mainsample
Col %Booster
Sample
Col %
Total
66
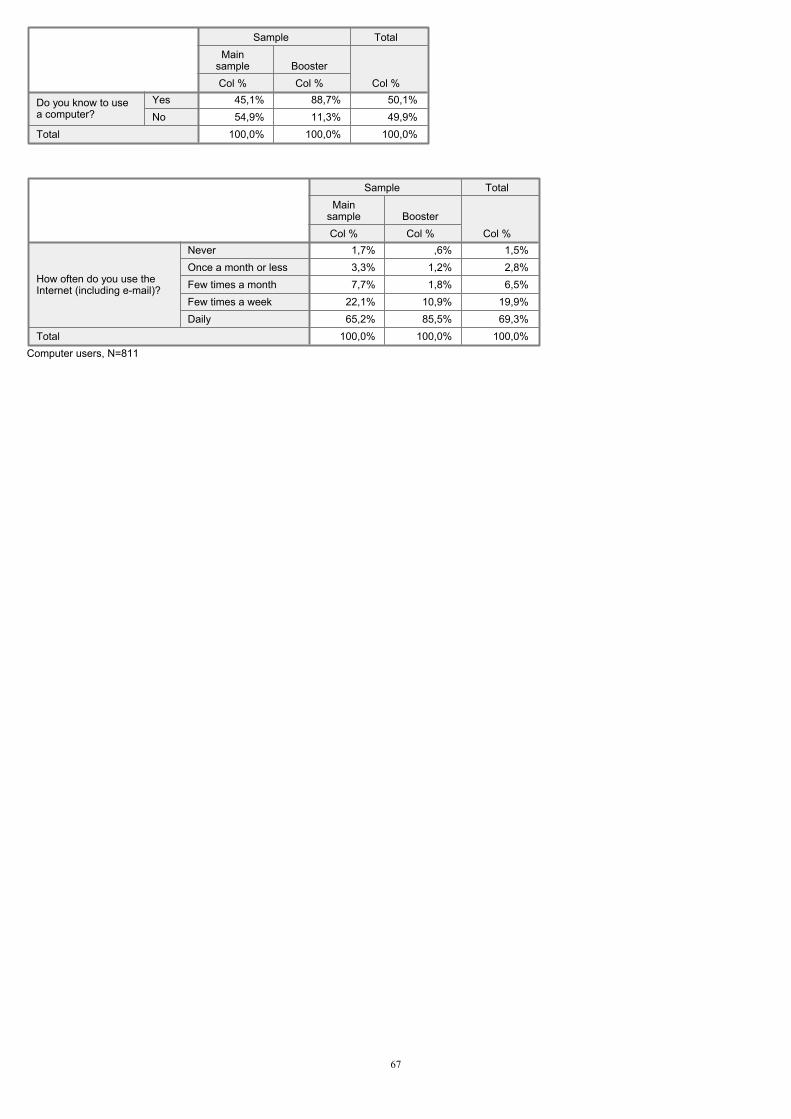
45,1% 88,7% 50,1%54,9% 11,3% 49,9%
100,0% 100,0% 100,0%
YesNo
Do you know to usea computer?
Total
Col %
Mainsample
Col %Booster
Sample
Col %
Total
1,7% ,6% 1,5%3,3% 1,2% 2,8%7,7% 1,8% 6,5%
22,1% 10,9% 19,9%65,2% 85,5% 69,3%
100,0% 100,0% 100,0%
NeverOnce a month or lessFew times a monthFew times a weekDaily
How often do you use theInternet (including e-mail)?
Total
Col %
Mainsample
Col %Booster
Sample
Col %
Total
Computer users, N=811
67
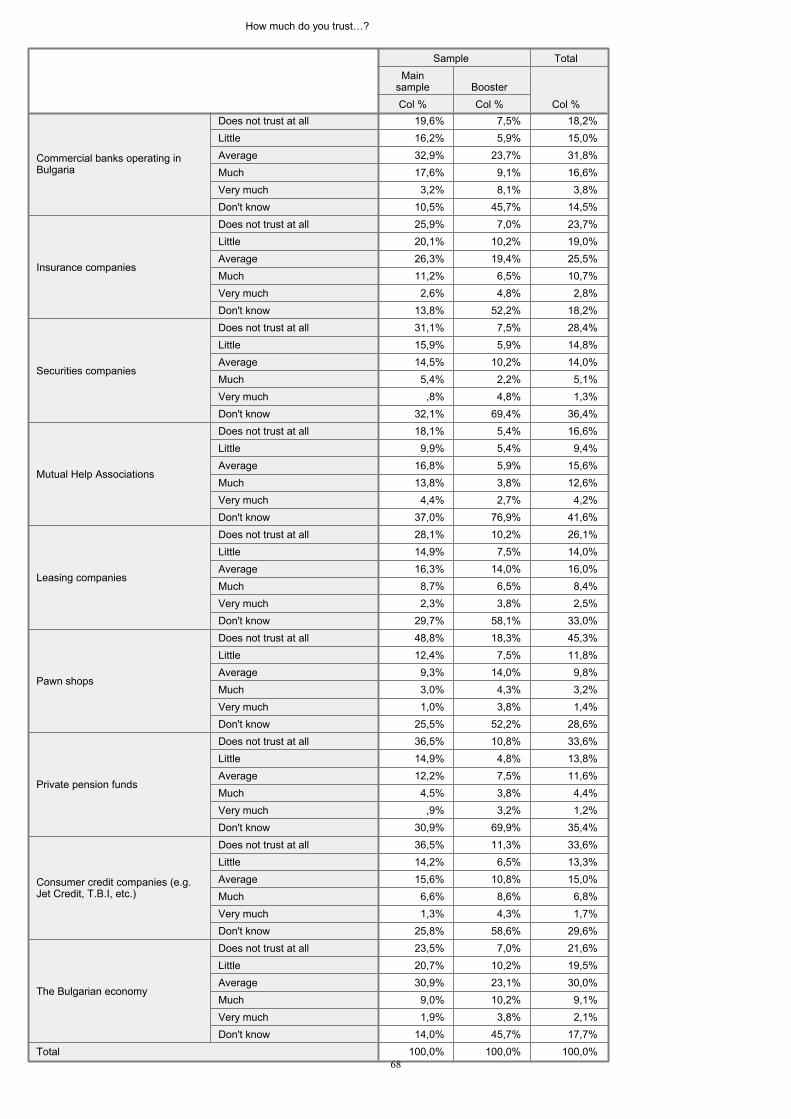
How much do you trust�…?
19,6% 7,5% 18,2%16,2% 5,9% 15,0%32,9% 23,7% 31,8%17,6% 9,1% 16,6%3,2% 8,1% 3,8%
10,5% 45,7% 14,5%25,9% 7,0% 23,7%20,1% 10,2% 19,0%26,3% 19,4% 25,5%11,2% 6,5% 10,7%2,6% 4,8% 2,8%
13,8% 52,2% 18,2%31,1% 7,5% 28,4%15,9% 5,9% 14,8%14,5% 10,2% 14,0%5,4% 2,2% 5,1%,8% 4,8% 1,3%
32,1% 69,4% 36,4%18,1% 5,4% 16,6%9,9% 5,4% 9,4%
16,8% 5,9% 15,6%13,8% 3,8% 12,6%4,4% 2,7% 4,2%
37,0% 76,9% 41,6%28,1% 10,2% 26,1%14,9% 7,5% 14,0%16,3% 14,0% 16,0%8,7% 6,5% 8,4%2,3% 3,8% 2,5%
29,7% 58,1% 33,0%48,8% 18,3% 45,3%12,4% 7,5% 11,8%9,3% 14,0% 9,8%3,0% 4,3% 3,2%1,0% 3,8% 1,4%
25,5% 52,2% 28,6%36,5% 10,8% 33,6%14,9% 4,8% 13,8%12,2% 7,5% 11,6%4,5% 3,8% 4,4%,9% 3,2% 1,2%
30,9% 69,9% 35,4%36,5% 11,3% 33,6%14,2% 6,5% 13,3%15,6% 10,8% 15,0%6,6% 8,6% 6,8%1,3% 4,3% 1,7%
25,8% 58,6% 29,6%23,5% 7,0% 21,6%20,7% 10,2% 19,5%30,9% 23,1% 30,0%9,0% 10,2% 9,1%1,9% 3,8% 2,1%
14,0% 45,7% 17,7%100,0% 100,0% 100,0%
Does not trust at allLittleAverageMuchVery muchDon't know
Commercial banks operating inBulgaria
Does not trust at allLittleAverageMuchVery muchDon't know
Insurance companies
Does not trust at allLittleAverageMuchVery muchDon't know
Securities companies
Does not trust at allLittleAverageMuchVery muchDon't know
Mutual Help Associations
Does not trust at allLittleAverageMuchVery muchDon't know
Leasing companies
Does not trust at allLittleAverageMuchVery muchDon't know
Pawn shops
Does not trust at allLittleAverageMuchVery muchDon't know
Private pension funds
Does not trust at allLittleAverageMuchVery muchDon't know
Consumer credit companies (e.g.Jet Credit, T.B.I, etc.)
Does not trust at allLittleAverageMuchVery muchDon't know
The Bulgarian economy
Total
Col %
Mainsample
Col %Booster
Sample
Col %
Total
68
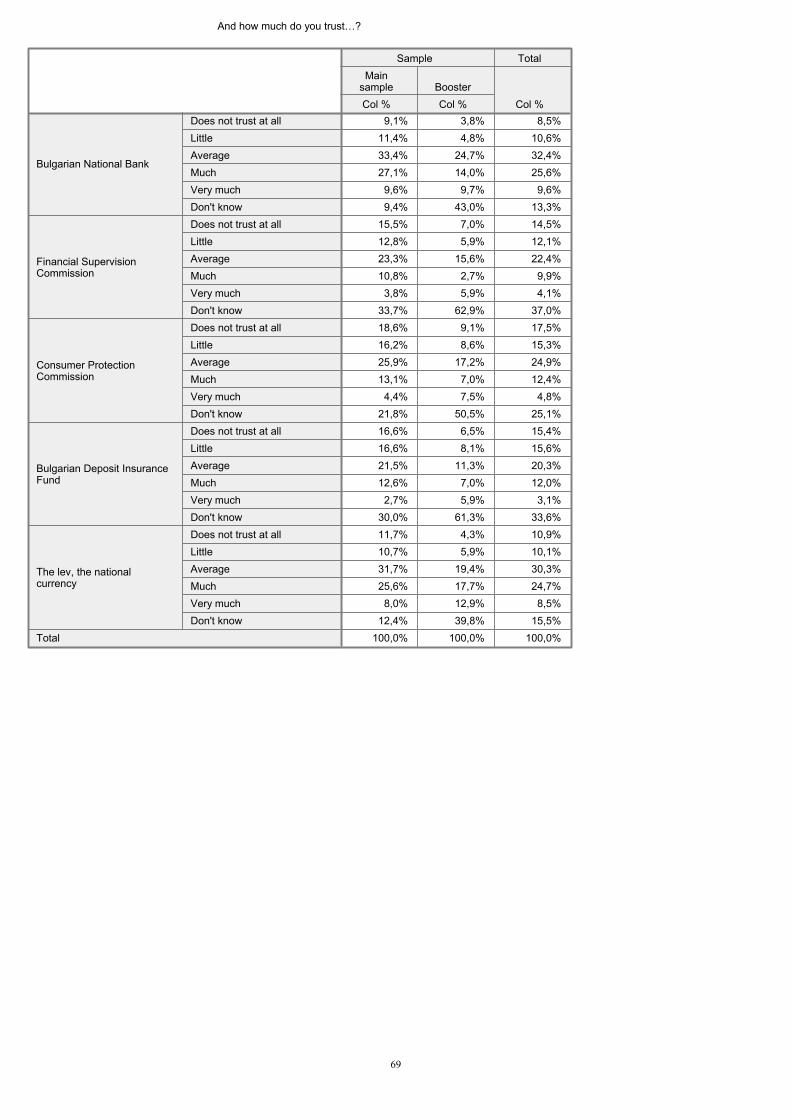
And how much do you trust�…?
9,1% 3,8% 8,5%11,4% 4,8% 10,6%33,4% 24,7% 32,4%27,1% 14,0% 25,6%9,6% 9,7% 9,6%9,4% 43,0% 13,3%
15,5% 7,0% 14,5%12,8% 5,9% 12,1%23,3% 15,6% 22,4%10,8% 2,7% 9,9%3,8% 5,9% 4,1%
33,7% 62,9% 37,0%18,6% 9,1% 17,5%16,2% 8,6% 15,3%25,9% 17,2% 24,9%13,1% 7,0% 12,4%4,4% 7,5% 4,8%
21,8% 50,5% 25,1%16,6% 6,5% 15,4%16,6% 8,1% 15,6%21,5% 11,3% 20,3%12,6% 7,0% 12,0%2,7% 5,9% 3,1%
30,0% 61,3% 33,6%11,7% 4,3% 10,9%10,7% 5,9% 10,1%31,7% 19,4% 30,3%25,6% 17,7% 24,7%8,0% 12,9% 8,5%
12,4% 39,8% 15,5%100,0% 100,0% 100,0%
Does not trust at allLittleAverageMuchVery muchDon't know
Bulgarian National Bank
Does not trust at allLittleAverageMuchVery muchDon't know
Financial SupervisionCommission
Does not trust at allLittleAverageMuchVery muchDon't know
Consumer ProtectionCommission
Does not trust at allLittleAverageMuchVery muchDon't know
Bulgarian Deposit InsuranceFund
Does not trust at allLittleAverageMuchVery muchDon't know
The lev, the nationalcurrency
Total
Col %
Mainsample
Col %Booster
Sample
Col %
Total
69
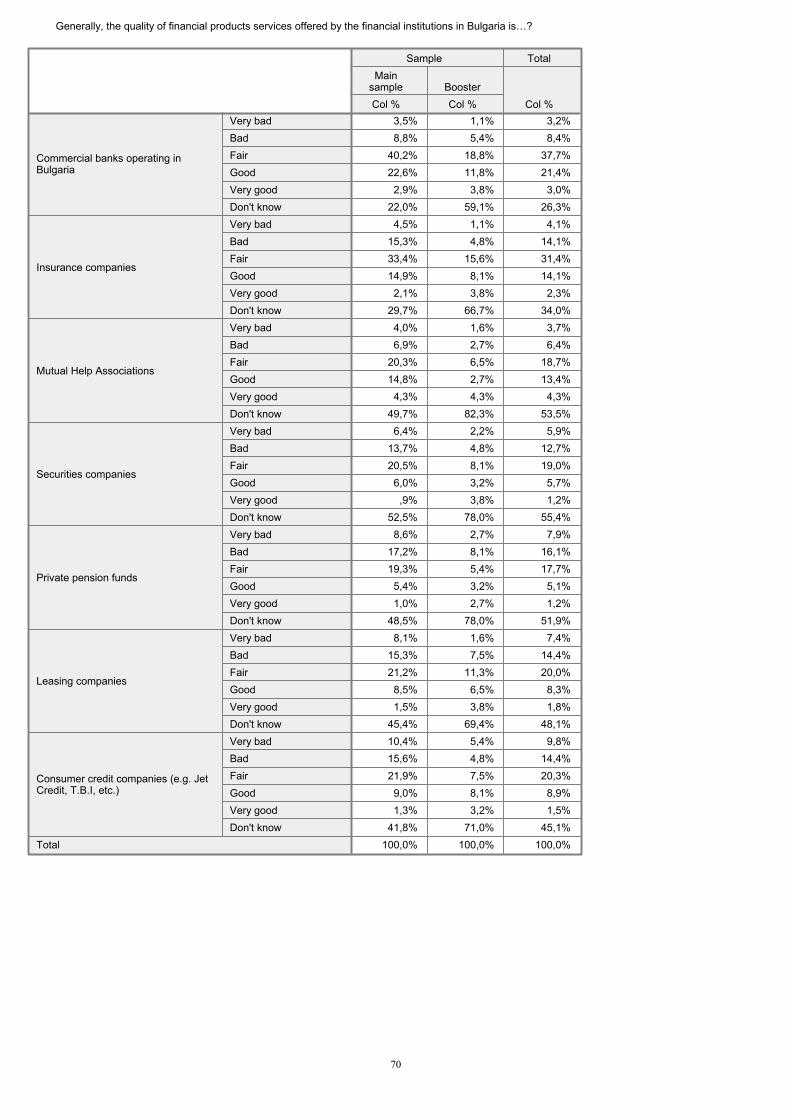
Generally, the quality of financial products services offered by the financial institutions in Bulgaria is�…?
3,5% 1,1% 3,2%8,8% 5,4% 8,4%
40,2% 18,8% 37,7%22,6% 11,8% 21,4%2,9% 3,8% 3,0%
22,0% 59,1% 26,3%4,5% 1,1% 4,1%
15,3% 4,8% 14,1%33,4% 15,6% 31,4%14,9% 8,1% 14,1%2,1% 3,8% 2,3%
29,7% 66,7% 34,0%4,0% 1,6% 3,7%6,9% 2,7% 6,4%
20,3% 6,5% 18,7%14,8% 2,7% 13,4%4,3% 4,3% 4,3%
49,7% 82,3% 53,5%6,4% 2,2% 5,9%
13,7% 4,8% 12,7%20,5% 8,1% 19,0%6,0% 3,2% 5,7%,9% 3,8% 1,2%
52,5% 78,0% 55,4%8,6% 2,7% 7,9%
17,2% 8,1% 16,1%19,3% 5,4% 17,7%5,4% 3,2% 5,1%1,0% 2,7% 1,2%
48,5% 78,0% 51,9%8,1% 1,6% 7,4%
15,3% 7,5% 14,4%21,2% 11,3% 20,0%8,5% 6,5% 8,3%1,5% 3,8% 1,8%
45,4% 69,4% 48,1%10,4% 5,4% 9,8%15,6% 4,8% 14,4%21,9% 7,5% 20,3%9,0% 8,1% 8,9%1,3% 3,2% 1,5%
41,8% 71,0% 45,1%100,0% 100,0% 100,0%
Very badBadFairGoodVery goodDon't know
Commercial banks operating inBulgaria
Very badBadFairGoodVery goodDon't know
Insurance companies
Very badBadFairGoodVery goodDon't know
Mutual Help Associations
Very badBadFairGoodVery goodDon't know
Securities companies
Very badBadFairGoodVery goodDon't know
Private pension funds
Very badBadFairGoodVery goodDon't know
Leasing companies
Very badBadFairGoodVery goodDon't know
Consumer credit companies (e.g. JetCredit, T.B.I, etc.)
Total
Col %
Mainsample
Col %Booster
Sample
Col %
Total
70

What are your expectations to the development of�…?
5,6% 14,0% 6,6%
28,8% 26,3% 28,6%
54,9% 52,2% 54,6%
10,7% 7,5% 10,3%
10,7% 17,2% 11,4%
13,9% 14,5% 14,0%
54,1% 53,8% 54,1%
21,3% 14,5% 20,5%
8,8% 15,1% 9,5%
18,6% 20,4% 18,9%
58,9% 53,8% 58,3%
13,7% 10,8% 13,3%
12,4% 19,4% 13,2%
16,6% 15,1% 16,4%
50,6% 54,3% 51,1%
20,4% 11,3% 19,3%
9,9% 16,7% 10,7%
17,3% 18,3% 17,4%
52,9% 52,2% 52,8%
19,8% 12,9% 19,0%
100,0% 100,0% 100,0%
NAIt will remain stable anddevelop in a positive directionNo changeDestabilization and negativedevelopment
Banking sector in Bulgaria
NAIt will remain stable anddevelop in a positive directionNo changeDestabilization and negativedevelopment
Private Pension Funds
NAIt will remain stable anddevelop in a positive directionNo changeDestabilization and negativedevelopment
Insurance companies
NAIt will remain stable anddevelop in a positive directionNo changeDestabilization and negativedevelopment
The capital market
NAIt will remain stable anddevelop in a positive directionNo changeDestabilization and negativedevelopment
Consumer credit companies(e.g. Jet Credit, T.B.I, etc.)
Total
Col %
Mainsample
Col %Booster
Sample
Col %
Total
62,2% 51,1% 60,9%17,5% 21,5% 18,0%17,7% 18,3% 17,7%12,3% 11,8% 12,2%12,8% 7,0% 12,2%5,9% 3,8% 5,7%4,6% 4,3% 4,6%4,0% 3,2% 3,9%2,4% 2,2% 2,4%1,7% 3,2% 1,9%,3% ,5% ,3%,2% ,2%,1% ,1%
,5% ,1%
To the bank managementTo the mediaI will not complain to anyoneTo a representative of the system of justiceTo the Consumer Protection CommissionTo the Financial Supervision CommissionTo the Bank Deposits Guarantee FundTo Bulgarian National BankTo some other state institutionTo the Association of Banks in BulgariaOtherTo the Payments Conciliation CommitteeI will change the bankParents
Who would you complain to, if youhave a problem with your bank?
Col %
Mainsample
Col %Booster
Sample
Col %
Total
71
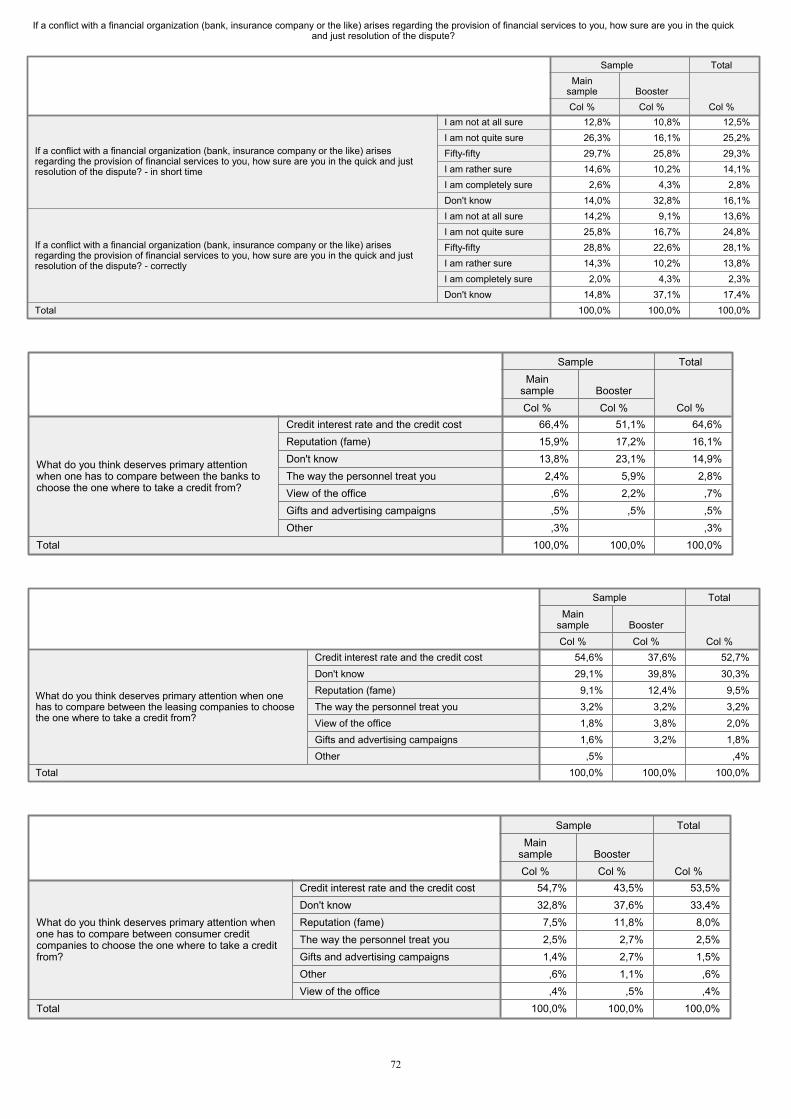
If a conflict with a financial organization (bank, insurance company or the like) arises regarding the provision of financial services to you, how sure are you in the quickand just resolution of the dispute?
12,8% 10,8% 12,5%26,3% 16,1% 25,2%29,7% 25,8% 29,3%14,6% 10,2% 14,1%
2,6% 4,3% 2,8%14,0% 32,8% 16,1%14,2% 9,1% 13,6%25,8% 16,7% 24,8%28,8% 22,6% 28,1%14,3% 10,2% 13,8%
2,0% 4,3% 2,3%14,8% 37,1% 17,4%
100,0% 100,0% 100,0%
I am not at all sureI am not quite sureFifty-fiftyI am rather sureI am completely sureDon't know
If a conflict with a financial organization (bank, insurance company or the like) arisesregarding the provision of financial services to you, how sure are you in the quick and justresolution of the dispute? - in short time
I am not at all sureI am not quite sureFifty-fiftyI am rather sureI am completely sureDon't know
If a conflict with a financial organization (bank, insurance company or the like) arisesregarding the provision of financial services to you, how sure are you in the quick and justresolution of the dispute? - correctly
Total
Col %
Mainsample
Col %Booster
Sample
Col %
Total
66,4% 51,1% 64,6%15,9% 17,2% 16,1%13,8% 23,1% 14,9%2,4% 5,9% 2,8%,6% 2,2% ,7%,5% ,5% ,5%,3% ,3%
100,0% 100,0% 100,0%
Credit interest rate and the credit costReputation (fame)Don't know
he way the personnel treat youView of the officeGifts and advertising campaignsOther
What do you think deserves primary attentionwhen one has to compare between the banks tochoose the one where to take a credit from?
Total
Col %
Mainsample
Col %Booster
Sample
Col %
Total
54,6% 37,6% 52,7%29,1% 39,8% 30,3%9,1% 12,4% 9,5%3,2% 3,2% 3,2%1,8% 3,8% 2,0%1,6% 3,2% 1,8%,5% ,4%
100,0% 100,0% 100,0%
Credit interest rate and the credit costDon't knowReputation (fame)
he way the personnel treat youView of the officeGifts and advertising campaignsOther
What do you think deserves primary attention when onehas to compare between the leasing companies to choosethe one where to take a credit from?
Total
Col %
Mainsample
Col %Booster
Sample
Col %
Total
54,7% 43,5% 53,5%32,8% 37,6% 33,4%7,5% 11,8% 8,0%2,5% 2,7% 2,5%1,4% 2,7% 1,5%,6% 1,1% ,6%,4% ,5% ,4%
100,0% 100,0% 100,0%
Credit interest rate and the credit costDon't knowReputation (fame)
he way the personnel treat youGifts and advertising campaignsOtherView of the office
What do you think deserves primary attention whenone has to compare between consumer creditcompanies to choose the one where to take a creditfrom?
Total
Col %
Mainsample
Col %Booster
Sample
Col %
Total
72
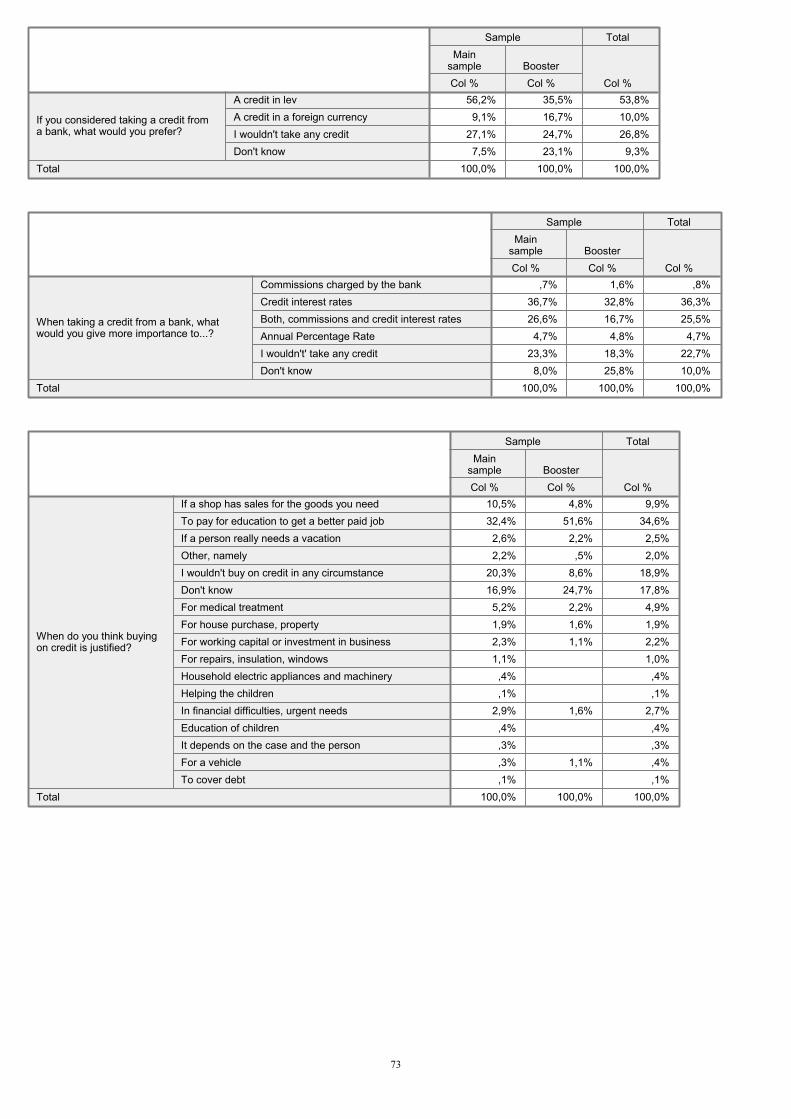
56,2% 35,5% 53,8%9,1% 16,7% 10,0%
27,1% 24,7% 26,8%7,5% 23,1% 9,3%
100,0% 100,0% 100,0%
A credit in levA credit in a foreign currencyI wouldn't take any creditDon't know
If you considered taking a credit froma bank, what would you prefer?
Total
Col %
Mainsample
Col %Booster
Sample
Col %
Total
,7% 1,6% ,8%36,7% 32,8% 36,3%26,6% 16,7% 25,5%4,7% 4,8% 4,7%
23,3% 18,3% 22,7%8,0% 25,8% 10,0%
100,0% 100,0% 100,0%
Commissions charged by the bankCredit interest ratesBoth, commissions and credit interest ratesAnnual Percentage RateI wouldn't' take any creditDon't know
When taking a credit from a bank, whatwould you give more importance to...?
Total
Col %
Mainsample
Col %Booster
Sample
Col %
Total
10,5% 4,8% 9,9%32,4% 51,6% 34,6%2,6% 2,2% 2,5%2,2% ,5% 2,0%
20,3% 8,6% 18,9%16,9% 24,7% 17,8%5,2% 2,2% 4,9%1,9% 1,6% 1,9%2,3% 1,1% 2,2%1,1% 1,0%,4% ,4%,1% ,1%
2,9% 1,6% 2,7%,4% ,4%,3% ,3%,3% 1,1% ,4%,1% ,1%
100,0% 100,0% 100,0%
If a shop has sales for the goods you needTo pay for education to get a better paid jobIf a person really needs a vacationOther, namelyI wouldn't buy on credit in any circumstanceDon't knowFor medical treatmentFor house purchase, propertyFor working capital or investment in businessFor repairs, insulation, windowsHousehold electric appliances and machineryHelping the childrenIn financial difficulties, urgent needsEducation of childrenIt depends on the case and the personFor a vehicleTo cover debt
When do you think buyingon credit is justified?
Total
Col %
Mainsample
Col %Booster
Sample
Col %
Total
73
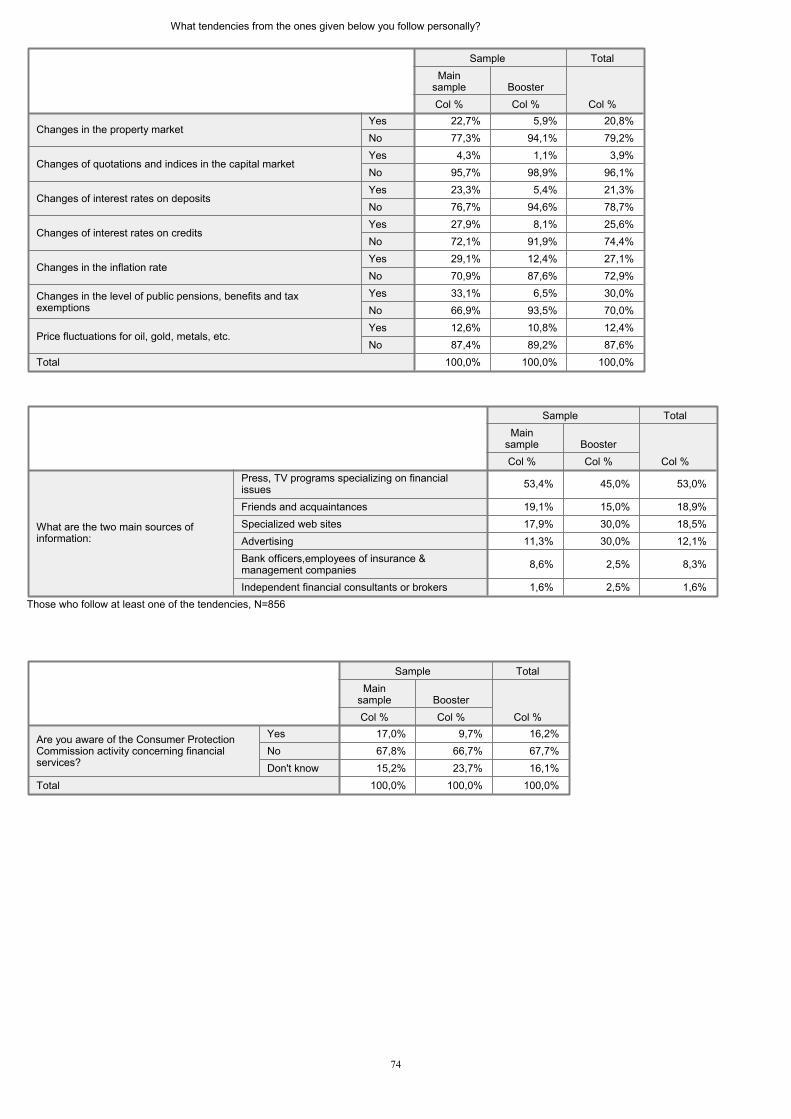
What tendencies from the ones given below you follow personally?
22,7% 5,9% 20,8%77,3% 94,1% 79,2%4,3% 1,1% 3,9%
95,7% 98,9% 96,1%23,3% 5,4% 21,3%76,7% 94,6% 78,7%27,9% 8,1% 25,6%72,1% 91,9% 74,4%29,1% 12,4% 27,1%70,9% 87,6% 72,9%33,1% 6,5% 30,0%66,9% 93,5% 70,0%12,6% 10,8% 12,4%87,4% 89,2% 87,6%
100,0% 100,0% 100,0%
YesNo
Changes in the property market
YesNo
Changes of quotations and indices in the capital market
YesNo
Changes of interest rates on deposits
YesNo
Changes of interest rates on credits
YesNo
Changes in the inflation rate
YesNo
Changes in the level of public pensions, benefits and taxexemptions
YesNo
Price fluctuations for oil, gold, metals, etc.
Total
Col %
Mainsample
Col %Booster
Sample
Col %
Total
53,4% 45,0% 53,0%
19,1% 15,0% 18,9%17,9% 30,0% 18,5%11,3% 30,0% 12,1%
8,6% 2,5% 8,3%
1,6% 2,5% 1,6%
Press, TV programs specializing on financialissuesFriends and acquaintancesSpecialized web sitesAdvertisingBank officers,employees of insurance &management companiesIndependent financial consultants or brokers
What are the two main sources ofinformation:
Col %
Mainsample
Col %Booster
Sample
Col %
Total
Those who follow at least one of the tendencies, N=856
17,0% 9,7% 16,2%67,8% 66,7% 67,7%15,2% 23,7% 16,1%
100,0% 100,0% 100,0%
YesNoDon't know
Are you aware of the Consumer ProtectionCommission activity concerning financialservices?
Total
Col %
Mainsample
Col %Booster
Sample
Col %
Total
74
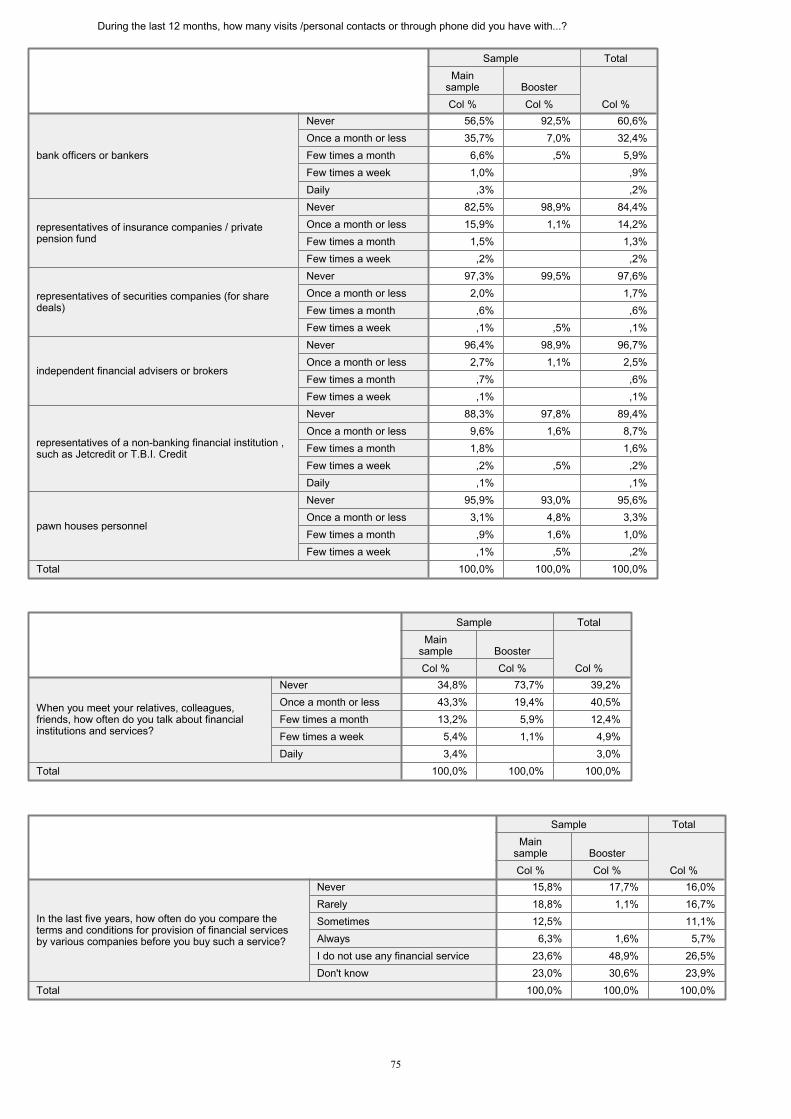
During the last 12 months, how many visits /personal contacts or through phone did you have with...?
56,5% 92,5% 60,6%35,7% 7,0% 32,4%6,6% ,5% 5,9%1,0% ,9%,3% ,2%
82,5% 98,9% 84,4%15,9% 1,1% 14,2%1,5% 1,3%,2% ,2%
97,3% 99,5% 97,6%2,0% 1,7%,6% ,6%,1% ,5% ,1%
96,4% 98,9% 96,7%2,7% 1,1% 2,5%,7% ,6%,1% ,1%
88,3% 97,8% 89,4%9,6% 1,6% 8,7%1,8% 1,6%,2% ,5% ,2%,1% ,1%
95,9% 93,0% 95,6%3,1% 4,8% 3,3%,9% 1,6% 1,0%,1% ,5% ,2%
100,0% 100,0% 100,0%
NeverOnce a month or lessFew times a monthFew times a weekDaily
bank officers or bankers
NeverOnce a month or lessFew times a monthFew times a week
representatives of insurance companies / privatepension fund
NeverOnce a month or lessFew times a monthFew times a week
representatives of securities companies (for sharedeals)
NeverOnce a month or lessFew times a monthFew times a week
independent financial advisers or brokers
NeverOnce a month or lessFew times a monthFew times a weekDaily
representatives of a non-banking financial institution ,such as Jetcredit or T.B.I. Credit
NeverOnce a month or lessFew times a monthFew times a week
pawn houses personnel
Total
Col %
Mainsample
Col %Booster
Sample
Col %
Total
34,8% 73,7% 39,2%43,3% 19,4% 40,5%13,2% 5,9% 12,4%5,4% 1,1% 4,9%3,4% 3,0%
100,0% 100,0% 100,0%
NeverOnce a month or lessFew times a monthFew times a weekDaily
When you meet your relatives, colleagues,friends, how often do you talk about financialinstitutions and services?
Total
Col %
Mainsample
Col %Booster
Sample
Col %
Total
15,8% 17,7% 16,0%18,8% 1,1% 16,7%12,5% 11,1%6,3% 1,6% 5,7%
23,6% 48,9% 26,5%23,0% 30,6% 23,9%
100,0% 100,0% 100,0%
NeverRarelySometimesAlwaysI do not use any financial serviceDon't know
In the last five years, how often do you compare theterms and conditions for provision of financial servicesby various companies before you buy such a service?
Total
Col %
Mainsample
Col %Booster
Sample
Col %
Total
75
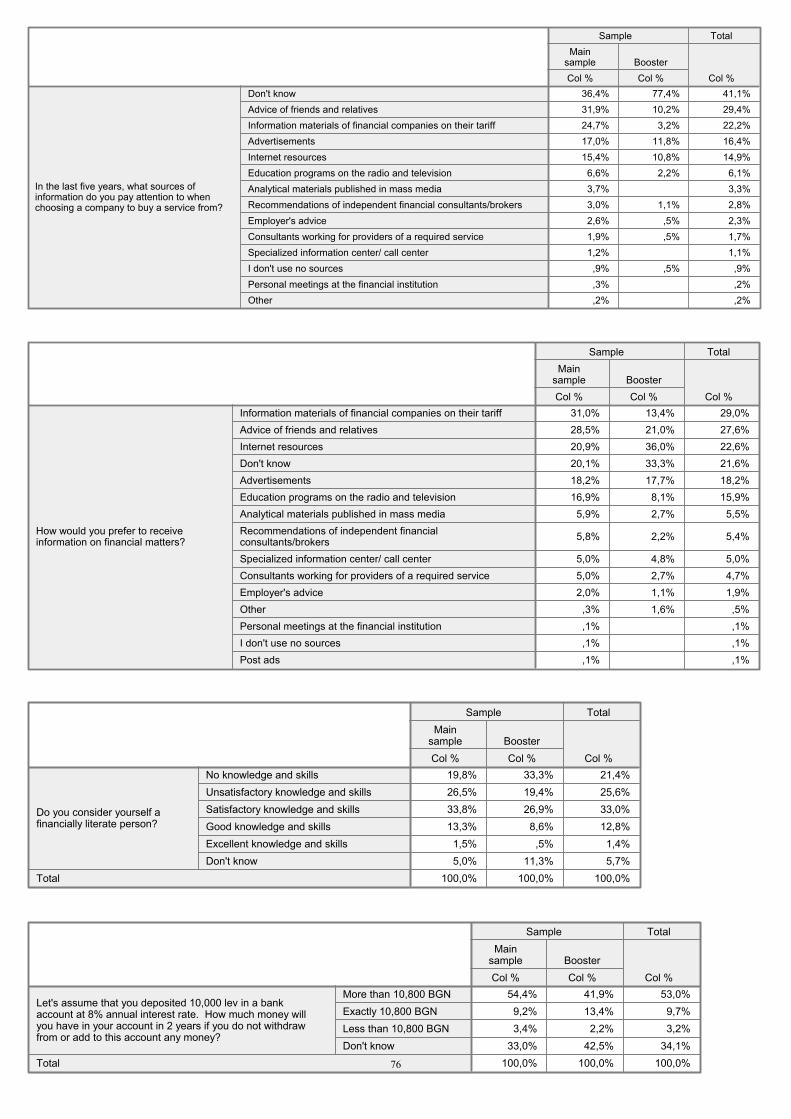
36,4% 77,4% 41,1%31,9% 10,2% 29,4%24,7% 3,2% 22,2%17,0% 11,8% 16,4%15,4% 10,8% 14,9%
6,6% 2,2% 6,1%3,7% 3,3%3,0% 1,1% 2,8%2,6% ,5% 2,3%1,9% ,5% 1,7%1,2% 1,1%
,9% ,5% ,9%,3% ,2%,2% ,2%
Don't knowAdvice of friends and relativesInformation materials of financial companies on their tariffAdvertisementsInternet resourcesEducation programs on the radio and televisionAnalytical materials published in mass mediaRecommendations of independent financial consultants/brokersEmployer's adviceConsultants working for providers of a required serviceSpecialized information center/ call centerI don't use no sourcesPersonal meetings at the financial institutionOther
In the last five years, what sources ofinformation do you pay attention to whenchoosing a company to buy a service from?
Col %
Mainsample
Col %Booster
Sample
Col %
Total
31,0% 13,4% 29,0%28,5% 21,0% 27,6%20,9% 36,0% 22,6%20,1% 33,3% 21,6%18,2% 17,7% 18,2%16,9% 8,1% 15,9%
5,9% 2,7% 5,5%
5,8% 2,2% 5,4%
5,0% 4,8% 5,0%5,0% 2,7% 4,7%2,0% 1,1% 1,9%
,3% 1,6% ,5%,1% ,1%,1% ,1%,1% ,1%
Information materials of financial companies on their tariffAdvice of friends and relativesInternet resourcesDon't knowAdvertisementsEducation programs on the radio and televisionAnalytical materials published in mass mediaRecommendations of independent financialconsultants/brokersSpecialized information center/ call centerConsultants working for providers of a required serviceEmployer's adviceOtherPersonal meetings at the financial institutionI don't use no sourcesPost ads
How would you prefer to receiveinformation on financial matters?
Col %
Mainsample
Col %Booster
Sample
Col %
Total
19,8% 33,3% 21,4%26,5% 19,4% 25,6%33,8% 26,9% 33,0%13,3% 8,6% 12,8%1,5% ,5% 1,4%5,0% 11,3% 5,7%
100,0% 100,0% 100,0%
No knowledge and skillsUnsatisfactory knowledge and skillsSatisfactory knowledge and skillsGood knowledge and skillsExcellent knowledge and skillsDon't know
Do you consider yourself afinancially literate person?
Total
Col %
Mainsample
Col %Booster
Sample
Col %
Total
54,4% 41,9% 53,0%9,2% 13,4% 9,7%3,4% 2,2% 3,2%
33,0% 42,5% 34,1%100,0% 100,0% 100,0%
More than 10,800 BGNExactly 10,800 BGNLess than 10,800 BGNDon't know
Let's assume that you deposited 10,000 lev in a bankaccount at 8% annual interest rate. How much money willyou have in your account in 2 years if you do not withdrawfrom or add to this account any money?
Total
Col %
Mainsample
Col %Booster
Sample
Col %
Total
76
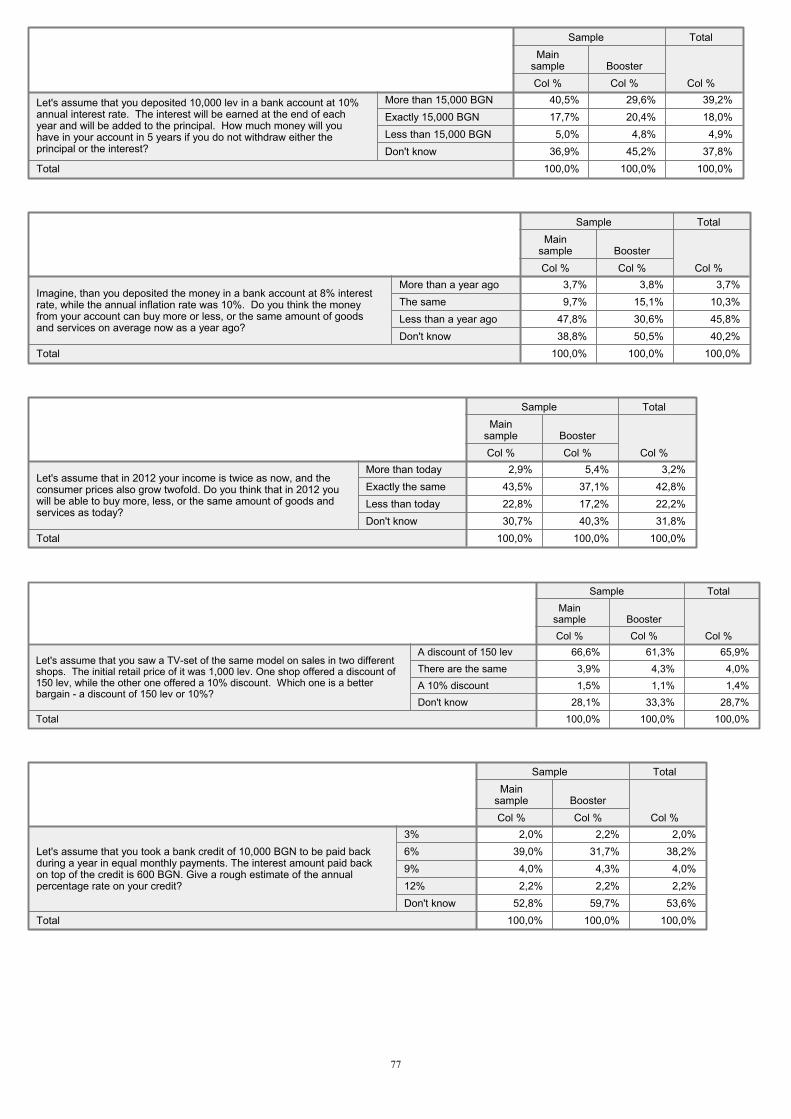
40,5% 29,6% 39,2%17,7% 20,4% 18,0%5,0% 4,8% 4,9%
36,9% 45,2% 37,8%100,0% 100,0% 100,0%
More than 15,000 BGNExactly 15,000 BGNLess than 15,000 BGNDon't know
Let's assume that you deposited 10,000 lev in a bank account at 10%annual interest rate. The interest will be earned at the end of eachyear and will be added to the principal. How much money will youhave in your account in 5 years if you do not withdraw either theprincipal or the interest?
Total
Col %
Mainsample
Col %Booster
Sample
Col %
Total
3,7% 3,8% 3,7%9,7% 15,1% 10,3%
47,8% 30,6% 45,8%38,8% 50,5% 40,2%
100,0% 100,0% 100,0%
More than a year agoThe sameLess than a year agoDon't know
Imagine, than you deposited the money in a bank account at 8% interestrate, while the annual inflation rate was 10%. Do you think the moneyfrom your account can buy more or less, or the same amount of goodsand services on average now as a year ago?
Total
Col %
Mainsample
Col %Booster
Sample
Col %
Total
2,9% 5,4% 3,2%43,5% 37,1% 42,8%22,8% 17,2% 22,2%30,7% 40,3% 31,8%
100,0% 100,0% 100,0%
More than todayExactly the sameLess than todayDon't know
Let's assume that in 2012 your income is twice as now, and theconsumer prices also grow twofold. Do you think that in 2012 youwill be able to buy more, less, or the same amount of goods andservices as today?
Total
Col %
Mainsample
Col %Booster
Sample
Col %
Total
66,6% 61,3% 65,9%3,9% 4,3% 4,0%1,5% 1,1% 1,4%
28,1% 33,3% 28,7%100,0% 100,0% 100,0%
A discount of 150 levThere are the sameA 10% discountDon't know
Let's assume that you saw a TV-set of the same model on sales in two differentshops. The initial retail price of it was 1,000 lev. One shop offered a discount of150 lev, while the other one offered a 10% discount. Which one is a betterbargain - a discount of 150 lev or 10%?
Total
Col %
Mainsample
Col %Booster
Sample
Col %
Total
2,0% 2,2% 2,0%39,0% 31,7% 38,2%4,0% 4,3% 4,0%2,2% 2,2% 2,2%
52,8% 59,7% 53,6%100,0% 100,0% 100,0%
3%6%9%12%Don't know
Let's assume that you took a bank credit of 10,000 BGN to be paid backduring a year in equal monthly payments. The interest amount paid backon top of the credit is 600 BGN. Give a rough estimate of the annualpercentage rate on your credit?
Total
Col %
Mainsample
Col %Booster
Sample
Col %
Total
77
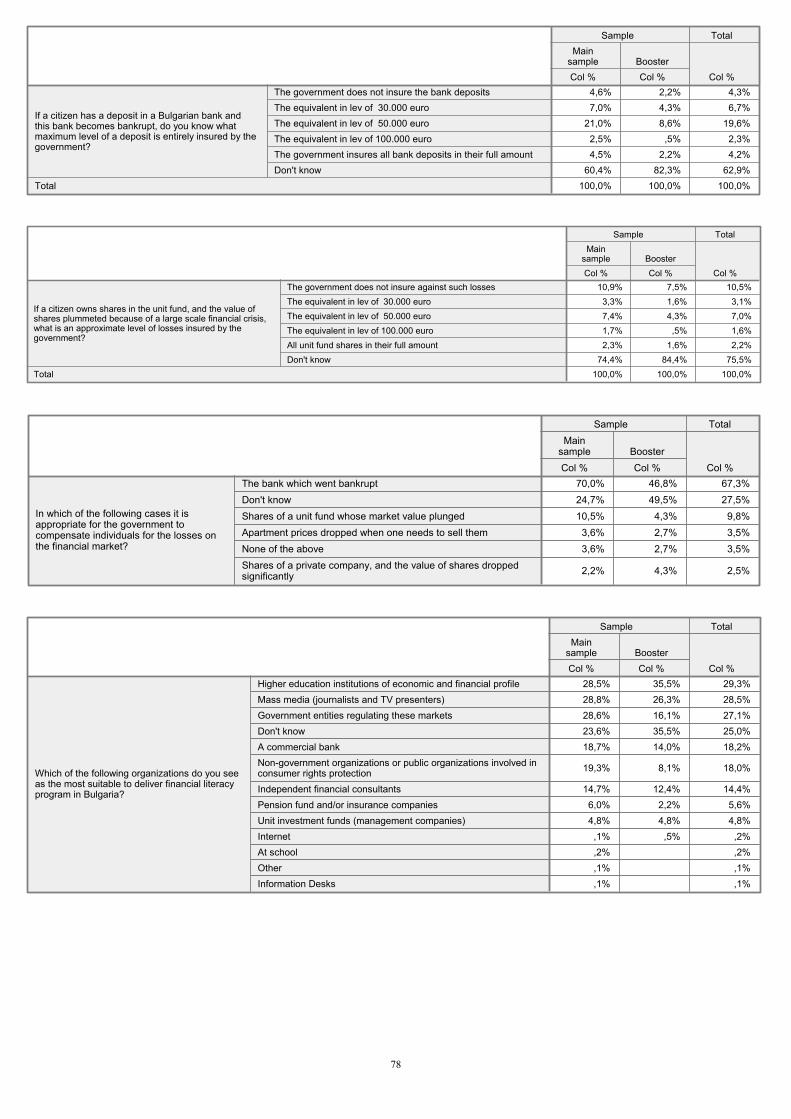
4,6% 2,2% 4,3%7,0% 4,3% 6,7%
21,0% 8,6% 19,6%2,5% ,5% 2,3%4,5% 2,2% 4,2%
60,4% 82,3% 62,9%100,0% 100,0% 100,0%
The government does not insure the bank depositsThe equivalent in lev of 30.000 euroThe equivalent in lev of 50.000 euroThe equivalent in lev of 100.000 euroThe government insures all bank deposits in their full amountDon't know
If a citizen has a deposit in a Bulgarian bank andthis bank becomes bankrupt, do you know whatmaximum level of a deposit is entirely insured by thegovernment?
Total
Col %
Mainsample
Col %Booster
Sample
Col %
Total
10,9% 7,5% 10,5%3,3% 1,6% 3,1%7,4% 4,3% 7,0%1,7% ,5% 1,6%2,3% 1,6% 2,2%
74,4% 84,4% 75,5%100,0% 100,0% 100,0%
The government does not insure against such lossesThe equivalent in lev of 30.000 euroThe equivalent in lev of 50.000 euroThe equivalent in lev of 100.000 euroAll unit fund shares in their full amountDon't know
If a citizen owns shares in the unit fund, and the value ofshares plummeted because of a large scale financial crisis,what is an approximate level of losses insured by thegovernment?
Total
Col %
Mainsample
Col %Booster
Sample
Col %
Total
70,0% 46,8% 67,3%24,7% 49,5% 27,5%10,5% 4,3% 9,8%
3,6% 2,7% 3,5%3,6% 2,7% 3,5%
2,2% 4,3% 2,5%
The bank which went bankruptDon't knowShares of a unit fund whose market value plungedApartment prices dropped when one needs to sell themNone of the aboveShares of a private company, and the value of shares droppedsignificantly
In which of the following cases it isappropriate for the government tocompensate individuals for the losses onthe financial market?
Col %
Mainsample
Col %Booster
Sample
Col %
Total
28,5% 35,5% 29,3%28,8% 26,3% 28,5%28,6% 16,1% 27,1%23,6% 35,5% 25,0%18,7% 14,0% 18,2%
19,3% 8,1% 18,0%
14,7% 12,4% 14,4%6,0% 2,2% 5,6%4,8% 4,8% 4,8%,1% ,5% ,2%,2% ,2%,1% ,1%,1% ,1%
Higher education institutions of economic and financial profileMass media (journalists and TV presenters)Government entities regulating these marketsDon't knowA commercial bankNon-government organizations or public organizations involved inconsumer rights protectionIndependent financial consultantsPension fund and/or insurance companiesUnit investment funds (management companies)InternetAt schoolOtherInformation Desks
Which of the following organizations do you seeas the most suitable to deliver financial literacyprogram in Bulgaria?
Col %
Mainsample
Col %Booster
Sample
Col %
Total
78
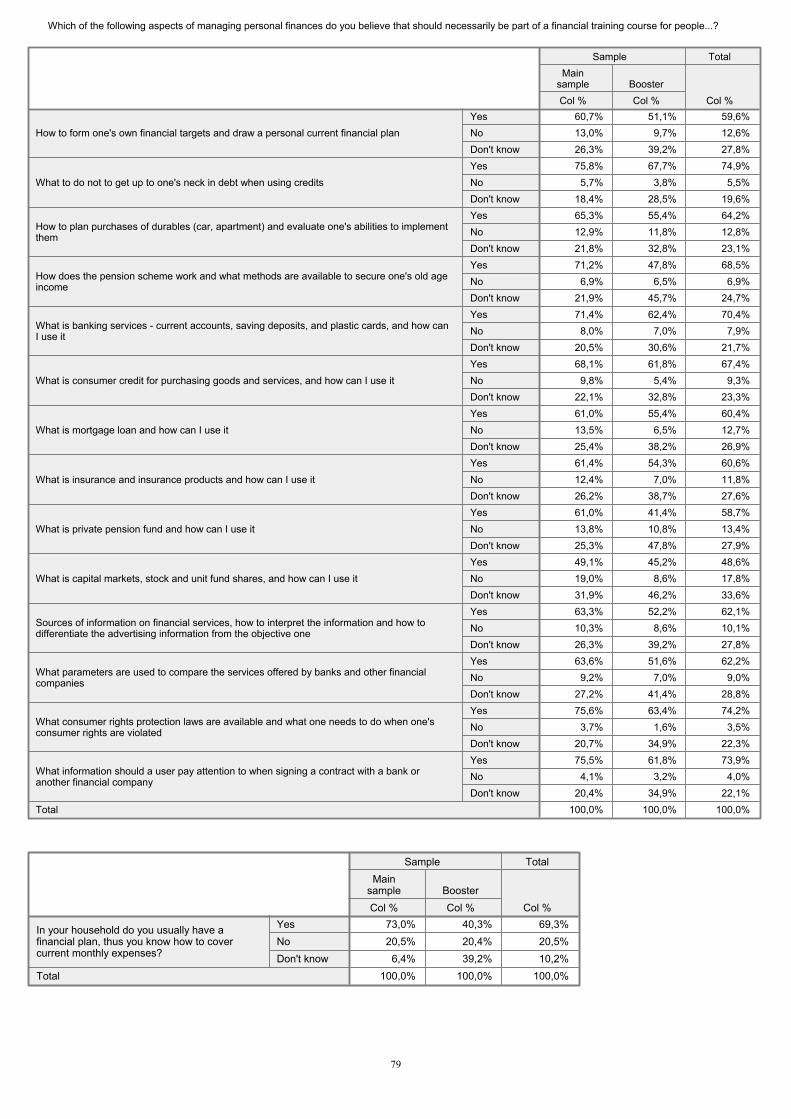
Which of the following aspects of managing personal finances do you believe that should necessarily be part of a financial training course for people...?
60,7% 51,1% 59,6%13,0% 9,7% 12,6%26,3% 39,2% 27,8%75,8% 67,7% 74,9%5,7% 3,8% 5,5%
18,4% 28,5% 19,6%65,3% 55,4% 64,2%12,9% 11,8% 12,8%21,8% 32,8% 23,1%71,2% 47,8% 68,5%6,9% 6,5% 6,9%
21,9% 45,7% 24,7%71,4% 62,4% 70,4%8,0% 7,0% 7,9%
20,5% 30,6% 21,7%68,1% 61,8% 67,4%9,8% 5,4% 9,3%
22,1% 32,8% 23,3%61,0% 55,4% 60,4%13,5% 6,5% 12,7%25,4% 38,2% 26,9%61,4% 54,3% 60,6%12,4% 7,0% 11,8%26,2% 38,7% 27,6%61,0% 41,4% 58,7%13,8% 10,8% 13,4%25,3% 47,8% 27,9%49,1% 45,2% 48,6%19,0% 8,6% 17,8%31,9% 46,2% 33,6%63,3% 52,2% 62,1%10,3% 8,6% 10,1%26,3% 39,2% 27,8%63,6% 51,6% 62,2%9,2% 7,0% 9,0%
27,2% 41,4% 28,8%75,6% 63,4% 74,2%3,7% 1,6% 3,5%
20,7% 34,9% 22,3%75,5% 61,8% 73,9%4,1% 3,2% 4,0%
20,4% 34,9% 22,1%100,0% 100,0% 100,0%
YesNoDon't know
How to form one's own financial targets and draw a personal current financial plan
YesNoDon't know
What to do not to get up to one's neck in debt when using credits
YesNoDon't know
How to plan purchases of durables (car, apartment) and evaluate one's abilities to implementthem
YesNoDon't know
How does the pension scheme work and what methods are available to secure one's old ageincome
YesNoDon't know
What is banking services - current accounts, saving deposits, and plastic cards, and how canI use it
YesNoDon't know
What is consumer credit for purchasing goods and services, and how can I use it
YesNoDon't know
What is mortgage loan and how can I use it
YesNoDon't know
What is insurance and insurance products and how can I use it
YesNoDon't know
What is private pension fund and how can I use it
YesNoDon't know
What is capital markets, stock and unit fund shares, and how can I use it
YesNoDon't know
Sources of information on financial services, how to interpret the information and how todifferentiate the advertising information from the objective one
YesNoDon't know
What parameters are used to compare the services offered by banks and other financialcompanies
YesNoDon't know
What consumer rights protection laws are available and what one needs to do when one'sconsumer rights are violated
YesNoDon't know
What information should a user pay attention to when signing a contract with a bank oranother financial company
Total
Col %
Mainsample
Col %Booster
Sample
Col %
Total
73,0% 40,3% 69,3%20,5% 20,4% 20,5%6,4% 39,2% 10,2%
100,0% 100,0% 100,0%
YesNoDon't know
In your household do you usually have afinancial plan, thus you know how to covercurrent monthly expenses?
Total
Col %
Mainsample
Col %Booster
Sample
Col %
Total
79
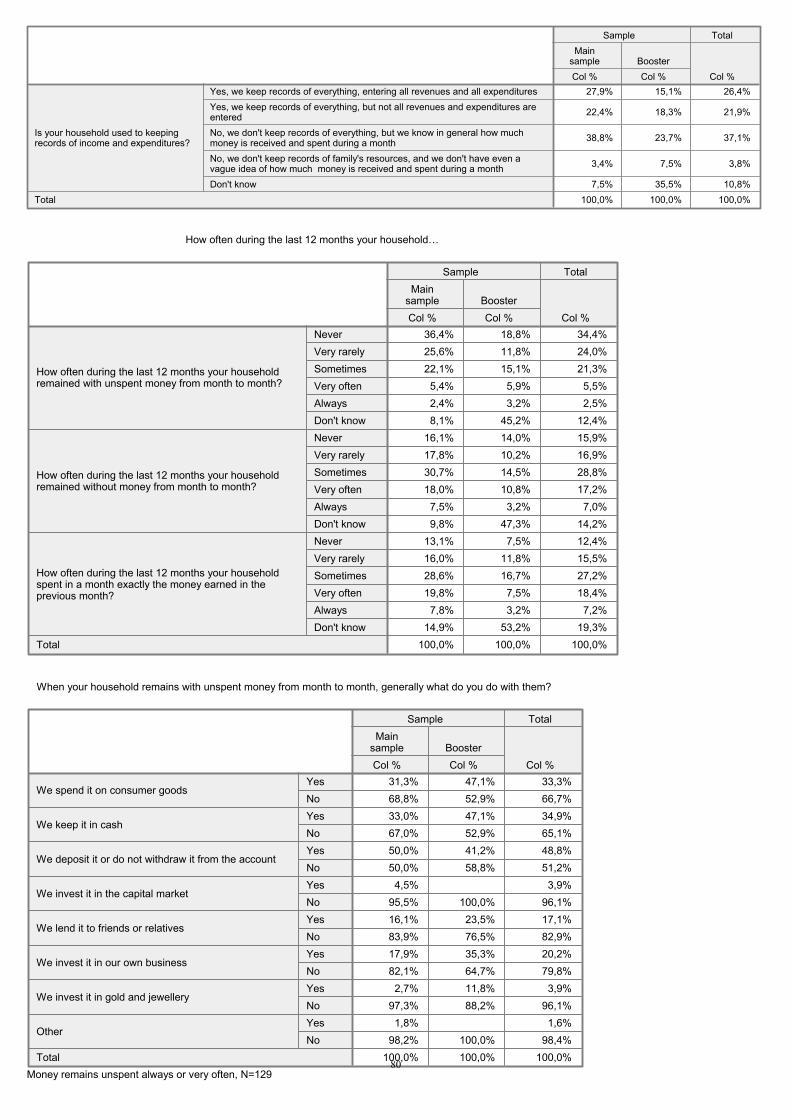
27,9% 15,1% 26,4%
22,4% 18,3% 21,9%
38,8% 23,7% 37,1%
3,4% 7,5% 3,8%
7,5% 35,5% 10,8%100,0% 100,0% 100,0%
Yes, we keep records of everything, entering all revenues and all expendituresYes, we keep records of everything, but not all revenues and expenditures areenteredNo, we don't keep records of everything, but we know in general how muchmoney is received and spent during a monthNo, we don't keep records of family's resources, and we don't have even avague idea of how much money is received and spent during a monthDon't know
Is your household used to keepingrecords of income and expenditures?
Total
Col %
Mainsample
Col %Booster
Sample
Col %
Total
How often during the last 12 months your household�…
36,4% 18,8% 34,4%25,6% 11,8% 24,0%22,1% 15,1% 21,3%5,4% 5,9% 5,5%2,4% 3,2% 2,5%8,1% 45,2% 12,4%
16,1% 14,0% 15,9%17,8% 10,2% 16,9%30,7% 14,5% 28,8%18,0% 10,8% 17,2%7,5% 3,2% 7,0%9,8% 47,3% 14,2%
13,1% 7,5% 12,4%16,0% 11,8% 15,5%28,6% 16,7% 27,2%19,8% 7,5% 18,4%7,8% 3,2% 7,2%
14,9% 53,2% 19,3%100,0% 100,0% 100,0%
NeverVery rarelySometimesVery oftenAlwaysDon't know
How often during the last 12 months your householdremained with unspent money from month to month?
NeverVery rarelySometimesVery oftenAlwaysDon't know
How often during the last 12 months your householdremained without money from month to month?
NeverVery rarelySometimesVery oftenAlwaysDon't know
How often during the last 12 months your householdspent in a month exactly the money earned in theprevious month?
Total
Col %
Mainsample
Col %Booster
Sample
Col %
Total
When your household remains with unspent money from month to month, generally what do you do with them?
31,3% 47,1% 33,3%68,8% 52,9% 66,7%33,0% 47,1% 34,9%67,0% 52,9% 65,1%50,0% 41,2% 48,8%50,0% 58,8% 51,2%4,5% 3,9%
95,5% 100,0% 96,1%16,1% 23,5% 17,1%83,9% 76,5% 82,9%17,9% 35,3% 20,2%82,1% 64,7% 79,8%2,7% 11,8% 3,9%
97,3% 88,2% 96,1%1,8% 1,6%
98,2% 100,0% 98,4%100,0% 100,0% 100,0%
YesNo
We spend it on consumer goods
YesNo
We keep it in cash
YesNo
We deposit it or do not withdraw it from the account
YesNo
We invest it in the capital market
YesNo
We lend it to friends or relatives
YesNo
We invest it in our own business
YesNo
We invest it in gold and jewellery
YesNo
Other
Total
Col %
Mainsample
Col %Booster
Sample
Col %
Total
Money remains unspent always or very often, N=12980
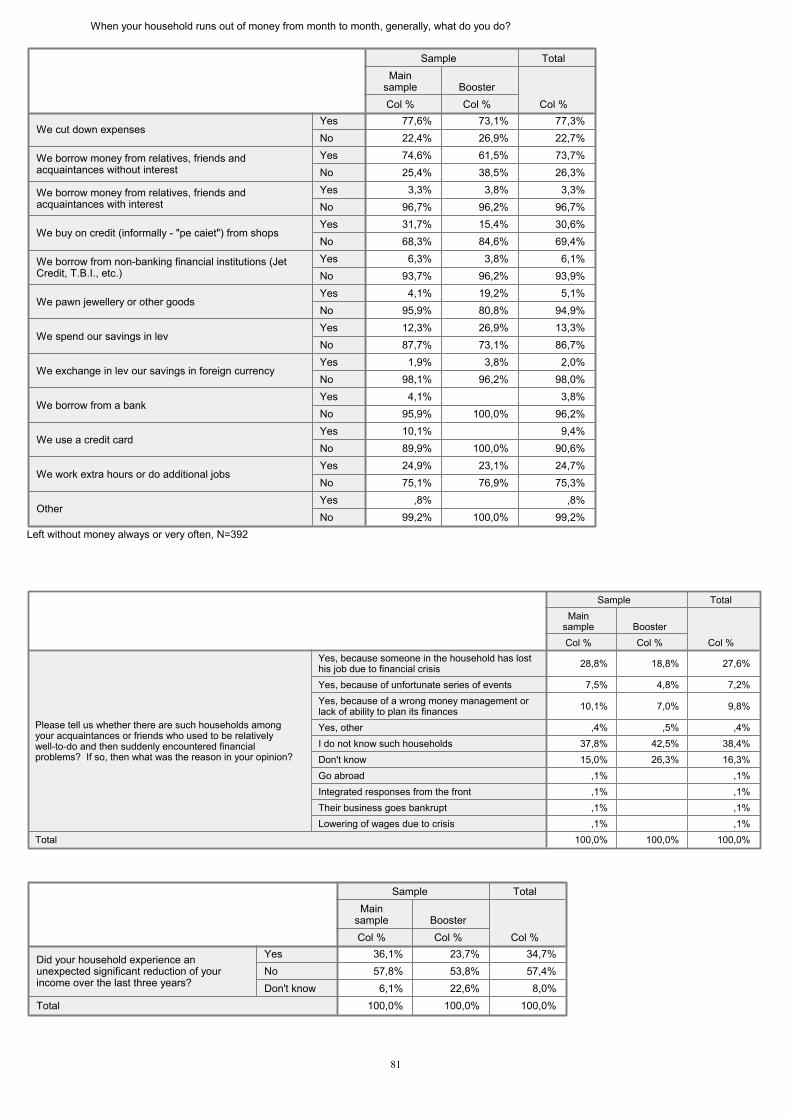
When your household runs out of money from month to month, generally, what do you do?
77,6% 73,1% 77,3%22,4% 26,9% 22,7%74,6% 61,5% 73,7%25,4% 38,5% 26,3%3,3% 3,8% 3,3%
96,7% 96,2% 96,7%31,7% 15,4% 30,6%68,3% 84,6% 69,4%6,3% 3,8% 6,1%
93,7% 96,2% 93,9%4,1% 19,2% 5,1%
95,9% 80,8% 94,9%12,3% 26,9% 13,3%87,7% 73,1% 86,7%1,9% 3,8% 2,0%
98,1% 96,2% 98,0%4,1% 3,8%
95,9% 100,0% 96,2%10,1% 9,4%89,9% 100,0% 90,6%24,9% 23,1% 24,7%75,1% 76,9% 75,3%
,8% ,8%99,2% 100,0% 99,2%
YesNo
We cut down expenses
YesNo
We borrow money from relatives, friends andacquaintances without interest
YesNo
We borrow money from relatives, friends andacquaintances with interest
YesNo
We buy on credit (informally - "pe caiet") from shops
YesNo
We borrow from non-banking financial institutions (JetCredit, T.B.I., etc.)
YesNo
We pawn jewellery or other goods
YesNo
We spend our savings in lev
YesNo
We exchange in lev our savings in foreign currency
YesNo
We borrow from a bank
YesNo
We use a credit card
YesNo
We work extra hours or do additional jobs
YesNo
Other
Col %
Mainsample
Col %Booster
Sample
Col %
Total
Left without money always or very often, N=392
28,8% 18,8% 27,6%
7,5% 4,8% 7,2%
10,1% 7,0% 9,8%
,4% ,5% ,4%37,8% 42,5% 38,4%15,0% 26,3% 16,3%
,1% ,1%,1% ,1%,1% ,1%,1% ,1%
100,0% 100,0% 100,0%
Yes, because someone in the household has losthis job due to financial crisisYes, because of unfortunate series of eventsYes, because of a wrong money management orlack of ability to plan its financesYes, otherI do not know such householdsDon't knowGo abroadIntegrated responses from the frontTheir business goes bankruptLowering of wages due to crisis
Please tell us whether there are such households amongyour acquaintances or friends who used to be relativelywell-to-do and then suddenly encountered financialproblems? If so, then what was the reason in your opinion?
Total
Col %
Mainsample
Col %Booster
Sample
Col %
Total
36,1% 23,7% 34,7%57,8% 53,8% 57,4%6,1% 22,6% 8,0%
100,0% 100,0% 100,0%
YesNoDon't know
Did your household experience anunexpected significant reduction of yourincome over the last three years?
Total
Col %
Mainsample
Col %Booster
Sample
Col %
Total
81
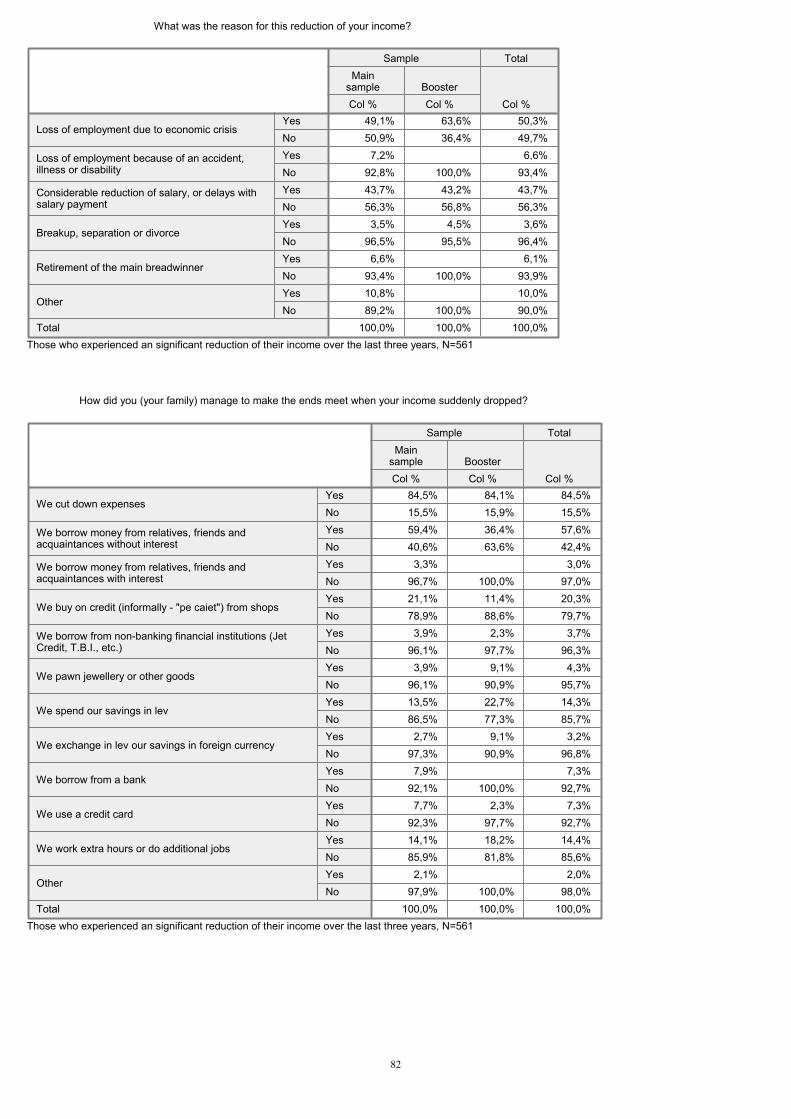
What was the reason for this reduction of your income?
49,1% 63,6% 50,3%50,9% 36,4% 49,7%7,2% 6,6%
92,8% 100,0% 93,4%43,7% 43,2% 43,7%56,3% 56,8% 56,3%3,5% 4,5% 3,6%
96,5% 95,5% 96,4%6,6% 6,1%
93,4% 100,0% 93,9%10,8% 10,0%89,2% 100,0% 90,0%
100,0% 100,0% 100,0%
YesNo
Loss of employment due to economic crisis
YesNo
Loss of employment because of an accident,illness or disability
YesNo
Considerable reduction of salary, or delays withsalary payment
YesNo
Breakup, separation or divorce
YesNo
Retirement of the main breadwinner
YesNo
Other
Total
Col %
Mainsample
Col %Booster
Sample
Col %
Total
Those who experienced an significant reduction of their income over the last three years, N=561
How did you (your family) manage to make the ends meet when your income suddenly dropped?
84,5% 84,1% 84,5%15,5% 15,9% 15,5%59,4% 36,4% 57,6%40,6% 63,6% 42,4%3,3% 3,0%
96,7% 100,0% 97,0%21,1% 11,4% 20,3%78,9% 88,6% 79,7%3,9% 2,3% 3,7%
96,1% 97,7% 96,3%3,9% 9,1% 4,3%
96,1% 90,9% 95,7%13,5% 22,7% 14,3%86,5% 77,3% 85,7%2,7% 9,1% 3,2%
97,3% 90,9% 96,8%7,9% 7,3%
92,1% 100,0% 92,7%7,7% 2,3% 7,3%
92,3% 97,7% 92,7%14,1% 18,2% 14,4%85,9% 81,8% 85,6%2,1% 2,0%
97,9% 100,0% 98,0%100,0% 100,0% 100,0%
YesNo
We cut down expenses
YesNo
We borrow money from relatives, friends andacquaintances without interest
YesNo
We borrow money from relatives, friends andacquaintances with interest
YesNo
We buy on credit (informally - "pe caiet") from shops
YesNo
We borrow from non-banking financial institutions (JetCredit, T.B.I., etc.)
YesNo
We pawn jewellery or other goods
YesNo
We spend our savings in lev
YesNo
We exchange in lev our savings in foreign currency
YesNo
We borrow from a bank
YesNo
We use a credit card
YesNo
We work extra hours or do additional jobs
YesNo
Other
Total
Col %
Mainsample
Col %Booster
Sample
Col %
Total
Those who experienced an significant reduction of their income over the last three years, N=561
82
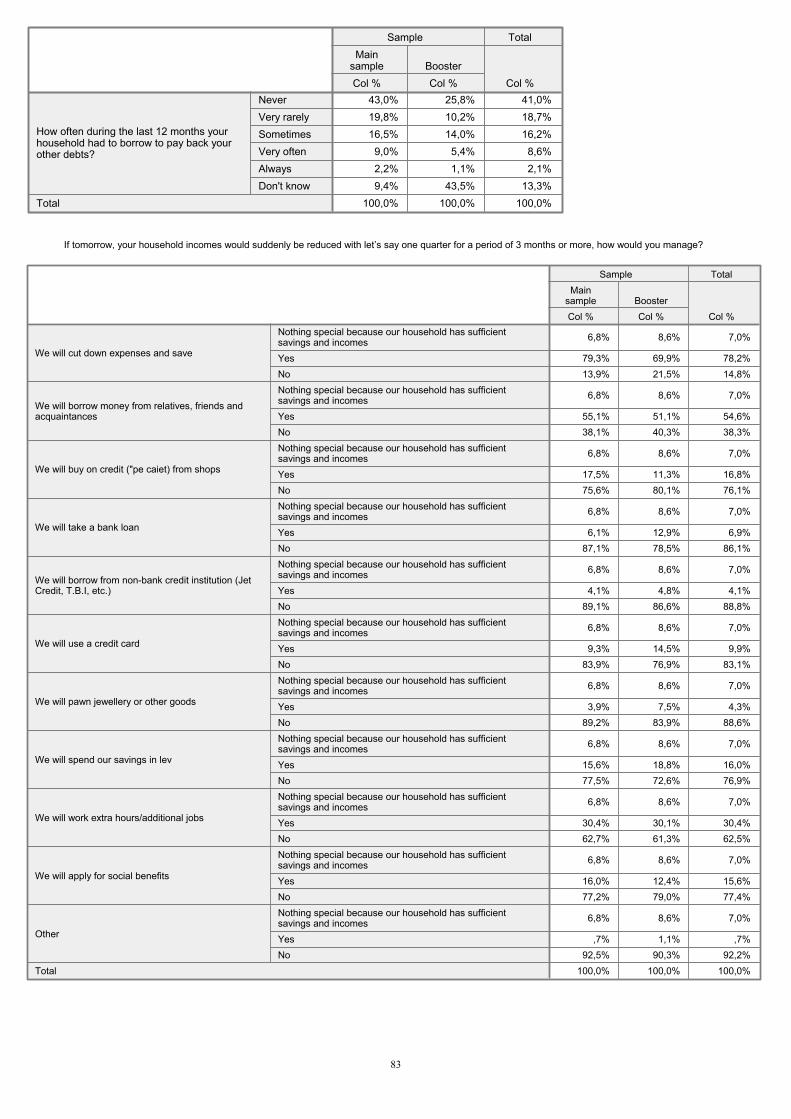
43,0% 25,8% 41,0%19,8% 10,2% 18,7%16,5% 14,0% 16,2%9,0% 5,4% 8,6%2,2% 1,1% 2,1%9,4% 43,5% 13,3%
100,0% 100,0% 100,0%
NeverVery rarelySometimesVery oftenAlwaysDon't know
How often during the last 12 months yourhousehold had to borrow to pay back yourother debts?
Total
Col %
Mainsample
Col %Booster
Sample
Col %
Total
If tomorrow, your household incomes would suddenly be reduced with let�’s say one quarter for a period of 3 months or more, how would you manage?
6,8% 8,6% 7,0%
79,3% 69,9% 78,2%13,9% 21,5% 14,8%
6,8% 8,6% 7,0%
55,1% 51,1% 54,6%38,1% 40,3% 38,3%
6,8% 8,6% 7,0%
17,5% 11,3% 16,8%75,6% 80,1% 76,1%
6,8% 8,6% 7,0%
6,1% 12,9% 6,9%87,1% 78,5% 86,1%
6,8% 8,6% 7,0%
4,1% 4,8% 4,1%89,1% 86,6% 88,8%
6,8% 8,6% 7,0%
9,3% 14,5% 9,9%83,9% 76,9% 83,1%
6,8% 8,6% 7,0%
3,9% 7,5% 4,3%89,2% 83,9% 88,6%
6,8% 8,6% 7,0%
15,6% 18,8% 16,0%77,5% 72,6% 76,9%
6,8% 8,6% 7,0%
30,4% 30,1% 30,4%62,7% 61,3% 62,5%
6,8% 8,6% 7,0%
16,0% 12,4% 15,6%77,2% 79,0% 77,4%
6,8% 8,6% 7,0%
,7% 1,1% ,7%92,5% 90,3% 92,2%
100,0% 100,0% 100,0%
Nothing special because our household has sufficientsavings and incomesYesNo
We will cut down expenses and save
Nothing special because our household has sufficientsavings and incomesYesNo
We will borrow money from relatives, friends andacquaintances
Nothing special because our household has sufficientsavings and incomesYesNo
We will buy on credit ("pe caiet) from shops
Nothing special because our household has sufficientsavings and incomesYesNo
We will take a bank loan
Nothing special because our household has sufficientsavings and incomesYesNo
We will borrow from non-bank credit institution (JetCredit, T.B.I, etc.)
Nothing special because our household has sufficientsavings and incomesYesNo
We will use a credit card
Nothing special because our household has sufficientsavings and incomesYesNo
We will pawn jewellery or other goods
Nothing special because our household has sufficientsavings and incomesYesNo
We will spend our savings in lev
Nothing special because our household has sufficientsavings and incomesYesNo
We will work extra hours/additional jobs
Nothing special because our household has sufficientsavings and incomesYesNo
We will apply for social benefits
Nothing special because our household has sufficientsavings and incomesYesNo
Other
Total
Col %
Mainsample
Col %Booster
Sample
Col %
Total
83
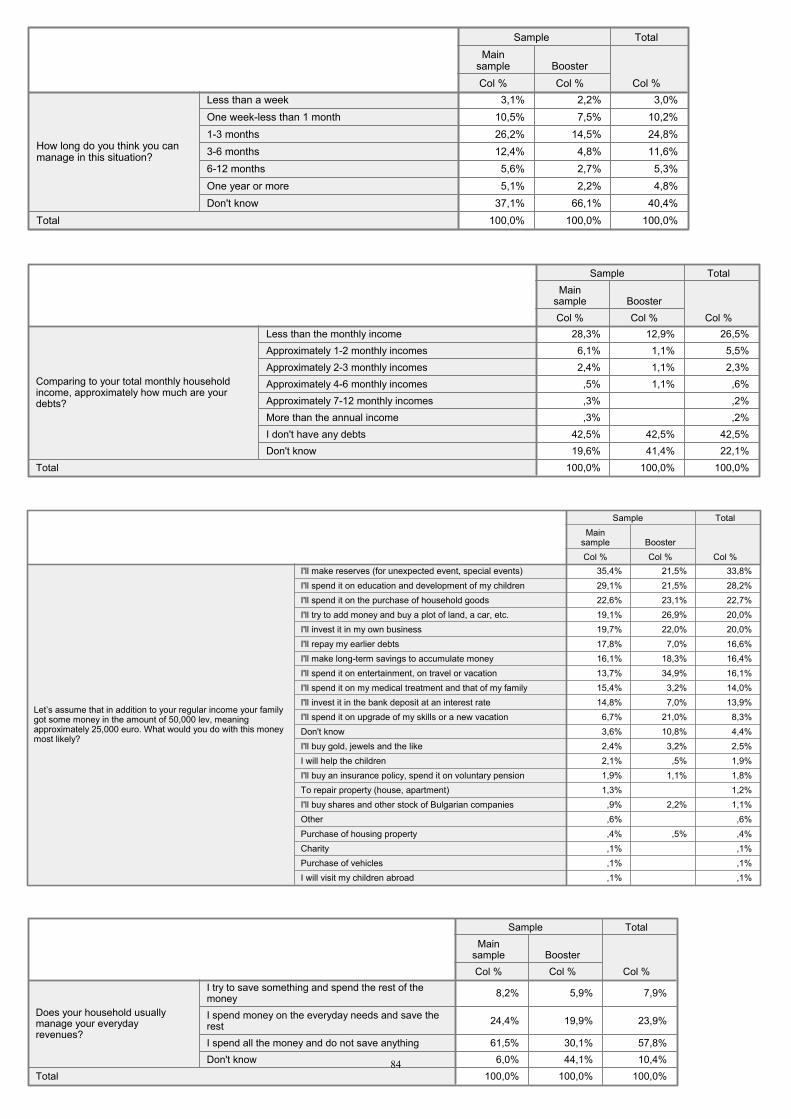
3,1% 2,2% 3,0%10,5% 7,5% 10,2%26,2% 14,5% 24,8%12,4% 4,8% 11,6%5,6% 2,7% 5,3%5,1% 2,2% 4,8%
37,1% 66,1% 40,4%100,0% 100,0% 100,0%
Less than a weekOne week-less than 1 month1-3 months3-6 months6-12 monthsOne year or moreDon't know
How long do you think you canmanage in this situation?
Total
Col %
Mainsample
Col %Booster
Sample
Col %
Total
28,3% 12,9% 26,5%6,1% 1,1% 5,5%2,4% 1,1% 2,3%,5% 1,1% ,6%,3% ,2%,3% ,2%
42,5% 42,5% 42,5%19,6% 41,4% 22,1%
100,0% 100,0% 100,0%
Less than the monthly incomeApproximately 1-2 monthly incomesApproximately 2-3 monthly incomesApproximately 4-6 monthly incomesApproximately 7-12 monthly incomesMore than the annual incomeI don't have any debtsDon't know
Comparing to your total monthly householdincome, approximately how much are yourdebts?
Total
Col %
Mainsample
Col %Booster
Sample
Col %
Total
35,4% 21,5% 33,8%29,1% 21,5% 28,2%22,6% 23,1% 22,7%19,1% 26,9% 20,0%19,7% 22,0% 20,0%17,8% 7,0% 16,6%16,1% 18,3% 16,4%13,7% 34,9% 16,1%15,4% 3,2% 14,0%14,8% 7,0% 13,9%6,7% 21,0% 8,3%3,6% 10,8% 4,4%2,4% 3,2% 2,5%2,1% ,5% 1,9%1,9% 1,1% 1,8%1,3% 1,2%,9% 2,2% 1,1%,6% ,6%,4% ,5% ,4%,1% ,1%,1% ,1%,1% ,1%
I'll make reserves (for unexpected event, special events)I'll spend it on education and development of my childrenI'll spend it on the purchase of household goodsI'll try to add money and buy a plot of land, a car, etc.I'll invest it in my own businessI'll repay my earlier debtsI'll make long-term savings to accumulate moneyI'll spend it on entertainment, on travel or vacationI'll spend it on my medical treatment and that of my familyI'll invest it in the bank deposit at an interest rateI'll spend it on upgrade of my skills or a new vacationDon't knowI'll buy gold, jewels and the likeI will help the childrenI'll buy an insurance policy, spend it on voluntary pensionTo repair property (house, apartment)I'll buy shares and other stock of Bulgarian companiesOtherPurchase of housing propertyCharityPurchase of vehiclesI will visit my children abroad
Let�’s assume that in addition to your regular income your familygot some money in the amount of 50,000 lev, meaningapproximately 25,000 euro. What would you do with this moneymost likely?
Col %
Mainsample
Col %Booster
Sample
Col %
Total
8,2% 5,9% 7,9%
24,4% 19,9% 23,9%
61,5% 30,1% 57,8%6,0% 44,1% 10,4%
100,0% 100,0% 100,0%
I try to save something and spend the rest of themoneyI spend money on the everyday needs and save therestI spend all the money and do not save anythingDon't know
Does your household usuallymanage your everydayrevenues?
Total
Col %
Mainsample
Col %Booster
Sample
Col %
Total
84
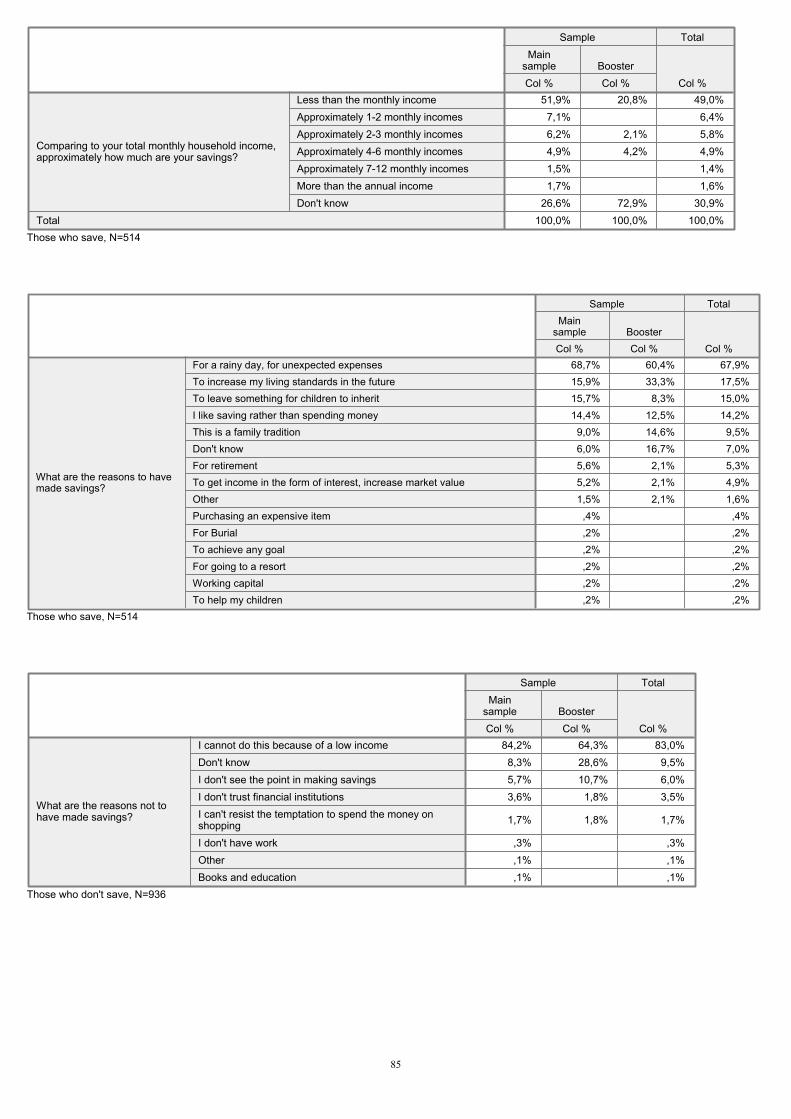
51,9% 20,8% 49,0%7,1% 6,4%6,2% 2,1% 5,8%4,9% 4,2% 4,9%1,5% 1,4%1,7% 1,6%
26,6% 72,9% 30,9%100,0% 100,0% 100,0%
Less than the monthly incomeApproximately 1-2 monthly incomesApproximately 2-3 monthly incomesApproximately 4-6 monthly incomesApproximately 7-12 monthly incomesMore than the annual incomeDon't know
Comparing to your total monthly household income,approximately how much are your savings?
Total
Col %
Mainsample
Col %Booster
Sample
Col %
Total
Those who save, N=514
68,7% 60,4% 67,9%15,9% 33,3% 17,5%15,7% 8,3% 15,0%14,4% 12,5% 14,2%
9,0% 14,6% 9,5%6,0% 16,7% 7,0%5,6% 2,1% 5,3%5,2% 2,1% 4,9%1,5% 2,1% 1,6%
,4% ,4%,2% ,2%,2% ,2%,2% ,2%,2% ,2%,2% ,2%
For a rainy day, for unexpected expensesTo increase my living standards in the futureTo leave something for children to inheritI like saving rather than spending moneyThis is a family traditionDon't knowFor retirementTo get income in the form of interest, increase market valueOtherPurchasing an expensive itemFor BurialTo achieve any goalFor going to a resortWorking capitalTo help my children
What are the reasons to havemade savings?
Col %
Mainsample
Col %Booster
Sample
Col %
Total
Those who save, N=514
84,2% 64,3% 83,0%8,3% 28,6% 9,5%5,7% 10,7% 6,0%3,6% 1,8% 3,5%
1,7% 1,8% 1,7%
,3% ,3%,1% ,1%,1% ,1%
I cannot do this because of a low incomeDon't knowI don't see the point in making savingsI don't trust financial institutionsI can't resist the temptation to spend the money onshoppingI don't have workOtherBooks and education
What are the reasons not tohave made savings?
Col %
Mainsample
Col %Booster
Sample
Col %
Total
Those who don't save, N=936
85
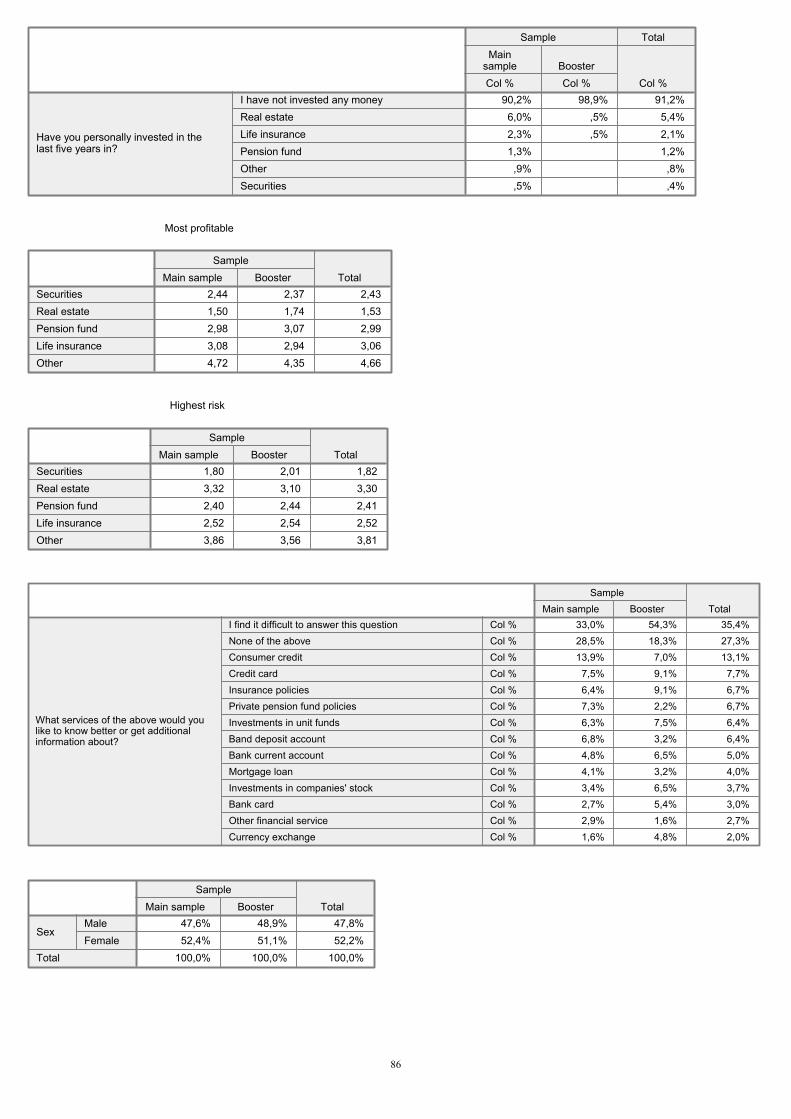
90,2% 98,9% 91,2%6,0% ,5% 5,4%2,3% ,5% 2,1%1,3% 1,2%,9% ,8%,5% ,4%
I have not invested any moneyReal estateLife insurancePension fundOtherSecurities
Have you personally invested in thelast five years in?
Col %
Mainsample
Col %Booster
Sample
Col %
Total
Most profitable
2,44 2,37 2,431,50 1,74 1,532,98 3,07 2,993,08 2,94 3,064,72 4,35 4,66
SecuritiesReal estatePension fundLife insuranceOther
Main sample BoosterSample
Total
Highest risk
1,80 2,01 1,823,32 3,10 3,302,40 2,44 2,412,52 2,54 2,523,86 3,56 3,81
SecuritiesReal estatePension fundLife insuranceOther
Main sample BoosterSample
Total
33,0% 54,3% 35,4%28,5% 18,3% 27,3%13,9% 7,0% 13,1%
7,5% 9,1% 7,7%6,4% 9,1% 6,7%7,3% 2,2% 6,7%6,3% 7,5% 6,4%6,8% 3,2% 6,4%4,8% 6,5% 5,0%4,1% 3,2% 4,0%3,4% 6,5% 3,7%2,7% 5,4% 3,0%2,9% 1,6% 2,7%1,6% 4,8% 2,0%
Col %I find it difficult to answer this questionCol %None of the aboveCol %Consumer creditCol %Credit cardCol %Insurance policiesCol %Private pension fund policiesCol %Investments in unit fundsCol %Band deposit accountCol %Bank current accountCol %Mortgage loanCol %Investments in companies' stockCol %Bank cardCol %Other financial serviceCol %Currency exchange
What services of the above would youlike to know better or get additionalinformation about?
Main sample BoosterSample
Total
47,6% 48,9% 47,8%52,4% 51,1% 52,2%
100,0% 100,0% 100,0%
MaleFemale
Sex
Total
Main sample BoosterSample
Total
86
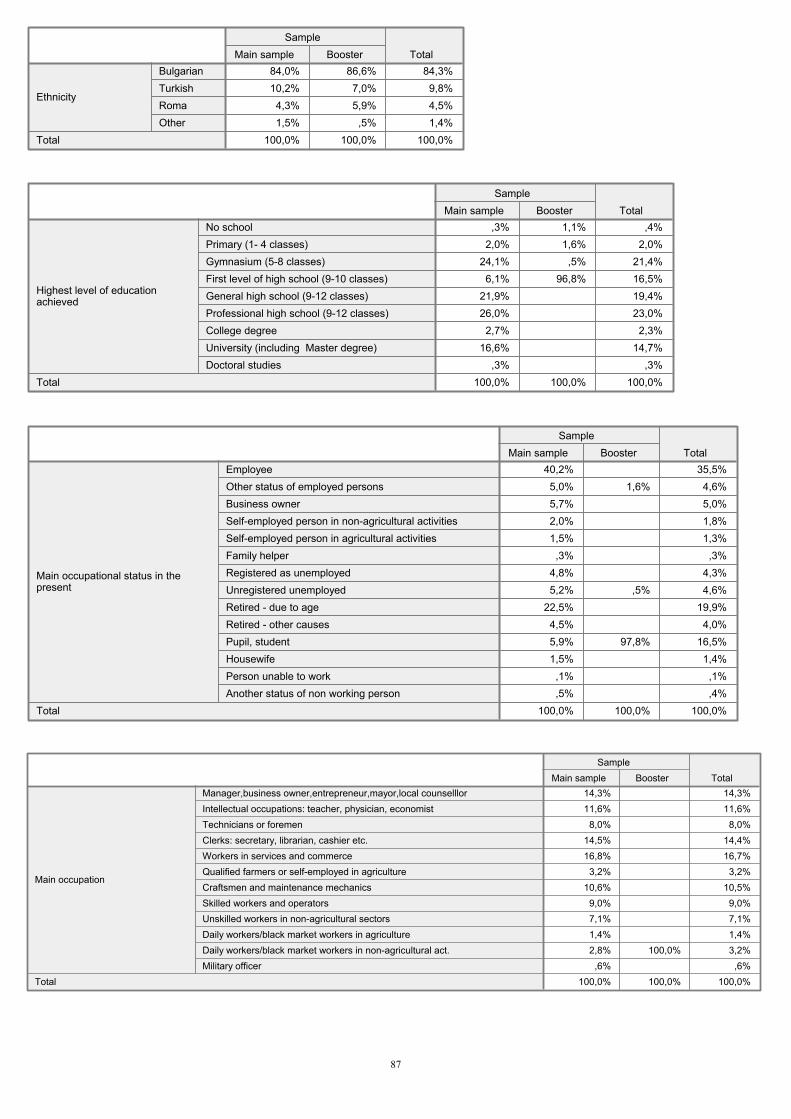
84,0% 86,6% 84,3%10,2% 7,0% 9,8%4,3% 5,9% 4,5%1,5% ,5% 1,4%
100,0% 100,0% 100,0%
BulgarianTurkishRomaOther
Ethnicity
Total
Main sample BoosterSample
Total
,3% 1,1% ,4%2,0% 1,6% 2,0%
24,1% ,5% 21,4%6,1% 96,8% 16,5%
21,9% 19,4%26,0% 23,0%2,7% 2,3%
16,6% 14,7%,3% ,3%
100,0% 100,0% 100,0%
No schoolPrimary (1- 4 classes)Gymnasium (5-8 classes)First level of high school (9-10 classes)General high school (9-12 classes)Professional high school (9-12 classes)College degreeUniversity (including Master degree)Doctoral studies
Highest level of educationachieved
Total
Main sample BoosterSample
Total
40,2% 35,5%5,0% 1,6% 4,6%5,7% 5,0%2,0% 1,8%1,5% 1,3%,3% ,3%
4,8% 4,3%5,2% ,5% 4,6%
22,5% 19,9%4,5% 4,0%5,9% 97,8% 16,5%1,5% 1,4%,1% ,1%,5% ,4%
100,0% 100,0% 100,0%
EmployeeOther status of employed personsBusiness ownerSelf-employed person in non-agricultural activitiesSelf-employed person in agricultural activitiesFamily helperRegistered as unemployedUnregistered unemployedRetired - due to ageRetired - other causesPupil, studentHousewifePerson unable to workAnother status of non working person
Main occupational status in thepresent
Total
Main sample BoosterSample
Total
14,3% 14,3%11,6% 11,6%
8,0% 8,0%14,5% 14,4%16,8% 16,7%
3,2% 3,2%10,6% 10,5%
9,0% 9,0%7,1% 7,1%1,4% 1,4%2,8% 100,0% 3,2%
,6% ,6%100,0% 100,0% 100,0%
Manager,business owner,entrepreneur,mayor,local counselllorIntellectual occupations: teacher, physician, economistTechnicians or foremenClerks: secretary, librarian, cashier etc.Workers in services and commerceQualified farmers or self-employed in agricultureCraftsmen and maintenance mechanicsSkilled workers and operatorsUnskilled workers in non-agricultural sectorsDaily workers/black market workers in agricultureDaily workers/black market workers in non-agricultural act.Military officer
Main occupation
Total
Main sample BoosterSample
Total
87
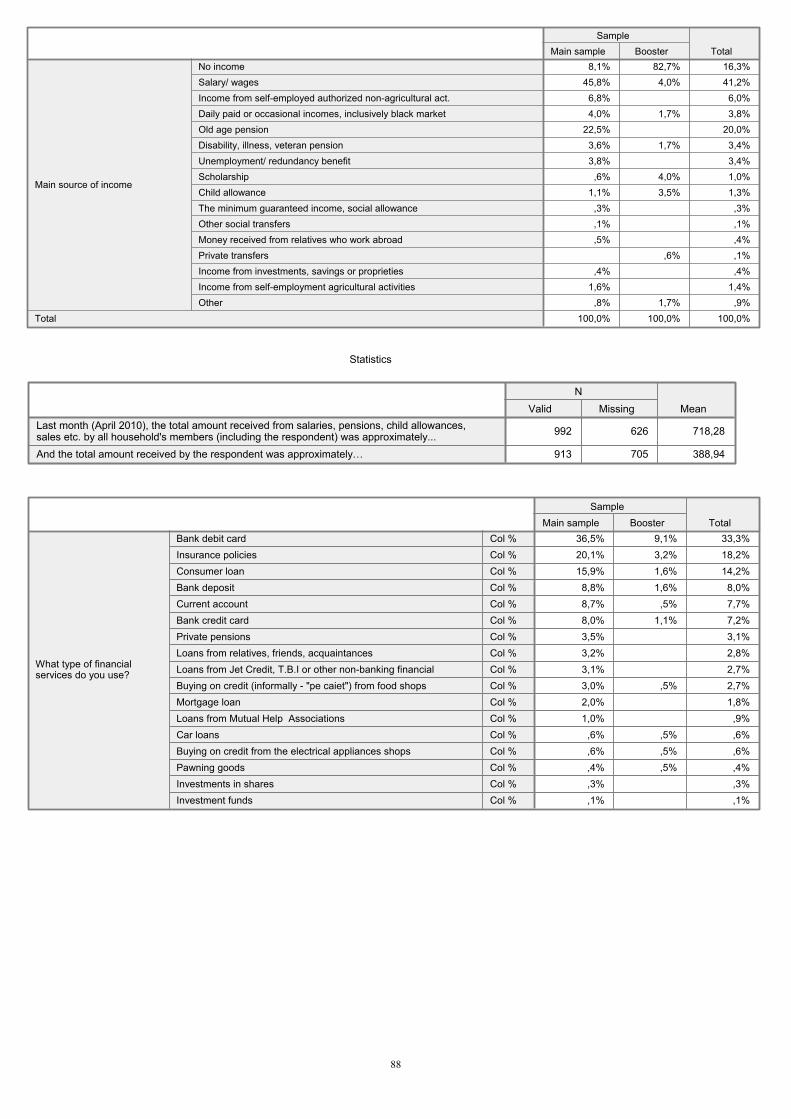
8,1% 82,7% 16,3%45,8% 4,0% 41,2%6,8% 6,0%4,0% 1,7% 3,8%
22,5% 20,0%3,6% 1,7% 3,4%3,8% 3,4%,6% 4,0% 1,0%
1,1% 3,5% 1,3%,3% ,3%,1% ,1%,5% ,4%
,6% ,1%,4% ,4%
1,6% 1,4%,8% 1,7% ,9%
100,0% 100,0% 100,0%
No incomeSalary/ wagesIncome from self-employed authorized non-agricultural act.Daily paid or occasional incomes, inclusively black marketOld age pensionDisability, illness, veteran pensionUnemployment/ redundancy benefitScholarshipChild allowanceThe minimum guaranteed income, social allowanceOther social transfersMoney received from relatives who work abroadPrivate transfersIncome from investments, savings or proprietiesIncome from self-employment agricultural activitiesOther
Main source of income
Total
Main sample BoosterSample
Total
Statistics
992 626 718,28
913 705 388,94
Last month (April 2010), the total amount received from salaries, pensions, child allowances,sales etc. by all household's members (including the respondent) was approximately...And the total amount received by the respondent was approximately�…
Valid MissingN
Mean
36,5% 9,1% 33,3%20,1% 3,2% 18,2%15,9% 1,6% 14,2%
8,8% 1,6% 8,0%8,7% ,5% 7,7%8,0% 1,1% 7,2%3,5% 3,1%3,2% 2,8%3,1% 2,7%3,0% ,5% 2,7%2,0% 1,8%1,0% ,9%
,6% ,5% ,6%,6% ,5% ,6%,4% ,5% ,4%,3% ,3%,1% ,1%
Col %Bank debit cardCol %Insurance policiesCol %Consumer loanCol %Bank depositCol %Current accountCol %Bank credit cardCol %Private pensionsCol %Loans from relatives, friends, acquaintancesCol %Loans from Jet Credit, T.B.I or other non-banking financialCol %Buying on credit (informally - "pe caiet") from food shopsCol %Mortgage loanCol %Loans from Mutual Help AssociationsCol %Car loansCol %Buying on credit from the electrical appliances shopsCol %Pawning goodsCol %Investments in sharesCol %Investment funds
What type of financialservices do you use?
Main sample BoosterSample
Total
88
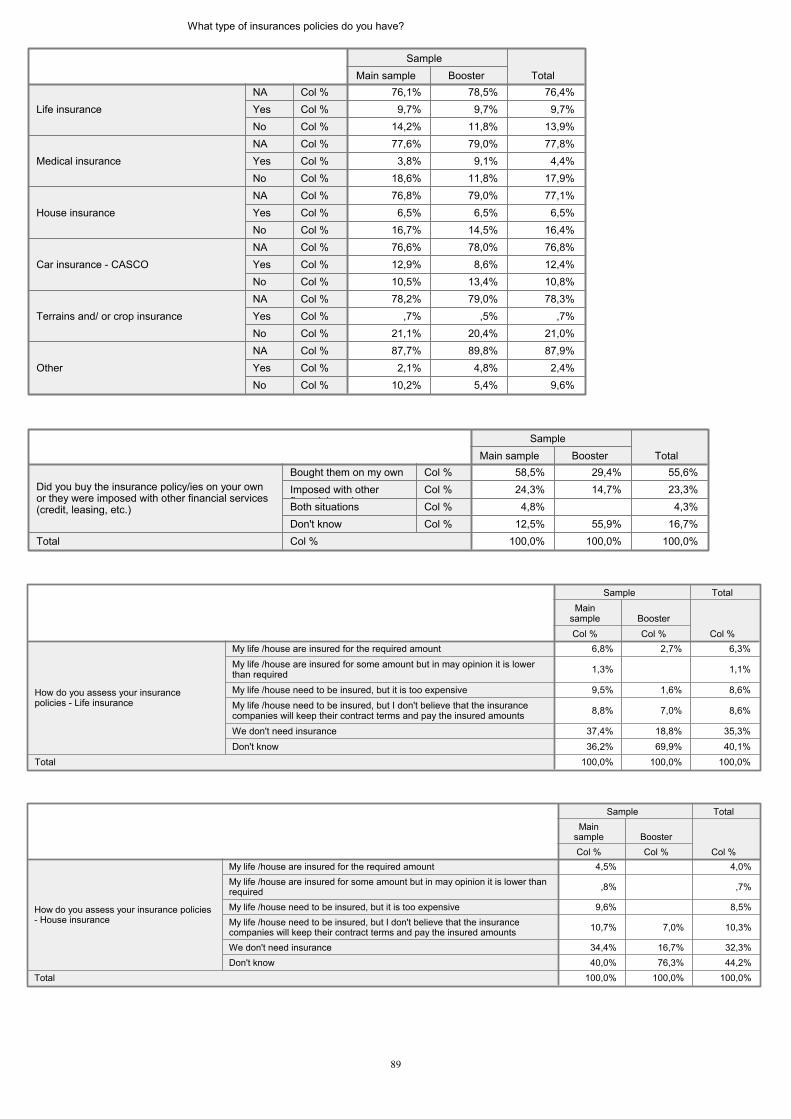
What type of insurances policies do you have?
76,1% 78,5% 76,4%9,7% 9,7% 9,7%
14,2% 11,8% 13,9%77,6% 79,0% 77,8%3,8% 9,1% 4,4%
18,6% 11,8% 17,9%76,8% 79,0% 77,1%6,5% 6,5% 6,5%
16,7% 14,5% 16,4%76,6% 78,0% 76,8%12,9% 8,6% 12,4%10,5% 13,4% 10,8%78,2% 79,0% 78,3%
,7% ,5% ,7%21,1% 20,4% 21,0%87,7% 89,8% 87,9%2,1% 4,8% 2,4%
10,2% 5,4% 9,6%
Col %NACol %YesCol %No
Life insurance
Col %NACol %YesCol %No
Medical insurance
Col %NACol %YesCol %No
House insurance
Col %NACol %YesCol %No
Car insurance - CASCO
Col %NACol %YesCol %No
Terrains and/ or crop insurance
Col %NACol %YesCol %No
Other
Main sample BoosterSample
Total
58,5% 29,4% 55,6%24,3% 14,7% 23,3%4,8% 4,3%
12,5% 55,9% 16,7%100,0% 100,0% 100,0%
Col %Bought them on my ownCol %Imposed with other
fi i l i Col %Both situationsCol %Don't know
Did you buy the insurance policy/ies on your ownor they were imposed with other financial services(credit, leasing, etc.)
Col %Total
Main sample BoosterSample
Total
6,8% 2,7% 6,3%
1,3% 1,1%
9,5% 1,6% 8,6%
8,8% 7,0% 8,6%
37,4% 18,8% 35,3%36,2% 69,9% 40,1%
100,0% 100,0% 100,0%
My life /house are insured for the required amountMy life /house are insured for some amount but in may opinion it is lowerthan requiredMy life /house need to be insured, but it is too expensiveMy life /house need to be insured, but I don't believe that the insurancecompanies will keep their contract terms and pay the insured amountsWe don't need insuranceDon't know
How do you assess your insurancepolicies - Life insurance
Total
Col %
Mainsample
Col %Booster
Sample
Col %
Total
4,5% 4,0%
,8% ,7%
9,6% 8,5%
10,7% 7,0% 10,3%
34,4% 16,7% 32,3%40,0% 76,3% 44,2%
100,0% 100,0% 100,0%
My life /house are insured for the required amountMy life /house are insured for some amount but in may opinion it is lower thanrequiredMy life /house need to be insured, but it is too expensiveMy life /house need to be insured, but I don't believe that the insurancecompanies will keep their contract terms and pay the insured amountsWe don't need insuranceDon't know
How do you assess your insurance policies- House insurance
Total
Col %
Mainsample
Col %Booster
Sample
Col %
Total
89
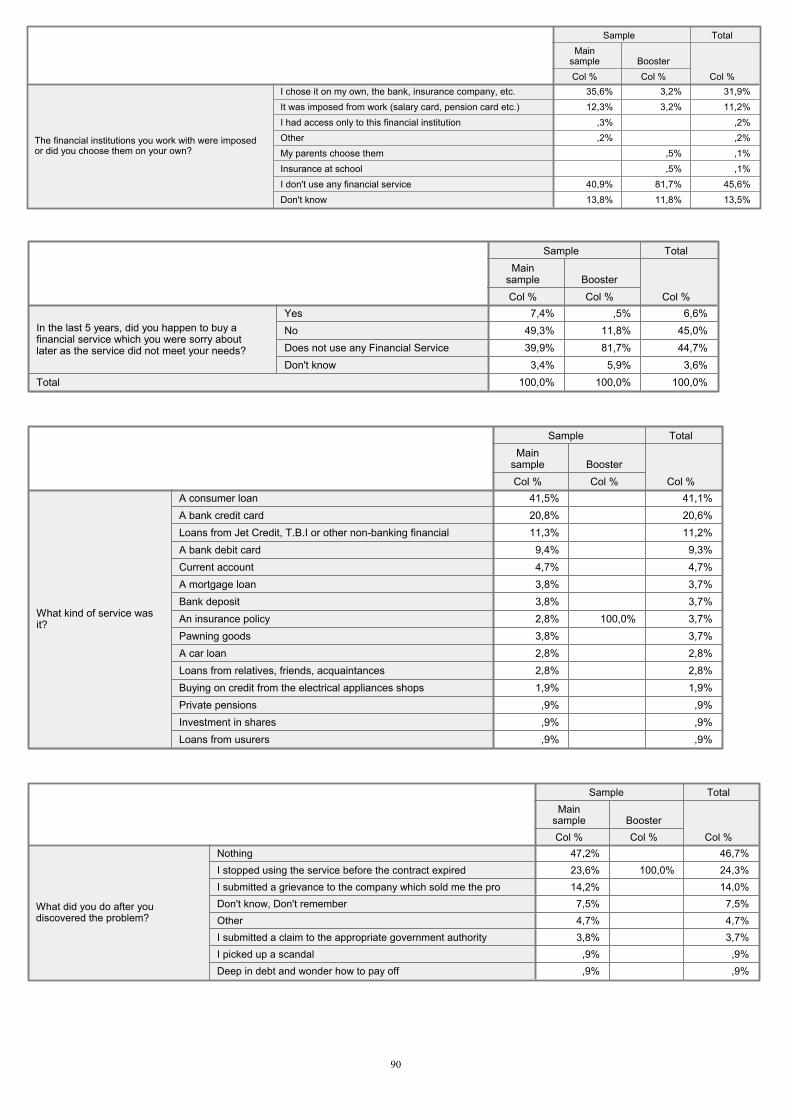
35,6% 3,2% 31,9%12,3% 3,2% 11,2%
,3% ,2%,2% ,2%
,5% ,1% ,5% ,1%
40,9% 81,7% 45,6%13,8% 11,8% 13,5%
I chose it on my own, the bank, insurance company, etc.It was imposed from work (salary card, pension card etc.)I had access only to this financial institutionOtherMy parents choose themInsurance at schoolI don't use any financial serviceDon't know
The financial institutions you work with were imposedor did you choose them on your own?
Col %
Mainsample
Col %Booster
Sample
Col %
Total
7,4% ,5% 6,6%49,3% 11,8% 45,0%39,9% 81,7% 44,7%3,4% 5,9% 3,6%
100,0% 100,0% 100,0%
YesNoDoes not use any Financial ServiceDon't know
In the last 5 years, did you happen to buy afinancial service which you were sorry aboutlater as the service did not meet your needs?
Total
Col %
Mainsample
Col %Booster
Sample
Col %
Total
41,5% 41,1%20,8% 20,6%11,3% 11,2%9,4% 9,3%4,7% 4,7%3,8% 3,7%3,8% 3,7%2,8% 100,0% 3,7%3,8% 3,7%2,8% 2,8%2,8% 2,8%1,9% 1,9%,9% ,9%,9% ,9%,9% ,9%
A consumer loanA bank credit cardLoans from Jet Credit, T.B.I or other non-banking financialA bank debit cardCurrent accountA mortgage loanBank depositAn insurance policyPawning goodsA car loanLoans from relatives, friends, acquaintancesBuying on credit from the electrical appliances shopsPrivate pensionsInvestment in sharesLoans from usurers
What kind of service wasit?
Col %
Mainsample
Col %Booster
Sample
Col %
Total
47,2% 46,7%23,6% 100,0% 24,3%14,2% 14,0%
7,5% 7,5%4,7% 4,7%3,8% 3,7%
,9% ,9%,9% ,9%
NothingI stopped using the service before the contract expiredI submitted a grievance to the company which sold me the proDon't know, Don't rememberOtherI submitted a claim to the appropriate government authorityI picked up a scandalDeep in debt and wonder how to pay off
What did you do after youdiscovered the problem?
Col %
Mainsample
Col %Booster
Sample
Col %
Total
90
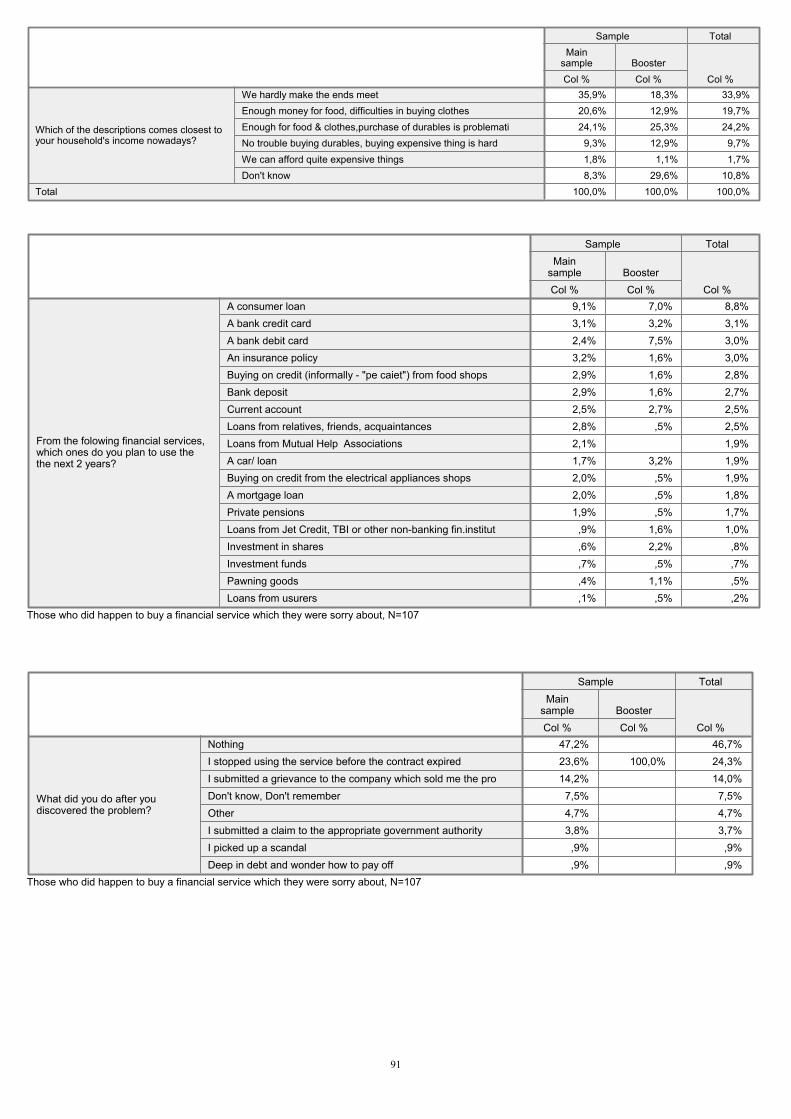
35,9% 18,3% 33,9%20,6% 12,9% 19,7%24,1% 25,3% 24,2%
9,3% 12,9% 9,7%1,8% 1,1% 1,7%8,3% 29,6% 10,8%
100,0% 100,0% 100,0%
We hardly make the ends meetEnough money for food, difficulties in buying clothesEnough for food & clothes,purchase of durables is problematiNo trouble buying durables, buying expensive thing is hardWe can afford quite expensive thingsDon't know
Which of the descriptions comes closest toyour household's income nowadays?
Total
Col %
Mainsample
Col %Booster
Sample
Col %
Total
9,1% 7,0% 8,8%3,1% 3,2% 3,1%2,4% 7,5% 3,0%3,2% 1,6% 3,0%2,9% 1,6% 2,8%2,9% 1,6% 2,7%2,5% 2,7% 2,5%2,8% ,5% 2,5%2,1% 1,9%1,7% 3,2% 1,9%2,0% ,5% 1,9%2,0% ,5% 1,8%1,9% ,5% 1,7%,9% 1,6% 1,0%,6% 2,2% ,8%,7% ,5% ,7%,4% 1,1% ,5%,1% ,5% ,2%
A consumer loanA bank credit cardA bank debit cardAn insurance policyBuying on credit (informally - "pe caiet") from food shopsBank depositCurrent accountLoans from relatives, friends, acquaintancesLoans from Mutual Help AssociationsA car/ loanBuying on credit from the electrical appliances shopsA mortgage loanPrivate pensionsLoans from Jet Credit, TBI or other non-banking fin.institutInvestment in sharesInvestment fundsPawning goodsLoans from usurers
From the folowing financial services,which ones do you plan to use thethe next 2 years?
Col %
Mainsample
Col %Booster
Sample
Col %
Total
Those who did happen to buy a financial service which they were sorry about, N=107
47,2% 46,7%23,6% 100,0% 24,3%14,2% 14,0%7,5% 7,5%4,7% 4,7%3,8% 3,7%,9% ,9%,9% ,9%
NothingI stopped using the service before the contract expiredI submitted a grievance to the company which sold me the proDon't know, Don't rememberOtherI submitted a claim to the appropriate government authorityI picked up a scandalDeep in debt and wonder how to pay off
What did you do after youdiscovered the problem?
Col %
Mainsample
Col %Booster
Sample
Col %
Total
Those who did happen to buy a financial service which they were sorry about, N=107
91
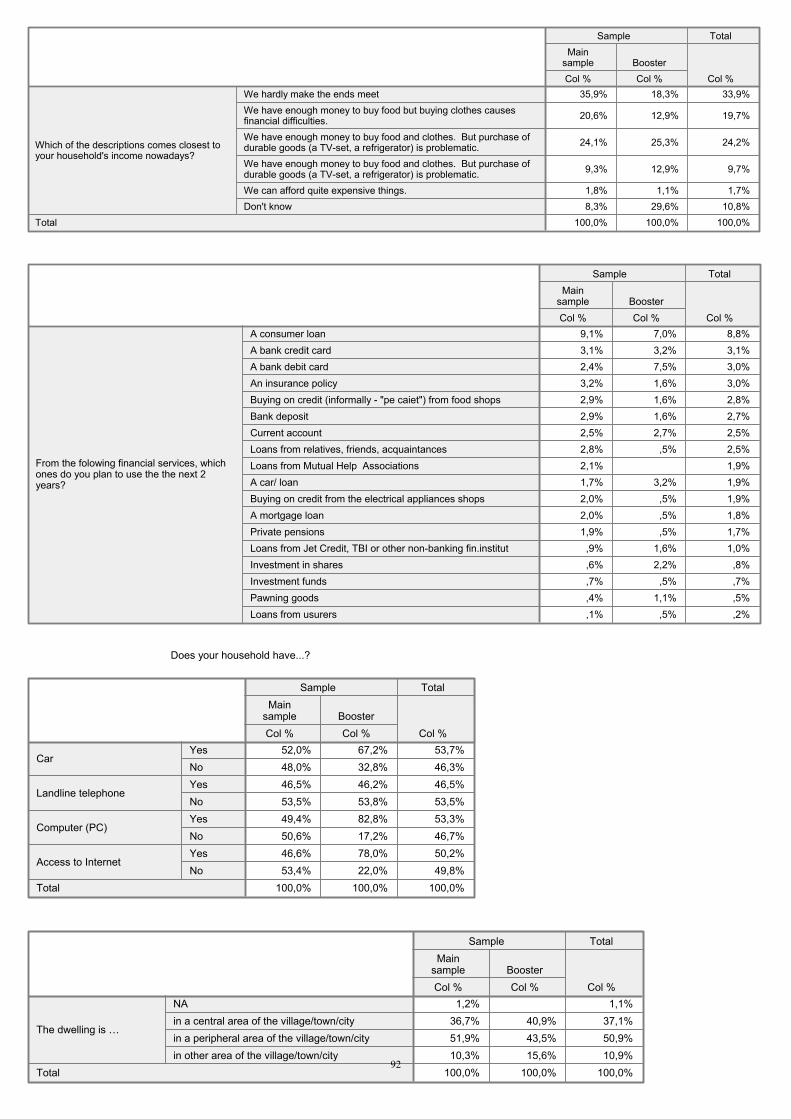
35,9% 18,3% 33,9%
20,6% 12,9% 19,7%
24,1% 25,3% 24,2%
9,3% 12,9% 9,7%
1,8% 1,1% 1,7%8,3% 29,6% 10,8%
100,0% 100,0% 100,0%
We hardly make the ends meetWe have enough money to buy food but buying clothes causesfinancial difficulties.We have enough money to buy food and clothes. But purchase ofdurable goods (a TV-set, a refrigerator) is problematic.We have enough money to buy food and clothes. But purchase ofdurable goods (a TV-set, a refrigerator) is problematic.We can afford quite expensive things.Don't know
Which of the descriptions comes closest toyour household's income nowadays?
Total
Col %
Mainsample
Col %Booster
Sample
Col %
Total
9,1% 7,0% 8,8%3,1% 3,2% 3,1%2,4% 7,5% 3,0%3,2% 1,6% 3,0%2,9% 1,6% 2,8%2,9% 1,6% 2,7%2,5% 2,7% 2,5%2,8% ,5% 2,5%2,1% 1,9%1,7% 3,2% 1,9%2,0% ,5% 1,9%2,0% ,5% 1,8%1,9% ,5% 1,7%,9% 1,6% 1,0%,6% 2,2% ,8%,7% ,5% ,7%,4% 1,1% ,5%,1% ,5% ,2%
A consumer loanA bank credit cardA bank debit cardAn insurance policyBuying on credit (informally - "pe caiet") from food shopsBank depositCurrent accountLoans from relatives, friends, acquaintancesLoans from Mutual Help AssociationsA car/ loanBuying on credit from the electrical appliances shopsA mortgage loanPrivate pensionsLoans from Jet Credit, TBI or other non-banking fin.institutInvestment in sharesInvestment fundsPawning goodsLoans from usurers
From the folowing financial services, whichones do you plan to use the the next 2years?
Col %
Mainsample
Col %Booster
Sample
Col %
Total
Does your household have...?
52,0% 67,2% 53,7%48,0% 32,8% 46,3%46,5% 46,2% 46,5%53,5% 53,8% 53,5%49,4% 82,8% 53,3%50,6% 17,2% 46,7%46,6% 78,0% 50,2%53,4% 22,0% 49,8%
100,0% 100,0% 100,0%
YesNo
Car
YesNo
Landline telephone
YesNo
Computer (PC)
YesNo
Access to Internet
Total
Col %
Mainsample
Col %Booster
Sample
Col %
Total
1,2% 1,1%36,7% 40,9% 37,1%51,9% 43,5% 50,9%10,3% 15,6% 10,9%
100,0% 100,0% 100,0%
NAin a central area of the village/town/cityin a peripheral area of the village/town/cityin other area of the village/town/city
The dwelling is �…
Total
Col %
Mainsample
Col %Booster
Sample
Col %
Total
92
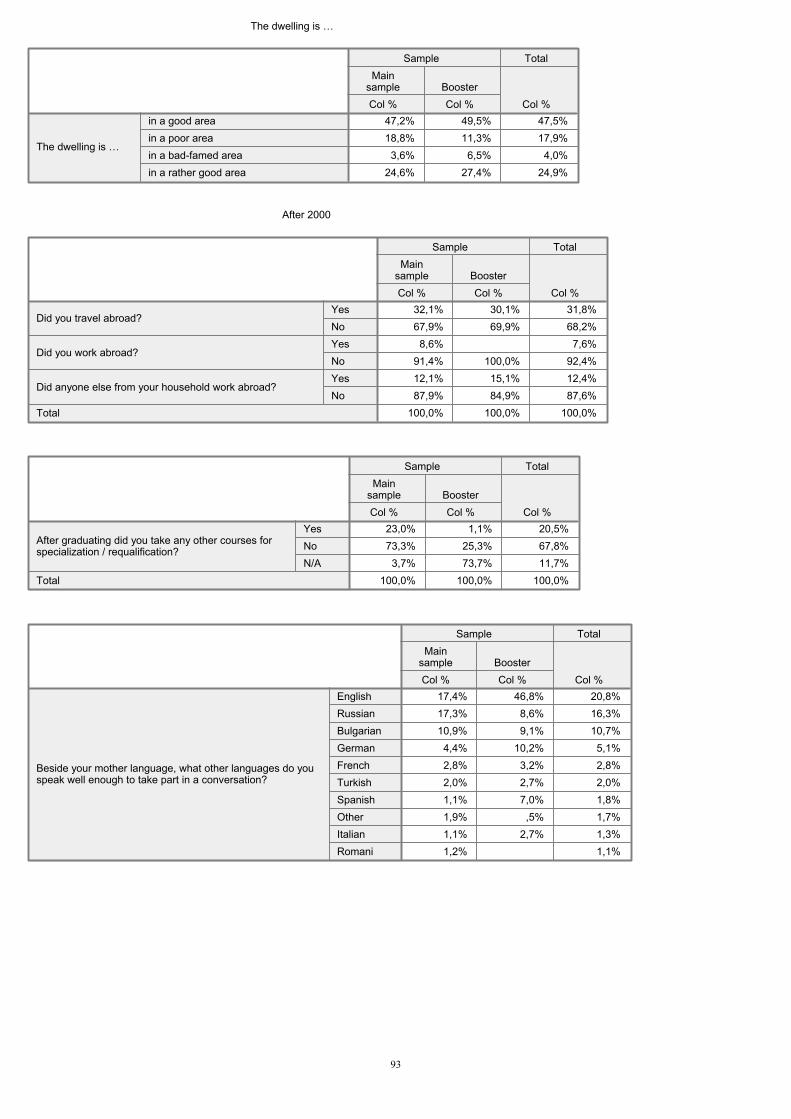
The dwelling is �…
47,2% 49,5% 47,5%18,8% 11,3% 17,9%3,6% 6,5% 4,0%
24,6% 27,4% 24,9%
in a good areain a poor areain a bad-famed areain a rather good area
The dwelling is �…
Col %
Mainsample
Col %Booster
Sample
Col %
Total
After 2000
32,1% 30,1% 31,8%67,9% 69,9% 68,2%8,6% 7,6%
91,4% 100,0% 92,4%12,1% 15,1% 12,4%87,9% 84,9% 87,6%
100,0% 100,0% 100,0%
YesNo
Did you travel abroad?
YesNo
Did you work abroad?
YesNo
Did anyone else from your household work abroad?
Total
Col %
Mainsample
Col %Booster
Sample
Col %
Total
23,0% 1,1% 20,5%73,3% 25,3% 67,8%3,7% 73,7% 11,7%
100,0% 100,0% 100,0%
YesNoN/A
After graduating did you take any other courses forspecialization / requalification?
Total
Col %
Mainsample
Col %Booster
Sample
Col %
Total
17,4% 46,8% 20,8%17,3% 8,6% 16,3%10,9% 9,1% 10,7%4,4% 10,2% 5,1%2,8% 3,2% 2,8%2,0% 2,7% 2,0%1,1% 7,0% 1,8%1,9% ,5% 1,7%1,1% 2,7% 1,3%1,2% 1,1%
EnglishRussianBulgarianGermanFrenchTurkishSpanishOtherItalianRomani
Beside your mother language, what other languages do youspeak well enough to take part in a conversation?
Col %
Mainsample
Col %Booster
Sample
Col %
Total
93
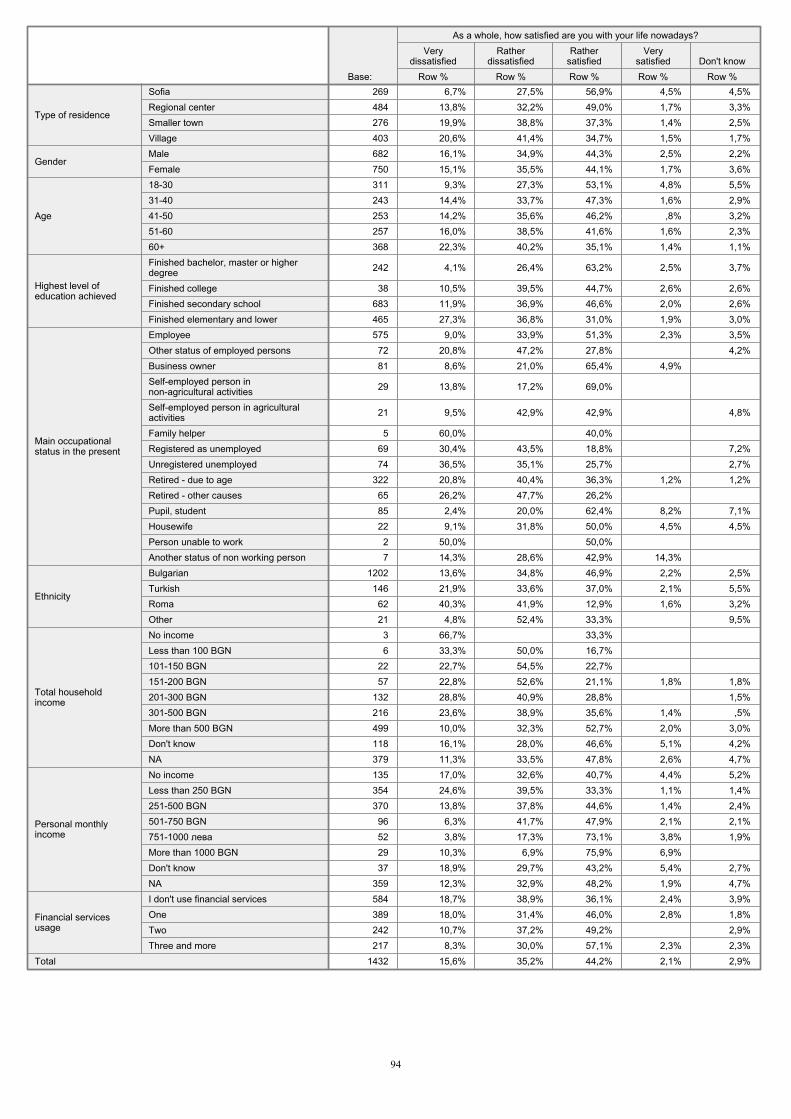
269 6,7% 27,5% 56,9% 4,5% 4,5%484 13,8% 32,2% 49,0% 1,7% 3,3%276 19,9% 38,8% 37,3% 1,4% 2,5%403 20,6% 41,4% 34,7% 1,5% 1,7%682 16,1% 34,9% 44,3% 2,5% 2,2%750 15,1% 35,5% 44,1% 1,7% 3,6%311 9,3% 27,3% 53,1% 4,8% 5,5%243 14,4% 33,7% 47,3% 1,6% 2,9%253 14,2% 35,6% 46,2% ,8% 3,2%257 16,0% 38,5% 41,6% 1,6% 2,3%368 22,3% 40,2% 35,1% 1,4% 1,1%
242 4,1% 26,4% 63,2% 2,5% 3,7%
38 10,5% 39,5% 44,7% 2,6% 2,6%683 11,9% 36,9% 46,6% 2,0% 2,6%465 27,3% 36,8% 31,0% 1,9% 3,0%575 9,0% 33,9% 51,3% 2,3% 3,5%72 20,8% 47,2% 27,8% 4,2%81 8,6% 21,0% 65,4% 4,9%
29 13,8% 17,2% 69,0%
21 9,5% 42,9% 42,9% 4,8%
5 60,0% 40,0% 69 30,4% 43,5% 18,8% 7,2%74 36,5% 35,1% 25,7% 2,7%
322 20,8% 40,4% 36,3% 1,2% 1,2%65 26,2% 47,7% 26,2% 85 2,4% 20,0% 62,4% 8,2% 7,1%22 9,1% 31,8% 50,0% 4,5% 4,5%2 50,0% 50,0% 7 14,3% 28,6% 42,9% 14,3%
1202 13,6% 34,8% 46,9% 2,2% 2,5%146 21,9% 33,6% 37,0% 2,1% 5,5%62 40,3% 41,9% 12,9% 1,6% 3,2%21 4,8% 52,4% 33,3% 9,5%3 66,7% 33,3% 6 33,3% 50,0% 16,7%
22 22,7% 54,5% 22,7% 57 22,8% 52,6% 21,1% 1,8% 1,8%
132 28,8% 40,9% 28,8% 1,5%216 23,6% 38,9% 35,6% 1,4% ,5%499 10,0% 32,3% 52,7% 2,0% 3,0%118 16,1% 28,0% 46,6% 5,1% 4,2%379 11,3% 33,5% 47,8% 2,6% 4,7%135 17,0% 32,6% 40,7% 4,4% 5,2%354 24,6% 39,5% 33,3% 1,1% 1,4%370 13,8% 37,8% 44,6% 1,4% 2,4%96 6,3% 41,7% 47,9% 2,1% 2,1%52 3,8% 17,3% 73,1% 3,8% 1,9%29 10,3% 6,9% 75,9% 6,9% 37 18,9% 29,7% 43,2% 5,4% 2,7%
359 12,3% 32,9% 48,2% 1,9% 4,7%584 18,7% 38,9% 36,1% 2,4% 3,9%389 18,0% 31,4% 46,0% 2,8% 1,8%242 10,7% 37,2% 49,2% 2,9%217 8,3% 30,0% 57,1% 2,3% 2,3%
1432 15,6% 35,2% 44,2% 2,1% 2,9%
SofiaRegional centerSmaller townVillage
Type of residence
MaleFemale
Gender
18-3031-4041-5051-6060+
Age
Finished bachelor, master or higherdegreeFinished collegeFinished secondary schoolFinished elementary and lower
Highest level ofeducation achieved
EmployeeOther status of employed personsBusiness ownerSelf-employed person innon-agricultural activitiesSelf-employed person in agriculturalactivitiesFamily helperRegistered as unemployedUnregistered unemployedRetired - due to ageRetired - other causesPupil, studentHousewifePerson unable to workAnother status of non working person
Main occupationalstatus in the present
BulgarianTurkishRomaOther
Ethnicity
No incomeLess than 100 BGN101-150 BGN151-200 BGN201-300 BGN301-500 BGNMore than 500 BGNDon't knowNA
Total householdincome
No incomeLess than 250 BGN251-500 BGN501-750 BGN751-1000 More than 1000 BGNDon't knowNA
Personal monthlyincome
I don't use financial servicesOneTwoThree and more
Financial servicesusage
Total
Base: Row %
Verydissatisfied
Row %
Ratherdissatisfied
Row %
Rathersatisfied
Row %
Verysatisfied
Row %Don't know
As a whole, how satisfied are you with your life nowadays?
94
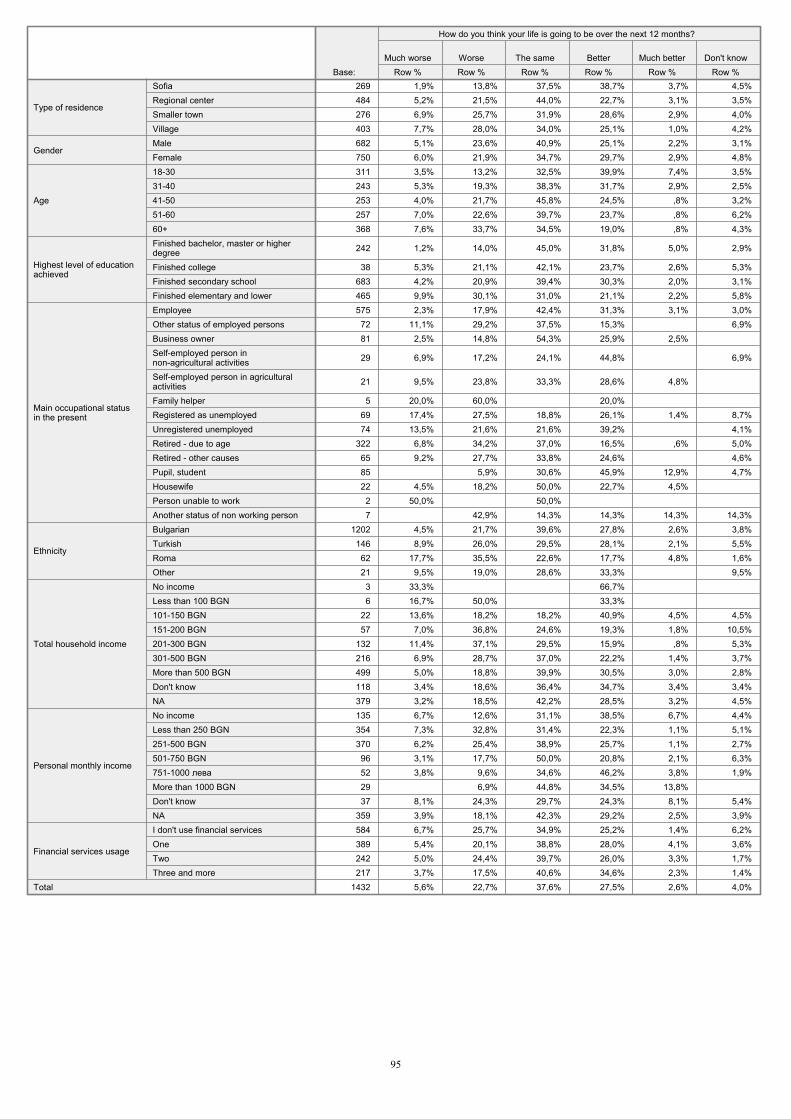
269 1,9% 13,8% 37,5% 38,7% 3,7% 4,5%484 5,2% 21,5% 44,0% 22,7% 3,1% 3,5%276 6,9% 25,7% 31,9% 28,6% 2,9% 4,0%403 7,7% 28,0% 34,0% 25,1% 1,0% 4,2%682 5,1% 23,6% 40,9% 25,1% 2,2% 3,1%750 6,0% 21,9% 34,7% 29,7% 2,9% 4,8%311 3,5% 13,2% 32,5% 39,9% 7,4% 3,5%243 5,3% 19,3% 38,3% 31,7% 2,9% 2,5%253 4,0% 21,7% 45,8% 24,5% ,8% 3,2%257 7,0% 22,6% 39,7% 23,7% ,8% 6,2%368 7,6% 33,7% 34,5% 19,0% ,8% 4,3%
242 1,2% 14,0% 45,0% 31,8% 5,0% 2,9%
38 5,3% 21,1% 42,1% 23,7% 2,6% 5,3%683 4,2% 20,9% 39,4% 30,3% 2,0% 3,1%465 9,9% 30,1% 31,0% 21,1% 2,2% 5,8%575 2,3% 17,9% 42,4% 31,3% 3,1% 3,0%
72 11,1% 29,2% 37,5% 15,3% 6,9%81 2,5% 14,8% 54,3% 25,9% 2,5%
29 6,9% 17,2% 24,1% 44,8% 6,9%
21 9,5% 23,8% 33,3% 28,6% 4,8%
5 20,0% 60,0% 20,0% 69 17,4% 27,5% 18,8% 26,1% 1,4% 8,7%74 13,5% 21,6% 21,6% 39,2% 4,1%
322 6,8% 34,2% 37,0% 16,5% ,6% 5,0%65 9,2% 27,7% 33,8% 24,6% 4,6%85 5,9% 30,6% 45,9% 12,9% 4,7%22 4,5% 18,2% 50,0% 22,7% 4,5%
2 50,0% 50,0% 7 42,9% 14,3% 14,3% 14,3% 14,3%
1202 4,5% 21,7% 39,6% 27,8% 2,6% 3,8%146 8,9% 26,0% 29,5% 28,1% 2,1% 5,5%
62 17,7% 35,5% 22,6% 17,7% 4,8% 1,6%21 9,5% 19,0% 28,6% 33,3% 9,5%
3 33,3% 66,7% 6 16,7% 50,0% 33,3%
22 13,6% 18,2% 18,2% 40,9% 4,5% 4,5%57 7,0% 36,8% 24,6% 19,3% 1,8% 10,5%
132 11,4% 37,1% 29,5% 15,9% ,8% 5,3%216 6,9% 28,7% 37,0% 22,2% 1,4% 3,7%499 5,0% 18,8% 39,9% 30,5% 3,0% 2,8%118 3,4% 18,6% 36,4% 34,7% 3,4% 3,4%379 3,2% 18,5% 42,2% 28,5% 3,2% 4,5%135 6,7% 12,6% 31,1% 38,5% 6,7% 4,4%354 7,3% 32,8% 31,4% 22,3% 1,1% 5,1%370 6,2% 25,4% 38,9% 25,7% 1,1% 2,7%
96 3,1% 17,7% 50,0% 20,8% 2,1% 6,3%52 3,8% 9,6% 34,6% 46,2% 3,8% 1,9%29 6,9% 44,8% 34,5% 13,8% 37 8,1% 24,3% 29,7% 24,3% 8,1% 5,4%
359 3,9% 18,1% 42,3% 29,2% 2,5% 3,9%584 6,7% 25,7% 34,9% 25,2% 1,4% 6,2%389 5,4% 20,1% 38,8% 28,0% 4,1% 3,6%242 5,0% 24,4% 39,7% 26,0% 3,3% 1,7%217 3,7% 17,5% 40,6% 34,6% 2,3% 1,4%
1432 5,6% 22,7% 37,6% 27,5% 2,6% 4,0%
SofiaRegional centerSmaller townVillage
Type of residence
MaleFemale
Gender
18-3031-4041-5051-6060+
Age
Finished bachelor, master or higherdegreeFinished collegeFinished secondary schoolFinished elementary and lower
Highest level of educationachieved
EmployeeOther status of employed personsBusiness ownerSelf-employed person innon-agricultural activitiesSelf-employed person in agriculturalactivitiesFamily helperRegistered as unemployedUnregistered unemployedRetired - due to ageRetired - other causesPupil, studentHousewifePerson unable to workAnother status of non working person
Main occupational statusin the present
BulgarianTurkishRomaOther
Ethnicity
No incomeLess than 100 BGN101-150 BGN151-200 BGN201-300 BGN301-500 BGNMore than 500 BGNDon't knowNA
Total household income
No incomeLess than 250 BGN251-500 BGN501-750 BGN751-1000 More than 1000 BGNDon't knowNA
Personal monthly income
I don't use financial servicesOneTwoThree and more
Financial services usage
Total
Base: Row %Much worse
Row %Worse
Row %The same
Row %Better
Row %Much better
Row %Don't know
How do you think your life is going to be over the next 12 months?
95
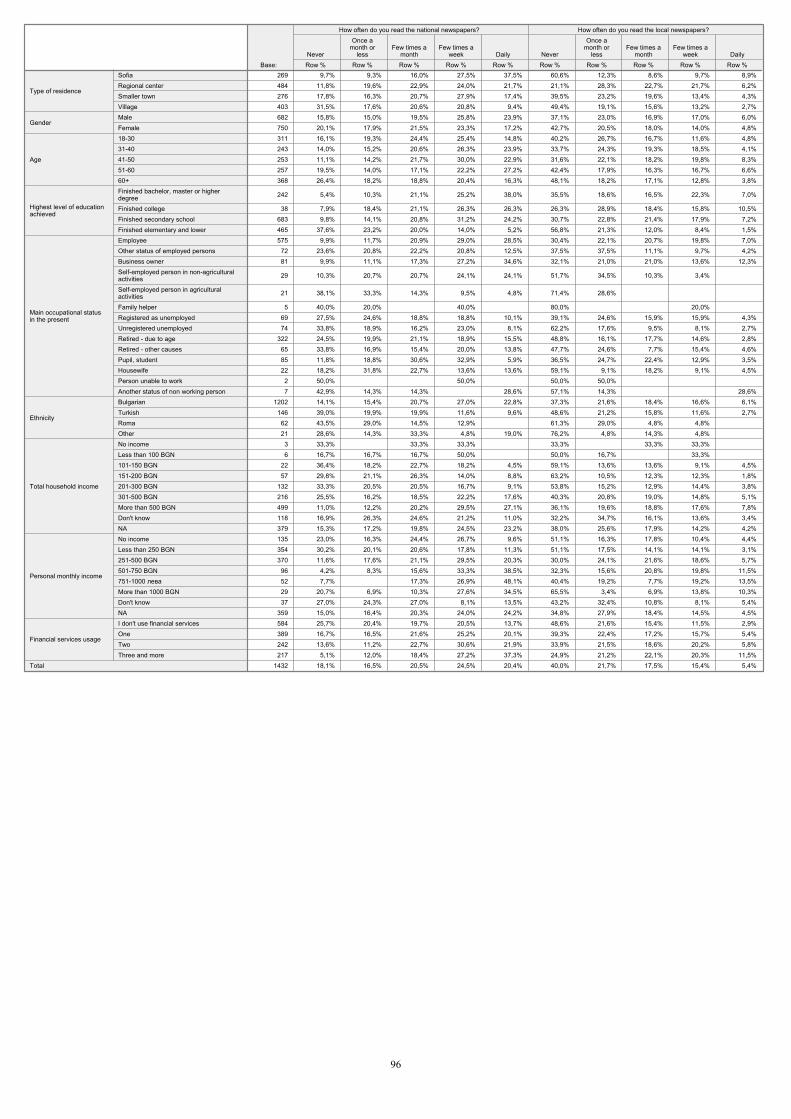
269 9,7% 9,3% 16,0% 27,5% 37,5% 60,6% 12,3% 8,6% 9,7% 8,9%484 11,8% 19,6% 22,9% 24,0% 21,7% 21,1% 28,3% 22,7% 21,7% 6,2%276 17,8% 16,3% 20,7% 27,9% 17,4% 39,5% 23,2% 19,6% 13,4% 4,3%403 31,5% 17,6% 20,6% 20,8% 9,4% 49,4% 19,1% 15,6% 13,2% 2,7%682 15,8% 15,0% 19,5% 25,8% 23,9% 37,1% 23,0% 16,9% 17,0% 6,0%750 20,1% 17,9% 21,5% 23,3% 17,2% 42,7% 20,5% 18,0% 14,0% 4,8%311 16,1% 19,3% 24,4% 25,4% 14,8% 40,2% 26,7% 16,7% 11,6% 4,8%243 14,0% 15,2% 20,6% 26,3% 23,9% 33,7% 24,3% 19,3% 18,5% 4,1%253 11,1% 14,2% 21,7% 30,0% 22,9% 31,6% 22,1% 18,2% 19,8% 8,3%257 19,5% 14,0% 17,1% 22,2% 27,2% 42,4% 17,9% 16,3% 16,7% 6,6%368 26,4% 18,2% 18,8% 20,4% 16,3% 48,1% 18,2% 17,1% 12,8% 3,8%
242 5,4% 10,3% 21,1% 25,2% 38,0% 35,5% 18,6% 16,5% 22,3% 7,0%
38 7,9% 18,4% 21,1% 26,3% 26,3% 26,3% 28,9% 18,4% 15,8% 10,5%683 9,8% 14,1% 20,8% 31,2% 24,2% 30,7% 22,8% 21,4% 17,9% 7,2%465 37,6% 23,2% 20,0% 14,0% 5,2% 56,8% 21,3% 12,0% 8,4% 1,5%575 9,9% 11,7% 20,9% 29,0% 28,5% 30,4% 22,1% 20,7% 19,8% 7,0%
72 23,6% 20,8% 22,2% 20,8% 12,5% 37,5% 37,5% 11,1% 9,7% 4,2%81 9,9% 11,1% 17,3% 27,2% 34,6% 32,1% 21,0% 21,0% 13,6% 12,3%
29 10,3% 20,7% 20,7% 24,1% 24,1% 51,7% 34,5% 10,3% 3,4%
21 38,1% 33,3% 14,3% 9,5% 4,8% 71,4% 28,6%
5 40,0% 20,0% 40,0% 80,0% 20,0% 69 27,5% 24,6% 18,8% 18,8% 10,1% 39,1% 24,6% 15,9% 15,9% 4,3%74 33,8% 18,9% 16,2% 23,0% 8,1% 62,2% 17,6% 9,5% 8,1% 2,7%
322 24,5% 19,9% 21,1% 18,9% 15,5% 48,8% 16,1% 17,7% 14,6% 2,8%65 33,8% 16,9% 15,4% 20,0% 13,8% 47,7% 24,6% 7,7% 15,4% 4,6%85 11,8% 18,8% 30,6% 32,9% 5,9% 36,5% 24,7% 22,4% 12,9% 3,5%22 18,2% 31,8% 22,7% 13,6% 13,6% 59,1% 9,1% 18,2% 9,1% 4,5%
2 50,0% 50,0% 50,0% 50,0% 7 42,9% 14,3% 14,3% 28,6% 57,1% 14,3% 28,6%
1202 14,1% 15,4% 20,7% 27,0% 22,8% 37,3% 21,6% 18,4% 16,6% 6,1%146 39,0% 19,9% 19,9% 11,6% 9,6% 48,6% 21,2% 15,8% 11,6% 2,7%
62 43,5% 29,0% 14,5% 12,9% 61,3% 29,0% 4,8% 4,8% 21 28,6% 14,3% 33,3% 4,8% 19,0% 76,2% 4,8% 14,3% 4,8%
3 33,3% 33,3% 33,3% 33,3% 33,3% 33,3% 6 16,7% 16,7% 16,7% 50,0% 50,0% 16,7% 33,3%
22 36,4% 18,2% 22,7% 18,2% 4,5% 59,1% 13,6% 13,6% 9,1% 4,5%57 29,8% 21,1% 26,3% 14,0% 8,8% 63,2% 10,5% 12,3% 12,3% 1,8%
132 33,3% 20,5% 20,5% 16,7% 9,1% 53,8% 15,2% 12,9% 14,4% 3,8%216 25,5% 16,2% 18,5% 22,2% 17,6% 40,3% 20,8% 19,0% 14,8% 5,1%499 11,0% 12,2% 20,2% 29,5% 27,1% 36,1% 19,6% 18,8% 17,6% 7,8%118 16,9% 26,3% 24,6% 21,2% 11,0% 32,2% 34,7% 16,1% 13,6% 3,4%379 15,3% 17,2% 19,8% 24,5% 23,2% 38,0% 25,6% 17,9% 14,2% 4,2%135 23,0% 16,3% 24,4% 26,7% 9,6% 51,1% 16,3% 17,8% 10,4% 4,4%354 30,2% 20,1% 20,6% 17,8% 11,3% 51,1% 17,5% 14,1% 14,1% 3,1%370 11,6% 17,6% 21,1% 29,5% 20,3% 30,0% 24,1% 21,6% 18,6% 5,7%
96 4,2% 8,3% 15,6% 33,3% 38,5% 32,3% 15,6% 20,8% 19,8% 11,5%52 7,7% 17,3% 26,9% 48,1% 40,4% 19,2% 7,7% 19,2% 13,5%29 20,7% 6,9% 10,3% 27,6% 34,5% 65,5% 3,4% 6,9% 13,8% 10,3%37 27,0% 24,3% 27,0% 8,1% 13,5% 43,2% 32,4% 10,8% 8,1% 5,4%
359 15,0% 16,4% 20,3% 24,0% 24,2% 34,8% 27,9% 18,4% 14,5% 4,5%584 25,7% 20,4% 19,7% 20,5% 13,7% 48,6% 21,6% 15,4% 11,5% 2,9%389 16,7% 16,5% 21,6% 25,2% 20,1% 39,3% 22,4% 17,2% 15,7% 5,4%242 13,6% 11,2% 22,7% 30,6% 21,9% 33,9% 21,5% 18,6% 20,2% 5,8%217 5,1% 12,0% 18,4% 27,2% 37,3% 24,9% 21,2% 22,1% 20,3% 11,5%
1432 18,1% 16,5% 20,5% 24,5% 20,4% 40,0% 21,7% 17,5% 15,4% 5,4%
SofiaRegional centerSmaller townVillage
Type of residence
MaleFemale
Gender
18-3031-4041-5051-6060+
Age
Finished bachelor, master or higherdegreeFinished collegeFinished secondary schoolFinished elementary and lower
Highest level of educationachieved
EmployeeOther status of employed personsBusiness ownerSelf-employed person in non-agriculturalactivitiesSelf-employed person in agriculturalactivitiesFamily helperRegistered as unemployedUnregistered unemployedRetired - due to ageRetired - other causesPupil, studentHousewifePerson unable to workAnother status of non working person
Main occupational statusin the present
BulgarianTurkishRomaOther
Ethnicity
No incomeLess than 100 BGN101-150 BGN151-200 BGN201-300 BGN301-500 BGNMore than 500 BGNDon't knowNA
Total household income
No incomeLess than 250 BGN251-500 BGN501-750 BGN751-1000 More than 1000 BGNDon't knowNA
Personal monthly income
I don't use financial servicesOneTwoThree and more
Financial services usage
Total
Base: Row %Never
Row %
Once amonth or
lessRow %
Few times amonth
Row %
Few times aweek
Row %Daily
How often do you read the national newspapers?
Row %Never
Row %
Once amonth or
lessRow %
Few times amonth
Row %
Few times aweek
Row %Daily
How often do you read the local newspapers?
96
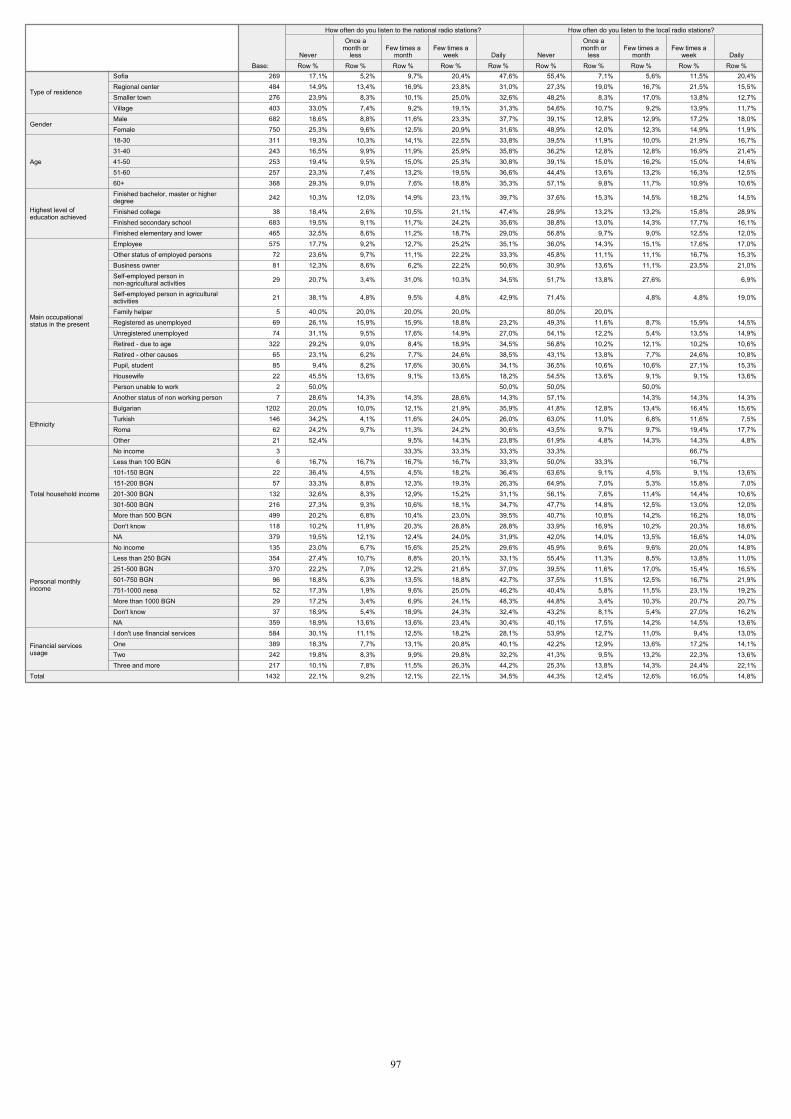
269 17,1% 5,2% 9,7% 20,4% 47,6% 55,4% 7,1% 5,6% 11,5% 20,4%484 14,9% 13,4% 16,9% 23,8% 31,0% 27,3% 19,0% 16,7% 21,5% 15,5%276 23,9% 8,3% 10,1% 25,0% 32,6% 48,2% 8,3% 17,0% 13,8% 12,7%403 33,0% 7,4% 9,2% 19,1% 31,3% 54,6% 10,7% 9,2% 13,9% 11,7%682 18,6% 8,8% 11,6% 23,3% 37,7% 39,1% 12,8% 12,9% 17,2% 18,0%750 25,3% 9,6% 12,5% 20,9% 31,6% 48,9% 12,0% 12,3% 14,9% 11,9%311 19,3% 10,3% 14,1% 22,5% 33,8% 39,5% 11,9% 10,0% 21,9% 16,7%243 16,5% 9,9% 11,9% 25,9% 35,8% 36,2% 12,8% 12,8% 16,9% 21,4%253 19,4% 9,5% 15,0% 25,3% 30,8% 39,1% 15,0% 16,2% 15,0% 14,6%257 23,3% 7,4% 13,2% 19,5% 36,6% 44,4% 13,6% 13,2% 16,3% 12,5%368 29,3% 9,0% 7,6% 18,8% 35,3% 57,1% 9,8% 11,7% 10,9% 10,6%
242 10,3% 12,0% 14,9% 23,1% 39,7% 37,6% 15,3% 14,5% 18,2% 14,5%
38 18,4% 2,6% 10,5% 21,1% 47,4% 28,9% 13,2% 13,2% 15,8% 28,9%683 19,5% 9,1% 11,7% 24,2% 35,6% 38,8% 13,0% 14,3% 17,7% 16,1%465 32,5% 8,6% 11,2% 18,7% 29,0% 56,8% 9,7% 9,0% 12,5% 12,0%575 17,7% 9,2% 12,7% 25,2% 35,1% 36,0% 14,3% 15,1% 17,6% 17,0%
72 23,6% 9,7% 11,1% 22,2% 33,3% 45,8% 11,1% 11,1% 16,7% 15,3%81 12,3% 8,6% 6,2% 22,2% 50,6% 30,9% 13,6% 11,1% 23,5% 21,0%
29 20,7% 3,4% 31,0% 10,3% 34,5% 51,7% 13,8% 27,6% 6,9%
21 38,1% 4,8% 9,5% 4,8% 42,9% 71,4% 4,8% 4,8% 19,0%
5 40,0% 20,0% 20,0% 20,0% 80,0% 20,0% 69 26,1% 15,9% 15,9% 18,8% 23,2% 49,3% 11,6% 8,7% 15,9% 14,5%74 31,1% 9,5% 17,6% 14,9% 27,0% 54,1% 12,2% 5,4% 13,5% 14,9%
322 29,2% 9,0% 8,4% 18,9% 34,5% 56,8% 10,2% 12,1% 10,2% 10,6%65 23,1% 6,2% 7,7% 24,6% 38,5% 43,1% 13,8% 7,7% 24,6% 10,8%85 9,4% 8,2% 17,6% 30,6% 34,1% 36,5% 10,6% 10,6% 27,1% 15,3%22 45,5% 13,6% 9,1% 13,6% 18,2% 54,5% 13,6% 9,1% 9,1% 13,6%
2 50,0% 50,0% 50,0% 50,0% 7 28,6% 14,3% 14,3% 28,6% 14,3% 57,1% 14,3% 14,3% 14,3%
1202 20,0% 10,0% 12,1% 21,9% 35,9% 41,8% 12,8% 13,4% 16,4% 15,6%146 34,2% 4,1% 11,6% 24,0% 26,0% 63,0% 11,0% 6,8% 11,6% 7,5%
62 24,2% 9,7% 11,3% 24,2% 30,6% 43,5% 9,7% 9,7% 19,4% 17,7%21 52,4% 9,5% 14,3% 23,8% 61,9% 4,8% 14,3% 14,3% 4,8%
3 33,3% 33,3% 33,3% 33,3% 66,7% 6 16,7% 16,7% 16,7% 16,7% 33,3% 50,0% 33,3% 16,7%
22 36,4% 4,5% 4,5% 18,2% 36,4% 63,6% 9,1% 4,5% 9,1% 13,6%57 33,3% 8,8% 12,3% 19,3% 26,3% 64,9% 7,0% 5,3% 15,8% 7,0%
132 32,6% 8,3% 12,9% 15,2% 31,1% 56,1% 7,6% 11,4% 14,4% 10,6%216 27,3% 9,3% 10,6% 18,1% 34,7% 47,7% 14,8% 12,5% 13,0% 12,0%499 20,2% 6,8% 10,4% 23,0% 39,5% 40,7% 10,8% 14,2% 16,2% 18,0%118 10,2% 11,9% 20,3% 28,8% 28,8% 33,9% 16,9% 10,2% 20,3% 18,6%379 19,5% 12,1% 12,4% 24,0% 31,9% 42,0% 14,0% 13,5% 16,6% 14,0%135 23,0% 6,7% 15,6% 25,2% 29,6% 45,9% 9,6% 9,6% 20,0% 14,8%354 27,4% 10,7% 8,8% 20,1% 33,1% 55,4% 11,3% 8,5% 13,8% 11,0%370 22,2% 7,0% 12,2% 21,6% 37,0% 39,5% 11,6% 17,0% 15,4% 16,5%
96 18,8% 6,3% 13,5% 18,8% 42,7% 37,5% 11,5% 12,5% 16,7% 21,9%52 17,3% 1,9% 9,6% 25,0% 46,2% 40,4% 5,8% 11,5% 23,1% 19,2%29 17,2% 3,4% 6,9% 24,1% 48,3% 44,8% 3,4% 10,3% 20,7% 20,7%37 18,9% 5,4% 18,9% 24,3% 32,4% 43,2% 8,1% 5,4% 27,0% 16,2%
359 18,9% 13,6% 13,6% 23,4% 30,4% 40,1% 17,5% 14,2% 14,5% 13,6%584 30,1% 11,1% 12,5% 18,2% 28,1% 53,9% 12,7% 11,0% 9,4% 13,0%389 18,3% 7,7% 13,1% 20,8% 40,1% 42,2% 12,9% 13,6% 17,2% 14,1%242 19,8% 8,3% 9,9% 29,8% 32,2% 41,3% 9,5% 13,2% 22,3% 13,6%217 10,1% 7,8% 11,5% 26,3% 44,2% 25,3% 13,8% 14,3% 24,4% 22,1%
1432 22,1% 9,2% 12,1% 22,1% 34,5% 44,3% 12,4% 12,6% 16,0% 14,8%
SofiaRegional centerSmaller townVillage
Type of residence
MaleFemale
Gender
18-3031-4041-5051-6060+
Age
Finished bachelor, master or higherdegreeFinished collegeFinished secondary schoolFinished elementary and lower
Highest level ofeducation achieved
EmployeeOther status of employed personsBusiness ownerSelf-employed person innon-agricultural activitiesSelf-employed person in agriculturalactivitiesFamily helperRegistered as unemployedUnregistered unemployedRetired - due to ageRetired - other causesPupil, studentHousewifePerson unable to workAnother status of non working person
Main occupationalstatus in the present
BulgarianTurkishRomaOther
Ethnicity
No incomeLess than 100 BGN101-150 BGN151-200 BGN201-300 BGN301-500 BGNMore than 500 BGNDon't knowNA
Total household income
No incomeLess than 250 BGN251-500 BGN501-750 BGN751-1000 More than 1000 BGNDon't knowNA
Personal monthlyincome
I don't use financial servicesOneTwoThree and more
Financial servicesusage
Total
Base: Row %Never
Row %
Once amonth or
lessRow %
Few times amonth
Row %
Few times aweek
Row %Daily
How often do you listen to the national radio stations?
Row %Never
Row %
Once amonth or
lessRow %
Few times amonth
Row %
Few times aweek
Row %Daily
How often do you listen to the local radio stations?
97
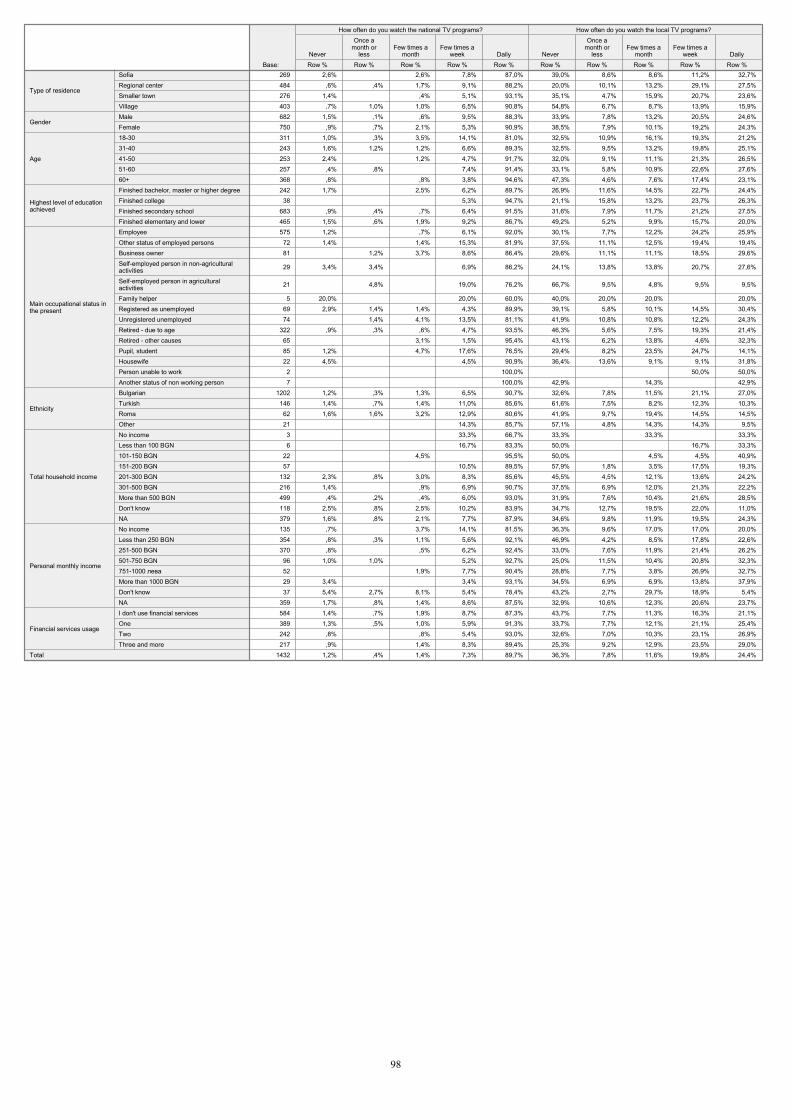
269 2,6% 2,6% 7,8% 87,0% 39,0% 8,6% 8,6% 11,2% 32,7%484 ,6% ,4% 1,7% 9,1% 88,2% 20,0% 10,1% 13,2% 29,1% 27,5%276 1,4% ,4% 5,1% 93,1% 35,1% 4,7% 15,9% 20,7% 23,6%403 ,7% 1,0% 1,0% 6,5% 90,8% 54,8% 6,7% 8,7% 13,9% 15,9%682 1,5% ,1% ,6% 9,5% 88,3% 33,9% 7,8% 13,2% 20,5% 24,6%750 ,9% ,7% 2,1% 5,3% 90,9% 38,5% 7,9% 10,1% 19,2% 24,3%311 1,0% ,3% 3,5% 14,1% 81,0% 32,5% 10,9% 16,1% 19,3% 21,2%243 1,6% 1,2% 1,2% 6,6% 89,3% 32,5% 9,5% 13,2% 19,8% 25,1%253 2,4% 1,2% 4,7% 91,7% 32,0% 9,1% 11,1% 21,3% 26,5%257 ,4% ,8% 7,4% 91,4% 33,1% 5,8% 10,9% 22,6% 27,6%368 ,8% ,8% 3,8% 94,6% 47,3% 4,6% 7,6% 17,4% 23,1%242 1,7% 2,5% 6,2% 89,7% 26,9% 11,6% 14,5% 22,7% 24,4%38 5,3% 94,7% 21,1% 15,8% 13,2% 23,7% 26,3%
683 ,9% ,4% ,7% 6,4% 91,5% 31,6% 7,9% 11,7% 21,2% 27,5%465 1,5% ,6% 1,9% 9,2% 86,7% 49,2% 5,2% 9,9% 15,7% 20,0%575 1,2% ,7% 6,1% 92,0% 30,1% 7,7% 12,2% 24,2% 25,9%72 1,4% 1,4% 15,3% 81,9% 37,5% 11,1% 12,5% 19,4% 19,4%81 1,2% 3,7% 8,6% 86,4% 29,6% 11,1% 11,1% 18,5% 29,6%
29 3,4% 3,4% 6,9% 86,2% 24,1% 13,8% 13,8% 20,7% 27,6%
21 4,8% 19,0% 76,2% 66,7% 9,5% 4,8% 9,5% 9,5%
5 20,0% 20,0% 60,0% 40,0% 20,0% 20,0% 20,0%69 2,9% 1,4% 1,4% 4,3% 89,9% 39,1% 5,8% 10,1% 14,5% 30,4%74 1,4% 4,1% 13,5% 81,1% 41,9% 10,8% 10,8% 12,2% 24,3%
322 ,9% ,3% ,6% 4,7% 93,5% 46,3% 5,6% 7,5% 19,3% 21,4%65 3,1% 1,5% 95,4% 43,1% 6,2% 13,8% 4,6% 32,3%85 1,2% 4,7% 17,6% 76,5% 29,4% 8,2% 23,5% 24,7% 14,1%22 4,5% 4,5% 90,9% 36,4% 13,6% 9,1% 9,1% 31,8%2 100,0% 50,0% 50,0%7 100,0% 42,9% 14,3% 42,9%
1202 1,2% ,3% 1,3% 6,5% 90,7% 32,6% 7,8% 11,5% 21,1% 27,0%146 1,4% ,7% 1,4% 11,0% 85,6% 61,6% 7,5% 8,2% 12,3% 10,3%62 1,6% 1,6% 3,2% 12,9% 80,6% 41,9% 9,7% 19,4% 14,5% 14,5%21 14,3% 85,7% 57,1% 4,8% 14,3% 14,3% 9,5%3 33,3% 66,7% 33,3% 33,3% 33,3%6 16,7% 83,3% 50,0% 16,7% 33,3%
22 4,5% 95,5% 50,0% 4,5% 4,5% 40,9%57 10,5% 89,5% 57,9% 1,8% 3,5% 17,5% 19,3%
132 2,3% ,8% 3,0% 8,3% 85,6% 45,5% 4,5% 12,1% 13,6% 24,2%216 1,4% ,9% 6,9% 90,7% 37,5% 6,9% 12,0% 21,3% 22,2%499 ,4% ,2% ,4% 6,0% 93,0% 31,9% 7,6% 10,4% 21,6% 28,5%118 2,5% ,8% 2,5% 10,2% 83,9% 34,7% 12,7% 19,5% 22,0% 11,0%379 1,6% ,8% 2,1% 7,7% 87,9% 34,6% 9,8% 11,9% 19,5% 24,3%135 ,7% 3,7% 14,1% 81,5% 36,3% 9,6% 17,0% 17,0% 20,0%354 ,8% ,3% 1,1% 5,6% 92,1% 46,9% 4,2% 8,5% 17,8% 22,6%370 ,8% ,5% 6,2% 92,4% 33,0% 7,6% 11,9% 21,4% 26,2%96 1,0% 1,0% 5,2% 92,7% 25,0% 11,5% 10,4% 20,8% 32,3%52 1,9% 7,7% 90,4% 28,8% 7,7% 3,8% 26,9% 32,7%29 3,4% 3,4% 93,1% 34,5% 6,9% 6,9% 13,8% 37,9%37 5,4% 2,7% 8,1% 5,4% 78,4% 43,2% 2,7% 29,7% 18,9% 5,4%
359 1,7% ,8% 1,4% 8,6% 87,5% 32,9% 10,6% 12,3% 20,6% 23,7%584 1,4% ,7% 1,9% 8,7% 87,3% 43,7% 7,7% 11,3% 16,3% 21,1%389 1,3% ,5% 1,0% 5,9% 91,3% 33,7% 7,7% 12,1% 21,1% 25,4%242 ,8% ,8% 5,4% 93,0% 32,6% 7,0% 10,3% 23,1% 26,9%217 ,9% 1,4% 8,3% 89,4% 25,3% 9,2% 12,9% 23,5% 29,0%
1432 1,2% ,4% 1,4% 7,3% 89,7% 36,3% 7,8% 11,6% 19,8% 24,4%
SofiaRegional centerSmaller townVillage
Type of residence
MaleFemale
Gender
18-3031-4041-5051-6060+
Age
Finished bachelor, master or higher degreeFinished collegeFinished secondary schoolFinished elementary and lower
Highest level of educationachieved
EmployeeOther status of employed personsBusiness ownerSelf-employed person in non-agriculturalactivitiesSelf-employed person in agriculturalactivitiesFamily helperRegistered as unemployedUnregistered unemployedRetired - due to ageRetired - other causesPupil, studentHousewifePerson unable to workAnother status of non working person
Main occupational status inthe present
BulgarianTurkishRomaOther
Ethnicity
No incomeLess than 100 BGN101-150 BGN151-200 BGN201-300 BGN301-500 BGNMore than 500 BGNDon't knowNA
Total household income
No incomeLess than 250 BGN251-500 BGN501-750 BGN751-1000 More than 1000 BGNDon't knowNA
Personal monthly income
I don't use financial servicesOneTwoThree and more
Financial services usage
Total
Base: Row %Never
Row %
Once amonth or
lessRow %
Few times amonth
Row %
Few times aweek
Row %Daily
How often do you watch the national TV programs?
Row %Never
Row %
Once amonth or
lessRow %
Few times amonth
Row %
Few times aweek
Row %Daily
How often do you watch the local TV programs?
98
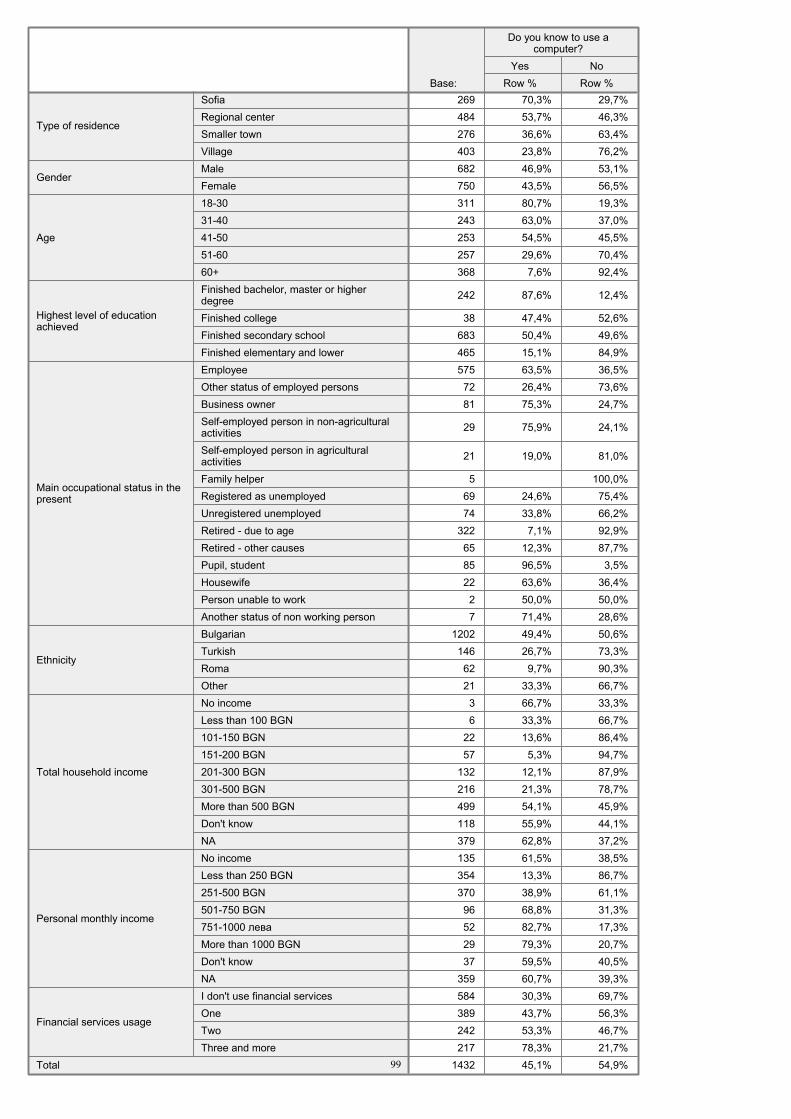
269 70,3% 29,7%484 53,7% 46,3%276 36,6% 63,4%403 23,8% 76,2%682 46,9% 53,1%750 43,5% 56,5%311 80,7% 19,3%243 63,0% 37,0%253 54,5% 45,5%257 29,6% 70,4%368 7,6% 92,4%
242 87,6% 12,4%
38 47,4% 52,6%683 50,4% 49,6%465 15,1% 84,9%575 63,5% 36,5%72 26,4% 73,6%81 75,3% 24,7%
29 75,9% 24,1%
21 19,0% 81,0%
5 100,0%69 24,6% 75,4%74 33,8% 66,2%
322 7,1% 92,9%65 12,3% 87,7%85 96,5% 3,5%22 63,6% 36,4%2 50,0% 50,0%7 71,4% 28,6%
1202 49,4% 50,6%146 26,7% 73,3%62 9,7% 90,3%21 33,3% 66,7%3 66,7% 33,3%6 33,3% 66,7%
22 13,6% 86,4%57 5,3% 94,7%
132 12,1% 87,9%216 21,3% 78,7%499 54,1% 45,9%118 55,9% 44,1%379 62,8% 37,2%135 61,5% 38,5%354 13,3% 86,7%370 38,9% 61,1%96 68,8% 31,3%52 82,7% 17,3%29 79,3% 20,7%37 59,5% 40,5%
359 60,7% 39,3%584 30,3% 69,7%389 43,7% 56,3%242 53,3% 46,7%217 78,3% 21,7%
1432 45,1% 54,9%
SofiaRegional centerSmaller townVillage
Type of residence
MaleFemale
Gender
18-3031-4041-5051-6060+
Age
Finished bachelor, master or higherdegreeFinished collegeFinished secondary schoolFinished elementary and lower
Highest level of educationachieved
EmployeeOther status of employed personsBusiness ownerSelf-employed person in non-agriculturalactivitiesSelf-employed person in agriculturalactivitiesFamily helperRegistered as unemployedUnregistered unemployedRetired - due to ageRetired - other causesPupil, studentHousewifePerson unable to workAnother status of non working person
Main occupational status in thepresent
BulgarianTurkishRomaOther
Ethnicity
No incomeLess than 100 BGN101-150 BGN151-200 BGN201-300 BGN301-500 BGNMore than 500 BGNDon't knowNA
Total household income
No incomeLess than 250 BGN251-500 BGN501-750 BGN751-1000 More than 1000 BGNDon't knowNA
Personal monthly income
I don't use financial servicesOneTwoThree and more
Financial services usage
Total
Base: Row %Yes
Row %No
Do you know to use acomputer?
99
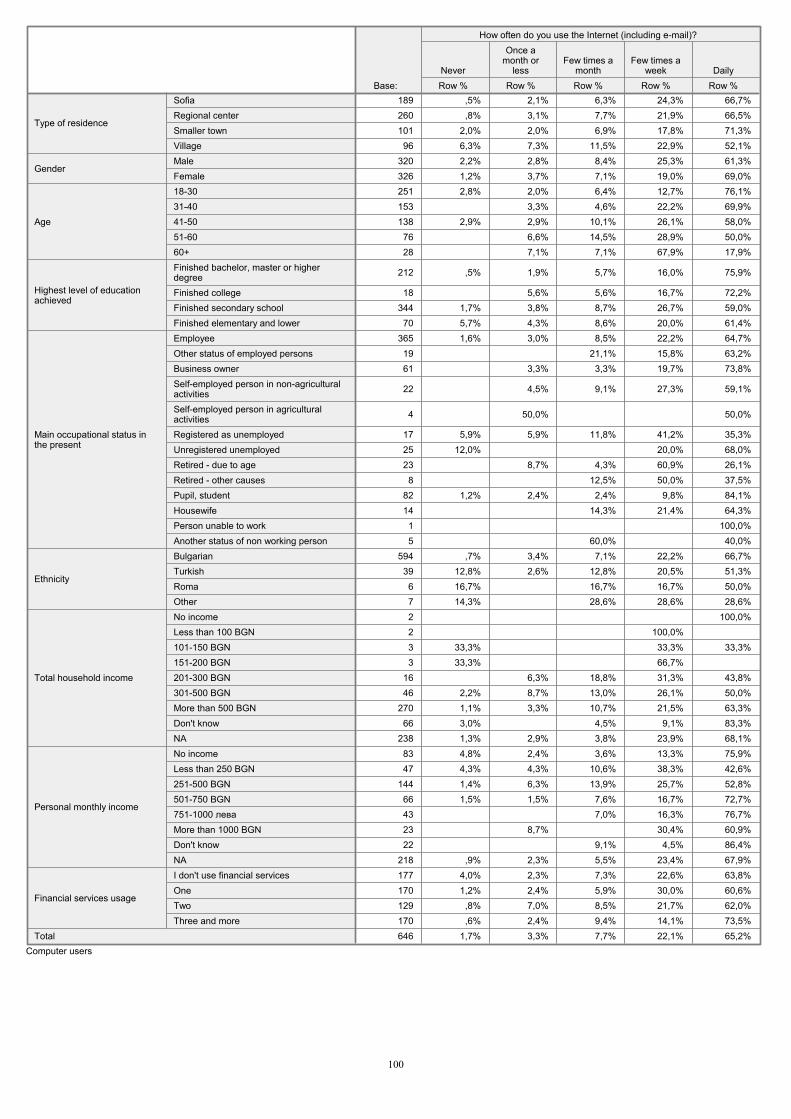
189 ,5% 2,1% 6,3% 24,3% 66,7%260 ,8% 3,1% 7,7% 21,9% 66,5%101 2,0% 2,0% 6,9% 17,8% 71,3%
96 6,3% 7,3% 11,5% 22,9% 52,1%320 2,2% 2,8% 8,4% 25,3% 61,3%326 1,2% 3,7% 7,1% 19,0% 69,0%251 2,8% 2,0% 6,4% 12,7% 76,1%153 3,3% 4,6% 22,2% 69,9%138 2,9% 2,9% 10,1% 26,1% 58,0%
76 6,6% 14,5% 28,9% 50,0%28 7,1% 7,1% 67,9% 17,9%
212 ,5% 1,9% 5,7% 16,0% 75,9%
18 5,6% 5,6% 16,7% 72,2%344 1,7% 3,8% 8,7% 26,7% 59,0%
70 5,7% 4,3% 8,6% 20,0% 61,4%365 1,6% 3,0% 8,5% 22,2% 64,7%
19 21,1% 15,8% 63,2%61 3,3% 3,3% 19,7% 73,8%
22 4,5% 9,1% 27,3% 59,1%
4 50,0% 50,0%
17 5,9% 5,9% 11,8% 41,2% 35,3%25 12,0% 20,0% 68,0%23 8,7% 4,3% 60,9% 26,1%
8 12,5% 50,0% 37,5%82 1,2% 2,4% 2,4% 9,8% 84,1%14 14,3% 21,4% 64,3%
1 100,0%5 60,0% 40,0%
594 ,7% 3,4% 7,1% 22,2% 66,7%39 12,8% 2,6% 12,8% 20,5% 51,3%
6 16,7% 16,7% 16,7% 50,0%7 14,3% 28,6% 28,6% 28,6%2 100,0%2 100,0% 3 33,3% 33,3% 33,3%3 33,3% 66,7%
16 6,3% 18,8% 31,3% 43,8%46 2,2% 8,7% 13,0% 26,1% 50,0%
270 1,1% 3,3% 10,7% 21,5% 63,3%66 3,0% 4,5% 9,1% 83,3%
238 1,3% 2,9% 3,8% 23,9% 68,1%83 4,8% 2,4% 3,6% 13,3% 75,9%47 4,3% 4,3% 10,6% 38,3% 42,6%
144 1,4% 6,3% 13,9% 25,7% 52,8%66 1,5% 1,5% 7,6% 16,7% 72,7%43 7,0% 16,3% 76,7%23 8,7% 30,4% 60,9%22 9,1% 4,5% 86,4%
218 ,9% 2,3% 5,5% 23,4% 67,9%177 4,0% 2,3% 7,3% 22,6% 63,8%170 1,2% 2,4% 5,9% 30,0% 60,6%129 ,8% 7,0% 8,5% 21,7% 62,0%170 ,6% 2,4% 9,4% 14,1% 73,5%646 1,7% 3,3% 7,7% 22,1% 65,2%
SofiaRegional centerSmaller townVillage
Type of residence
MaleFemale
Gender
18-3031-4041-5051-6060+
Age
Finished bachelor, master or higherdegreeFinished collegeFinished secondary schoolFinished elementary and lower
Highest level of educationachieved
EmployeeOther status of employed personsBusiness ownerSelf-employed person in non-agriculturalactivitiesSelf-employed person in agriculturalactivitiesRegistered as unemployedUnregistered unemployedRetired - due to ageRetired - other causesPupil, studentHousewifePerson unable to workAnother status of non working person
Main occupational status inthe present
BulgarianTurkishRomaOther
Ethnicity
No incomeLess than 100 BGN101-150 BGN151-200 BGN201-300 BGN301-500 BGNMore than 500 BGNDon't knowNA
Total household income
No incomeLess than 250 BGN251-500 BGN501-750 BGN751-1000 More than 1000 BGNDon't knowNA
Personal monthly income
I don't use financial servicesOneTwoThree and more
Financial services usage
Total
Base: Row %Never
Row %
Once amonth or
lessRow %
Few times amonth
Row %
Few times aweek
Row %Daily
How often do you use the Internet (including e-mail)?
Computer users
100
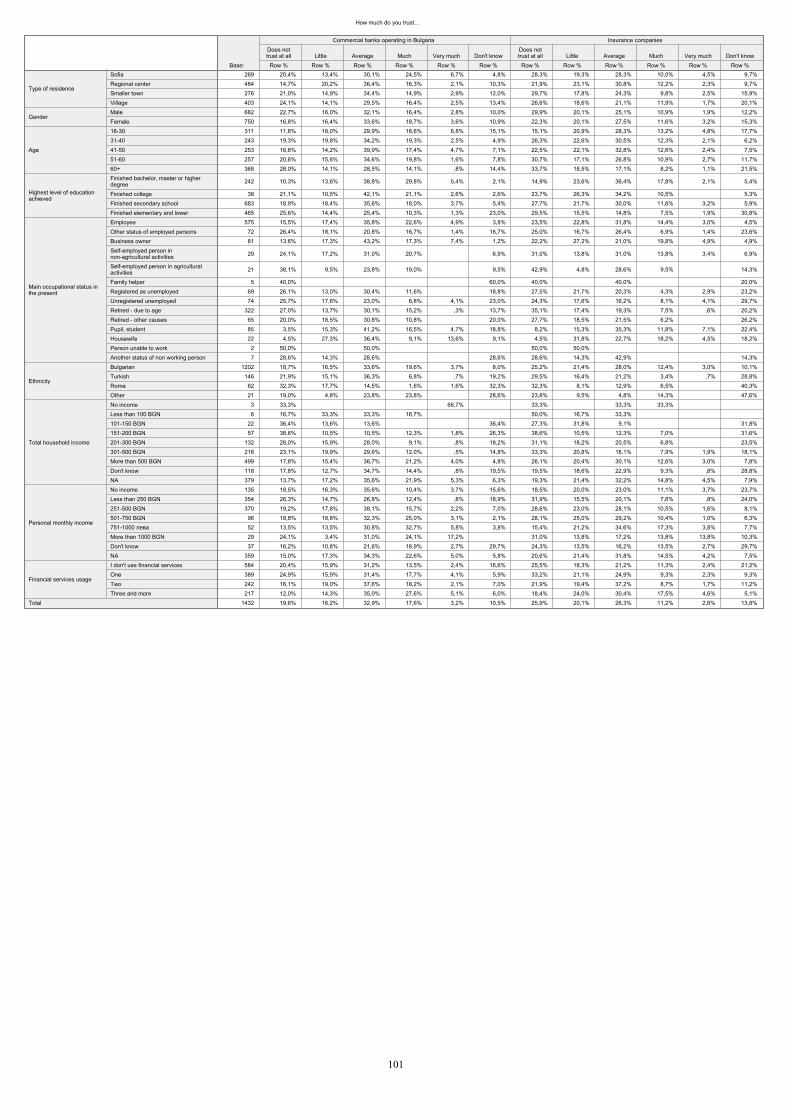
How much do you trust�…
269 20,4% 13,4% 30,1% 24,5% 6,7% 4,8% 28,3% 19,3% 28,3% 10,0% 4,5% 9,7%484 14,7% 20,2% 36,4% 16,3% 2,1% 10,3% 21,9% 23,1% 30,8% 12,2% 2,3% 9,7%276 21,0% 14,9% 34,4% 14,9% 2,9% 12,0% 29,7% 17,8% 24,3% 9,8% 2,5% 15,9%403 24,1% 14,1% 29,5% 16,4% 2,5% 13,4% 26,6% 18,6% 21,1% 11,9% 1,7% 20,1%682 22,7% 16,0% 32,1% 16,4% 2,8% 10,0% 29,9% 20,1% 25,1% 10,9% 1,9% 12,2%750 16,8% 16,4% 33,6% 18,7% 3,6% 10,9% 22,3% 20,1% 27,5% 11,6% 3,2% 15,3%311 11,6% 18,0% 29,9% 18,6% 6,8% 15,1% 15,1% 20,9% 28,3% 13,2% 4,8% 17,7%243 19,3% 19,8% 34,2% 19,3% 2,5% 4,9% 26,3% 22,6% 30,5% 12,3% 2,1% 6,2%253 16,6% 14,2% 39,9% 17,4% 4,7% 7,1% 22,5% 22,1% 32,8% 12,6% 2,4% 7,5%257 20,6% 15,6% 34,6% 19,8% 1,6% 7,8% 30,7% 17,1% 26,8% 10,9% 2,7% 11,7%368 28,0% 14,1% 28,5% 14,1% ,8% 14,4% 33,7% 18,5% 17,1% 8,2% 1,1% 21,5%
242 10,3% 13,6% 38,8% 29,8% 5,4% 2,1% 14,9% 23,6% 36,4% 17,8% 2,1% 5,4%
38 21,1% 10,5% 42,1% 21,1% 2,6% 2,6% 23,7% 26,3% 34,2% 10,5% 5,3%683 18,9% 18,4% 35,6% 18,0% 3,7% 5,4% 27,7% 21,7% 30,0% 11,6% 3,2% 5,9%465 25,6% 14,4% 25,4% 10,3% 1,3% 23,0% 29,5% 15,5% 14,8% 7,5% 1,9% 30,8%575 15,5% 17,4% 35,8% 22,6% 4,9% 3,8% 23,5% 22,8% 31,8% 14,4% 3,0% 4,5%72 26,4% 18,1% 20,8% 16,7% 1,4% 16,7% 25,0% 16,7% 26,4% 6,9% 1,4% 23,6%81 13,6% 17,3% 43,2% 17,3% 7,4% 1,2% 22,2% 27,2% 21,0% 19,8% 4,9% 4,9%
29 24,1% 17,2% 31,0% 20,7% 6,9% 31,0% 13,8% 31,0% 13,8% 3,4% 6,9%
21 38,1% 9,5% 23,8% 19,0% 9,5% 42,9% 4,8% 28,6% 9,5% 14,3%
5 40,0% 60,0% 40,0% 40,0% 20,0%69 26,1% 13,0% 30,4% 11,6% 18,8% 27,5% 21,7% 20,3% 4,3% 2,9% 23,2%74 25,7% 17,6% 23,0% 6,8% 4,1% 23,0% 24,3% 17,6% 16,2% 8,1% 4,1% 29,7%
322 27,0% 13,7% 30,1% 15,2% ,3% 13,7% 35,1% 17,4% 19,3% 7,5% ,6% 20,2%65 20,0% 18,5% 30,8% 10,8% 20,0% 27,7% 18,5% 21,5% 6,2% 26,2%85 3,5% 15,3% 41,2% 16,5% 4,7% 18,8% 8,2% 15,3% 35,3% 11,8% 7,1% 22,4%22 4,5% 27,3% 36,4% 9,1% 13,6% 9,1% 4,5% 31,8% 22,7% 18,2% 4,5% 18,2%2 50,0% 50,0% 50,0% 50,0% 7 28,6% 14,3% 28,6% 28,6% 28,6% 14,3% 42,9% 14,3%
1202 18,7% 16,5% 33,6% 19,6% 3,7% 8,0% 25,2% 21,4% 28,0% 12,4% 3,0% 10,1%146 21,9% 15,1% 36,3% 6,8% ,7% 19,2% 29,5% 16,4% 21,2% 3,4% ,7% 28,8%62 32,3% 17,7% 14,5% 1,6% 1,6% 32,3% 32,3% 8,1% 12,9% 6,5% 40,3%21 19,0% 4,8% 23,8% 23,8% 28,6% 23,8% 9,5% 4,8% 14,3% 47,6%3 33,3% 66,7% 33,3% 33,3% 33,3% 6 16,7% 33,3% 33,3% 16,7% 50,0% 16,7% 33,3%
22 36,4% 13,6% 13,6% 36,4% 27,3% 31,8% 9,1% 31,8%57 38,6% 10,5% 10,5% 12,3% 1,8% 26,3% 38,6% 10,5% 12,3% 7,0% 31,6%
132 28,0% 15,9% 28,0% 9,1% ,8% 18,2% 31,1% 18,2% 20,5% 6,8% 23,5%216 23,1% 19,9% 29,6% 12,0% ,5% 14,8% 33,3% 20,8% 18,1% 7,9% 1,9% 18,1%499 17,8% 15,4% 36,7% 21,2% 4,0% 4,8% 26,1% 20,4% 30,1% 12,6% 3,0% 7,8%118 17,8% 12,7% 34,7% 14,4% ,8% 19,5% 19,5% 18,6% 22,9% 9,3% ,8% 28,8%379 13,7% 17,2% 35,6% 21,9% 5,3% 6,3% 19,3% 21,4% 32,2% 14,8% 4,5% 7,9%135 18,5% 16,3% 35,6% 10,4% 3,7% 15,6% 18,5% 20,0% 23,0% 11,1% 3,7% 23,7%354 26,3% 14,7% 26,8% 12,4% ,8% 18,9% 31,9% 15,5% 20,1% 7,6% ,8% 24,0%370 19,2% 17,8% 38,1% 15,7% 2,2% 7,0% 28,6% 23,0% 28,1% 10,5% 1,6% 8,1%96 18,8% 18,8% 32,3% 25,0% 3,1% 2,1% 28,1% 25,0% 29,2% 10,4% 1,0% 6,3%52 13,5% 13,5% 30,8% 32,7% 5,8% 3,8% 15,4% 21,2% 34,6% 17,3% 3,8% 7,7%29 24,1% 3,4% 31,0% 24,1% 17,2% 31,0% 13,8% 17,2% 13,8% 13,8% 10,3%37 16,2% 10,8% 21,6% 18,9% 2,7% 29,7% 24,3% 13,5% 16,2% 13,5% 2,7% 29,7%
359 15,0% 17,3% 34,3% 22,6% 5,0% 5,8% 20,6% 21,4% 31,8% 14,5% 4,2% 7,5%584 20,4% 15,9% 31,2% 13,5% 2,4% 16,6% 25,5% 18,3% 21,2% 11,3% 2,4% 21,2%389 24,9% 15,9% 31,4% 17,7% 4,1% 5,9% 33,2% 21,1% 24,9% 9,3% 2,3% 9,3%242 16,1% 19,0% 37,6% 18,2% 2,1% 7,0% 21,9% 19,4% 37,2% 8,7% 1,7% 11,2%217 12,0% 14,3% 35,0% 27,6% 5,1% 6,0% 18,4% 24,0% 30,4% 17,5% 4,6% 5,1%
1432 19,6% 16,2% 32,9% 17,6% 3,2% 10,5% 25,9% 20,1% 26,3% 11,2% 2,6% 13,8%
SofiaRegional centerSmaller townVillage
Type of residence
MaleFemale
Gender
18-3031-4041-5051-6060+
Age
Finished bachelor, master or higherdegreeFinished collegeFinished secondary schoolFinished elementary and lower
Highest level of educationachieved
EmployeeOther status of employed personsBusiness ownerSelf-employed person innon-agricultural activitiesSelf-employed person in agriculturalactivitiesFamily helperRegistered as unemployedUnregistered unemployedRetired - due to ageRetired - other causesPupil, studentHousewifePerson unable to workAnother status of non working person
Main occupational status inthe present
BulgarianTurkishRomaOther
Ethnicity
No incomeLess than 100 BGN101-150 BGN151-200 BGN201-300 BGN301-500 BGNMore than 500 BGNDon't knowNA
Total household income
No incomeLess than 250 BGN251-500 BGN501-750 BGN751-1000 More than 1000 BGNDon't knowNA
Personal monthly income
I don't use financial servicesOneTwoThree and more
Financial services usage
Total
Base: Row %
Does nottrust at all
Row %Little
Row %Average
Row %Much
Row %Very much
Row %Don't know
Commercial banks operating in Bulgaria
Row %
Does nottrust at all
Row %Little
Row %Average
Row %Much
Row %Very much
Row %Don't know
Insurance companies
101
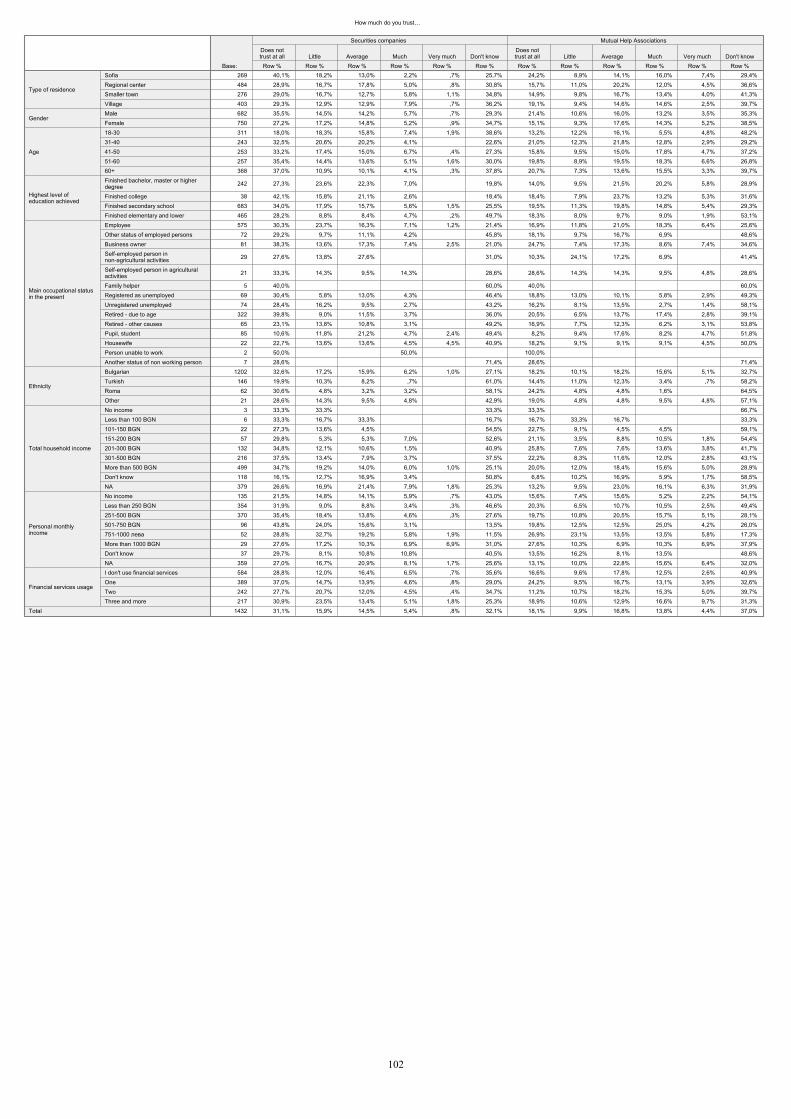
How much do you trust�…
269 40,1% 18,2% 13,0% 2,2% ,7% 25,7% 24,2% 8,9% 14,1% 16,0% 7,4% 29,4%484 28,9% 16,7% 17,8% 5,0% ,8% 30,8% 15,7% 11,0% 20,2% 12,0% 4,5% 36,6%276 29,0% 16,7% 12,7% 5,8% 1,1% 34,8% 14,9% 9,8% 16,7% 13,4% 4,0% 41,3%403 29,3% 12,9% 12,9% 7,9% ,7% 36,2% 19,1% 9,4% 14,6% 14,6% 2,5% 39,7%682 35,5% 14,5% 14,2% 5,7% ,7% 29,3% 21,4% 10,6% 16,0% 13,2% 3,5% 35,3%750 27,2% 17,2% 14,8% 5,2% ,9% 34,7% 15,1% 9,3% 17,6% 14,3% 5,2% 38,5%311 18,0% 18,3% 15,8% 7,4% 1,9% 38,6% 13,2% 12,2% 16,1% 5,5% 4,8% 48,2%243 32,5% 20,6% 20,2% 4,1% 22,6% 21,0% 12,3% 21,8% 12,8% 2,9% 29,2%253 33,2% 17,4% 15,0% 6,7% ,4% 27,3% 15,8% 9,5% 15,0% 17,8% 4,7% 37,2%257 35,4% 14,4% 13,6% 5,1% 1,6% 30,0% 19,8% 8,9% 19,5% 18,3% 6,6% 26,8%368 37,0% 10,9% 10,1% 4,1% ,3% 37,8% 20,7% 7,3% 13,6% 15,5% 3,3% 39,7%
242 27,3% 23,6% 22,3% 7,0% 19,8% 14,0% 9,5% 21,5% 20,2% 5,8% 28,9%
38 42,1% 15,8% 21,1% 2,6% 18,4% 18,4% 7,9% 23,7% 13,2% 5,3% 31,6%683 34,0% 17,9% 15,7% 5,6% 1,5% 25,5% 19,5% 11,3% 19,8% 14,8% 5,4% 29,3%465 28,2% 8,8% 8,4% 4,7% ,2% 49,7% 18,3% 8,0% 9,7% 9,0% 1,9% 53,1%575 30,3% 23,7% 16,3% 7,1% 1,2% 21,4% 16,9% 11,8% 21,0% 18,3% 6,4% 25,6%
72 29,2% 9,7% 11,1% 4,2% 45,8% 18,1% 9,7% 16,7% 6,9% 48,6%81 38,3% 13,6% 17,3% 7,4% 2,5% 21,0% 24,7% 7,4% 17,3% 8,6% 7,4% 34,6%
29 27,6% 13,8% 27,6% 31,0% 10,3% 24,1% 17,2% 6,9% 41,4%
21 33,3% 14,3% 9,5% 14,3% 28,6% 28,6% 14,3% 14,3% 9,5% 4,8% 28,6%
5 40,0% 60,0% 40,0% 60,0%69 30,4% 5,8% 13,0% 4,3% 46,4% 18,8% 13,0% 10,1% 5,8% 2,9% 49,3%74 28,4% 16,2% 9,5% 2,7% 43,2% 16,2% 8,1% 13,5% 2,7% 1,4% 58,1%
322 39,8% 9,0% 11,5% 3,7% 36,0% 20,5% 6,5% 13,7% 17,4% 2,8% 39,1%65 23,1% 13,8% 10,8% 3,1% 49,2% 16,9% 7,7% 12,3% 6,2% 3,1% 53,8%85 10,6% 11,8% 21,2% 4,7% 2,4% 49,4% 8,2% 9,4% 17,6% 8,2% 4,7% 51,8%22 22,7% 13,6% 13,6% 4,5% 4,5% 40,9% 18,2% 9,1% 9,1% 9,1% 4,5% 50,0%
2 50,0% 50,0% 100,0% 7 28,6% 71,4% 28,6% 71,4%
1202 32,6% 17,2% 15,9% 6,2% 1,0% 27,1% 18,2% 10,1% 18,2% 15,6% 5,1% 32,7%146 19,9% 10,3% 8,2% ,7% 61,0% 14,4% 11,0% 12,3% 3,4% ,7% 58,2%
62 30,6% 4,8% 3,2% 3,2% 58,1% 24,2% 4,8% 4,8% 1,6% 64,5%21 28,6% 14,3% 9,5% 4,8% 42,9% 19,0% 4,8% 4,8% 9,5% 4,8% 57,1%
3 33,3% 33,3% 33,3% 33,3% 66,7%6 33,3% 16,7% 33,3% 16,7% 16,7% 33,3% 16,7% 33,3%
22 27,3% 13,6% 4,5% 54,5% 22,7% 9,1% 4,5% 4,5% 59,1%57 29,8% 5,3% 5,3% 7,0% 52,6% 21,1% 3,5% 8,8% 10,5% 1,8% 54,4%
132 34,8% 12,1% 10,6% 1,5% 40,9% 25,8% 7,6% 7,6% 13,6% 3,8% 41,7%216 37,5% 13,4% 7,9% 3,7% 37,5% 22,2% 8,3% 11,6% 12,0% 2,8% 43,1%499 34,7% 19,2% 14,0% 6,0% 1,0% 25,1% 20,0% 12,0% 18,4% 15,6% 5,0% 28,9%118 16,1% 12,7% 16,9% 3,4% 50,8% 6,8% 10,2% 16,9% 5,9% 1,7% 58,5%379 26,6% 16,9% 21,4% 7,9% 1,8% 25,3% 13,2% 9,5% 23,0% 16,1% 6,3% 31,9%135 21,5% 14,8% 14,1% 5,9% ,7% 43,0% 15,6% 7,4% 15,6% 5,2% 2,2% 54,1%354 31,9% 9,0% 8,8% 3,4% ,3% 46,6% 20,3% 6,5% 10,7% 10,5% 2,5% 49,4%370 35,4% 18,4% 13,8% 4,6% ,3% 27,6% 19,7% 10,8% 20,5% 15,7% 5,1% 28,1%
96 43,8% 24,0% 15,6% 3,1% 13,5% 19,8% 12,5% 12,5% 25,0% 4,2% 26,0%52 28,8% 32,7% 19,2% 5,8% 1,9% 11,5% 26,9% 23,1% 13,5% 13,5% 5,8% 17,3%29 27,6% 17,2% 10,3% 6,9% 6,9% 31,0% 27,6% 10,3% 6,9% 10,3% 6,9% 37,9%37 29,7% 8,1% 10,8% 10,8% 40,5% 13,5% 16,2% 8,1% 13,5% 48,6%
359 27,0% 16,7% 20,9% 8,1% 1,7% 25,6% 13,1% 10,0% 22,8% 15,6% 6,4% 32,0%584 28,8% 12,0% 16,4% 6,5% ,7% 35,6% 16,6% 9,6% 17,8% 12,5% 2,6% 40,9%389 37,0% 14,7% 13,9% 4,6% ,8% 29,0% 24,2% 9,5% 16,7% 13,1% 3,9% 32,6%242 27,7% 20,7% 12,0% 4,5% ,4% 34,7% 11,2% 10,7% 18,2% 15,3% 5,0% 39,7%217 30,9% 23,5% 13,4% 5,1% 1,8% 25,3% 18,9% 10,6% 12,9% 16,6% 9,7% 31,3%
1432 31,1% 15,9% 14,5% 5,4% ,8% 32,1% 18,1% 9,9% 16,8% 13,8% 4,4% 37,0%
SofiaRegional centerSmaller townVillage
Type of residence
MaleFemale
Gender
18-3031-4041-5051-6060+
Age
Finished bachelor, master or higherdegreeFinished collegeFinished secondary schoolFinished elementary and lower
Highest level ofeducation achieved
EmployeeOther status of employed personsBusiness ownerSelf-employed person innon-agricultural activitiesSelf-employed person in agriculturalactivitiesFamily helperRegistered as unemployedUnregistered unemployedRetired - due to ageRetired - other causesPupil, studentHousewifePerson unable to workAnother status of non working person
Main occupational statusin the present
BulgarianTurkishRomaOther
Ethnicity
No incomeLess than 100 BGN101-150 BGN151-200 BGN201-300 BGN301-500 BGNMore than 500 BGNDon't knowNA
Total household income
No incomeLess than 250 BGN251-500 BGN501-750 BGN751-1000 More than 1000 BGNDon't knowNA
Personal monthlyincome
I don't use financial servicesOneTwoThree and more
Financial services usage
Total
Base: Row %
Does nottrust at all
Row %Little
Row %Average
Row %Much
Row %Very much
Row %Don't know
Securities companies
Row %
Does nottrust at all
Row %Little
Row %Average
Row %Much
Row %Very much
Row %Don't know
Mutual Help Associations
102

How much do you trust�…
269 28,6% 16,0% 20,1% 11,2% 3,3% 20,8% 57,2% 14,9% 10,4% 2,6% ,4% 14,5%484 25,8% 19,2% 18,6% 7,4% 1,7% 27,3% 50,2% 13,6% 9,9% ,8% ,4% 25,0%276 29,7% 11,6% 14,5% 9,8% 2,2% 32,2% 48,9% 8,3% 7,6% 5,4% 1,8% 27,9%403 29,5% 11,2% 12,2% 7,7% 2,5% 37,0% 41,4% 11,9% 8,9% 4,2% 1,7% 31,8%682 33,1% 14,7% 14,8% 8,9% 1,8% 26,7% 52,3% 12,2% 9,8% 2,6% 1,0% 22,0%750 23,6% 15,1% 17,6% 8,4% 2,8% 32,5% 45,6% 12,5% 8,8% 3,3% 1,1% 28,7%311 19,3% 15,1% 18,3% 10,9% 4,8% 31,5% 38,3% 14,8% 12,9% 4,5% 1,6% 28,0%243 31,7% 18,1% 22,2% 7,4% 2,5% 18,1% 53,9% 17,7% 8,2% ,4% 1,6% 18,1%253 27,3% 18,2% 16,6% 14,2% 1,2% 22,5% 53,0% 14,6% 7,9% 4,0% ,4% 20,2%257 31,5% 14,0% 16,7% 7,4% 1,9% 28,4% 54,1% 8,2% 9,7% 2,7% 1,2% 24,1%368 31,5% 10,9% 10,1% 4,6% 1,1% 41,8% 47,8% 8,2% 7,6% 3,0% ,5% 32,9%
242 21,5% 20,7% 22,7% 17,8% 2,9% 14,5% 55,4% 18,2% 9,9% 1,2% ,4% 14,9%
38 36,8% 15,8% 18,4% 13,2% 15,8% 60,5% 7,9% 13,2% 2,6% 15,8%683 30,6% 15,5% 19,5% 8,2% 2,8% 23,4% 53,9% 13,3% 10,8% 3,4% 1,3% 17,3%465 27,3% 10,8% 8,2% 4,3% 1,3% 48,2% 37,2% 8,0% 6,5% 3,4% 1,1% 43,9%575 28,9% 17,0% 19,7% 12,3% 2,8% 19,3% 54,8% 14,3% 10,1% 3,0% 1,4% 16,5%
72 25,0% 15,3% 19,4% 8,3% 2,8% 29,2% 41,7% 15,3% 12,5% 5,6% 25,0%81 29,6% 16,0% 19,8% 16,0% 3,7% 14,8% 59,3% 7,4% 7,4% 8,6% 2,5% 14,8%
29 17,2% 27,6% 31,0% 10,3% 13,8% 41,4% 27,6% 10,3% 20,7%
21 38,1% 4,8% 19,0% 9,5% 28,6% 52,4% 19,0% 4,8% 23,8%
5 40,0% 60,0% 40,0% 60,0%69 24,6% 14,5% 10,1% 5,8% 1,4% 43,5% 37,7% 8,7% 4,3% 2,9% 1,4% 44,9%74 29,7% 17,6% 8,1% 6,8% 37,8% 37,8% 12,2% 14,9% 35,1%
322 33,5% 10,6% 10,9% 3,4% 1,2% 40,4% 49,4% 8,4% 8,1% 2,2% ,3% 31,7%65 24,6% 10,8% 9,2% 1,5% 53,8% 40,0% 9,2% 4,6% 1,5% 44,6%85 9,4% 15,3% 21,2% 8,2% 4,7% 41,2% 30,6% 15,3% 14,1% 4,7% 2,4% 32,9%22 13,6% 18,2% 18,2% 4,5% 13,6% 31,8% 45,5% 13,6% 4,5% 4,5% 4,5% 27,3%
2 100,0% 100,0% 7 28,6% 14,3% 14,3% 42,9% 28,6% 28,6% 42,9%
1202 28,7% 16,2% 17,8% 10,0% 2,6% 24,7% 50,9% 13,1% 9,7% 3,3% 1,2% 21,7%146 22,6% 9,6% 8,9% 1,4% 57,5% 36,3% 8,2% 6,8% 1,4% 47,3%
62 29,0% 4,8% 4,8% 1,6% 1,6% 58,1% 35,5% 8,1% 8,1% 1,6% 46,8%21 28,6% 4,8% 14,3% 4,8% 4,8% 42,9% 52,4% 14,3% 4,8% 28,6%
3 33,3% 66,7% 33,3% 33,3% 33,3%6 33,3% 16,7% 33,3% 16,7% 33,3% 33,3% 33,3%
22 36,4% 9,1% 4,5% 4,5% 45,5% 31,8% 9,1% 4,5% 54,5%57 33,3% 1,8% 7,0% 1,8% 56,1% 36,8% 3,5% 7,0% 1,8% 50,9%
132 34,1% 11,4% 10,6% 2,3% 41,7% 43,2% 10,6% 6,1% 3,0% ,8% 36,4%216 31,9% 14,8% 11,1% 4,6% ,9% 36,6% 50,9% 11,1% 7,9% 2,8% 27,3%499 30,3% 16,4% 18,0% 10,8% 2,8% 21,6% 56,1% 13,0% 9,4% 2,8% 1,0% 17,6%118 14,4% 15,3% 13,6% 5,9% ,8% 50,0% 31,4% 11,9% 8,5% 4,2% 44,1%379 24,0% 16,4% 21,6% 12,1% 4,2% 21,6% 48,5% 14,2% 11,6% 3,2% 2,4% 20,1%135 23,0% 17,8% 11,1% 6,7% 2,2% 39,3% 34,1% 11,1% 14,1% 3,0% 1,5% 36,3%354 31,1% 8,8% 10,2% 3,7% 1,4% 44,9% 41,2% 10,5% 5,6% 4,0% ,6% 38,1%370 30,5% 15,1% 19,5% 7,6% 1,6% 25,7% 56,5% 10,5% 9,7% 2,2% ,8% 20,3%
96 34,4% 28,1% 13,5% 10,4% 1,0% 12,5% 66,7% 13,5% 9,4% 10,4%52 21,2% 25,0% 23,1% 13,5% 17,3% 48,1% 25,0% 11,5% 3,8% 11,5%29 27,6% 10,3% 3,4% 24,1% 10,3% 24,1% 48,3% 13,8% 3,4% 6,9% 3,4% 24,1%37 21,6% 10,8% 10,8% 10,8% 2,7% 43,2% 32,4% 18,9% 2,7% 10,8% 35,1%
359 24,8% 15,3% 22,3% 12,8% 3,9% 20,9% 51,0% 13,6% 11,4% 2,5% 1,9% 19,5%584 26,9% 14,0% 14,6% 7,9% 2,1% 34,6% 41,4% 11,5% 10,6% 3,8% 1,2% 31,5%389 34,4% 14,4% 14,4% 8,5% 2,6% 25,7% 55,5% 12,9% 8,2% 2,6% 1,5% 19,3%242 24,0% 16,5% 20,2% 6,2% 2,1% 31,0% 53,7% 10,3% 8,7% 2,5% 24,8%217 24,9% 16,1% 19,8% 13,8% 2,8% 22,6% 51,2% 16,1% 8,3% 2,3% ,9% 21,2%
1432 28,1% 14,9% 16,3% 8,7% 2,3% 29,7% 48,8% 12,4% 9,3% 3,0% 1,0% 25,5%
SofiaRegional centerSmaller townVillage
Type of residence
MaleFemale
Gender
18-3031-4041-5051-6060+
Age
Finished bachelor, master or higherdegreeFinished collegeFinished secondary schoolFinished elementary and lower
Highest level ofeducation achieved
EmployeeOther status of employed personsBusiness ownerSelf-employed person innon-agricultural activitiesSelf-employed person in agriculturalactivitiesFamily helperRegistered as unemployedUnregistered unemployedRetired - due to ageRetired - other causesPupil, studentHousewifePerson unable to workAnother status of non working person
Main occupationalstatus in the present
BulgarianTurkishRomaOther
Ethnicity
No incomeLess than 100 BGN101-150 BGN151-200 BGN201-300 BGN301-500 BGNMore than 500 BGNDon't knowNA
Total householdincome
No incomeLess than 250 BGN251-500 BGN501-750 BGN751-1000 More than 1000 BGNDon't knowNA
Personal monthlyincome
I don't use financial servicesOneTwoThree and more
Financial servicesusage
Total
Base: Row %
Does nottrust at all
Row %Little
Row %Average
Row %Much
Row %Very much
Row %Don't know
Leasing companies
Row %
Does nottrust at all
Row %Little
Row %Average
Row %Much
Row %Very much
Row %Don't know
Pawn shops
103
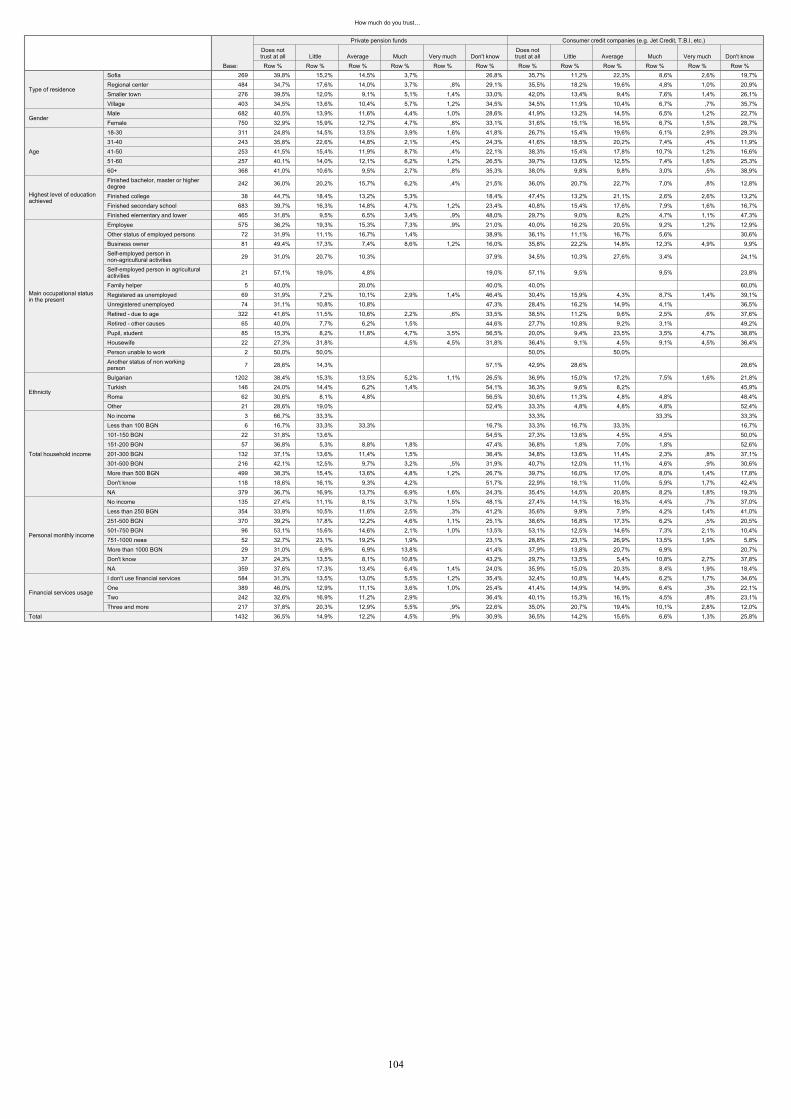
How much do you trust�…
269 39,8% 15,2% 14,5% 3,7% 26,8% 35,7% 11,2% 22,3% 8,6% 2,6% 19,7%484 34,7% 17,6% 14,0% 3,7% ,8% 29,1% 35,5% 18,2% 19,6% 4,8% 1,0% 20,9%276 39,5% 12,0% 9,1% 5,1% 1,4% 33,0% 42,0% 13,4% 9,4% 7,6% 1,4% 26,1%403 34,5% 13,6% 10,4% 5,7% 1,2% 34,5% 34,5% 11,9% 10,4% 6,7% ,7% 35,7%682 40,5% 13,9% 11,6% 4,4% 1,0% 28,6% 41,9% 13,2% 14,5% 6,5% 1,2% 22,7%750 32,9% 15,9% 12,7% 4,7% ,8% 33,1% 31,6% 15,1% 16,5% 6,7% 1,5% 28,7%311 24,8% 14,5% 13,5% 3,9% 1,6% 41,8% 26,7% 15,4% 19,6% 6,1% 2,9% 29,3%243 35,8% 22,6% 14,8% 2,1% ,4% 24,3% 41,6% 18,5% 20,2% 7,4% ,4% 11,9%253 41,5% 15,4% 11,9% 8,7% ,4% 22,1% 38,3% 15,4% 17,8% 10,7% 1,2% 16,6%257 40,1% 14,0% 12,1% 6,2% 1,2% 26,5% 39,7% 13,6% 12,5% 7,4% 1,6% 25,3%368 41,0% 10,6% 9,5% 2,7% ,8% 35,3% 38,0% 9,8% 9,8% 3,0% ,5% 38,9%
242 36,0% 20,2% 15,7% 6,2% ,4% 21,5% 36,0% 20,7% 22,7% 7,0% ,8% 12,8%
38 44,7% 18,4% 13,2% 5,3% 18,4% 47,4% 13,2% 21,1% 2,6% 2,6% 13,2%683 39,7% 16,3% 14,8% 4,7% 1,2% 23,4% 40,8% 15,4% 17,6% 7,9% 1,6% 16,7%465 31,8% 9,5% 6,5% 3,4% ,9% 48,0% 29,7% 9,0% 8,2% 4,7% 1,1% 47,3%575 36,2% 19,3% 15,3% 7,3% ,9% 21,0% 40,0% 16,2% 20,5% 9,2% 1,2% 12,9%
72 31,9% 11,1% 16,7% 1,4% 38,9% 36,1% 11,1% 16,7% 5,6% 30,6%81 49,4% 17,3% 7,4% 8,6% 1,2% 16,0% 35,8% 22,2% 14,8% 12,3% 4,9% 9,9%
29 31,0% 20,7% 10,3% 37,9% 34,5% 10,3% 27,6% 3,4% 24,1%
21 57,1% 19,0% 4,8% 19,0% 57,1% 9,5% 9,5% 23,8%
5 40,0% 20,0% 40,0% 40,0% 60,0%69 31,9% 7,2% 10,1% 2,9% 1,4% 46,4% 30,4% 15,9% 4,3% 8,7% 1,4% 39,1%74 31,1% 10,8% 10,8% 47,3% 28,4% 16,2% 14,9% 4,1% 36,5%
322 41,6% 11,5% 10,6% 2,2% ,6% 33,5% 38,5% 11,2% 9,6% 2,5% ,6% 37,6%65 40,0% 7,7% 6,2% 1,5% 44,6% 27,7% 10,8% 9,2% 3,1% 49,2%85 15,3% 8,2% 11,8% 4,7% 3,5% 56,5% 20,0% 9,4% 23,5% 3,5% 4,7% 38,8%22 27,3% 31,8% 4,5% 4,5% 31,8% 36,4% 9,1% 4,5% 9,1% 4,5% 36,4%
2 50,0% 50,0% 50,0% 50,0%
7 28,6% 14,3% 57,1% 42,9% 28,6% 28,6%
1202 38,4% 15,3% 13,5% 5,2% 1,1% 26,5% 36,9% 15,0% 17,2% 7,5% 1,6% 21,8%146 24,0% 14,4% 6,2% 1,4% 54,1% 36,3% 9,6% 8,2% 45,9%
62 30,6% 8,1% 4,8% 56,5% 30,6% 11,3% 4,8% 4,8% 48,4%21 28,6% 19,0% 52,4% 33,3% 4,8% 4,8% 4,8% 52,4%
3 66,7% 33,3% 33,3% 33,3% 33,3%6 16,7% 33,3% 33,3% 16,7% 33,3% 16,7% 33,3% 16,7%
22 31,8% 13,6% 54,5% 27,3% 13,6% 4,5% 4,5% 50,0%57 36,8% 5,3% 8,8% 1,8% 47,4% 36,8% 1,8% 7,0% 1,8% 52,6%
132 37,1% 13,6% 11,4% 1,5% 36,4% 34,8% 13,6% 11,4% 2,3% ,8% 37,1%216 42,1% 12,5% 9,7% 3,2% ,5% 31,9% 40,7% 12,0% 11,1% 4,6% ,9% 30,6%499 38,3% 15,4% 13,6% 4,8% 1,2% 26,7% 39,7% 16,0% 17,0% 8,0% 1,4% 17,8%118 18,6% 16,1% 9,3% 4,2% 51,7% 22,9% 16,1% 11,0% 5,9% 1,7% 42,4%379 36,7% 16,9% 13,7% 6,9% 1,6% 24,3% 35,4% 14,5% 20,8% 8,2% 1,8% 19,3%135 27,4% 11,1% 8,1% 3,7% 1,5% 48,1% 27,4% 14,1% 16,3% 4,4% ,7% 37,0%354 33,9% 10,5% 11,6% 2,5% ,3% 41,2% 35,6% 9,9% 7,9% 4,2% 1,4% 41,0%370 39,2% 17,8% 12,2% 4,6% 1,1% 25,1% 38,6% 16,8% 17,3% 6,2% ,5% 20,5%
96 53,1% 15,6% 14,6% 2,1% 1,0% 13,5% 53,1% 12,5% 14,6% 7,3% 2,1% 10,4%52 32,7% 23,1% 19,2% 1,9% 23,1% 28,8% 23,1% 26,9% 13,5% 1,9% 5,8%29 31,0% 6,9% 6,9% 13,8% 41,4% 37,9% 13,8% 20,7% 6,9% 20,7%37 24,3% 13,5% 8,1% 10,8% 43,2% 29,7% 13,5% 5,4% 10,8% 2,7% 37,8%
359 37,6% 17,3% 13,4% 6,4% 1,4% 24,0% 35,9% 15,0% 20,3% 8,4% 1,9% 18,4%584 31,3% 13,5% 13,0% 5,5% 1,2% 35,4% 32,4% 10,8% 14,4% 6,2% 1,7% 34,6%389 46,0% 12,9% 11,1% 3,6% 1,0% 25,4% 41,4% 14,9% 14,9% 6,4% ,3% 22,1%242 32,6% 16,9% 11,2% 2,9% 36,4% 40,1% 15,3% 16,1% 4,5% ,8% 23,1%217 37,8% 20,3% 12,9% 5,5% ,9% 22,6% 35,0% 20,7% 19,4% 10,1% 2,8% 12,0%
1432 36,5% 14,9% 12,2% 4,5% ,9% 30,9% 36,5% 14,2% 15,6% 6,6% 1,3% 25,8%
SofiaRegional centerSmaller townVillage
Type of residence
MaleFemale
Gender
18-3031-4041-5051-6060+
Age
Finished bachelor, master or higherdegreeFinished collegeFinished secondary schoolFinished elementary and lower
Highest level of educationachieved
EmployeeOther status of employed personsBusiness ownerSelf-employed person innon-agricultural activitiesSelf-employed person in agriculturalactivitiesFamily helperRegistered as unemployedUnregistered unemployedRetired - due to ageRetired - other causesPupil, studentHousewifePerson unable to workAnother status of non workingperson
Main occupational statusin the present
BulgarianTurkishRomaOther
Ethnicity
No incomeLess than 100 BGN101-150 BGN151-200 BGN201-300 BGN301-500 BGNMore than 500 BGNDon't knowNA
Total household income
No incomeLess than 250 BGN251-500 BGN501-750 BGN751-1000 More than 1000 BGNDon't knowNA
Personal monthly income
I don't use financial servicesOneTwoThree and more
Financial services usage
Total
Base: Row %
Does nottrust at all
Row %Little
Row %Average
Row %Much
Row %Very much
Row %Don't know
Private pension funds
Row %
Does nottrust at all
Row %Little
Row %Average
Row %Much
Row %Very much
Row %Don't know
Consumer credit companies (e.g. Jet Credit, T.B.I, etc.)
104

How much do you trust�…
269 27,9% 18,6% 27,5% 13,4% 1,5% 11,2% 10,8% 7,4% 27,1% 39,0% 11,9% 3,7%484 21,1% 24,6% 37,2% 5,6% 1,7% 9,9% 5,8% 14,0% 38,6% 27,5% 6,6% 7,4%276 25,7% 18,1% 29,0% 10,9% 1,4% 14,9% 10,9% 10,9% 33,7% 22,5% 10,5% 11,6%403 21,8% 19,4% 26,8% 8,9% 2,7% 20,3% 10,9% 11,2% 31,0% 21,8% 10,9% 14,1%682 27,3% 19,9% 31,1% 8,5% 1,9% 11,3% 10,6% 12,5% 35,3% 25,1% 9,2% 7,3%750 20,0% 21,5% 30,7% 9,5% 1,9% 16,5% 7,9% 10,4% 31,6% 28,9% 9,9% 11,3%311 20,3% 17,4% 29,3% 9,6% 2,9% 20,6% 5,8% 11,3% 32,5% 25,7% 11,9% 12,9%243 27,2% 19,3% 31,3% 9,9% 1,2% 11,1% 11,5% 14,4% 32,1% 29,6% 6,6% 5,8%253 19,4% 22,9% 37,9% 11,1% 2,0% 6,7% 4,7% 14,2% 36,8% 30,0% 8,7% 5,5%257 23,0% 20,2% 34,2% 7,8% 2,3% 12,5% 10,1% 10,1% 33,5% 28,0% 11,3% 7,0%368 26,9% 23,4% 24,7% 7,3% 1,1% 16,6% 12,8% 8,4% 32,6% 23,9% 9,0% 13,3%
242 19,0% 18,2% 38,8% 15,7% ,8% 7,4% 3,3% 9,5% 33,5% 38,8% 12,8% 2,1%
38 26,3% 18,4% 44,7% 7,9% 2,6% 7,9% 15,8% 28,9% 39,5% 5,3% 2,6%683 22,8% 21,4% 35,3% 8,3% 2,3% 9,8% 8,6% 11,3% 36,6% 29,3% 10,8% 3,4%465 26,7% 21,1% 19,1% 6,7% 1,5% 24,9% 13,1% 12,0% 28,8% 17,0% 6,2% 22,8%575 20,2% 19,5% 37,2% 12,7% 2,1% 8,3% 6,6% 11,8% 34,1% 33,9% 10,1% 3,5%
72 26,4% 16,7% 25,0% 11,1% 20,8% 18,1% 16,7% 23,6% 18,1% 8,3% 15,3%81 23,5% 17,3% 42,0% 4,9% 4,9% 7,4% 8,6% 12,3% 39,5% 21,0% 18,5%
29 17,2% 27,6% 41,4% 6,9% 6,9% 6,9% 13,8% 48,3% 27,6% 3,4%
21 28,6% 14,3% 23,8% 4,8% 9,5% 19,0% 9,5% 9,5% 38,1% 14,3% 14,3% 14,3%
5 40,0% 20,0% 20,0% 20,0% 20,0% 20,0% 20,0% 20,0% 20,0%69 36,2% 13,0% 27,5% 2,9% 1,4% 18,8% 14,5% 14,5% 26,1% 26,1% 2,9% 15,9%74 33,8% 18,9% 14,9% 2,7% 1,4% 28,4% 8,1% 9,5% 33,8% 14,9% 9,5% 24,3%
322 26,1% 26,7% 25,5% 5,6% 1,2% 14,9% 12,1% 7,5% 34,2% 25,8% 9,3% 11,2%65 20,0% 26,2% 24,6% 7,7% 21,5% 10,8% 15,4% 27,7% 20,0% 1,5% 24,6%85 15,3% 15,3% 27,1% 14,1% 2,4% 25,9% 3,5% 11,8% 36,5% 24,7% 9,4% 14,1%22 18,2% 27,3% 27,3% 4,5% 4,5% 18,2% 22,7% 22,7% 22,7% 22,7% 9,1%
2 50,0% 50,0% 50,0% 50,0% 7 42,9% 28,6% 14,3% 14,3% 14,3% 28,6% 14,3% 42,9%
1202 23,3% 21,2% 32,7% 10,0% 2,2% 10,6% 8,3% 11,2% 33,3% 29,8% 11,1% 6,3%146 19,2% 21,9% 21,9% 3,4% 33,6% 11,0% 13,7% 37,0% 13,0% 2,1% 23,3%
62 37,1% 9,7% 21,0% 1,6% 30,6% 21,0% 9,7% 33,9% 4,8% 30,6%21 23,8% 19,0% 19,0% 14,3% 23,8% 9,5% 9,5% 14,3% 38,1% 28,6%
3 33,3% 33,3% 33,3% 33,3% 66,7% 6 33,3% 16,7% 33,3% 16,7% 16,7% 50,0% 33,3%
22 31,8% 36,4% 4,5% 4,5% 22,7% 18,2% 18,2% 22,7% 13,6% 27,3%57 31,6% 24,6% 14,0% 1,8% 28,1% 15,8% 15,8% 22,8% 17,5% 5,3% 22,8%
132 32,6% 19,7% 21,2% 6,8% ,8% 18,9% 16,7% 12,1% 28,0% 22,0% 5,3% 15,9%216 27,3% 25,5% 29,2% 3,7% ,5% 13,9% 11,1% 13,0% 39,4% 19,4% 6,9% 10,2%499 20,0% 21,0% 36,7% 10,0% 1,0% 11,2% 6,8% 9,0% 32,9% 38,1% 7,8% 5,4%118 18,6% 19,5% 28,8% 8,5% 1,7% 22,9% 7,6% 8,5% 40,7% 16,9% 6,8% 19,5%379 22,2% 17,2% 32,2% 13,2% 4,7% 10,6% 7,4% 13,2% 32,5% 24,3% 16,6% 6,1%135 26,7% 19,3% 22,2% 8,1% ,7% 23,0% 10,4% 12,6% 33,3% 17,8% 9,6% 16,3%354 28,0% 25,4% 23,2% 5,6% ,6% 17,2% 13,3% 11,6% 30,8% 21,8% 5,6% 16,9%370 23,0% 23,0% 34,3% 6,8% ,3% 12,7% 8,4% 11,1% 38,6% 29,2% 6,8% 5,9%
96 15,6% 18,8% 45,8% 10,4% 2,1% 7,3% 4,2% 10,4% 38,5% 33,3% 11,5% 2,1%52 19,2% 17,3% 38,5% 15,4% 9,6% 5,8% 9,6% 21,2% 55,8% 7,7% 29 27,6% 3,4% 34,5% 20,7% 6,9% 6,9% 17,2% 3,4% 10,3% 58,6% 10,3% 37 10,8% 16,2% 27,0% 13,5% 2,7% 29,7% 8,1% 2,7% 37,8% 21,6% 8,1% 21,6%
359 22,0% 17,3% 33,1% 12,3% 5,0% 10,3% 6,7% 13,1% 32,3% 25,9% 16,2% 5,8%584 23,3% 20,4% 24,1% 10,6% 1,7% 19,9% 9,6% 11,3% 31,5% 21,1% 9,6% 17,0%389 25,7% 21,1% 35,5% 6,9% 1,5% 9,3% 11,8% 9,8% 36,2% 28,3% 9,8% 4,1%242 21,1% 21,1% 37,6% 6,6% 1,7% 12,0% 5,8% 14,5% 37,6% 28,9% 7,9% 5,4%217 22,6% 20,7% 33,2% 11,1% 3,2% 9,2% 6,9% 11,1% 28,6% 39,2% 11,1% 3,2%
1432 23,5% 20,7% 30,9% 9,0% 1,9% 14,0% 9,1% 11,4% 33,4% 27,1% 9,6% 9,4%
SofiaRegional centerSmaller townVillage
Type of residence
MaleFemale
Gender
18-3031-4041-5051-6060+
Age
Finished bachelor, master or higherdegreeFinished collegeFinished secondary schoolFinished elementary and lower
Highest level ofeducation achieved
EmployeeOther status of employed personsBusiness ownerSelf-employed person innon-agricultural activitiesSelf-employed person in agriculturalactivitiesFamily helperRegistered as unemployedUnregistered unemployedRetired - due to ageRetired - other causesPupil, studentHousewifePerson unable to workAnother status of non working person
Main occupational statusin the present
BulgarianTurkishRomaOther
Ethnicity
No incomeLess than 100 BGN101-150 BGN151-200 BGN201-300 BGN301-500 BGNMore than 500 BGNDon't knowNA
Total household income
No incomeLess than 250 BGN251-500 BGN501-750 BGN751-1000 More than 1000 BGNDon't knowNA
Personal monthly income
I don't use financial servicesOneTwoThree and more
Financial services usage
Total
Base: Row %
Does nottrust at all
Row %Little
Row %Average
Row %Much
Row %Very much
Row %Don't know
The Bulgarian economy
Row %
Does nottrust at all
Row %Little
Row %Average
Row %Much
Row %Very much
Row %Don't know
Bulgarian National Bank
105

How much do you trust�…
269 20,4% 10,0% 21,6% 14,1% 8,2% 25,7% 20,8% 15,2% 26,0% 19,0% 8,2% 10,8%484 14,3% 18,0% 24,6% 9,3% 3,3% 30,6% 19,6% 21,5% 26,2% 9,9% 5,4% 17,4%276 17,4% 10,1% 25,7% 10,5% 1,8% 34,4% 20,3% 11,6% 28,6% 13,4% 1,4% 24,6%403 12,4% 10,4% 21,3% 10,7% 3,0% 42,2% 14,6% 13,6% 23,6% 12,9% 2,7% 32,5%682 17,0% 13,6% 24,3% 10,0% 4,1% 30,9% 20,4% 18,0% 24,9% 12,6% 3,8% 20,2%750 14,1% 12,1% 22,4% 11,6% 3,6% 36,1% 16,9% 14,5% 26,8% 13,6% 4,9% 23,2%311 11,6% 9,6% 23,5% 12,2% 6,8% 36,3% 12,9% 16,7% 25,1% 14,8% 6,1% 24,4%243 17,3% 14,8% 27,2% 12,8% 2,5% 25,5% 22,6% 14,8% 23,5% 18,1% 4,9% 16,0%253 11,9% 15,0% 27,7% 12,3% 2,4% 30,8% 16,6% 15,8% 32,8% 12,6% 5,5% 16,6%257 17,9% 14,4% 23,3% 10,9% 3,9% 29,6% 20,2% 14,8% 30,0% 11,7% 3,9% 19,5%368 18,5% 11,7% 17,7% 7,3% 3,3% 41,6% 20,9% 17,9% 20,7% 9,8% 2,2% 28,5%
242 11,2% 15,7% 26,9% 19,8% 6,2% 20,2% 16,1% 18,2% 30,6% 21,5% 5,8% 7,9%
38 21,1% 10,5% 28,9% 13,2% 5,3% 21,1% 21,1% 15,8% 34,2% 15,8% 7,9% 5,3%683 17,1% 14,3% 27,4% 10,8% 3,8% 26,5% 19,6% 16,8% 29,7% 13,8% 5,0% 15,1%465 15,1% 9,5% 15,1% 5,8% 2,4% 52,3% 18,1% 14,4% 17,4% 7,5% 2,4% 40,2%575 13,9% 14,3% 27,8% 16,0% 4,5% 23,5% 17,0% 17,4% 29,6% 18,1% 5,2% 12,7%
72 18,1% 12,5% 15,3% 6,9% 47,2% 19,4% 18,1% 23,6% 8,3% 1,4% 29,2%81 21,0% 13,6% 32,1% 9,9% 6,2% 17,3% 25,9% 16,0% 29,6% 11,1% 9,9% 7,4%
29 10,3% 20,7% 24,1% 10,3% 10,3% 24,1% 13,8% 20,7% 34,5% 17,2% 3,4% 10,3%
21 14,3% 4,8% 28,6% 9,5% 9,5% 33,3% 19,0% 14,3% 19,0% 9,5% 9,5% 28,6%
5 40,0% 20,0% 40,0% 40,0% 20,0% 40,0%69 23,2% 10,1% 24,6% 7,2% 34,8% 26,1% 8,7% 20,3% 15,9% 4,3% 24,6%74 13,5% 8,1% 21,6% 4,1% 2,7% 50,0% 18,9% 10,8% 18,9% 9,5% 1,4% 40,5%
322 17,4% 12,1% 18,0% 7,1% 2,8% 42,5% 20,8% 15,8% 24,5% 7,8% 2,2% 28,9%65 10,8% 12,3% 13,8% 4,6% 58,5% 20,0% 15,4% 18,5% 4,6% 1,5% 40,0%85 8,2% 12,9% 20,0% 10,6% 7,1% 41,2% 5,9% 21,2% 22,4% 11,8% 8,2% 30,6%22 22,7% 18,2% 13,6% 9,1% 9,1% 27,3% 18,2% 13,6% 22,7% 18,2% 9,1% 18,2%
2 50,0% 50,0% 50,0% 50,0% 7 14,3% 14,3% 71,4% 14,3% 14,3% 14,3% 57,1%
1202 15,8% 13,6% 25,0% 12,1% 4,6% 29,0% 18,9% 16,8% 27,5% 14,6% 5,1% 17,1%146 13,0% 11,6% 15,8% 4,1% 55,5% 15,8% 15,1% 21,2% 4,1% ,7% 43,2%
62 17,7% 4,8% 12,9% 1,6% 62,9% 22,6% 9,7% 12,9% 1,6% 1,6% 51,6%21 9,5% 4,8% 9,5% 14,3% 61,9% 9,5% 9,5% 4,8% 23,8% 52,4%
3 33,3% 33,3% 33,3% 33,3% 33,3% 33,3%6 50,0% 16,7% 33,3% 16,7% 33,3% 16,7% 33,3%
22 13,6% 4,5% 13,6% 68,2% 18,2% 13,6% 13,6% 4,5% 50,0%57 24,6% 8,8% 17,5% 3,5% 1,8% 43,9% 26,3% 14,0% 15,8% 5,3% 1,8% 36,8%
132 22,0% 11,4% 15,2% 3,8% 2,3% 45,5% 24,2% 16,7% 19,7% 6,8% 3,0% 29,5%216 19,0% 12,5% 19,9% 5,1% ,9% 42,6% 22,2% 16,7% 24,1% 7,4% 1,4% 28,2%499 17,0% 14,8% 24,2% 14,0% 3,8% 26,1% 19,4% 17,6% 26,1% 17,6% 4,2% 15,0%118 5,1% 11,0% 25,4% 6,8% 3,4% 48,3% 5,9% 12,7% 29,7% 10,2% 3,4% 38,1%379 11,3% 12,9% 27,2% 15,0% 6,9% 26,6% 16,4% 15,6% 29,8% 15,3% 7,9% 15,0%135 16,3% 9,6% 22,2% 5,9% 4,4% 41,5% 14,8% 18,5% 20,0% 11,1% 4,4% 31,1%354 18,9% 11,3% 16,9% 6,2% 1,1% 45,5% 20,9% 17,2% 20,6% 6,5% 1,4% 33,3%370 14,9% 14,9% 25,4% 8,9% 2,2% 33,8% 18,4% 17,3% 29,7% 11,9% 2,7% 20,0%
96 15,6% 21,9% 24,0% 13,5% 6,3% 18,8% 21,9% 19,8% 26,0% 19,8% 4,2% 8,3%52 19,2% 13,5% 30,8% 19,2% 7,7% 9,6% 13,5% 21,2% 30,8% 17,3% 11,5% 5,8%29 27,6% 6,9% 20,7% 24,1% 3,4% 17,2% 31,0% 6,9% 13,8% 31,0% 10,3% 6,9%37 5,4% 2,7% 24,3% 18,9% 2,7% 45,9% 10,8% 2,7% 35,1% 16,2% 2,7% 32,4%
359 12,0% 12,5% 26,7% 15,3% 7,0% 26,5% 17,5% 13,6% 28,7% 17,5% 7,8% 14,8%584 14,7% 13,5% 20,2% 10,3% 2,7% 38,5% 16,3% 16,3% 23,5% 12,2% 3,6% 28,3%389 20,6% 10,0% 22,9% 11,3% 4,6% 30,6% 23,4% 14,4% 25,7% 13,9% 4,6% 18,0%242 8,7% 14,0% 27,7% 9,5% 3,3% 36,8% 12,0% 19,8% 31,8% 12,0% 4,1% 20,2%217 16,1% 14,7% 27,6% 12,9% 6,0% 22,6% 23,5% 15,2% 26,3% 15,7% 6,5% 12,9%
1432 15,5% 12,8% 23,3% 10,8% 3,8% 33,7% 18,6% 16,2% 25,9% 13,1% 4,4% 21,8%
SofiaRegional centerSmaller townVillage
Type of residence
MaleFemale
Gender
18-3031-4041-5051-6060+
Age
Finished bachelor, master or higherdegreeFinished collegeFinished secondary schoolFinished elementary and lower
Highest level ofeducation achieved
EmployeeOther status of employed personsBusiness ownerSelf-employed person innon-agricultural activitiesSelf-employed person in agriculturalactivitiesFamily helperRegistered as unemployedUnregistered unemployedRetired - due to ageRetired - other causesPupil, studentHousewifePerson unable to workAnother status of non working person
Main occupationalstatus in the present
BulgarianTurkishRomaOther
Ethnicity
No incomeLess than 100 BGN101-150 BGN151-200 BGN201-300 BGN301-500 BGNMore than 500 BGNDon't knowNA
Total householdincome
No incomeLess than 250 BGN251-500 BGN501-750 BGN751-1000 More than 1000 BGNDon't knowNA
Personal monthlyincome
I don't use financial servicesOneTwoThree and more
Financial servicesusage
Total
Base: Row %
Does nottrust at all
Row %Little
Row %Average
Row %Much
Row %Very much
Row %Don't know
Financial Supervision Commission
Row %
Does nottrust at all
Row %Little
Row %Average
Row %Much
Row %Very much
Row %Don't know
Consumer Protection Commission
106
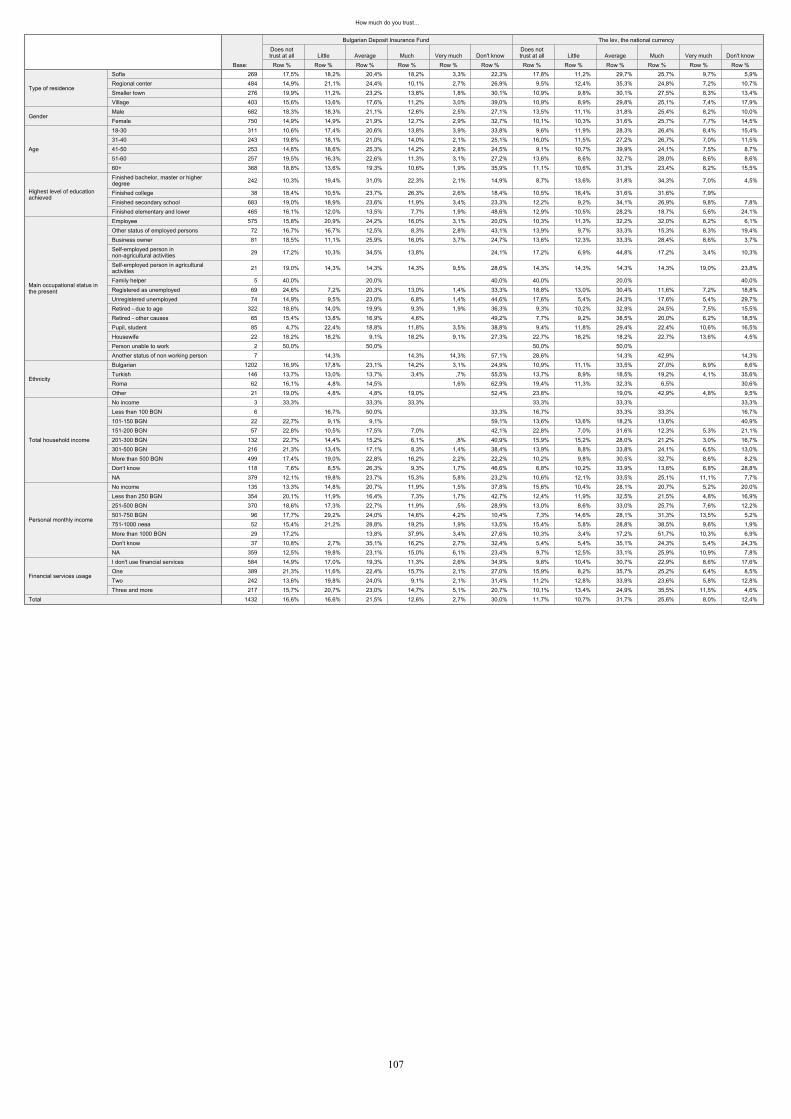
How much do you trust�…
269 17,5% 18,2% 20,4% 18,2% 3,3% 22,3% 17,8% 11,2% 29,7% 25,7% 9,7% 5,9%484 14,9% 21,1% 24,4% 10,1% 2,7% 26,9% 9,5% 12,4% 35,3% 24,8% 7,2% 10,7%276 19,9% 11,2% 23,2% 13,8% 1,8% 30,1% 10,9% 9,8% 30,1% 27,5% 8,3% 13,4%403 15,6% 13,6% 17,6% 11,2% 3,0% 39,0% 10,9% 8,9% 29,8% 25,1% 7,4% 17,9%682 18,3% 18,3% 21,1% 12,6% 2,5% 27,1% 13,5% 11,1% 31,8% 25,4% 8,2% 10,0%750 14,9% 14,9% 21,9% 12,7% 2,9% 32,7% 10,1% 10,3% 31,6% 25,7% 7,7% 14,5%311 10,6% 17,4% 20,6% 13,8% 3,9% 33,8% 9,6% 11,9% 28,3% 26,4% 8,4% 15,4%243 19,8% 18,1% 21,0% 14,0% 2,1% 25,1% 16,0% 11,5% 27,2% 26,7% 7,0% 11,5%253 14,6% 18,6% 25,3% 14,2% 2,8% 24,5% 9,1% 10,7% 39,9% 24,1% 7,5% 8,7%257 19,5% 16,3% 22,6% 11,3% 3,1% 27,2% 13,6% 8,6% 32,7% 28,0% 8,6% 8,6%368 18,8% 13,6% 19,3% 10,6% 1,9% 35,9% 11,1% 10,6% 31,3% 23,4% 8,2% 15,5%
242 10,3% 19,4% 31,0% 22,3% 2,1% 14,9% 8,7% 13,6% 31,8% 34,3% 7,0% 4,5%
38 18,4% 10,5% 23,7% 26,3% 2,6% 18,4% 10,5% 18,4% 31,6% 31,6% 7,9% 683 19,0% 18,9% 23,6% 11,9% 3,4% 23,3% 12,2% 9,2% 34,1% 26,9% 9,8% 7,8%465 16,1% 12,0% 13,5% 7,7% 1,9% 48,6% 12,9% 10,5% 28,2% 18,7% 5,6% 24,1%575 15,8% 20,9% 24,2% 16,0% 3,1% 20,0% 10,3% 11,3% 32,2% 32,0% 8,2% 6,1%
72 16,7% 16,7% 12,5% 8,3% 2,8% 43,1% 13,9% 9,7% 33,3% 15,3% 8,3% 19,4%81 18,5% 11,1% 25,9% 16,0% 3,7% 24,7% 13,6% 12,3% 33,3% 28,4% 8,6% 3,7%
29 17,2% 10,3% 34,5% 13,8% 24,1% 17,2% 6,9% 44,8% 17,2% 3,4% 10,3%
21 19,0% 14,3% 14,3% 14,3% 9,5% 28,6% 14,3% 14,3% 14,3% 14,3% 19,0% 23,8%
5 40,0% 20,0% 40,0% 40,0% 20,0% 40,0%69 24,6% 7,2% 20,3% 13,0% 1,4% 33,3% 18,8% 13,0% 30,4% 11,6% 7,2% 18,8%74 14,9% 9,5% 23,0% 6,8% 1,4% 44,6% 17,6% 5,4% 24,3% 17,6% 5,4% 29,7%
322 18,6% 14,0% 19,9% 9,3% 1,9% 36,3% 9,3% 10,2% 32,9% 24,5% 7,5% 15,5%65 15,4% 13,8% 16,9% 4,6% 49,2% 7,7% 9,2% 38,5% 20,0% 6,2% 18,5%85 4,7% 22,4% 18,8% 11,8% 3,5% 38,8% 9,4% 11,8% 29,4% 22,4% 10,6% 16,5%22 18,2% 18,2% 9,1% 18,2% 9,1% 27,3% 22,7% 18,2% 18,2% 22,7% 13,6% 4,5%
2 50,0% 50,0% 50,0% 50,0% 7 14,3% 14,3% 14,3% 57,1% 28,6% 14,3% 42,9% 14,3%
1202 16,9% 17,8% 23,1% 14,2% 3,1% 24,9% 10,9% 11,1% 33,5% 27,0% 8,9% 8,6%146 13,7% 13,0% 13,7% 3,4% ,7% 55,5% 13,7% 8,9% 18,5% 19,2% 4,1% 35,6%
62 16,1% 4,8% 14,5% 1,6% 62,9% 19,4% 11,3% 32,3% 6,5% 30,6%21 19,0% 4,8% 4,8% 19,0% 52,4% 23,8% 19,0% 42,9% 4,8% 9,5%
3 33,3% 33,3% 33,3% 33,3% 33,3% 33,3%6 16,7% 50,0% 33,3% 16,7% 33,3% 33,3% 16,7%
22 22,7% 9,1% 9,1% 59,1% 13,6% 13,6% 18,2% 13,6% 40,9%57 22,8% 10,5% 17,5% 7,0% 42,1% 22,8% 7,0% 31,6% 12,3% 5,3% 21,1%
132 22,7% 14,4% 15,2% 6,1% ,8% 40,9% 15,9% 15,2% 28,0% 21,2% 3,0% 16,7%216 21,3% 13,4% 17,1% 8,3% 1,4% 38,4% 13,9% 8,8% 33,8% 24,1% 6,5% 13,0%499 17,4% 19,0% 22,8% 16,2% 2,2% 22,2% 10,2% 9,8% 30,5% 32,7% 8,6% 8,2%118 7,6% 8,5% 26,3% 9,3% 1,7% 46,6% 6,8% 10,2% 33,9% 13,6% 6,8% 28,8%379 12,1% 19,8% 23,7% 15,3% 5,8% 23,2% 10,6% 12,1% 33,5% 25,1% 11,1% 7,7%135 13,3% 14,8% 20,7% 11,9% 1,5% 37,8% 15,6% 10,4% 28,1% 20,7% 5,2% 20,0%354 20,1% 11,9% 16,4% 7,3% 1,7% 42,7% 12,4% 11,9% 32,5% 21,5% 4,8% 16,9%370 18,6% 17,3% 22,7% 11,9% ,5% 28,9% 13,0% 8,6% 33,0% 25,7% 7,6% 12,2%
96 17,7% 29,2% 24,0% 14,6% 4,2% 10,4% 7,3% 14,6% 28,1% 31,3% 13,5% 5,2%52 15,4% 21,2% 28,8% 19,2% 1,9% 13,5% 15,4% 5,8% 28,8% 38,5% 9,6% 1,9%29 17,2% 13,8% 37,9% 3,4% 27,6% 10,3% 3,4% 17,2% 51,7% 10,3% 6,9%37 10,8% 2,7% 35,1% 16,2% 2,7% 32,4% 5,4% 5,4% 35,1% 24,3% 5,4% 24,3%
359 12,5% 19,8% 23,1% 15,0% 6,1% 23,4% 9,7% 12,5% 33,1% 25,9% 10,9% 7,8%584 14,9% 17,0% 19,3% 11,3% 2,6% 34,9% 9,8% 10,4% 30,7% 22,9% 8,6% 17,6%389 21,3% 11,6% 22,4% 15,7% 2,1% 27,0% 15,9% 8,2% 35,7% 25,2% 6,4% 8,5%242 13,6% 19,8% 24,0% 9,1% 2,1% 31,4% 11,2% 12,8% 33,9% 23,6% 5,8% 12,8%217 15,7% 20,7% 23,0% 14,7% 5,1% 20,7% 10,1% 13,4% 24,9% 35,5% 11,5% 4,6%
1432 16,6% 16,6% 21,5% 12,6% 2,7% 30,0% 11,7% 10,7% 31,7% 25,6% 8,0% 12,4%
SofiaRegional centerSmaller townVillage
Type of residence
MaleFemale
Gender
18-3031-4041-5051-6060+
Age
Finished bachelor, master or higherdegreeFinished collegeFinished secondary schoolFinished elementary and lower
Highest level of educationachieved
EmployeeOther status of employed personsBusiness ownerSelf-employed person innon-agricultural activitiesSelf-employed person in agriculturalactivitiesFamily helperRegistered as unemployedUnregistered unemployedRetired - due to ageRetired - other causesPupil, studentHousewifePerson unable to workAnother status of non working person
Main occupational status inthe present
BulgarianTurkishRomaOther
Ethnicity
No incomeLess than 100 BGN101-150 BGN151-200 BGN201-300 BGN301-500 BGNMore than 500 BGNDon't knowNA
Total household income
No incomeLess than 250 BGN251-500 BGN501-750 BGN751-1000 More than 1000 BGNDon't knowNA
Personal monthly income
I don't use financial servicesOneTwoThree and more
Financial services usage
Total
Base: Row %
Does nottrust at all
Row %Little
Row %Average
Row %Much
Row %Very much
Row %Don't know
Bulgarian Deposit Insurance Fund
Row %
Does nottrust at all
Row %Little
Row %Average
Row %Much
Row %Very much
Row %Don't know
The lev, the national currency
107

Generally, the quality of financial products services offered by the financial institutions in Bulgaria is�…
269 5,9% 7,1% 37,9% 29,4% 3,7% 16,0% 5,6% 18,2% 31,6% 15,6% 1,1% 27,9%484 3,5% 9,3% 44,2% 20,9% 2,7% 19,4% 3,7% 19,2% 36,8% 14,7% 2,3% 23,3%276 2,9% 10,9% 41,3% 19,9% 3,3% 21,7% 5,4% 12,3% 36,6% 14,5% 2,5% 28,6%403 2,2% 7,9% 36,0% 22,1% 2,5% 29,3% 4,2% 10,7% 28,5% 14,9% 2,2% 39,5%682 4,1% 10,3% 40,6% 21,3% 2,8% 21,0% 5,4% 17,0% 35,6% 13,5% 2,1% 26,4%750 2,9% 7,5% 39,7% 23,9% 3,1% 22,9% 3,7% 13,7% 31,5% 16,1% 2,1% 32,8%311 1,6% 5,5% 37,3% 27,0% 4,5% 24,1% 1,3% 10,6% 31,2% 20,9% 2,9% 33,1%243 6,6% 11,9% 39,9% 22,2% 3,3% 16,0% 5,8% 21,4% 35,0% 14,8% 2,5% 20,6%253 2,4% 10,7% 42,7% 26,1% 4,0% 14,2% 4,3% 17,0% 40,7% 15,8% 2,4% 19,8%257 3,1% 9,7% 45,9% 21,4% 2,3% 17,5% 6,2% 17,5% 34,2% 13,6% 1,9% 26,5%368 4,1% 7,6% 37,0% 17,7% 1,1% 32,6% 5,4% 12,5% 28,8% 10,1% 1,1% 42,1%
242 4,1% 7,9% 43,8% 32,2% 3,7% 8,3% 4,1% 15,7% 41,7% 21,9% 2,1% 14,5%
38 5,3% 7,9% 50,0% 21,1% 15,8% 5,3% 31,6% 34,2% 10,5% 18,4%683 3,7% 8,5% 46,0% 25,0% 2,8% 14,1% 4,7% 16,4% 38,7% 16,8% 2,2% 21,2%465 2,8% 9,7% 29,0% 14,4% 2,8% 41,3% 4,5% 12,0% 21,3% 8,8% 1,9% 51,4%575 3,1% 7,8% 44,3% 28,9% 3,0% 12,9% 3,7% 17,7% 38,4% 19,8% 2,4% 17,9%
72 5,6% 12,5% 37,5% 11,1% 5,6% 27,8% 6,9% 13,9% 37,5% 5,6% 2,8% 33,3%81 3,7% 17,3% 42,0% 27,2% 6,2% 3,7% 3,7% 25,9% 38,3% 19,8% 2,5% 9,9%
29 6,9% 17,2% 37,9% 27,6% 10,3% 10,3% 20,7% 41,4% 6,9% 3,4% 17,2%
21 9,5% 38,1% 9,5% 14,3% 28,6% 14,3% 33,3% 14,3% 9,5% 28,6%
5 40,0% 20,0% 40,0% 40,0% 20,0% 40,0%69 1,4% 11,6% 37,7% 15,9% 1,4% 31,9% 4,3% 11,6% 30,4% 8,7% 1,4% 43,5%74 4,1% 6,8% 36,5% 16,2% 2,7% 33,8% 5,4% 13,5% 27,0% 9,5% 44,6%
322 3,4% 7,8% 39,8% 15,8% ,9% 32,3% 5,3% 12,7% 29,5% 8,7% ,9% 42,9%65 3,1% 9,2% 27,7% 16,9% 43,1% 4,6% 15,4% 23,1% 10,8% 46,2%85 1,2% 3,5% 35,3% 28,2% 5,9% 25,9% 3,5% 27,1% 22,4% 4,7% 42,4%22 9,1% 40,9% 27,3% 9,1% 13,6% 13,6% 27,3% 27,3% 4,5% 27,3%
2 50,0% 50,0% 100,0% 7 28,6% 14,3% 14,3% 14,3% 28,6% 28,6% 14,3% 14,3% 42,9%
1202 3,4% 9,5% 41,3% 24,1% 3,2% 18,4% 4,2% 16,6% 35,4% 15,9% 2,4% 25,5%146 2,1% 6,2% 40,4% 16,4% 1,4% 33,6% 4,8% 11,6% 24,7% 11,6% ,7% 46,6%
62 6,5% 3,2% 24,2% 6,5% 59,7% 8,1% 4,8% 22,6% 3,2% 61,3%21 9,5% 4,8% 19,0% 23,8% 4,8% 38,1% 14,3% 14,3% 14,3% 57,1%
3 33,3% 33,3% 33,3% 33,3% 33,3% 33,3%6 33,3% 50,0% 16,7% 33,3% 33,3% 16,7% 16,7%
22 4,5% 9,1% 36,4% 13,6% 36,4% 13,6% 13,6% 18,2% 9,1% 45,5%57 8,8% 7,0% 28,1% 7,0% 1,8% 47,4% 10,5% 5,3% 26,3% 3,5% 54,4%
132 5,3% 6,8% 28,8% 19,7% 39,4% 6,8% 10,6% 22,7% 10,6% 49,2%216 4,2% 12,0% 36,6% 17,6% ,5% 29,2% 5,6% 16,7% 30,6% 8,8% ,9% 37,5%499 2,6% 8,8% 44,3% 26,1% 2,4% 15,8% 3,6% 17,8% 37,7% 17,2% 1,2% 22,4%118 ,8% 5,1% 41,5% 17,8% 3,4% 31,4% 11,0% 28,8% 8,5% 3,4% 48,3%379 3,7% 8,7% 42,5% 26,4% 6,1% 12,7% 4,5% 15,6% 36,7% 20,6% 4,7% 17,9%135 3,7% 9,6% 31,1% 21,5% 3,0% 31,1% 3,0% 11,9% 23,7% 14,8% 2,2% 44,4%354 4,0% 8,2% 33,3% 15,5% 2,0% 37,0% 5,1% 13,6% 27,4% 7,9% ,6% 45,5%370 2,4% 8,4% 45,1% 23,0% 1,4% 19,7% 4,9% 15,9% 35,4% 15,7% 1,1% 27,0%
96 4,2% 11,5% 55,2% 21,9% 2,1% 5,2% 3,1% 22,9% 47,9% 11,5% 2,1% 12,5%52 3,8% 9,6% 30,8% 42,3% 1,9% 11,5% 3,8% 17,3% 40,4% 19,2% 19,2%29 3,4% 20,7% 24,1% 34,5% 3,4% 13,8% 3,4% 24,1% 20,7% 27,6% 24,1%37 2,7% 40,5% 18,9% 5,4% 32,4% 2,7% 32,4% 16,2% 5,4% 43,2%
359 4,2% 8,4% 43,7% 26,5% 5,6% 11,7% 5,3% 15,9% 37,3% 20,1% 4,7% 16,7%584 2,6% 7,9% 37,8% 18,8% 2,1% 30,8% 3,8% 11,5% 29,8% 14,0% 1,9% 39,0%389 5,4% 11,3% 41,1% 22,1% 2,8% 17,2% 5,7% 19,0% 34,4% 11,6% 1,5% 27,8%242 3,7% 6,6% 44,6% 23,6% 2,5% 19,0% 4,5% 14,0% 38,4% 15,7% 1,2% 26,0%217 2,3% 9,2% 39,6% 32,7% 6,0% 10,1% 4,6% 20,3% 35,9% 22,1% 4,6% 12,4%
1432 3,5% 8,8% 40,2% 22,6% 2,9% 22,0% 4,5% 15,3% 33,4% 14,9% 2,1% 29,7%
SofiaRegional centerSmaller townVillage
Type of residence
MaleFemale
Gender
18-3031-4041-5051-6060+
Age
Finished bachelor, master or higherdegreeFinished collegeFinished secondary schoolFinished elementary and lower
Highest level ofeducation achieved
EmployeeOther status of employed personsBusiness ownerSelf-employed person in non-agriculturalactivitiesSelf-employed person in agriculturalactivitiesFamily helperRegistered as unemployedUnregistered unemployedRetired - due to ageRetired - other causesPupil, studentHousewifePerson unable to workAnother status of non working person
Main occupationalstatus in the present
BulgarianTurkishRomaOther
Ethnicity
No incomeLess than 100 BGN101-150 BGN151-200 BGN201-300 BGN301-500 BGNMore than 500 BGNDon't knowNA
Total householdincome
No incomeLess than 250 BGN251-500 BGN501-750 BGN751-1000 More than 1000 BGNDon't knowNA
Personal monthlyincome
I don't use financial servicesOneTwoThree and more
Financial servicesusage
Total
Base: Row %Very bad
Row %Bad
Row %Fair
Row %Good
Row %Very good
Row %Don't know
Commercial banks operating in Bulgaria
Row %Very bad
Row %Bad
Row %Fair
Row %Good
Row %Very good
Row %Don't know
Insurance companies
108

Generally, the quality of financial products services offered by the financial institutions in Bulgaria is�…
269 6,7% 7,1% 14,5% 16,7% 9,3% 45,7% 10,0% 13,8% 17,1% 2,6% 56,5%484 3,9% 8,3% 21,1% 12,6% 5,0% 49,2% 6,0% 16,3% 20,9% 5,6% 1,0% 50,2%276 2,5% 6,9% 25,4% 15,9% 2,5% 46,7% 3,3% 15,2% 24,3% 7,6% 1,1% 48,6%403 3,2% 5,2% 19,9% 15,4% 1,2% 55,1% 6,7% 9,4% 19,6% 7,7% 1,2% 55,3%682 5,3% 8,1% 22,7% 11,9% 3,8% 48,2% 7,6% 15,5% 21,1% 4,8% 1,3% 49,6%750 2,8% 5,9% 18,1% 17,5% 4,7% 51,1% 5,3% 12,0% 19,9% 7,1% ,5% 55,2%311 2,6% 4,8% 18,3% 10,0% 4,5% 59,8% 4,2% 10,9% 21,9% 7,4% 1,9% 53,7%243 5,3% 9,9% 23,5% 14,4% 2,5% 44,4% 7,4% 14,8% 25,5% 5,3% ,8% 46,1%253 3,6% 9,9% 19,4% 17,0% 4,7% 45,5% 7,1% 17,4% 20,2% 7,1% ,4% 47,8%257 4,7% 5,8% 23,3% 18,7% 6,6% 40,9% 5,8% 14,4% 21,0% 6,2% ,4% 52,1%368 4,1% 5,4% 18,5% 14,9% 3,3% 53,8% 7,6% 12,2% 15,8% 4,3% ,8% 59,2%
242 3,7% 8,7% 24,0% 19,8% 5,4% 38,4% 8,3% 16,5% 25,6% 6,2% 1,2% 42,1%
38 5,3% 10,5% 23,7% 13,2% 5,3% 42,1% 7,9% 15,8% 21,1% 2,6% 52,6%683 4,7% 7,0% 23,4% 17,0% 5,4% 42,5% 7,0% 15,8% 24,3% 7,2% ,6% 45,1%465 3,0% 5,4% 13,5% 9,0% 1,9% 67,1% 4,5% 8,6% 12,3% 4,3% 1,3% 69,0%575 3,7% 7,7% 22,3% 22,4% 5,9% 38,1% 7,1% 16,2% 23,7% 8,5% 1,0% 43,5%
72 2,8% 8,3% 23,6% 1,4% 2,8% 61,1% 5,6% 11,1% 19,4% 1,4% 62,5%81 6,2% 12,3% 23,5% 11,1% 4,9% 42,0% 6,2% 17,3% 29,6% 7,4% 39,5%
29 10,3% 17,2% 10,3% 62,1% 6,9% 17,2% 24,1% 51,7%
21 9,5% 14,3% 23,8% 9,5% 4,8% 38,1% 14,3% 33,3% 4,8% 4,8% 42,9%
5 20,0% 20,0% 60,0% 40,0% 60,0%69 4,3% 8,7% 23,2% 4,3% 2,9% 56,5% 4,3% 10,1% 15,9% 7,2% 62,3%74 5,4% 6,8% 13,5% 2,7% 2,7% 68,9% 5,4% 10,8% 17,6% 2,7% 63,5%
322 4,0% 5,0% 18,6% 14,9% 3,1% 54,3% 7,5% 11,8% 15,8% 3,1% ,6% 61,2%65 3,1% 1,5% 18,5% 7,7% 69,2% 4,6% 4,6% 15,4% 6,2% 69,2%85 2,4% 1,2% 17,6% 7,1% 5,9% 65,9% 2,4% 9,4% 18,8% 7,1% 2,4% 60,0%22 4,5% 9,1% 13,6% 4,5% 68,2% 4,5% 22,7% 9,1% 9,1% 4,5% 50,0%
2 50,0% 50,0% 50,0% 50,0%
7 14,3% 14,3% 14,3% 57,1% 28,6% 14,3% 14,3% 42,9%
1202 3,8% 7,4% 21,2% 16,1% 4,9% 46,5% 6,4% 14,7% 21,9% 6,7% 1,1% 49,3%146 2,1% 5,5% 18,5% 9,6% ,7% 63,7% 4,1% 10,3% 13,7% 4,1% 67,8%
62 9,7% 3,2% 9,7% 77,4% 9,7% 4,8% 9,7% 75,8%21 9,5% 14,3% 14,3% 4,8% 57,1% 14,3% 4,8% 14,3% 66,7%
3 100,0% 33,3% 66,7%6 33,3% 33,3% 33,3% 33,3% 33,3% 33,3%
22 4,5% 4,5% 18,2% 72,7% 4,5% 4,5% 22,7% 68,2%57 7,0% 5,3% 14,0% 7,0% 1,8% 64,9% 3,5% 14,0% 7,0% 3,5% 71,9%
132 5,3% 3,0% 15,2% 15,2% 2,3% 59,1% 8,3% 8,3% 16,7% 3,0% ,8% 62,9%216 3,7% 7,9% 14,4% 12,0% 2,3% 59,7% 6,5% 11,6% 17,6% 2,8% ,5% 61,1%499 3,8% 8,6% 23,2% 17,6% 5,0% 41,7% 6,6% 16,4% 20,8% 7,8% ,4% 47,9%118 ,8% 4,2% 21,2% 6,8% 2,5% 64,4% ,8% 5,9% 19,5% 5,9% ,8% 66,9%379 4,5% 6,3% 22,4% 17,4% 6,3% 43,0% 7,9% 15,8% 24,8% 7,4% 2,1% 42,0%135 5,9% 5,9% 11,9% 5,9% 2,2% 68,1% 5,9% 13,3% 14,1% 5,9% 1,5% 59,3%354 3,4% 4,8% 15,8% 9,6% 2,3% 64,1% 5,6% 10,2% 13,3% 3,4% ,6% 66,9%370 3,0% 6,5% 23,2% 18,6% 4,3% 44,3% 6,8% 13,5% 21,4% 5,9% ,3% 52,2%
96 3,1% 13,5% 25,0% 22,9% 5,2% 30,2% 3,1% 27,1% 27,1% 4,2% 1,0% 37,5%52 5,8% 15,4% 19,2% 17,3% 7,7% 34,6% 9,6% 17,3% 32,7% 7,7% 32,7%29 3,4% 13,8% 17,2% 10,3% 3,4% 51,7% 3,4% 13,8% 13,8% 10,3% 58,6%37 2,7% 2,7% 24,3% 8,1% 2,7% 59,5% 2,7% 21,6% 10,8% 2,7% 62,2%
359 5,0% 6,7% 23,7% 17,8% 6,4% 40,4% 8,4% 14,5% 25,9% 8,1% 1,7% 41,5%584 3,4% 5,3% 20,5% 13,9% 2,2% 54,6% 5,1% 10,4% 21,1% 7,4% 1,0% 55,0%389 4,6% 8,5% 19,8% 14,1% 3,9% 49,1% 8,5% 15,4% 18,0% 5,1% ,5% 52,4%242 4,1% 5,8% 21,1% 16,5% 5,8% 46,7% 6,2% 12,4% 24,0% 2,9% 1,2% 53,3%217 4,1% 9,7% 19,8% 16,6% 8,8% 41,0% 6,5% 20,7% 19,4% 7,4% ,9% 45,2%
1432 4,0% 6,9% 20,3% 14,8% 4,3% 49,7% 6,4% 13,7% 20,5% 6,0% ,9% 52,5%
SofiaRegional centerSmaller townVillage
Type of residence
MaleFemale
Gender
18-3031-4041-5051-6060+
Age
Finished bachelor, master or higherdegreeFinished collegeFinished secondary schoolFinished elementary and lower
Highest level of educationachieved
EmployeeOther status of employed personsBusiness ownerSelf-employed person innon-agricultural activitiesSelf-employed person in agriculturalactivitiesFamily helperRegistered as unemployedUnregistered unemployedRetired - due to ageRetired - other causesPupil, studentHousewifePerson unable to workAnother status of non workingperson
Main occupational statusin the present
BulgarianTurkishRomaOther
Ethnicity
No incomeLess than 100 BGN101-150 BGN151-200 BGN201-300 BGN301-500 BGNMore than 500 BGNDon't knowNA
Total household income
No incomeLess than 250 BGN251-500 BGN501-750 BGN751-1000 More than 1000 BGNDon't knowNA
Personal monthly income
I don't use financial servicesOneTwoThree and more
Financial services usage
Total
Base: Row %Very bad
Row %Bad
Row %Fair
Row %Good
Row %Very good
Row %Don't know
Mutual Help Associations
Row %Very bad
Row %Bad
Row %Fair
Row %Good
Row %Very good
Row %Don't know
Securities companies
109

Generally, the quality of financial products services offered by the financial institutions in Bulgaria is�…
269 9,7% 17,5% 19,0% 3,7% 50,2% 9,3% 13,4% 23,0% 11,2% 1,1% 42,0%484 8,7% 21,1% 20,0% 4,5% ,8% 44,8% 9,7% 20,7% 20,2% 8,1% 1,0% 40,3%276 7,2% 18,5% 19,9% 6,2% 1,8% 46,4% 4,7% 15,6% 26,8% 7,6% 2,5% 42,8%403 8,7% 11,4% 18,1% 6,9% 1,5% 53,3% 7,7% 9,9% 17,1% 7,9% 1,7% 55,6%682 10,0% 19,1% 18,3% 5,6% 1,0% 46,0% 9,8% 17,6% 21,7% 7,2% 1,6% 42,1%750 7,3% 15,5% 20,1% 5,2% 1,1% 50,8% 6,5% 13,2% 20,7% 9,7% 1,5% 48,4%311 4,8% 14,1% 17,4% 6,4% 1,9% 55,3% 4,8% 11,9% 22,8% 11,6% 2,6% 46,3%243 8,2% 18,9% 25,9% 2,9% 1,2% 42,8% 9,1% 22,6% 24,7% 8,2% 1,6% 33,7%253 9,1% 23,7% 19,8% 6,3% 1,2% 39,9% 9,9% 17,8% 23,3% 11,1% 2,0% 36,0%257 11,3% 16,0% 20,6% 6,2% ,8% 45,1% 9,3% 14,8% 22,6% 7,4% 1,2% 44,7%368 9,8% 14,9% 15,2% 4,9% ,3% 54,9% 8,2% 12,0% 14,9% 5,2% ,5% 59,2%
242 7,9% 25,6% 23,1% 5,4% ,8% 37,2% 9,5% 16,5% 29,8% 10,7% 2,9% 30,6%
38 23,7% 15,8% 26,3% 2,6% 31,6% 18,4% 13,2% 23,7% 13,2% 31,6%683 9,4% 18,6% 23,1% 6,0% 1,2% 41,7% 8,2% 18,3% 24,9% 9,2% 1,6% 37,8%465 6,7% 10,5% 11,0% 4,7% 1,1% 66,0% 6,5% 10,3% 11,2% 5,8% ,6% 65,6%575 8,9% 19,5% 24,2% 7,7% 1,7% 38,1% 8,2% 17,6% 24,3% 12,7% 2,1% 35,1%
72 5,6% 18,1% 12,5% 5,6% 1,4% 56,9% 6,9% 13,9% 25,0% 5,6% 1,4% 47,2%81 12,3% 25,9% 24,7% 6,2% 30,9% 9,9% 24,7% 28,4% 11,1% 2,5% 23,5%
29 6,9% 24,1% 27,6% 41,4% 6,9% 24,1% 44,8% 3,4% 20,7%
21 14,3% 23,8% 4,8% 4,8% 52,4% 9,5% 33,3% 4,8% 52,4%
5 40,0% 20,0% 40,0% 20,0% 20,0% 60,0%69 7,2% 7,2% 15,9% 4,3% 65,2% 7,2% 14,5% 14,5% 5,8% 58,0%74 8,1% 10,8% 17,6% 1,4% 62,2% 9,5% 10,8% 18,9% 6,8% 54,1%
322 9,6% 15,8% 15,5% 3,4% ,3% 55,3% 8,4% 12,4% 14,3% 3,7% ,6% 60,6%65 9,2% 7,7% 9,2% 3,1% 70,8% 12,3% 6,2% 10,8% 3,1% 67,7%85 2,4% 9,4% 16,5% 7,1% 2,4% 62,4% 3,5% 10,6% 21,2% 12,9% 1,2% 50,6%22 27,3% 13,6% 4,5% 54,5% 18,2% 22,7% 4,5% 13,6% 40,9%
2 100,0% 50,0% 50,0% 7 28,6% 14,3% 14,3% 42,9% 14,3% 28,6% 14,3% 42,9%
1202 8,7% 18,8% 20,6% 5,7% 1,2% 44,9% 8,0% 16,9% 22,6% 9,2% 1,8% 41,4%146 6,8% 10,3% 13,0% 4,8% 65,1% 5,5% 9,6% 13,7% 5,5% 65,8%
62 11,3% 6,5% 8,1% 1,6% 72,6% 12,9% 3,2% 9,7% 1,6% 72,6%21 9,5% 4,8% 19,0% 66,7% 19,0% 19,0% 9,5% 52,4%
3 33,3% 66,7% 33,3% 66,7%6 16,7% 33,3% 50,0% 33,3% 33,3% 33,3%
22 13,6% 13,6% 22,7% 50,0% 18,2% 4,5% 13,6% 4,5% 59,1%57 14,0% 10,5% 5,3% 3,5% 66,7% 10,5% 8,8% 7,0% 1,8% 71,9%
132 7,6% 11,4% 18,2% 3,8% 59,1% 6,1% 12,1% 15,9% 5,3% 60,6%216 8,3% 17,1% 16,7% 4,6% 53,2% 8,3% 14,4% 18,5% 3,7% ,9% 54,2%499 9,2% 18,4% 19,2% 6,4% 1,2% 45,5% 8,2% 18,0% 23,4% 10,0% 1,2% 39,1%118 1,7% 7,6% 24,6% 3,4% ,8% 61,9% 3,4% 8,5% 17,8% 10,2% ,8% 59,3%379 9,5% 21,9% 21,1% 6,3% 2,1% 39,1% 9,2% 16,9% 25,1% 11,1% 3,4% 34,3%135 7,4% 12,6% 14,1% 3,7% 1,5% 60,7% 8,9% 13,3% 16,3% 8,9% ,7% 51,9%354 7,6% 12,7% 12,7% 4,5% ,3% 62,1% 7,3% 11,6% 13,3% 5,6% ,6% 61,6%370 8,6% 15,4% 21,6% 5,7% ,5% 48,1% 6,5% 14,1% 24,1% 7,8% 1,1% 46,5%
96 9,4% 35,4% 22,9% 3,1% 2,1% 27,1% 10,4% 35,4% 26,0% 5,2% 2,1% 20,8%52 9,6% 21,2% 30,8% 3,8% 34,6% 7,7% 28,8% 30,8% 9,6% 23,1%29 3,4% 20,7% 13,8% 10,3% 51,7% 6,9% 17,2% 17,2% 6,9% 51,7%37 2,7% 21,6% 10,8% 2,7% 62,2% 2,7% 8,1% 18,9% 10,8% 2,7% 56,8%
359 10,9% 20,9% 22,8% 6,4% 1,9% 37,0% 10,3% 14,2% 25,6% 12,5% 3,3% 34,0%584 6,5% 12,8% 19,5% 7,4% 1,4% 52,4% 6,8% 12,5% 18,0% 8,7% 1,7% 52,2%389 12,6% 18,8% 16,2% 3,9% 1,5% 47,0% 10,0% 16,2% 20,8% 8,2% 1,5% 43,2%242 7,9% 18,2% 20,2% 3,3% 50,4% 7,4% 17,4% 24,8% 7,0% ,8% 42,6%217 7,8% 24,9% 23,0% 5,1% ,5% 38,7% 8,8% 18,9% 26,3% 10,1% 1,8% 34,1%
1432 8,6% 17,2% 19,3% 5,4% 1,0% 48,5% 8,1% 15,3% 21,2% 8,5% 1,5% 45,4%
SofiaRegional centerSmaller townVillage
Type of residence
MaleFemale
Gender
18-3031-4041-5051-6060+
Age
Finished bachelor, master or higherdegreeFinished collegeFinished secondary schoolFinished elementary and lower
Highest level ofeducation achieved
EmployeeOther status of employed personsBusiness ownerSelf-employed person innon-agricultural activitiesSelf-employed person in agriculturalactivitiesFamily helperRegistered as unemployedUnregistered unemployedRetired - due to ageRetired - other causesPupil, studentHousewifePerson unable to workAnother status of non working person
Main occupationalstatus in the present
BulgarianTurkishRomaOther
Ethnicity
No incomeLess than 100 BGN101-150 BGN151-200 BGN201-300 BGN301-500 BGNMore than 500 BGNDon't knowNA
Total householdincome
No incomeLess than 250 BGN251-500 BGN501-750 BGN751-1000 More than 1000 BGNDon't knowNA
Personal monthlyincome
I don't use financial servicesOneTwoThree and more
Financial servicesusage
Total
Base: Row %Very bad
Row %Bad
Row %Fair
Row %Good
Row %Very good
Row %Don't know
Private pension funds
Row %Very bad
Row %Bad
Row %Fair
Row %Good
Row %Very good
Row %Don't know
Leasing companies
110
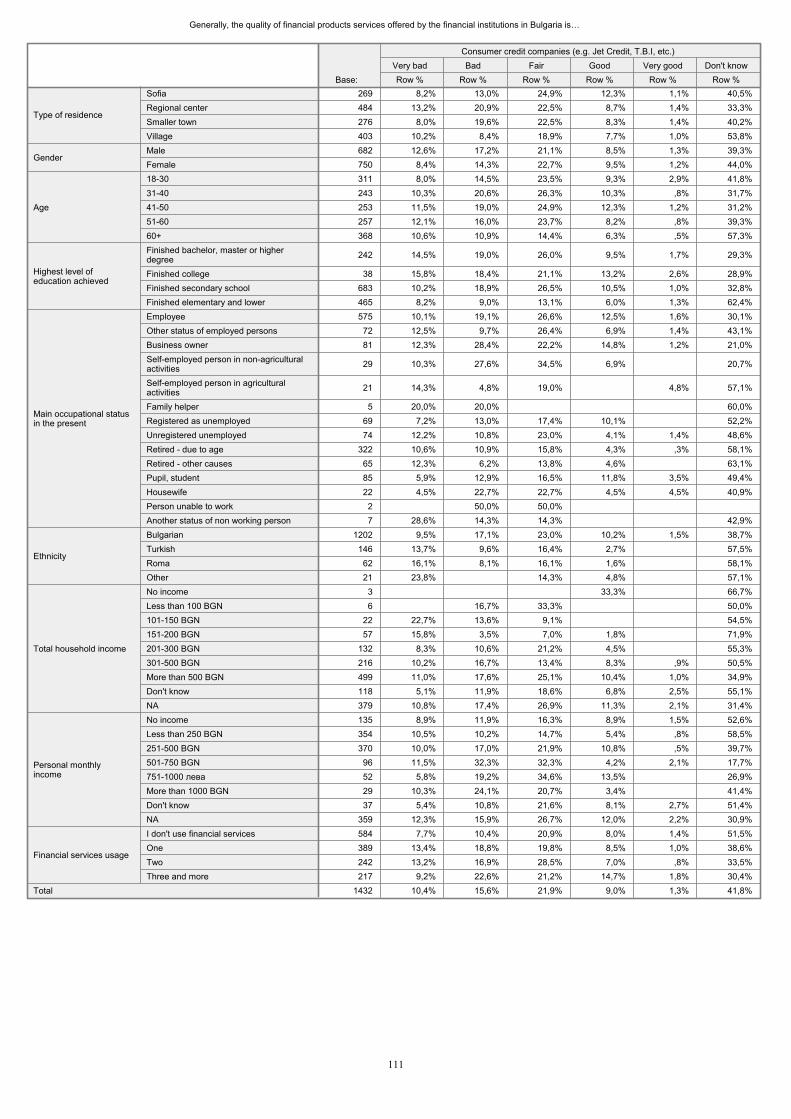
Generally, the quality of financial products services offered by the financial institutions in Bulgaria is�…
269 8,2% 13,0% 24,9% 12,3% 1,1% 40,5%484 13,2% 20,9% 22,5% 8,7% 1,4% 33,3%276 8,0% 19,6% 22,5% 8,3% 1,4% 40,2%403 10,2% 8,4% 18,9% 7,7% 1,0% 53,8%682 12,6% 17,2% 21,1% 8,5% 1,3% 39,3%750 8,4% 14,3% 22,7% 9,5% 1,2% 44,0%311 8,0% 14,5% 23,5% 9,3% 2,9% 41,8%243 10,3% 20,6% 26,3% 10,3% ,8% 31,7%253 11,5% 19,0% 24,9% 12,3% 1,2% 31,2%257 12,1% 16,0% 23,7% 8,2% ,8% 39,3%368 10,6% 10,9% 14,4% 6,3% ,5% 57,3%
242 14,5% 19,0% 26,0% 9,5% 1,7% 29,3%
38 15,8% 18,4% 21,1% 13,2% 2,6% 28,9%683 10,2% 18,9% 26,5% 10,5% 1,0% 32,8%465 8,2% 9,0% 13,1% 6,0% 1,3% 62,4%575 10,1% 19,1% 26,6% 12,5% 1,6% 30,1%
72 12,5% 9,7% 26,4% 6,9% 1,4% 43,1%81 12,3% 28,4% 22,2% 14,8% 1,2% 21,0%
29 10,3% 27,6% 34,5% 6,9% 20,7%
21 14,3% 4,8% 19,0% 4,8% 57,1%
5 20,0% 20,0% 60,0%69 7,2% 13,0% 17,4% 10,1% 52,2%74 12,2% 10,8% 23,0% 4,1% 1,4% 48,6%
322 10,6% 10,9% 15,8% 4,3% ,3% 58,1%65 12,3% 6,2% 13,8% 4,6% 63,1%85 5,9% 12,9% 16,5% 11,8% 3,5% 49,4%22 4,5% 22,7% 22,7% 4,5% 4,5% 40,9%
2 50,0% 50,0% 7 28,6% 14,3% 14,3% 42,9%
1202 9,5% 17,1% 23,0% 10,2% 1,5% 38,7%146 13,7% 9,6% 16,4% 2,7% 57,5%
62 16,1% 8,1% 16,1% 1,6% 58,1%21 23,8% 14,3% 4,8% 57,1%
3 33,3% 66,7%6 16,7% 33,3% 50,0%
22 22,7% 13,6% 9,1% 54,5%57 15,8% 3,5% 7,0% 1,8% 71,9%
132 8,3% 10,6% 21,2% 4,5% 55,3%216 10,2% 16,7% 13,4% 8,3% ,9% 50,5%499 11,0% 17,6% 25,1% 10,4% 1,0% 34,9%118 5,1% 11,9% 18,6% 6,8% 2,5% 55,1%379 10,8% 17,4% 26,9% 11,3% 2,1% 31,4%135 8,9% 11,9% 16,3% 8,9% 1,5% 52,6%354 10,5% 10,2% 14,7% 5,4% ,8% 58,5%370 10,0% 17,0% 21,9% 10,8% ,5% 39,7%
96 11,5% 32,3% 32,3% 4,2% 2,1% 17,7%52 5,8% 19,2% 34,6% 13,5% 26,9%29 10,3% 24,1% 20,7% 3,4% 41,4%37 5,4% 10,8% 21,6% 8,1% 2,7% 51,4%
359 12,3% 15,9% 26,7% 12,0% 2,2% 30,9%584 7,7% 10,4% 20,9% 8,0% 1,4% 51,5%389 13,4% 18,8% 19,8% 8,5% 1,0% 38,6%242 13,2% 16,9% 28,5% 7,0% ,8% 33,5%217 9,2% 22,6% 21,2% 14,7% 1,8% 30,4%
1432 10,4% 15,6% 21,9% 9,0% 1,3% 41,8%
SofiaRegional centerSmaller townVillage
Type of residence
MaleFemale
Gender
18-3031-4041-5051-6060+
Age
Finished bachelor, master or higherdegreeFinished collegeFinished secondary schoolFinished elementary and lower
Highest level ofeducation achieved
EmployeeOther status of employed personsBusiness ownerSelf-employed person in non-agriculturalactivitiesSelf-employed person in agriculturalactivitiesFamily helperRegistered as unemployedUnregistered unemployedRetired - due to ageRetired - other causesPupil, studentHousewifePerson unable to workAnother status of non working person
Main occupational statusin the present
BulgarianTurkishRomaOther
Ethnicity
No incomeLess than 100 BGN101-150 BGN151-200 BGN201-300 BGN301-500 BGNMore than 500 BGNDon't knowNA
Total household income
No incomeLess than 250 BGN251-500 BGN501-750 BGN751-1000 More than 1000 BGNDon't knowNA
Personal monthlyincome
I don't use financial servicesOneTwoThree and more
Financial services usage
Total
Base: Row %Very bad
Row %Bad
Row %Fair
Row %Good
Row %Very good
Row %Don't know
Consumer credit companies (e.g. Jet Credit, T.B.I, etc.)
111
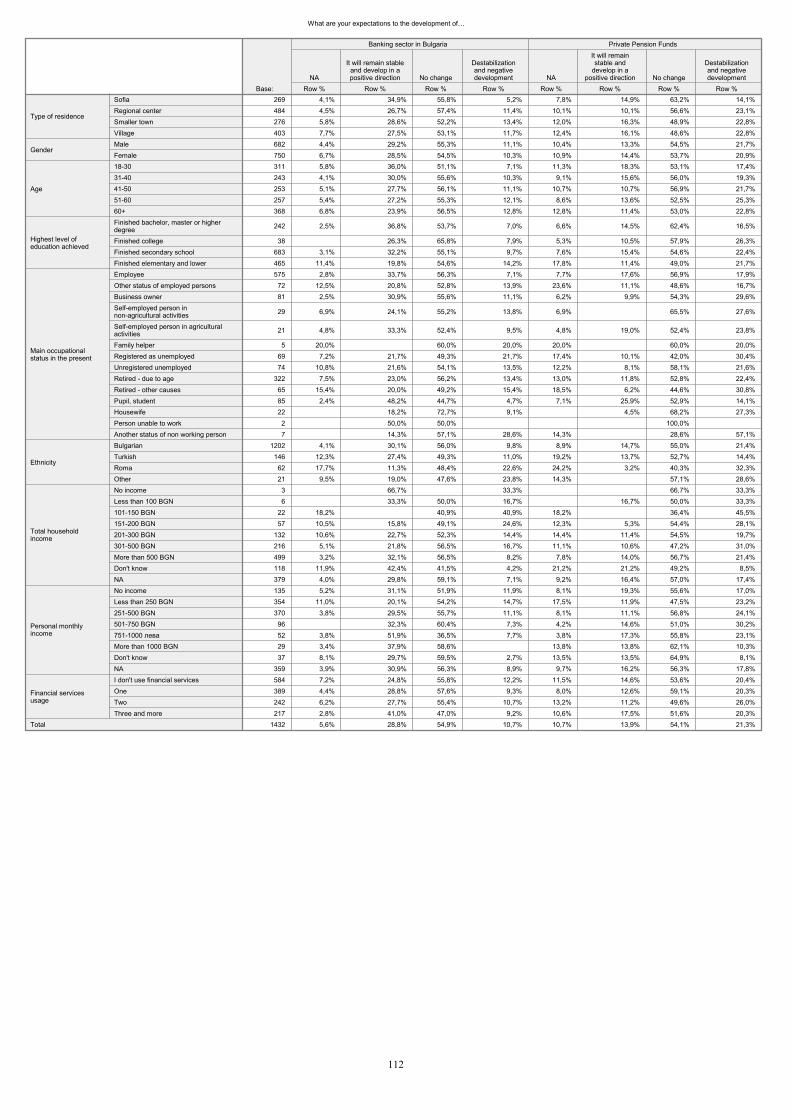
What are your expectations to the development of�…
269 4,1% 34,9% 55,8% 5,2% 7,8% 14,9% 63,2% 14,1%484 4,5% 26,7% 57,4% 11,4% 10,1% 10,1% 56,6% 23,1%276 5,8% 28,6% 52,2% 13,4% 12,0% 16,3% 48,9% 22,8%403 7,7% 27,5% 53,1% 11,7% 12,4% 16,1% 48,6% 22,8%682 4,4% 29,2% 55,3% 11,1% 10,4% 13,3% 54,5% 21,7%750 6,7% 28,5% 54,5% 10,3% 10,9% 14,4% 53,7% 20,9%311 5,8% 36,0% 51,1% 7,1% 11,3% 18,3% 53,1% 17,4%243 4,1% 30,0% 55,6% 10,3% 9,1% 15,6% 56,0% 19,3%253 5,1% 27,7% 56,1% 11,1% 10,7% 10,7% 56,9% 21,7%257 5,4% 27,2% 55,3% 12,1% 8,6% 13,6% 52,5% 25,3%368 6,8% 23,9% 56,5% 12,8% 12,8% 11,4% 53,0% 22,8%
242 2,5% 36,8% 53,7% 7,0% 6,6% 14,5% 62,4% 16,5%
38 26,3% 65,8% 7,9% 5,3% 10,5% 57,9% 26,3%683 3,1% 32,2% 55,1% 9,7% 7,6% 15,4% 54,6% 22,4%465 11,4% 19,8% 54,6% 14,2% 17,8% 11,4% 49,0% 21,7%575 2,8% 33,7% 56,3% 7,1% 7,7% 17,6% 56,9% 17,9%72 12,5% 20,8% 52,8% 13,9% 23,6% 11,1% 48,6% 16,7%81 2,5% 30,9% 55,6% 11,1% 6,2% 9,9% 54,3% 29,6%
29 6,9% 24,1% 55,2% 13,8% 6,9% 65,5% 27,6%
21 4,8% 33,3% 52,4% 9,5% 4,8% 19,0% 52,4% 23,8%
5 20,0% 60,0% 20,0% 20,0% 60,0% 20,0%69 7,2% 21,7% 49,3% 21,7% 17,4% 10,1% 42,0% 30,4%74 10,8% 21,6% 54,1% 13,5% 12,2% 8,1% 58,1% 21,6%
322 7,5% 23,0% 56,2% 13,4% 13,0% 11,8% 52,8% 22,4%65 15,4% 20,0% 49,2% 15,4% 18,5% 6,2% 44,6% 30,8%85 2,4% 48,2% 44,7% 4,7% 7,1% 25,9% 52,9% 14,1%22 18,2% 72,7% 9,1% 4,5% 68,2% 27,3%2 50,0% 50,0% 100,0% 7 14,3% 57,1% 28,6% 14,3% 28,6% 57,1%
1202 4,1% 30,1% 56,0% 9,8% 8,9% 14,7% 55,0% 21,4%146 12,3% 27,4% 49,3% 11,0% 19,2% 13,7% 52,7% 14,4%62 17,7% 11,3% 48,4% 22,6% 24,2% 3,2% 40,3% 32,3%21 9,5% 19,0% 47,6% 23,8% 14,3% 57,1% 28,6%3 66,7% 33,3% 66,7% 33,3%6 33,3% 50,0% 16,7% 16,7% 50,0% 33,3%
22 18,2% 40,9% 40,9% 18,2% 36,4% 45,5%57 10,5% 15,8% 49,1% 24,6% 12,3% 5,3% 54,4% 28,1%
132 10,6% 22,7% 52,3% 14,4% 14,4% 11,4% 54,5% 19,7%216 5,1% 21,8% 56,5% 16,7% 11,1% 10,6% 47,2% 31,0%499 3,2% 32,1% 56,5% 8,2% 7,8% 14,0% 56,7% 21,4%118 11,9% 42,4% 41,5% 4,2% 21,2% 21,2% 49,2% 8,5%379 4,0% 29,8% 59,1% 7,1% 9,2% 16,4% 57,0% 17,4%135 5,2% 31,1% 51,9% 11,9% 8,1% 19,3% 55,6% 17,0%354 11,0% 20,1% 54,2% 14,7% 17,5% 11,9% 47,5% 23,2%370 3,8% 29,5% 55,7% 11,1% 8,1% 11,1% 56,8% 24,1%96 32,3% 60,4% 7,3% 4,2% 14,6% 51,0% 30,2%52 3,8% 51,9% 36,5% 7,7% 3,8% 17,3% 55,8% 23,1%29 3,4% 37,9% 58,6% 13,8% 13,8% 62,1% 10,3%37 8,1% 29,7% 59,5% 2,7% 13,5% 13,5% 64,9% 8,1%
359 3,9% 30,9% 56,3% 8,9% 9,7% 16,2% 56,3% 17,8%584 7,2% 24,8% 55,8% 12,2% 11,5% 14,6% 53,6% 20,4%389 4,4% 28,8% 57,6% 9,3% 8,0% 12,6% 59,1% 20,3%242 6,2% 27,7% 55,4% 10,7% 13,2% 11,2% 49,6% 26,0%217 2,8% 41,0% 47,0% 9,2% 10,6% 17,5% 51,6% 20,3%
1432 5,6% 28,8% 54,9% 10,7% 10,7% 13,9% 54,1% 21,3%
SofiaRegional centerSmaller townVillage
Type of residence
MaleFemale
Gender
18-3031-4041-5051-6060+
Age
Finished bachelor, master or higherdegreeFinished collegeFinished secondary schoolFinished elementary and lower
Highest level ofeducation achieved
EmployeeOther status of employed personsBusiness ownerSelf-employed person innon-agricultural activitiesSelf-employed person in agriculturalactivitiesFamily helperRegistered as unemployedUnregistered unemployedRetired - due to ageRetired - other causesPupil, studentHousewifePerson unable to workAnother status of non working person
Main occupationalstatus in the present
BulgarianTurkishRomaOther
Ethnicity
No incomeLess than 100 BGN101-150 BGN151-200 BGN201-300 BGN301-500 BGNMore than 500 BGNDon't knowNA
Total householdincome
No incomeLess than 250 BGN251-500 BGN501-750 BGN751-1000 More than 1000 BGNDon't knowNA
Personal monthlyincome
I don't use financial servicesOneTwoThree and more
Financial servicesusage
Total
Base: Row %NA
Row %
It will remain stableand develop in apositive direction
Row %No change
Row %
Destabilizationand negativedevelopment
Banking sector in Bulgaria
Row %NA
Row %
It will remainstable and
develop in apositive direction
Row %No change
Row %
Destabilizationand negativedevelopment
Private Pension Funds
112
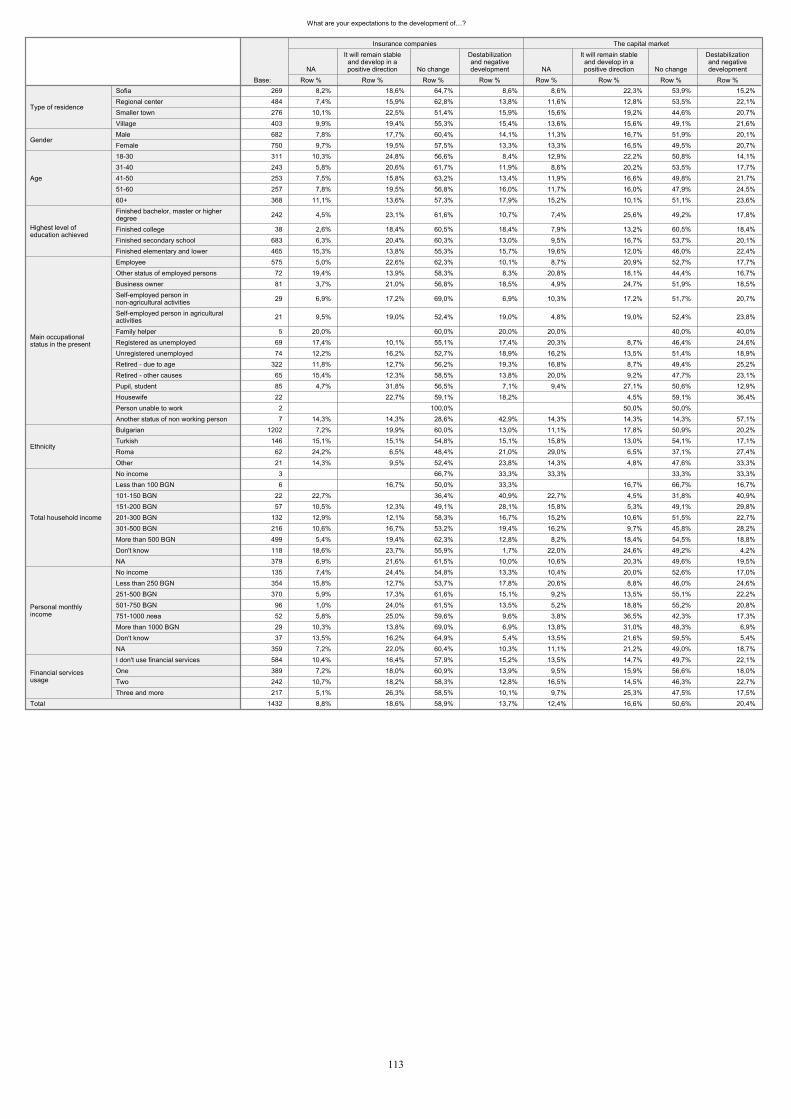
What are your expectations to the development of�…?
269 8,2% 18,6% 64,7% 8,6% 8,6% 22,3% 53,9% 15,2%484 7,4% 15,9% 62,8% 13,8% 11,6% 12,8% 53,5% 22,1%276 10,1% 22,5% 51,4% 15,9% 15,6% 19,2% 44,6% 20,7%403 9,9% 19,4% 55,3% 15,4% 13,6% 15,6% 49,1% 21,6%682 7,8% 17,7% 60,4% 14,1% 11,3% 16,7% 51,9% 20,1%750 9,7% 19,5% 57,5% 13,3% 13,3% 16,5% 49,5% 20,7%311 10,3% 24,8% 56,6% 8,4% 12,9% 22,2% 50,8% 14,1%243 5,8% 20,6% 61,7% 11,9% 8,6% 20,2% 53,5% 17,7%253 7,5% 15,8% 63,2% 13,4% 11,9% 16,6% 49,8% 21,7%257 7,8% 19,5% 56,8% 16,0% 11,7% 16,0% 47,9% 24,5%368 11,1% 13,6% 57,3% 17,9% 15,2% 10,1% 51,1% 23,6%
242 4,5% 23,1% 61,6% 10,7% 7,4% 25,6% 49,2% 17,8%
38 2,6% 18,4% 60,5% 18,4% 7,9% 13,2% 60,5% 18,4%683 6,3% 20,4% 60,3% 13,0% 9,5% 16,7% 53,7% 20,1%465 15,3% 13,8% 55,3% 15,7% 19,6% 12,0% 46,0% 22,4%575 5,0% 22,6% 62,3% 10,1% 8,7% 20,9% 52,7% 17,7%
72 19,4% 13,9% 58,3% 8,3% 20,8% 18,1% 44,4% 16,7%81 3,7% 21,0% 56,8% 18,5% 4,9% 24,7% 51,9% 18,5%
29 6,9% 17,2% 69,0% 6,9% 10,3% 17,2% 51,7% 20,7%
21 9,5% 19,0% 52,4% 19,0% 4,8% 19,0% 52,4% 23,8%
5 20,0% 60,0% 20,0% 20,0% 40,0% 40,0%69 17,4% 10,1% 55,1% 17,4% 20,3% 8,7% 46,4% 24,6%74 12,2% 16,2% 52,7% 18,9% 16,2% 13,5% 51,4% 18,9%
322 11,8% 12,7% 56,2% 19,3% 16,8% 8,7% 49,4% 25,2%65 15,4% 12,3% 58,5% 13,8% 20,0% 9,2% 47,7% 23,1%85 4,7% 31,8% 56,5% 7,1% 9,4% 27,1% 50,6% 12,9%22 22,7% 59,1% 18,2% 4,5% 59,1% 36,4%
2 100,0% 50,0% 50,0% 7 14,3% 14,3% 28,6% 42,9% 14,3% 14,3% 14,3% 57,1%
1202 7,2% 19,9% 60,0% 13,0% 11,1% 17,8% 50,9% 20,2%146 15,1% 15,1% 54,8% 15,1% 15,8% 13,0% 54,1% 17,1%
62 24,2% 6,5% 48,4% 21,0% 29,0% 6,5% 37,1% 27,4%21 14,3% 9,5% 52,4% 23,8% 14,3% 4,8% 47,6% 33,3%
3 66,7% 33,3% 33,3% 33,3% 33,3%6 16,7% 50,0% 33,3% 16,7% 66,7% 16,7%
22 22,7% 36,4% 40,9% 22,7% 4,5% 31,8% 40,9%57 10,5% 12,3% 49,1% 28,1% 15,8% 5,3% 49,1% 29,8%
132 12,9% 12,1% 58,3% 16,7% 15,2% 10,6% 51,5% 22,7%216 10,6% 16,7% 53,2% 19,4% 16,2% 9,7% 45,8% 28,2%499 5,4% 19,4% 62,3% 12,8% 8,2% 18,4% 54,5% 18,8%118 18,6% 23,7% 55,9% 1,7% 22,0% 24,6% 49,2% 4,2%379 6,9% 21,6% 61,5% 10,0% 10,6% 20,3% 49,6% 19,5%135 7,4% 24,4% 54,8% 13,3% 10,4% 20,0% 52,6% 17,0%354 15,8% 12,7% 53,7% 17,8% 20,6% 8,8% 46,0% 24,6%370 5,9% 17,3% 61,6% 15,1% 9,2% 13,5% 55,1% 22,2%
96 1,0% 24,0% 61,5% 13,5% 5,2% 18,8% 55,2% 20,8%52 5,8% 25,0% 59,6% 9,6% 3,8% 36,5% 42,3% 17,3%29 10,3% 13,8% 69,0% 6,9% 13,8% 31,0% 48,3% 6,9%37 13,5% 16,2% 64,9% 5,4% 13,5% 21,6% 59,5% 5,4%
359 7,2% 22,0% 60,4% 10,3% 11,1% 21,2% 49,0% 18,7%584 10,4% 16,4% 57,9% 15,2% 13,5% 14,7% 49,7% 22,1%389 7,2% 18,0% 60,9% 13,9% 9,5% 15,9% 56,6% 18,0%242 10,7% 18,2% 58,3% 12,8% 16,5% 14,5% 46,3% 22,7%217 5,1% 26,3% 58,5% 10,1% 9,7% 25,3% 47,5% 17,5%
1432 8,8% 18,6% 58,9% 13,7% 12,4% 16,6% 50,6% 20,4%
SofiaRegional centerSmaller townVillage
Type of residence
MaleFemale
Gender
18-3031-4041-5051-6060+
Age
Finished bachelor, master or higherdegreeFinished collegeFinished secondary schoolFinished elementary and lower
Highest level ofeducation achieved
EmployeeOther status of employed personsBusiness ownerSelf-employed person innon-agricultural activitiesSelf-employed person in agriculturalactivitiesFamily helperRegistered as unemployedUnregistered unemployedRetired - due to ageRetired - other causesPupil, studentHousewifePerson unable to workAnother status of non working person
Main occupationalstatus in the present
BulgarianTurkishRomaOther
Ethnicity
No incomeLess than 100 BGN101-150 BGN151-200 BGN201-300 BGN301-500 BGNMore than 500 BGNDon't knowNA
Total household income
No incomeLess than 250 BGN251-500 BGN501-750 BGN751-1000 More than 1000 BGNDon't knowNA
Personal monthlyincome
I don't use financial servicesOneTwoThree and more
Financial servicesusage
Total
Base: Row %NA
Row %
It will remain stableand develop in apositive direction
Row %No change
Row %
Destabilizationand negativedevelopment
Insurance companies
Row %NA
Row %
It will remain stableand develop in apositive direction
Row %No change
Row %
Destabilizationand negativedevelopment
The capital market
113
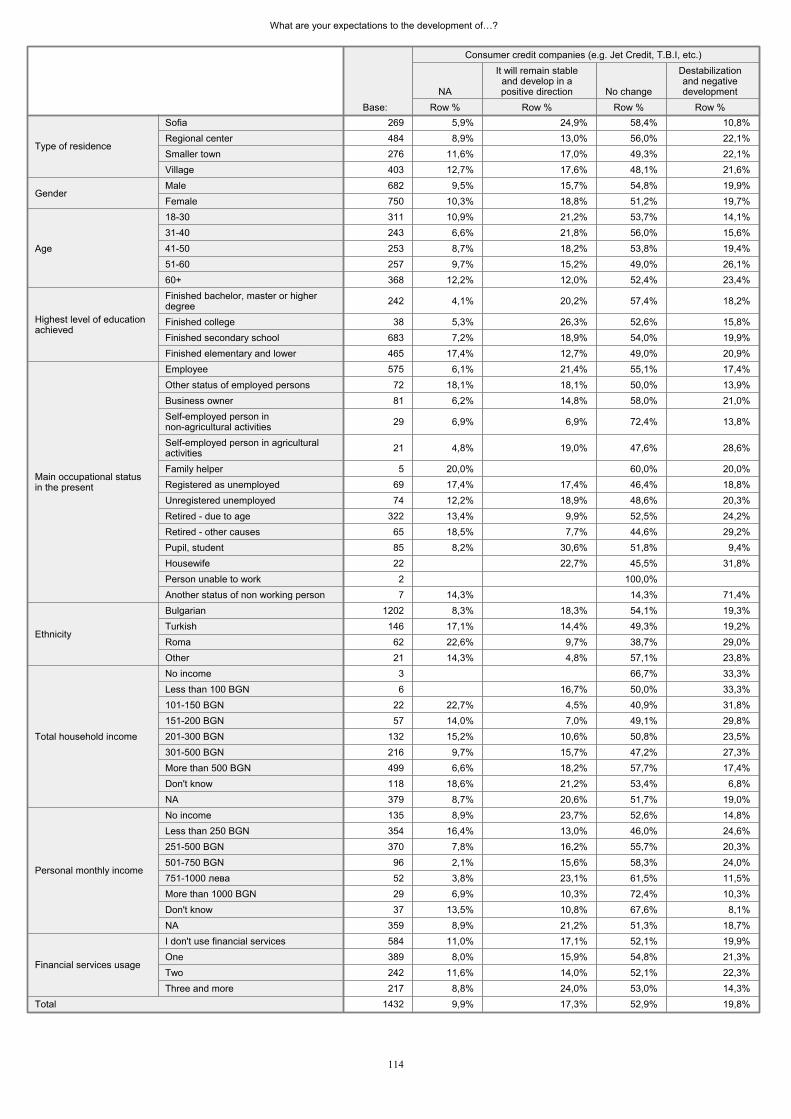
What are your expectations to the development of�…?
269 5,9% 24,9% 58,4% 10,8%484 8,9% 13,0% 56,0% 22,1%276 11,6% 17,0% 49,3% 22,1%403 12,7% 17,6% 48,1% 21,6%682 9,5% 15,7% 54,8% 19,9%750 10,3% 18,8% 51,2% 19,7%311 10,9% 21,2% 53,7% 14,1%243 6,6% 21,8% 56,0% 15,6%253 8,7% 18,2% 53,8% 19,4%257 9,7% 15,2% 49,0% 26,1%368 12,2% 12,0% 52,4% 23,4%
242 4,1% 20,2% 57,4% 18,2%
38 5,3% 26,3% 52,6% 15,8%683 7,2% 18,9% 54,0% 19,9%465 17,4% 12,7% 49,0% 20,9%575 6,1% 21,4% 55,1% 17,4%72 18,1% 18,1% 50,0% 13,9%81 6,2% 14,8% 58,0% 21,0%
29 6,9% 6,9% 72,4% 13,8%
21 4,8% 19,0% 47,6% 28,6%
5 20,0% 60,0% 20,0%69 17,4% 17,4% 46,4% 18,8%74 12,2% 18,9% 48,6% 20,3%
322 13,4% 9,9% 52,5% 24,2%65 18,5% 7,7% 44,6% 29,2%85 8,2% 30,6% 51,8% 9,4%22 22,7% 45,5% 31,8%2 100,0% 7 14,3% 14,3% 71,4%
1202 8,3% 18,3% 54,1% 19,3%146 17,1% 14,4% 49,3% 19,2%62 22,6% 9,7% 38,7% 29,0%21 14,3% 4,8% 57,1% 23,8%3 66,7% 33,3%6 16,7% 50,0% 33,3%
22 22,7% 4,5% 40,9% 31,8%57 14,0% 7,0% 49,1% 29,8%
132 15,2% 10,6% 50,8% 23,5%216 9,7% 15,7% 47,2% 27,3%499 6,6% 18,2% 57,7% 17,4%118 18,6% 21,2% 53,4% 6,8%379 8,7% 20,6% 51,7% 19,0%135 8,9% 23,7% 52,6% 14,8%354 16,4% 13,0% 46,0% 24,6%370 7,8% 16,2% 55,7% 20,3%96 2,1% 15,6% 58,3% 24,0%52 3,8% 23,1% 61,5% 11,5%29 6,9% 10,3% 72,4% 10,3%37 13,5% 10,8% 67,6% 8,1%
359 8,9% 21,2% 51,3% 18,7%584 11,0% 17,1% 52,1% 19,9%389 8,0% 15,9% 54,8% 21,3%242 11,6% 14,0% 52,1% 22,3%217 8,8% 24,0% 53,0% 14,3%
1432 9,9% 17,3% 52,9% 19,8%
SofiaRegional centerSmaller townVillage
Type of residence
MaleFemale
Gender
18-3031-4041-5051-6060+
Age
Finished bachelor, master or higherdegreeFinished collegeFinished secondary schoolFinished elementary and lower
Highest level of educationachieved
EmployeeOther status of employed personsBusiness ownerSelf-employed person innon-agricultural activitiesSelf-employed person in agriculturalactivitiesFamily helperRegistered as unemployedUnregistered unemployedRetired - due to ageRetired - other causesPupil, studentHousewifePerson unable to workAnother status of non working person
Main occupational statusin the present
BulgarianTurkishRomaOther
Ethnicity
No incomeLess than 100 BGN101-150 BGN151-200 BGN201-300 BGN301-500 BGNMore than 500 BGNDon't knowNA
Total household income
No incomeLess than 250 BGN251-500 BGN501-750 BGN751-1000 More than 1000 BGNDon't knowNA
Personal monthly income
I don't use financial servicesOneTwoThree and more
Financial services usage
Total
Base: Row %NA
Row %
It will remain stableand develop in apositive direction
Row %No change
Row %
Destabilizationand negativedevelopment
Consumer credit companies (e.g. Jet Credit, T.B.I, etc.)
114
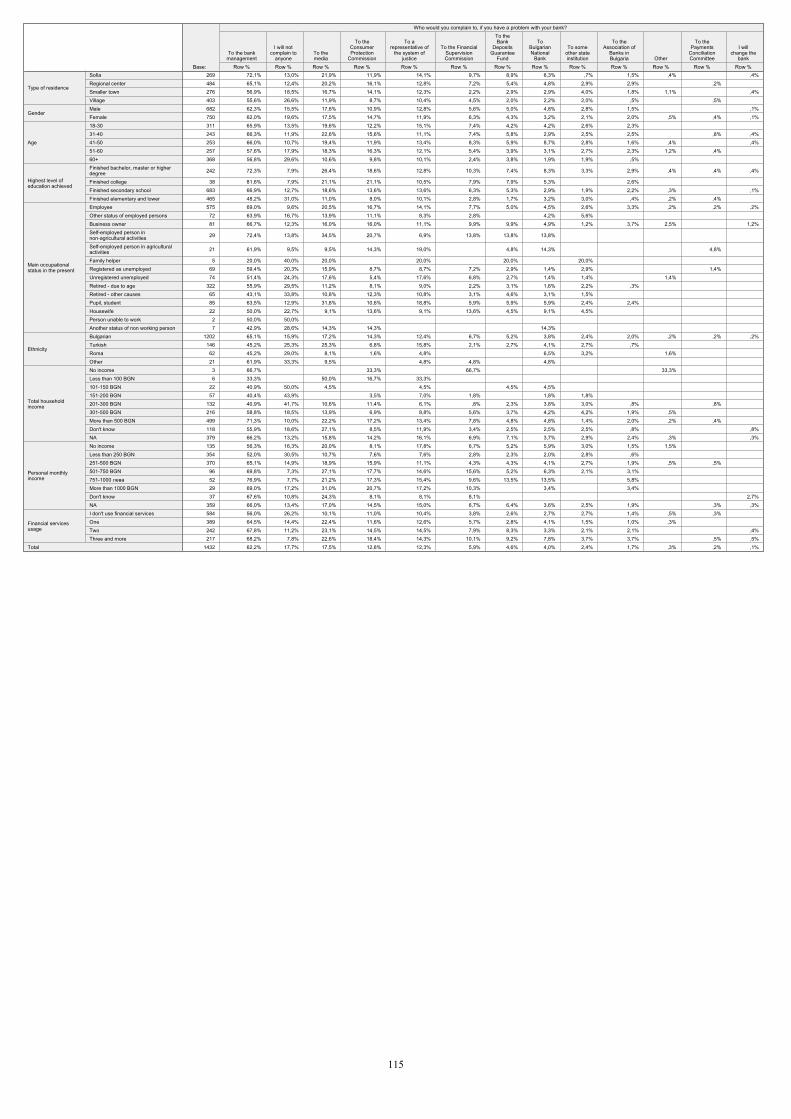
269 72,1% 13,0% 21,9% 11,9% 14,1% 9,7% 8,9% 6,3% ,7% 1,5% ,4% ,4%484 65,1% 12,4% 20,2% 16,1% 12,8% 7,2% 5,4% 4,8% 2,9% 2,9% ,2% 276 56,9% 18,5% 16,7% 14,1% 12,3% 2,2% 2,9% 2,9% 4,0% 1,8% 1,1% ,4%403 55,6% 26,6% 11,9% 8,7% 10,4% 4,5% 2,0% 2,2% 2,0% ,5% ,5% 682 62,3% 15,5% 17,6% 10,9% 12,8% 5,6% 5,0% 4,8% 2,8% 1,5% ,1%750 62,0% 19,6% 17,5% 14,7% 11,9% 6,3% 4,3% 3,2% 2,1% 2,0% ,5% ,4% ,1%311 65,9% 13,5% 19,6% 12,2% 15,1% 7,4% 4,2% 4,2% 2,6% 2,3% 243 66,3% 11,9% 22,6% 15,6% 11,1% 7,4% 5,8% 2,9% 2,5% 2,5% ,8% ,4%253 66,0% 10,7% 19,4% 11,9% 13,4% 8,3% 5,9% 8,7% 2,8% 1,6% ,4% ,4%257 57,6% 17,9% 18,3% 16,3% 12,1% 5,4% 3,9% 3,1% 2,7% 2,3% 1,2% ,4% 368 56,8% 29,6% 10,6% 9,8% 10,1% 2,4% 3,8% 1,9% 1,9% ,5%
242 72,3% 7,9% 26,4% 18,6% 12,8% 10,3% 7,4% 8,3% 3,3% 2,9% ,4% ,4% ,4%
38 81,6% 7,9% 21,1% 21,1% 10,5% 7,9% 7,9% 5,3% 2,6% 683 66,9% 12,7% 18,6% 13,6% 13,6% 6,3% 5,3% 2,9% 1,9% 2,2% ,3% ,1%465 48,2% 31,0% 11,0% 8,0% 10,1% 2,8% 1,7% 3,2% 3,0% ,4% ,2% ,4% 575 69,0% 9,6% 20,5% 16,7% 14,1% 7,7% 5,0% 4,5% 2,6% 3,3% ,2% ,2% ,2%
72 63,9% 16,7% 13,9% 11,1% 8,3% 2,8% 4,2% 5,6% 81 66,7% 12,3% 16,0% 16,0% 11,1% 9,9% 9,9% 4,9% 1,2% 3,7% 2,5% 1,2%
29 72,4% 13,8% 34,5% 20,7% 6,9% 13,8% 13,8% 13,8%
21 61,9% 9,5% 9,5% 14,3% 19,0% 4,8% 14,3% 4,8%
5 20,0% 40,0% 20,0% 20,0% 20,0% 20,0% 69 59,4% 20,3% 15,9% 8,7% 8,7% 7,2% 2,9% 1,4% 2,9% 1,4% 74 51,4% 24,3% 17,6% 5,4% 17,6% 6,8% 2,7% 1,4% 1,4% 1,4%
322 55,9% 29,5% 11,2% 8,1% 9,0% 2,2% 3,1% 1,6% 2,2% ,3% 65 43,1% 33,8% 10,8% 12,3% 10,8% 3,1% 4,6% 3,1% 1,5% 85 63,5% 12,9% 31,8% 10,6% 18,8% 5,9% 5,9% 5,9% 2,4% 2,4% 22 50,0% 22,7% 9,1% 13,6% 9,1% 13,6% 4,5% 9,1% 4,5%
2 50,0% 50,0% 7 42,9% 28,6% 14,3% 14,3% 14,3%
1202 65,1% 15,9% 17,2% 14,3% 12,4% 6,7% 5,2% 3,8% 2,4% 2,0% ,2% ,2% ,2%146 45,2% 25,3% 25,3% 6,8% 15,8% 2,1% 2,7% 4,1% 2,7% ,7%
62 45,2% 29,0% 8,1% 1,6% 4,8% 6,5% 3,2% 1,6% 21 61,9% 33,3% 9,5% 4,8% 4,8% 4,8%
3 66,7% 33,3% 66,7% 33,3% 6 33,3% 50,0% 16,7% 33,3%
22 40,9% 50,0% 4,5% 4,5% 4,5% 4,5% 57 40,4% 43,9% 3,5% 7,0% 1,8% 1,8% 1,8%
132 40,9% 41,7% 10,6% 11,4% 6,1% ,8% 2,3% 3,8% 3,0% ,8% ,8% 216 58,8% 18,5% 13,9% 6,9% 8,8% 5,6% 3,7% 4,2% 4,2% 1,9% ,5% 499 71,3% 10,0% 22,2% 17,2% 13,4% 7,8% 4,8% 4,8% 1,4% 2,0% ,2% ,4% 118 55,9% 18,6% 27,1% 8,5% 11,9% 3,4% 2,5% 2,5% 2,5% ,8% ,8%379 66,2% 13,2% 15,8% 14,2% 16,1% 6,9% 7,1% 3,7% 2,9% 2,4% ,3% ,3%135 56,3% 16,3% 20,0% 8,1% 17,8% 6,7% 5,2% 5,9% 3,0% 1,5% 1,5% 354 52,0% 30,5% 10,7% 7,6% 7,6% 2,8% 2,3% 2,0% 2,8% ,6% 370 65,1% 14,9% 18,9% 15,9% 11,1% 4,3% 4,3% 4,1% 2,7% 1,9% ,5% ,5%
96 69,8% 7,3% 27,1% 17,7% 14,6% 15,6% 5,2% 6,3% 2,1% 3,1% 52 76,9% 7,7% 21,2% 17,3% 15,4% 9,6% 13,5% 13,5% 5,8% 29 69,0% 17,2% 31,0% 20,7% 17,2% 10,3% 3,4% 3,4% 37 67,6% 10,8% 24,3% 8,1% 8,1% 8,1% 2,7%
359 66,0% 13,4% 17,0% 14,5% 15,0% 6,7% 6,4% 3,6% 2,5% 1,9% ,3% ,3%584 56,0% 26,2% 10,1% 11,0% 10,4% 3,8% 2,6% 2,7% 2,7% 1,4% ,5% ,3% 389 64,5% 14,4% 22,4% 11,6% 12,6% 5,7% 2,8% 4,1% 1,5% 1,0% ,3% 242 67,8% 11,2% 23,1% 14,5% 14,5% 7,9% 8,3% 3,3% 2,1% 2,1% ,4%217 68,2% 7,8% 22,6% 18,4% 14,3% 10,1% 9,2% 7,8% 3,7% 3,7% ,5% ,5%
1432 62,2% 17,7% 17,5% 12,8% 12,3% 5,9% 4,6% 4,0% 2,4% 1,7% ,3% ,2% ,1%
SofiaRegional centerSmaller townVillage
Type of residence
MaleFemale
Gender
18-3031-4041-5051-6060+
Age
Finished bachelor, master or higherdegreeFinished collegeFinished secondary schoolFinished elementary and lower
Highest level ofeducation achieved
EmployeeOther status of employed personsBusiness ownerSelf-employed person innon-agricultural activitiesSelf-employed person in agriculturalactivitiesFamily helperRegistered as unemployedUnregistered unemployedRetired - due to ageRetired - other causesPupil, studentHousewifePerson unable to workAnother status of non working person
Main occupationalstatus in the present
BulgarianTurkishRomaOther
Ethnicity
No incomeLess than 100 BGN101-150 BGN151-200 BGN201-300 BGN301-500 BGNMore than 500 BGNDon't knowNA
Total householdincome
No incomeLess than 250 BGN251-500 BGN501-750 BGN751-1000 More than 1000 BGNDon't knowNA
Personal monthlyincome
I don't use financial servicesOneTwoThree and more
Financial servicesusage
Total
Base: Row %
To the bankmanagement
Row %
I will notcomplain to
anyoneRow %
To themedia
Row %
To theConsumerProtection
CommissionRow %
To arepresentative of
the system ofjustice
Row %
To the FinancialSupervisionCommission
Row %
To theBank
DepositsGuarantee
FundRow %
ToBulgarianNational
BankRow %
To someother stateinstitution
Row %
To theAssociation of
Banks inBulgaria
Row %Other
Row %
To thePayments
ConciliationCommittee
Row %
I willchange the
bank
Who would you complain to, if you have a problem with your bank?
115
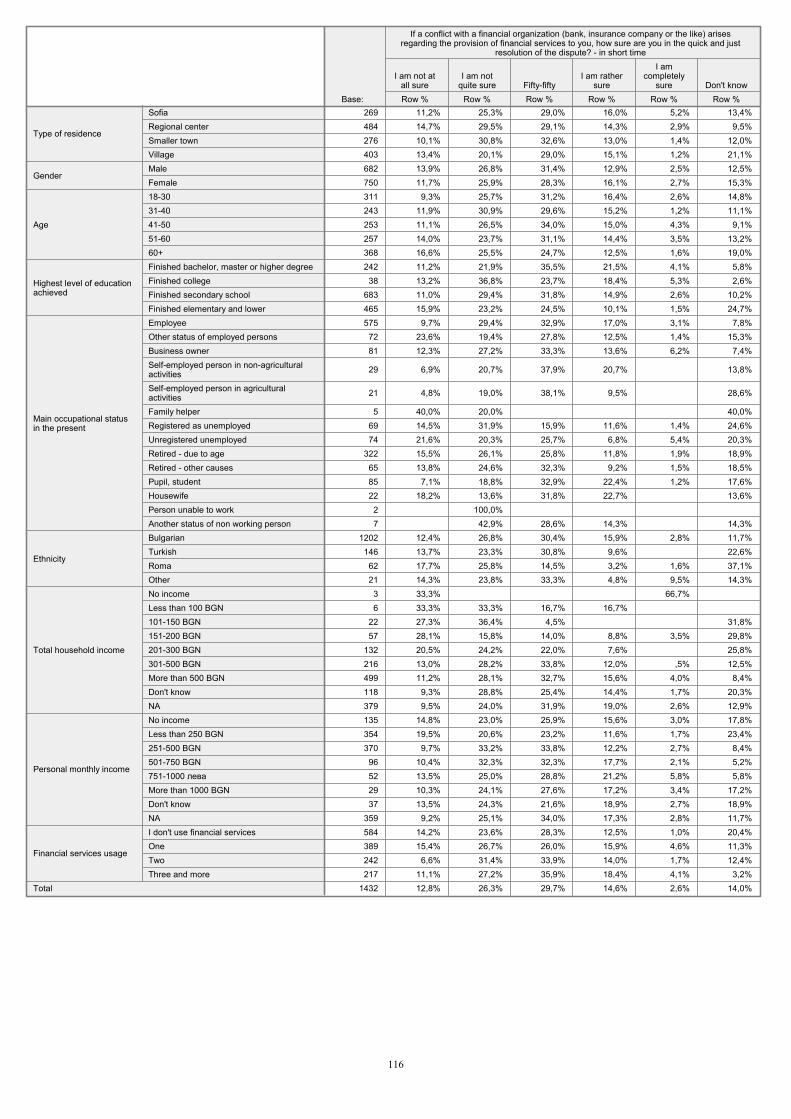
269 11,2% 25,3% 29,0% 16,0% 5,2% 13,4%484 14,7% 29,5% 29,1% 14,3% 2,9% 9,5%276 10,1% 30,8% 32,6% 13,0% 1,4% 12,0%403 13,4% 20,1% 29,0% 15,1% 1,2% 21,1%682 13,9% 26,8% 31,4% 12,9% 2,5% 12,5%750 11,7% 25,9% 28,3% 16,1% 2,7% 15,3%311 9,3% 25,7% 31,2% 16,4% 2,6% 14,8%243 11,9% 30,9% 29,6% 15,2% 1,2% 11,1%253 11,1% 26,5% 34,0% 15,0% 4,3% 9,1%257 14,0% 23,7% 31,1% 14,4% 3,5% 13,2%368 16,6% 25,5% 24,7% 12,5% 1,6% 19,0%242 11,2% 21,9% 35,5% 21,5% 4,1% 5,8%
38 13,2% 36,8% 23,7% 18,4% 5,3% 2,6%683 11,0% 29,4% 31,8% 14,9% 2,6% 10,2%465 15,9% 23,2% 24,5% 10,1% 1,5% 24,7%575 9,7% 29,4% 32,9% 17,0% 3,1% 7,8%
72 23,6% 19,4% 27,8% 12,5% 1,4% 15,3%81 12,3% 27,2% 33,3% 13,6% 6,2% 7,4%
29 6,9% 20,7% 37,9% 20,7% 13,8%
21 4,8% 19,0% 38,1% 9,5% 28,6%
5 40,0% 20,0% 40,0%69 14,5% 31,9% 15,9% 11,6% 1,4% 24,6%74 21,6% 20,3% 25,7% 6,8% 5,4% 20,3%
322 15,5% 26,1% 25,8% 11,8% 1,9% 18,9%65 13,8% 24,6% 32,3% 9,2% 1,5% 18,5%85 7,1% 18,8% 32,9% 22,4% 1,2% 17,6%22 18,2% 13,6% 31,8% 22,7% 13,6%
2 100,0% 7 42,9% 28,6% 14,3% 14,3%
1202 12,4% 26,8% 30,4% 15,9% 2,8% 11,7%146 13,7% 23,3% 30,8% 9,6% 22,6%
62 17,7% 25,8% 14,5% 3,2% 1,6% 37,1%21 14,3% 23,8% 33,3% 4,8% 9,5% 14,3%
3 33,3% 66,7% 6 33,3% 33,3% 16,7% 16,7%
22 27,3% 36,4% 4,5% 31,8%57 28,1% 15,8% 14,0% 8,8% 3,5% 29,8%
132 20,5% 24,2% 22,0% 7,6% 25,8%216 13,0% 28,2% 33,8% 12,0% ,5% 12,5%499 11,2% 28,1% 32,7% 15,6% 4,0% 8,4%118 9,3% 28,8% 25,4% 14,4% 1,7% 20,3%379 9,5% 24,0% 31,9% 19,0% 2,6% 12,9%135 14,8% 23,0% 25,9% 15,6% 3,0% 17,8%354 19,5% 20,6% 23,2% 11,6% 1,7% 23,4%370 9,7% 33,2% 33,8% 12,2% 2,7% 8,4%
96 10,4% 32,3% 32,3% 17,7% 2,1% 5,2%52 13,5% 25,0% 28,8% 21,2% 5,8% 5,8%29 10,3% 24,1% 27,6% 17,2% 3,4% 17,2%37 13,5% 24,3% 21,6% 18,9% 2,7% 18,9%
359 9,2% 25,1% 34,0% 17,3% 2,8% 11,7%584 14,2% 23,6% 28,3% 12,5% 1,0% 20,4%389 15,4% 26,7% 26,0% 15,9% 4,6% 11,3%242 6,6% 31,4% 33,9% 14,0% 1,7% 12,4%217 11,1% 27,2% 35,9% 18,4% 4,1% 3,2%
1432 12,8% 26,3% 29,7% 14,6% 2,6% 14,0%
SofiaRegional centerSmaller townVillage
Type of residence
MaleFemale
Gender
18-3031-4041-5051-6060+
Age
Finished bachelor, master or higher degreeFinished collegeFinished secondary schoolFinished elementary and lower
Highest level of educationachieved
EmployeeOther status of employed personsBusiness ownerSelf-employed person in non-agriculturalactivitiesSelf-employed person in agriculturalactivitiesFamily helperRegistered as unemployedUnregistered unemployedRetired - due to ageRetired - other causesPupil, studentHousewifePerson unable to workAnother status of non working person
Main occupational statusin the present
BulgarianTurkishRomaOther
Ethnicity
No incomeLess than 100 BGN101-150 BGN151-200 BGN201-300 BGN301-500 BGNMore than 500 BGNDon't knowNA
Total household income
No incomeLess than 250 BGN251-500 BGN501-750 BGN751-1000 More than 1000 BGNDon't knowNA
Personal monthly income
I don't use financial servicesOneTwoThree and more
Financial services usage
Total
Base: Row %
I am not atall sure
Row %
I am notquite sure
Row %Fifty-fifty
Row %
I am rathersure
Row %
I amcompletely
sureRow %
Don't know
If a conflict with a financial organization (bank, insurance company or the like) arisesregarding the provision of financial services to you, how sure are you in the quick and just
resolution of the dispute? - in short time
116
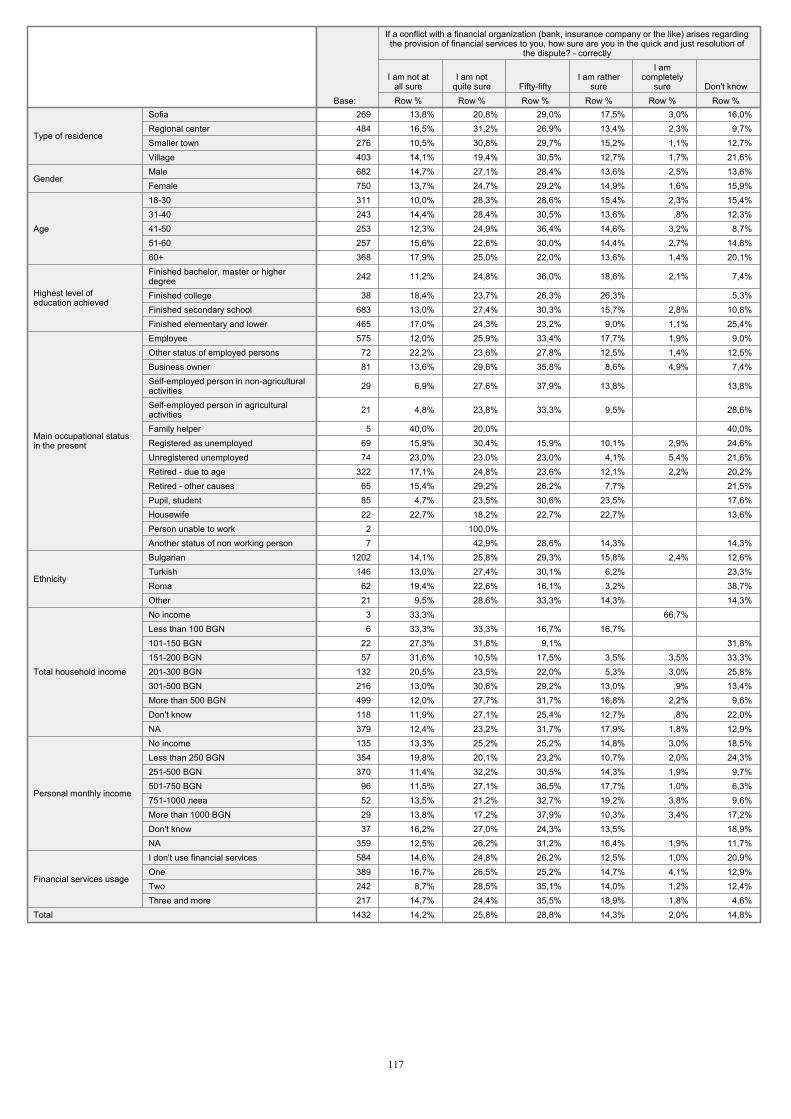
269 13,8% 20,8% 29,0% 17,5% 3,0% 16,0%484 16,5% 31,2% 26,9% 13,4% 2,3% 9,7%276 10,5% 30,8% 29,7% 15,2% 1,1% 12,7%403 14,1% 19,4% 30,5% 12,7% 1,7% 21,6%682 14,7% 27,1% 28,4% 13,6% 2,5% 13,6%750 13,7% 24,7% 29,2% 14,9% 1,6% 15,9%311 10,0% 28,3% 28,6% 15,4% 2,3% 15,4%243 14,4% 28,4% 30,5% 13,6% ,8% 12,3%253 12,3% 24,9% 36,4% 14,6% 3,2% 8,7%257 15,6% 22,6% 30,0% 14,4% 2,7% 14,8%368 17,9% 25,0% 22,0% 13,6% 1,4% 20,1%
242 11,2% 24,8% 36,0% 18,6% 2,1% 7,4%
38 18,4% 23,7% 26,3% 26,3% 5,3%683 13,0% 27,4% 30,3% 15,7% 2,8% 10,8%465 17,0% 24,3% 23,2% 9,0% 1,1% 25,4%575 12,0% 25,9% 33,4% 17,7% 1,9% 9,0%
72 22,2% 23,6% 27,8% 12,5% 1,4% 12,5%81 13,6% 29,6% 35,8% 8,6% 4,9% 7,4%
29 6,9% 27,6% 37,9% 13,8% 13,8%
21 4,8% 23,8% 33,3% 9,5% 28,6%
5 40,0% 20,0% 40,0%69 15,9% 30,4% 15,9% 10,1% 2,9% 24,6%74 23,0% 23,0% 23,0% 4,1% 5,4% 21,6%
322 17,1% 24,8% 23,6% 12,1% 2,2% 20,2%65 15,4% 29,2% 26,2% 7,7% 21,5%85 4,7% 23,5% 30,6% 23,5% 17,6%22 22,7% 18,2% 22,7% 22,7% 13,6%
2 100,0% 7 42,9% 28,6% 14,3% 14,3%
1202 14,1% 25,8% 29,3% 15,8% 2,4% 12,6%146 13,0% 27,4% 30,1% 6,2% 23,3%
62 19,4% 22,6% 16,1% 3,2% 38,7%21 9,5% 28,6% 33,3% 14,3% 14,3%
3 33,3% 66,7% 6 33,3% 33,3% 16,7% 16,7%
22 27,3% 31,8% 9,1% 31,8%57 31,6% 10,5% 17,5% 3,5% 3,5% 33,3%
132 20,5% 23,5% 22,0% 5,3% 3,0% 25,8%216 13,0% 30,6% 29,2% 13,0% ,9% 13,4%499 12,0% 27,7% 31,7% 16,8% 2,2% 9,6%118 11,9% 27,1% 25,4% 12,7% ,8% 22,0%379 12,4% 23,2% 31,7% 17,9% 1,8% 12,9%135 13,3% 25,2% 25,2% 14,8% 3,0% 18,5%354 19,8% 20,1% 23,2% 10,7% 2,0% 24,3%370 11,4% 32,2% 30,5% 14,3% 1,9% 9,7%
96 11,5% 27,1% 36,5% 17,7% 1,0% 6,3%52 13,5% 21,2% 32,7% 19,2% 3,8% 9,6%29 13,8% 17,2% 37,9% 10,3% 3,4% 17,2%37 16,2% 27,0% 24,3% 13,5% 18,9%
359 12,5% 26,2% 31,2% 16,4% 1,9% 11,7%584 14,6% 24,8% 26,2% 12,5% 1,0% 20,9%389 16,7% 26,5% 25,2% 14,7% 4,1% 12,9%242 8,7% 28,5% 35,1% 14,0% 1,2% 12,4%217 14,7% 24,4% 35,5% 18,9% 1,8% 4,6%
1432 14,2% 25,8% 28,8% 14,3% 2,0% 14,8%
SofiaRegional centerSmaller townVillage
Type of residence
MaleFemale
Gender
18-3031-4041-5051-6060+
Age
Finished bachelor, master or higherdegreeFinished collegeFinished secondary schoolFinished elementary and lower
Highest level ofeducation achieved
EmployeeOther status of employed personsBusiness ownerSelf-employed person in non-agriculturalactivitiesSelf-employed person in agriculturalactivitiesFamily helperRegistered as unemployedUnregistered unemployedRetired - due to ageRetired - other causesPupil, studentHousewifePerson unable to workAnother status of non working person
Main occupational statusin the present
BulgarianTurkishRomaOther
Ethnicity
No incomeLess than 100 BGN101-150 BGN151-200 BGN201-300 BGN301-500 BGNMore than 500 BGNDon't knowNA
Total household income
No incomeLess than 250 BGN251-500 BGN501-750 BGN751-1000 More than 1000 BGNDon't knowNA
Personal monthly income
I don't use financial servicesOneTwoThree and more
Financial services usage
Total
Base: Row %
I am not atall sure
Row %
I am notquite sure
Row %Fifty-fifty
Row %
I am rathersure
Row %
I amcompletely
sureRow %
Don't know
If a conflict with a financial organization (bank, insurance company or the like) arises regardingthe provision of financial services to you, how sure are you in the quick and just resolution of
the dispute? - correctly
117
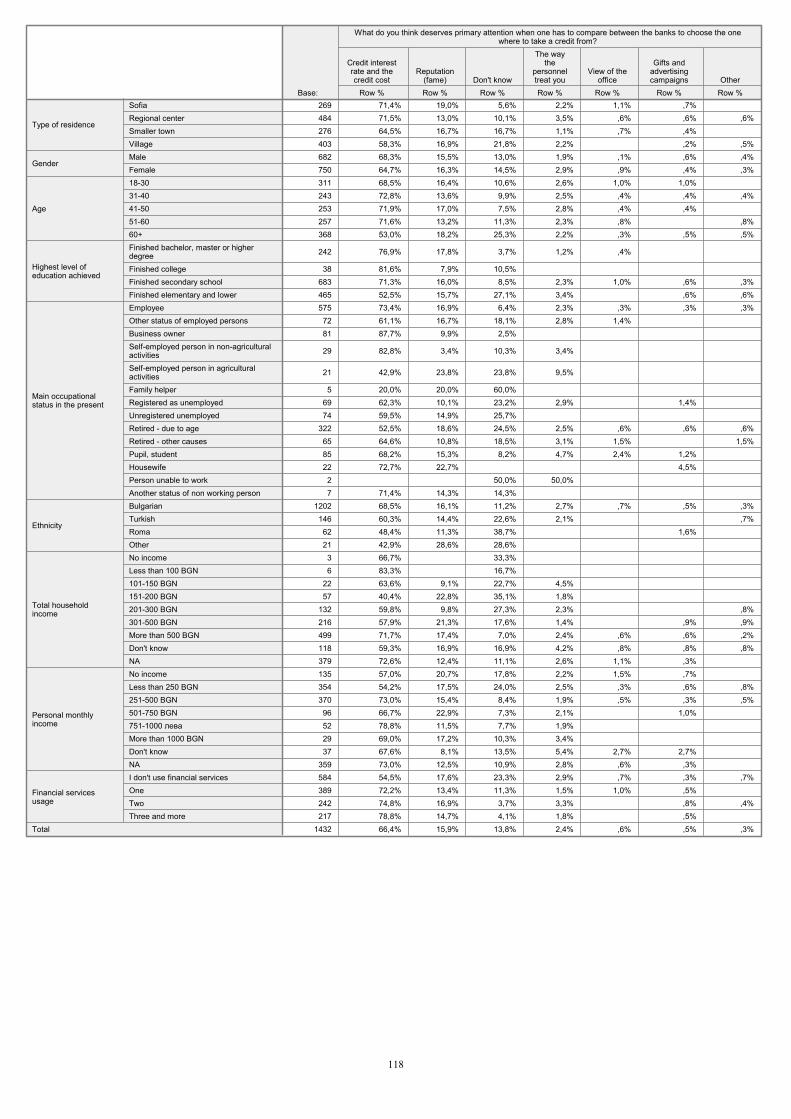
269 71,4% 19,0% 5,6% 2,2% 1,1% ,7% 484 71,5% 13,0% 10,1% 3,5% ,6% ,6% ,6%276 64,5% 16,7% 16,7% 1,1% ,7% ,4% 403 58,3% 16,9% 21,8% 2,2% ,2% ,5%682 68,3% 15,5% 13,0% 1,9% ,1% ,6% ,4%750 64,7% 16,3% 14,5% 2,9% ,9% ,4% ,3%311 68,5% 16,4% 10,6% 2,6% 1,0% 1,0% 243 72,8% 13,6% 9,9% 2,5% ,4% ,4% ,4%253 71,9% 17,0% 7,5% 2,8% ,4% ,4% 257 71,6% 13,2% 11,3% 2,3% ,8% ,8%368 53,0% 18,2% 25,3% 2,2% ,3% ,5% ,5%
242 76,9% 17,8% 3,7% 1,2% ,4%
38 81,6% 7,9% 10,5% 683 71,3% 16,0% 8,5% 2,3% 1,0% ,6% ,3%465 52,5% 15,7% 27,1% 3,4% ,6% ,6%575 73,4% 16,9% 6,4% 2,3% ,3% ,3% ,3%72 61,1% 16,7% 18,1% 2,8% 1,4% 81 87,7% 9,9% 2,5%
29 82,8% 3,4% 10,3% 3,4%
21 42,9% 23,8% 23,8% 9,5%
5 20,0% 20,0% 60,0% 69 62,3% 10,1% 23,2% 2,9% 1,4% 74 59,5% 14,9% 25,7%
322 52,5% 18,6% 24,5% 2,5% ,6% ,6% ,6%65 64,6% 10,8% 18,5% 3,1% 1,5% 1,5%85 68,2% 15,3% 8,2% 4,7% 2,4% 1,2% 22 72,7% 22,7% 4,5% 2 50,0% 50,0% 7 71,4% 14,3% 14,3%
1202 68,5% 16,1% 11,2% 2,7% ,7% ,5% ,3%146 60,3% 14,4% 22,6% 2,1% ,7%62 48,4% 11,3% 38,7% 1,6% 21 42,9% 28,6% 28,6% 3 66,7% 33,3% 6 83,3% 16,7%
22 63,6% 9,1% 22,7% 4,5% 57 40,4% 22,8% 35,1% 1,8%
132 59,8% 9,8% 27,3% 2,3% ,8%216 57,9% 21,3% 17,6% 1,4% ,9% ,9%499 71,7% 17,4% 7,0% 2,4% ,6% ,6% ,2%118 59,3% 16,9% 16,9% 4,2% ,8% ,8% ,8%379 72,6% 12,4% 11,1% 2,6% 1,1% ,3% 135 57,0% 20,7% 17,8% 2,2% 1,5% ,7% 354 54,2% 17,5% 24,0% 2,5% ,3% ,6% ,8%370 73,0% 15,4% 8,4% 1,9% ,5% ,3% ,5%96 66,7% 22,9% 7,3% 2,1% 1,0% 52 78,8% 11,5% 7,7% 1,9% 29 69,0% 17,2% 10,3% 3,4% 37 67,6% 8,1% 13,5% 5,4% 2,7% 2,7%
359 73,0% 12,5% 10,9% 2,8% ,6% ,3% 584 54,5% 17,6% 23,3% 2,9% ,7% ,3% ,7%389 72,2% 13,4% 11,3% 1,5% 1,0% ,5% 242 74,8% 16,9% 3,7% 3,3% ,8% ,4%217 78,8% 14,7% 4,1% 1,8% ,5%
1432 66,4% 15,9% 13,8% 2,4% ,6% ,5% ,3%
SofiaRegional centerSmaller townVillage
Type of residence
MaleFemale
Gender
18-3031-4041-5051-6060+
Age
Finished bachelor, master or higherdegreeFinished collegeFinished secondary schoolFinished elementary and lower
Highest level ofeducation achieved
EmployeeOther status of employed personsBusiness ownerSelf-employed person in non-agriculturalactivitiesSelf-employed person in agriculturalactivitiesFamily helperRegistered as unemployedUnregistered unemployedRetired - due to ageRetired - other causesPupil, studentHousewifePerson unable to workAnother status of non working person
Main occupationalstatus in the present
BulgarianTurkishRomaOther
Ethnicity
No incomeLess than 100 BGN101-150 BGN151-200 BGN201-300 BGN301-500 BGNMore than 500 BGNDon't knowNA
Total householdincome
No incomeLess than 250 BGN251-500 BGN501-750 BGN751-1000 More than 1000 BGNDon't knowNA
Personal monthlyincome
I don't use financial servicesOneTwoThree and more
Financial servicesusage
Total
Base: Row %
Credit interestrate and thecredit cost
Row %
Reputation(fame)
Row %Don't know
Row %
he waythe
personneltreat you
Row %
View of theoffice
Row %
Gifts andadvertisingcampaigns
Row %Other
What do you think deserves primary attention when one has to compare between the banks to choose the onewhere to take a credit from?
118
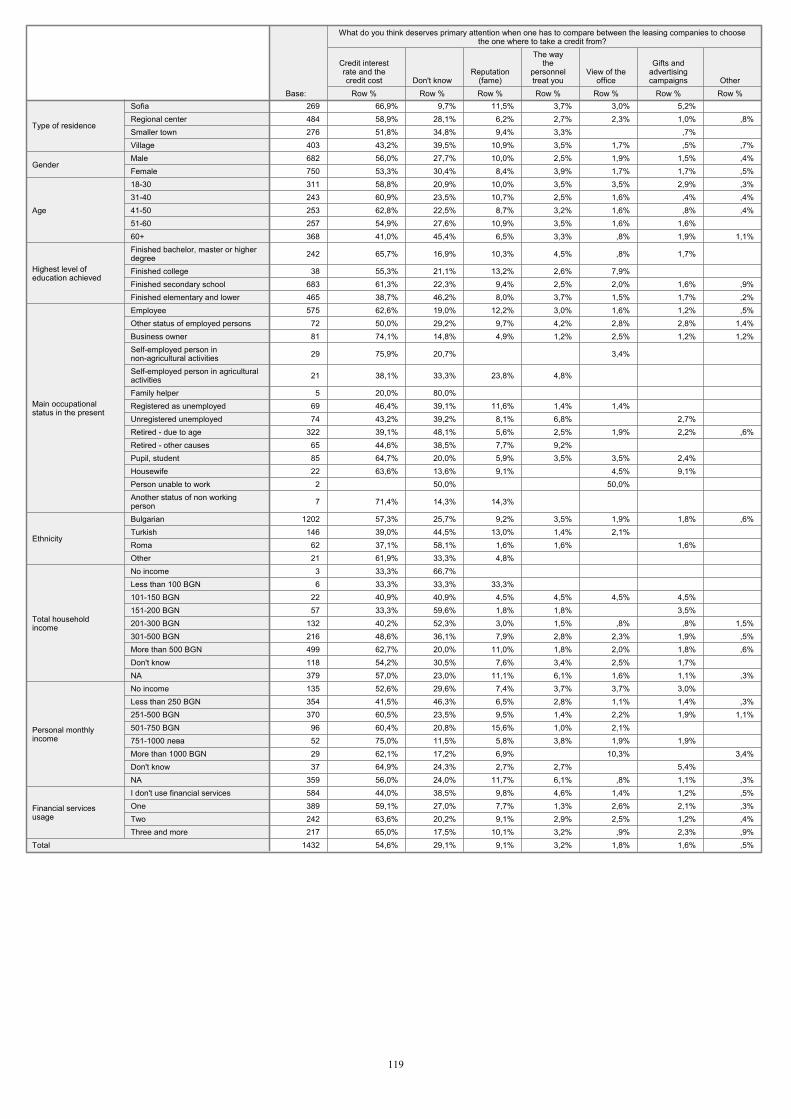
269 66,9% 9,7% 11,5% 3,7% 3,0% 5,2% 484 58,9% 28,1% 6,2% 2,7% 2,3% 1,0% ,8%276 51,8% 34,8% 9,4% 3,3% ,7% 403 43,2% 39,5% 10,9% 3,5% 1,7% ,5% ,7%682 56,0% 27,7% 10,0% 2,5% 1,9% 1,5% ,4%750 53,3% 30,4% 8,4% 3,9% 1,7% 1,7% ,5%311 58,8% 20,9% 10,0% 3,5% 3,5% 2,9% ,3%243 60,9% 23,5% 10,7% 2,5% 1,6% ,4% ,4%253 62,8% 22,5% 8,7% 3,2% 1,6% ,8% ,4%257 54,9% 27,6% 10,9% 3,5% 1,6% 1,6% 368 41,0% 45,4% 6,5% 3,3% ,8% 1,9% 1,1%
242 65,7% 16,9% 10,3% 4,5% ,8% 1,7%
38 55,3% 21,1% 13,2% 2,6% 7,9% 683 61,3% 22,3% 9,4% 2,5% 2,0% 1,6% ,9%465 38,7% 46,2% 8,0% 3,7% 1,5% 1,7% ,2%575 62,6% 19,0% 12,2% 3,0% 1,6% 1,2% ,5%
72 50,0% 29,2% 9,7% 4,2% 2,8% 2,8% 1,4%81 74,1% 14,8% 4,9% 1,2% 2,5% 1,2% 1,2%
29 75,9% 20,7% 3,4%
21 38,1% 33,3% 23,8% 4,8%
5 20,0% 80,0% 69 46,4% 39,1% 11,6% 1,4% 1,4% 74 43,2% 39,2% 8,1% 6,8% 2,7%
322 39,1% 48,1% 5,6% 2,5% 1,9% 2,2% ,6%65 44,6% 38,5% 7,7% 9,2% 85 64,7% 20,0% 5,9% 3,5% 3,5% 2,4% 22 63,6% 13,6% 9,1% 4,5% 9,1%
2 50,0% 50,0%
7 71,4% 14,3% 14,3%
1202 57,3% 25,7% 9,2% 3,5% 1,9% 1,8% ,6%146 39,0% 44,5% 13,0% 1,4% 2,1%
62 37,1% 58,1% 1,6% 1,6% 1,6% 21 61,9% 33,3% 4,8%
3 33,3% 66,7% 6 33,3% 33,3% 33,3%
22 40,9% 40,9% 4,5% 4,5% 4,5% 4,5% 57 33,3% 59,6% 1,8% 1,8% 3,5%
132 40,2% 52,3% 3,0% 1,5% ,8% ,8% 1,5%216 48,6% 36,1% 7,9% 2,8% 2,3% 1,9% ,5%499 62,7% 20,0% 11,0% 1,8% 2,0% 1,8% ,6%118 54,2% 30,5% 7,6% 3,4% 2,5% 1,7% 379 57,0% 23,0% 11,1% 6,1% 1,6% 1,1% ,3%135 52,6% 29,6% 7,4% 3,7% 3,7% 3,0% 354 41,5% 46,3% 6,5% 2,8% 1,1% 1,4% ,3%370 60,5% 23,5% 9,5% 1,4% 2,2% 1,9% 1,1%
96 60,4% 20,8% 15,6% 1,0% 2,1% 52 75,0% 11,5% 5,8% 3,8% 1,9% 1,9% 29 62,1% 17,2% 6,9% 10,3% 3,4%37 64,9% 24,3% 2,7% 2,7% 5,4%
359 56,0% 24,0% 11,7% 6,1% ,8% 1,1% ,3%584 44,0% 38,5% 9,8% 4,6% 1,4% 1,2% ,5%389 59,1% 27,0% 7,7% 1,3% 2,6% 2,1% ,3%242 63,6% 20,2% 9,1% 2,9% 2,5% 1,2% ,4%217 65,0% 17,5% 10,1% 3,2% ,9% 2,3% ,9%
1432 54,6% 29,1% 9,1% 3,2% 1,8% 1,6% ,5%
SofiaRegional centerSmaller townVillage
Type of residence
MaleFemale
Gender
18-3031-4041-5051-6060+
Age
Finished bachelor, master or higherdegreeFinished collegeFinished secondary schoolFinished elementary and lower
Highest level ofeducation achieved
EmployeeOther status of employed personsBusiness ownerSelf-employed person innon-agricultural activitiesSelf-employed person in agriculturalactivitiesFamily helperRegistered as unemployedUnregistered unemployedRetired - due to ageRetired - other causesPupil, studentHousewifePerson unable to workAnother status of non workingperson
Main occupationalstatus in the present
BulgarianTurkishRomaOther
Ethnicity
No incomeLess than 100 BGN101-150 BGN151-200 BGN201-300 BGN301-500 BGNMore than 500 BGNDon't knowNA
Total householdincome
No incomeLess than 250 BGN251-500 BGN501-750 BGN751-1000 More than 1000 BGNDon't knowNA
Personal monthlyincome
I don't use financial servicesOneTwoThree and more
Financial servicesusage
Total
Base: Row %
Credit interestrate and thecredit cost
Row %Don't know
Row %
Reputation(fame)
Row %
he waythe
personneltreat you
Row %
View of theoffice
Row %
Gifts andadvertisingcampaigns
Row %Other
What do you think deserves primary attention when one has to compare between the leasing companies to choosethe one where to take a credit from?
119
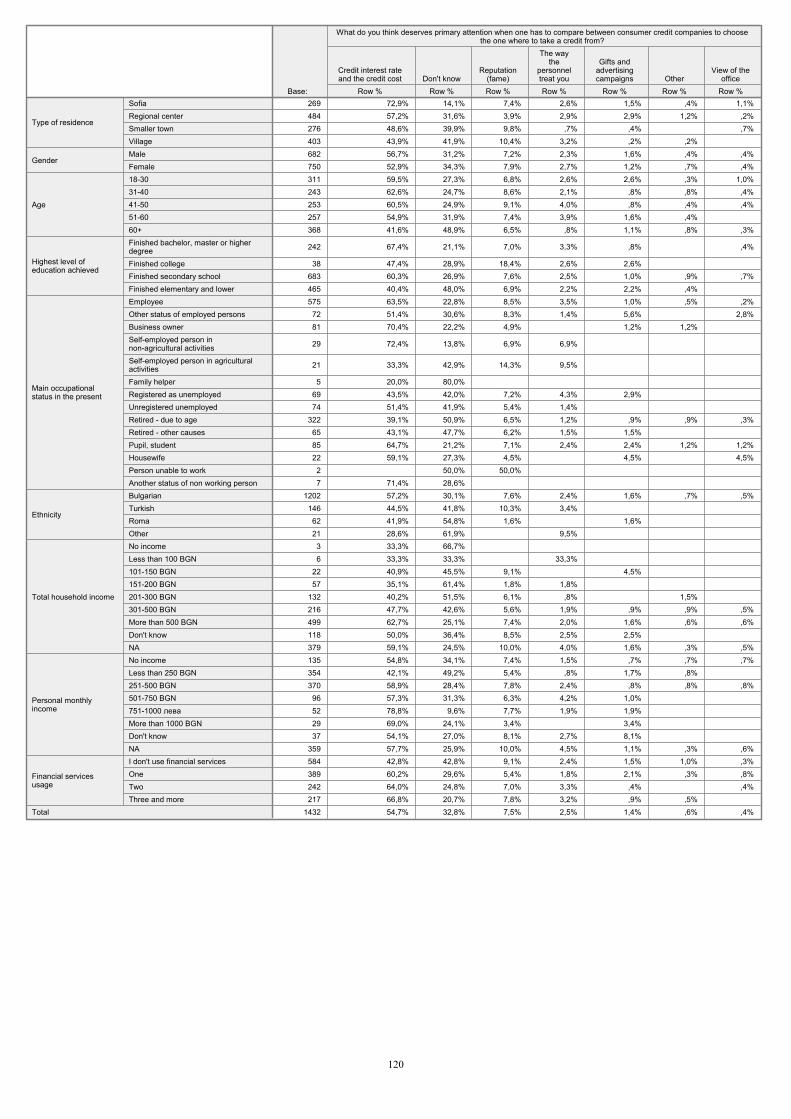
269 72,9% 14,1% 7,4% 2,6% 1,5% ,4% 1,1%484 57,2% 31,6% 3,9% 2,9% 2,9% 1,2% ,2%276 48,6% 39,9% 9,8% ,7% ,4% ,7%403 43,9% 41,9% 10,4% 3,2% ,2% ,2% 682 56,7% 31,2% 7,2% 2,3% 1,6% ,4% ,4%750 52,9% 34,3% 7,9% 2,7% 1,2% ,7% ,4%311 59,5% 27,3% 6,8% 2,6% 2,6% ,3% 1,0%243 62,6% 24,7% 8,6% 2,1% ,8% ,8% ,4%253 60,5% 24,9% 9,1% 4,0% ,8% ,4% ,4%257 54,9% 31,9% 7,4% 3,9% 1,6% ,4% 368 41,6% 48,9% 6,5% ,8% 1,1% ,8% ,3%
242 67,4% 21,1% 7,0% 3,3% ,8% ,4%
38 47,4% 28,9% 18,4% 2,6% 2,6% 683 60,3% 26,9% 7,6% 2,5% 1,0% ,9% ,7%465 40,4% 48,0% 6,9% 2,2% 2,2% ,4% 575 63,5% 22,8% 8,5% 3,5% 1,0% ,5% ,2%
72 51,4% 30,6% 8,3% 1,4% 5,6% 2,8%81 70,4% 22,2% 4,9% 1,2% 1,2%
29 72,4% 13,8% 6,9% 6,9%
21 33,3% 42,9% 14,3% 9,5%
5 20,0% 80,0% 69 43,5% 42,0% 7,2% 4,3% 2,9% 74 51,4% 41,9% 5,4% 1,4%
322 39,1% 50,9% 6,5% 1,2% ,9% ,9% ,3%65 43,1% 47,7% 6,2% 1,5% 1,5% 85 64,7% 21,2% 7,1% 2,4% 2,4% 1,2% 1,2%22 59,1% 27,3% 4,5% 4,5% 4,5%
2 50,0% 50,0% 7 71,4% 28,6%
1202 57,2% 30,1% 7,6% 2,4% 1,6% ,7% ,5%146 44,5% 41,8% 10,3% 3,4%
62 41,9% 54,8% 1,6% 1,6% 21 28,6% 61,9% 9,5%
3 33,3% 66,7% 6 33,3% 33,3% 33,3%
22 40,9% 45,5% 9,1% 4,5% 57 35,1% 61,4% 1,8% 1,8%
132 40,2% 51,5% 6,1% ,8% 1,5% 216 47,7% 42,6% 5,6% 1,9% ,9% ,9% ,5%499 62,7% 25,1% 7,4% 2,0% 1,6% ,6% ,6%118 50,0% 36,4% 8,5% 2,5% 2,5% 379 59,1% 24,5% 10,0% 4,0% 1,6% ,3% ,5%135 54,8% 34,1% 7,4% 1,5% ,7% ,7% ,7%354 42,1% 49,2% 5,4% ,8% 1,7% ,8% 370 58,9% 28,4% 7,8% 2,4% ,8% ,8% ,8%
96 57,3% 31,3% 6,3% 4,2% 1,0% 52 78,8% 9,6% 7,7% 1,9% 1,9% 29 69,0% 24,1% 3,4% 3,4% 37 54,1% 27,0% 8,1% 2,7% 8,1%
359 57,7% 25,9% 10,0% 4,5% 1,1% ,3% ,6%584 42,8% 42,8% 9,1% 2,4% 1,5% 1,0% ,3%389 60,2% 29,6% 5,4% 1,8% 2,1% ,3% ,8%242 64,0% 24,8% 7,0% 3,3% ,4% ,4%217 66,8% 20,7% 7,8% 3,2% ,9% ,5%
1432 54,7% 32,8% 7,5% 2,5% 1,4% ,6% ,4%
SofiaRegional centerSmaller townVillage
Type of residence
MaleFemale
Gender
18-3031-4041-5051-6060+
Age
Finished bachelor, master or higherdegreeFinished collegeFinished secondary schoolFinished elementary and lower
Highest level ofeducation achieved
EmployeeOther status of employed personsBusiness ownerSelf-employed person innon-agricultural activitiesSelf-employed person in agriculturalactivitiesFamily helperRegistered as unemployedUnregistered unemployedRetired - due to ageRetired - other causesPupil, studentHousewifePerson unable to workAnother status of non working person
Main occupationalstatus in the present
BulgarianTurkishRomaOther
Ethnicity
No incomeLess than 100 BGN101-150 BGN151-200 BGN201-300 BGN301-500 BGNMore than 500 BGNDon't knowNA
Total household income
No incomeLess than 250 BGN251-500 BGN501-750 BGN751-1000 More than 1000 BGNDon't knowNA
Personal monthlyincome
I don't use financial servicesOneTwoThree and more
Financial servicesusage
Total
Base: Row %
Credit interest rateand the credit cost
Row %Don't know
Row %
Reputation(fame)
Row %
he waythe
personneltreat you
Row %
Gifts andadvertisingcampaigns
Row %Other
Row %
View of theoffice
What do you think deserves primary attention when one has to compare between consumer credit companies to choosethe one where to take a credit from?
120
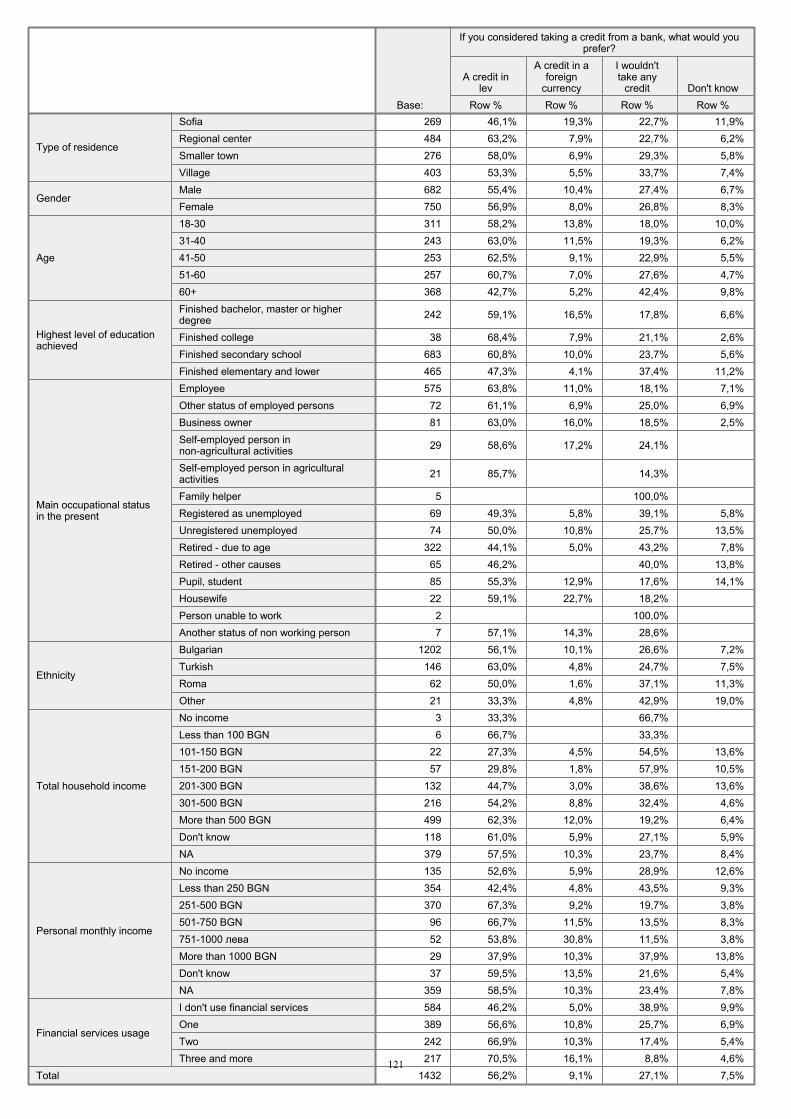
269 46,1% 19,3% 22,7% 11,9%484 63,2% 7,9% 22,7% 6,2%276 58,0% 6,9% 29,3% 5,8%403 53,3% 5,5% 33,7% 7,4%682 55,4% 10,4% 27,4% 6,7%750 56,9% 8,0% 26,8% 8,3%311 58,2% 13,8% 18,0% 10,0%243 63,0% 11,5% 19,3% 6,2%253 62,5% 9,1% 22,9% 5,5%257 60,7% 7,0% 27,6% 4,7%368 42,7% 5,2% 42,4% 9,8%
242 59,1% 16,5% 17,8% 6,6%
38 68,4% 7,9% 21,1% 2,6%683 60,8% 10,0% 23,7% 5,6%465 47,3% 4,1% 37,4% 11,2%575 63,8% 11,0% 18,1% 7,1%72 61,1% 6,9% 25,0% 6,9%81 63,0% 16,0% 18,5% 2,5%
29 58,6% 17,2% 24,1%
21 85,7% 14,3%
5 100,0% 69 49,3% 5,8% 39,1% 5,8%74 50,0% 10,8% 25,7% 13,5%
322 44,1% 5,0% 43,2% 7,8%65 46,2% 40,0% 13,8%85 55,3% 12,9% 17,6% 14,1%22 59,1% 22,7% 18,2% 2 100,0% 7 57,1% 14,3% 28,6%
1202 56,1% 10,1% 26,6% 7,2%146 63,0% 4,8% 24,7% 7,5%62 50,0% 1,6% 37,1% 11,3%21 33,3% 4,8% 42,9% 19,0%3 33,3% 66,7% 6 66,7% 33,3%
22 27,3% 4,5% 54,5% 13,6%57 29,8% 1,8% 57,9% 10,5%
132 44,7% 3,0% 38,6% 13,6%216 54,2% 8,8% 32,4% 4,6%499 62,3% 12,0% 19,2% 6,4%118 61,0% 5,9% 27,1% 5,9%379 57,5% 10,3% 23,7% 8,4%135 52,6% 5,9% 28,9% 12,6%354 42,4% 4,8% 43,5% 9,3%370 67,3% 9,2% 19,7% 3,8%96 66,7% 11,5% 13,5% 8,3%52 53,8% 30,8% 11,5% 3,8%29 37,9% 10,3% 37,9% 13,8%37 59,5% 13,5% 21,6% 5,4%
359 58,5% 10,3% 23,4% 7,8%584 46,2% 5,0% 38,9% 9,9%389 56,6% 10,8% 25,7% 6,9%242 66,9% 10,3% 17,4% 5,4%217 70,5% 16,1% 8,8% 4,6%
1432 56,2% 9,1% 27,1% 7,5%
SofiaRegional centerSmaller townVillage
Type of residence
MaleFemale
Gender
18-3031-4041-5051-6060+
Age
Finished bachelor, master or higherdegreeFinished collegeFinished secondary schoolFinished elementary and lower
Highest level of educationachieved
EmployeeOther status of employed personsBusiness ownerSelf-employed person innon-agricultural activitiesSelf-employed person in agriculturalactivitiesFamily helperRegistered as unemployedUnregistered unemployedRetired - due to ageRetired - other causesPupil, studentHousewifePerson unable to workAnother status of non working person
Main occupational statusin the present
BulgarianTurkishRomaOther
Ethnicity
No incomeLess than 100 BGN101-150 BGN151-200 BGN201-300 BGN301-500 BGNMore than 500 BGNDon't knowNA
Total household income
No incomeLess than 250 BGN251-500 BGN501-750 BGN751-1000 More than 1000 BGNDon't knowNA
Personal monthly income
I don't use financial servicesOneTwoThree and more
Financial services usage
Total
Base: Row %
A credit inlev
Row %
A credit in aforeign
currencyRow %
I wouldn'ttake any
creditRow %
Don't know
If you considered taking a credit from a bank, what would youprefer?
121
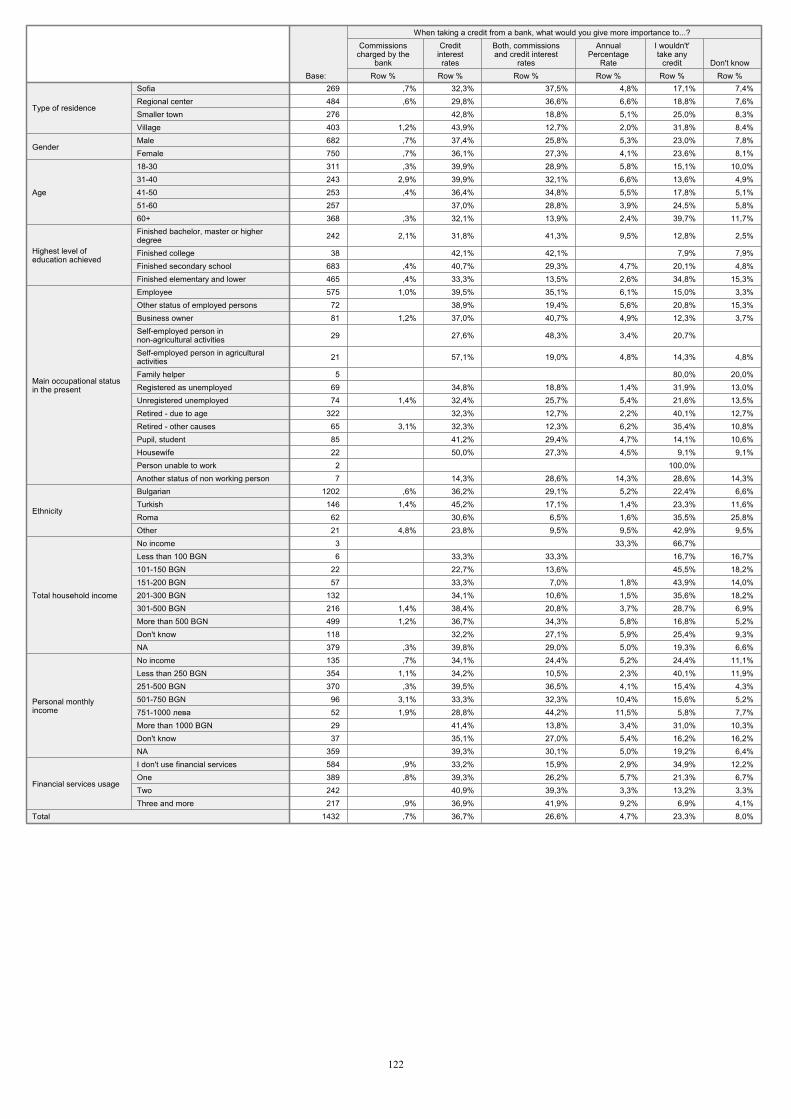
269 ,7% 32,3% 37,5% 4,8% 17,1% 7,4%484 ,6% 29,8% 36,6% 6,6% 18,8% 7,6%276 42,8% 18,8% 5,1% 25,0% 8,3%403 1,2% 43,9% 12,7% 2,0% 31,8% 8,4%682 ,7% 37,4% 25,8% 5,3% 23,0% 7,8%750 ,7% 36,1% 27,3% 4,1% 23,6% 8,1%311 ,3% 39,9% 28,9% 5,8% 15,1% 10,0%243 2,9% 39,9% 32,1% 6,6% 13,6% 4,9%253 ,4% 36,4% 34,8% 5,5% 17,8% 5,1%257 37,0% 28,8% 3,9% 24,5% 5,8%368 ,3% 32,1% 13,9% 2,4% 39,7% 11,7%
242 2,1% 31,8% 41,3% 9,5% 12,8% 2,5%
38 42,1% 42,1% 7,9% 7,9%683 ,4% 40,7% 29,3% 4,7% 20,1% 4,8%465 ,4% 33,3% 13,5% 2,6% 34,8% 15,3%575 1,0% 39,5% 35,1% 6,1% 15,0% 3,3%
72 38,9% 19,4% 5,6% 20,8% 15,3%81 1,2% 37,0% 40,7% 4,9% 12,3% 3,7%
29 27,6% 48,3% 3,4% 20,7%
21 57,1% 19,0% 4,8% 14,3% 4,8%
5 80,0% 20,0%69 34,8% 18,8% 1,4% 31,9% 13,0%74 1,4% 32,4% 25,7% 5,4% 21,6% 13,5%
322 32,3% 12,7% 2,2% 40,1% 12,7%65 3,1% 32,3% 12,3% 6,2% 35,4% 10,8%85 41,2% 29,4% 4,7% 14,1% 10,6%22 50,0% 27,3% 4,5% 9,1% 9,1%
2 100,0% 7 14,3% 28,6% 14,3% 28,6% 14,3%
1202 ,6% 36,2% 29,1% 5,2% 22,4% 6,6%146 1,4% 45,2% 17,1% 1,4% 23,3% 11,6%
62 30,6% 6,5% 1,6% 35,5% 25,8%21 4,8% 23,8% 9,5% 9,5% 42,9% 9,5%
3 33,3% 66,7% 6 33,3% 33,3% 16,7% 16,7%
22 22,7% 13,6% 45,5% 18,2%57 33,3% 7,0% 1,8% 43,9% 14,0%
132 34,1% 10,6% 1,5% 35,6% 18,2%216 1,4% 38,4% 20,8% 3,7% 28,7% 6,9%499 1,2% 36,7% 34,3% 5,8% 16,8% 5,2%118 32,2% 27,1% 5,9% 25,4% 9,3%379 ,3% 39,8% 29,0% 5,0% 19,3% 6,6%135 ,7% 34,1% 24,4% 5,2% 24,4% 11,1%354 1,1% 34,2% 10,5% 2,3% 40,1% 11,9%370 ,3% 39,5% 36,5% 4,1% 15,4% 4,3%
96 3,1% 33,3% 32,3% 10,4% 15,6% 5,2%52 1,9% 28,8% 44,2% 11,5% 5,8% 7,7%29 41,4% 13,8% 3,4% 31,0% 10,3%37 35,1% 27,0% 5,4% 16,2% 16,2%
359 39,3% 30,1% 5,0% 19,2% 6,4%584 ,9% 33,2% 15,9% 2,9% 34,9% 12,2%389 ,8% 39,3% 26,2% 5,7% 21,3% 6,7%242 40,9% 39,3% 3,3% 13,2% 3,3%217 ,9% 36,9% 41,9% 9,2% 6,9% 4,1%
1432 ,7% 36,7% 26,6% 4,7% 23,3% 8,0%
SofiaRegional centerSmaller townVillage
Type of residence
MaleFemale
Gender
18-3031-4041-5051-6060+
Age
Finished bachelor, master or higherdegreeFinished collegeFinished secondary schoolFinished elementary and lower
Highest level ofeducation achieved
EmployeeOther status of employed personsBusiness ownerSelf-employed person innon-agricultural activitiesSelf-employed person in agriculturalactivitiesFamily helperRegistered as unemployedUnregistered unemployedRetired - due to ageRetired - other causesPupil, studentHousewifePerson unable to workAnother status of non working person
Main occupational statusin the present
BulgarianTurkishRomaOther
Ethnicity
No incomeLess than 100 BGN101-150 BGN151-200 BGN201-300 BGN301-500 BGNMore than 500 BGNDon't knowNA
Total household income
No incomeLess than 250 BGN251-500 BGN501-750 BGN751-1000 More than 1000 BGNDon't knowNA
Personal monthlyincome
I don't use financial servicesOneTwoThree and more
Financial services usage
Total
Base: Row %
Commissionscharged by the
bankRow %
Creditinterestrates
Row %
Both, commissionsand credit interest
ratesRow %
AnnualPercentage
RateRow %
I wouldn't'take any
creditRow %
Don't know
When taking a credit from a bank, what would you give more importance to...?
122
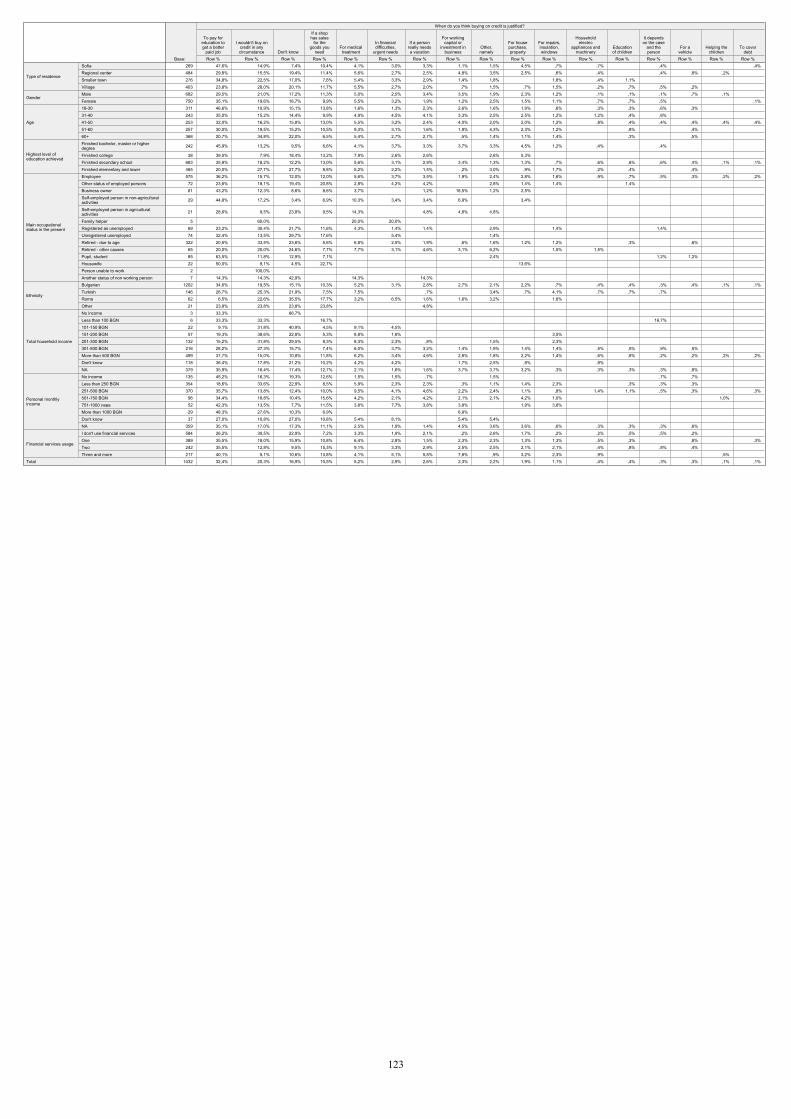
269 47,6% 14,9% 7,4% 10,4% 4,1% 3,0% 3,3% 1,1% 1,5% 4,5% ,7% ,7% ,4% ,4%484 29,8% 15,5% 19,4% 11,4% 5,6% 2,7% 2,5% 4,8% 3,5% 2,5% ,6% ,4% ,4% ,8% ,2% 276 34,8% 22,5% 17,0% 7,6% 5,4% 3,3% 2,9% 1,4% 1,8% 1,8% ,4% 1,1% 403 23,8% 28,0% 20,1% 11,7% 5,5% 2,7% 2,0% ,7% 1,5% ,7% 1,5% ,2% ,7% ,5% ,2% 682 29,5% 21,0% 17,2% 11,3% 5,0% 2,5% 3,4% 3,5% 1,9% 2,3% 1,2% ,1% ,1% ,1% ,7% ,1% 750 35,1% 19,6% 16,7% 9,9% 5,5% 3,2% 1,9% 1,2% 2,5% 1,5% 1,1% ,7% ,7% ,5% ,1%311 46,6% 10,9% 15,1% 13,8% 1,6% 1,3% 2,3% 2,6% 1,6% 1,9% ,6% ,3% ,3% ,6% ,3% 243 35,0% 15,2% 14,4% 9,9% 4,9% 4,5% 4,1% 3,3% 2,5% 2,5% 1,2% 1,2% ,4% ,8% 253 32,0% 16,2% 15,8% 13,0% 5,5% 3,2% 2,4% 4,0% 2,0% 2,0% 1,2% ,8% ,4% ,4% ,4% ,4% ,4%257 30,0% 19,5% 15,2% 10,5% 9,3% 3,1% 1,6% 1,9% 4,3% 2,3% 1,2% ,8% ,4% 368 20,7% 34,8% 22,0% 6,5% 5,4% 2,7% 2,7% ,5% 1,4% 1,1% 1,4% ,3% ,5%
242 45,9% 13,2% 9,5% 6,6% 4,1% 3,7% 3,3% 3,7% 3,3% 4,5% 1,2% ,4% ,4%
38 39,5% 7,9% 18,4% 13,2% 7,9% 2,6% 2,6% 2,6% 5,3% 683 35,9% 18,2% 12,2% 13,0% 5,6% 3,1% 2,9% 3,4% 1,3% 1,3% ,7% ,6% ,6% ,6% ,4% ,1% ,1%465 20,0% 27,7% 27,7% 8,8% 5,2% 2,2% 1,5% ,2% 3,0% ,9% 1,7% ,2% ,4% ,4% 575 36,2% 15,7% 12,0% 12,0% 5,6% 3,7% 3,5% 1,9% 2,4% 2,8% 1,6% ,9% ,7% ,5% ,3% ,2% ,2%72 23,6% 18,1% 19,4% 20,8% 2,8% 4,2% 4,2% 2,8% 1,4% 1,4% 1,4% 81 43,2% 12,3% 8,6% 8,6% 3,7% 1,2% 18,5% 1,2% 2,5%
29 44,8% 17,2% 3,4% 6,9% 10,3% 3,4% 3,4% 6,9% 3,4%
21 28,6% 9,5% 23,8% 9,5% 14,3% 4,8% 4,8% 4,8%
5 60,0% 20,0% 20,0% 69 23,2% 30,4% 21,7% 11,6% 4,3% 1,4% 1,4% 2,9% 1,4% 1,4% 74 32,4% 13,5% 29,7% 17,6% 5,4% 1,4%
322 20,5% 33,5% 23,6% 5,6% 6,8% 2,5% 1,9% ,6% 1,6% 1,2% 1,2% ,3% ,6% 65 20,0% 20,0% 24,6% 7,7% 7,7% 3,1% 4,6% 3,1% 6,2% 1,5% 1,5% 85 63,5% 11,8% 12,9% 7,1% 2,4% 1,2% 1,2% 22 50,0% 9,1% 4,5% 22,7% 13,6% 2 100,0% 7 14,3% 14,3% 42,9% 14,3% 14,3%
1202 34,6% 19,5% 15,1% 10,3% 5,2% 3,1% 2,8% 2,7% 2,1% 2,2% ,7% ,4% ,4% ,3% ,4% ,1% ,1%146 26,7% 25,3% 21,9% 7,5% 7,5% ,7% 3,4% ,7% 4,1% ,7% ,7% ,7% 62 6,5% 22,6% 35,5% 17,7% 3,2% 6,5% 1,6% 1,6% 3,2% 1,6% 21 23,8% 23,8% 23,8% 23,8% 4,8% 3 33,3% 66,7% 6 33,3% 33,3% 16,7% 16,7%
22 9,1% 31,8% 40,9% 4,5% 9,1% 4,5% 57 19,3% 38,6% 22,8% 5,3% 8,8% 1,8% 3,5%
132 15,2% 31,8% 29,5% 8,3% 8,3% 2,3% ,8% 1,5% 2,3% 216 28,2% 27,3% 15,7% 7,4% 6,0% 3,7% 3,2% 1,4% 1,9% 1,4% 1,4% ,5% ,5% ,9% ,5% 499 37,7% 15,0% 10,8% 11,8% 6,2% 3,4% 4,6% 2,8% 1,8% 2,2% 1,4% ,6% ,8% ,2% ,2% ,2% ,2%118 36,4% 17,8% 21,2% 10,2% 4,2% 4,2% 1,7% 2,5% ,8% ,8% 379 35,9% 16,4% 17,4% 12,7% 2,1% 1,6% 1,6% 3,7% 3,7% 3,2% ,3% ,3% ,3% ,3% ,8% 135 45,2% 16,3% 19,3% 12,6% 1,5% 1,5% ,7% 1,5% ,7% ,7% 354 18,6% 33,6% 22,9% 8,5% 5,9% 2,3% 2,3% ,3% 1,1% 1,4% 2,3% ,3% ,3% ,3% 370 35,7% 13,8% 12,4% 10,0% 9,5% 4,1% 4,6% 2,2% 2,4% 1,1% ,8% 1,4% 1,1% ,5% ,3% ,3%96 34,4% 18,8% 10,4% 15,6% 4,2% 2,1% 4,2% 2,1% 2,1% 4,2% 1,0% 1,0% 52 42,3% 13,5% 7,7% 11,5% 3,8% 7,7% 3,8% 3,8% 1,9% 3,8% 29 48,3% 27,6% 10,3% 6,9% 6,9% 37 27,0% 10,8% 27,0% 10,8% 5,4% 8,1% 5,4% 5,4%
359 35,1% 17,0% 17,3% 11,1% 2,5% 1,9% 1,4% 4,5% 3,6% 3,6% ,6% ,3% ,3% ,3% ,6% 584 26,2% 30,5% 22,9% 7,2% 3,3% 1,9% 2,1% ,2% 2,6% 1,7% ,2% ,2% ,5% ,5% ,2% 389 35,5% 18,0% 15,9% 10,8% 6,4% 2,8% 1,5% 2,3% 2,3% 1,3% 1,3% ,5% ,3% ,8% ,3%242 35,5% 12,8% 9,5% 15,3% 9,1% 3,3% 2,9% 2,5% 2,5% 2,1% 2,1% ,4% ,8% ,8% ,4% 217 40,1% 5,1% 10,6% 13,8% 4,1% 5,1% 5,5% 7,8% ,9% 3,2% 2,3% ,9% ,5%
1432 32,4% 20,3% 16,9% 10,5% 5,2% 2,9% 2,6% 2,3% 2,2% 1,9% 1,1% ,4% ,4% ,3% ,3% ,1% ,1%
SofiaRegional centerSmaller townVillage
Type of residence
MaleFemale
Gender
18-3031-4041-5051-6060+
Age
Finished bachelor, master or higherdegreeFinished collegeFinished secondary schoolFinished elementary and lower
Highest level ofeducation achieved
EmployeeOther status of employed personsBusiness ownerSelf-employed person in non-agriculturalactivitiesSelf-employed person in agriculturalactivitiesFamily helperRegistered as unemployedUnregistered unemployedRetired - due to ageRetired - other causesPupil, studentHousewifePerson unable to workAnother status of non working person
Main occupationalstatus in the present
BulgarianTurkishRomaOther
Ethnicity
No incomeLess than 100 BGN101-150 BGN151-200 BGN201-300 BGN301-500 BGNMore than 500 BGNDon't knowNA
Total household income
No incomeLess than 250 BGN251-500 BGN501-750 BGN751-1000 More than 1000 BGNDon't knowNA
Personal monthlyincome
I don't use financial servicesOneTwoThree and more
Financial services usage
Total
Base: Row %
To pay foreducation toget a better
paid jobRow %
I wouldn't buy oncredit in anycircumstance
Row %Don't know
Row %
If a shophas sales
for thegoods you
needRow %
For medicaltreatment
Row %
In financialdifficulties,
urgent needsRow %
If a personreally needsa vacation
Row %
For workingcapital or
investment inbusiness
Row %
Other,namely
Row %
For housepurchase,property
Row %
For repairs,insulation,windows
Row %
Householdelectric
appliances andmachinery
Row %
Educationof children
Row %
It dependson the case
and theperson
Row %
For avehicle
Row %
Helping thechildren
Row %
To coverdebt
When do you think buying on credit is justified?
123
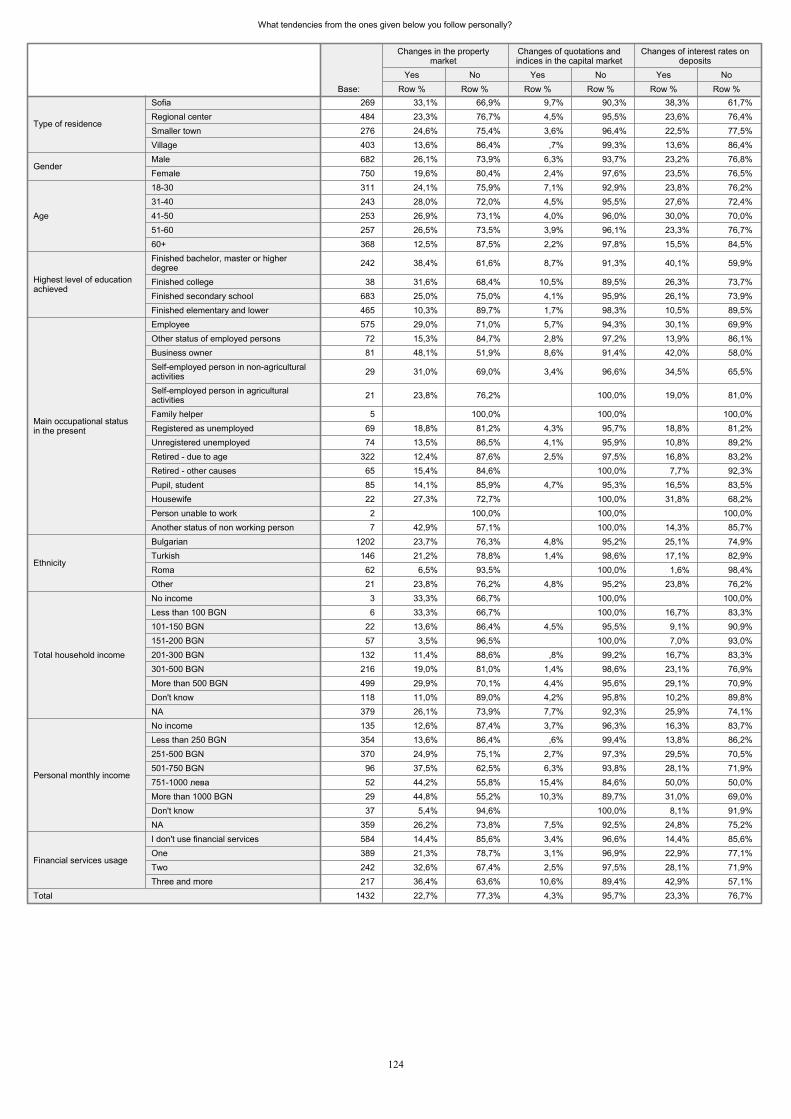
What tendencies from the ones given below you follow personally?
269 33,1% 66,9% 9,7% 90,3% 38,3% 61,7%484 23,3% 76,7% 4,5% 95,5% 23,6% 76,4%276 24,6% 75,4% 3,6% 96,4% 22,5% 77,5%403 13,6% 86,4% ,7% 99,3% 13,6% 86,4%682 26,1% 73,9% 6,3% 93,7% 23,2% 76,8%750 19,6% 80,4% 2,4% 97,6% 23,5% 76,5%311 24,1% 75,9% 7,1% 92,9% 23,8% 76,2%243 28,0% 72,0% 4,5% 95,5% 27,6% 72,4%253 26,9% 73,1% 4,0% 96,0% 30,0% 70,0%257 26,5% 73,5% 3,9% 96,1% 23,3% 76,7%368 12,5% 87,5% 2,2% 97,8% 15,5% 84,5%
242 38,4% 61,6% 8,7% 91,3% 40,1% 59,9%
38 31,6% 68,4% 10,5% 89,5% 26,3% 73,7%683 25,0% 75,0% 4,1% 95,9% 26,1% 73,9%465 10,3% 89,7% 1,7% 98,3% 10,5% 89,5%575 29,0% 71,0% 5,7% 94,3% 30,1% 69,9%72 15,3% 84,7% 2,8% 97,2% 13,9% 86,1%81 48,1% 51,9% 8,6% 91,4% 42,0% 58,0%
29 31,0% 69,0% 3,4% 96,6% 34,5% 65,5%
21 23,8% 76,2% 100,0% 19,0% 81,0%
5 100,0% 100,0% 100,0%69 18,8% 81,2% 4,3% 95,7% 18,8% 81,2%74 13,5% 86,5% 4,1% 95,9% 10,8% 89,2%
322 12,4% 87,6% 2,5% 97,5% 16,8% 83,2%65 15,4% 84,6% 100,0% 7,7% 92,3%85 14,1% 85,9% 4,7% 95,3% 16,5% 83,5%22 27,3% 72,7% 100,0% 31,8% 68,2%2 100,0% 100,0% 100,0%7 42,9% 57,1% 100,0% 14,3% 85,7%
1202 23,7% 76,3% 4,8% 95,2% 25,1% 74,9%146 21,2% 78,8% 1,4% 98,6% 17,1% 82,9%62 6,5% 93,5% 100,0% 1,6% 98,4%21 23,8% 76,2% 4,8% 95,2% 23,8% 76,2%3 33,3% 66,7% 100,0% 100,0%6 33,3% 66,7% 100,0% 16,7% 83,3%
22 13,6% 86,4% 4,5% 95,5% 9,1% 90,9%57 3,5% 96,5% 100,0% 7,0% 93,0%
132 11,4% 88,6% ,8% 99,2% 16,7% 83,3%216 19,0% 81,0% 1,4% 98,6% 23,1% 76,9%499 29,9% 70,1% 4,4% 95,6% 29,1% 70,9%118 11,0% 89,0% 4,2% 95,8% 10,2% 89,8%379 26,1% 73,9% 7,7% 92,3% 25,9% 74,1%135 12,6% 87,4% 3,7% 96,3% 16,3% 83,7%354 13,6% 86,4% ,6% 99,4% 13,8% 86,2%370 24,9% 75,1% 2,7% 97,3% 29,5% 70,5%96 37,5% 62,5% 6,3% 93,8% 28,1% 71,9%52 44,2% 55,8% 15,4% 84,6% 50,0% 50,0%29 44,8% 55,2% 10,3% 89,7% 31,0% 69,0%37 5,4% 94,6% 100,0% 8,1% 91,9%
359 26,2% 73,8% 7,5% 92,5% 24,8% 75,2%584 14,4% 85,6% 3,4% 96,6% 14,4% 85,6%389 21,3% 78,7% 3,1% 96,9% 22,9% 77,1%242 32,6% 67,4% 2,5% 97,5% 28,1% 71,9%217 36,4% 63,6% 10,6% 89,4% 42,9% 57,1%
1432 22,7% 77,3% 4,3% 95,7% 23,3% 76,7%
SofiaRegional centerSmaller townVillage
Type of residence
MaleFemale
Gender
18-3031-4041-5051-6060+
Age
Finished bachelor, master or higherdegreeFinished collegeFinished secondary schoolFinished elementary and lower
Highest level of educationachieved
EmployeeOther status of employed personsBusiness ownerSelf-employed person in non-agriculturalactivitiesSelf-employed person in agriculturalactivitiesFamily helperRegistered as unemployedUnregistered unemployedRetired - due to ageRetired - other causesPupil, studentHousewifePerson unable to workAnother status of non working person
Main occupational statusin the present
BulgarianTurkishRomaOther
Ethnicity
No incomeLess than 100 BGN101-150 BGN151-200 BGN201-300 BGN301-500 BGNMore than 500 BGNDon't knowNA
Total household income
No incomeLess than 250 BGN251-500 BGN501-750 BGN751-1000 More than 1000 BGNDon't knowNA
Personal monthly income
I don't use financial servicesOneTwoThree and more
Financial services usage
Total
Base: Row %Yes
Row %No
Changes in the propertymarket
Row %Yes
Row %No
Changes of quotations andindices in the capital market
Row %Yes
Row %No
Changes of interest rates ondeposits
124
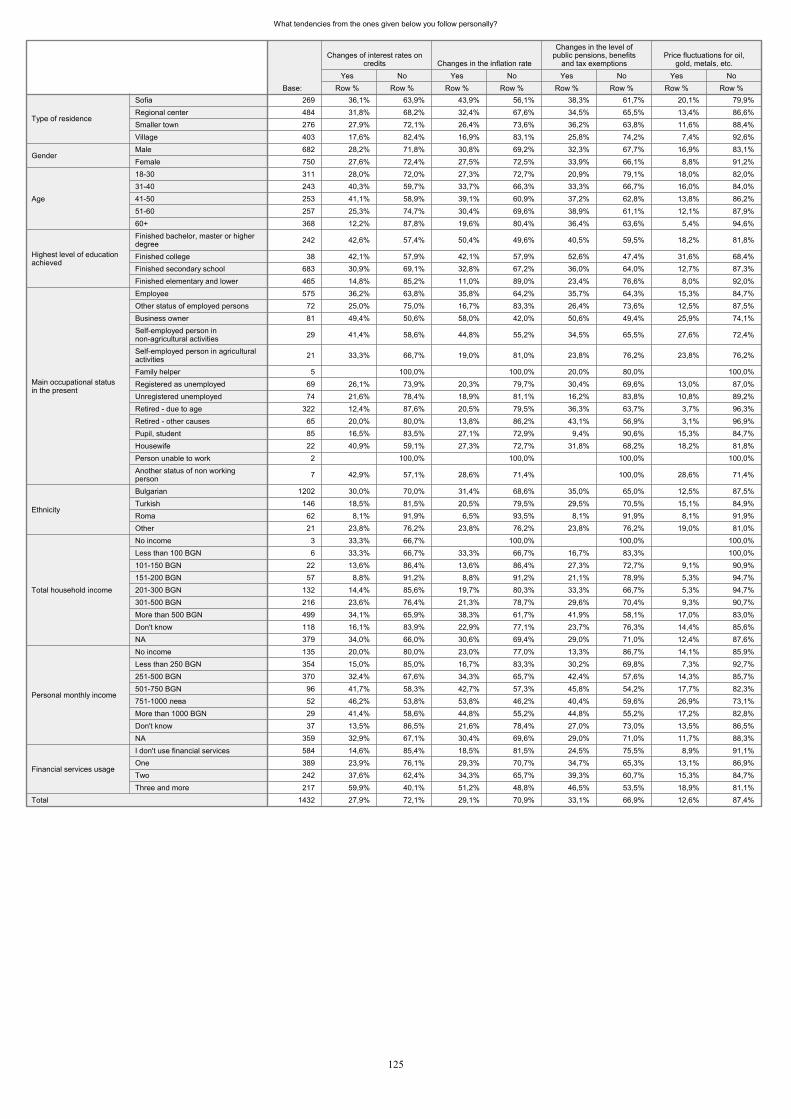
What tendencies from the ones given below you follow personally?
269 36,1% 63,9% 43,9% 56,1% 38,3% 61,7% 20,1% 79,9%484 31,8% 68,2% 32,4% 67,6% 34,5% 65,5% 13,4% 86,6%276 27,9% 72,1% 26,4% 73,6% 36,2% 63,8% 11,6% 88,4%403 17,6% 82,4% 16,9% 83,1% 25,8% 74,2% 7,4% 92,6%682 28,2% 71,8% 30,8% 69,2% 32,3% 67,7% 16,9% 83,1%750 27,6% 72,4% 27,5% 72,5% 33,9% 66,1% 8,8% 91,2%311 28,0% 72,0% 27,3% 72,7% 20,9% 79,1% 18,0% 82,0%243 40,3% 59,7% 33,7% 66,3% 33,3% 66,7% 16,0% 84,0%253 41,1% 58,9% 39,1% 60,9% 37,2% 62,8% 13,8% 86,2%257 25,3% 74,7% 30,4% 69,6% 38,9% 61,1% 12,1% 87,9%368 12,2% 87,8% 19,6% 80,4% 36,4% 63,6% 5,4% 94,6%
242 42,6% 57,4% 50,4% 49,6% 40,5% 59,5% 18,2% 81,8%
38 42,1% 57,9% 42,1% 57,9% 52,6% 47,4% 31,6% 68,4%683 30,9% 69,1% 32,8% 67,2% 36,0% 64,0% 12,7% 87,3%465 14,8% 85,2% 11,0% 89,0% 23,4% 76,6% 8,0% 92,0%575 36,2% 63,8% 35,8% 64,2% 35,7% 64,3% 15,3% 84,7%
72 25,0% 75,0% 16,7% 83,3% 26,4% 73,6% 12,5% 87,5%81 49,4% 50,6% 58,0% 42,0% 50,6% 49,4% 25,9% 74,1%
29 41,4% 58,6% 44,8% 55,2% 34,5% 65,5% 27,6% 72,4%
21 33,3% 66,7% 19,0% 81,0% 23,8% 76,2% 23,8% 76,2%
5 100,0% 100,0% 20,0% 80,0% 100,0%69 26,1% 73,9% 20,3% 79,7% 30,4% 69,6% 13,0% 87,0%74 21,6% 78,4% 18,9% 81,1% 16,2% 83,8% 10,8% 89,2%
322 12,4% 87,6% 20,5% 79,5% 36,3% 63,7% 3,7% 96,3%65 20,0% 80,0% 13,8% 86,2% 43,1% 56,9% 3,1% 96,9%85 16,5% 83,5% 27,1% 72,9% 9,4% 90,6% 15,3% 84,7%22 40,9% 59,1% 27,3% 72,7% 31,8% 68,2% 18,2% 81,8%
2 100,0% 100,0% 100,0% 100,0%
7 42,9% 57,1% 28,6% 71,4% 100,0% 28,6% 71,4%
1202 30,0% 70,0% 31,4% 68,6% 35,0% 65,0% 12,5% 87,5%146 18,5% 81,5% 20,5% 79,5% 29,5% 70,5% 15,1% 84,9%
62 8,1% 91,9% 6,5% 93,5% 8,1% 91,9% 8,1% 91,9%21 23,8% 76,2% 23,8% 76,2% 23,8% 76,2% 19,0% 81,0%
3 33,3% 66,7% 100,0% 100,0% 100,0%6 33,3% 66,7% 33,3% 66,7% 16,7% 83,3% 100,0%
22 13,6% 86,4% 13,6% 86,4% 27,3% 72,7% 9,1% 90,9%57 8,8% 91,2% 8,8% 91,2% 21,1% 78,9% 5,3% 94,7%
132 14,4% 85,6% 19,7% 80,3% 33,3% 66,7% 5,3% 94,7%216 23,6% 76,4% 21,3% 78,7% 29,6% 70,4% 9,3% 90,7%499 34,1% 65,9% 38,3% 61,7% 41,9% 58,1% 17,0% 83,0%118 16,1% 83,9% 22,9% 77,1% 23,7% 76,3% 14,4% 85,6%379 34,0% 66,0% 30,6% 69,4% 29,0% 71,0% 12,4% 87,6%135 20,0% 80,0% 23,0% 77,0% 13,3% 86,7% 14,1% 85,9%354 15,0% 85,0% 16,7% 83,3% 30,2% 69,8% 7,3% 92,7%370 32,4% 67,6% 34,3% 65,7% 42,4% 57,6% 14,3% 85,7%
96 41,7% 58,3% 42,7% 57,3% 45,8% 54,2% 17,7% 82,3%52 46,2% 53,8% 53,8% 46,2% 40,4% 59,6% 26,9% 73,1%29 41,4% 58,6% 44,8% 55,2% 44,8% 55,2% 17,2% 82,8%37 13,5% 86,5% 21,6% 78,4% 27,0% 73,0% 13,5% 86,5%
359 32,9% 67,1% 30,4% 69,6% 29,0% 71,0% 11,7% 88,3%584 14,6% 85,4% 18,5% 81,5% 24,5% 75,5% 8,9% 91,1%389 23,9% 76,1% 29,3% 70,7% 34,7% 65,3% 13,1% 86,9%242 37,6% 62,4% 34,3% 65,7% 39,3% 60,7% 15,3% 84,7%217 59,9% 40,1% 51,2% 48,8% 46,5% 53,5% 18,9% 81,1%
1432 27,9% 72,1% 29,1% 70,9% 33,1% 66,9% 12,6% 87,4%
SofiaRegional centerSmaller townVillage
Type of residence
MaleFemale
Gender
18-3031-4041-5051-6060+
Age
Finished bachelor, master or higherdegreeFinished collegeFinished secondary schoolFinished elementary and lower
Highest level of educationachieved
EmployeeOther status of employed personsBusiness ownerSelf-employed person innon-agricultural activitiesSelf-employed person in agriculturalactivitiesFamily helperRegistered as unemployedUnregistered unemployedRetired - due to ageRetired - other causesPupil, studentHousewifePerson unable to workAnother status of non workingperson
Main occupational statusin the present
BulgarianTurkishRomaOther
Ethnicity
No incomeLess than 100 BGN101-150 BGN151-200 BGN201-300 BGN301-500 BGNMore than 500 BGNDon't knowNA
Total household income
No incomeLess than 250 BGN251-500 BGN501-750 BGN751-1000 More than 1000 BGNDon't knowNA
Personal monthly income
I don't use financial servicesOneTwoThree and more
Financial services usage
Total
Base: Row %Yes
Row %No
Changes of interest rates oncredits
Row %Yes
Row %No
Changes in the inflation rate
Row %Yes
Row %No
Changes in the level ofpublic pensions, benefits
and tax exemptions
Row %Yes
Row %No
Price fluctuations for oil,gold, metals, etc.
125
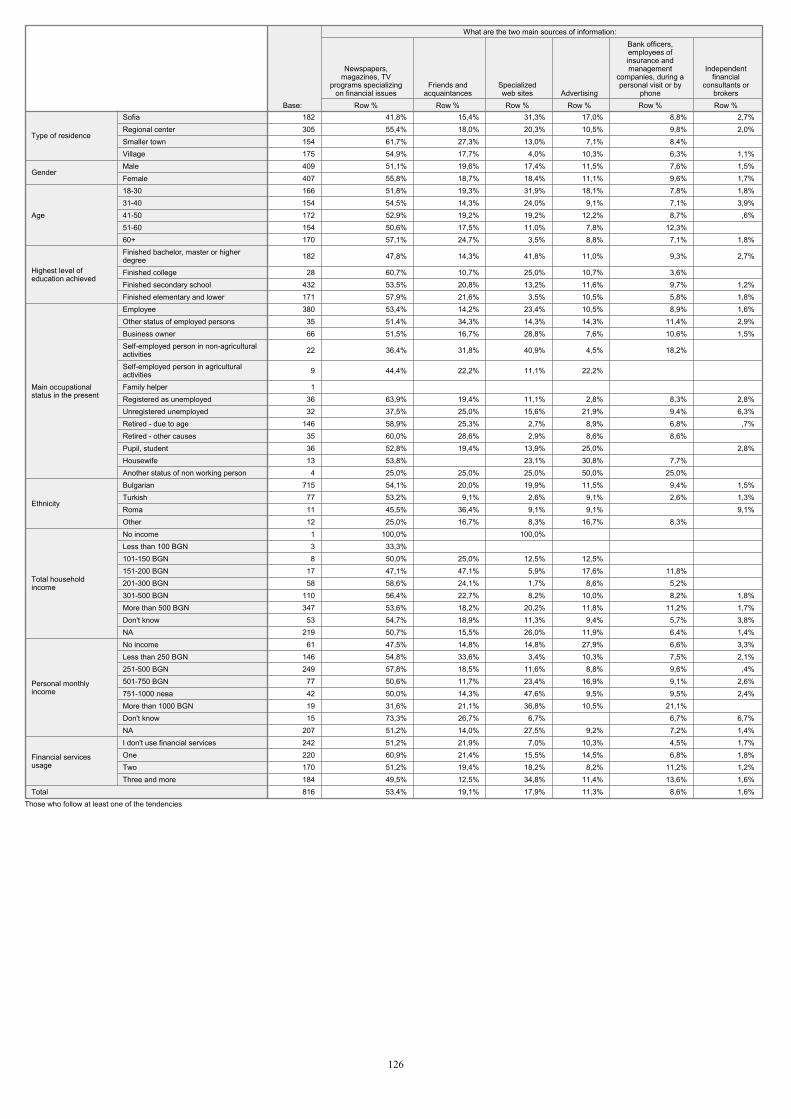
182 41,8% 15,4% 31,3% 17,0% 8,8% 2,7%305 55,4% 18,0% 20,3% 10,5% 9,8% 2,0%154 61,7% 27,3% 13,0% 7,1% 8,4% 175 54,9% 17,7% 4,0% 10,3% 6,3% 1,1%409 51,1% 19,6% 17,4% 11,5% 7,6% 1,5%407 55,8% 18,7% 18,4% 11,1% 9,6% 1,7%166 51,8% 19,3% 31,9% 18,1% 7,8% 1,8%154 54,5% 14,3% 24,0% 9,1% 7,1% 3,9%172 52,9% 19,2% 19,2% 12,2% 8,7% ,6%154 50,6% 17,5% 11,0% 7,8% 12,3% 170 57,1% 24,7% 3,5% 8,8% 7,1% 1,8%
182 47,8% 14,3% 41,8% 11,0% 9,3% 2,7%
28 60,7% 10,7% 25,0% 10,7% 3,6% 432 53,5% 20,8% 13,2% 11,6% 9,7% 1,2%171 57,9% 21,6% 3,5% 10,5% 5,8% 1,8%380 53,4% 14,2% 23,4% 10,5% 8,9% 1,6%35 51,4% 34,3% 14,3% 14,3% 11,4% 2,9%66 51,5% 16,7% 28,8% 7,6% 10,6% 1,5%
22 36,4% 31,8% 40,9% 4,5% 18,2%
9 44,4% 22,2% 11,1% 22,2%
1 36 63,9% 19,4% 11,1% 2,8% 8,3% 2,8%32 37,5% 25,0% 15,6% 21,9% 9,4% 6,3%
146 58,9% 25,3% 2,7% 8,9% 6,8% ,7%35 60,0% 28,6% 2,9% 8,6% 8,6% 36 52,8% 19,4% 13,9% 25,0% 2,8%13 53,8% 23,1% 30,8% 7,7% 4 25,0% 25,0% 25,0% 50,0% 25,0%
715 54,1% 20,0% 19,9% 11,5% 9,4% 1,5%77 53,2% 9,1% 2,6% 9,1% 2,6% 1,3%11 45,5% 36,4% 9,1% 9,1% 9,1%12 25,0% 16,7% 8,3% 16,7% 8,3% 1 100,0% 100,0% 3 33,3% 8 50,0% 25,0% 12,5% 12,5%
17 47,1% 47,1% 5,9% 17,6% 11,8% 58 58,6% 24,1% 1,7% 8,6% 5,2%
110 56,4% 22,7% 8,2% 10,0% 8,2% 1,8%347 53,6% 18,2% 20,2% 11,8% 11,2% 1,7%53 54,7% 18,9% 11,3% 9,4% 5,7% 3,8%
219 50,7% 15,5% 26,0% 11,9% 6,4% 1,4%61 47,5% 14,8% 14,8% 27,9% 6,6% 3,3%
146 54,8% 33,6% 3,4% 10,3% 7,5% 2,1%249 57,8% 18,5% 11,6% 8,8% 9,6% ,4%77 50,6% 11,7% 23,4% 16,9% 9,1% 2,6%42 50,0% 14,3% 47,6% 9,5% 9,5% 2,4%19 31,6% 21,1% 36,8% 10,5% 21,1% 15 73,3% 26,7% 6,7% 6,7% 6,7%
207 51,2% 14,0% 27,5% 9,2% 7,2% 1,4%242 51,2% 21,9% 7,0% 10,3% 4,5% 1,7%220 60,9% 21,4% 15,5% 14,5% 6,8% 1,8%170 51,2% 19,4% 18,2% 8,2% 11,2% 1,2%184 49,5% 12,5% 34,8% 11,4% 13,6% 1,6%816 53,4% 19,1% 17,9% 11,3% 8,6% 1,6%
SofiaRegional centerSmaller townVillage
Type of residence
MaleFemale
Gender
18-3031-4041-5051-6060+
Age
Finished bachelor, master or higherdegreeFinished collegeFinished secondary schoolFinished elementary and lower
Highest level ofeducation achieved
EmployeeOther status of employed personsBusiness ownerSelf-employed person in non-agriculturalactivitiesSelf-employed person in agriculturalactivitiesFamily helperRegistered as unemployedUnregistered unemployedRetired - due to ageRetired - other causesPupil, studentHousewifeAnother status of non working person
Main occupationalstatus in the present
BulgarianTurkishRomaOther
Ethnicity
No incomeLess than 100 BGN101-150 BGN151-200 BGN201-300 BGN301-500 BGNMore than 500 BGNDon't knowNA
Total householdincome
No incomeLess than 250 BGN251-500 BGN501-750 BGN751-1000 More than 1000 BGNDon't knowNA
Personal monthlyincome
I don't use financial servicesOneTwoThree and more
Financial servicesusage
Total
Base: Row %
Newspapers,magazines, TV
programs specializingon financial issues
Row %
Friends andacquaintances
Row %
Specializedweb sites
Row %Advertising
Row %
Bank officers,employees ofinsurance andmanagement
companies, during apersonal visit or by
phoneRow %
Independentfinancial
consultants orbrokers
What are the two main sources of information:
Those who follow at least one of the tendencies
126
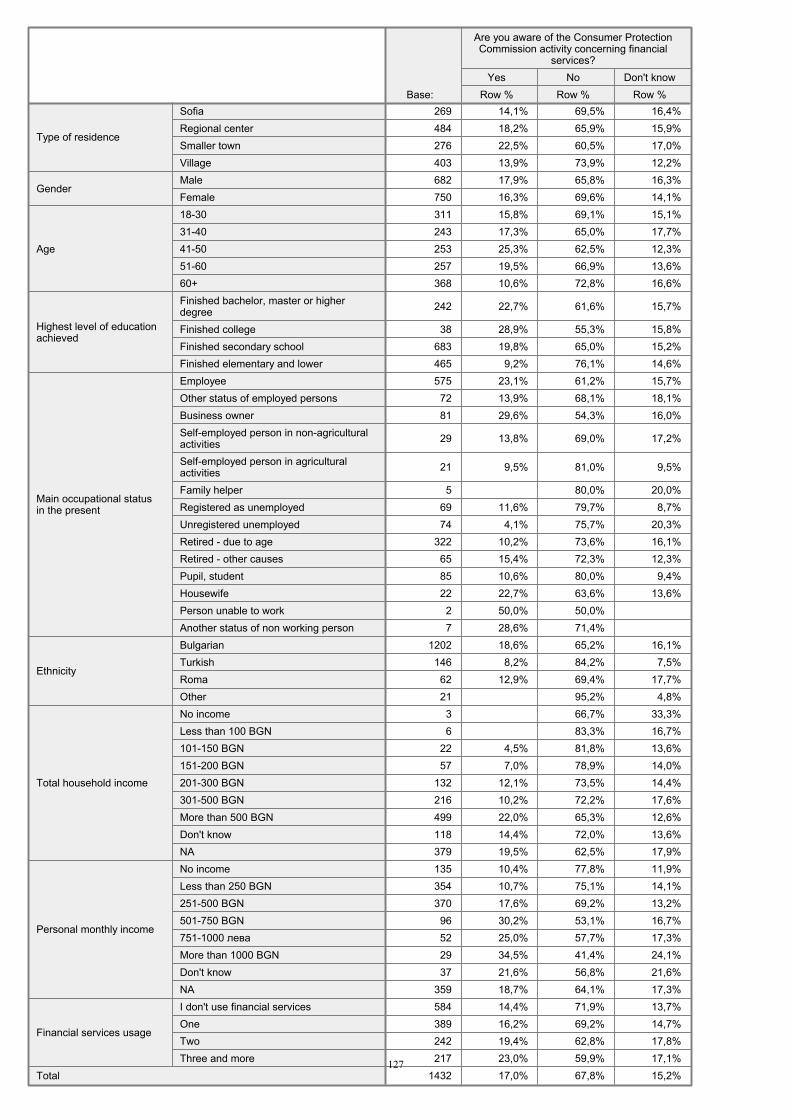
269 14,1% 69,5% 16,4%484 18,2% 65,9% 15,9%276 22,5% 60,5% 17,0%403 13,9% 73,9% 12,2%682 17,9% 65,8% 16,3%750 16,3% 69,6% 14,1%311 15,8% 69,1% 15,1%243 17,3% 65,0% 17,7%253 25,3% 62,5% 12,3%257 19,5% 66,9% 13,6%368 10,6% 72,8% 16,6%
242 22,7% 61,6% 15,7%
38 28,9% 55,3% 15,8%683 19,8% 65,0% 15,2%465 9,2% 76,1% 14,6%575 23,1% 61,2% 15,7%72 13,9% 68,1% 18,1%81 29,6% 54,3% 16,0%
29 13,8% 69,0% 17,2%
21 9,5% 81,0% 9,5%
5 80,0% 20,0%69 11,6% 79,7% 8,7%74 4,1% 75,7% 20,3%
322 10,2% 73,6% 16,1%65 15,4% 72,3% 12,3%85 10,6% 80,0% 9,4%22 22,7% 63,6% 13,6%2 50,0% 50,0% 7 28,6% 71,4%
1202 18,6% 65,2% 16,1%146 8,2% 84,2% 7,5%62 12,9% 69,4% 17,7%21 95,2% 4,8%3 66,7% 33,3%6 83,3% 16,7%
22 4,5% 81,8% 13,6%57 7,0% 78,9% 14,0%
132 12,1% 73,5% 14,4%216 10,2% 72,2% 17,6%499 22,0% 65,3% 12,6%118 14,4% 72,0% 13,6%379 19,5% 62,5% 17,9%135 10,4% 77,8% 11,9%354 10,7% 75,1% 14,1%370 17,6% 69,2% 13,2%96 30,2% 53,1% 16,7%52 25,0% 57,7% 17,3%29 34,5% 41,4% 24,1%37 21,6% 56,8% 21,6%
359 18,7% 64,1% 17,3%584 14,4% 71,9% 13,7%389 16,2% 69,2% 14,7%242 19,4% 62,8% 17,8%217 23,0% 59,9% 17,1%
1432 17,0% 67,8% 15,2%
SofiaRegional centerSmaller townVillage
Type of residence
MaleFemale
Gender
18-3031-4041-5051-6060+
Age
Finished bachelor, master or higherdegreeFinished collegeFinished secondary schoolFinished elementary and lower
Highest level of educationachieved
EmployeeOther status of employed personsBusiness ownerSelf-employed person in non-agriculturalactivitiesSelf-employed person in agriculturalactivitiesFamily helperRegistered as unemployedUnregistered unemployedRetired - due to ageRetired - other causesPupil, studentHousewifePerson unable to workAnother status of non working person
Main occupational statusin the present
BulgarianTurkishRomaOther
Ethnicity
No incomeLess than 100 BGN101-150 BGN151-200 BGN201-300 BGN301-500 BGNMore than 500 BGNDon't knowNA
Total household income
No incomeLess than 250 BGN251-500 BGN501-750 BGN751-1000 More than 1000 BGNDon't knowNA
Personal monthly income
I don't use financial servicesOneTwoThree and more
Financial services usage
Total
Base: Row %Yes
Row %No
Row %Don't know
Are you aware of the Consumer ProtectionCommission activity concerning financial
services?
127
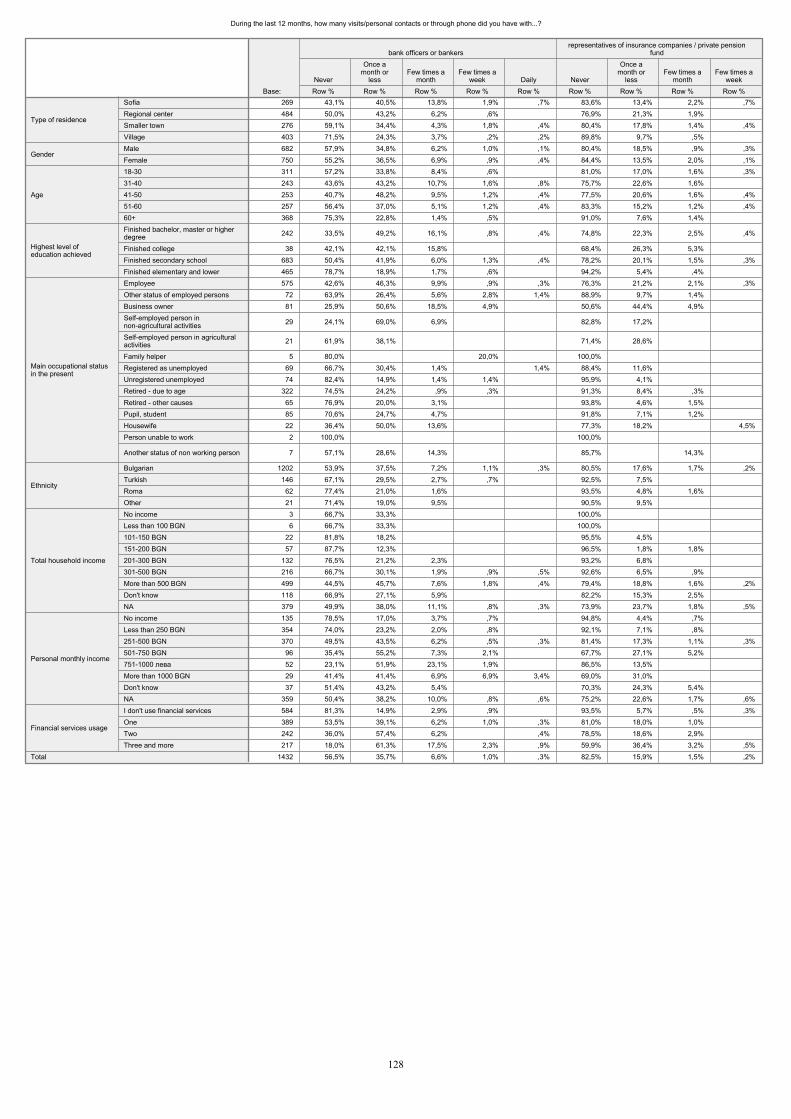
During the last 12 months, how many visits/personal contacts or through phone did you have with...?
269 43,1% 40,5% 13,8% 1,9% ,7% 83,6% 13,4% 2,2% ,7%484 50,0% 43,2% 6,2% ,6% 76,9% 21,3% 1,9% 276 59,1% 34,4% 4,3% 1,8% ,4% 80,4% 17,8% 1,4% ,4%403 71,5% 24,3% 3,7% ,2% ,2% 89,8% 9,7% ,5% 682 57,9% 34,8% 6,2% 1,0% ,1% 80,4% 18,5% ,9% ,3%750 55,2% 36,5% 6,9% ,9% ,4% 84,4% 13,5% 2,0% ,1%311 57,2% 33,8% 8,4% ,6% 81,0% 17,0% 1,6% ,3%243 43,6% 43,2% 10,7% 1,6% ,8% 75,7% 22,6% 1,6% 253 40,7% 48,2% 9,5% 1,2% ,4% 77,5% 20,6% 1,6% ,4%257 56,4% 37,0% 5,1% 1,2% ,4% 83,3% 15,2% 1,2% ,4%368 75,3% 22,8% 1,4% ,5% 91,0% 7,6% 1,4%
242 33,5% 49,2% 16,1% ,8% ,4% 74,8% 22,3% 2,5% ,4%
38 42,1% 42,1% 15,8% 68,4% 26,3% 5,3% 683 50,4% 41,9% 6,0% 1,3% ,4% 78,2% 20,1% 1,5% ,3%465 78,7% 18,9% 1,7% ,6% 94,2% 5,4% ,4% 575 42,6% 46,3% 9,9% ,9% ,3% 76,3% 21,2% 2,1% ,3%72 63,9% 26,4% 5,6% 2,8% 1,4% 88,9% 9,7% 1,4% 81 25,9% 50,6% 18,5% 4,9% 50,6% 44,4% 4,9%
29 24,1% 69,0% 6,9% 82,8% 17,2%
21 61,9% 38,1% 71,4% 28,6%
5 80,0% 20,0% 100,0% 69 66,7% 30,4% 1,4% 1,4% 88,4% 11,6% 74 82,4% 14,9% 1,4% 1,4% 95,9% 4,1%
322 74,5% 24,2% ,9% ,3% 91,3% 8,4% ,3% 65 76,9% 20,0% 3,1% 93,8% 4,6% 1,5% 85 70,6% 24,7% 4,7% 91,8% 7,1% 1,2% 22 36,4% 50,0% 13,6% 77,3% 18,2% 4,5%2 100,0% 100,0%
7 57,1% 28,6% 14,3% 85,7% 14,3%
1202 53,9% 37,5% 7,2% 1,1% ,3% 80,5% 17,6% 1,7% ,2%146 67,1% 29,5% 2,7% ,7% 92,5% 7,5% 62 77,4% 21,0% 1,6% 93,5% 4,8% 1,6% 21 71,4% 19,0% 9,5% 90,5% 9,5% 3 66,7% 33,3% 100,0% 6 66,7% 33,3% 100,0%
22 81,8% 18,2% 95,5% 4,5% 57 87,7% 12,3% 96,5% 1,8% 1,8%
132 76,5% 21,2% 2,3% 93,2% 6,8% 216 66,7% 30,1% 1,9% ,9% ,5% 92,6% 6,5% ,9% 499 44,5% 45,7% 7,6% 1,8% ,4% 79,4% 18,8% 1,6% ,2%118 66,9% 27,1% 5,9% 82,2% 15,3% 2,5% 379 49,9% 38,0% 11,1% ,8% ,3% 73,9% 23,7% 1,8% ,5%135 78,5% 17,0% 3,7% ,7% 94,8% 4,4% ,7% 354 74,0% 23,2% 2,0% ,8% 92,1% 7,1% ,8% 370 49,5% 43,5% 6,2% ,5% ,3% 81,4% 17,3% 1,1% ,3%96 35,4% 55,2% 7,3% 2,1% 67,7% 27,1% 5,2% 52 23,1% 51,9% 23,1% 1,9% 86,5% 13,5% 29 41,4% 41,4% 6,9% 6,9% 3,4% 69,0% 31,0% 37 51,4% 43,2% 5,4% 70,3% 24,3% 5,4%
359 50,4% 38,2% 10,0% ,8% ,6% 75,2% 22,6% 1,7% ,6%584 81,3% 14,9% 2,9% ,9% 93,5% 5,7% ,5% ,3%389 53,5% 39,1% 6,2% 1,0% ,3% 81,0% 18,0% 1,0% 242 36,0% 57,4% 6,2% ,4% 78,5% 18,6% 2,9% 217 18,0% 61,3% 17,5% 2,3% ,9% 59,9% 36,4% 3,2% ,5%
1432 56,5% 35,7% 6,6% 1,0% ,3% 82,5% 15,9% 1,5% ,2%
SofiaRegional centerSmaller townVillage
Type of residence
MaleFemale
Gender
18-3031-4041-5051-6060+
Age
Finished bachelor, master or higherdegreeFinished collegeFinished secondary schoolFinished elementary and lower
Highest level ofeducation achieved
EmployeeOther status of employed personsBusiness ownerSelf-employed person innon-agricultural activitiesSelf-employed person in agriculturalactivitiesFamily helperRegistered as unemployedUnregistered unemployedRetired - due to ageRetired - other causesPupil, studentHousewifePerson unable to work
Another status of non working person
Main occupational statusin the present
BulgarianTurkishRomaOther
Ethnicity
No incomeLess than 100 BGN101-150 BGN151-200 BGN201-300 BGN301-500 BGNMore than 500 BGNDon't knowNA
Total household income
No incomeLess than 250 BGN251-500 BGN501-750 BGN751-1000 More than 1000 BGNDon't knowNA
Personal monthly income
I don't use financial servicesOneTwoThree and more
Financial services usage
Total
Base: Row %Never
Row %
Once amonth or
lessRow %
Few times amonth
Row %
Few times aweek
Row %Daily
bank officers or bankers
Row %Never
Row %
Once amonth or
lessRow %
Few times amonth
Row %
Few times aweek
representatives of insurance companies / private pensionfund
128
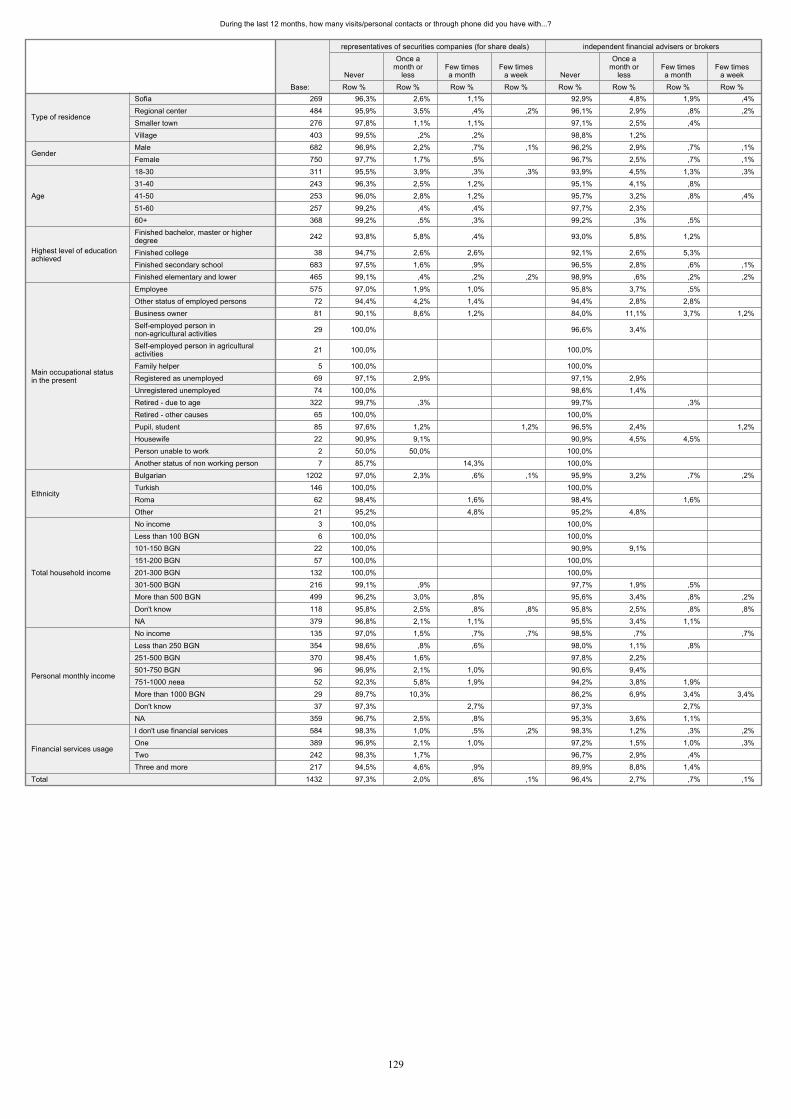
During the last 12 months, how many visits/personal contacts or through phone did you have with...?
269 96,3% 2,6% 1,1% 92,9% 4,8% 1,9% ,4%484 95,9% 3,5% ,4% ,2% 96,1% 2,9% ,8% ,2%276 97,8% 1,1% 1,1% 97,1% 2,5% ,4% 403 99,5% ,2% ,2% 98,8% 1,2% 682 96,9% 2,2% ,7% ,1% 96,2% 2,9% ,7% ,1%750 97,7% 1,7% ,5% 96,7% 2,5% ,7% ,1%311 95,5% 3,9% ,3% ,3% 93,9% 4,5% 1,3% ,3%243 96,3% 2,5% 1,2% 95,1% 4,1% ,8% 253 96,0% 2,8% 1,2% 95,7% 3,2% ,8% ,4%257 99,2% ,4% ,4% 97,7% 2,3% 368 99,2% ,5% ,3% 99,2% ,3% ,5%
242 93,8% 5,8% ,4% 93,0% 5,8% 1,2%
38 94,7% 2,6% 2,6% 92,1% 2,6% 5,3% 683 97,5% 1,6% ,9% 96,5% 2,8% ,6% ,1%465 99,1% ,4% ,2% ,2% 98,9% ,6% ,2% ,2%575 97,0% 1,9% 1,0% 95,8% 3,7% ,5%
72 94,4% 4,2% 1,4% 94,4% 2,8% 2,8% 81 90,1% 8,6% 1,2% 84,0% 11,1% 3,7% 1,2%
29 100,0% 96,6% 3,4%
21 100,0% 100,0%
5 100,0% 100,0% 69 97,1% 2,9% 97,1% 2,9% 74 100,0% 98,6% 1,4%
322 99,7% ,3% 99,7% ,3% 65 100,0% 100,0% 85 97,6% 1,2% 1,2% 96,5% 2,4% 1,2%22 90,9% 9,1% 90,9% 4,5% 4,5%
2 50,0% 50,0% 100,0% 7 85,7% 14,3% 100,0%
1202 97,0% 2,3% ,6% ,1% 95,9% 3,2% ,7% ,2%146 100,0% 100,0%
62 98,4% 1,6% 98,4% 1,6% 21 95,2% 4,8% 95,2% 4,8%
3 100,0% 100,0% 6 100,0% 100,0%
22 100,0% 90,9% 9,1% 57 100,0% 100,0%
132 100,0% 100,0% 216 99,1% ,9% 97,7% 1,9% ,5% 499 96,2% 3,0% ,8% 95,6% 3,4% ,8% ,2%118 95,8% 2,5% ,8% ,8% 95,8% 2,5% ,8% ,8%379 96,8% 2,1% 1,1% 95,5% 3,4% 1,1% 135 97,0% 1,5% ,7% ,7% 98,5% ,7% ,7%354 98,6% ,8% ,6% 98,0% 1,1% ,8% 370 98,4% 1,6% 97,8% 2,2%
96 96,9% 2,1% 1,0% 90,6% 9,4% 52 92,3% 5,8% 1,9% 94,2% 3,8% 1,9% 29 89,7% 10,3% 86,2% 6,9% 3,4% 3,4%37 97,3% 2,7% 97,3% 2,7%
359 96,7% 2,5% ,8% 95,3% 3,6% 1,1% 584 98,3% 1,0% ,5% ,2% 98,3% 1,2% ,3% ,2%389 96,9% 2,1% 1,0% 97,2% 1,5% 1,0% ,3%242 98,3% 1,7% 96,7% 2,9% ,4% 217 94,5% 4,6% ,9% 89,9% 8,8% 1,4%
1432 97,3% 2,0% ,6% ,1% 96,4% 2,7% ,7% ,1%
SofiaRegional centerSmaller townVillage
Type of residence
MaleFemale
Gender
18-3031-4041-5051-6060+
Age
Finished bachelor, master or higherdegreeFinished collegeFinished secondary schoolFinished elementary and lower
Highest level of educationachieved
EmployeeOther status of employed personsBusiness ownerSelf-employed person innon-agricultural activitiesSelf-employed person in agriculturalactivitiesFamily helperRegistered as unemployedUnregistered unemployedRetired - due to ageRetired - other causesPupil, studentHousewifePerson unable to workAnother status of non working person
Main occupational statusin the present
BulgarianTurkishRomaOther
Ethnicity
No incomeLess than 100 BGN101-150 BGN151-200 BGN201-300 BGN301-500 BGNMore than 500 BGNDon't knowNA
Total household income
No incomeLess than 250 BGN251-500 BGN501-750 BGN751-1000 More than 1000 BGNDon't knowNA
Personal monthly income
I don't use financial servicesOneTwoThree and more
Financial services usage
Total
Base: Row %Never
Row %
Once amonth or
lessRow %
Few timesa month
Row %
Few timesa week
representatives of securities companies (for share deals)
Row %Never
Row %
Once amonth or
lessRow %
Few timesa month
Row %
Few timesa week
independent financial advisers or brokers
129
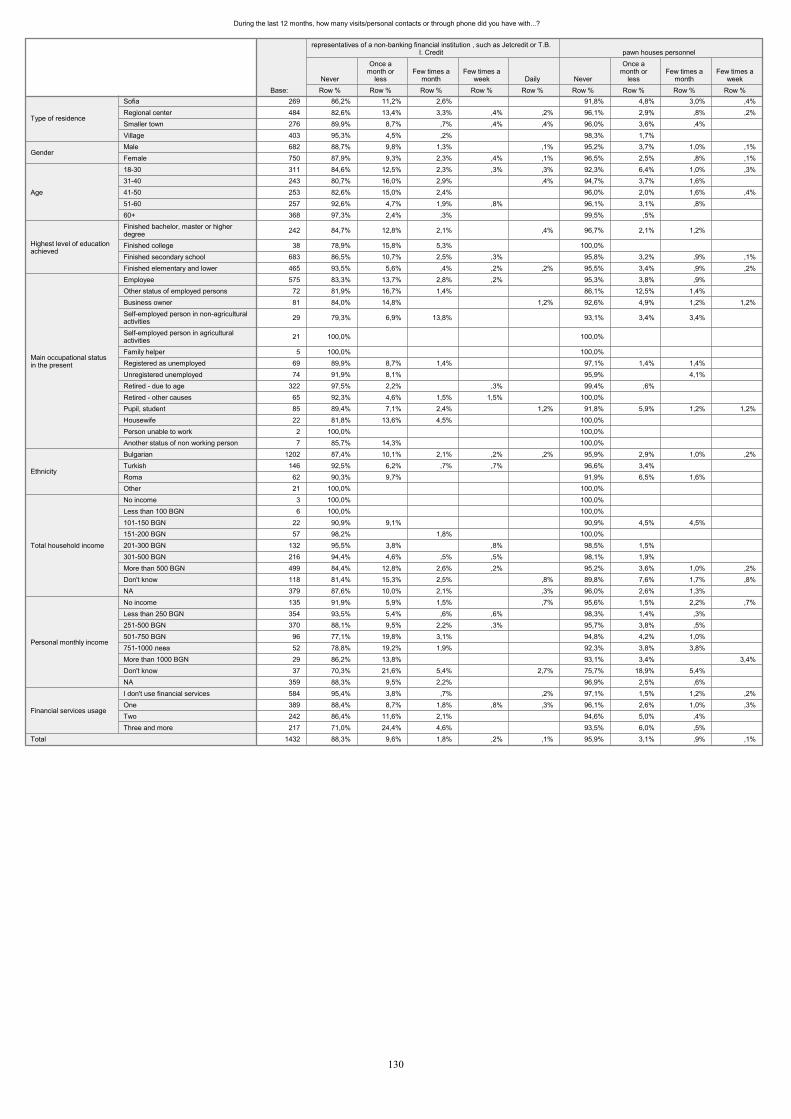
During the last 12 months, how many visits/personal contacts or through phone did you have with...?
269 86,2% 11,2% 2,6% 91,8% 4,8% 3,0% ,4%484 82,6% 13,4% 3,3% ,4% ,2% 96,1% 2,9% ,8% ,2%276 89,9% 8,7% ,7% ,4% ,4% 96,0% 3,6% ,4% 403 95,3% 4,5% ,2% 98,3% 1,7% 682 88,7% 9,8% 1,3% ,1% 95,2% 3,7% 1,0% ,1%750 87,9% 9,3% 2,3% ,4% ,1% 96,5% 2,5% ,8% ,1%311 84,6% 12,5% 2,3% ,3% ,3% 92,3% 6,4% 1,0% ,3%243 80,7% 16,0% 2,9% ,4% 94,7% 3,7% 1,6% 253 82,6% 15,0% 2,4% 96,0% 2,0% 1,6% ,4%257 92,6% 4,7% 1,9% ,8% 96,1% 3,1% ,8% 368 97,3% 2,4% ,3% 99,5% ,5%
242 84,7% 12,8% 2,1% ,4% 96,7% 2,1% 1,2%
38 78,9% 15,8% 5,3% 100,0% 683 86,5% 10,7% 2,5% ,3% 95,8% 3,2% ,9% ,1%465 93,5% 5,6% ,4% ,2% ,2% 95,5% 3,4% ,9% ,2%575 83,3% 13,7% 2,8% ,2% 95,3% 3,8% ,9% 72 81,9% 16,7% 1,4% 86,1% 12,5% 1,4% 81 84,0% 14,8% 1,2% 92,6% 4,9% 1,2% 1,2%
29 79,3% 6,9% 13,8% 93,1% 3,4% 3,4%
21 100,0% 100,0%
5 100,0% 100,0% 69 89,9% 8,7% 1,4% 97,1% 1,4% 1,4% 74 91,9% 8,1% 95,9% 4,1%
322 97,5% 2,2% ,3% 99,4% ,6% 65 92,3% 4,6% 1,5% 1,5% 100,0% 85 89,4% 7,1% 2,4% 1,2% 91,8% 5,9% 1,2% 1,2%22 81,8% 13,6% 4,5% 100,0% 2 100,0% 100,0% 7 85,7% 14,3% 100,0%
1202 87,4% 10,1% 2,1% ,2% ,2% 95,9% 2,9% 1,0% ,2%146 92,5% 6,2% ,7% ,7% 96,6% 3,4% 62 90,3% 9,7% 91,9% 6,5% 1,6% 21 100,0% 100,0% 3 100,0% 100,0% 6 100,0% 100,0%
22 90,9% 9,1% 90,9% 4,5% 4,5% 57 98,2% 1,8% 100,0%
132 95,5% 3,8% ,8% 98,5% 1,5% 216 94,4% 4,6% ,5% ,5% 98,1% 1,9% 499 84,4% 12,8% 2,6% ,2% 95,2% 3,6% 1,0% ,2%118 81,4% 15,3% 2,5% ,8% 89,8% 7,6% 1,7% ,8%379 87,6% 10,0% 2,1% ,3% 96,0% 2,6% 1,3% 135 91,9% 5,9% 1,5% ,7% 95,6% 1,5% 2,2% ,7%354 93,5% 5,4% ,6% ,6% 98,3% 1,4% ,3% 370 88,1% 9,5% 2,2% ,3% 95,7% 3,8% ,5% 96 77,1% 19,8% 3,1% 94,8% 4,2% 1,0% 52 78,8% 19,2% 1,9% 92,3% 3,8% 3,8% 29 86,2% 13,8% 93,1% 3,4% 3,4%37 70,3% 21,6% 5,4% 2,7% 75,7% 18,9% 5,4%
359 88,3% 9,5% 2,2% 96,9% 2,5% ,6% 584 95,4% 3,8% ,7% ,2% 97,1% 1,5% 1,2% ,2%389 88,4% 8,7% 1,8% ,8% ,3% 96,1% 2,6% 1,0% ,3%242 86,4% 11,6% 2,1% 94,6% 5,0% ,4% 217 71,0% 24,4% 4,6% 93,5% 6,0% ,5%
1432 88,3% 9,6% 1,8% ,2% ,1% 95,9% 3,1% ,9% ,1%
SofiaRegional centerSmaller townVillage
Type of residence
MaleFemale
Gender
18-3031-4041-5051-6060+
Age
Finished bachelor, master or higherdegreeFinished collegeFinished secondary schoolFinished elementary and lower
Highest level of educationachieved
EmployeeOther status of employed personsBusiness ownerSelf-employed person in non-agriculturalactivitiesSelf-employed person in agriculturalactivitiesFamily helperRegistered as unemployedUnregistered unemployedRetired - due to ageRetired - other causesPupil, studentHousewifePerson unable to workAnother status of non working person
Main occupational statusin the present
BulgarianTurkishRomaOther
Ethnicity
No incomeLess than 100 BGN101-150 BGN151-200 BGN201-300 BGN301-500 BGNMore than 500 BGNDon't knowNA
Total household income
No incomeLess than 250 BGN251-500 BGN501-750 BGN751-1000 More than 1000 BGNDon't knowNA
Personal monthly income
I don't use financial servicesOneTwoThree and more
Financial services usage
Total
Base: Row %Never
Row %
Once amonth or
lessRow %
Few times amonth
Row %
Few times aweek
Row %Daily
representatives of a non-banking financial institution , such as Jetcredit or T.B.I. Credit
Row %Never
Row %
Once amonth or
lessRow %
Few times amonth
Row %
Few times aweek
pawn houses personnel
130
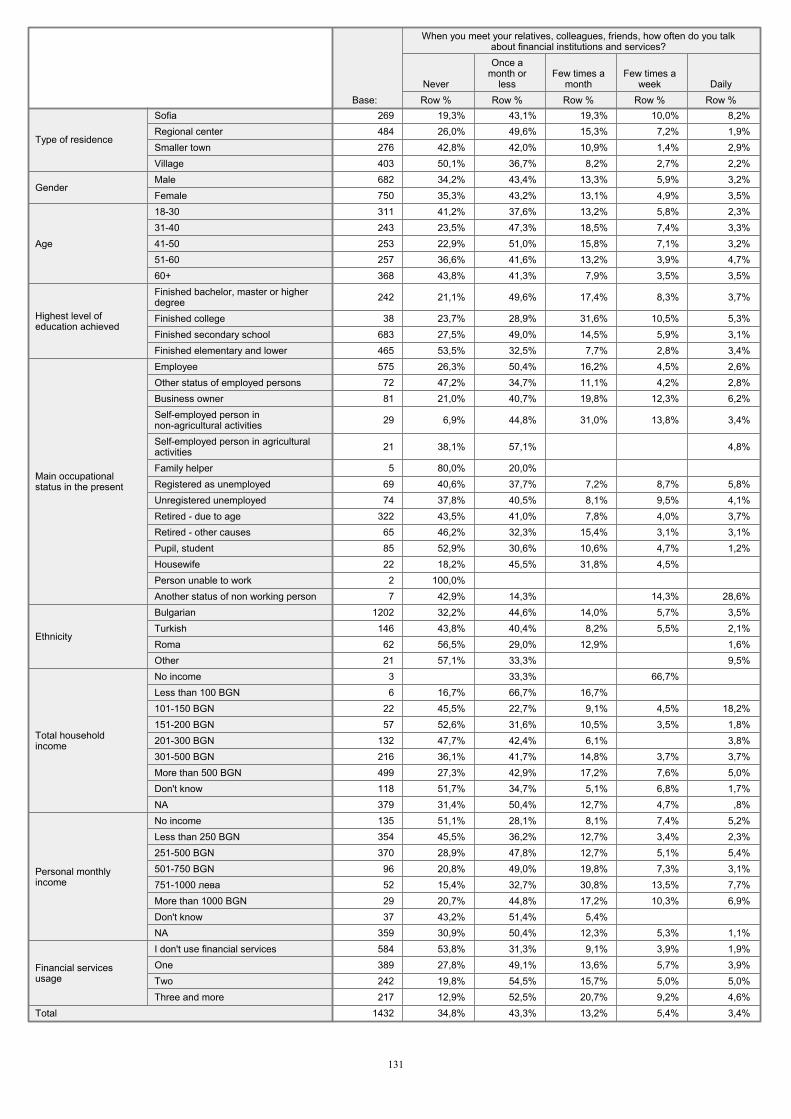
269 19,3% 43,1% 19,3% 10,0% 8,2%484 26,0% 49,6% 15,3% 7,2% 1,9%276 42,8% 42,0% 10,9% 1,4% 2,9%403 50,1% 36,7% 8,2% 2,7% 2,2%682 34,2% 43,4% 13,3% 5,9% 3,2%750 35,3% 43,2% 13,1% 4,9% 3,5%311 41,2% 37,6% 13,2% 5,8% 2,3%243 23,5% 47,3% 18,5% 7,4% 3,3%253 22,9% 51,0% 15,8% 7,1% 3,2%257 36,6% 41,6% 13,2% 3,9% 4,7%368 43,8% 41,3% 7,9% 3,5% 3,5%
242 21,1% 49,6% 17,4% 8,3% 3,7%
38 23,7% 28,9% 31,6% 10,5% 5,3%683 27,5% 49,0% 14,5% 5,9% 3,1%465 53,5% 32,5% 7,7% 2,8% 3,4%575 26,3% 50,4% 16,2% 4,5% 2,6%72 47,2% 34,7% 11,1% 4,2% 2,8%81 21,0% 40,7% 19,8% 12,3% 6,2%
29 6,9% 44,8% 31,0% 13,8% 3,4%
21 38,1% 57,1% 4,8%
5 80,0% 20,0% 69 40,6% 37,7% 7,2% 8,7% 5,8%74 37,8% 40,5% 8,1% 9,5% 4,1%
322 43,5% 41,0% 7,8% 4,0% 3,7%65 46,2% 32,3% 15,4% 3,1% 3,1%85 52,9% 30,6% 10,6% 4,7% 1,2%22 18,2% 45,5% 31,8% 4,5% 2 100,0% 7 42,9% 14,3% 14,3% 28,6%
1202 32,2% 44,6% 14,0% 5,7% 3,5%146 43,8% 40,4% 8,2% 5,5% 2,1%62 56,5% 29,0% 12,9% 1,6%21 57,1% 33,3% 9,5%3 33,3% 66,7% 6 16,7% 66,7% 16,7%
22 45,5% 22,7% 9,1% 4,5% 18,2%57 52,6% 31,6% 10,5% 3,5% 1,8%
132 47,7% 42,4% 6,1% 3,8%216 36,1% 41,7% 14,8% 3,7% 3,7%499 27,3% 42,9% 17,2% 7,6% 5,0%118 51,7% 34,7% 5,1% 6,8% 1,7%379 31,4% 50,4% 12,7% 4,7% ,8%135 51,1% 28,1% 8,1% 7,4% 5,2%354 45,5% 36,2% 12,7% 3,4% 2,3%370 28,9% 47,8% 12,7% 5,1% 5,4%96 20,8% 49,0% 19,8% 7,3% 3,1%52 15,4% 32,7% 30,8% 13,5% 7,7%29 20,7% 44,8% 17,2% 10,3% 6,9%37 43,2% 51,4% 5,4%
359 30,9% 50,4% 12,3% 5,3% 1,1%584 53,8% 31,3% 9,1% 3,9% 1,9%389 27,8% 49,1% 13,6% 5,7% 3,9%242 19,8% 54,5% 15,7% 5,0% 5,0%217 12,9% 52,5% 20,7% 9,2% 4,6%
1432 34,8% 43,3% 13,2% 5,4% 3,4%
SofiaRegional centerSmaller townVillage
Type of residence
MaleFemale
Gender
18-3031-4041-5051-6060+
Age
Finished bachelor, master or higherdegreeFinished collegeFinished secondary schoolFinished elementary and lower
Highest level ofeducation achieved
EmployeeOther status of employed personsBusiness ownerSelf-employed person innon-agricultural activitiesSelf-employed person in agriculturalactivitiesFamily helperRegistered as unemployedUnregistered unemployedRetired - due to ageRetired - other causesPupil, studentHousewifePerson unable to workAnother status of non working person
Main occupationalstatus in the present
BulgarianTurkishRomaOther
Ethnicity
No incomeLess than 100 BGN101-150 BGN151-200 BGN201-300 BGN301-500 BGNMore than 500 BGNDon't knowNA
Total householdincome
No incomeLess than 250 BGN251-500 BGN501-750 BGN751-1000 More than 1000 BGNDon't knowNA
Personal monthlyincome
I don't use financial servicesOneTwoThree and more
Financial servicesusage
Total
Base: Row %Never
Row %
Once amonth or
lessRow %
Few times amonth
Row %
Few times aweek
Row %Daily
When you meet your relatives, colleagues, friends, how often do you talkabout financial institutions and services?
131
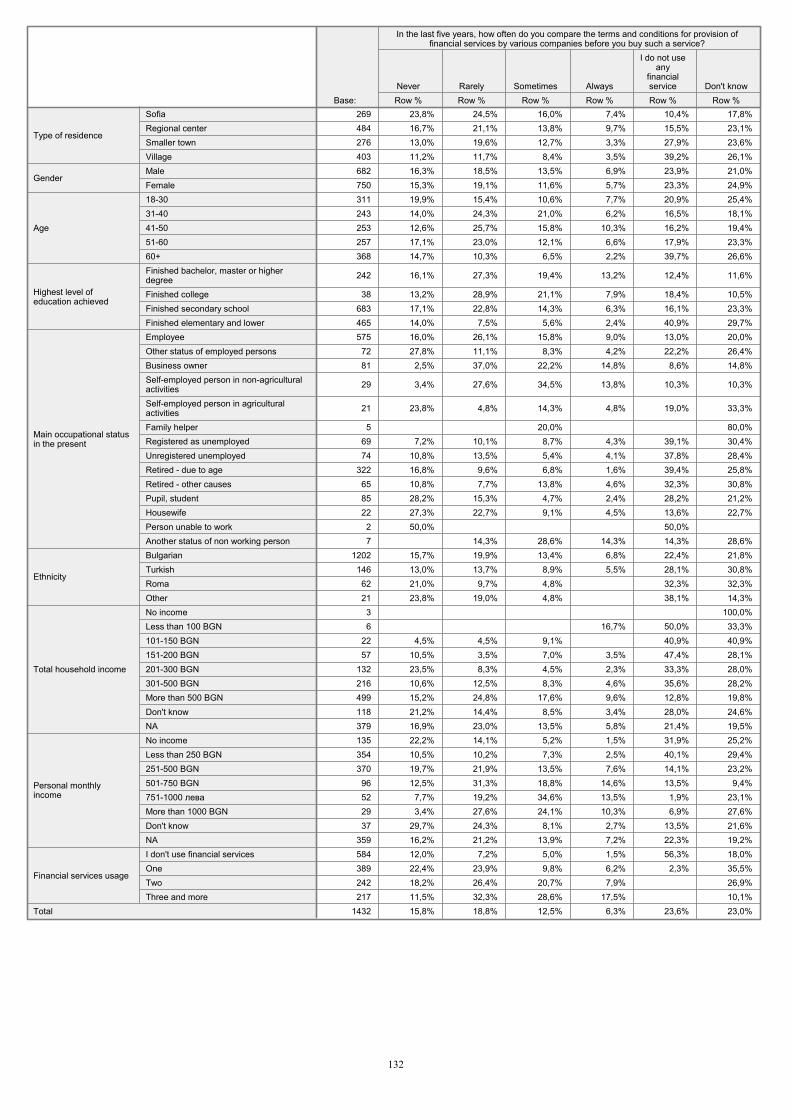
269 23,8% 24,5% 16,0% 7,4% 10,4% 17,8%484 16,7% 21,1% 13,8% 9,7% 15,5% 23,1%276 13,0% 19,6% 12,7% 3,3% 27,9% 23,6%403 11,2% 11,7% 8,4% 3,5% 39,2% 26,1%682 16,3% 18,5% 13,5% 6,9% 23,9% 21,0%750 15,3% 19,1% 11,6% 5,7% 23,3% 24,9%311 19,9% 15,4% 10,6% 7,7% 20,9% 25,4%243 14,0% 24,3% 21,0% 6,2% 16,5% 18,1%253 12,6% 25,7% 15,8% 10,3% 16,2% 19,4%257 17,1% 23,0% 12,1% 6,6% 17,9% 23,3%368 14,7% 10,3% 6,5% 2,2% 39,7% 26,6%
242 16,1% 27,3% 19,4% 13,2% 12,4% 11,6%
38 13,2% 28,9% 21,1% 7,9% 18,4% 10,5%683 17,1% 22,8% 14,3% 6,3% 16,1% 23,3%465 14,0% 7,5% 5,6% 2,4% 40,9% 29,7%575 16,0% 26,1% 15,8% 9,0% 13,0% 20,0%
72 27,8% 11,1% 8,3% 4,2% 22,2% 26,4%81 2,5% 37,0% 22,2% 14,8% 8,6% 14,8%
29 3,4% 27,6% 34,5% 13,8% 10,3% 10,3%
21 23,8% 4,8% 14,3% 4,8% 19,0% 33,3%
5 20,0% 80,0%69 7,2% 10,1% 8,7% 4,3% 39,1% 30,4%74 10,8% 13,5% 5,4% 4,1% 37,8% 28,4%
322 16,8% 9,6% 6,8% 1,6% 39,4% 25,8%65 10,8% 7,7% 13,8% 4,6% 32,3% 30,8%85 28,2% 15,3% 4,7% 2,4% 28,2% 21,2%22 27,3% 22,7% 9,1% 4,5% 13,6% 22,7%
2 50,0% 50,0% 7 14,3% 28,6% 14,3% 14,3% 28,6%
1202 15,7% 19,9% 13,4% 6,8% 22,4% 21,8%146 13,0% 13,7% 8,9% 5,5% 28,1% 30,8%
62 21,0% 9,7% 4,8% 32,3% 32,3%21 23,8% 19,0% 4,8% 38,1% 14,3%
3 100,0%6 16,7% 50,0% 33,3%
22 4,5% 4,5% 9,1% 40,9% 40,9%57 10,5% 3,5% 7,0% 3,5% 47,4% 28,1%
132 23,5% 8,3% 4,5% 2,3% 33,3% 28,0%216 10,6% 12,5% 8,3% 4,6% 35,6% 28,2%499 15,2% 24,8% 17,6% 9,6% 12,8% 19,8%118 21,2% 14,4% 8,5% 3,4% 28,0% 24,6%379 16,9% 23,0% 13,5% 5,8% 21,4% 19,5%135 22,2% 14,1% 5,2% 1,5% 31,9% 25,2%354 10,5% 10,2% 7,3% 2,5% 40,1% 29,4%370 19,7% 21,9% 13,5% 7,6% 14,1% 23,2%
96 12,5% 31,3% 18,8% 14,6% 13,5% 9,4%52 7,7% 19,2% 34,6% 13,5% 1,9% 23,1%29 3,4% 27,6% 24,1% 10,3% 6,9% 27,6%37 29,7% 24,3% 8,1% 2,7% 13,5% 21,6%
359 16,2% 21,2% 13,9% 7,2% 22,3% 19,2%584 12,0% 7,2% 5,0% 1,5% 56,3% 18,0%389 22,4% 23,9% 9,8% 6,2% 2,3% 35,5%242 18,2% 26,4% 20,7% 7,9% 26,9%217 11,5% 32,3% 28,6% 17,5% 10,1%
1432 15,8% 18,8% 12,5% 6,3% 23,6% 23,0%
SofiaRegional centerSmaller townVillage
Type of residence
MaleFemale
Gender
18-3031-4041-5051-6060+
Age
Finished bachelor, master or higherdegreeFinished collegeFinished secondary schoolFinished elementary and lower
Highest level ofeducation achieved
EmployeeOther status of employed personsBusiness ownerSelf-employed person in non-agriculturalactivitiesSelf-employed person in agriculturalactivitiesFamily helperRegistered as unemployedUnregistered unemployedRetired - due to ageRetired - other causesPupil, studentHousewifePerson unable to workAnother status of non working person
Main occupational statusin the present
BulgarianTurkishRomaOther
Ethnicity
No incomeLess than 100 BGN101-150 BGN151-200 BGN201-300 BGN301-500 BGNMore than 500 BGNDon't knowNA
Total household income
No incomeLess than 250 BGN251-500 BGN501-750 BGN751-1000 More than 1000 BGNDon't knowNA
Personal monthlyincome
I don't use financial servicesOneTwoThree and more
Financial services usage
Total
Base: Row %Never
Row %Rarely
Row %Sometimes
Row %Always
Row %
I do not useany
financialservice
Row %Don't know
In the last five years, how often do you compare the terms and conditions for provision offinancial services by various companies before you buy such a service?
132

269 20,4% 40,1% 31,2% 21,2% 27,5% 10,0% 7,1% 4,8% 2,6% 4,1% 2,6% ,4% ,4%484 31,4% 31,8% 29,5% 16,1% 21,1% 6,0% 4,5% 3,5% 3,9% 1,2% ,8% 1,2% ,4% ,2%276 37,7% 30,8% 27,2% 19,9% 12,0% 5,8% 2,5% 2,9% 1,8% 2,5% ,7% ,7% ,7% ,4%403 52,1% 27,3% 12,7% 13,4% 3,0% 5,7% 1,2% 1,2% 1,5% ,7% 1,0% 1,0% 682 36,5% 32,1% 25,7% 17,4% 17,3% 6,0% 4,7% 2,9% 2,6% 1,5% ,9% 1,2% ,6% 750 36,3% 31,7% 23,7% 16,7% 13,7% 7,2% 2,8% 3,1% 2,5% 2,3% 1,5% ,7% ,4%311 39,5% 26,0% 20,9% 17,0% 24,8% 5,5% 3,9% 2,3% 2,9% 1,3% 2,9% 1,3% ,3%243 21,0% 37,4% 30,9% 17,7% 21,8% 5,8% 3,7% 2,1% 3,7% 2,9% ,8% 1,6% ,4% ,4%253 19,8% 37,9% 36,0% 22,5% 20,9% 5,9% 4,3% 5,1% 3,6% 2,0% 2,0% ,8% ,4%257 35,0% 37,0% 26,5% 16,7% 11,7% 7,8% 4,7% 3,1% 3,5% 3,1% ,8% ,4% 368 56,3% 25,5% 14,7% 13,0% 2,2% 7,9% 2,4% 2,7% ,3% ,8% ,3% ,8%
242 14,5% 39,3% 38,4% 16,9% 43,0% 7,0% 7,9% 5,0% 2,9% 4,5% 2,5% ,4% ,4%
38 26,3% 34,2% 36,8% 13,2% 26,3% 5,3% 7,9% 5,3% 2,6% 5,3% 683 29,4% 36,7% 27,7% 17,7% 14,1% 6,9% 4,2% 3,5% 3,8% 1,8% 1,5% ,9% ,6% ,1%465 59,1% 20,6% 12,0% 16,3% 2,2% 5,8% ,4% 1,1% ,6% ,4% ,2% 1,1% ,2%575 20,2% 37,9% 33,7% 19,5% 22,8% 7,1% 5,9% 3,1% 5,7% 2,8% 1,6% ,9% ,3%72 41,7% 37,5% 12,5% 18,1% 6,9% 4,2% 1,4% 1,4% 1,4% 1,4% 2,8% 81 12,3% 33,3% 43,2% 19,8% 33,3% 6,2% 7,4% 9,9% 6,2% 2,5% 1,2% 2,5%
29 6,9% 58,6% 55,2% 24,1% 37,9% 3,4% 6,9% 3,4% 3,4% 3,4%
21 33,3% 38,1% 19,0% 28,6% 9,5% 14,3% 4,8% 4,8% 4,8%
5 40,0% 20,0% 20,0% 20,0% 20,0% 69 53,6% 20,3% 18,8% 14,5% 2,9% 2,9% 1,4% 4,3% 2,9% 1,4% 74 51,4% 24,3% 16,2% 10,8% 9,5% 6,8% 1,4% 1,4% 1,4% 1,4%
322 57,5% 25,5% 14,0% 13,0% 2,2% 8,1% 2,2% 1,9% ,3% ,9% 65 56,9% 24,6% 10,8% 10,8% 4,6% 3,1% 1,5% 1,5% 1,5% 85 50,6% 24,7% 11,8% 17,6% 22,4% 8,2% 2,4% 1,2% 1,2% 1,2% 2,4% 22 40,9% 27,3% 22,7% 18,2% 27,3% 9,1% 4,5% 2 50,0% 50,0% 7 42,9% 14,3% 14,3% 28,6% 14,3%
1202 33,3% 32,6% 27,7% 17,3% 18,2% 6,7% 4,2% 3,4% 2,7% 2,1% 1,3% 1,1% ,3% ,2%146 47,3% 30,1% 8,2% 19,2% 7,5% 1,4% 1,4% 3,4% 1,4% ,7% 62 67,7% 24,2% 6,5% 12,9% 1,6% 1,6%21 47,6% 23,8% 19,0% 9,5% 9,5% 4,8% 3 33,3% 33,3% 66,7% 33,3% 6 16,7% 66,7% 16,7% 16,7% 16,7%
22 50,0% 22,7% 4,5% 22,7% 4,5% 9,1% 4,5% 57 66,7% 21,1% 5,3% 12,3% 3,5% 1,8% 1,8%
132 62,9% 18,9% 14,4% 13,6% 1,5% 1,5% 3,0% ,8% ,8% ,8% 216 46,3% 31,0% 14,8% 14,8% 4,6% 4,6% 2,3% 3,7% 2,8% ,9% 1,4% 1,9% 499 23,4% 38,5% 32,5% 18,8% 20,8% 8,2% 5,8% 3,4% 3,0% 2,6% 1,4% 1,4% ,2% ,2%118 50,0% 21,2% 20,3% 12,7% 11,0% 2,5% 1,7% 3,4% 1,7% ,8% 1,7% ,8%379 29,3% 33,2% 29,0% 19,0% 23,7% 9,0% 3,4% 3,2% 3,4% 3,2% 1,3% ,3% 135 52,6% 22,2% 12,6% 18,5% 12,6% 7,4% 2,2% 2,2% 1,5% 1,5% 1,5% 354 55,9% 26,0% 11,0% 14,7% 2,3% 5,1% 2,0% 1,7% ,6% ,6% 1,1% ,3% ,3%370 30,0% 38,9% 28,9% 19,7% 10,8% 6,2% 4,3% 1,9% 4,1% ,5% 1,4% 1,1% ,3% ,5%96 16,7% 39,6% 38,5% 14,6% 30,2% 9,4% 6,3% 5,2% 4,2% 3,1% 2,1% 2,1% 52 9,6% 36,5% 53,8% 17,3% 53,8% 13,5% 11,5% 1,9% 1,9% 7,7% 1,9% 1,9% 29 3,4% 48,3% 31,0% 13,8% 48,3% 3,4% 6,9% 10,3% 10,3% 3,4% 37 43,2% 10,8% 27,0% 8,1% 13,5% 2,7% 8,1% 2,7% 2,7%
359 28,7% 32,3% 29,5% 17,8% 22,3% 7,2% 3,6% 4,2% 3,6% 3,3% 1,7% ,3% 584 57,5% 20,4% 10,6% 12,5% 5,5% 7,5% 1,5% 1,9% 2,1% ,7% ,5% 1,2% ,2%389 32,1% 31,4% 27,0% 21,3% 13,6% 4,4% 3,1% 2,8% 1,0% 1,8% 1,0% 1,0% ,3% 242 18,6% 51,2% 33,5% 20,2% 17,4% 7,4% 5,0% 5,0% 5,8% 1,7% 1,2% ,4% ,4%217 6,9% 42,4% 48,4% 18,0% 43,3% 7,4% 9,2% 4,1% 3,2% 5,5% 3,2% ,5% 1,4% ,5%
1432 36,4% 31,9% 24,7% 17,0% 15,4% 6,6% 3,7% 3,0% 2,6% 1,9% 1,2% ,9% ,3% ,2%
SofiaRegional centerSmaller townVillage
Type of residence
MaleFemale
Gender
18-3031-4041-5051-6060+
Age
Finished bachelor, master or higherdegreeFinished collegeFinished secondary schoolFinished elementary and lower
Highest level ofeducation achieved
EmployeeOther status of employed personsBusiness ownerSelf-employed person in non-agriculturalactivitiesSelf-employed person in agriculturalactivitiesFamily helperRegistered as unemployedUnregistered unemployedRetired - due to ageRetired - other causesPupil, studentHousewifePerson unable to workAnother status of non working person
Main occupational statusin the present
BulgarianTurkishRomaOther
Ethnicity
No incomeLess than 100 BGN101-150 BGN151-200 BGN201-300 BGN301-500 BGNMore than 500 BGNDon't knowNA
Total household income
No incomeLess than 250 BGN251-500 BGN501-750 BGN751-1000 More than 1000 BGNDon't knowNA
Personal monthly income
I don't use financial servicesOneTwoThree and more
Financial services usage
Total
Base: Row %Don't know
Row %
Advice offriends and
relativesRow %
Informationmaterials of
financialcompanies on
their tariffRow %
Advertisements
Row %
Internetresources
Row %
Educationprograms
on the radioand
televisionRow %
Analyticalmaterials
published inmass media
Row %
Recommendations of
independentfinancial
consultants/brokers
Row %
Employer'sadvice
Row %
Consultantsworking for
providers of arequiredservice
Row %
Specializedinformationcenter/ call
centerRow %
I don't useno sources
Row %
Personalmeetings atthe financial
institutionRow %Other
In the last five years, what sources of information do you pay attention to when choosing a company to buy a service from?
269 39,8% 33,8% 30,1% 14,1% 21,2% 19,7% 11,9% 5,9% 10,8% 5,9% 2,6% ,4% ,4%484 37,4% 26,9% 29,8% 13,4% 16,3% 14,7% 5,2% 6,4% 6,2% 5,8% 2,5% ,4% ,4% 276 29,3% 24,6% 16,7% 21,4% 19,9% 18,8% 4,0% 8,0% 3,3% 5,1% 1,4% ,4% 403 18,6% 29,5% 6,9% 31,3% 17,4% 16,4% 4,0% 3,5% 1,0% 3,2% 1,5% ,2% ,2% 682 32,8% 27,4% 22,4% 19,2% 18,8% 17,6% 6,3% 6,5% 5,3% 5,6% 1,6% ,3% ,1% ,1% 750 29,3% 29,5% 19,5% 20,9% 17,7% 16,3% 5,5% 5,2% 4,8% 4,4% 2,4% ,4% ,1% ,1%311 30,2% 24,1% 37,9% 16,7% 19,6% 12,9% 6,4% 5,8% 8,7% 4,5% 1,6% 243 34,2% 26,7% 28,0% 11,1% 17,7% 15,2% 7,4% 4,1% 4,9% 4,5% 4,1% ,8% ,4% 253 42,3% 30,0% 24,9% 10,7% 22,9% 15,8% 3,2% 7,5% 6,3% 5,9% 2,0% ,4% ,4% 257 30,0% 31,9% 12,8% 19,5% 16,3% 23,0% 10,1% 8,2% 4,7% 8,2% 1,9% ,4% ,4% ,4%368 22,6% 29,9% 4,6% 35,9% 15,5% 17,9% 3,3% 4,1% 1,4% 2,7% 1,1% ,3%
242 40,9% 26,0% 50,4% 6,6% 14,9% 17,8% 11,6% 5,8% 9,5% 6,6% ,8% ,4%
38 36,8% 36,8% 23,7% 10,5% 15,8% 10,5% 18,4% 7,9% 10,5% 10,5% 683 34,7% 30,0% 20,6% 14,8% 19,6% 17,6% 5,9% 8,2% 5,3% 6,0% 3,2% ,3% ,1% 465 20,0% 26,7% 5,6% 35,7% 18,3% 15,9% 1,7% 1,9% 1,7% 2,2% 1,1% ,6% ,2% ,2%575 37,7% 28,9% 29,0% 9,4% 19,5% 18,8% 7,3% 7,5% 5,4% 6,8% 3,5% ,2% ,2% 72 15,3% 31,9% 8,3% 27,8% 20,8% 12,5% 4,2% 4,2% 5,6% 4,2% 1,4% 1,4% 1,4%81 44,4% 19,8% 43,2% 8,6% 18,5% 11,1% 8,6% 14,8% 7,4% 4,9% 1,2%
29 58,6% 44,8% 37,9% 31,0% 20,7% 10,3% 6,9% 17,2% 6,9%
21 33,3% 33,3% 9,5% 28,6% 19,0% 14,3% 4,8%
5 40,0% 20,0% 20,0% 20,0% 69 26,1% 30,4% 5,8% 21,7% 13,0% 13,0% 2,9% 4,3% 1,4% 10,1% 74 18,9% 24,3% 10,8% 33,8% 18,9% 18,9% 5,4% 6,8% 5,4% 2,7%
322 21,4% 28,9% 3,7% 38,8% 14,6% 18,6% 3,4% 2,8% 1,2% 1,9% 1,2% ,3% 65 26,2% 32,3% 7,7% 24,6% 16,9% 13,8% 4,6% 4,6% 6,2% 3,1% 3,1% 85 30,6% 22,4% 48,2% 15,3% 20,0% 11,8% 5,9% 2,4% 12,9% 5,9% 1,2% 22 27,3% 27,3% 27,3% 18,2% 27,3% 13,6% 9,1% 4,5% 9,1% 13,6% 4,5% 2 50,0% 50,0% 7 28,6% 57,1% 28,6% 14,3% 28,6% 14,3%
1202 34,3% 29,1% 23,8% 17,9% 18,5% 15,9% 6,4% 6,5% 5,8% 5,5% 2,2% ,2% ,2% ,1%146 14,4% 28,1% 4,8% 26,0% 16,4% 26,7% 4,1% 2,7% 2,7% 1,4% 1,4% ,7% 62 9,7% 17,7% 4,8% 46,8% 21,0% 11,3% 1,6% 21 19,0% 28,6% 14,3% 28,6% 9,5% 23,8% 4,8% 4,8% 9,5% 3 66,7% 33,3% 33,3% 33,3% 6 33,3% 50,0% 16,7% 16,7% 33,3% 16,7%
22 22,7% 22,7% 9,1% 31,8% 13,6% 13,6% 4,5% 57 8,8% 35,1% 1,8% 42,1% 19,3% 14,0% 1,8% 1,8% 3,5%
132 23,5% 27,3% 4,5% 40,9% 12,1% 12,1% 3,0% 2,3% 2,3% ,8% 216 21,3% 32,9% 9,7% 26,9% 13,0% 18,5% 4,6% 6,5% 3,7% 3,2% 3,2% ,5% 499 36,9% 28,3% 25,9% 11,4% 20,4% 19,4% 7,2% 7,6% 6,6% 5,8% 1,8% ,4% ,2% 118 29,7% 22,9% 24,6% 19,5% 26,3% 14,4% 5,9% 5,9% 7,6% 4,2% 379 35,4% 27,7% 29,0% 16,9% 17,9% 15,6% 6,6% 5,3% 5,5% 7,7% 2,6% ,3% ,3%135 26,7% 24,4% 28,1% 20,0% 22,2% 17,0% 5,9% 5,9% 8,1% 5,9% 2,2% 354 18,6% 29,4% 4,0% 36,4% 15,0% 15,3% 4,0% 2,5% 1,1% ,8% 1,4% ,8% ,3% 370 33,5% 30,8% 17,3% 14,6% 20,8% 21,6% 6,2% 6,5% 4,6% 4,6% 2,4% ,3% ,3% 96 45,8% 29,2% 32,3% 4,2% 21,9% 15,6% 6,3% 10,4% 7,3% 10,4% 3,1% 52 48,1% 26,9% 51,9% 7,7% 21,2% 23,1% 17,3% 5,8% 15,4% 9,6% 1,9% 29 37,9% 34,5% 51,7% 3,4% 10,3% 13,8% 10,3% 17,2% 6,9% 10,3% 37 29,7% 29,7% 29,7% 21,6% 21,6% 5,4% 2,7% 2,7%
359 35,4% 26,2% 27,6% 17,0% 16,2% 14,5% 5,6% 6,7% 6,1% 7,0% 2,5% ,3% ,3%584 20,4% 27,4% 10,1% 33,4% 14,7% 16,6% 3,8% 3,9% 3,8% 3,9% 1,9% ,2% ,2% ,2%389 34,2% 30,3% 19,8% 15,2% 26,0% 14,7% 5,4% 6,2% 3,9% 5,4% 1,5% ,5% 242 36,8% 35,5% 25,2% 9,9% 15,3% 20,7% 9,1% 6,6% 6,2% 5,4% 3,7% ,4% 217 47,5% 20,3% 47,0% 4,6% 17,1% 17,5% 8,8% 9,2% 9,2% 6,5% 1,4% ,5% ,9%
1432 31,0% 28,5% 20,9% 20,1% 18,2% 16,9% 5,9% 5,8% 5,0% 5,0% 2,0% ,3% ,1% ,1% ,1%
SofiaRegional centerSmaller townVillage
Type of residence
MaleFemale
Gender
18-3031-4041-5051-6060+
Age
Finished bachelor, master or higherdegreeFinished collegeFinished secondary schoolFinished elementary and lower
Highest level ofeducation achieved
EmployeeOther status of employed personsBusiness ownerSelf-employed person innon-agricultural activitiesSelf-employed person in agriculturalactivitiesFamily helperRegistered as unemployedUnregistered unemployedRetired - due to ageRetired - other causesPupil, studentHousewifePerson unable to workAnother status of non working person
Main occupational statusin the present
BulgarianTurkishRomaOther
Ethnicity
No incomeLess than 100 BGN101-150 BGN151-200 BGN201-300 BGN301-500 BGNMore than 500 BGNDon't knowNA
Total household income
No incomeLess than 250 BGN251-500 BGN501-750 BGN751-1000 More than 1000 BGNDon't knowNA
Personal monthlyincome
I don't use financial servicesOneTwoThree and more
Financial services usage
Total
Base: Row %
Informationmaterials of
financialcompanies on
their tariffRow %
Advice offriends and
relativesRow %
Internetresources
Row %Don't know
Row %
Advertisements
Row %
Educationprograms
on the radioand
televisionRow %
Analyticalmaterials
published inmass media
Row %
Recommendations of
independentfinancial
consultants/brokers
Row %
Specializedinformationcenter/ call
centerRow %
Consultantsworking for
providers of arequiredservice
Row %
Employer'sadvice
Row %Other
Row %
Personalmeetings atthe financialinstitution
Row %
I don't useno sources
Row %Post ads
How would you prefer to receive information on financial matters?
133
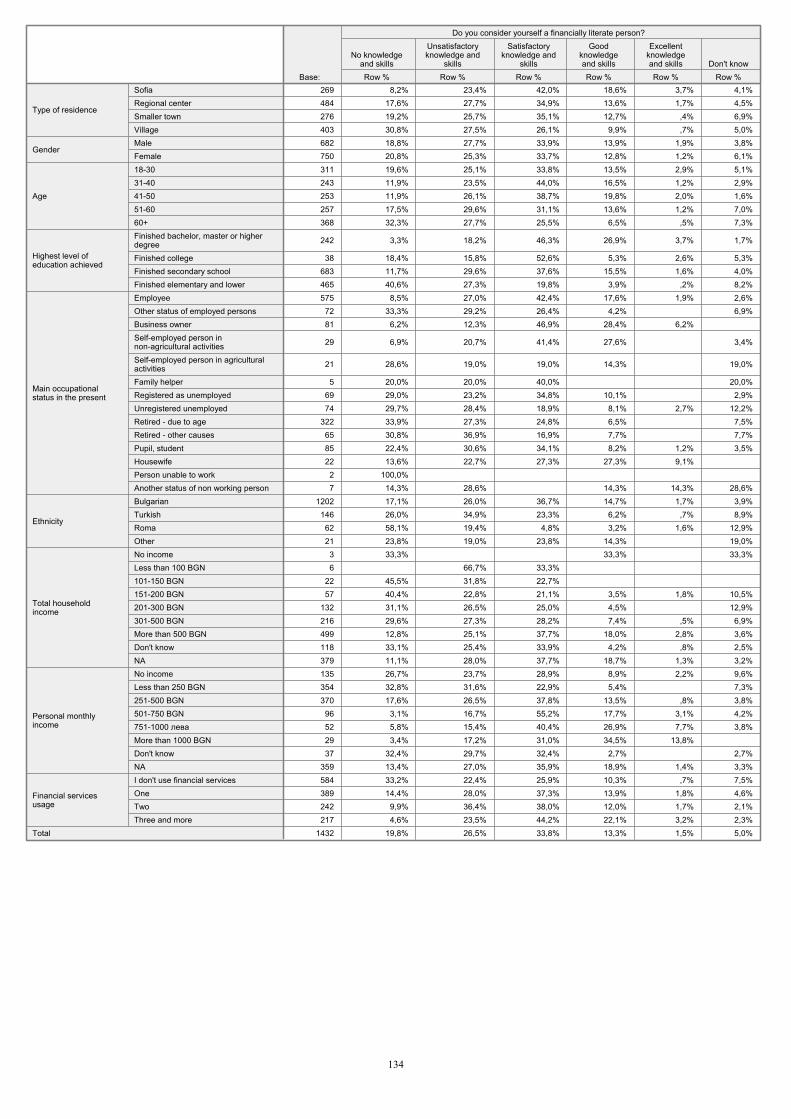
269 8,2% 23,4% 42,0% 18,6% 3,7% 4,1%484 17,6% 27,7% 34,9% 13,6% 1,7% 4,5%276 19,2% 25,7% 35,1% 12,7% ,4% 6,9%403 30,8% 27,5% 26,1% 9,9% ,7% 5,0%682 18,8% 27,7% 33,9% 13,9% 1,9% 3,8%750 20,8% 25,3% 33,7% 12,8% 1,2% 6,1%311 19,6% 25,1% 33,8% 13,5% 2,9% 5,1%243 11,9% 23,5% 44,0% 16,5% 1,2% 2,9%253 11,9% 26,1% 38,7% 19,8% 2,0% 1,6%257 17,5% 29,6% 31,1% 13,6% 1,2% 7,0%368 32,3% 27,7% 25,5% 6,5% ,5% 7,3%
242 3,3% 18,2% 46,3% 26,9% 3,7% 1,7%
38 18,4% 15,8% 52,6% 5,3% 2,6% 5,3%683 11,7% 29,6% 37,6% 15,5% 1,6% 4,0%465 40,6% 27,3% 19,8% 3,9% ,2% 8,2%575 8,5% 27,0% 42,4% 17,6% 1,9% 2,6%
72 33,3% 29,2% 26,4% 4,2% 6,9%81 6,2% 12,3% 46,9% 28,4% 6,2%
29 6,9% 20,7% 41,4% 27,6% 3,4%
21 28,6% 19,0% 19,0% 14,3% 19,0%
5 20,0% 20,0% 40,0% 20,0%69 29,0% 23,2% 34,8% 10,1% 2,9%74 29,7% 28,4% 18,9% 8,1% 2,7% 12,2%
322 33,9% 27,3% 24,8% 6,5% 7,5%65 30,8% 36,9% 16,9% 7,7% 7,7%85 22,4% 30,6% 34,1% 8,2% 1,2% 3,5%22 13,6% 22,7% 27,3% 27,3% 9,1%
2 100,0% 7 14,3% 28,6% 14,3% 14,3% 28,6%
1202 17,1% 26,0% 36,7% 14,7% 1,7% 3,9%146 26,0% 34,9% 23,3% 6,2% ,7% 8,9%
62 58,1% 19,4% 4,8% 3,2% 1,6% 12,9%21 23,8% 19,0% 23,8% 14,3% 19,0%
3 33,3% 33,3% 33,3%6 66,7% 33,3%
22 45,5% 31,8% 22,7% 57 40,4% 22,8% 21,1% 3,5% 1,8% 10,5%
132 31,1% 26,5% 25,0% 4,5% 12,9%216 29,6% 27,3% 28,2% 7,4% ,5% 6,9%499 12,8% 25,1% 37,7% 18,0% 2,8% 3,6%118 33,1% 25,4% 33,9% 4,2% ,8% 2,5%379 11,1% 28,0% 37,7% 18,7% 1,3% 3,2%135 26,7% 23,7% 28,9% 8,9% 2,2% 9,6%354 32,8% 31,6% 22,9% 5,4% 7,3%370 17,6% 26,5% 37,8% 13,5% ,8% 3,8%
96 3,1% 16,7% 55,2% 17,7% 3,1% 4,2%52 5,8% 15,4% 40,4% 26,9% 7,7% 3,8%29 3,4% 17,2% 31,0% 34,5% 13,8% 37 32,4% 29,7% 32,4% 2,7% 2,7%
359 13,4% 27,0% 35,9% 18,9% 1,4% 3,3%584 33,2% 22,4% 25,9% 10,3% ,7% 7,5%389 14,4% 28,0% 37,3% 13,9% 1,8% 4,6%242 9,9% 36,4% 38,0% 12,0% 1,7% 2,1%217 4,6% 23,5% 44,2% 22,1% 3,2% 2,3%
1432 19,8% 26,5% 33,8% 13,3% 1,5% 5,0%
SofiaRegional centerSmaller townVillage
Type of residence
MaleFemale
Gender
18-3031-4041-5051-6060+
Age
Finished bachelor, master or higherdegreeFinished collegeFinished secondary schoolFinished elementary and lower
Highest level ofeducation achieved
EmployeeOther status of employed personsBusiness ownerSelf-employed person innon-agricultural activitiesSelf-employed person in agriculturalactivitiesFamily helperRegistered as unemployedUnregistered unemployedRetired - due to ageRetired - other causesPupil, studentHousewifePerson unable to workAnother status of non working person
Main occupationalstatus in the present
BulgarianTurkishRomaOther
Ethnicity
No incomeLess than 100 BGN101-150 BGN151-200 BGN201-300 BGN301-500 BGNMore than 500 BGNDon't knowNA
Total householdincome
No incomeLess than 250 BGN251-500 BGN501-750 BGN751-1000 More than 1000 BGNDon't knowNA
Personal monthlyincome
I don't use financial servicesOneTwoThree and more
Financial servicesusage
Total
Base: Row %
No knowledgeand skills
Row %
Unsatisfactoryknowledge and
skillsRow %
Satisfactoryknowledge and
skillsRow %
Goodknowledgeand skills
Row %
Excellentknowledgeand skills
Row %Don't know
Do you consider yourself a financially literate person?
134
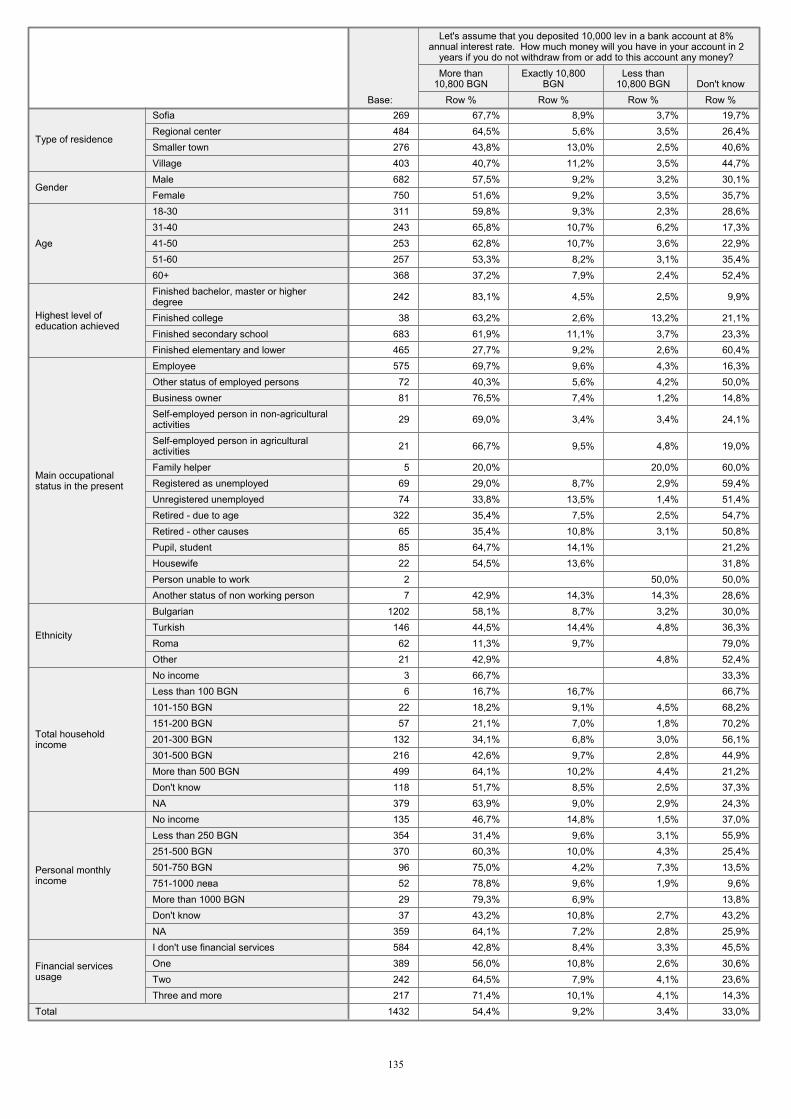
269 67,7% 8,9% 3,7% 19,7%484 64,5% 5,6% 3,5% 26,4%276 43,8% 13,0% 2,5% 40,6%403 40,7% 11,2% 3,5% 44,7%682 57,5% 9,2% 3,2% 30,1%750 51,6% 9,2% 3,5% 35,7%311 59,8% 9,3% 2,3% 28,6%243 65,8% 10,7% 6,2% 17,3%253 62,8% 10,7% 3,6% 22,9%257 53,3% 8,2% 3,1% 35,4%368 37,2% 7,9% 2,4% 52,4%
242 83,1% 4,5% 2,5% 9,9%
38 63,2% 2,6% 13,2% 21,1%683 61,9% 11,1% 3,7% 23,3%465 27,7% 9,2% 2,6% 60,4%575 69,7% 9,6% 4,3% 16,3%72 40,3% 5,6% 4,2% 50,0%81 76,5% 7,4% 1,2% 14,8%
29 69,0% 3,4% 3,4% 24,1%
21 66,7% 9,5% 4,8% 19,0%
5 20,0% 20,0% 60,0%69 29,0% 8,7% 2,9% 59,4%74 33,8% 13,5% 1,4% 51,4%
322 35,4% 7,5% 2,5% 54,7%65 35,4% 10,8% 3,1% 50,8%85 64,7% 14,1% 21,2%22 54,5% 13,6% 31,8%2 50,0% 50,0%7 42,9% 14,3% 14,3% 28,6%
1202 58,1% 8,7% 3,2% 30,0%146 44,5% 14,4% 4,8% 36,3%62 11,3% 9,7% 79,0%21 42,9% 4,8% 52,4%3 66,7% 33,3%6 16,7% 16,7% 66,7%
22 18,2% 9,1% 4,5% 68,2%57 21,1% 7,0% 1,8% 70,2%
132 34,1% 6,8% 3,0% 56,1%216 42,6% 9,7% 2,8% 44,9%499 64,1% 10,2% 4,4% 21,2%118 51,7% 8,5% 2,5% 37,3%379 63,9% 9,0% 2,9% 24,3%135 46,7% 14,8% 1,5% 37,0%354 31,4% 9,6% 3,1% 55,9%370 60,3% 10,0% 4,3% 25,4%96 75,0% 4,2% 7,3% 13,5%52 78,8% 9,6% 1,9% 9,6%29 79,3% 6,9% 13,8%37 43,2% 10,8% 2,7% 43,2%
359 64,1% 7,2% 2,8% 25,9%584 42,8% 8,4% 3,3% 45,5%389 56,0% 10,8% 2,6% 30,6%242 64,5% 7,9% 4,1% 23,6%217 71,4% 10,1% 4,1% 14,3%
1432 54,4% 9,2% 3,4% 33,0%
SofiaRegional centerSmaller townVillage
Type of residence
MaleFemale
Gender
18-3031-4041-5051-6060+
Age
Finished bachelor, master or higherdegreeFinished collegeFinished secondary schoolFinished elementary and lower
Highest level ofeducation achieved
EmployeeOther status of employed personsBusiness ownerSelf-employed person in non-agriculturalactivitiesSelf-employed person in agriculturalactivitiesFamily helperRegistered as unemployedUnregistered unemployedRetired - due to ageRetired - other causesPupil, studentHousewifePerson unable to workAnother status of non working person
Main occupationalstatus in the present
BulgarianTurkishRomaOther
Ethnicity
No incomeLess than 100 BGN101-150 BGN151-200 BGN201-300 BGN301-500 BGNMore than 500 BGNDon't knowNA
Total householdincome
No incomeLess than 250 BGN251-500 BGN501-750 BGN751-1000 More than 1000 BGNDon't knowNA
Personal monthlyincome
I don't use financial servicesOneTwoThree and more
Financial servicesusage
Total
Base: Row %
More than10,800 BGN
Row %
Exactly 10,800BGN
Row %
Less than10,800 BGN
Row %Don't know
Let's assume that you deposited 10,000 lev in a bank account at 8%annual interest rate. How much money will you have in your account in 2
years if you do not withdraw from or add to this account any money?
135
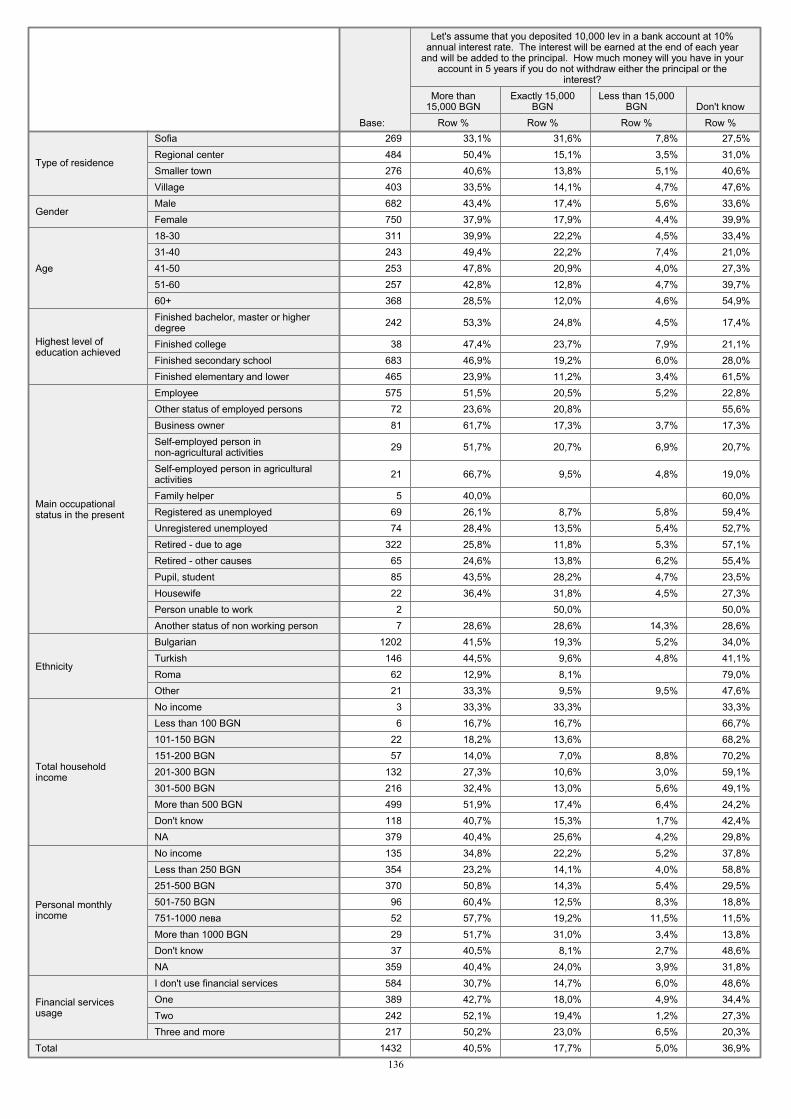
269 33,1% 31,6% 7,8% 27,5%484 50,4% 15,1% 3,5% 31,0%276 40,6% 13,8% 5,1% 40,6%403 33,5% 14,1% 4,7% 47,6%682 43,4% 17,4% 5,6% 33,6%750 37,9% 17,9% 4,4% 39,9%311 39,9% 22,2% 4,5% 33,4%243 49,4% 22,2% 7,4% 21,0%253 47,8% 20,9% 4,0% 27,3%257 42,8% 12,8% 4,7% 39,7%368 28,5% 12,0% 4,6% 54,9%
242 53,3% 24,8% 4,5% 17,4%
38 47,4% 23,7% 7,9% 21,1%683 46,9% 19,2% 6,0% 28,0%465 23,9% 11,2% 3,4% 61,5%575 51,5% 20,5% 5,2% 22,8%72 23,6% 20,8% 55,6%81 61,7% 17,3% 3,7% 17,3%
29 51,7% 20,7% 6,9% 20,7%
21 66,7% 9,5% 4,8% 19,0%
5 40,0% 60,0%69 26,1% 8,7% 5,8% 59,4%74 28,4% 13,5% 5,4% 52,7%
322 25,8% 11,8% 5,3% 57,1%65 24,6% 13,8% 6,2% 55,4%85 43,5% 28,2% 4,7% 23,5%22 36,4% 31,8% 4,5% 27,3%2 50,0% 50,0%7 28,6% 28,6% 14,3% 28,6%
1202 41,5% 19,3% 5,2% 34,0%146 44,5% 9,6% 4,8% 41,1%62 12,9% 8,1% 79,0%21 33,3% 9,5% 9,5% 47,6%3 33,3% 33,3% 33,3%6 16,7% 16,7% 66,7%
22 18,2% 13,6% 68,2%57 14,0% 7,0% 8,8% 70,2%
132 27,3% 10,6% 3,0% 59,1%216 32,4% 13,0% 5,6% 49,1%499 51,9% 17,4% 6,4% 24,2%118 40,7% 15,3% 1,7% 42,4%379 40,4% 25,6% 4,2% 29,8%135 34,8% 22,2% 5,2% 37,8%354 23,2% 14,1% 4,0% 58,8%370 50,8% 14,3% 5,4% 29,5%96 60,4% 12,5% 8,3% 18,8%52 57,7% 19,2% 11,5% 11,5%29 51,7% 31,0% 3,4% 13,8%37 40,5% 8,1% 2,7% 48,6%
359 40,4% 24,0% 3,9% 31,8%584 30,7% 14,7% 6,0% 48,6%389 42,7% 18,0% 4,9% 34,4%242 52,1% 19,4% 1,2% 27,3%217 50,2% 23,0% 6,5% 20,3%
1432 40,5% 17,7% 5,0% 36,9%
SofiaRegional centerSmaller townVillage
Type of residence
MaleFemale
Gender
18-3031-4041-5051-6060+
Age
Finished bachelor, master or higherdegreeFinished collegeFinished secondary schoolFinished elementary and lower
Highest level ofeducation achieved
EmployeeOther status of employed personsBusiness ownerSelf-employed person innon-agricultural activitiesSelf-employed person in agriculturalactivitiesFamily helperRegistered as unemployedUnregistered unemployedRetired - due to ageRetired - other causesPupil, studentHousewifePerson unable to workAnother status of non working person
Main occupationalstatus in the present
BulgarianTurkishRomaOther
Ethnicity
No incomeLess than 100 BGN101-150 BGN151-200 BGN201-300 BGN301-500 BGNMore than 500 BGNDon't knowNA
Total householdincome
No incomeLess than 250 BGN251-500 BGN501-750 BGN751-1000 More than 1000 BGNDon't knowNA
Personal monthlyincome
I don't use financial servicesOneTwoThree and more
Financial servicesusage
Total
Base: Row %
More than15,000 BGN
Row %
Exactly 15,000BGN
Row %
Less than 15,000BGN
Row %Don't know
Let's assume that you deposited 10,000 lev in a bank account at 10%annual interest rate. The interest will be earned at the end of each year
and will be added to the principal. How much money will you have in youraccount in 5 years if you do not withdraw either the principal or the
interest?
136
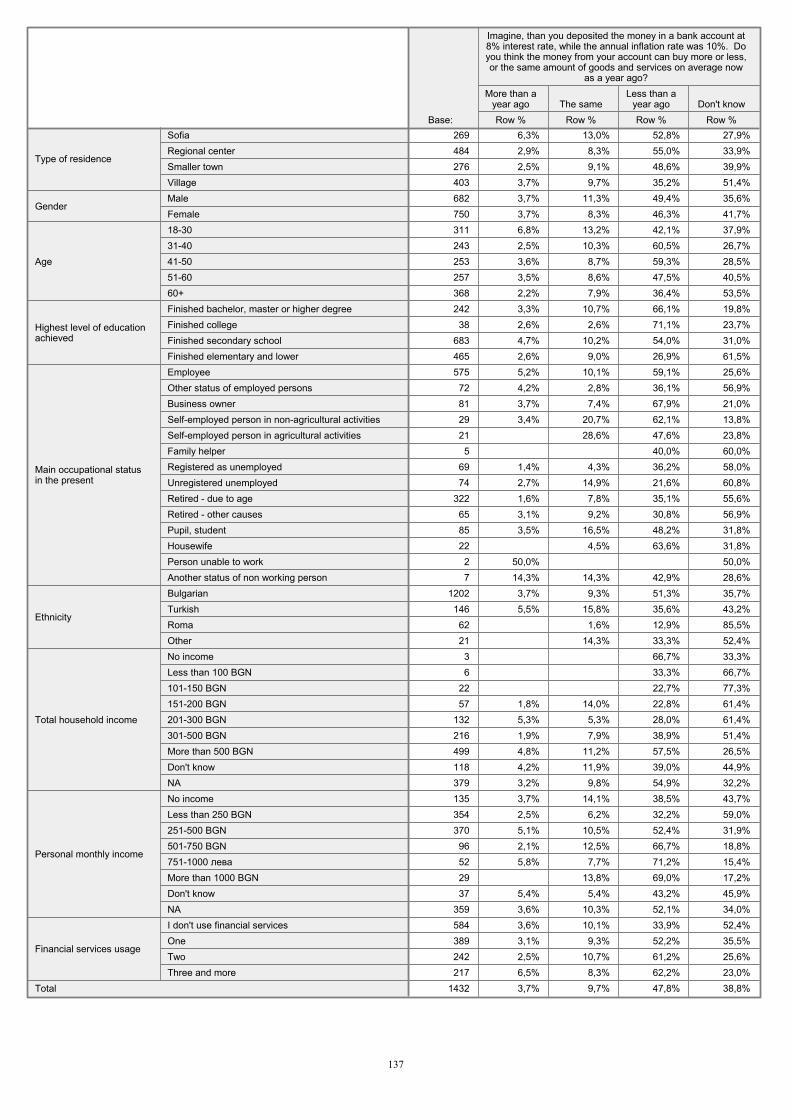
269 6,3% 13,0% 52,8% 27,9%484 2,9% 8,3% 55,0% 33,9%276 2,5% 9,1% 48,6% 39,9%403 3,7% 9,7% 35,2% 51,4%682 3,7% 11,3% 49,4% 35,6%750 3,7% 8,3% 46,3% 41,7%311 6,8% 13,2% 42,1% 37,9%243 2,5% 10,3% 60,5% 26,7%253 3,6% 8,7% 59,3% 28,5%257 3,5% 8,6% 47,5% 40,5%368 2,2% 7,9% 36,4% 53,5%242 3,3% 10,7% 66,1% 19,8%38 2,6% 2,6% 71,1% 23,7%
683 4,7% 10,2% 54,0% 31,0%465 2,6% 9,0% 26,9% 61,5%575 5,2% 10,1% 59,1% 25,6%72 4,2% 2,8% 36,1% 56,9%81 3,7% 7,4% 67,9% 21,0%29 3,4% 20,7% 62,1% 13,8%21 28,6% 47,6% 23,8%5 40,0% 60,0%
69 1,4% 4,3% 36,2% 58,0%74 2,7% 14,9% 21,6% 60,8%
322 1,6% 7,8% 35,1% 55,6%65 3,1% 9,2% 30,8% 56,9%85 3,5% 16,5% 48,2% 31,8%22 4,5% 63,6% 31,8%2 50,0% 50,0%7 14,3% 14,3% 42,9% 28,6%
1202 3,7% 9,3% 51,3% 35,7%146 5,5% 15,8% 35,6% 43,2%62 1,6% 12,9% 85,5%21 14,3% 33,3% 52,4%3 66,7% 33,3%6 33,3% 66,7%
22 22,7% 77,3%57 1,8% 14,0% 22,8% 61,4%
132 5,3% 5,3% 28,0% 61,4%216 1,9% 7,9% 38,9% 51,4%499 4,8% 11,2% 57,5% 26,5%118 4,2% 11,9% 39,0% 44,9%379 3,2% 9,8% 54,9% 32,2%135 3,7% 14,1% 38,5% 43,7%354 2,5% 6,2% 32,2% 59,0%370 5,1% 10,5% 52,4% 31,9%96 2,1% 12,5% 66,7% 18,8%52 5,8% 7,7% 71,2% 15,4%29 13,8% 69,0% 17,2%37 5,4% 5,4% 43,2% 45,9%
359 3,6% 10,3% 52,1% 34,0%584 3,6% 10,1% 33,9% 52,4%389 3,1% 9,3% 52,2% 35,5%242 2,5% 10,7% 61,2% 25,6%217 6,5% 8,3% 62,2% 23,0%
1432 3,7% 9,7% 47,8% 38,8%
SofiaRegional centerSmaller townVillage
Type of residence
MaleFemale
Gender
18-3031-4041-5051-6060+
Age
Finished bachelor, master or higher degreeFinished collegeFinished secondary schoolFinished elementary and lower
Highest level of educationachieved
EmployeeOther status of employed personsBusiness ownerSelf-employed person in non-agricultural activitiesSelf-employed person in agricultural activitiesFamily helperRegistered as unemployedUnregistered unemployedRetired - due to ageRetired - other causesPupil, studentHousewifePerson unable to workAnother status of non working person
Main occupational statusin the present
BulgarianTurkishRomaOther
Ethnicity
No incomeLess than 100 BGN101-150 BGN151-200 BGN201-300 BGN301-500 BGNMore than 500 BGNDon't knowNA
Total household income
No incomeLess than 250 BGN251-500 BGN501-750 BGN751-1000 More than 1000 BGNDon't knowNA
Personal monthly income
I don't use financial servicesOneTwoThree and more
Financial services usage
Total
Base: Row %
More than ayear ago
Row %The same
Row %
Less than ayear ago
Row %Don't know
Imagine, than you deposited the money in a bank account at8% interest rate, while the annual inflation rate was 10%. Doyou think the money from your account can buy more or less,or the same amount of goods and services on average now
as a year ago?
137
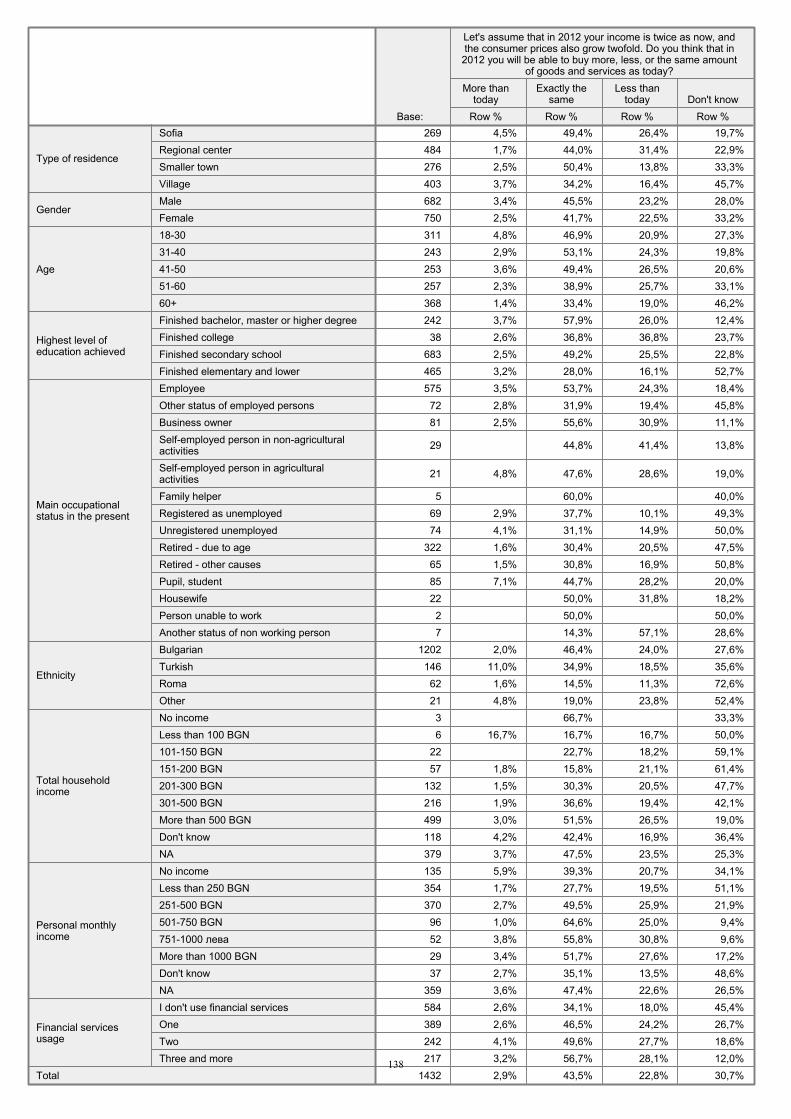
269 4,5% 49,4% 26,4% 19,7%484 1,7% 44,0% 31,4% 22,9%276 2,5% 50,4% 13,8% 33,3%403 3,7% 34,2% 16,4% 45,7%682 3,4% 45,5% 23,2% 28,0%750 2,5% 41,7% 22,5% 33,2%311 4,8% 46,9% 20,9% 27,3%243 2,9% 53,1% 24,3% 19,8%253 3,6% 49,4% 26,5% 20,6%257 2,3% 38,9% 25,7% 33,1%368 1,4% 33,4% 19,0% 46,2%242 3,7% 57,9% 26,0% 12,4%38 2,6% 36,8% 36,8% 23,7%
683 2,5% 49,2% 25,5% 22,8%465 3,2% 28,0% 16,1% 52,7%575 3,5% 53,7% 24,3% 18,4%72 2,8% 31,9% 19,4% 45,8%81 2,5% 55,6% 30,9% 11,1%
29 44,8% 41,4% 13,8%
21 4,8% 47,6% 28,6% 19,0%
5 60,0% 40,0%69 2,9% 37,7% 10,1% 49,3%74 4,1% 31,1% 14,9% 50,0%
322 1,6% 30,4% 20,5% 47,5%65 1,5% 30,8% 16,9% 50,8%85 7,1% 44,7% 28,2% 20,0%22 50,0% 31,8% 18,2%2 50,0% 50,0%7 14,3% 57,1% 28,6%
1202 2,0% 46,4% 24,0% 27,6%146 11,0% 34,9% 18,5% 35,6%62 1,6% 14,5% 11,3% 72,6%21 4,8% 19,0% 23,8% 52,4%3 66,7% 33,3%6 16,7% 16,7% 16,7% 50,0%
22 22,7% 18,2% 59,1%57 1,8% 15,8% 21,1% 61,4%
132 1,5% 30,3% 20,5% 47,7%216 1,9% 36,6% 19,4% 42,1%499 3,0% 51,5% 26,5% 19,0%118 4,2% 42,4% 16,9% 36,4%379 3,7% 47,5% 23,5% 25,3%135 5,9% 39,3% 20,7% 34,1%354 1,7% 27,7% 19,5% 51,1%370 2,7% 49,5% 25,9% 21,9%96 1,0% 64,6% 25,0% 9,4%52 3,8% 55,8% 30,8% 9,6%29 3,4% 51,7% 27,6% 17,2%37 2,7% 35,1% 13,5% 48,6%
359 3,6% 47,4% 22,6% 26,5%584 2,6% 34,1% 18,0% 45,4%389 2,6% 46,5% 24,2% 26,7%242 4,1% 49,6% 27,7% 18,6%217 3,2% 56,7% 28,1% 12,0%
1432 2,9% 43,5% 22,8% 30,7%
SofiaRegional centerSmaller townVillage
Type of residence
MaleFemale
Gender
18-3031-4041-5051-6060+
Age
Finished bachelor, master or higher degreeFinished collegeFinished secondary schoolFinished elementary and lower
Highest level ofeducation achieved
EmployeeOther status of employed personsBusiness ownerSelf-employed person in non-agriculturalactivitiesSelf-employed person in agriculturalactivitiesFamily helperRegistered as unemployedUnregistered unemployedRetired - due to ageRetired - other causesPupil, studentHousewifePerson unable to workAnother status of non working person
Main occupationalstatus in the present
BulgarianTurkishRomaOther
Ethnicity
No incomeLess than 100 BGN101-150 BGN151-200 BGN201-300 BGN301-500 BGNMore than 500 BGNDon't knowNA
Total householdincome
No incomeLess than 250 BGN251-500 BGN501-750 BGN751-1000 More than 1000 BGNDon't knowNA
Personal monthlyincome
I don't use financial servicesOneTwoThree and more
Financial servicesusage
Total
Base: Row %
More thantoday
Row %
Exactly thesame
Row %
Less thantoday
Row %Don't know
Let's assume that in 2012 your income is twice as now, andthe consumer prices also grow twofold. Do you think that in2012 you will be able to buy more, less, or the same amount
of goods and services as today?
138

269 79,6% 4,8% 1,5% 14,1%484 75,0% 2,1% 1,2% 21,7%276 61,2% 4,3% 1,8% 32,6%403 51,4% 5,2% 1,5% 41,9%682 67,7% 5,3% 1,9% 25,1%750 65,5% 2,7% 1,1% 30,8%311 72,3% 3,5% 1,3% 22,8%243 77,0% 4,9% 1,6% 16,5%253 77,5% 3,6% 2,4% 16,6%257 61,9% 3,5% 1,9% 32,7%368 50,5% 4,1% ,5% 44,8%
242 86,4% 1,7% 2,1% 9,9%
38 73,7% 5,3% 21,1%683 74,8% 4,4% 1,3% 19,5%465 43,2% 4,3% 1,5% 51,0%575 78,8% 4,0% 1,6% 15,7%
72 55,6% 2,8% 41,7%81 82,7% 3,7% 2,5% 11,1%
29 89,7% 3,4% 3,4% 3,4%
21 61,9% 14,3% 23,8%
5 40,0% 20,0% 40,0%69 53,6% 2,9% 1,4% 42,0%74 43,2% 9,5% 2,7% 44,6%
322 48,8% 4,0% ,3% 46,9%65 50,8% 4,6% 44,6%85 80,0% 2,4% 17,6%22 77,3% 4,5% 18,2%
2 50,0% 50,0%
7 71,4% 28,6%
1202 69,6% 4,2% 1,5% 24,7%146 63,7% 3,4% 1,4% 31,5%
62 21,0% 1,6% 77,4%21 42,9% 4,8% 52,4%
3 66,7% 33,3%6 33,3% 16,7% 50,0%
22 45,5% 4,5% 50,0%57 28,1% 5,3% 66,7%
132 46,2% 6,1% ,8% 47,0%216 56,9% 2,3% 1,9% 38,9%499 81,0% 3,0% 1,0% 15,0%118 61,0% 2,5% ,8% 35,6%379 69,4% 5,5% 2,4% 22,7%135 62,2% 5,2% 1,5% 31,1%354 46,9% 2,8% 1,1% 49,2%370 75,7% 3,8% 1,9% 18,6%
96 86,5% 3,1% 1,0% 9,4%52 88,5% 1,9% 9,6%29 86,2% 3,4% 10,3%37 51,4% 48,6%
359 69,6% 5,6% 1,9% 22,8%584 51,9% 4,1% 1,7% 42,3%389 70,2% 4,6% 1,5% 23,7%242 81,0% 2,9% ,4% 15,7%217 83,4% 3,2% 1,8% 11,5%
1432 66,6% 3,9% 1,5% 28,1%
SofiaRegional centerSmaller townVillage
Type of residence
MaleFemale
Gender
18-3031-4041-5051-6060+
Age
Finished bachelor, master or higherdegreeFinished collegeFinished secondary schoolFinished elementary and lower
Highest level ofeducation achieved
EmployeeOther status of employed personsBusiness ownerSelf-employed person innon-agricultural activitiesSelf-employed person inagricultural activitiesFamily helperRegistered as unemployedUnregistered unemployedRetired - due to ageRetired - other causesPupil, studentHousewifePerson unable to workAnother status of non workingperson
Main occupationalstatus in the present
BulgarianTurkishRomaOther
Ethnicity
No incomeLess than 100 BGN101-150 BGN151-200 BGN201-300 BGN301-500 BGNMore than 500 BGNDon't knowNA
Total householdincome
No incomeLess than 250 BGN251-500 BGN501-750 BGN751-1000 More than 1000 BGNDon't knowNA
Personal monthlyincome
I don't use financial servicesOneTwoThree and more
Financial servicesusage
Total
Base: Row %
A discountof 150 lev
Row %
There arethe same
Row %
A 10%discount
Row %Don't know
Let's assume that you saw a TV-set of the same model onsales in two different shops. The initial retail price of it was1,000 lev. One shop offered a discount of 150 lev, while the
other one offered a 10% discount. Which one is a betterbargain - a discount of 150 lev or 10%?
139
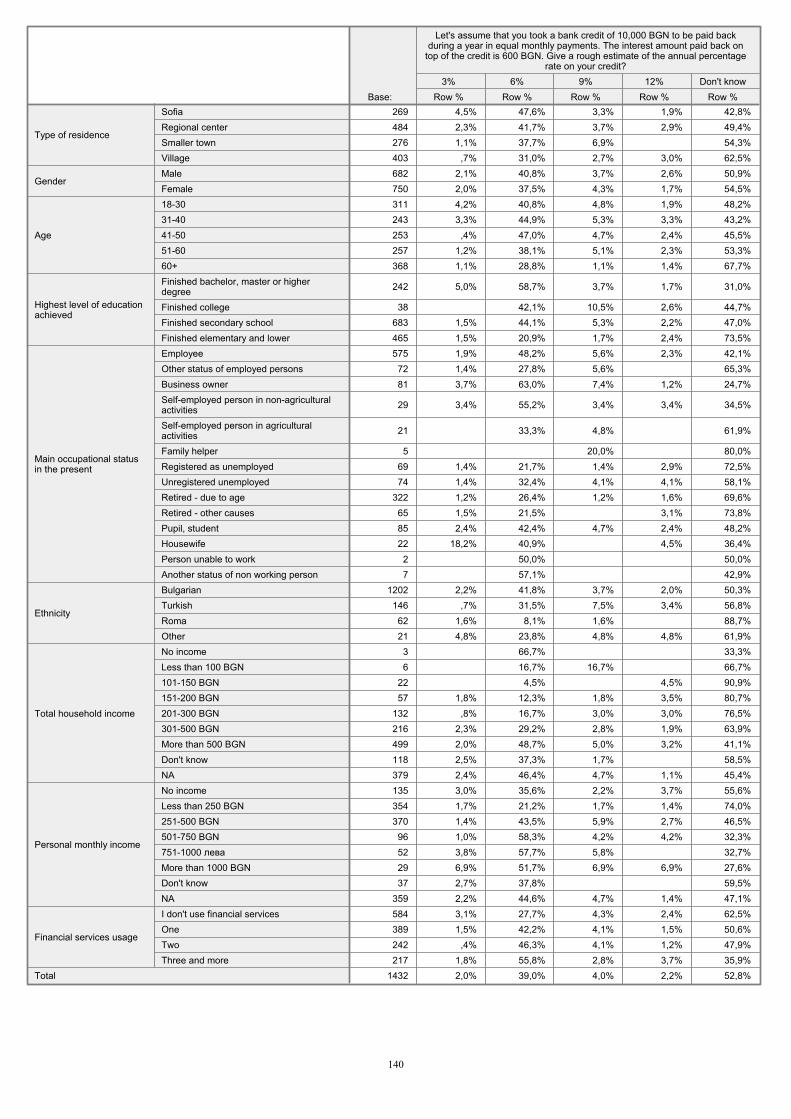
269 4,5% 47,6% 3,3% 1,9% 42,8%484 2,3% 41,7% 3,7% 2,9% 49,4%276 1,1% 37,7% 6,9% 54,3%403 ,7% 31,0% 2,7% 3,0% 62,5%682 2,1% 40,8% 3,7% 2,6% 50,9%750 2,0% 37,5% 4,3% 1,7% 54,5%311 4,2% 40,8% 4,8% 1,9% 48,2%243 3,3% 44,9% 5,3% 3,3% 43,2%253 ,4% 47,0% 4,7% 2,4% 45,5%257 1,2% 38,1% 5,1% 2,3% 53,3%368 1,1% 28,8% 1,1% 1,4% 67,7%
242 5,0% 58,7% 3,7% 1,7% 31,0%
38 42,1% 10,5% 2,6% 44,7%683 1,5% 44,1% 5,3% 2,2% 47,0%465 1,5% 20,9% 1,7% 2,4% 73,5%575 1,9% 48,2% 5,6% 2,3% 42,1%
72 1,4% 27,8% 5,6% 65,3%81 3,7% 63,0% 7,4% 1,2% 24,7%
29 3,4% 55,2% 3,4% 3,4% 34,5%
21 33,3% 4,8% 61,9%
5 20,0% 80,0%69 1,4% 21,7% 1,4% 2,9% 72,5%74 1,4% 32,4% 4,1% 4,1% 58,1%
322 1,2% 26,4% 1,2% 1,6% 69,6%65 1,5% 21,5% 3,1% 73,8%85 2,4% 42,4% 4,7% 2,4% 48,2%22 18,2% 40,9% 4,5% 36,4%
2 50,0% 50,0%7 57,1% 42,9%
1202 2,2% 41,8% 3,7% 2,0% 50,3%146 ,7% 31,5% 7,5% 3,4% 56,8%
62 1,6% 8,1% 1,6% 88,7%21 4,8% 23,8% 4,8% 4,8% 61,9%
3 66,7% 33,3%6 16,7% 16,7% 66,7%
22 4,5% 4,5% 90,9%57 1,8% 12,3% 1,8% 3,5% 80,7%
132 ,8% 16,7% 3,0% 3,0% 76,5%216 2,3% 29,2% 2,8% 1,9% 63,9%499 2,0% 48,7% 5,0% 3,2% 41,1%118 2,5% 37,3% 1,7% 58,5%379 2,4% 46,4% 4,7% 1,1% 45,4%135 3,0% 35,6% 2,2% 3,7% 55,6%354 1,7% 21,2% 1,7% 1,4% 74,0%370 1,4% 43,5% 5,9% 2,7% 46,5%
96 1,0% 58,3% 4,2% 4,2% 32,3%52 3,8% 57,7% 5,8% 32,7%29 6,9% 51,7% 6,9% 6,9% 27,6%37 2,7% 37,8% 59,5%
359 2,2% 44,6% 4,7% 1,4% 47,1%584 3,1% 27,7% 4,3% 2,4% 62,5%389 1,5% 42,2% 4,1% 1,5% 50,6%242 ,4% 46,3% 4,1% 1,2% 47,9%217 1,8% 55,8% 2,8% 3,7% 35,9%
1432 2,0% 39,0% 4,0% 2,2% 52,8%
SofiaRegional centerSmaller townVillage
Type of residence
MaleFemale
Gender
18-3031-4041-5051-6060+
Age
Finished bachelor, master or higherdegreeFinished collegeFinished secondary schoolFinished elementary and lower
Highest level of educationachieved
EmployeeOther status of employed personsBusiness ownerSelf-employed person in non-agriculturalactivitiesSelf-employed person in agriculturalactivitiesFamily helperRegistered as unemployedUnregistered unemployedRetired - due to ageRetired - other causesPupil, studentHousewifePerson unable to workAnother status of non working person
Main occupational statusin the present
BulgarianTurkishRomaOther
Ethnicity
No incomeLess than 100 BGN101-150 BGN151-200 BGN201-300 BGN301-500 BGNMore than 500 BGNDon't knowNA
Total household income
No incomeLess than 250 BGN251-500 BGN501-750 BGN751-1000 More than 1000 BGNDon't knowNA
Personal monthly income
I don't use financial servicesOneTwoThree and more
Financial services usage
Total
Base: Row %3%
Row %6%
Row %9%
Row %12%
Row %Don't know
Let's assume that you took a bank credit of 10,000 BGN to be paid backduring a year in equal monthly payments. The interest amount paid back on
top of the credit is 600 BGN. Give a rough estimate of the annual percentagerate on your credit?
140
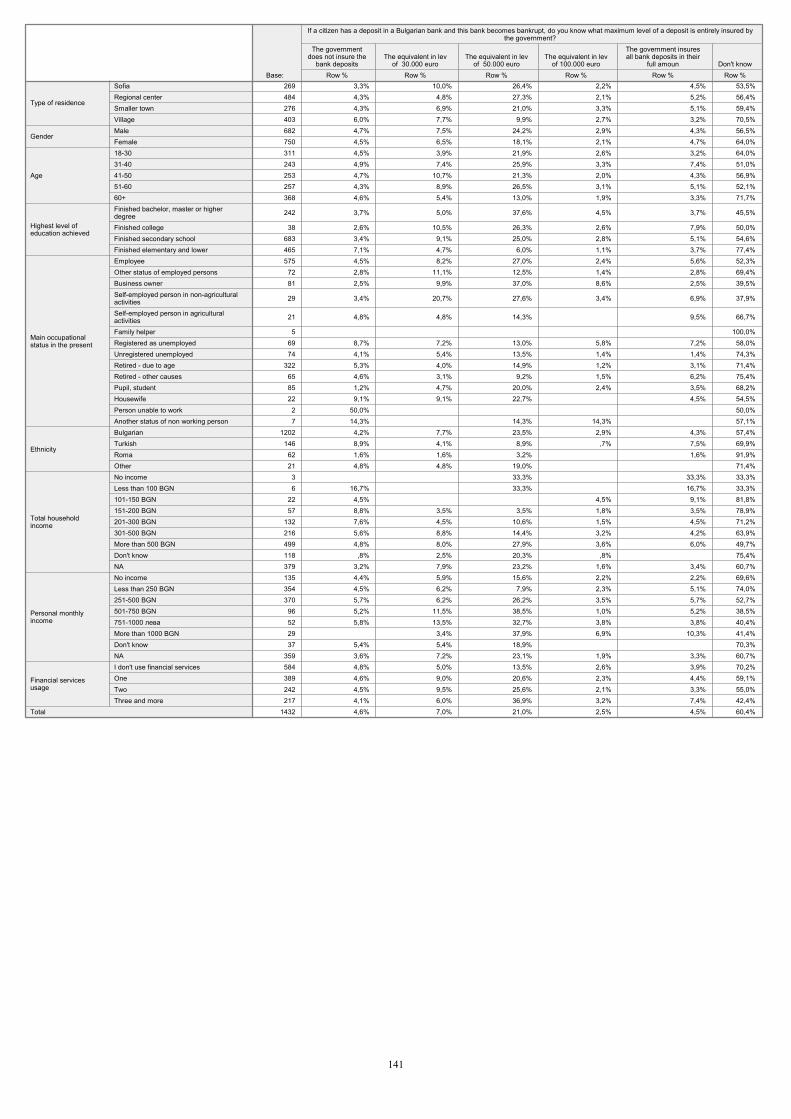
269 3,3% 10,0% 26,4% 2,2% 4,5% 53,5%484 4,3% 4,8% 27,3% 2,1% 5,2% 56,4%276 4,3% 6,9% 21,0% 3,3% 5,1% 59,4%403 6,0% 7,7% 9,9% 2,7% 3,2% 70,5%682 4,7% 7,5% 24,2% 2,9% 4,3% 56,5%750 4,5% 6,5% 18,1% 2,1% 4,7% 64,0%311 4,5% 3,9% 21,9% 2,6% 3,2% 64,0%243 4,9% 7,4% 25,9% 3,3% 7,4% 51,0%253 4,7% 10,7% 21,3% 2,0% 4,3% 56,9%257 4,3% 8,9% 26,5% 3,1% 5,1% 52,1%368 4,6% 5,4% 13,0% 1,9% 3,3% 71,7%
242 3,7% 5,0% 37,6% 4,5% 3,7% 45,5%
38 2,6% 10,5% 26,3% 2,6% 7,9% 50,0%683 3,4% 9,1% 25,0% 2,8% 5,1% 54,6%465 7,1% 4,7% 6,0% 1,1% 3,7% 77,4%575 4,5% 8,2% 27,0% 2,4% 5,6% 52,3%
72 2,8% 11,1% 12,5% 1,4% 2,8% 69,4%81 2,5% 9,9% 37,0% 8,6% 2,5% 39,5%
29 3,4% 20,7% 27,6% 3,4% 6,9% 37,9%
21 4,8% 4,8% 14,3% 9,5% 66,7%
5 100,0%69 8,7% 7,2% 13,0% 5,8% 7,2% 58,0%74 4,1% 5,4% 13,5% 1,4% 1,4% 74,3%
322 5,3% 4,0% 14,9% 1,2% 3,1% 71,4%65 4,6% 3,1% 9,2% 1,5% 6,2% 75,4%85 1,2% 4,7% 20,0% 2,4% 3,5% 68,2%22 9,1% 9,1% 22,7% 4,5% 54,5%
2 50,0% 50,0%7 14,3% 14,3% 14,3% 57,1%
1202 4,2% 7,7% 23,5% 2,9% 4,3% 57,4%146 8,9% 4,1% 8,9% ,7% 7,5% 69,9%
62 1,6% 1,6% 3,2% 1,6% 91,9%21 4,8% 4,8% 19,0% 71,4%
3 33,3% 33,3% 33,3%6 16,7% 33,3% 16,7% 33,3%
22 4,5% 4,5% 9,1% 81,8%57 8,8% 3,5% 3,5% 1,8% 3,5% 78,9%
132 7,6% 4,5% 10,6% 1,5% 4,5% 71,2%216 5,6% 8,8% 14,4% 3,2% 4,2% 63,9%499 4,8% 8,0% 27,9% 3,6% 6,0% 49,7%118 ,8% 2,5% 20,3% ,8% 75,4%379 3,2% 7,9% 23,2% 1,6% 3,4% 60,7%135 4,4% 5,9% 15,6% 2,2% 2,2% 69,6%354 4,5% 6,2% 7,9% 2,3% 5,1% 74,0%370 5,7% 6,2% 26,2% 3,5% 5,7% 52,7%
96 5,2% 11,5% 38,5% 1,0% 5,2% 38,5%52 5,8% 13,5% 32,7% 3,8% 3,8% 40,4%29 3,4% 37,9% 6,9% 10,3% 41,4%37 5,4% 5,4% 18,9% 70,3%
359 3,6% 7,2% 23,1% 1,9% 3,3% 60,7%584 4,8% 5,0% 13,5% 2,6% 3,9% 70,2%389 4,6% 9,0% 20,6% 2,3% 4,4% 59,1%242 4,5% 9,5% 25,6% 2,1% 3,3% 55,0%217 4,1% 6,0% 36,9% 3,2% 7,4% 42,4%
1432 4,6% 7,0% 21,0% 2,5% 4,5% 60,4%
SofiaRegional centerSmaller townVillage
Type of residence
MaleFemale
Gender
18-3031-4041-5051-6060+
Age
Finished bachelor, master or higherdegreeFinished collegeFinished secondary schoolFinished elementary and lower
Highest level ofeducation achieved
EmployeeOther status of employed personsBusiness ownerSelf-employed person in non-agriculturalactivitiesSelf-employed person in agriculturalactivitiesFamily helperRegistered as unemployedUnregistered unemployedRetired - due to ageRetired - other causesPupil, studentHousewifePerson unable to workAnother status of non working person
Main occupationalstatus in the present
BulgarianTurkishRomaOther
Ethnicity
No incomeLess than 100 BGN101-150 BGN151-200 BGN201-300 BGN301-500 BGNMore than 500 BGNDon't knowNA
Total householdincome
No incomeLess than 250 BGN251-500 BGN501-750 BGN751-1000 More than 1000 BGNDon't knowNA
Personal monthlyincome
I don't use financial servicesOneTwoThree and more
Financial servicesusage
Total
Base: Row %
The governmentdoes not insure the
bank depositsRow %
The equivalent in levof 30.000 euro
Row %
The equivalent in levof 50.000 euro
Row %
The equivalent in levof 100.000 euro
Row %
The government insuresall bank deposits in their
full amounRow %
Don't know
If a citizen has a deposit in a Bulgarian bank and this bank becomes bankrupt, do you know what maximum level of a deposit is entirely insured bythe government?
141
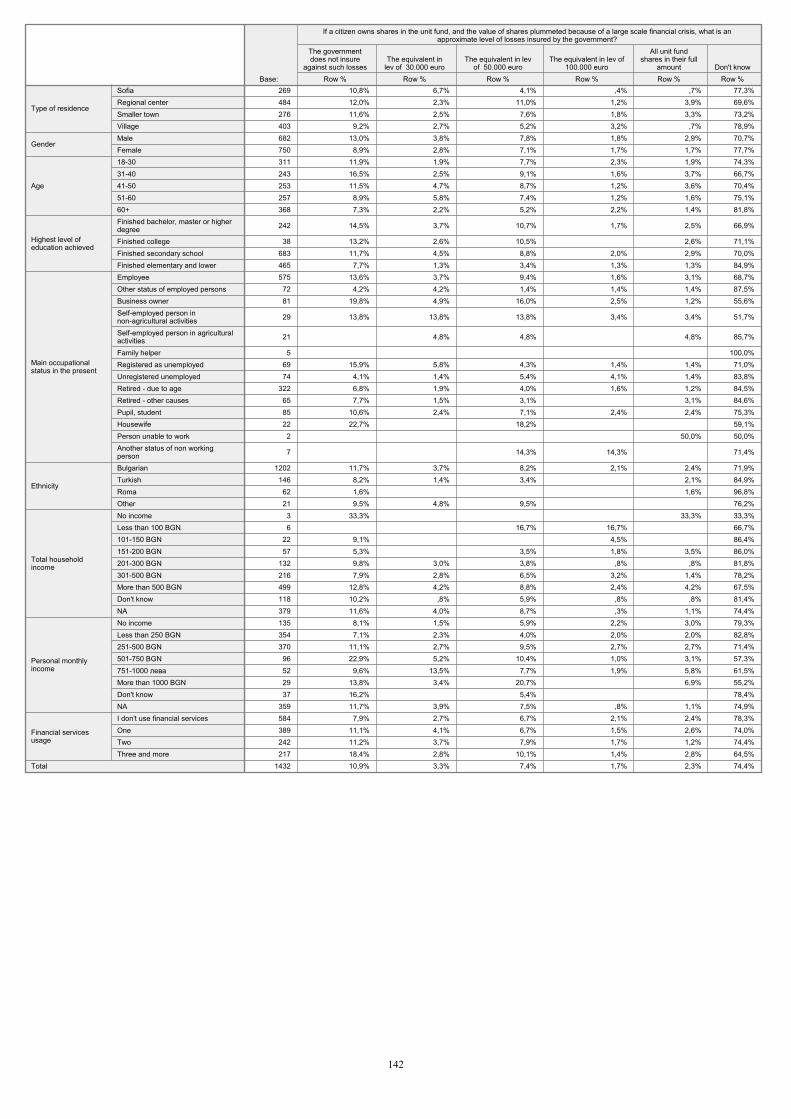
269 10,8% 6,7% 4,1% ,4% ,7% 77,3%484 12,0% 2,3% 11,0% 1,2% 3,9% 69,6%276 11,6% 2,5% 7,6% 1,8% 3,3% 73,2%403 9,2% 2,7% 5,2% 3,2% ,7% 78,9%682 13,0% 3,8% 7,8% 1,8% 2,9% 70,7%750 8,9% 2,8% 7,1% 1,7% 1,7% 77,7%311 11,9% 1,9% 7,7% 2,3% 1,9% 74,3%243 16,5% 2,5% 9,1% 1,6% 3,7% 66,7%253 11,5% 4,7% 8,7% 1,2% 3,6% 70,4%257 8,9% 5,8% 7,4% 1,2% 1,6% 75,1%368 7,3% 2,2% 5,2% 2,2% 1,4% 81,8%
242 14,5% 3,7% 10,7% 1,7% 2,5% 66,9%
38 13,2% 2,6% 10,5% 2,6% 71,1%683 11,7% 4,5% 8,8% 2,0% 2,9% 70,0%465 7,7% 1,3% 3,4% 1,3% 1,3% 84,9%575 13,6% 3,7% 9,4% 1,6% 3,1% 68,7%
72 4,2% 4,2% 1,4% 1,4% 1,4% 87,5%81 19,8% 4,9% 16,0% 2,5% 1,2% 55,6%
29 13,8% 13,8% 13,8% 3,4% 3,4% 51,7%
21 4,8% 4,8% 4,8% 85,7%
5 100,0%69 15,9% 5,8% 4,3% 1,4% 1,4% 71,0%74 4,1% 1,4% 5,4% 4,1% 1,4% 83,8%
322 6,8% 1,9% 4,0% 1,6% 1,2% 84,5%65 7,7% 1,5% 3,1% 3,1% 84,6%85 10,6% 2,4% 7,1% 2,4% 2,4% 75,3%22 22,7% 18,2% 59,1%
2 50,0% 50,0%
7 14,3% 14,3% 71,4%
1202 11,7% 3,7% 8,2% 2,1% 2,4% 71,9%146 8,2% 1,4% 3,4% 2,1% 84,9%
62 1,6% 1,6% 96,8%21 9,5% 4,8% 9,5% 76,2%
3 33,3% 33,3% 33,3%6 16,7% 16,7% 66,7%
22 9,1% 4,5% 86,4%57 5,3% 3,5% 1,8% 3,5% 86,0%
132 9,8% 3,0% 3,8% ,8% ,8% 81,8%216 7,9% 2,8% 6,5% 3,2% 1,4% 78,2%499 12,8% 4,2% 8,8% 2,4% 4,2% 67,5%118 10,2% ,8% 5,9% ,8% ,8% 81,4%379 11,6% 4,0% 8,7% ,3% 1,1% 74,4%135 8,1% 1,5% 5,9% 2,2% 3,0% 79,3%354 7,1% 2,3% 4,0% 2,0% 2,0% 82,8%370 11,1% 2,7% 9,5% 2,7% 2,7% 71,4%
96 22,9% 5,2% 10,4% 1,0% 3,1% 57,3%52 9,6% 13,5% 7,7% 1,9% 5,8% 61,5%29 13,8% 3,4% 20,7% 6,9% 55,2%37 16,2% 5,4% 78,4%
359 11,7% 3,9% 7,5% ,8% 1,1% 74,9%584 7,9% 2,7% 6,7% 2,1% 2,4% 78,3%389 11,1% 4,1% 6,7% 1,5% 2,6% 74,0%242 11,2% 3,7% 7,9% 1,7% 1,2% 74,4%217 18,4% 2,8% 10,1% 1,4% 2,8% 64,5%
1432 10,9% 3,3% 7,4% 1,7% 2,3% 74,4%
SofiaRegional centerSmaller townVillage
Type of residence
MaleFemale
Gender
18-3031-4041-5051-6060+
Age
Finished bachelor, master or higherdegreeFinished collegeFinished secondary schoolFinished elementary and lower
Highest level ofeducation achieved
EmployeeOther status of employed personsBusiness ownerSelf-employed person innon-agricultural activitiesSelf-employed person in agriculturalactivitiesFamily helperRegistered as unemployedUnregistered unemployedRetired - due to ageRetired - other causesPupil, studentHousewifePerson unable to workAnother status of non workingperson
Main occupationalstatus in the present
BulgarianTurkishRomaOther
Ethnicity
No incomeLess than 100 BGN101-150 BGN151-200 BGN201-300 BGN301-500 BGNMore than 500 BGNDon't knowNA
Total householdincome
No incomeLess than 250 BGN251-500 BGN501-750 BGN751-1000 More than 1000 BGNDon't knowNA
Personal monthlyincome
I don't use financial servicesOneTwoThree and more
Financial servicesusage
Total
Base: Row %
The governmentdoes not insure
against such lossesRow %
The equivalent inlev of 30.000 euro
Row %
The equivalent in levof 50.000 euro
Row %
The equivalent in lev of100.000 euro
Row %
All unit fundshares in their full
amountRow %
Don't know
If a citizen owns shares in the unit fund, and the value of shares plummeted because of a large scale financial crisis, what is anapproximate level of losses insured by the government?
142
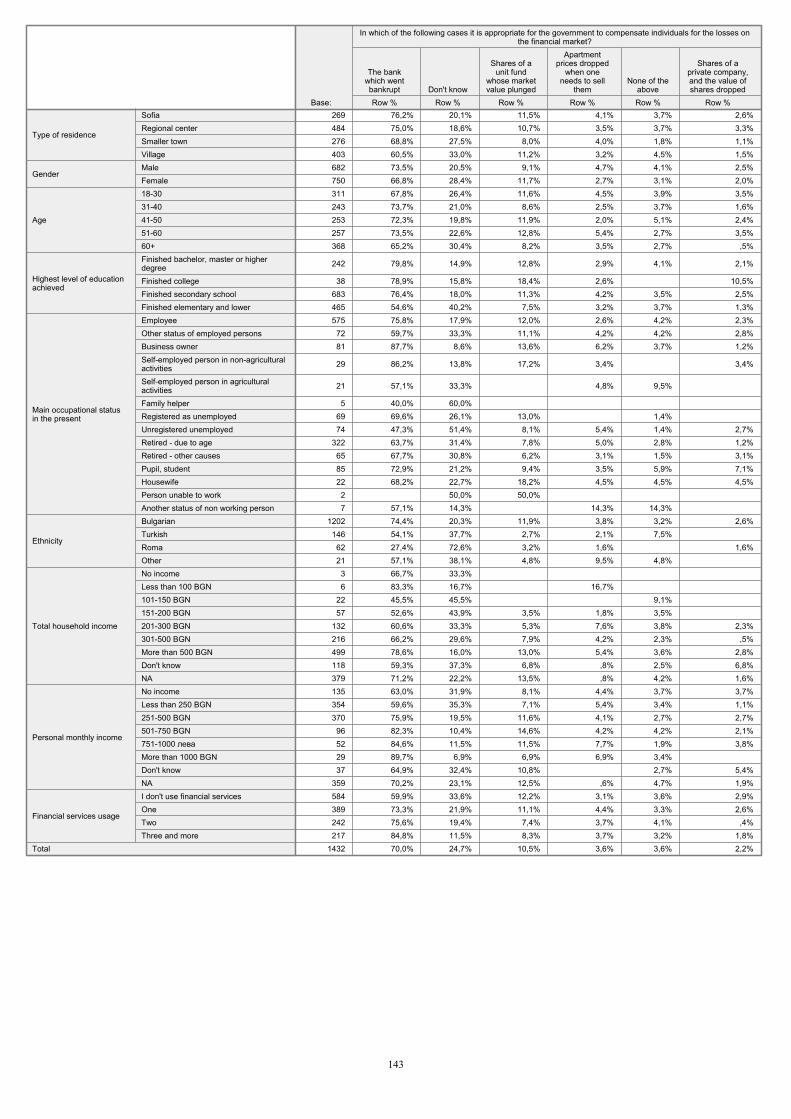
269 76,2% 20,1% 11,5% 4,1% 3,7% 2,6%484 75,0% 18,6% 10,7% 3,5% 3,7% 3,3%276 68,8% 27,5% 8,0% 4,0% 1,8% 1,1%403 60,5% 33,0% 11,2% 3,2% 4,5% 1,5%682 73,5% 20,5% 9,1% 4,7% 4,1% 2,5%750 66,8% 28,4% 11,7% 2,7% 3,1% 2,0%311 67,8% 26,4% 11,6% 4,5% 3,9% 3,5%243 73,7% 21,0% 8,6% 2,5% 3,7% 1,6%253 72,3% 19,8% 11,9% 2,0% 5,1% 2,4%257 73,5% 22,6% 12,8% 5,4% 2,7% 3,5%368 65,2% 30,4% 8,2% 3,5% 2,7% ,5%
242 79,8% 14,9% 12,8% 2,9% 4,1% 2,1%
38 78,9% 15,8% 18,4% 2,6% 10,5%683 76,4% 18,0% 11,3% 4,2% 3,5% 2,5%465 54,6% 40,2% 7,5% 3,2% 3,7% 1,3%575 75,8% 17,9% 12,0% 2,6% 4,2% 2,3%
72 59,7% 33,3% 11,1% 4,2% 4,2% 2,8%81 87,7% 8,6% 13,6% 6,2% 3,7% 1,2%
29 86,2% 13,8% 17,2% 3,4% 3,4%
21 57,1% 33,3% 4,8% 9,5%
5 40,0% 60,0% 69 69,6% 26,1% 13,0% 1,4% 74 47,3% 51,4% 8,1% 5,4% 1,4% 2,7%
322 63,7% 31,4% 7,8% 5,0% 2,8% 1,2%65 67,7% 30,8% 6,2% 3,1% 1,5% 3,1%85 72,9% 21,2% 9,4% 3,5% 5,9% 7,1%22 68,2% 22,7% 18,2% 4,5% 4,5% 4,5%
2 50,0% 50,0% 7 57,1% 14,3% 14,3% 14,3%
1202 74,4% 20,3% 11,9% 3,8% 3,2% 2,6%146 54,1% 37,7% 2,7% 2,1% 7,5%
62 27,4% 72,6% 3,2% 1,6% 1,6%21 57,1% 38,1% 4,8% 9,5% 4,8%
3 66,7% 33,3% 6 83,3% 16,7% 16,7%
22 45,5% 45,5% 9,1% 57 52,6% 43,9% 3,5% 1,8% 3,5%
132 60,6% 33,3% 5,3% 7,6% 3,8% 2,3%216 66,2% 29,6% 7,9% 4,2% 2,3% ,5%499 78,6% 16,0% 13,0% 5,4% 3,6% 2,8%118 59,3% 37,3% 6,8% ,8% 2,5% 6,8%379 71,2% 22,2% 13,5% ,8% 4,2% 1,6%135 63,0% 31,9% 8,1% 4,4% 3,7% 3,7%354 59,6% 35,3% 7,1% 5,4% 3,4% 1,1%370 75,9% 19,5% 11,6% 4,1% 2,7% 2,7%
96 82,3% 10,4% 14,6% 4,2% 4,2% 2,1%52 84,6% 11,5% 11,5% 7,7% 1,9% 3,8%29 89,7% 6,9% 6,9% 6,9% 3,4% 37 64,9% 32,4% 10,8% 2,7% 5,4%
359 70,2% 23,1% 12,5% ,6% 4,7% 1,9%584 59,9% 33,6% 12,2% 3,1% 3,6% 2,9%389 73,3% 21,9% 11,1% 4,4% 3,3% 2,6%242 75,6% 19,4% 7,4% 3,7% 4,1% ,4%217 84,8% 11,5% 8,3% 3,7% 3,2% 1,8%
1432 70,0% 24,7% 10,5% 3,6% 3,6% 2,2%
SofiaRegional centerSmaller townVillage
Type of residence
MaleFemale
Gender
18-3031-4041-5051-6060+
Age
Finished bachelor, master or higherdegreeFinished collegeFinished secondary schoolFinished elementary and lower
Highest level of educationachieved
EmployeeOther status of employed personsBusiness ownerSelf-employed person in non-agriculturalactivitiesSelf-employed person in agriculturalactivitiesFamily helperRegistered as unemployedUnregistered unemployedRetired - due to ageRetired - other causesPupil, studentHousewifePerson unable to workAnother status of non working person
Main occupational statusin the present
BulgarianTurkishRomaOther
Ethnicity
No incomeLess than 100 BGN101-150 BGN151-200 BGN201-300 BGN301-500 BGNMore than 500 BGNDon't knowNA
Total household income
No incomeLess than 250 BGN251-500 BGN501-750 BGN751-1000 More than 1000 BGNDon't knowNA
Personal monthly income
I don't use financial servicesOneTwoThree and more
Financial services usage
Total
Base: Row %
The bankwhich wentbankrupt
Row %Don't know
Row %
Shares of aunit fund
whose marketvalue plunged
Row %
Apartmentprices dropped
when oneneeds to sell
themRow %
None of theabove
Row %
Shares of aprivate company,and the value ofshares dropped
In which of the following cases it is appropriate for the government to compensate individuals for the losses onthe financial market?
143
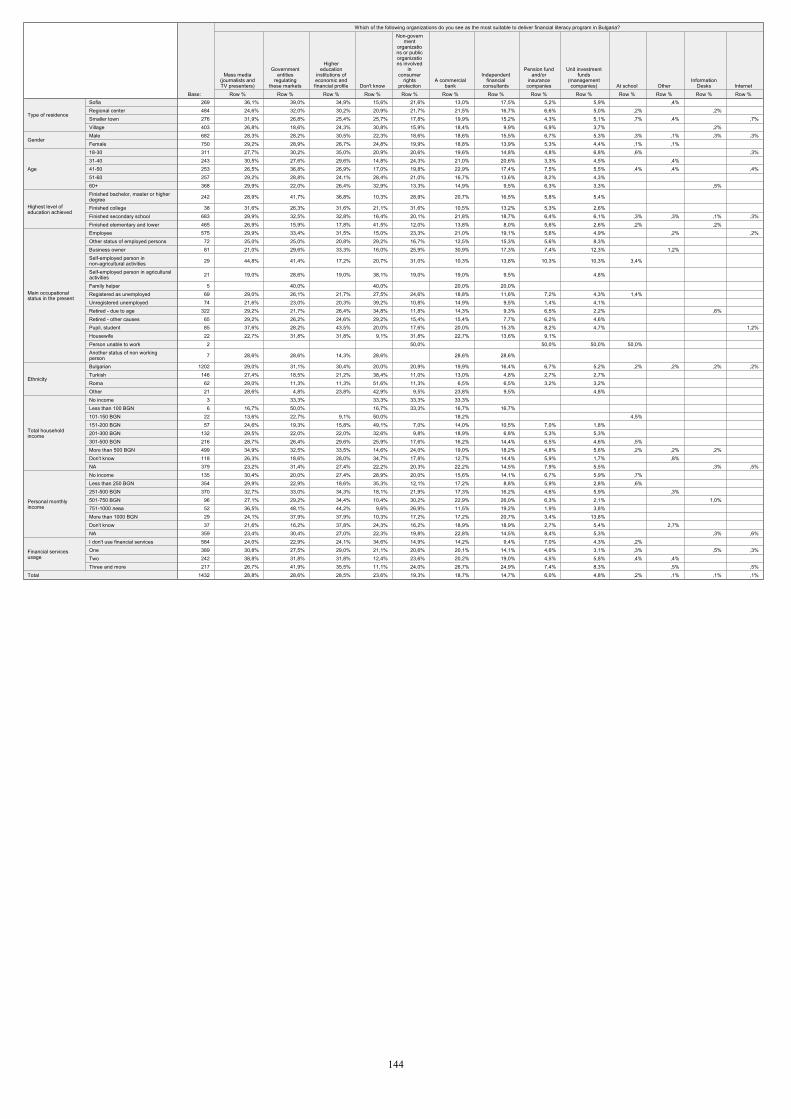
269 36,1% 39,0% 34,9% 15,6% 21,6% 13,0% 17,5% 5,2% 5,9% ,4% 484 24,6% 32,0% 30,2% 20,9% 21,7% 21,5% 16,7% 6,6% 5,0% ,2% ,2% 276 31,9% 26,8% 25,4% 25,7% 17,8% 19,9% 15,2% 4,3% 5,1% ,7% ,4% ,7%403 26,8% 18,6% 24,3% 30,8% 15,9% 18,4% 9,9% 6,9% 3,7% ,2% 682 28,3% 28,2% 30,5% 22,3% 18,6% 18,6% 15,5% 6,7% 5,3% ,3% ,1% ,3% ,3%750 29,2% 28,9% 26,7% 24,8% 19,9% 18,8% 13,9% 5,3% 4,4% ,1% ,1% 311 27,7% 30,2% 35,0% 20,9% 20,6% 19,6% 14,8% 4,8% 6,8% ,6% ,3%243 30,5% 27,6% 29,6% 14,8% 24,3% 21,0% 20,6% 3,3% 4,5% ,4% 253 26,5% 36,8% 26,9% 17,0% 19,8% 22,9% 17,4% 7,5% 5,5% ,4% ,4% ,4%257 29,2% 28,8% 24,1% 28,4% 21,0% 16,7% 13,6% 8,2% 4,3% 368 29,9% 22,0% 26,4% 32,9% 13,3% 14,9% 9,5% 6,3% 3,3% ,5%
242 28,9% 41,7% 36,8% 10,3% 28,9% 20,7% 16,5% 5,8% 5,4%
38 31,6% 26,3% 31,6% 21,1% 31,6% 10,5% 13,2% 5,3% 2,6% 683 29,9% 32,5% 32,8% 16,4% 20,1% 21,8% 18,7% 6,4% 6,1% ,3% ,3% ,1% ,3%465 26,9% 15,9% 17,8% 41,5% 12,0% 13,8% 8,0% 5,6% 2,6% ,2% ,2% 575 29,9% 33,4% 31,5% 15,0% 23,3% 21,0% 19,1% 5,6% 4,9% ,2% ,2%
72 25,0% 25,0% 20,8% 29,2% 16,7% 12,5% 15,3% 5,6% 8,3% 81 21,0% 29,6% 33,3% 16,0% 25,9% 30,9% 17,3% 7,4% 12,3% 1,2%
29 44,8% 41,4% 17,2% 20,7% 31,0% 10,3% 13,8% 10,3% 10,3% 3,4%
21 19,0% 28,6% 19,0% 38,1% 19,0% 19,0% 9,5% 4,8%
5 40,0% 40,0% 20,0% 20,0% 69 29,0% 26,1% 21,7% 27,5% 24,6% 18,8% 11,6% 7,2% 4,3% 1,4% 74 21,6% 23,0% 20,3% 39,2% 10,8% 14,9% 9,5% 1,4% 4,1%
322 29,2% 21,7% 26,4% 34,8% 11,8% 14,3% 9,3% 6,5% 2,2% ,6% 65 29,2% 26,2% 24,6% 29,2% 15,4% 15,4% 7,7% 6,2% 4,6% 85 37,6% 28,2% 43,5% 20,0% 17,6% 20,0% 15,3% 8,2% 4,7% 1,2%22 22,7% 31,8% 31,8% 9,1% 31,8% 22,7% 13,6% 9,1%
2 50,0% 50,0% 50,0% 50,0%
7 28,6% 28,6% 14,3% 28,6% 28,6% 28,6%
1202 29,0% 31,1% 30,4% 20,0% 20,9% 19,9% 16,4% 6,7% 5,2% ,2% ,2% ,2% ,2%146 27,4% 18,5% 21,2% 38,4% 11,0% 13,0% 4,8% 2,7% 2,7%
62 29,0% 11,3% 11,3% 51,6% 11,3% 6,5% 6,5% 3,2% 3,2% 21 28,6% 4,8% 23,8% 42,9% 9,5% 23,8% 9,5% 4,8%
3 33,3% 33,3% 33,3% 33,3% 6 16,7% 50,0% 16,7% 33,3% 16,7% 16,7%
22 13,6% 22,7% 9,1% 50,0% 18,2% 4,5% 57 24,6% 19,3% 15,8% 49,1% 7,0% 14,0% 10,5% 7,0% 1,8%
132 29,5% 22,0% 22,0% 32,6% 9,8% 18,9% 6,8% 5,3% 5,3% 216 28,7% 26,4% 29,6% 25,9% 17,6% 16,2% 14,4% 6,5% 4,6% ,5% 499 34,9% 32,5% 33,5% 14,6% 24,0% 19,0% 18,2% 4,8% 5,6% ,2% ,2% ,2% 118 26,3% 18,6% 28,0% 34,7% 17,8% 12,7% 14,4% 5,9% 1,7% ,8% 379 23,2% 31,4% 27,4% 22,2% 20,3% 22,2% 14,5% 7,9% 5,5% ,3% ,5%135 30,4% 20,0% 27,4% 28,9% 20,0% 15,6% 14,1% 6,7% 5,9% ,7% 354 29,9% 22,9% 18,6% 35,3% 12,1% 17,2% 8,8% 5,9% 2,8% ,6% 370 32,7% 33,0% 34,3% 18,1% 21,9% 17,3% 16,2% 4,6% 5,9% ,3%
96 27,1% 29,2% 34,4% 10,4% 30,2% 22,9% 26,0% 6,3% 2,1% 1,0% 52 36,5% 48,1% 44,2% 9,6% 26,9% 11,5% 19,2% 1,9% 3,8% 29 24,1% 37,9% 37,9% 10,3% 17,2% 17,2% 20,7% 3,4% 13,8% 37 21,6% 16,2% 37,8% 24,3% 16,2% 18,9% 18,9% 2,7% 5,4% 2,7%
359 23,4% 30,4% 27,0% 22,3% 19,8% 22,8% 14,5% 8,4% 5,3% ,3% ,6%584 24,0% 22,9% 24,1% 34,6% 14,9% 14,2% 9,4% 7,0% 4,3% ,2% 389 30,8% 27,5% 29,0% 21,1% 20,6% 20,1% 14,1% 4,6% 3,1% ,3% ,5% ,3%242 38,8% 31,8% 31,8% 12,4% 23,6% 20,2% 19,0% 4,5% 5,8% ,4% ,4% 217 26,7% 41,9% 35,5% 11,1% 24,0% 26,7% 24,9% 7,4% 8,3% ,5% ,5%
1432 28,8% 28,6% 28,5% 23,6% 19,3% 18,7% 14,7% 6,0% 4,8% ,2% ,1% ,1% ,1%
SofiaRegional centerSmaller townVillage
Type of residence
MaleFemale
Gender
18-3031-4041-5051-6060+
Age
Finished bachelor, master or higherdegreeFinished collegeFinished secondary schoolFinished elementary and lower
Highest level ofeducation achieved
EmployeeOther status of employed personsBusiness ownerSelf-employed person innon-agricultural activitiesSelf-employed person in agriculturalactivitiesFamily helperRegistered as unemployedUnregistered unemployedRetired - due to ageRetired - other causesPupil, studentHousewifePerson unable to workAnother status of non workingperson
Main occupationalstatus in the present
BulgarianTurkishRomaOther
Ethnicity
No incomeLess than 100 BGN101-150 BGN151-200 BGN201-300 BGN301-500 BGNMore than 500 BGNDon't knowNA
Total householdincome
No incomeLess than 250 BGN251-500 BGN501-750 BGN751-1000 More than 1000 BGNDon't knowNA
Personal monthlyincome
I don't use financial servicesOneTwoThree and more
Financial servicesusage
Total
Base: Row %
Mass media(journalists andTV presenters)
Row %
Governmententities
regulatingthese markets
Row %
Highereducation
institutions ofeconomic andfinancial profile
Row %Don't know
Row %
Non-government
organizations or publicorganizations involved
inconsumer
rightsprotection
Row %
A commercialbank
Row %
Independentfinancial
consultantsRow %
Pension fundand/or
insurancecompanies
Row %
Unit investmentfunds
(managementcompanies)
Row %At school
Row %Other
Row %
InformationDesks
Row %Internet
Which of the following organizations do you see as the most suitable to deliver financial literacy program in Bulgaria?
144

Which of the following aspects of managing personal finances do you believe that should necessarily be part of a financial training course for people...?
269 68,8% 16,4% 14,9% 81,8% 6,3% 11,9% 71,4% 13,8% 14,9% 79,2% 8,6% 12,3%484 60,7% 13,2% 26,0% 75,8% 6,8% 17,4% 65,5% 13,4% 21,1% 71,5% 5,8% 22,7%276 59,8% 13,0% 27,2% 77,2% 4,0% 18,8% 66,7% 12,0% 21,4% 71,0% 5,4% 23,6%403 55,8% 10,4% 33,7% 71,0% 5,2% 23,8% 60,0% 12,4% 27,5% 65,5% 8,2% 26,3%682 61,6% 12,6% 25,8% 78,3% 4,8% 16,9% 66,3% 13,2% 20,5% 70,7% 7,2% 22,1%750 59,9% 13,3% 26,8% 73,6% 6,5% 19,9% 64,4% 12,7% 22,9% 71,6% 6,7% 21,7%311 60,5% 15,1% 24,4% 74,0% 7,4% 18,6% 65,9% 12,2% 21,9% 65,3% 7,7% 27,0%243 67,1% 13,6% 19,3% 79,8% 7,4% 12,8% 71,2% 14,8% 14,0% 75,7% 8,2% 16,0%253 65,6% 13,0% 21,3% 82,2% 4,7% 13,0% 71,9% 13,0% 15,0% 77,9% 7,5% 14,6%257 59,9% 12,1% 28,0% 77,4% 5,1% 17,5% 66,1% 11,3% 22,6% 75,5% 4,7% 19,8%368 53,8% 11,4% 34,8% 69,3% 4,3% 26,4% 55,7% 13,3% 31,0% 65,5% 6,5% 28,0%
242 69,0% 16,1% 14,9% 78,1% 9,5% 12,4% 70,2% 14,0% 15,7% 77,7% 9,5% 12,8%
38 60,5% 21,1% 18,4% 78,9% 7,9% 13,2% 63,2% 18,4% 18,4% 81,6% 5,3% 13,2%683 66,8% 14,3% 18,9% 83,9% 5,6% 10,5% 73,5% 14,1% 12,4% 78,2% 7,0% 14,8%465 47,3% 8,6% 44,1% 62,6% 3,7% 33,8% 50,8% 10,1% 39,1% 56,6% 5,4% 38,1%575 67,7% 15,1% 17,2% 82,6% 6,8% 10,6% 72,9% 14,4% 12,7% 80,5% 7,1% 12,3%72 54,2% 15,3% 30,6% 80,6% 1,4% 18,1% 65,3% 9,7% 25,0% 56,9% 8,3% 34,7%81 81,5% 11,1% 7,4% 84,0% 7,4% 8,6% 76,5% 13,6% 9,9% 87,7% 6,2% 6,2%
29 65,5% 20,7% 13,8% 75,9% 10,3% 13,8% 65,5% 24,1% 10,3% 79,3% 10,3% 10,3%
21 47,6% 4,8% 47,6% 66,7% 4,8% 28,6% 57,1% 9,5% 33,3% 57,1% 9,5% 33,3%
5 40,0% 20,0% 40,0% 40,0% 20,0% 40,0% 60,0% 40,0% 60,0% 40,0%69 47,8% 11,6% 40,6% 69,6% 5,8% 24,6% 62,3% 8,7% 29,0% 65,2% 5,8% 29,0%74 54,1% 5,4% 40,5% 63,5% 2,7% 33,8% 45,9% 13,5% 40,5% 51,4% 10,8% 37,8%
322 49,7% 13,0% 37,3% 67,1% 5,6% 27,3% 54,7% 13,7% 31,7% 64,0% 6,2% 29,8%65 52,3% 7,7% 40,0% 69,2% 30,8% 55,4% 7,7% 36,9% 60,0% 4,6% 35,4%85 64,7% 10,6% 24,7% 75,3% 8,2% 16,5% 70,6% 9,4% 20,0% 62,4% 8,2% 29,4%22 68,2% 9,1% 22,7% 81,8% 18,2% 77,3% 4,5% 18,2% 77,3% 22,7%2 50,0% 50,0% 100,0% 50,0% 50,0% 100,0% 7 71,4% 28,6% 85,7% 14,3% 71,4% 28,6% 71,4% 28,6%
1202 63,8% 13,6% 22,6% 80,0% 5,9% 14,1% 68,6% 13,7% 17,7% 74,9% 7,2% 17,9%146 47,9% 11,6% 40,4% 58,2% 6,2% 35,6% 51,4% 9,6% 39,0% 57,5% 4,8% 37,7%62 30,6% 4,8% 64,5% 40,3% 3,2% 56,5% 38,7% 4,8% 56,5% 37,1% 3,2% 59,7%21 57,1% 14,3% 28,6% 66,7% 33,3% 52,4% 14,3% 33,3% 52,4% 14,3% 33,3%3 66,7% 33,3% 66,7% 33,3% 33,3% 33,3% 33,3% 66,7% 33,3%6 50,0% 16,7% 33,3% 66,7% 16,7% 16,7% 66,7% 16,7% 16,7% 50,0% 16,7% 33,3%
22 50,0% 9,1% 40,9% 63,6% 36,4% 36,4% 13,6% 50,0% 50,0% 4,5% 45,5%57 38,6% 8,8% 52,6% 61,4% 38,6% 42,1% 12,3% 45,6% 52,6% 7,0% 40,4%
132 45,5% 14,4% 40,2% 65,2% 5,3% 29,5% 53,0% 12,9% 34,1% 62,1% 3,8% 34,1%216 54,6% 12,5% 32,9% 75,0% 5,1% 19,9% 57,9% 16,7% 25,5% 65,3% 7,9% 26,9%499 66,9% 13,8% 19,2% 80,4% 5,6% 14,0% 69,7% 13,6% 16,6% 77,0% 7,0% 16,0%118 54,2% 14,4% 31,4% 66,1% 10,2% 23,7% 55,9% 16,1% 28,0% 64,4% 7,6% 28,0%379 67,3% 12,1% 20,6% 80,2% 6,1% 13,7% 76,3% 8,7% 15,0% 76,5% 7,1% 16,4%135 58,5% 6,7% 34,8% 70,4% 4,4% 25,2% 59,3% 11,1% 29,6% 62,2% 6,7% 31,1%354 48,6% 12,4% 39,0% 68,1% 3,4% 28,5% 55,1% 12,1% 32,8% 60,2% 5,6% 34,2%370 61,9% 14,9% 23,2% 81,1% 5,4% 13,5% 63,8% 17,3% 18,9% 76,8% 6,2% 17,0%96 67,7% 15,6% 16,7% 77,1% 9,4% 13,5% 70,8% 15,6% 13,5% 76,0% 8,3% 15,6%52 71,2% 19,2% 9,6% 78,8% 9,6% 11,5% 76,9% 11,5% 11,5% 86,5% 5,8% 7,7%29 89,7% 6,9% 3,4% 86,2% 13,8% 75,9% 10,3% 13,8% 82,8% 10,3% 6,9%37 54,1% 18,9% 27,0% 56,8% 18,9% 24,3% 59,5% 16,2% 24,3% 62,2% 10,8% 27,0%
359 67,1% 12,3% 20,6% 80,5% 6,4% 13,1% 75,8% 9,2% 15,0% 76,0% 8,1% 15,9%584 56,7% 8,9% 34,4% 68,7% 4,1% 27,2% 58,7% 10,3% 31,0% 63,2% 5,7% 31,2%389 64,3% 14,4% 21,3% 80,5% 6,2% 13,4% 66,3% 14,9% 18,8% 75,6% 9,0% 15,4%242 61,6% 16,9% 21,5% 81,4% 6,6% 12,0% 70,7% 14,5% 14,9% 76,4% 6,2% 17,4%217 64,1% 17,1% 18,9% 80,6% 8,3% 11,1% 75,1% 14,7% 10,1% 78,8% 7,4% 13,8%
1432 60,7% 13,0% 26,3% 75,8% 5,7% 18,4% 65,3% 12,9% 21,8% 71,2% 6,9% 21,9%
SofiaRegional centerSmaller townVillage
Type of residence
MaleFemale
Gender
18-3031-4041-5051-6060+
Age
Finished bachelor, master or higherdegreeFinished collegeFinished secondary schoolFinished elementary and lower
Highest level ofeducation achieved
EmployeeOther status of employed personsBusiness ownerSelf-employed person innon-agricultural activitiesSelf-employed person in agriculturalactivitiesFamily helperRegistered as unemployedUnregistered unemployedRetired - due to ageRetired - other causesPupil, studentHousewifePerson unable to workAnother status of non working person
Main occupationalstatus in the present
BulgarianTurkishRomaOther
Ethnicity
No incomeLess than 100 BGN101-150 BGN151-200 BGN201-300 BGN301-500 BGNMore than 500 BGNDon't knowNA
Total householdincome
No incomeLess than 250 BGN251-500 BGN501-750 BGN751-1000 More than 1000 BGNDon't knowNA
Personal monthlyincome
I don't use financial servicesOneTwoThree and more
Financial servicesusage
Total
Base: Row %Yes
Row %No
Row %Don't know
How to form one's own financial targets anddraw a personal current financial plan
Row %Yes
Row %No
Row %Don't know
What to do not to get up to one's neck indebt when using credits
Row %Yes
Row %No
Row %Don't know
How to plan purchases of durables (car,apartment) and evaluate one's abilities to
implement them
Row %Yes
Row %No
Row %Don't know
How does the pension scheme work andwhat methods are available to secure one's
old age income
145
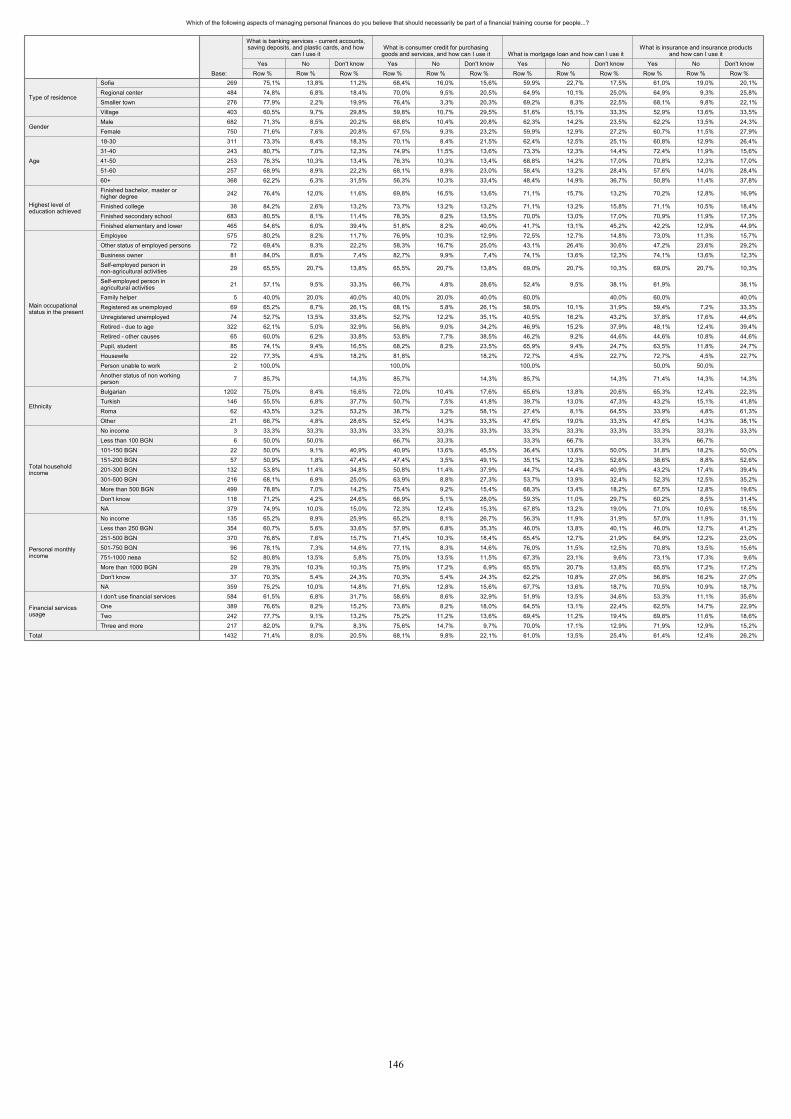
Which of the following aspects of managing personal finances do you believe that should necessarily be part of a financial training course for people...?
269 75,1% 13,8% 11,2% 68,4% 16,0% 15,6% 59,9% 22,7% 17,5% 61,0% 19,0% 20,1%484 74,8% 6,8% 18,4% 70,0% 9,5% 20,5% 64,9% 10,1% 25,0% 64,9% 9,3% 25,8%276 77,9% 2,2% 19,9% 76,4% 3,3% 20,3% 69,2% 8,3% 22,5% 68,1% 9,8% 22,1%403 60,5% 9,7% 29,8% 59,8% 10,7% 29,5% 51,6% 15,1% 33,3% 52,9% 13,6% 33,5%682 71,3% 8,5% 20,2% 68,8% 10,4% 20,8% 62,3% 14,2% 23,5% 62,2% 13,5% 24,3%750 71,6% 7,6% 20,8% 67,5% 9,3% 23,2% 59,9% 12,9% 27,2% 60,7% 11,5% 27,9%311 73,3% 8,4% 18,3% 70,1% 8,4% 21,5% 62,4% 12,5% 25,1% 60,8% 12,9% 26,4%243 80,7% 7,0% 12,3% 74,9% 11,5% 13,6% 73,3% 12,3% 14,4% 72,4% 11,9% 15,6%253 76,3% 10,3% 13,4% 76,3% 10,3% 13,4% 68,8% 14,2% 17,0% 70,8% 12,3% 17,0%257 68,9% 8,9% 22,2% 68,1% 8,9% 23,0% 58,4% 13,2% 28,4% 57,6% 14,0% 28,4%368 62,2% 6,3% 31,5% 56,3% 10,3% 33,4% 48,4% 14,9% 36,7% 50,8% 11,4% 37,8%
242 76,4% 12,0% 11,6% 69,8% 16,5% 13,6% 71,1% 15,7% 13,2% 70,2% 12,8% 16,9%
38 84,2% 2,6% 13,2% 73,7% 13,2% 13,2% 71,1% 13,2% 15,8% 71,1% 10,5% 18,4%683 80,5% 8,1% 11,4% 78,3% 8,2% 13,5% 70,0% 13,0% 17,0% 70,9% 11,9% 17,3%465 54,6% 6,0% 39,4% 51,8% 8,2% 40,0% 41,7% 13,1% 45,2% 42,2% 12,9% 44,9%575 80,2% 8,2% 11,7% 76,9% 10,3% 12,9% 72,5% 12,7% 14,8% 73,0% 11,3% 15,7%
72 69,4% 8,3% 22,2% 58,3% 16,7% 25,0% 43,1% 26,4% 30,6% 47,2% 23,6% 29,2%81 84,0% 8,6% 7,4% 82,7% 9,9% 7,4% 74,1% 13,6% 12,3% 74,1% 13,6% 12,3%
29 65,5% 20,7% 13,8% 65,5% 20,7% 13,8% 69,0% 20,7% 10,3% 69,0% 20,7% 10,3%
21 57,1% 9,5% 33,3% 66,7% 4,8% 28,6% 52,4% 9,5% 38,1% 61,9% 38,1%
5 40,0% 20,0% 40,0% 40,0% 20,0% 40,0% 60,0% 40,0% 60,0% 40,0%69 65,2% 8,7% 26,1% 68,1% 5,8% 26,1% 58,0% 10,1% 31,9% 59,4% 7,2% 33,3%74 52,7% 13,5% 33,8% 52,7% 12,2% 35,1% 40,5% 16,2% 43,2% 37,8% 17,6% 44,6%
322 62,1% 5,0% 32,9% 56,8% 9,0% 34,2% 46,9% 15,2% 37,9% 48,1% 12,4% 39,4%65 60,0% 6,2% 33,8% 53,8% 7,7% 38,5% 46,2% 9,2% 44,6% 44,6% 10,8% 44,6%85 74,1% 9,4% 16,5% 68,2% 8,2% 23,5% 65,9% 9,4% 24,7% 63,5% 11,8% 24,7%22 77,3% 4,5% 18,2% 81,8% 18,2% 72,7% 4,5% 22,7% 72,7% 4,5% 22,7%
2 100,0% 100,0% 100,0% 50,0% 50,0%
7 85,7% 14,3% 85,7% 14,3% 85,7% 14,3% 71,4% 14,3% 14,3%
1202 75,0% 8,4% 16,6% 72,0% 10,4% 17,6% 65,6% 13,8% 20,6% 65,3% 12,4% 22,3%146 55,5% 6,8% 37,7% 50,7% 7,5% 41,8% 39,7% 13,0% 47,3% 43,2% 15,1% 41,8%
62 43,5% 3,2% 53,2% 38,7% 3,2% 58,1% 27,4% 8,1% 64,5% 33,9% 4,8% 61,3%21 66,7% 4,8% 28,6% 52,4% 14,3% 33,3% 47,6% 19,0% 33,3% 47,6% 14,3% 38,1%
3 33,3% 33,3% 33,3% 33,3% 33,3% 33,3% 33,3% 33,3% 33,3% 33,3% 33,3% 33,3%6 50,0% 50,0% 66,7% 33,3% 33,3% 66,7% 33,3% 66,7%
22 50,0% 9,1% 40,9% 40,9% 13,6% 45,5% 36,4% 13,6% 50,0% 31,8% 18,2% 50,0%57 50,9% 1,8% 47,4% 47,4% 3,5% 49,1% 35,1% 12,3% 52,6% 38,6% 8,8% 52,6%
132 53,8% 11,4% 34,8% 50,8% 11,4% 37,9% 44,7% 14,4% 40,9% 43,2% 17,4% 39,4%216 68,1% 6,9% 25,0% 63,9% 8,8% 27,3% 53,7% 13,9% 32,4% 52,3% 12,5% 35,2%499 78,8% 7,0% 14,2% 75,4% 9,2% 15,4% 68,3% 13,4% 18,2% 67,5% 12,8% 19,6%118 71,2% 4,2% 24,6% 66,9% 5,1% 28,0% 59,3% 11,0% 29,7% 60,2% 8,5% 31,4%379 74,9% 10,0% 15,0% 72,3% 12,4% 15,3% 67,8% 13,2% 19,0% 71,0% 10,6% 18,5%135 65,2% 8,9% 25,9% 65,2% 8,1% 26,7% 56,3% 11,9% 31,9% 57,0% 11,9% 31,1%354 60,7% 5,6% 33,6% 57,9% 6,8% 35,3% 46,0% 13,8% 40,1% 46,0% 12,7% 41,2%370 76,8% 7,6% 15,7% 71,4% 10,3% 18,4% 65,4% 12,7% 21,9% 64,9% 12,2% 23,0%
96 78,1% 7,3% 14,6% 77,1% 8,3% 14,6% 76,0% 11,5% 12,5% 70,8% 13,5% 15,6%52 80,8% 13,5% 5,8% 75,0% 13,5% 11,5% 67,3% 23,1% 9,6% 73,1% 17,3% 9,6%29 79,3% 10,3% 10,3% 75,9% 17,2% 6,9% 65,5% 20,7% 13,8% 65,5% 17,2% 17,2%37 70,3% 5,4% 24,3% 70,3% 5,4% 24,3% 62,2% 10,8% 27,0% 56,8% 16,2% 27,0%
359 75,2% 10,0% 14,8% 71,6% 12,8% 15,6% 67,7% 13,6% 18,7% 70,5% 10,9% 18,7%584 61,5% 6,8% 31,7% 58,6% 8,6% 32,9% 51,9% 13,5% 34,6% 53,3% 11,1% 35,6%389 76,6% 8,2% 15,2% 73,8% 8,2% 18,0% 64,5% 13,1% 22,4% 62,5% 14,7% 22,9%242 77,7% 9,1% 13,2% 75,2% 11,2% 13,6% 69,4% 11,2% 19,4% 69,8% 11,6% 18,6%217 82,0% 9,7% 8,3% 75,6% 14,7% 9,7% 70,0% 17,1% 12,9% 71,9% 12,9% 15,2%
1432 71,4% 8,0% 20,5% 68,1% 9,8% 22,1% 61,0% 13,5% 25,4% 61,4% 12,4% 26,2%
SofiaRegional centerSmaller townVillage
Type of residence
MaleFemale
Gender
18-3031-4041-5051-6060+
Age
Finished bachelor, master orhigher degreeFinished collegeFinished secondary schoolFinished elementary and lower
Highest level ofeducation achieved
EmployeeOther status of employed personsBusiness ownerSelf-employed person innon-agricultural activitiesSelf-employed person inagricultural activitiesFamily helperRegistered as unemployedUnregistered unemployedRetired - due to ageRetired - other causesPupil, studentHousewifePerson unable to workAnother status of non workingperson
Main occupationalstatus in the present
BulgarianTurkishRomaOther
Ethnicity
No incomeLess than 100 BGN101-150 BGN151-200 BGN201-300 BGN301-500 BGNMore than 500 BGNDon't knowNA
Total householdincome
No incomeLess than 250 BGN251-500 BGN501-750 BGN751-1000 More than 1000 BGNDon't knowNA
Personal monthlyincome
I don't use financial servicesOneTwoThree and more
Financial servicesusage
Total
Base: Row %Yes
Row %No
Row %Don't know
What is banking services - current accounts,saving deposits, and plastic cards, and how
can I use it
Row %Yes
Row %No
Row %Don't know
What is consumer credit for purchasinggoods and services, and how can I use it
Row %Yes
Row %No
Row %Don't know
What is mortgage loan and how can I use it
Row %Yes
Row %No
Row %Don't know
What is insurance and insurance productsand how can I use it
146
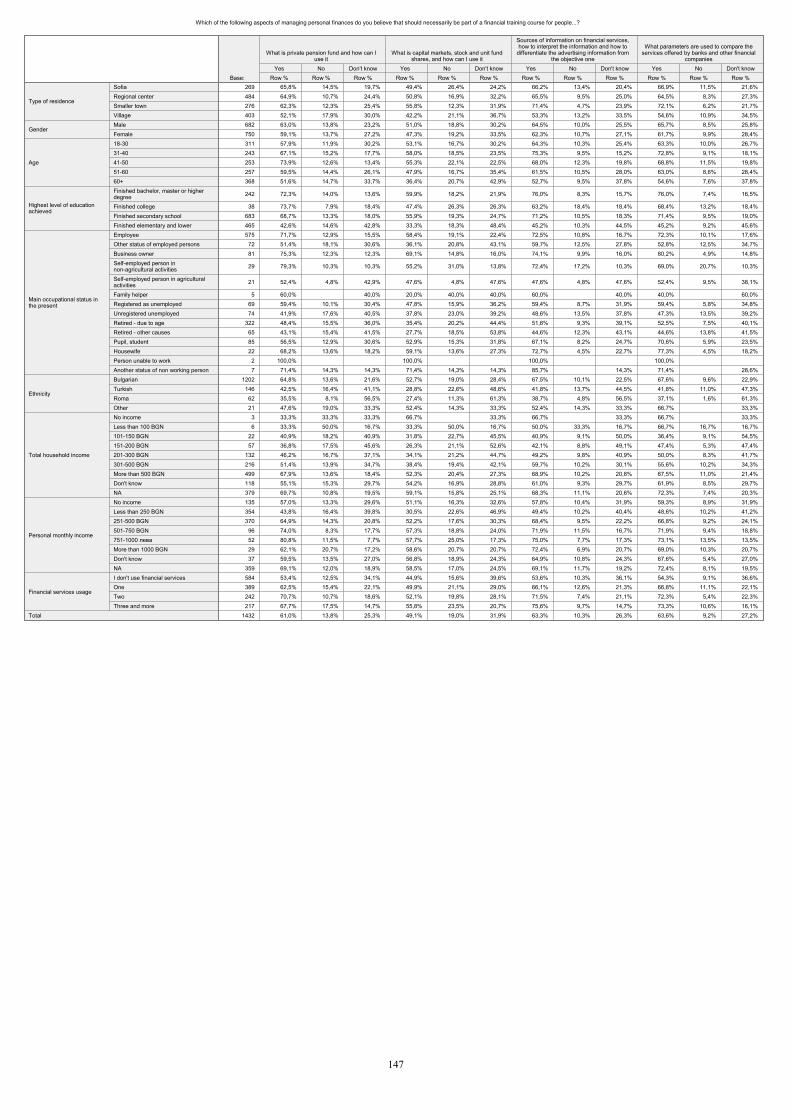
Which of the following aspects of managing personal finances do you believe that should necessarily be part of a financial training course for people...?
269 65,8% 14,5% 19,7% 49,4% 26,4% 24,2% 66,2% 13,4% 20,4% 66,9% 11,5% 21,6%484 64,9% 10,7% 24,4% 50,8% 16,9% 32,2% 65,5% 9,5% 25,0% 64,5% 8,3% 27,3%276 62,3% 12,3% 25,4% 55,8% 12,3% 31,9% 71,4% 4,7% 23,9% 72,1% 6,2% 21,7%403 52,1% 17,9% 30,0% 42,2% 21,1% 36,7% 53,3% 13,2% 33,5% 54,6% 10,9% 34,5%682 63,0% 13,8% 23,2% 51,0% 18,8% 30,2% 64,5% 10,0% 25,5% 65,7% 8,5% 25,8%750 59,1% 13,7% 27,2% 47,3% 19,2% 33,5% 62,3% 10,7% 27,1% 61,7% 9,9% 28,4%311 57,9% 11,9% 30,2% 53,1% 16,7% 30,2% 64,3% 10,3% 25,4% 63,3% 10,0% 26,7%243 67,1% 15,2% 17,7% 58,0% 18,5% 23,5% 75,3% 9,5% 15,2% 72,8% 9,1% 18,1%253 73,9% 12,6% 13,4% 55,3% 22,1% 22,5% 68,0% 12,3% 19,8% 68,8% 11,5% 19,8%257 59,5% 14,4% 26,1% 47,9% 16,7% 35,4% 61,5% 10,5% 28,0% 63,0% 8,6% 28,4%368 51,6% 14,7% 33,7% 36,4% 20,7% 42,9% 52,7% 9,5% 37,8% 54,6% 7,6% 37,8%
242 72,3% 14,0% 13,6% 59,9% 18,2% 21,9% 76,0% 8,3% 15,7% 76,0% 7,4% 16,5%
38 73,7% 7,9% 18,4% 47,4% 26,3% 26,3% 63,2% 18,4% 18,4% 68,4% 13,2% 18,4%683 68,7% 13,3% 18,0% 55,9% 19,3% 24,7% 71,2% 10,5% 18,3% 71,4% 9,5% 19,0%465 42,6% 14,6% 42,8% 33,3% 18,3% 48,4% 45,2% 10,3% 44,5% 45,2% 9,2% 45,6%575 71,7% 12,9% 15,5% 58,4% 19,1% 22,4% 72,5% 10,8% 16,7% 72,3% 10,1% 17,6%72 51,4% 18,1% 30,6% 36,1% 20,8% 43,1% 59,7% 12,5% 27,8% 52,8% 12,5% 34,7%81 75,3% 12,3% 12,3% 69,1% 14,8% 16,0% 74,1% 9,9% 16,0% 80,2% 4,9% 14,8%
29 79,3% 10,3% 10,3% 55,2% 31,0% 13,8% 72,4% 17,2% 10,3% 69,0% 20,7% 10,3%
21 52,4% 4,8% 42,9% 47,6% 4,8% 47,6% 47,6% 4,8% 47,6% 52,4% 9,5% 38,1%
5 60,0% 40,0% 20,0% 40,0% 40,0% 60,0% 40,0% 40,0% 60,0%69 59,4% 10,1% 30,4% 47,8% 15,9% 36,2% 59,4% 8,7% 31,9% 59,4% 5,8% 34,8%74 41,9% 17,6% 40,5% 37,8% 23,0% 39,2% 48,6% 13,5% 37,8% 47,3% 13,5% 39,2%
322 48,4% 15,5% 36,0% 35,4% 20,2% 44,4% 51,6% 9,3% 39,1% 52,5% 7,5% 40,1%65 43,1% 15,4% 41,5% 27,7% 18,5% 53,8% 44,6% 12,3% 43,1% 44,6% 13,8% 41,5%85 56,5% 12,9% 30,6% 52,9% 15,3% 31,8% 67,1% 8,2% 24,7% 70,6% 5,9% 23,5%22 68,2% 13,6% 18,2% 59,1% 13,6% 27,3% 72,7% 4,5% 22,7% 77,3% 4,5% 18,2%2 100,0% 100,0% 100,0% 100,0% 7 71,4% 14,3% 14,3% 71,4% 14,3% 14,3% 85,7% 14,3% 71,4% 28,6%
1202 64,8% 13,6% 21,6% 52,7% 19,0% 28,4% 67,5% 10,1% 22,5% 67,6% 9,6% 22,9%146 42,5% 16,4% 41,1% 28,8% 22,6% 48,6% 41,8% 13,7% 44,5% 41,8% 11,0% 47,3%62 35,5% 8,1% 56,5% 27,4% 11,3% 61,3% 38,7% 4,8% 56,5% 37,1% 1,6% 61,3%21 47,6% 19,0% 33,3% 52,4% 14,3% 33,3% 52,4% 14,3% 33,3% 66,7% 33,3%3 33,3% 33,3% 33,3% 66,7% 33,3% 66,7% 33,3% 66,7% 33,3%6 33,3% 50,0% 16,7% 33,3% 50,0% 16,7% 50,0% 33,3% 16,7% 66,7% 16,7% 16,7%
22 40,9% 18,2% 40,9% 31,8% 22,7% 45,5% 40,9% 9,1% 50,0% 36,4% 9,1% 54,5%57 36,8% 17,5% 45,6% 26,3% 21,1% 52,6% 42,1% 8,8% 49,1% 47,4% 5,3% 47,4%
132 46,2% 16,7% 37,1% 34,1% 21,2% 44,7% 49,2% 9,8% 40,9% 50,0% 8,3% 41,7%216 51,4% 13,9% 34,7% 38,4% 19,4% 42,1% 59,7% 10,2% 30,1% 55,6% 10,2% 34,3%499 67,9% 13,6% 18,4% 52,3% 20,4% 27,3% 68,9% 10,2% 20,8% 67,5% 11,0% 21,4%118 55,1% 15,3% 29,7% 54,2% 16,9% 28,8% 61,0% 9,3% 29,7% 61,9% 8,5% 29,7%379 69,7% 10,8% 19,5% 59,1% 15,8% 25,1% 68,3% 11,1% 20,6% 72,3% 7,4% 20,3%135 57,0% 13,3% 29,6% 51,1% 16,3% 32,6% 57,8% 10,4% 31,9% 59,3% 8,9% 31,9%354 43,8% 16,4% 39,8% 30,5% 22,6% 46,9% 49,4% 10,2% 40,4% 48,6% 10,2% 41,2%370 64,9% 14,3% 20,8% 52,2% 17,6% 30,3% 68,4% 9,5% 22,2% 66,8% 9,2% 24,1%96 74,0% 8,3% 17,7% 57,3% 18,8% 24,0% 71,9% 11,5% 16,7% 71,9% 9,4% 18,8%52 80,8% 11,5% 7,7% 57,7% 25,0% 17,3% 75,0% 7,7% 17,3% 73,1% 13,5% 13,5%29 62,1% 20,7% 17,2% 58,6% 20,7% 20,7% 72,4% 6,9% 20,7% 69,0% 10,3% 20,7%37 59,5% 13,5% 27,0% 56,8% 18,9% 24,3% 64,9% 10,8% 24,3% 67,6% 5,4% 27,0%
359 69,1% 12,0% 18,9% 58,5% 17,0% 24,5% 69,1% 11,7% 19,2% 72,4% 8,1% 19,5%584 53,4% 12,5% 34,1% 44,9% 15,6% 39,6% 53,6% 10,3% 36,1% 54,3% 9,1% 36,6%389 62,5% 15,4% 22,1% 49,9% 21,1% 29,0% 66,1% 12,6% 21,3% 66,8% 11,1% 22,1%242 70,7% 10,7% 18,6% 52,1% 19,8% 28,1% 71,5% 7,4% 21,1% 72,3% 5,4% 22,3%217 67,7% 17,5% 14,7% 55,8% 23,5% 20,7% 75,6% 9,7% 14,7% 73,3% 10,6% 16,1%
1432 61,0% 13,8% 25,3% 49,1% 19,0% 31,9% 63,3% 10,3% 26,3% 63,6% 9,2% 27,2%
SofiaRegional centerSmaller townVillage
Type of residence
MaleFemale
Gender
18-3031-4041-5051-6060+
Age
Finished bachelor, master or higherdegreeFinished collegeFinished secondary schoolFinished elementary and lower
Highest level of educationachieved
EmployeeOther status of employed personsBusiness ownerSelf-employed person innon-agricultural activitiesSelf-employed person in agriculturalactivitiesFamily helperRegistered as unemployedUnregistered unemployedRetired - due to ageRetired - other causesPupil, studentHousewifePerson unable to workAnother status of non working person
Main occupational status inthe present
BulgarianTurkishRomaOther
Ethnicity
No incomeLess than 100 BGN101-150 BGN151-200 BGN201-300 BGN301-500 BGNMore than 500 BGNDon't knowNA
Total household income
No incomeLess than 250 BGN251-500 BGN501-750 BGN751-1000 More than 1000 BGNDon't knowNA
Personal monthly income
I don't use financial servicesOneTwoThree and more
Financial services usage
Total
Base: Row %Yes
Row %No
Row %Don't know
What is private pension fund and how can Iuse it
Row %Yes
Row %No
Row %Don't know
What is capital markets, stock and unit fundshares, and how can I use it
Row %Yes
Row %No
Row %Don't know
Sources of information on financial services,how to interpret the information and how to
differentiate the advertising information fromthe objective one
Row %Yes
Row %No
Row %Don't know
What parameters are used to compare theservices offered by banks and other financial
companies
147
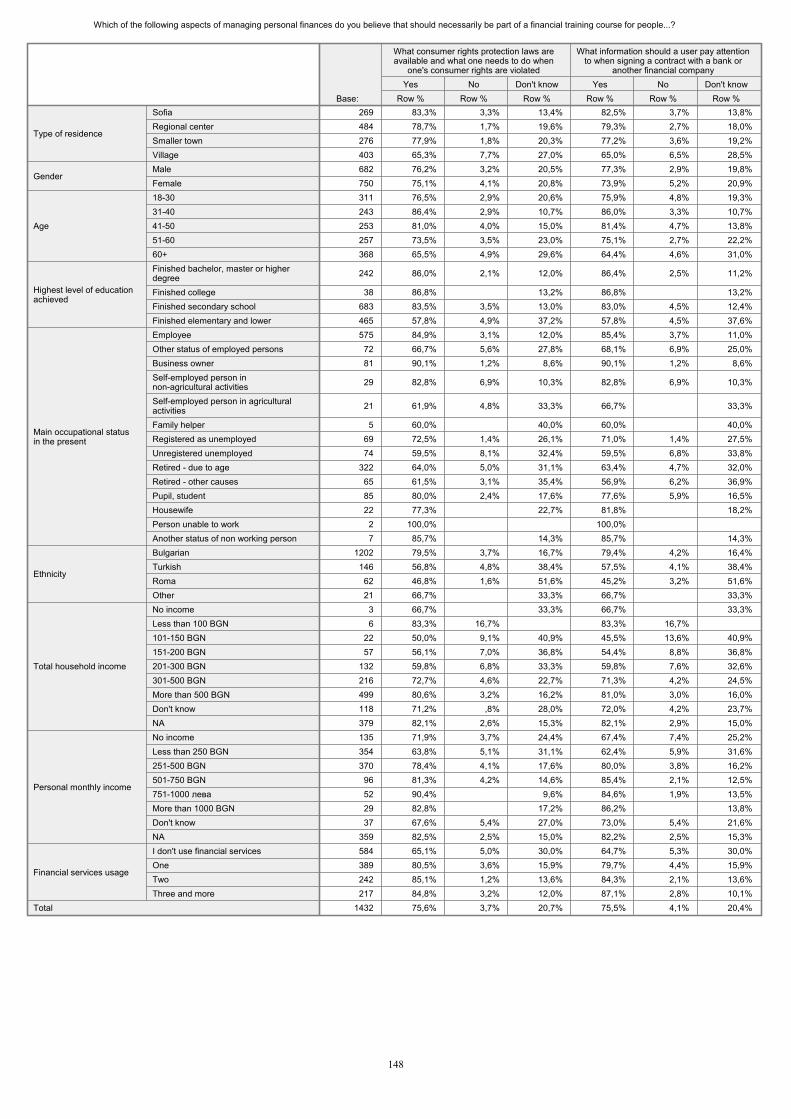
Which of the following aspects of managing personal finances do you believe that should necessarily be part of a financial training course for people...?
269 83,3% 3,3% 13,4% 82,5% 3,7% 13,8%484 78,7% 1,7% 19,6% 79,3% 2,7% 18,0%276 77,9% 1,8% 20,3% 77,2% 3,6% 19,2%403 65,3% 7,7% 27,0% 65,0% 6,5% 28,5%682 76,2% 3,2% 20,5% 77,3% 2,9% 19,8%750 75,1% 4,1% 20,8% 73,9% 5,2% 20,9%311 76,5% 2,9% 20,6% 75,9% 4,8% 19,3%243 86,4% 2,9% 10,7% 86,0% 3,3% 10,7%253 81,0% 4,0% 15,0% 81,4% 4,7% 13,8%257 73,5% 3,5% 23,0% 75,1% 2,7% 22,2%368 65,5% 4,9% 29,6% 64,4% 4,6% 31,0%
242 86,0% 2,1% 12,0% 86,4% 2,5% 11,2%
38 86,8% 13,2% 86,8% 13,2%683 83,5% 3,5% 13,0% 83,0% 4,5% 12,4%465 57,8% 4,9% 37,2% 57,8% 4,5% 37,6%575 84,9% 3,1% 12,0% 85,4% 3,7% 11,0%
72 66,7% 5,6% 27,8% 68,1% 6,9% 25,0%81 90,1% 1,2% 8,6% 90,1% 1,2% 8,6%
29 82,8% 6,9% 10,3% 82,8% 6,9% 10,3%
21 61,9% 4,8% 33,3% 66,7% 33,3%
5 60,0% 40,0% 60,0% 40,0%69 72,5% 1,4% 26,1% 71,0% 1,4% 27,5%74 59,5% 8,1% 32,4% 59,5% 6,8% 33,8%
322 64,0% 5,0% 31,1% 63,4% 4,7% 32,0%65 61,5% 3,1% 35,4% 56,9% 6,2% 36,9%85 80,0% 2,4% 17,6% 77,6% 5,9% 16,5%22 77,3% 22,7% 81,8% 18,2%
2 100,0% 100,0% 7 85,7% 14,3% 85,7% 14,3%
1202 79,5% 3,7% 16,7% 79,4% 4,2% 16,4%146 56,8% 4,8% 38,4% 57,5% 4,1% 38,4%
62 46,8% 1,6% 51,6% 45,2% 3,2% 51,6%21 66,7% 33,3% 66,7% 33,3%
3 66,7% 33,3% 66,7% 33,3%6 83,3% 16,7% 83,3% 16,7%
22 50,0% 9,1% 40,9% 45,5% 13,6% 40,9%57 56,1% 7,0% 36,8% 54,4% 8,8% 36,8%
132 59,8% 6,8% 33,3% 59,8% 7,6% 32,6%216 72,7% 4,6% 22,7% 71,3% 4,2% 24,5%499 80,6% 3,2% 16,2% 81,0% 3,0% 16,0%118 71,2% ,8% 28,0% 72,0% 4,2% 23,7%379 82,1% 2,6% 15,3% 82,1% 2,9% 15,0%135 71,9% 3,7% 24,4% 67,4% 7,4% 25,2%354 63,8% 5,1% 31,1% 62,4% 5,9% 31,6%370 78,4% 4,1% 17,6% 80,0% 3,8% 16,2%
96 81,3% 4,2% 14,6% 85,4% 2,1% 12,5%52 90,4% 9,6% 84,6% 1,9% 13,5%29 82,8% 17,2% 86,2% 13,8%37 67,6% 5,4% 27,0% 73,0% 5,4% 21,6%
359 82,5% 2,5% 15,0% 82,2% 2,5% 15,3%584 65,1% 5,0% 30,0% 64,7% 5,3% 30,0%389 80,5% 3,6% 15,9% 79,7% 4,4% 15,9%242 85,1% 1,2% 13,6% 84,3% 2,1% 13,6%217 84,8% 3,2% 12,0% 87,1% 2,8% 10,1%
1432 75,6% 3,7% 20,7% 75,5% 4,1% 20,4%
SofiaRegional centerSmaller townVillage
Type of residence
MaleFemale
Gender
18-3031-4041-5051-6060+
Age
Finished bachelor, master or higherdegreeFinished collegeFinished secondary schoolFinished elementary and lower
Highest level of educationachieved
EmployeeOther status of employed personsBusiness ownerSelf-employed person innon-agricultural activitiesSelf-employed person in agriculturalactivitiesFamily helperRegistered as unemployedUnregistered unemployedRetired - due to ageRetired - other causesPupil, studentHousewifePerson unable to workAnother status of non working person
Main occupational statusin the present
BulgarianTurkishRomaOther
Ethnicity
No incomeLess than 100 BGN101-150 BGN151-200 BGN201-300 BGN301-500 BGNMore than 500 BGNDon't knowNA
Total household income
No incomeLess than 250 BGN251-500 BGN501-750 BGN751-1000 More than 1000 BGNDon't knowNA
Personal monthly income
I don't use financial servicesOneTwoThree and more
Financial services usage
Total
Base: Row %Yes
Row %No
Row %Don't know
What consumer rights protection laws areavailable and what one needs to do when
one's consumer rights are violated
Row %Yes
Row %No
Row %Don't know
What information should a user pay attentionto when signing a contract with a bank or
another financial company
148
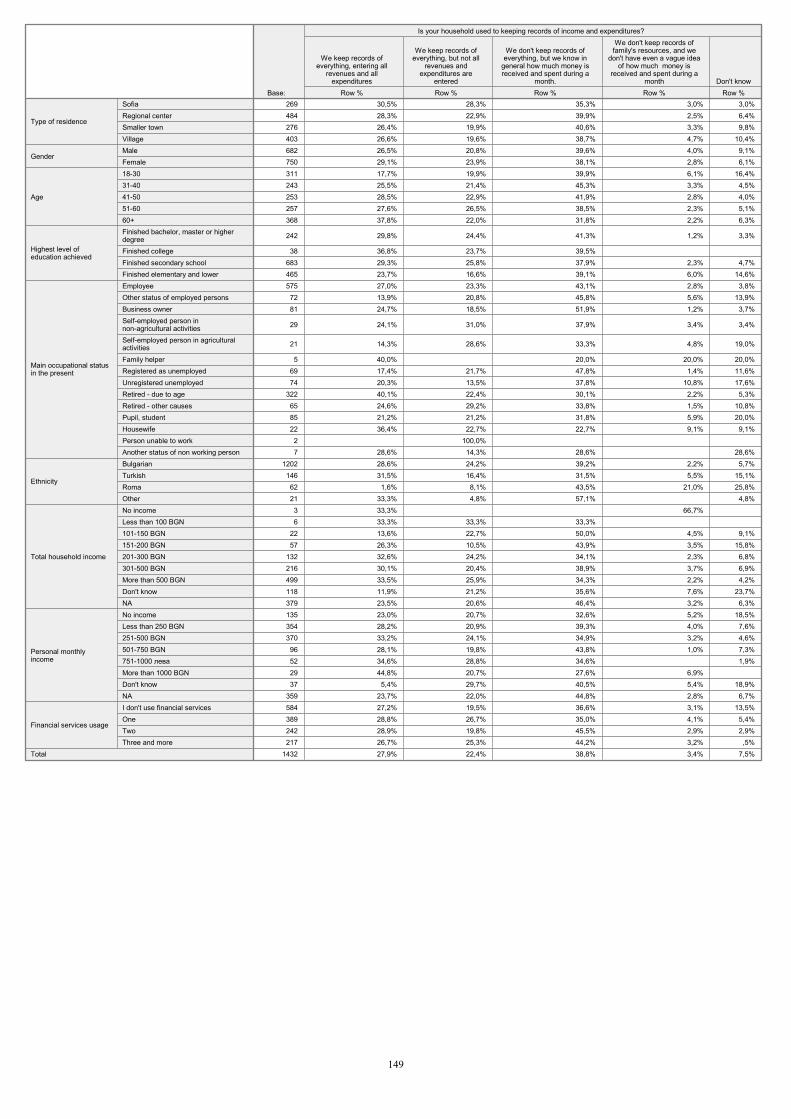
269 30,5% 28,3% 35,3% 3,0% 3,0%484 28,3% 22,9% 39,9% 2,5% 6,4%276 26,4% 19,9% 40,6% 3,3% 9,8%403 26,6% 19,6% 38,7% 4,7% 10,4%682 26,5% 20,8% 39,6% 4,0% 9,1%750 29,1% 23,9% 38,1% 2,8% 6,1%311 17,7% 19,9% 39,9% 6,1% 16,4%243 25,5% 21,4% 45,3% 3,3% 4,5%253 28,5% 22,9% 41,9% 2,8% 4,0%257 27,6% 26,5% 38,5% 2,3% 5,1%368 37,8% 22,0% 31,8% 2,2% 6,3%
242 29,8% 24,4% 41,3% 1,2% 3,3%
38 36,8% 23,7% 39,5% 683 29,3% 25,8% 37,9% 2,3% 4,7%465 23,7% 16,6% 39,1% 6,0% 14,6%575 27,0% 23,3% 43,1% 2,8% 3,8%72 13,9% 20,8% 45,8% 5,6% 13,9%81 24,7% 18,5% 51,9% 1,2% 3,7%
29 24,1% 31,0% 37,9% 3,4% 3,4%
21 14,3% 28,6% 33,3% 4,8% 19,0%
5 40,0% 20,0% 20,0% 20,0%69 17,4% 21,7% 47,8% 1,4% 11,6%74 20,3% 13,5% 37,8% 10,8% 17,6%
322 40,1% 22,4% 30,1% 2,2% 5,3%65 24,6% 29,2% 33,8% 1,5% 10,8%85 21,2% 21,2% 31,8% 5,9% 20,0%22 36,4% 22,7% 22,7% 9,1% 9,1%2 100,0% 7 28,6% 14,3% 28,6% 28,6%
1202 28,6% 24,2% 39,2% 2,2% 5,7%146 31,5% 16,4% 31,5% 5,5% 15,1%62 1,6% 8,1% 43,5% 21,0% 25,8%21 33,3% 4,8% 57,1% 4,8%3 33,3% 66,7% 6 33,3% 33,3% 33,3%
22 13,6% 22,7% 50,0% 4,5% 9,1%57 26,3% 10,5% 43,9% 3,5% 15,8%
132 32,6% 24,2% 34,1% 2,3% 6,8%216 30,1% 20,4% 38,9% 3,7% 6,9%499 33,5% 25,9% 34,3% 2,2% 4,2%118 11,9% 21,2% 35,6% 7,6% 23,7%379 23,5% 20,6% 46,4% 3,2% 6,3%135 23,0% 20,7% 32,6% 5,2% 18,5%354 28,2% 20,9% 39,3% 4,0% 7,6%370 33,2% 24,1% 34,9% 3,2% 4,6%96 28,1% 19,8% 43,8% 1,0% 7,3%52 34,6% 28,8% 34,6% 1,9%29 44,8% 20,7% 27,6% 6,9% 37 5,4% 29,7% 40,5% 5,4% 18,9%
359 23,7% 22,0% 44,8% 2,8% 6,7%584 27,2% 19,5% 36,6% 3,1% 13,5%389 28,8% 26,7% 35,0% 4,1% 5,4%242 28,9% 19,8% 45,5% 2,9% 2,9%217 26,7% 25,3% 44,2% 3,2% ,5%
1432 27,9% 22,4% 38,8% 3,4% 7,5%
SofiaRegional centerSmaller townVillage
Type of residence
MaleFemale
Gender
18-3031-4041-5051-6060+
Age
Finished bachelor, master or higherdegreeFinished collegeFinished secondary schoolFinished elementary and lower
Highest level ofeducation achieved
EmployeeOther status of employed personsBusiness ownerSelf-employed person innon-agricultural activitiesSelf-employed person in agriculturalactivitiesFamily helperRegistered as unemployedUnregistered unemployedRetired - due to ageRetired - other causesPupil, studentHousewifePerson unable to workAnother status of non working person
Main occupational statusin the present
BulgarianTurkishRomaOther
Ethnicity
No incomeLess than 100 BGN101-150 BGN151-200 BGN201-300 BGN301-500 BGNMore than 500 BGNDon't knowNA
Total household income
No incomeLess than 250 BGN251-500 BGN501-750 BGN751-1000 More than 1000 BGNDon't knowNA
Personal monthlyincome
I don't use financial servicesOneTwoThree and more
Financial services usage
Total
Base: Row %
We keep records ofeverything, entering all
revenues and allexpenditures
Row %
We keep records ofeverything, but not all
revenues andexpenditures are
enteredRow %
We don't keep records ofeverything, but we know in
general how much money isreceived and spent during a
month.Row %
We don't keep records offamily's resources, and we
don't have even a vague ideaof how much money is
received and spent during amonth
Row %Don't know
Is your household used to keeping records of income and expenditures?
149

269 34,2% 25,3% 24,9% 7,8% 3,3% 4,5%484 34,3% 27,7% 20,2% 5,4% 3,1% 9,3%276 37,7% 26,8% 23,2% 4,7% 1,8% 5,8%403 39,5% 22,6% 21,6% 4,5% 1,2% 10,7%682 33,6% 24,9% 23,3% 6,2% 2,8% 9,2%750 38,9% 26,3% 20,9% 4,8% 2,0% 7,1%311 35,0% 19,3% 20,3% 6,1% 2,9% 16,4%243 37,4% 28,0% 24,3% 3,7% 1,6% 4,9%253 36,8% 28,9% 22,1% 5,1% 2,8% 4,3%257 35,4% 27,2% 24,5% 5,4% 1,9% 5,4%368 37,2% 26,1% 20,4% 6,3% 2,4% 7,6%
242 20,2% 29,3% 30,2% 10,3% 4,5% 5,4%
38 23,7% 26,3% 31,6% 2,6% 2,6% 13,2%683 35,9% 27,8% 22,1% 5,9% 1,9% 6,4%465 46,5% 20,4% 17,0% 2,6% 1,9% 11,6%575 31,5% 29,6% 26,6% 5,2% 1,7% 5,4%72 54,2% 25,0% 9,7% 2,8% 8,3%81 13,6% 25,9% 33,3% 13,6% 4,9% 8,6%
29 17,2% 41,4% 37,9% 3,4%
21 14,3% 33,3% 33,3% 4,8% 9,5% 4,8%
5 40,0% 20,0% 20,0% 20,0%69 68,1% 14,5% 10,1% 7,2%74 62,2% 13,5% 6,8% 1,4% 4,1% 12,2%
322 36,6% 26,1% 19,6% 6,8% 2,8% 8,1%65 52,3% 21,5% 20,0% 3,1% 3,1%85 23,5% 17,6% 23,5% 9,4% 2,4% 23,5%22 40,9% 9,1% 9,1% 9,1% 9,1% 22,7%2 100,0% 7 42,9% 28,6% 28,6%
1202 33,4% 27,5% 23,8% 5,2% 2,4% 7,7%146 43,8% 19,9% 19,2% 7,5% 1,4% 8,2%62 71,0% 8,1% 1,6% 1,6% 1,6% 16,1%21 52,4% 14,3% 4,8% 14,3% 9,5% 4,8%3 66,7% 33,3% 6 83,3% 16,7%
22 72,7% 22,7% 4,5% 57 61,4% 14,0% 14,0% 10,5%
132 53,0% 23,5% 12,9% ,8% ,8% 9,1%216 44,9% 22,7% 14,8% 3,7% 2,3% 11,6%499 29,9% 28,1% 26,9% 8,0% 3,4% 3,8%118 38,1% 16,9% 17,8% 8,5% 18,6%379 26,9% 29,8% 27,4% 4,7% 2,6% 8,4%135 42,2% 14,8% 14,1% 5,9% 3,7% 19,3%354 50,3% 21,5% 13,8% 2,8% 1,4% 10,2%370 37,8% 28,6% 22,4% 4,1% 2,7% 4,3%96 18,8% 36,5% 25,0% 12,5% 2,1% 5,2%52 19,2% 25,0% 38,5% 11,5% 3,8% 1,9%29 10,3% 13,8% 37,9% 20,7% 6,9% 10,3%37 45,9% 24,3% 16,2% 2,7% 10,8%
359 27,3% 29,0% 29,0% 5,6% 2,2% 7,0%584 40,8% 23,8% 20,2% 3,4% 1,4% 10,4%389 33,7% 27,5% 21,6% 4,6% 3,3% 9,3%242 35,1% 26,0% 24,0% 7,0% 2,5% 5,4%217 30,9% 26,7% 25,8% 10,6% 3,2% 2,8%
1432 36,4% 25,6% 22,1% 5,4% 2,4% 8,1%
SofiaRegional centerSmaller townVillage
Type of residence
MaleFemale
Gender
18-3031-4041-5051-6060+
Age
Finished bachelor, master or higherdegreeFinished collegeFinished secondary schoolFinished elementary and lower
Highest level of educationachieved
EmployeeOther status of employed personsBusiness ownerSelf-employed person innon-agricultural activitiesSelf-employed person in agriculturalactivitiesFamily helperRegistered as unemployedUnregistered unemployedRetired - due to ageRetired - other causesPupil, studentHousewifePerson unable to workAnother status of non working person
Main occupational status inthe present
BulgarianTurkishRomaOther
Ethnicity
No incomeLess than 100 BGN101-150 BGN151-200 BGN201-300 BGN301-500 BGNMore than 500 BGNDon't knowNA
Total household income
No incomeLess than 250 BGN251-500 BGN501-750 BGN751-1000 More than 1000 BGNDon't knowNA
Personal monthly income
I don't use financial servicesOneTwoThree and more
Financial services usage
Total
Base: Row %Never
Row %Very rarely
Row %Sometimes
Row %Very often
Row %Always
Row %Don't know
How often during the last 12 months your household remained with unspent money from monthto month?
150
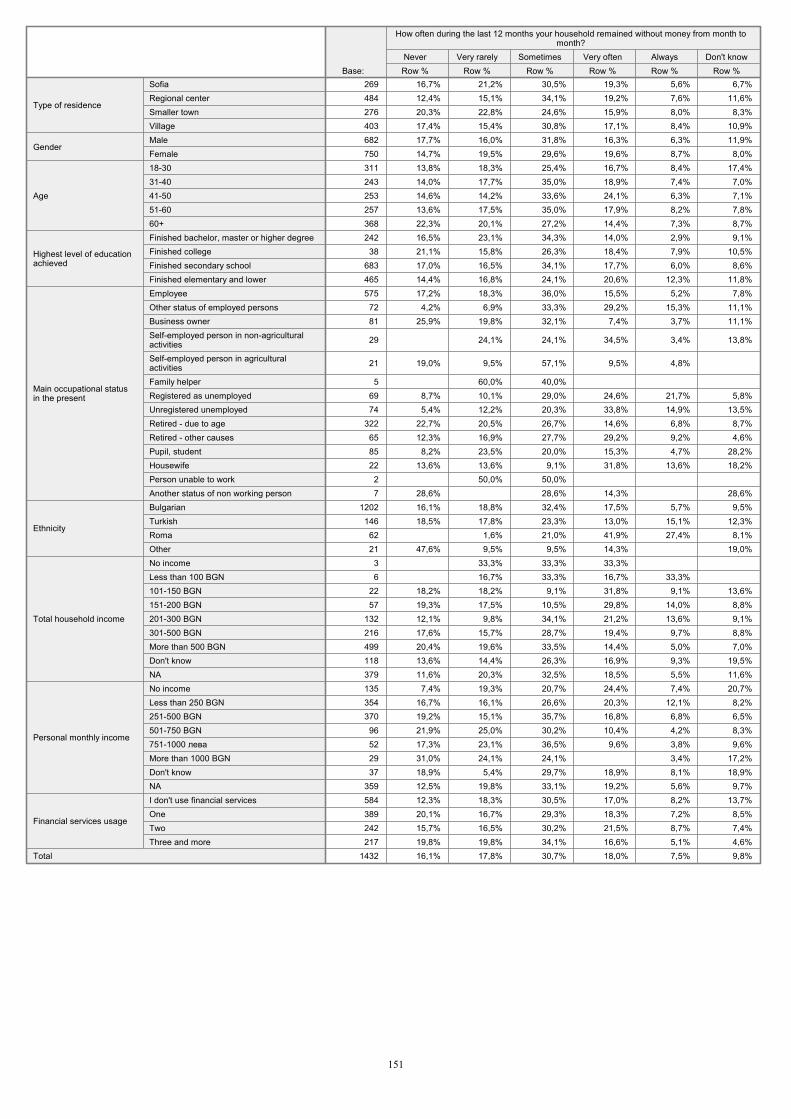
269 16,7% 21,2% 30,5% 19,3% 5,6% 6,7%484 12,4% 15,1% 34,1% 19,2% 7,6% 11,6%276 20,3% 22,8% 24,6% 15,9% 8,0% 8,3%403 17,4% 15,4% 30,8% 17,1% 8,4% 10,9%682 17,7% 16,0% 31,8% 16,3% 6,3% 11,9%750 14,7% 19,5% 29,6% 19,6% 8,7% 8,0%311 13,8% 18,3% 25,4% 16,7% 8,4% 17,4%243 14,0% 17,7% 35,0% 18,9% 7,4% 7,0%253 14,6% 14,2% 33,6% 24,1% 6,3% 7,1%257 13,6% 17,5% 35,0% 17,9% 8,2% 7,8%368 22,3% 20,1% 27,2% 14,4% 7,3% 8,7%242 16,5% 23,1% 34,3% 14,0% 2,9% 9,1%
38 21,1% 15,8% 26,3% 18,4% 7,9% 10,5%683 17,0% 16,5% 34,1% 17,7% 6,0% 8,6%465 14,4% 16,8% 24,1% 20,6% 12,3% 11,8%575 17,2% 18,3% 36,0% 15,5% 5,2% 7,8%
72 4,2% 6,9% 33,3% 29,2% 15,3% 11,1%81 25,9% 19,8% 32,1% 7,4% 3,7% 11,1%
29 24,1% 24,1% 34,5% 3,4% 13,8%
21 19,0% 9,5% 57,1% 9,5% 4,8%
5 60,0% 40,0% 69 8,7% 10,1% 29,0% 24,6% 21,7% 5,8%74 5,4% 12,2% 20,3% 33,8% 14,9% 13,5%
322 22,7% 20,5% 26,7% 14,6% 6,8% 8,7%65 12,3% 16,9% 27,7% 29,2% 9,2% 4,6%85 8,2% 23,5% 20,0% 15,3% 4,7% 28,2%22 13,6% 13,6% 9,1% 31,8% 13,6% 18,2%
2 50,0% 50,0% 7 28,6% 28,6% 14,3% 28,6%
1202 16,1% 18,8% 32,4% 17,5% 5,7% 9,5%146 18,5% 17,8% 23,3% 13,0% 15,1% 12,3%
62 1,6% 21,0% 41,9% 27,4% 8,1%21 47,6% 9,5% 9,5% 14,3% 19,0%
3 33,3% 33,3% 33,3% 6 16,7% 33,3% 16,7% 33,3%
22 18,2% 18,2% 9,1% 31,8% 9,1% 13,6%57 19,3% 17,5% 10,5% 29,8% 14,0% 8,8%
132 12,1% 9,8% 34,1% 21,2% 13,6% 9,1%216 17,6% 15,7% 28,7% 19,4% 9,7% 8,8%499 20,4% 19,6% 33,5% 14,4% 5,0% 7,0%118 13,6% 14,4% 26,3% 16,9% 9,3% 19,5%379 11,6% 20,3% 32,5% 18,5% 5,5% 11,6%135 7,4% 19,3% 20,7% 24,4% 7,4% 20,7%354 16,7% 16,1% 26,6% 20,3% 12,1% 8,2%370 19,2% 15,1% 35,7% 16,8% 6,8% 6,5%
96 21,9% 25,0% 30,2% 10,4% 4,2% 8,3%52 17,3% 23,1% 36,5% 9,6% 3,8% 9,6%29 31,0% 24,1% 24,1% 3,4% 17,2%37 18,9% 5,4% 29,7% 18,9% 8,1% 18,9%
359 12,5% 19,8% 33,1% 19,2% 5,6% 9,7%584 12,3% 18,3% 30,5% 17,0% 8,2% 13,7%389 20,1% 16,7% 29,3% 18,3% 7,2% 8,5%242 15,7% 16,5% 30,2% 21,5% 8,7% 7,4%217 19,8% 19,8% 34,1% 16,6% 5,1% 4,6%
1432 16,1% 17,8% 30,7% 18,0% 7,5% 9,8%
SofiaRegional centerSmaller townVillage
Type of residence
MaleFemale
Gender
18-3031-4041-5051-6060+
Age
Finished bachelor, master or higher degreeFinished collegeFinished secondary schoolFinished elementary and lower
Highest level of educationachieved
EmployeeOther status of employed personsBusiness ownerSelf-employed person in non-agriculturalactivitiesSelf-employed person in agriculturalactivitiesFamily helperRegistered as unemployedUnregistered unemployedRetired - due to ageRetired - other causesPupil, studentHousewifePerson unable to workAnother status of non working person
Main occupational statusin the present
BulgarianTurkishRomaOther
Ethnicity
No incomeLess than 100 BGN101-150 BGN151-200 BGN201-300 BGN301-500 BGNMore than 500 BGNDon't knowNA
Total household income
No incomeLess than 250 BGN251-500 BGN501-750 BGN751-1000 More than 1000 BGNDon't knowNA
Personal monthly income
I don't use financial servicesOneTwoThree and more
Financial services usage
Total
Base: Row %Never
Row %Very rarely
Row %Sometimes
Row %Very often
Row %Always
Row %Don't know
How often during the last 12 months your household remained without money from month tomonth?
151

269 11,9% 16,0% 39,0% 18,6% 4,8% 9,7%484 13,4% 17,8% 22,7% 21,7% 6,2% 18,2%276 12,7% 13,0% 31,9% 18,8% 12,3% 11,2%403 13,6% 15,9% 26,3% 18,9% 8,4% 16,9%682 13,3% 14,8% 29,3% 19,4% 7,2% 16,0%750 12,8% 17,1% 27,9% 20,1% 8,3% 13,9%311 11,6% 15,4% 27,3% 17,4% 6,4% 21,9%243 11,5% 13,6% 31,3% 22,2% 7,8% 13,6%253 9,5% 19,0% 31,6% 22,9% 5,9% 11,1%257 14,0% 17,9% 31,5% 18,7% 7,4% 10,5%368 17,1% 14,7% 23,6% 18,8% 10,3% 15,5%
242 11,2% 21,1% 33,9% 19,4% 2,9% 11,6%
38 13,2% 15,8% 36,8% 13,2% 5,3% 15,8%683 13,2% 15,4% 28,6% 21,7% 9,5% 11,7%465 14,0% 14,2% 25,4% 17,2% 8,0% 21,3%575 9,9% 18,1% 32,0% 24,0% 6,8% 9,2%
72 9,7% 12,5% 36,1% 20,8% 2,8% 18,1%81 8,6% 18,5% 30,9% 12,3% 12,3% 17,3%
29 6,9% 3,4% 48,3% 24,1% 17,2%
21 14,3% 14,3% 42,9% 9,5% 19,0%
5 40,0% 40,0% 20,0%69 20,3% 11,6% 24,6% 18,8% 8,7% 15,9%74 18,9% 17,6% 24,3% 12,2% 6,8% 20,3%
322 15,8% 14,3% 23,6% 18,9% 11,5% 15,8%65 16,9% 24,6% 21,5% 16,9% 9,2% 10,8%85 14,1% 11,8% 20,0% 15,3% 5,9% 32,9%22 27,3% 4,5% 22,7% 9,1% 36,4%
2 50,0% 50,0% 7 14,3% 28,6% 14,3% 42,9%
1202 12,6% 16,1% 30,4% 19,6% 8,0% 13,4%146 15,8% 19,2% 14,4% 18,5% 8,9% 23,3%
62 17,7% 9,7% 32,3% 17,7% 1,6% 21,0%21 9,5% 9,5% 9,5% 47,6% 23,8%
3 66,7% 33,3% 6 50,0% 33,3% 16,7%
22 13,6% 18,2% 18,2% 27,3% 9,1% 13,6%57 19,3% 10,5% 21,1% 21,1% 5,3% 22,8%
132 10,6% 16,7% 26,5% 18,9% 10,6% 16,7%216 14,8% 13,9% 20,4% 21,3% 13,4% 16,2%499 14,8% 13,4% 31,9% 19,2% 9,6% 11,0%118 11,0% 13,6% 30,5% 11,9% 5,9% 27,1%379 9,2% 21,4% 31,4% 21,9% 2,1% 14,0%135 19,3% 8,9% 21,5% 11,9% 5,2% 33,3%354 14,7% 14,1% 23,2% 22,0% 9,0% 16,9%370 15,1% 14,9% 28,6% 20,3% 11,4% 9,7%
96 11,5% 10,4% 36,5% 20,8% 8,3% 12,5%52 17,3% 48,1% 15,4% 13,5% 5,8%29 13,8% 20,7% 27,6% 13,8% 3,4% 20,7%37 16,2% 16,2% 27,0% 8,1% 10,8% 21,6%
359 8,9% 22,6% 31,8% 22,0% 2,8% 12,0%584 13,9% 14,7% 26,0% 17,3% 7,2% 20,9%389 13,4% 14,7% 27,5% 21,9% 10,8% 11,8%242 13,6% 17,4% 30,2% 21,9% 7,0% 9,9%217 9,7% 20,3% 35,5% 20,3% 4,6% 9,7%
1432 13,1% 16,0% 28,6% 19,8% 7,8% 14,9%
SofiaRegional centerSmaller townVillage
Type of residence
MaleFemale
Gender
18-3031-4041-5051-6060+
Age
Finished bachelor, master or higherdegreeFinished collegeFinished secondary schoolFinished elementary and lower
Highest level of educationachieved
EmployeeOther status of employed personsBusiness ownerSelf-employed person innon-agricultural activitiesSelf-employed person in agriculturalactivitiesFamily helperRegistered as unemployedUnregistered unemployedRetired - due to ageRetired - other causesPupil, studentHousewifePerson unable to workAnother status of non working person
Main occupational statusin the present
BulgarianTurkishRomaOther
Ethnicity
No incomeLess than 100 BGN101-150 BGN151-200 BGN201-300 BGN301-500 BGNMore than 500 BGNDon't knowNA
Total household income
No incomeLess than 250 BGN251-500 BGN501-750 BGN751-1000 More than 1000 BGNDon't knowNA
Personal monthly income
I don't use financial servicesOneTwoThree and more
Financial services usage
Total
Base: Row %Never
Row %Very rarely
Row %Sometimes
Row %Very often
Row %Always
Row %Don't know
How often during the last 12 months your household spent in a month exactly the moneyearned in the previous month?
152
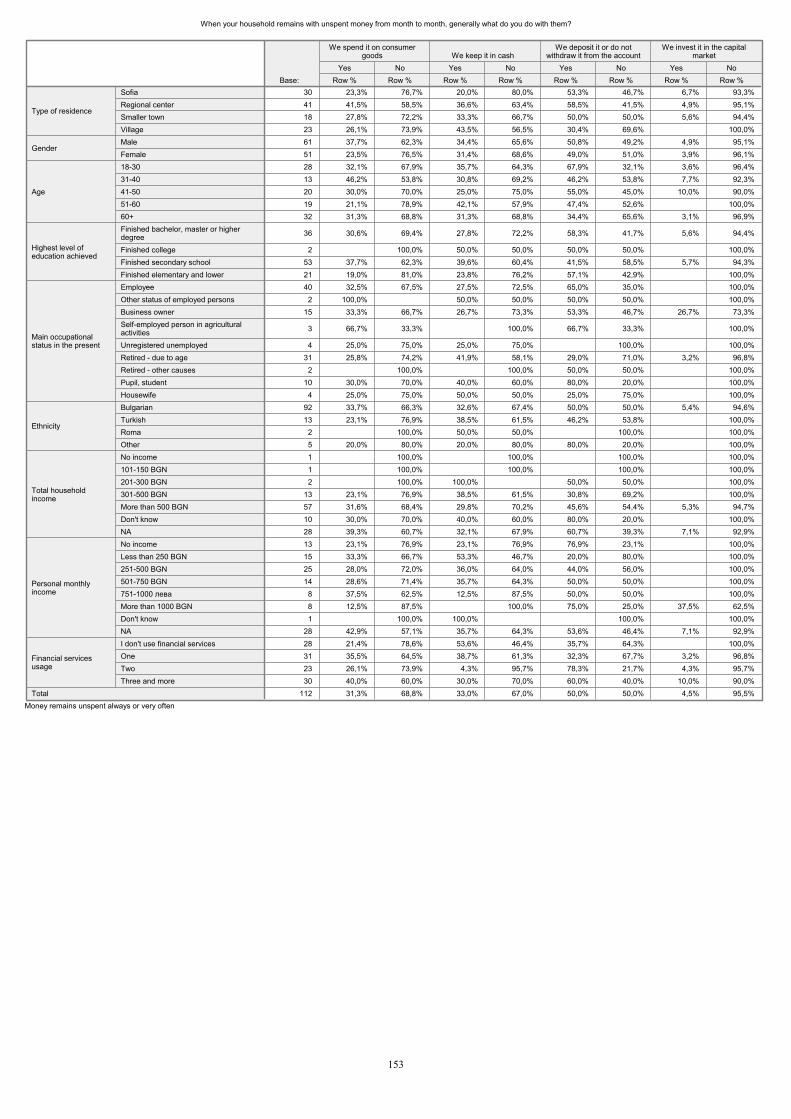
When your household remains with unspent money from month to month, generally what do you do with them?
30 23,3% 76,7% 20,0% 80,0% 53,3% 46,7% 6,7% 93,3%41 41,5% 58,5% 36,6% 63,4% 58,5% 41,5% 4,9% 95,1%18 27,8% 72,2% 33,3% 66,7% 50,0% 50,0% 5,6% 94,4%23 26,1% 73,9% 43,5% 56,5% 30,4% 69,6% 100,0%61 37,7% 62,3% 34,4% 65,6% 50,8% 49,2% 4,9% 95,1%51 23,5% 76,5% 31,4% 68,6% 49,0% 51,0% 3,9% 96,1%28 32,1% 67,9% 35,7% 64,3% 67,9% 32,1% 3,6% 96,4%13 46,2% 53,8% 30,8% 69,2% 46,2% 53,8% 7,7% 92,3%20 30,0% 70,0% 25,0% 75,0% 55,0% 45,0% 10,0% 90,0%19 21,1% 78,9% 42,1% 57,9% 47,4% 52,6% 100,0%32 31,3% 68,8% 31,3% 68,8% 34,4% 65,6% 3,1% 96,9%
36 30,6% 69,4% 27,8% 72,2% 58,3% 41,7% 5,6% 94,4%
2 100,0% 50,0% 50,0% 50,0% 50,0% 100,0%53 37,7% 62,3% 39,6% 60,4% 41,5% 58,5% 5,7% 94,3%21 19,0% 81,0% 23,8% 76,2% 57,1% 42,9% 100,0%40 32,5% 67,5% 27,5% 72,5% 65,0% 35,0% 100,0%
2 100,0% 50,0% 50,0% 50,0% 50,0% 100,0%15 33,3% 66,7% 26,7% 73,3% 53,3% 46,7% 26,7% 73,3%
3 66,7% 33,3% 100,0% 66,7% 33,3% 100,0%
4 25,0% 75,0% 25,0% 75,0% 100,0% 100,0%31 25,8% 74,2% 41,9% 58,1% 29,0% 71,0% 3,2% 96,8%
2 100,0% 100,0% 50,0% 50,0% 100,0%10 30,0% 70,0% 40,0% 60,0% 80,0% 20,0% 100,0%
4 25,0% 75,0% 50,0% 50,0% 25,0% 75,0% 100,0%92 33,7% 66,3% 32,6% 67,4% 50,0% 50,0% 5,4% 94,6%13 23,1% 76,9% 38,5% 61,5% 46,2% 53,8% 100,0%
2 100,0% 50,0% 50,0% 100,0% 100,0%5 20,0% 80,0% 20,0% 80,0% 80,0% 20,0% 100,0%1 100,0% 100,0% 100,0% 100,0%1 100,0% 100,0% 100,0% 100,0%2 100,0% 100,0% 50,0% 50,0% 100,0%
13 23,1% 76,9% 38,5% 61,5% 30,8% 69,2% 100,0%57 31,6% 68,4% 29,8% 70,2% 45,6% 54,4% 5,3% 94,7%10 30,0% 70,0% 40,0% 60,0% 80,0% 20,0% 100,0%28 39,3% 60,7% 32,1% 67,9% 60,7% 39,3% 7,1% 92,9%13 23,1% 76,9% 23,1% 76,9% 76,9% 23,1% 100,0%15 33,3% 66,7% 53,3% 46,7% 20,0% 80,0% 100,0%25 28,0% 72,0% 36,0% 64,0% 44,0% 56,0% 100,0%14 28,6% 71,4% 35,7% 64,3% 50,0% 50,0% 100,0%
8 37,5% 62,5% 12,5% 87,5% 50,0% 50,0% 100,0%8 12,5% 87,5% 100,0% 75,0% 25,0% 37,5% 62,5%1 100,0% 100,0% 100,0% 100,0%
28 42,9% 57,1% 35,7% 64,3% 53,6% 46,4% 7,1% 92,9%28 21,4% 78,6% 53,6% 46,4% 35,7% 64,3% 100,0%31 35,5% 64,5% 38,7% 61,3% 32,3% 67,7% 3,2% 96,8%23 26,1% 73,9% 4,3% 95,7% 78,3% 21,7% 4,3% 95,7%30 40,0% 60,0% 30,0% 70,0% 60,0% 40,0% 10,0% 90,0%
112 31,3% 68,8% 33,0% 67,0% 50,0% 50,0% 4,5% 95,5%
SofiaRegional centerSmaller townVillage
Type of residence
MaleFemale
Gender
18-3031-4041-5051-6060+
Age
Finished bachelor, master or higherdegreeFinished collegeFinished secondary schoolFinished elementary and lower
Highest level ofeducation achieved
EmployeeOther status of employed personsBusiness ownerSelf-employed person in agriculturalactivitiesUnregistered unemployedRetired - due to ageRetired - other causesPupil, studentHousewife
Main occupationalstatus in the present
BulgarianTurkishRomaOther
Ethnicity
No income101-150 BGN201-300 BGN301-500 BGNMore than 500 BGNDon't knowNA
Total householdincome
No incomeLess than 250 BGN251-500 BGN501-750 BGN751-1000 More than 1000 BGNDon't knowNA
Personal monthlyincome
I don't use financial servicesOneTwoThree and more
Financial servicesusage
Total
Base: Row %Yes
Row %No
We spend it on consumergoods
Row %Yes
Row %No
We keep it in cash
Row %Yes
Row %No
We deposit it or do notwithdraw it from the account
Row %Yes
Row %No
We invest it in the capitalmarket
Money remains unspent always or very often
153
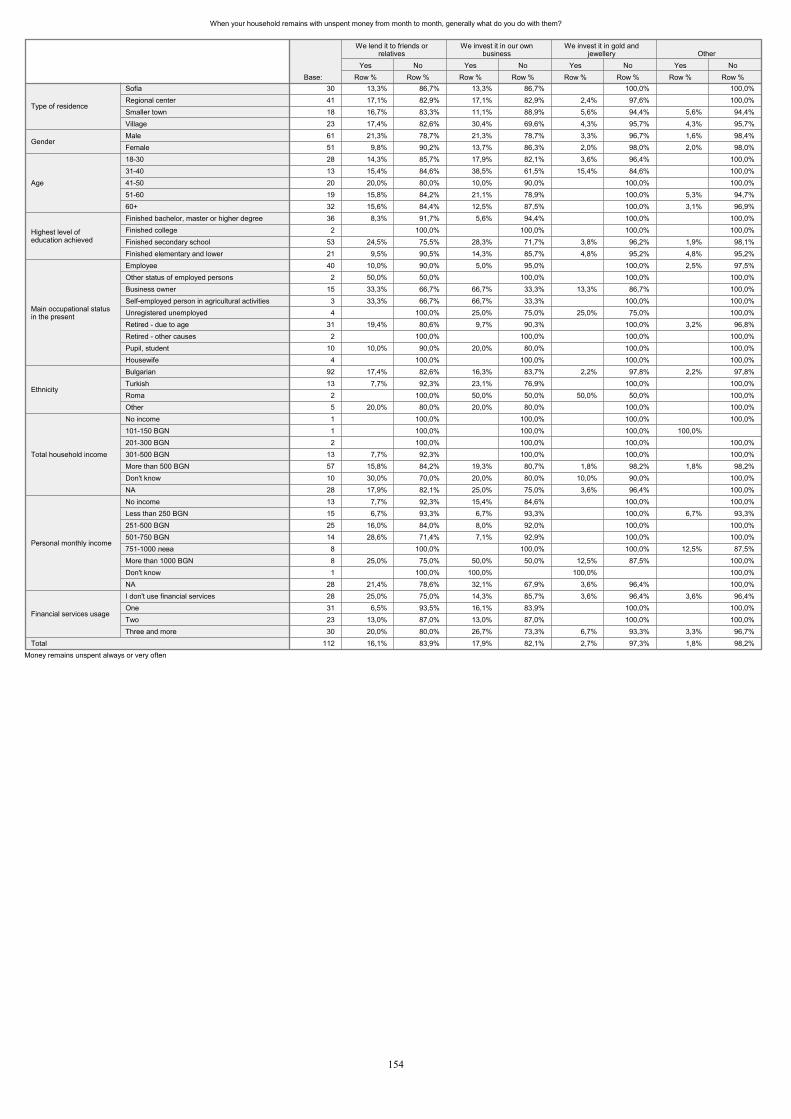
When your household remains with unspent money from month to month, generally what do you do with them?
30 13,3% 86,7% 13,3% 86,7% 100,0% 100,0%41 17,1% 82,9% 17,1% 82,9% 2,4% 97,6% 100,0%18 16,7% 83,3% 11,1% 88,9% 5,6% 94,4% 5,6% 94,4%23 17,4% 82,6% 30,4% 69,6% 4,3% 95,7% 4,3% 95,7%61 21,3% 78,7% 21,3% 78,7% 3,3% 96,7% 1,6% 98,4%51 9,8% 90,2% 13,7% 86,3% 2,0% 98,0% 2,0% 98,0%28 14,3% 85,7% 17,9% 82,1% 3,6% 96,4% 100,0%13 15,4% 84,6% 38,5% 61,5% 15,4% 84,6% 100,0%20 20,0% 80,0% 10,0% 90,0% 100,0% 100,0%19 15,8% 84,2% 21,1% 78,9% 100,0% 5,3% 94,7%32 15,6% 84,4% 12,5% 87,5% 100,0% 3,1% 96,9%36 8,3% 91,7% 5,6% 94,4% 100,0% 100,0%2 100,0% 100,0% 100,0% 100,0%
53 24,5% 75,5% 28,3% 71,7% 3,8% 96,2% 1,9% 98,1%21 9,5% 90,5% 14,3% 85,7% 4,8% 95,2% 4,8% 95,2%40 10,0% 90,0% 5,0% 95,0% 100,0% 2,5% 97,5%2 50,0% 50,0% 100,0% 100,0% 100,0%
15 33,3% 66,7% 66,7% 33,3% 13,3% 86,7% 100,0%3 33,3% 66,7% 66,7% 33,3% 100,0% 100,0%4 100,0% 25,0% 75,0% 25,0% 75,0% 100,0%
31 19,4% 80,6% 9,7% 90,3% 100,0% 3,2% 96,8%2 100,0% 100,0% 100,0% 100,0%
10 10,0% 90,0% 20,0% 80,0% 100,0% 100,0%4 100,0% 100,0% 100,0% 100,0%
92 17,4% 82,6% 16,3% 83,7% 2,2% 97,8% 2,2% 97,8%13 7,7% 92,3% 23,1% 76,9% 100,0% 100,0%2 100,0% 50,0% 50,0% 50,0% 50,0% 100,0%5 20,0% 80,0% 20,0% 80,0% 100,0% 100,0%1 100,0% 100,0% 100,0% 100,0%1 100,0% 100,0% 100,0% 100,0% 2 100,0% 100,0% 100,0% 100,0%
13 7,7% 92,3% 100,0% 100,0% 100,0%57 15,8% 84,2% 19,3% 80,7% 1,8% 98,2% 1,8% 98,2%10 30,0% 70,0% 20,0% 80,0% 10,0% 90,0% 100,0%28 17,9% 82,1% 25,0% 75,0% 3,6% 96,4% 100,0%13 7,7% 92,3% 15,4% 84,6% 100,0% 100,0%15 6,7% 93,3% 6,7% 93,3% 100,0% 6,7% 93,3%25 16,0% 84,0% 8,0% 92,0% 100,0% 100,0%14 28,6% 71,4% 7,1% 92,9% 100,0% 100,0%8 100,0% 100,0% 100,0% 12,5% 87,5%8 25,0% 75,0% 50,0% 50,0% 12,5% 87,5% 100,0%1 100,0% 100,0% 100,0% 100,0%
28 21,4% 78,6% 32,1% 67,9% 3,6% 96,4% 100,0%28 25,0% 75,0% 14,3% 85,7% 3,6% 96,4% 3,6% 96,4%31 6,5% 93,5% 16,1% 83,9% 100,0% 100,0%23 13,0% 87,0% 13,0% 87,0% 100,0% 100,0%30 20,0% 80,0% 26,7% 73,3% 6,7% 93,3% 3,3% 96,7%
112 16,1% 83,9% 17,9% 82,1% 2,7% 97,3% 1,8% 98,2%
SofiaRegional centerSmaller townVillage
Type of residence
MaleFemale
Gender
18-3031-4041-5051-6060+
Age
Finished bachelor, master or higher degreeFinished collegeFinished secondary schoolFinished elementary and lower
Highest level ofeducation achieved
EmployeeOther status of employed personsBusiness ownerSelf-employed person in agricultural activitiesUnregistered unemployedRetired - due to ageRetired - other causesPupil, studentHousewife
Main occupational statusin the present
BulgarianTurkishRomaOther
Ethnicity
No income101-150 BGN201-300 BGN301-500 BGNMore than 500 BGNDon't knowNA
Total household income
No incomeLess than 250 BGN251-500 BGN501-750 BGN751-1000 More than 1000 BGNDon't knowNA
Personal monthly income
I don't use financial servicesOneTwoThree and more
Financial services usage
Total
Base: Row %Yes
Row %No
We lend it to friends orrelatives
Row %Yes
Row %No
We invest it in our ownbusiness
Row %Yes
Row %No
We invest it in gold andjewellery
Row %Yes
Row %No
Other
Money remains unspent always or very often
154
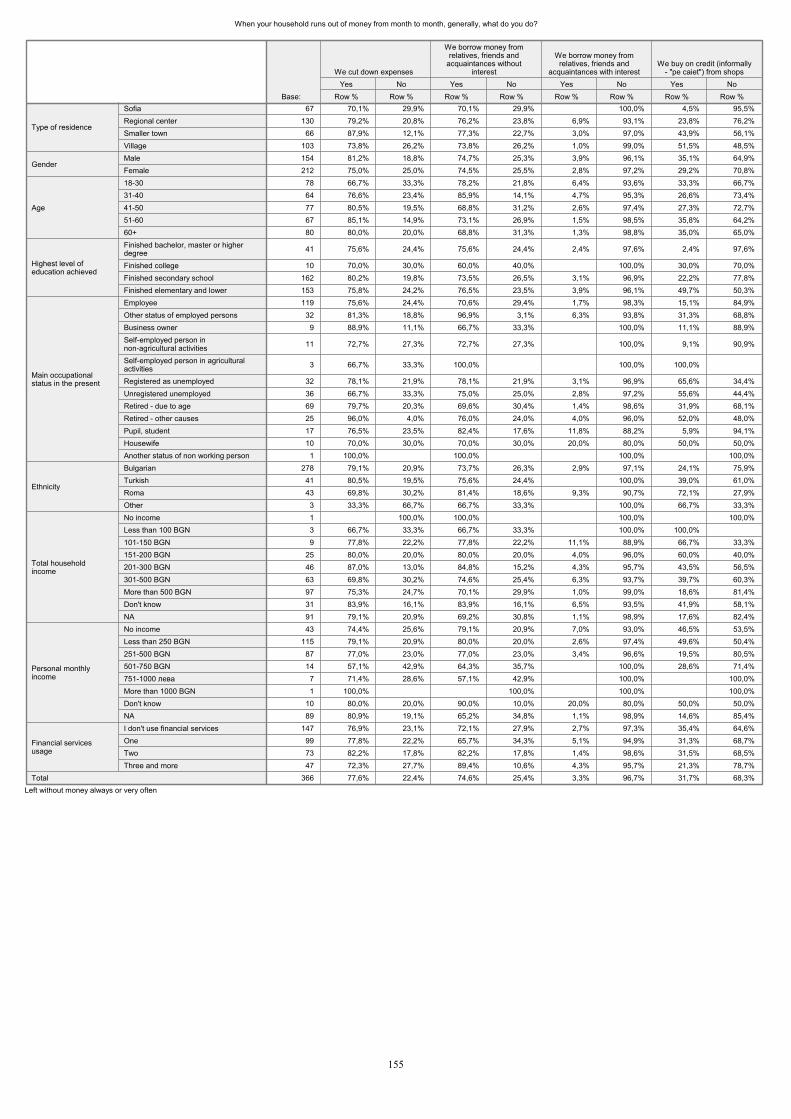
When your household runs out of money from month to month, generally, what do you do?
67 70,1% 29,9% 70,1% 29,9% 100,0% 4,5% 95,5%130 79,2% 20,8% 76,2% 23,8% 6,9% 93,1% 23,8% 76,2%
66 87,9% 12,1% 77,3% 22,7% 3,0% 97,0% 43,9% 56,1%103 73,8% 26,2% 73,8% 26,2% 1,0% 99,0% 51,5% 48,5%154 81,2% 18,8% 74,7% 25,3% 3,9% 96,1% 35,1% 64,9%212 75,0% 25,0% 74,5% 25,5% 2,8% 97,2% 29,2% 70,8%
78 66,7% 33,3% 78,2% 21,8% 6,4% 93,6% 33,3% 66,7%64 76,6% 23,4% 85,9% 14,1% 4,7% 95,3% 26,6% 73,4%77 80,5% 19,5% 68,8% 31,2% 2,6% 97,4% 27,3% 72,7%67 85,1% 14,9% 73,1% 26,9% 1,5% 98,5% 35,8% 64,2%80 80,0% 20,0% 68,8% 31,3% 1,3% 98,8% 35,0% 65,0%
41 75,6% 24,4% 75,6% 24,4% 2,4% 97,6% 2,4% 97,6%
10 70,0% 30,0% 60,0% 40,0% 100,0% 30,0% 70,0%162 80,2% 19,8% 73,5% 26,5% 3,1% 96,9% 22,2% 77,8%153 75,8% 24,2% 76,5% 23,5% 3,9% 96,1% 49,7% 50,3%119 75,6% 24,4% 70,6% 29,4% 1,7% 98,3% 15,1% 84,9%
32 81,3% 18,8% 96,9% 3,1% 6,3% 93,8% 31,3% 68,8%9 88,9% 11,1% 66,7% 33,3% 100,0% 11,1% 88,9%
11 72,7% 27,3% 72,7% 27,3% 100,0% 9,1% 90,9%
3 66,7% 33,3% 100,0% 100,0% 100,0%
32 78,1% 21,9% 78,1% 21,9% 3,1% 96,9% 65,6% 34,4%36 66,7% 33,3% 75,0% 25,0% 2,8% 97,2% 55,6% 44,4%69 79,7% 20,3% 69,6% 30,4% 1,4% 98,6% 31,9% 68,1%25 96,0% 4,0% 76,0% 24,0% 4,0% 96,0% 52,0% 48,0%17 76,5% 23,5% 82,4% 17,6% 11,8% 88,2% 5,9% 94,1%10 70,0% 30,0% 70,0% 30,0% 20,0% 80,0% 50,0% 50,0%
1 100,0% 100,0% 100,0% 100,0%278 79,1% 20,9% 73,7% 26,3% 2,9% 97,1% 24,1% 75,9%
41 80,5% 19,5% 75,6% 24,4% 100,0% 39,0% 61,0%43 69,8% 30,2% 81,4% 18,6% 9,3% 90,7% 72,1% 27,9%
3 33,3% 66,7% 66,7% 33,3% 100,0% 66,7% 33,3%1 100,0% 100,0% 100,0% 100,0%3 66,7% 33,3% 66,7% 33,3% 100,0% 100,0% 9 77,8% 22,2% 77,8% 22,2% 11,1% 88,9% 66,7% 33,3%
25 80,0% 20,0% 80,0% 20,0% 4,0% 96,0% 60,0% 40,0%46 87,0% 13,0% 84,8% 15,2% 4,3% 95,7% 43,5% 56,5%63 69,8% 30,2% 74,6% 25,4% 6,3% 93,7% 39,7% 60,3%97 75,3% 24,7% 70,1% 29,9% 1,0% 99,0% 18,6% 81,4%31 83,9% 16,1% 83,9% 16,1% 6,5% 93,5% 41,9% 58,1%91 79,1% 20,9% 69,2% 30,8% 1,1% 98,9% 17,6% 82,4%43 74,4% 25,6% 79,1% 20,9% 7,0% 93,0% 46,5% 53,5%
115 79,1% 20,9% 80,0% 20,0% 2,6% 97,4% 49,6% 50,4%87 77,0% 23,0% 77,0% 23,0% 3,4% 96,6% 19,5% 80,5%14 57,1% 42,9% 64,3% 35,7% 100,0% 28,6% 71,4%
7 71,4% 28,6% 57,1% 42,9% 100,0% 100,0%1 100,0% 100,0% 100,0% 100,0%
10 80,0% 20,0% 90,0% 10,0% 20,0% 80,0% 50,0% 50,0%89 80,9% 19,1% 65,2% 34,8% 1,1% 98,9% 14,6% 85,4%
147 76,9% 23,1% 72,1% 27,9% 2,7% 97,3% 35,4% 64,6%99 77,8% 22,2% 65,7% 34,3% 5,1% 94,9% 31,3% 68,7%73 82,2% 17,8% 82,2% 17,8% 1,4% 98,6% 31,5% 68,5%47 72,3% 27,7% 89,4% 10,6% 4,3% 95,7% 21,3% 78,7%
366 77,6% 22,4% 74,6% 25,4% 3,3% 96,7% 31,7% 68,3%
SofiaRegional centerSmaller townVillage
Type of residence
MaleFemale
Gender
18-3031-4041-5051-6060+
Age
Finished bachelor, master or higherdegreeFinished collegeFinished secondary schoolFinished elementary and lower
Highest level ofeducation achieved
EmployeeOther status of employed personsBusiness ownerSelf-employed person innon-agricultural activitiesSelf-employed person in agriculturalactivitiesRegistered as unemployedUnregistered unemployedRetired - due to ageRetired - other causesPupil, studentHousewifeAnother status of non working person
Main occupationalstatus in the present
BulgarianTurkishRomaOther
Ethnicity
No incomeLess than 100 BGN101-150 BGN151-200 BGN201-300 BGN301-500 BGNMore than 500 BGNDon't knowNA
Total householdincome
No incomeLess than 250 BGN251-500 BGN501-750 BGN751-1000 More than 1000 BGNDon't knowNA
Personal monthlyincome
I don't use financial servicesOneTwoThree and more
Financial servicesusage
Total
Base: Row %Yes
Row %No
We cut down expenses
Row %Yes
Row %No
We borrow money fromrelatives, friends and
acquaintances withoutinterest
Row %Yes
Row %No
We borrow money fromrelatives, friends and
acquaintances with interest
Row %Yes
Row %No
We buy on credit (informally- "pe caiet") from shops
Left without money always or very often
155
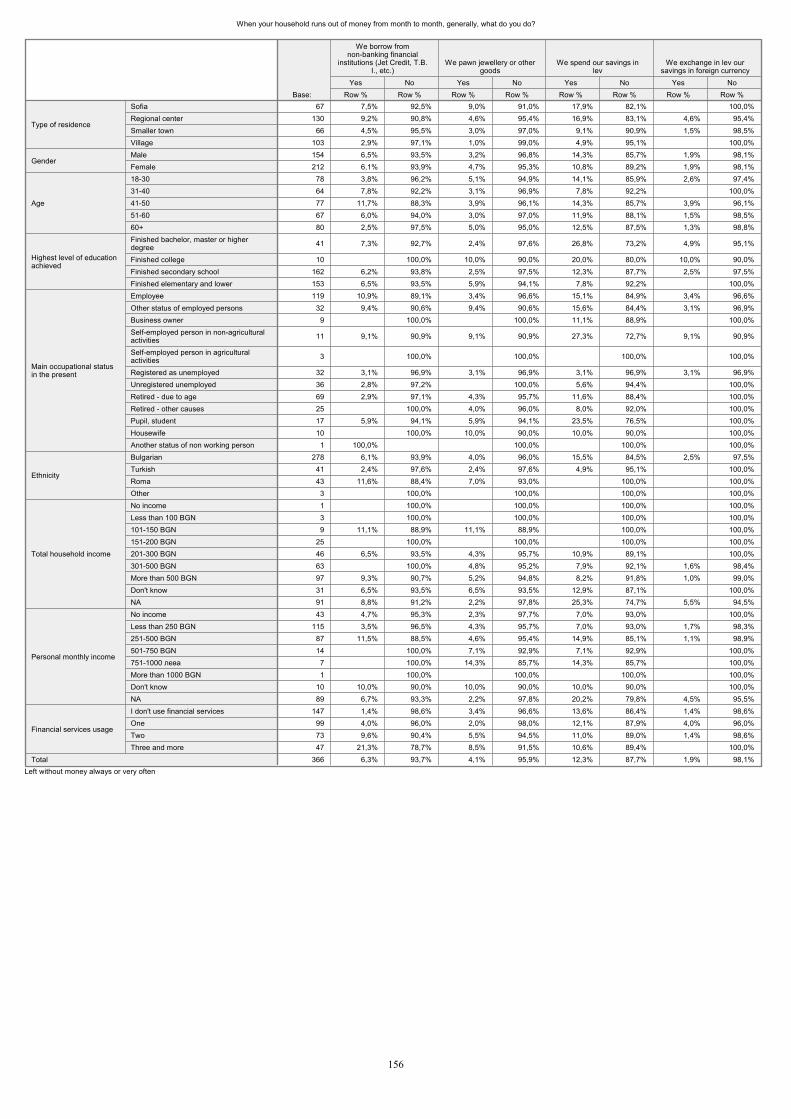
When your household runs out of money from month to month, generally, what do you do?
67 7,5% 92,5% 9,0% 91,0% 17,9% 82,1% 100,0%130 9,2% 90,8% 4,6% 95,4% 16,9% 83,1% 4,6% 95,4%
66 4,5% 95,5% 3,0% 97,0% 9,1% 90,9% 1,5% 98,5%103 2,9% 97,1% 1,0% 99,0% 4,9% 95,1% 100,0%154 6,5% 93,5% 3,2% 96,8% 14,3% 85,7% 1,9% 98,1%212 6,1% 93,9% 4,7% 95,3% 10,8% 89,2% 1,9% 98,1%
78 3,8% 96,2% 5,1% 94,9% 14,1% 85,9% 2,6% 97,4%64 7,8% 92,2% 3,1% 96,9% 7,8% 92,2% 100,0%77 11,7% 88,3% 3,9% 96,1% 14,3% 85,7% 3,9% 96,1%67 6,0% 94,0% 3,0% 97,0% 11,9% 88,1% 1,5% 98,5%80 2,5% 97,5% 5,0% 95,0% 12,5% 87,5% 1,3% 98,8%
41 7,3% 92,7% 2,4% 97,6% 26,8% 73,2% 4,9% 95,1%
10 100,0% 10,0% 90,0% 20,0% 80,0% 10,0% 90,0%162 6,2% 93,8% 2,5% 97,5% 12,3% 87,7% 2,5% 97,5%153 6,5% 93,5% 5,9% 94,1% 7,8% 92,2% 100,0%119 10,9% 89,1% 3,4% 96,6% 15,1% 84,9% 3,4% 96,6%
32 9,4% 90,6% 9,4% 90,6% 15,6% 84,4% 3,1% 96,9%9 100,0% 100,0% 11,1% 88,9% 100,0%
11 9,1% 90,9% 9,1% 90,9% 27,3% 72,7% 9,1% 90,9%
3 100,0% 100,0% 100,0% 100,0%
32 3,1% 96,9% 3,1% 96,9% 3,1% 96,9% 3,1% 96,9%36 2,8% 97,2% 100,0% 5,6% 94,4% 100,0%69 2,9% 97,1% 4,3% 95,7% 11,6% 88,4% 100,0%25 100,0% 4,0% 96,0% 8,0% 92,0% 100,0%17 5,9% 94,1% 5,9% 94,1% 23,5% 76,5% 100,0%10 100,0% 10,0% 90,0% 10,0% 90,0% 100,0%
1 100,0% 100,0% 100,0% 100,0%278 6,1% 93,9% 4,0% 96,0% 15,5% 84,5% 2,5% 97,5%
41 2,4% 97,6% 2,4% 97,6% 4,9% 95,1% 100,0%43 11,6% 88,4% 7,0% 93,0% 100,0% 100,0%
3 100,0% 100,0% 100,0% 100,0%1 100,0% 100,0% 100,0% 100,0%3 100,0% 100,0% 100,0% 100,0%9 11,1% 88,9% 11,1% 88,9% 100,0% 100,0%
25 100,0% 100,0% 100,0% 100,0%46 6,5% 93,5% 4,3% 95,7% 10,9% 89,1% 100,0%63 100,0% 4,8% 95,2% 7,9% 92,1% 1,6% 98,4%97 9,3% 90,7% 5,2% 94,8% 8,2% 91,8% 1,0% 99,0%31 6,5% 93,5% 6,5% 93,5% 12,9% 87,1% 100,0%91 8,8% 91,2% 2,2% 97,8% 25,3% 74,7% 5,5% 94,5%43 4,7% 95,3% 2,3% 97,7% 7,0% 93,0% 100,0%
115 3,5% 96,5% 4,3% 95,7% 7,0% 93,0% 1,7% 98,3%87 11,5% 88,5% 4,6% 95,4% 14,9% 85,1% 1,1% 98,9%14 100,0% 7,1% 92,9% 7,1% 92,9% 100,0%
7 100,0% 14,3% 85,7% 14,3% 85,7% 100,0%1 100,0% 100,0% 100,0% 100,0%
10 10,0% 90,0% 10,0% 90,0% 10,0% 90,0% 100,0%89 6,7% 93,3% 2,2% 97,8% 20,2% 79,8% 4,5% 95,5%
147 1,4% 98,6% 3,4% 96,6% 13,6% 86,4% 1,4% 98,6%99 4,0% 96,0% 2,0% 98,0% 12,1% 87,9% 4,0% 96,0%73 9,6% 90,4% 5,5% 94,5% 11,0% 89,0% 1,4% 98,6%47 21,3% 78,7% 8,5% 91,5% 10,6% 89,4% 100,0%
366 6,3% 93,7% 4,1% 95,9% 12,3% 87,7% 1,9% 98,1%
SofiaRegional centerSmaller townVillage
Type of residence
MaleFemale
Gender
18-3031-4041-5051-6060+
Age
Finished bachelor, master or higherdegreeFinished collegeFinished secondary schoolFinished elementary and lower
Highest level of educationachieved
EmployeeOther status of employed personsBusiness ownerSelf-employed person in non-agriculturalactivitiesSelf-employed person in agriculturalactivitiesRegistered as unemployedUnregistered unemployedRetired - due to ageRetired - other causesPupil, studentHousewifeAnother status of non working person
Main occupational statusin the present
BulgarianTurkishRomaOther
Ethnicity
No incomeLess than 100 BGN101-150 BGN151-200 BGN201-300 BGN301-500 BGNMore than 500 BGNDon't knowNA
Total household income
No incomeLess than 250 BGN251-500 BGN501-750 BGN751-1000 More than 1000 BGNDon't knowNA
Personal monthly income
I don't use financial servicesOneTwoThree and more
Financial services usage
Total
Base: Row %Yes
Row %No
We borrow fromnon-banking financial
institutions (Jet Credit, T.B.I., etc.)
Row %Yes
Row %No
We pawn jewellery or othergoods
Row %Yes
Row %No
We spend our savings inlev
Row %Yes
Row %No
We exchange in lev oursavings in foreign currency
Left without money always or very often
156
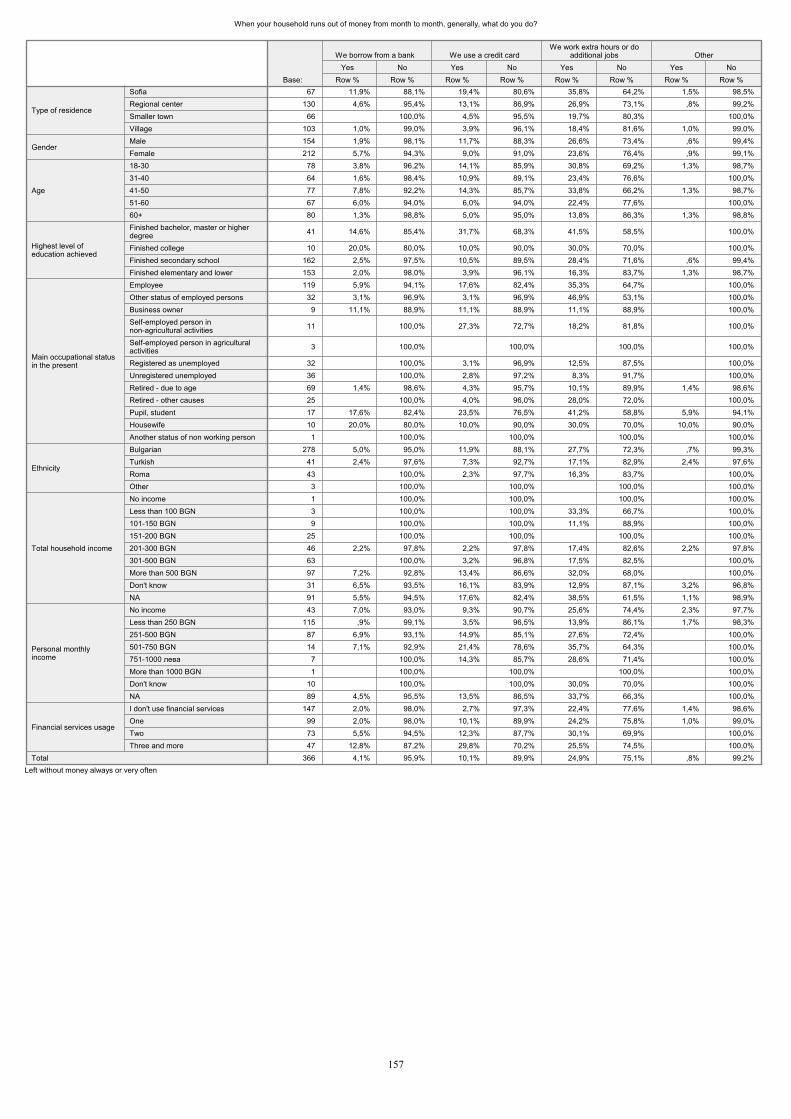
When your household runs out of money from month to month, generally, what do you do?
67 11,9% 88,1% 19,4% 80,6% 35,8% 64,2% 1,5% 98,5%130 4,6% 95,4% 13,1% 86,9% 26,9% 73,1% ,8% 99,2%
66 100,0% 4,5% 95,5% 19,7% 80,3% 100,0%103 1,0% 99,0% 3,9% 96,1% 18,4% 81,6% 1,0% 99,0%154 1,9% 98,1% 11,7% 88,3% 26,6% 73,4% ,6% 99,4%212 5,7% 94,3% 9,0% 91,0% 23,6% 76,4% ,9% 99,1%
78 3,8% 96,2% 14,1% 85,9% 30,8% 69,2% 1,3% 98,7%64 1,6% 98,4% 10,9% 89,1% 23,4% 76,6% 100,0%77 7,8% 92,2% 14,3% 85,7% 33,8% 66,2% 1,3% 98,7%67 6,0% 94,0% 6,0% 94,0% 22,4% 77,6% 100,0%80 1,3% 98,8% 5,0% 95,0% 13,8% 86,3% 1,3% 98,8%
41 14,6% 85,4% 31,7% 68,3% 41,5% 58,5% 100,0%
10 20,0% 80,0% 10,0% 90,0% 30,0% 70,0% 100,0%162 2,5% 97,5% 10,5% 89,5% 28,4% 71,6% ,6% 99,4%153 2,0% 98,0% 3,9% 96,1% 16,3% 83,7% 1,3% 98,7%119 5,9% 94,1% 17,6% 82,4% 35,3% 64,7% 100,0%
32 3,1% 96,9% 3,1% 96,9% 46,9% 53,1% 100,0%9 11,1% 88,9% 11,1% 88,9% 11,1% 88,9% 100,0%
11 100,0% 27,3% 72,7% 18,2% 81,8% 100,0%
3 100,0% 100,0% 100,0% 100,0%
32 100,0% 3,1% 96,9% 12,5% 87,5% 100,0%36 100,0% 2,8% 97,2% 8,3% 91,7% 100,0%69 1,4% 98,6% 4,3% 95,7% 10,1% 89,9% 1,4% 98,6%25 100,0% 4,0% 96,0% 28,0% 72,0% 100,0%17 17,6% 82,4% 23,5% 76,5% 41,2% 58,8% 5,9% 94,1%10 20,0% 80,0% 10,0% 90,0% 30,0% 70,0% 10,0% 90,0%
1 100,0% 100,0% 100,0% 100,0%278 5,0% 95,0% 11,9% 88,1% 27,7% 72,3% ,7% 99,3%
41 2,4% 97,6% 7,3% 92,7% 17,1% 82,9% 2,4% 97,6%43 100,0% 2,3% 97,7% 16,3% 83,7% 100,0%
3 100,0% 100,0% 100,0% 100,0%1 100,0% 100,0% 100,0% 100,0%3 100,0% 100,0% 33,3% 66,7% 100,0%9 100,0% 100,0% 11,1% 88,9% 100,0%
25 100,0% 100,0% 100,0% 100,0%46 2,2% 97,8% 2,2% 97,8% 17,4% 82,6% 2,2% 97,8%63 100,0% 3,2% 96,8% 17,5% 82,5% 100,0%97 7,2% 92,8% 13,4% 86,6% 32,0% 68,0% 100,0%31 6,5% 93,5% 16,1% 83,9% 12,9% 87,1% 3,2% 96,8%91 5,5% 94,5% 17,6% 82,4% 38,5% 61,5% 1,1% 98,9%43 7,0% 93,0% 9,3% 90,7% 25,6% 74,4% 2,3% 97,7%
115 ,9% 99,1% 3,5% 96,5% 13,9% 86,1% 1,7% 98,3%87 6,9% 93,1% 14,9% 85,1% 27,6% 72,4% 100,0%14 7,1% 92,9% 21,4% 78,6% 35,7% 64,3% 100,0%
7 100,0% 14,3% 85,7% 28,6% 71,4% 100,0%1 100,0% 100,0% 100,0% 100,0%
10 100,0% 100,0% 30,0% 70,0% 100,0%89 4,5% 95,5% 13,5% 86,5% 33,7% 66,3% 100,0%
147 2,0% 98,0% 2,7% 97,3% 22,4% 77,6% 1,4% 98,6%99 2,0% 98,0% 10,1% 89,9% 24,2% 75,8% 1,0% 99,0%73 5,5% 94,5% 12,3% 87,7% 30,1% 69,9% 100,0%47 12,8% 87,2% 29,8% 70,2% 25,5% 74,5% 100,0%
366 4,1% 95,9% 10,1% 89,9% 24,9% 75,1% ,8% 99,2%
SofiaRegional centerSmaller townVillage
Type of residence
MaleFemale
Gender
18-3031-4041-5051-6060+
Age
Finished bachelor, master or higherdegreeFinished collegeFinished secondary schoolFinished elementary and lower
Highest level ofeducation achieved
EmployeeOther status of employed personsBusiness ownerSelf-employed person innon-agricultural activitiesSelf-employed person in agriculturalactivitiesRegistered as unemployedUnregistered unemployedRetired - due to ageRetired - other causesPupil, studentHousewifeAnother status of non working person
Main occupational statusin the present
BulgarianTurkishRomaOther
Ethnicity
No incomeLess than 100 BGN101-150 BGN151-200 BGN201-300 BGN301-500 BGNMore than 500 BGNDon't knowNA
Total household income
No incomeLess than 250 BGN251-500 BGN501-750 BGN751-1000 More than 1000 BGNDon't knowNA
Personal monthlyincome
I don't use financial servicesOneTwoThree and more
Financial services usage
Total
Base: Row %Yes
Row %No
We borrow from a bank
Row %Yes
Row %No
We use a credit card
Row %Yes
Row %No
We work extra hours or doadditional jobs
Row %Yes
Row %No
Other
Left without money always or very often
157
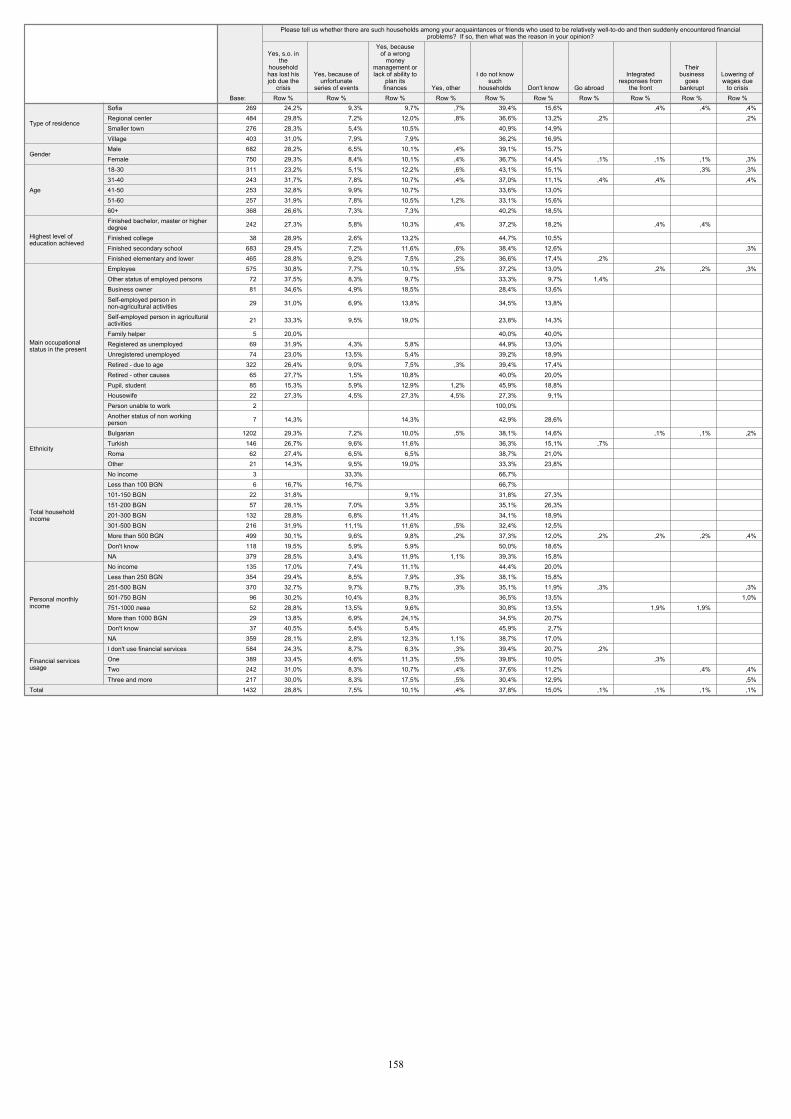
269 24,2% 9,3% 9,7% ,7% 39,4% 15,6% ,4% ,4% ,4%484 29,8% 7,2% 12,0% ,8% 36,6% 13,2% ,2% ,2%276 28,3% 5,4% 10,5% 40,9% 14,9% 403 31,0% 7,9% 7,9% 36,2% 16,9% 682 28,2% 6,5% 10,1% ,4% 39,1% 15,7% 750 29,3% 8,4% 10,1% ,4% 36,7% 14,4% ,1% ,1% ,1% ,3%311 23,2% 5,1% 12,2% ,6% 43,1% 15,1% ,3% ,3%243 31,7% 7,8% 10,7% ,4% 37,0% 11,1% ,4% ,4% ,4%253 32,8% 9,9% 10,7% 33,6% 13,0% 257 31,9% 7,8% 10,5% 1,2% 33,1% 15,6% 368 26,6% 7,3% 7,3% 40,2% 18,5%
242 27,3% 5,8% 10,3% ,4% 37,2% 18,2% ,4% ,4%
38 28,9% 2,6% 13,2% 44,7% 10,5% 683 29,4% 7,2% 11,6% ,6% 38,4% 12,6% ,3%465 28,8% 9,2% 7,5% ,2% 36,6% 17,4% ,2% 575 30,8% 7,7% 10,1% ,5% 37,2% 13,0% ,2% ,2% ,3%
72 37,5% 8,3% 9,7% 33,3% 9,7% 1,4% 81 34,6% 4,9% 18,5% 28,4% 13,6%
29 31,0% 6,9% 13,8% 34,5% 13,8%
21 33,3% 9,5% 19,0% 23,8% 14,3%
5 20,0% 40,0% 40,0% 69 31,9% 4,3% 5,8% 44,9% 13,0% 74 23,0% 13,5% 5,4% 39,2% 18,9%
322 26,4% 9,0% 7,5% ,3% 39,4% 17,4% 65 27,7% 1,5% 10,8% 40,0% 20,0% 85 15,3% 5,9% 12,9% 1,2% 45,9% 18,8% 22 27,3% 4,5% 27,3% 4,5% 27,3% 9,1%
2 100,0%
7 14,3% 14,3% 42,9% 28,6%
1202 29,3% 7,2% 10,0% ,5% 38,1% 14,6% ,1% ,1% ,2%146 26,7% 9,6% 11,6% 36,3% 15,1% ,7%
62 27,4% 6,5% 6,5% 38,7% 21,0% 21 14,3% 9,5% 19,0% 33,3% 23,8%
3 33,3% 66,7% 6 16,7% 16,7% 66,7%
22 31,8% 9,1% 31,8% 27,3% 57 28,1% 7,0% 3,5% 35,1% 26,3%
132 28,8% 6,8% 11,4% 34,1% 18,9% 216 31,9% 11,1% 11,6% ,5% 32,4% 12,5% 499 30,1% 9,6% 9,8% ,2% 37,3% 12,0% ,2% ,2% ,2% ,4%118 19,5% 5,9% 5,9% 50,0% 18,6% 379 28,5% 3,4% 11,9% 1,1% 39,3% 15,8% 135 17,0% 7,4% 11,1% 44,4% 20,0% 354 29,4% 8,5% 7,9% ,3% 38,1% 15,8% 370 32,7% 9,7% 9,7% ,3% 35,1% 11,9% ,3% ,3%
96 30,2% 10,4% 8,3% 36,5% 13,5% 1,0%52 28,8% 13,5% 9,6% 30,8% 13,5% 1,9% 1,9% 29 13,8% 6,9% 24,1% 34,5% 20,7% 37 40,5% 5,4% 5,4% 45,9% 2,7%
359 28,1% 2,8% 12,3% 1,1% 38,7% 17,0% 584 24,3% 8,7% 6,3% ,3% 39,4% 20,7% ,2% 389 33,4% 4,6% 11,3% ,5% 39,8% 10,0% ,3% 242 31,0% 8,3% 10,7% ,4% 37,6% 11,2% ,4% ,4%217 30,0% 8,3% 17,5% ,5% 30,4% 12,9% ,5%
1432 28,8% 7,5% 10,1% ,4% 37,8% 15,0% ,1% ,1% ,1% ,1%
SofiaRegional centerSmaller townVillage
Type of residence
MaleFemale
Gender
18-3031-4041-5051-6060+
Age
Finished bachelor, master or higherdegreeFinished collegeFinished secondary schoolFinished elementary and lower
Highest level ofeducation achieved
EmployeeOther status of employed personsBusiness ownerSelf-employed person innon-agricultural activitiesSelf-employed person in agriculturalactivitiesFamily helperRegistered as unemployedUnregistered unemployedRetired - due to ageRetired - other causesPupil, studentHousewifePerson unable to workAnother status of non workingperson
Main occupationalstatus in the present
BulgarianTurkishRomaOther
Ethnicity
No incomeLess than 100 BGN101-150 BGN151-200 BGN201-300 BGN301-500 BGNMore than 500 BGNDon't knowNA
Total householdincome
No incomeLess than 250 BGN251-500 BGN501-750 BGN751-1000 More than 1000 BGNDon't knowNA
Personal monthlyincome
I don't use financial servicesOneTwoThree and more
Financial servicesusage
Total
Base: Row %
Yes, s.o. inthe
householdhas lost hisjob due the
crisisRow %
Yes, because ofunfortunate
series of eventsRow %
Yes, becauseof a wrong
moneymanagement orlack of ability to
plan itsfinances
Row %Yes, other
Row %
I do not knowsuch
householdsRow %
Don't knowRow %
Go abroadRow %
Integratedresponses from
the frontRow %
Theirbusiness
goesbankrupt
Row %
Lowering ofwages due
to crisis
Please tell us whether there are such households among your acquaintances or friends who used to be relatively well-to-do and then suddenly encountered financialproblems? If so, then what was the reason in your opinion?
158
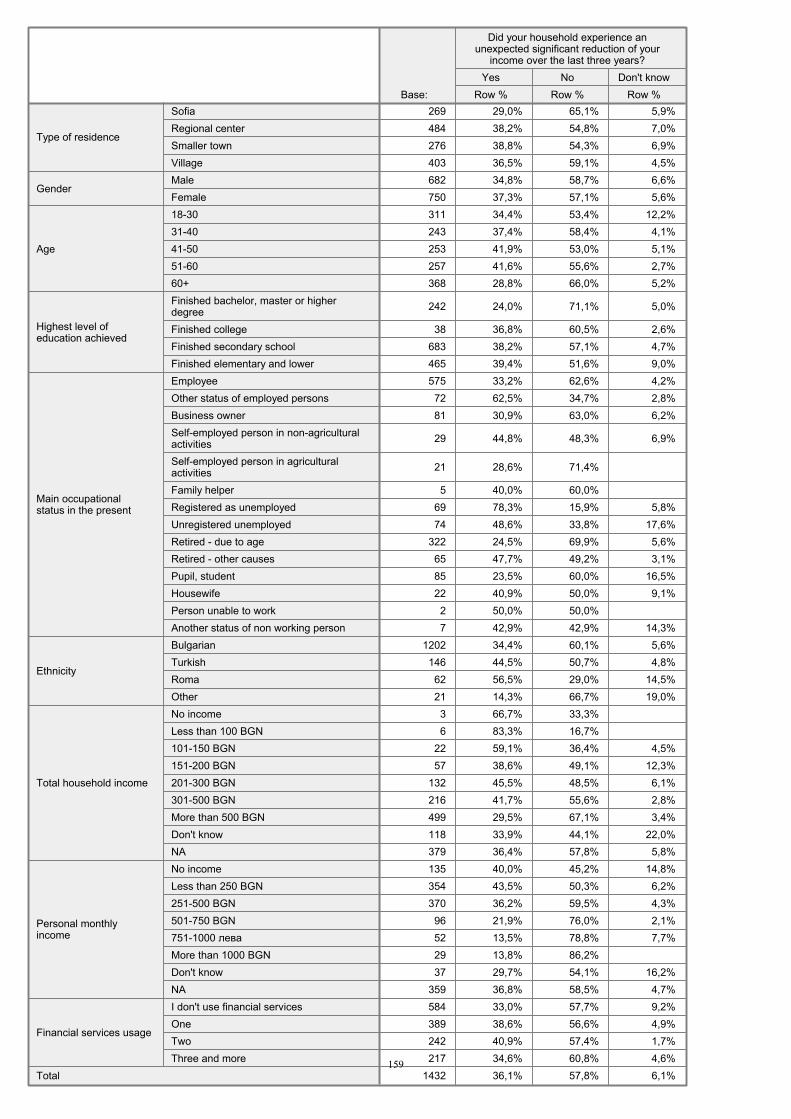
269 29,0% 65,1% 5,9%484 38,2% 54,8% 7,0%276 38,8% 54,3% 6,9%403 36,5% 59,1% 4,5%682 34,8% 58,7% 6,6%750 37,3% 57,1% 5,6%311 34,4% 53,4% 12,2%243 37,4% 58,4% 4,1%253 41,9% 53,0% 5,1%257 41,6% 55,6% 2,7%368 28,8% 66,0% 5,2%
242 24,0% 71,1% 5,0%
38 36,8% 60,5% 2,6%683 38,2% 57,1% 4,7%465 39,4% 51,6% 9,0%575 33,2% 62,6% 4,2%72 62,5% 34,7% 2,8%81 30,9% 63,0% 6,2%
29 44,8% 48,3% 6,9%
21 28,6% 71,4%
5 40,0% 60,0% 69 78,3% 15,9% 5,8%74 48,6% 33,8% 17,6%
322 24,5% 69,9% 5,6%65 47,7% 49,2% 3,1%85 23,5% 60,0% 16,5%22 40,9% 50,0% 9,1%2 50,0% 50,0% 7 42,9% 42,9% 14,3%
1202 34,4% 60,1% 5,6%146 44,5% 50,7% 4,8%62 56,5% 29,0% 14,5%21 14,3% 66,7% 19,0%3 66,7% 33,3% 6 83,3% 16,7%
22 59,1% 36,4% 4,5%57 38,6% 49,1% 12,3%
132 45,5% 48,5% 6,1%216 41,7% 55,6% 2,8%499 29,5% 67,1% 3,4%118 33,9% 44,1% 22,0%379 36,4% 57,8% 5,8%135 40,0% 45,2% 14,8%354 43,5% 50,3% 6,2%370 36,2% 59,5% 4,3%96 21,9% 76,0% 2,1%52 13,5% 78,8% 7,7%29 13,8% 86,2% 37 29,7% 54,1% 16,2%
359 36,8% 58,5% 4,7%584 33,0% 57,7% 9,2%389 38,6% 56,6% 4,9%242 40,9% 57,4% 1,7%217 34,6% 60,8% 4,6%
1432 36,1% 57,8% 6,1%
SofiaRegional centerSmaller townVillage
Type of residence
MaleFemale
Gender
18-3031-4041-5051-6060+
Age
Finished bachelor, master or higherdegreeFinished collegeFinished secondary schoolFinished elementary and lower
Highest level ofeducation achieved
EmployeeOther status of employed personsBusiness ownerSelf-employed person in non-agriculturalactivitiesSelf-employed person in agriculturalactivitiesFamily helperRegistered as unemployedUnregistered unemployedRetired - due to ageRetired - other causesPupil, studentHousewifePerson unable to workAnother status of non working person
Main occupationalstatus in the present
BulgarianTurkishRomaOther
Ethnicity
No incomeLess than 100 BGN101-150 BGN151-200 BGN201-300 BGN301-500 BGNMore than 500 BGNDon't knowNA
Total household income
No incomeLess than 250 BGN251-500 BGN501-750 BGN751-1000 More than 1000 BGNDon't knowNA
Personal monthlyincome
I don't use financial servicesOneTwoThree and more
Financial services usage
Total
Base: Row %Yes
Row %No
Row %Don't know
Did your household experience anunexpected significant reduction of your
income over the last three years?
159
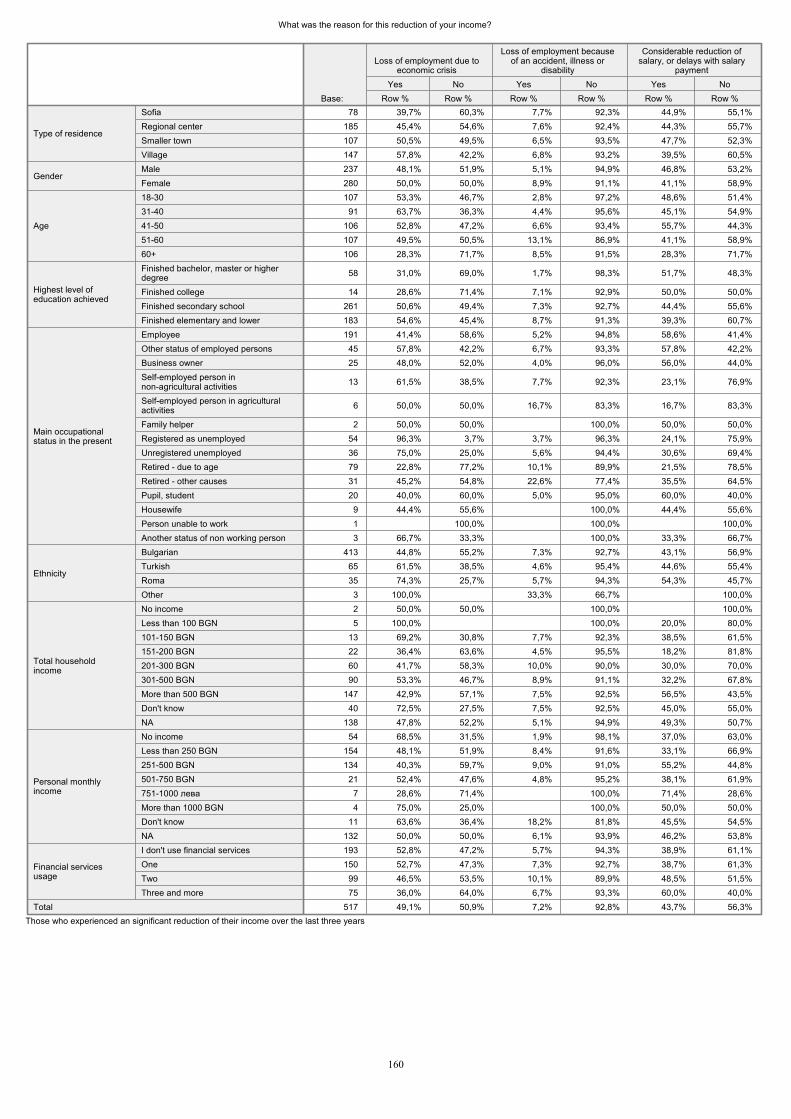
What was the reason for this reduction of your income?
78 39,7% 60,3% 7,7% 92,3% 44,9% 55,1%185 45,4% 54,6% 7,6% 92,4% 44,3% 55,7%107 50,5% 49,5% 6,5% 93,5% 47,7% 52,3%147 57,8% 42,2% 6,8% 93,2% 39,5% 60,5%237 48,1% 51,9% 5,1% 94,9% 46,8% 53,2%280 50,0% 50,0% 8,9% 91,1% 41,1% 58,9%107 53,3% 46,7% 2,8% 97,2% 48,6% 51,4%
91 63,7% 36,3% 4,4% 95,6% 45,1% 54,9%106 52,8% 47,2% 6,6% 93,4% 55,7% 44,3%107 49,5% 50,5% 13,1% 86,9% 41,1% 58,9%106 28,3% 71,7% 8,5% 91,5% 28,3% 71,7%
58 31,0% 69,0% 1,7% 98,3% 51,7% 48,3%
14 28,6% 71,4% 7,1% 92,9% 50,0% 50,0%261 50,6% 49,4% 7,3% 92,7% 44,4% 55,6%183 54,6% 45,4% 8,7% 91,3% 39,3% 60,7%191 41,4% 58,6% 5,2% 94,8% 58,6% 41,4%
45 57,8% 42,2% 6,7% 93,3% 57,8% 42,2%25 48,0% 52,0% 4,0% 96,0% 56,0% 44,0%
13 61,5% 38,5% 7,7% 92,3% 23,1% 76,9%
6 50,0% 50,0% 16,7% 83,3% 16,7% 83,3%
2 50,0% 50,0% 100,0% 50,0% 50,0%54 96,3% 3,7% 3,7% 96,3% 24,1% 75,9%36 75,0% 25,0% 5,6% 94,4% 30,6% 69,4%79 22,8% 77,2% 10,1% 89,9% 21,5% 78,5%31 45,2% 54,8% 22,6% 77,4% 35,5% 64,5%20 40,0% 60,0% 5,0% 95,0% 60,0% 40,0%
9 44,4% 55,6% 100,0% 44,4% 55,6%1 100,0% 100,0% 100,0%3 66,7% 33,3% 100,0% 33,3% 66,7%
413 44,8% 55,2% 7,3% 92,7% 43,1% 56,9%65 61,5% 38,5% 4,6% 95,4% 44,6% 55,4%35 74,3% 25,7% 5,7% 94,3% 54,3% 45,7%
3 100,0% 33,3% 66,7% 100,0%2 50,0% 50,0% 100,0% 100,0%5 100,0% 100,0% 20,0% 80,0%
13 69,2% 30,8% 7,7% 92,3% 38,5% 61,5%22 36,4% 63,6% 4,5% 95,5% 18,2% 81,8%60 41,7% 58,3% 10,0% 90,0% 30,0% 70,0%90 53,3% 46,7% 8,9% 91,1% 32,2% 67,8%
147 42,9% 57,1% 7,5% 92,5% 56,5% 43,5%40 72,5% 27,5% 7,5% 92,5% 45,0% 55,0%
138 47,8% 52,2% 5,1% 94,9% 49,3% 50,7%54 68,5% 31,5% 1,9% 98,1% 37,0% 63,0%
154 48,1% 51,9% 8,4% 91,6% 33,1% 66,9%134 40,3% 59,7% 9,0% 91,0% 55,2% 44,8%
21 52,4% 47,6% 4,8% 95,2% 38,1% 61,9%7 28,6% 71,4% 100,0% 71,4% 28,6%4 75,0% 25,0% 100,0% 50,0% 50,0%
11 63,6% 36,4% 18,2% 81,8% 45,5% 54,5%132 50,0% 50,0% 6,1% 93,9% 46,2% 53,8%193 52,8% 47,2% 5,7% 94,3% 38,9% 61,1%150 52,7% 47,3% 7,3% 92,7% 38,7% 61,3%
99 46,5% 53,5% 10,1% 89,9% 48,5% 51,5%75 36,0% 64,0% 6,7% 93,3% 60,0% 40,0%
517 49,1% 50,9% 7,2% 92,8% 43,7% 56,3%
SofiaRegional centerSmaller townVillage
Type of residence
MaleFemale
Gender
18-3031-4041-5051-6060+
Age
Finished bachelor, master or higherdegreeFinished collegeFinished secondary schoolFinished elementary and lower
Highest level ofeducation achieved
EmployeeOther status of employed personsBusiness ownerSelf-employed person innon-agricultural activitiesSelf-employed person in agriculturalactivitiesFamily helperRegistered as unemployedUnregistered unemployedRetired - due to ageRetired - other causesPupil, studentHousewifePerson unable to workAnother status of non working person
Main occupationalstatus in the present
BulgarianTurkishRomaOther
Ethnicity
No incomeLess than 100 BGN101-150 BGN151-200 BGN201-300 BGN301-500 BGNMore than 500 BGNDon't knowNA
Total householdincome
No incomeLess than 250 BGN251-500 BGN501-750 BGN751-1000 More than 1000 BGNDon't knowNA
Personal monthlyincome
I don't use financial servicesOneTwoThree and more
Financial servicesusage
Total
Base: Row %Yes
Row %No
Loss of employment due toeconomic crisis
Row %Yes
Row %No
Loss of employment becauseof an accident, illness or
disability
Row %Yes
Row %No
Considerable reduction ofsalary, or delays with salary
payment
Those who experienced an significant reduction of their income over the last three years
160
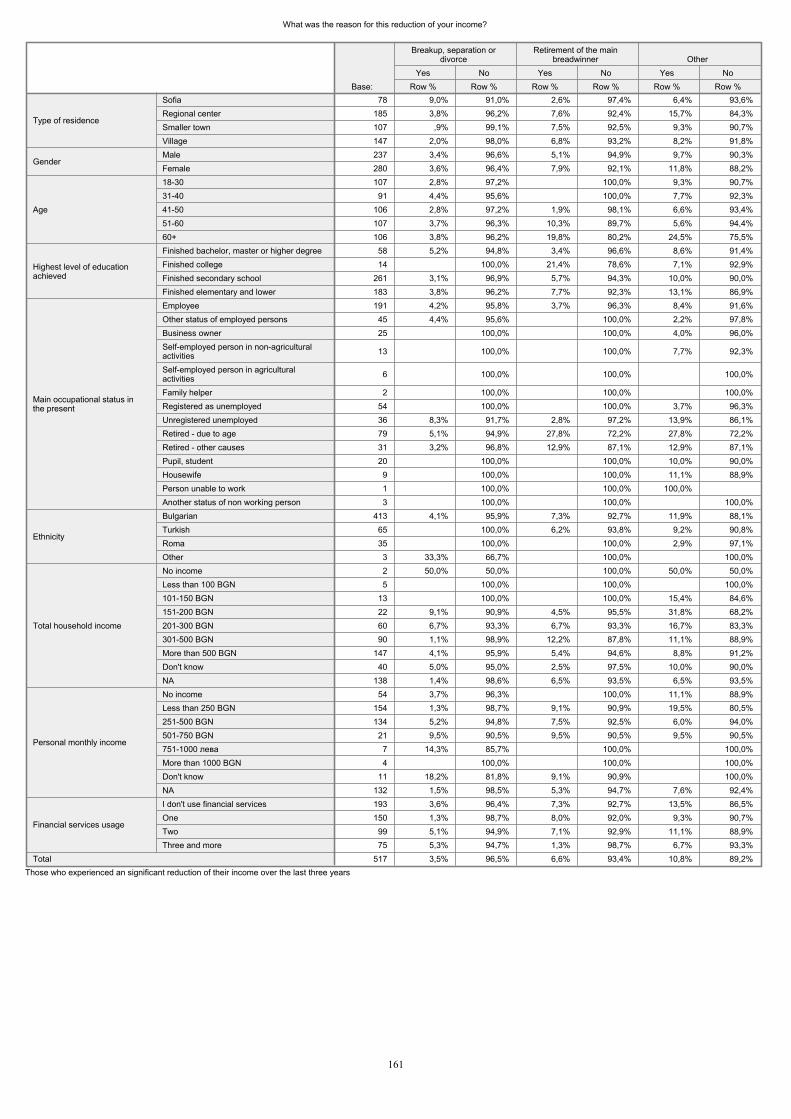
What was the reason for this reduction of your income?
78 9,0% 91,0% 2,6% 97,4% 6,4% 93,6%185 3,8% 96,2% 7,6% 92,4% 15,7% 84,3%107 ,9% 99,1% 7,5% 92,5% 9,3% 90,7%147 2,0% 98,0% 6,8% 93,2% 8,2% 91,8%237 3,4% 96,6% 5,1% 94,9% 9,7% 90,3%280 3,6% 96,4% 7,9% 92,1% 11,8% 88,2%107 2,8% 97,2% 100,0% 9,3% 90,7%91 4,4% 95,6% 100,0% 7,7% 92,3%
106 2,8% 97,2% 1,9% 98,1% 6,6% 93,4%107 3,7% 96,3% 10,3% 89,7% 5,6% 94,4%106 3,8% 96,2% 19,8% 80,2% 24,5% 75,5%58 5,2% 94,8% 3,4% 96,6% 8,6% 91,4%14 100,0% 21,4% 78,6% 7,1% 92,9%
261 3,1% 96,9% 5,7% 94,3% 10,0% 90,0%183 3,8% 96,2% 7,7% 92,3% 13,1% 86,9%191 4,2% 95,8% 3,7% 96,3% 8,4% 91,6%45 4,4% 95,6% 100,0% 2,2% 97,8%25 100,0% 100,0% 4,0% 96,0%
13 100,0% 100,0% 7,7% 92,3%
6 100,0% 100,0% 100,0%
2 100,0% 100,0% 100,0%54 100,0% 100,0% 3,7% 96,3%36 8,3% 91,7% 2,8% 97,2% 13,9% 86,1%79 5,1% 94,9% 27,8% 72,2% 27,8% 72,2%31 3,2% 96,8% 12,9% 87,1% 12,9% 87,1%20 100,0% 100,0% 10,0% 90,0%9 100,0% 100,0% 11,1% 88,9%1 100,0% 100,0% 100,0% 3 100,0% 100,0% 100,0%
413 4,1% 95,9% 7,3% 92,7% 11,9% 88,1%65 100,0% 6,2% 93,8% 9,2% 90,8%35 100,0% 100,0% 2,9% 97,1%3 33,3% 66,7% 100,0% 100,0%2 50,0% 50,0% 100,0% 50,0% 50,0%5 100,0% 100,0% 100,0%
13 100,0% 100,0% 15,4% 84,6%22 9,1% 90,9% 4,5% 95,5% 31,8% 68,2%60 6,7% 93,3% 6,7% 93,3% 16,7% 83,3%90 1,1% 98,9% 12,2% 87,8% 11,1% 88,9%
147 4,1% 95,9% 5,4% 94,6% 8,8% 91,2%40 5,0% 95,0% 2,5% 97,5% 10,0% 90,0%
138 1,4% 98,6% 6,5% 93,5% 6,5% 93,5%54 3,7% 96,3% 100,0% 11,1% 88,9%
154 1,3% 98,7% 9,1% 90,9% 19,5% 80,5%134 5,2% 94,8% 7,5% 92,5% 6,0% 94,0%21 9,5% 90,5% 9,5% 90,5% 9,5% 90,5%7 14,3% 85,7% 100,0% 100,0%4 100,0% 100,0% 100,0%
11 18,2% 81,8% 9,1% 90,9% 100,0%132 1,5% 98,5% 5,3% 94,7% 7,6% 92,4%193 3,6% 96,4% 7,3% 92,7% 13,5% 86,5%150 1,3% 98,7% 8,0% 92,0% 9,3% 90,7%99 5,1% 94,9% 7,1% 92,9% 11,1% 88,9%75 5,3% 94,7% 1,3% 98,7% 6,7% 93,3%
517 3,5% 96,5% 6,6% 93,4% 10,8% 89,2%
SofiaRegional centerSmaller townVillage
Type of residence
MaleFemale
Gender
18-3031-4041-5051-6060+
Age
Finished bachelor, master or higher degreeFinished collegeFinished secondary schoolFinished elementary and lower
Highest level of educationachieved
EmployeeOther status of employed personsBusiness ownerSelf-employed person in non-agriculturalactivitiesSelf-employed person in agriculturalactivitiesFamily helperRegistered as unemployedUnregistered unemployedRetired - due to ageRetired - other causesPupil, studentHousewifePerson unable to workAnother status of non working person
Main occupational status inthe present
BulgarianTurkishRomaOther
Ethnicity
No incomeLess than 100 BGN101-150 BGN151-200 BGN201-300 BGN301-500 BGNMore than 500 BGNDon't knowNA
Total household income
No incomeLess than 250 BGN251-500 BGN501-750 BGN751-1000 More than 1000 BGNDon't knowNA
Personal monthly income
I don't use financial servicesOneTwoThree and more
Financial services usage
Total
Base: Row %Yes
Row %No
Breakup, separation ordivorce
Row %Yes
Row %No
Retirement of the mainbreadwinner
Row %Yes
Row %No
Other
Those who experienced an significant reduction of their income over the last three years
161
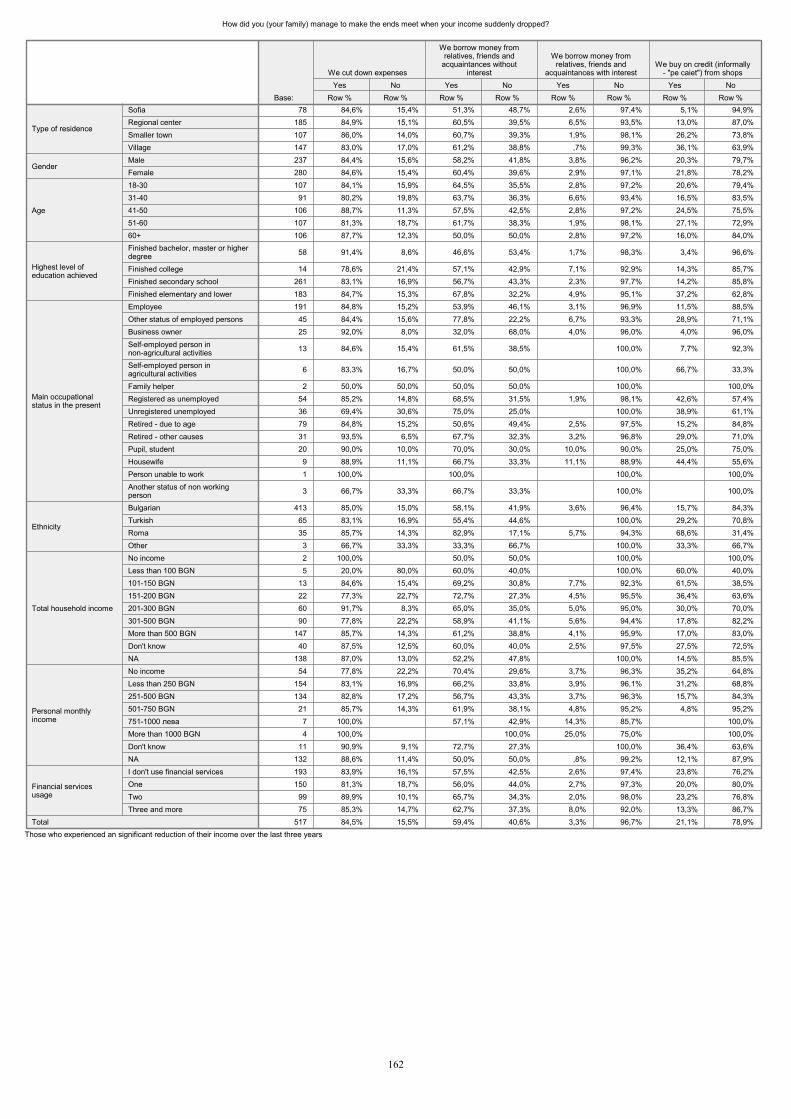
How did you (your family) manage to make the ends meet when your income suddenly dropped?
78 84,6% 15,4% 51,3% 48,7% 2,6% 97,4% 5,1% 94,9%185 84,9% 15,1% 60,5% 39,5% 6,5% 93,5% 13,0% 87,0%107 86,0% 14,0% 60,7% 39,3% 1,9% 98,1% 26,2% 73,8%147 83,0% 17,0% 61,2% 38,8% ,7% 99,3% 36,1% 63,9%237 84,4% 15,6% 58,2% 41,8% 3,8% 96,2% 20,3% 79,7%280 84,6% 15,4% 60,4% 39,6% 2,9% 97,1% 21,8% 78,2%107 84,1% 15,9% 64,5% 35,5% 2,8% 97,2% 20,6% 79,4%91 80,2% 19,8% 63,7% 36,3% 6,6% 93,4% 16,5% 83,5%
106 88,7% 11,3% 57,5% 42,5% 2,8% 97,2% 24,5% 75,5%107 81,3% 18,7% 61,7% 38,3% 1,9% 98,1% 27,1% 72,9%106 87,7% 12,3% 50,0% 50,0% 2,8% 97,2% 16,0% 84,0%
58 91,4% 8,6% 46,6% 53,4% 1,7% 98,3% 3,4% 96,6%
14 78,6% 21,4% 57,1% 42,9% 7,1% 92,9% 14,3% 85,7%261 83,1% 16,9% 56,7% 43,3% 2,3% 97,7% 14,2% 85,8%183 84,7% 15,3% 67,8% 32,2% 4,9% 95,1% 37,2% 62,8%191 84,8% 15,2% 53,9% 46,1% 3,1% 96,9% 11,5% 88,5%45 84,4% 15,6% 77,8% 22,2% 6,7% 93,3% 28,9% 71,1%25 92,0% 8,0% 32,0% 68,0% 4,0% 96,0% 4,0% 96,0%
13 84,6% 15,4% 61,5% 38,5% 100,0% 7,7% 92,3%
6 83,3% 16,7% 50,0% 50,0% 100,0% 66,7% 33,3%
2 50,0% 50,0% 50,0% 50,0% 100,0% 100,0%54 85,2% 14,8% 68,5% 31,5% 1,9% 98,1% 42,6% 57,4%36 69,4% 30,6% 75,0% 25,0% 100,0% 38,9% 61,1%79 84,8% 15,2% 50,6% 49,4% 2,5% 97,5% 15,2% 84,8%31 93,5% 6,5% 67,7% 32,3% 3,2% 96,8% 29,0% 71,0%20 90,0% 10,0% 70,0% 30,0% 10,0% 90,0% 25,0% 75,0%9 88,9% 11,1% 66,7% 33,3% 11,1% 88,9% 44,4% 55,6%1 100,0% 100,0% 100,0% 100,0%
3 66,7% 33,3% 66,7% 33,3% 100,0% 100,0%
413 85,0% 15,0% 58,1% 41,9% 3,6% 96,4% 15,7% 84,3%65 83,1% 16,9% 55,4% 44,6% 100,0% 29,2% 70,8%35 85,7% 14,3% 82,9% 17,1% 5,7% 94,3% 68,6% 31,4%3 66,7% 33,3% 33,3% 66,7% 100,0% 33,3% 66,7%2 100,0% 50,0% 50,0% 100,0% 100,0%5 20,0% 80,0% 60,0% 40,0% 100,0% 60,0% 40,0%
13 84,6% 15,4% 69,2% 30,8% 7,7% 92,3% 61,5% 38,5%22 77,3% 22,7% 72,7% 27,3% 4,5% 95,5% 36,4% 63,6%60 91,7% 8,3% 65,0% 35,0% 5,0% 95,0% 30,0% 70,0%90 77,8% 22,2% 58,9% 41,1% 5,6% 94,4% 17,8% 82,2%
147 85,7% 14,3% 61,2% 38,8% 4,1% 95,9% 17,0% 83,0%40 87,5% 12,5% 60,0% 40,0% 2,5% 97,5% 27,5% 72,5%
138 87,0% 13,0% 52,2% 47,8% 100,0% 14,5% 85,5%54 77,8% 22,2% 70,4% 29,6% 3,7% 96,3% 35,2% 64,8%
154 83,1% 16,9% 66,2% 33,8% 3,9% 96,1% 31,2% 68,8%134 82,8% 17,2% 56,7% 43,3% 3,7% 96,3% 15,7% 84,3%21 85,7% 14,3% 61,9% 38,1% 4,8% 95,2% 4,8% 95,2%7 100,0% 57,1% 42,9% 14,3% 85,7% 100,0%4 100,0% 100,0% 25,0% 75,0% 100,0%
11 90,9% 9,1% 72,7% 27,3% 100,0% 36,4% 63,6%132 88,6% 11,4% 50,0% 50,0% ,8% 99,2% 12,1% 87,9%193 83,9% 16,1% 57,5% 42,5% 2,6% 97,4% 23,8% 76,2%150 81,3% 18,7% 56,0% 44,0% 2,7% 97,3% 20,0% 80,0%99 89,9% 10,1% 65,7% 34,3% 2,0% 98,0% 23,2% 76,8%75 85,3% 14,7% 62,7% 37,3% 8,0% 92,0% 13,3% 86,7%
517 84,5% 15,5% 59,4% 40,6% 3,3% 96,7% 21,1% 78,9%
SofiaRegional centerSmaller townVillage
Type of residence
MaleFemale
Gender
18-3031-4041-5051-6060+
Age
Finished bachelor, master or higherdegreeFinished collegeFinished secondary schoolFinished elementary and lower
Highest level ofeducation achieved
EmployeeOther status of employed personsBusiness ownerSelf-employed person innon-agricultural activitiesSelf-employed person inagricultural activitiesFamily helperRegistered as unemployedUnregistered unemployedRetired - due to ageRetired - other causesPupil, studentHousewifePerson unable to workAnother status of non workingperson
Main occupationalstatus in the present
BulgarianTurkishRomaOther
Ethnicity
No incomeLess than 100 BGN101-150 BGN151-200 BGN201-300 BGN301-500 BGNMore than 500 BGNDon't knowNA
Total household income
No incomeLess than 250 BGN251-500 BGN501-750 BGN751-1000 More than 1000 BGNDon't knowNA
Personal monthlyincome
I don't use financial servicesOneTwoThree and more
Financial servicesusage
Total
Base: Row %Yes
Row %No
We cut down expenses
Row %Yes
Row %No
We borrow money fromrelatives, friends and
acquaintances withoutinterest
Row %Yes
Row %No
We borrow money fromrelatives, friends and
acquaintances with interest
Row %Yes
Row %No
We buy on credit (informally- "pe caiet") from shops
Those who experienced an significant reduction of their income over the last three years
162
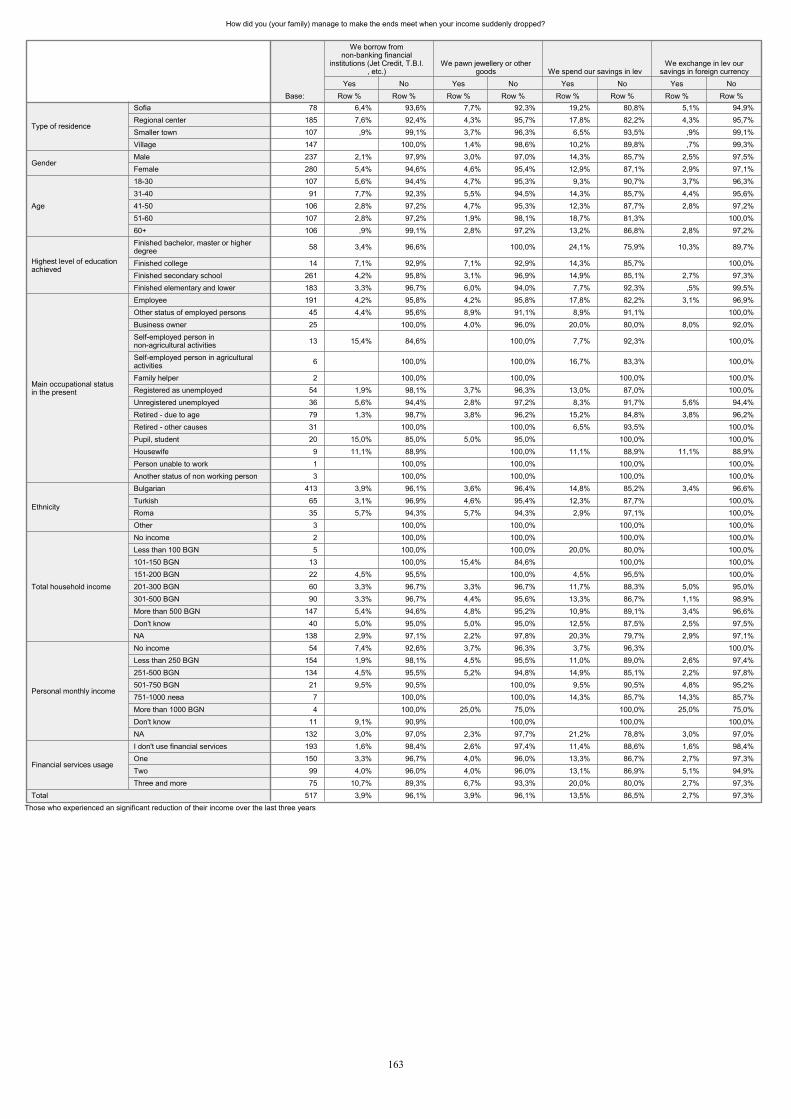
How did you (your family) manage to make the ends meet when your income suddenly dropped?
78 6,4% 93,6% 7,7% 92,3% 19,2% 80,8% 5,1% 94,9%185 7,6% 92,4% 4,3% 95,7% 17,8% 82,2% 4,3% 95,7%107 ,9% 99,1% 3,7% 96,3% 6,5% 93,5% ,9% 99,1%147 100,0% 1,4% 98,6% 10,2% 89,8% ,7% 99,3%237 2,1% 97,9% 3,0% 97,0% 14,3% 85,7% 2,5% 97,5%280 5,4% 94,6% 4,6% 95,4% 12,9% 87,1% 2,9% 97,1%107 5,6% 94,4% 4,7% 95,3% 9,3% 90,7% 3,7% 96,3%91 7,7% 92,3% 5,5% 94,5% 14,3% 85,7% 4,4% 95,6%
106 2,8% 97,2% 4,7% 95,3% 12,3% 87,7% 2,8% 97,2%107 2,8% 97,2% 1,9% 98,1% 18,7% 81,3% 100,0%106 ,9% 99,1% 2,8% 97,2% 13,2% 86,8% 2,8% 97,2%
58 3,4% 96,6% 100,0% 24,1% 75,9% 10,3% 89,7%
14 7,1% 92,9% 7,1% 92,9% 14,3% 85,7% 100,0%261 4,2% 95,8% 3,1% 96,9% 14,9% 85,1% 2,7% 97,3%183 3,3% 96,7% 6,0% 94,0% 7,7% 92,3% ,5% 99,5%191 4,2% 95,8% 4,2% 95,8% 17,8% 82,2% 3,1% 96,9%45 4,4% 95,6% 8,9% 91,1% 8,9% 91,1% 100,0%25 100,0% 4,0% 96,0% 20,0% 80,0% 8,0% 92,0%
13 15,4% 84,6% 100,0% 7,7% 92,3% 100,0%
6 100,0% 100,0% 16,7% 83,3% 100,0%
2 100,0% 100,0% 100,0% 100,0%54 1,9% 98,1% 3,7% 96,3% 13,0% 87,0% 100,0%36 5,6% 94,4% 2,8% 97,2% 8,3% 91,7% 5,6% 94,4%79 1,3% 98,7% 3,8% 96,2% 15,2% 84,8% 3,8% 96,2%31 100,0% 100,0% 6,5% 93,5% 100,0%20 15,0% 85,0% 5,0% 95,0% 100,0% 100,0%9 11,1% 88,9% 100,0% 11,1% 88,9% 11,1% 88,9%1 100,0% 100,0% 100,0% 100,0%3 100,0% 100,0% 100,0% 100,0%
413 3,9% 96,1% 3,6% 96,4% 14,8% 85,2% 3,4% 96,6%65 3,1% 96,9% 4,6% 95,4% 12,3% 87,7% 100,0%35 5,7% 94,3% 5,7% 94,3% 2,9% 97,1% 100,0%3 100,0% 100,0% 100,0% 100,0%2 100,0% 100,0% 100,0% 100,0%5 100,0% 100,0% 20,0% 80,0% 100,0%
13 100,0% 15,4% 84,6% 100,0% 100,0%22 4,5% 95,5% 100,0% 4,5% 95,5% 100,0%60 3,3% 96,7% 3,3% 96,7% 11,7% 88,3% 5,0% 95,0%90 3,3% 96,7% 4,4% 95,6% 13,3% 86,7% 1,1% 98,9%
147 5,4% 94,6% 4,8% 95,2% 10,9% 89,1% 3,4% 96,6%40 5,0% 95,0% 5,0% 95,0% 12,5% 87,5% 2,5% 97,5%
138 2,9% 97,1% 2,2% 97,8% 20,3% 79,7% 2,9% 97,1%54 7,4% 92,6% 3,7% 96,3% 3,7% 96,3% 100,0%
154 1,9% 98,1% 4,5% 95,5% 11,0% 89,0% 2,6% 97,4%134 4,5% 95,5% 5,2% 94,8% 14,9% 85,1% 2,2% 97,8%21 9,5% 90,5% 100,0% 9,5% 90,5% 4,8% 95,2%7 100,0% 100,0% 14,3% 85,7% 14,3% 85,7%4 100,0% 25,0% 75,0% 100,0% 25,0% 75,0%
11 9,1% 90,9% 100,0% 100,0% 100,0%132 3,0% 97,0% 2,3% 97,7% 21,2% 78,8% 3,0% 97,0%193 1,6% 98,4% 2,6% 97,4% 11,4% 88,6% 1,6% 98,4%150 3,3% 96,7% 4,0% 96,0% 13,3% 86,7% 2,7% 97,3%99 4,0% 96,0% 4,0% 96,0% 13,1% 86,9% 5,1% 94,9%75 10,7% 89,3% 6,7% 93,3% 20,0% 80,0% 2,7% 97,3%
517 3,9% 96,1% 3,9% 96,1% 13,5% 86,5% 2,7% 97,3%
SofiaRegional centerSmaller townVillage
Type of residence
MaleFemale
Gender
18-3031-4041-5051-6060+
Age
Finished bachelor, master or higherdegreeFinished collegeFinished secondary schoolFinished elementary and lower
Highest level of educationachieved
EmployeeOther status of employed personsBusiness ownerSelf-employed person innon-agricultural activitiesSelf-employed person in agriculturalactivitiesFamily helperRegistered as unemployedUnregistered unemployedRetired - due to ageRetired - other causesPupil, studentHousewifePerson unable to workAnother status of non working person
Main occupational statusin the present
BulgarianTurkishRomaOther
Ethnicity
No incomeLess than 100 BGN101-150 BGN151-200 BGN201-300 BGN301-500 BGNMore than 500 BGNDon't knowNA
Total household income
No incomeLess than 250 BGN251-500 BGN501-750 BGN751-1000 More than 1000 BGNDon't knowNA
Personal monthly income
I don't use financial servicesOneTwoThree and more
Financial services usage
Total
Base: Row %Yes
Row %No
We borrow fromnon-banking financial
institutions (Jet Credit, T.B.I., etc.)
Row %Yes
Row %No
We pawn jewellery or othergoods
Row %Yes
Row %No
We spend our savings in lev
Row %Yes
Row %No
We exchange in lev oursavings in foreign currency
Those who experienced an significant reduction of their income over the last three years
163
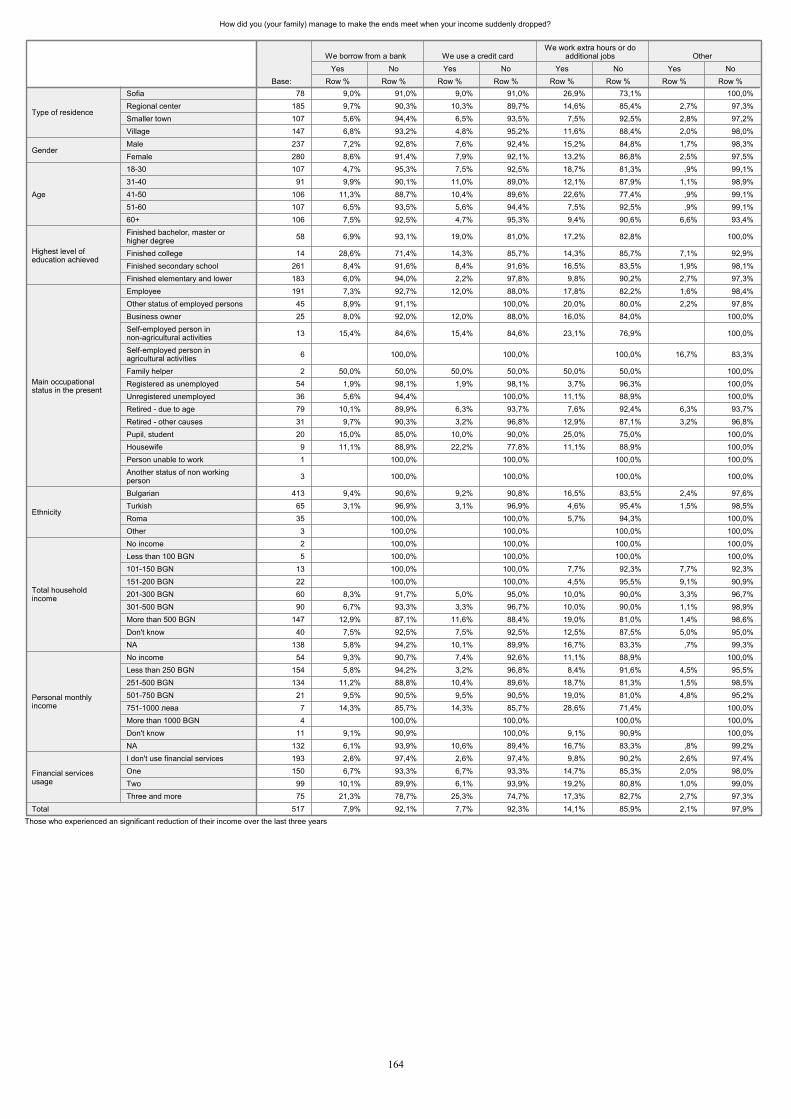
How did you (your family) manage to make the ends meet when your income suddenly dropped?
78 9,0% 91,0% 9,0% 91,0% 26,9% 73,1% 100,0%185 9,7% 90,3% 10,3% 89,7% 14,6% 85,4% 2,7% 97,3%107 5,6% 94,4% 6,5% 93,5% 7,5% 92,5% 2,8% 97,2%147 6,8% 93,2% 4,8% 95,2% 11,6% 88,4% 2,0% 98,0%237 7,2% 92,8% 7,6% 92,4% 15,2% 84,8% 1,7% 98,3%280 8,6% 91,4% 7,9% 92,1% 13,2% 86,8% 2,5% 97,5%107 4,7% 95,3% 7,5% 92,5% 18,7% 81,3% ,9% 99,1%
91 9,9% 90,1% 11,0% 89,0% 12,1% 87,9% 1,1% 98,9%106 11,3% 88,7% 10,4% 89,6% 22,6% 77,4% ,9% 99,1%107 6,5% 93,5% 5,6% 94,4% 7,5% 92,5% ,9% 99,1%106 7,5% 92,5% 4,7% 95,3% 9,4% 90,6% 6,6% 93,4%
58 6,9% 93,1% 19,0% 81,0% 17,2% 82,8% 100,0%
14 28,6% 71,4% 14,3% 85,7% 14,3% 85,7% 7,1% 92,9%261 8,4% 91,6% 8,4% 91,6% 16,5% 83,5% 1,9% 98,1%183 6,0% 94,0% 2,2% 97,8% 9,8% 90,2% 2,7% 97,3%191 7,3% 92,7% 12,0% 88,0% 17,8% 82,2% 1,6% 98,4%
45 8,9% 91,1% 100,0% 20,0% 80,0% 2,2% 97,8%25 8,0% 92,0% 12,0% 88,0% 16,0% 84,0% 100,0%
13 15,4% 84,6% 15,4% 84,6% 23,1% 76,9% 100,0%
6 100,0% 100,0% 100,0% 16,7% 83,3%
2 50,0% 50,0% 50,0% 50,0% 50,0% 50,0% 100,0%54 1,9% 98,1% 1,9% 98,1% 3,7% 96,3% 100,0%36 5,6% 94,4% 100,0% 11,1% 88,9% 100,0%79 10,1% 89,9% 6,3% 93,7% 7,6% 92,4% 6,3% 93,7%31 9,7% 90,3% 3,2% 96,8% 12,9% 87,1% 3,2% 96,8%20 15,0% 85,0% 10,0% 90,0% 25,0% 75,0% 100,0%
9 11,1% 88,9% 22,2% 77,8% 11,1% 88,9% 100,0%1 100,0% 100,0% 100,0% 100,0%
3 100,0% 100,0% 100,0% 100,0%
413 9,4% 90,6% 9,2% 90,8% 16,5% 83,5% 2,4% 97,6%65 3,1% 96,9% 3,1% 96,9% 4,6% 95,4% 1,5% 98,5%35 100,0% 100,0% 5,7% 94,3% 100,0%
3 100,0% 100,0% 100,0% 100,0%2 100,0% 100,0% 100,0% 100,0%5 100,0% 100,0% 100,0% 100,0%
13 100,0% 100,0% 7,7% 92,3% 7,7% 92,3%22 100,0% 100,0% 4,5% 95,5% 9,1% 90,9%60 8,3% 91,7% 5,0% 95,0% 10,0% 90,0% 3,3% 96,7%90 6,7% 93,3% 3,3% 96,7% 10,0% 90,0% 1,1% 98,9%
147 12,9% 87,1% 11,6% 88,4% 19,0% 81,0% 1,4% 98,6%40 7,5% 92,5% 7,5% 92,5% 12,5% 87,5% 5,0% 95,0%
138 5,8% 94,2% 10,1% 89,9% 16,7% 83,3% ,7% 99,3%54 9,3% 90,7% 7,4% 92,6% 11,1% 88,9% 100,0%
154 5,8% 94,2% 3,2% 96,8% 8,4% 91,6% 4,5% 95,5%134 11,2% 88,8% 10,4% 89,6% 18,7% 81,3% 1,5% 98,5%
21 9,5% 90,5% 9,5% 90,5% 19,0% 81,0% 4,8% 95,2%7 14,3% 85,7% 14,3% 85,7% 28,6% 71,4% 100,0%4 100,0% 100,0% 100,0% 100,0%
11 9,1% 90,9% 100,0% 9,1% 90,9% 100,0%132 6,1% 93,9% 10,6% 89,4% 16,7% 83,3% ,8% 99,2%193 2,6% 97,4% 2,6% 97,4% 9,8% 90,2% 2,6% 97,4%150 6,7% 93,3% 6,7% 93,3% 14,7% 85,3% 2,0% 98,0%
99 10,1% 89,9% 6,1% 93,9% 19,2% 80,8% 1,0% 99,0%75 21,3% 78,7% 25,3% 74,7% 17,3% 82,7% 2,7% 97,3%
517 7,9% 92,1% 7,7% 92,3% 14,1% 85,9% 2,1% 97,9%
SofiaRegional centerSmaller townVillage
Type of residence
MaleFemale
Gender
18-3031-4041-5051-6060+
Age
Finished bachelor, master orhigher degreeFinished collegeFinished secondary schoolFinished elementary and lower
Highest level ofeducation achieved
EmployeeOther status of employed personsBusiness ownerSelf-employed person innon-agricultural activitiesSelf-employed person inagricultural activitiesFamily helperRegistered as unemployedUnregistered unemployedRetired - due to ageRetired - other causesPupil, studentHousewifePerson unable to workAnother status of non workingperson
Main occupationalstatus in the present
BulgarianTurkishRomaOther
Ethnicity
No incomeLess than 100 BGN101-150 BGN151-200 BGN201-300 BGN301-500 BGNMore than 500 BGNDon't knowNA
Total householdincome
No incomeLess than 250 BGN251-500 BGN501-750 BGN751-1000 More than 1000 BGNDon't knowNA
Personal monthlyincome
I don't use financial servicesOneTwoThree and more
Financial servicesusage
Total
Base: Row %Yes
Row %No
We borrow from a bank
Row %Yes
Row %No
We use a credit card
Row %Yes
Row %No
We work extra hours or doadditional jobs
Row %Yes
Row %No
Other
Those who experienced an significant reduction of their income over the last three years
164
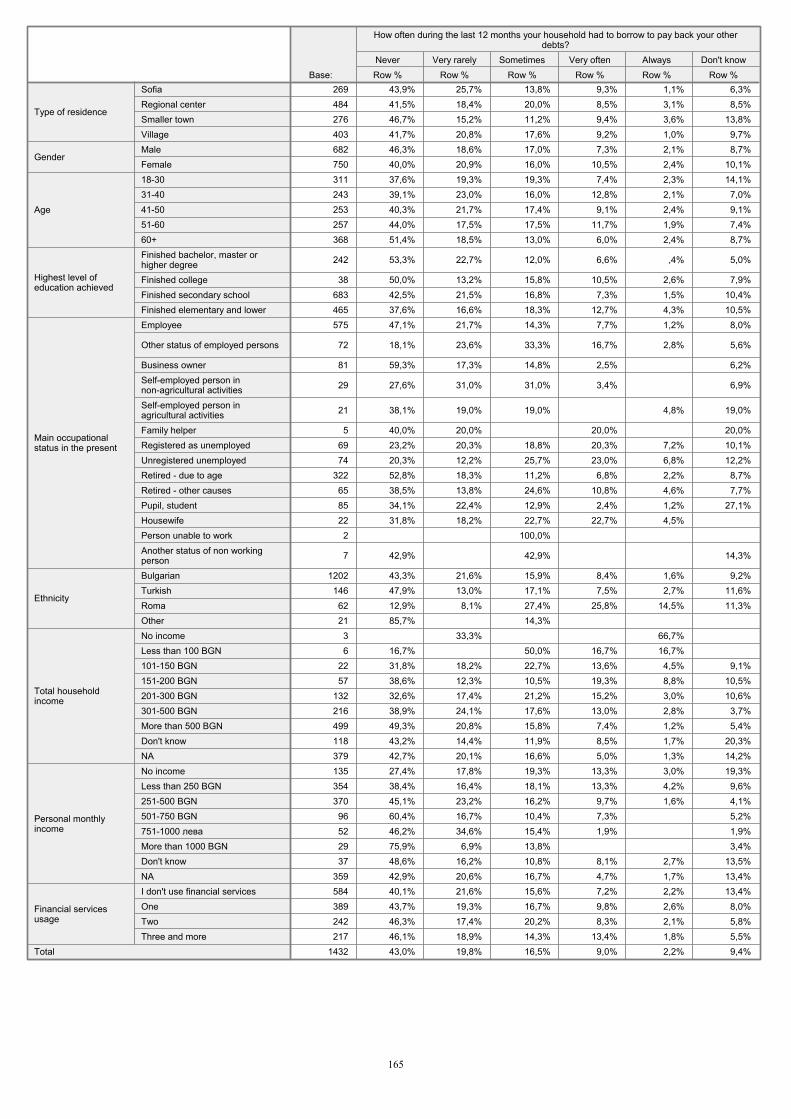
269 43,9% 25,7% 13,8% 9,3% 1,1% 6,3%484 41,5% 18,4% 20,0% 8,5% 3,1% 8,5%276 46,7% 15,2% 11,2% 9,4% 3,6% 13,8%403 41,7% 20,8% 17,6% 9,2% 1,0% 9,7%682 46,3% 18,6% 17,0% 7,3% 2,1% 8,7%750 40,0% 20,9% 16,0% 10,5% 2,4% 10,1%311 37,6% 19,3% 19,3% 7,4% 2,3% 14,1%243 39,1% 23,0% 16,0% 12,8% 2,1% 7,0%253 40,3% 21,7% 17,4% 9,1% 2,4% 9,1%257 44,0% 17,5% 17,5% 11,7% 1,9% 7,4%368 51,4% 18,5% 13,0% 6,0% 2,4% 8,7%
242 53,3% 22,7% 12,0% 6,6% ,4% 5,0%
38 50,0% 13,2% 15,8% 10,5% 2,6% 7,9%683 42,5% 21,5% 16,8% 7,3% 1,5% 10,4%465 37,6% 16,6% 18,3% 12,7% 4,3% 10,5%575 47,1% 21,7% 14,3% 7,7% 1,2% 8,0%
72 18,1% 23,6% 33,3% 16,7% 2,8% 5,6%
81 59,3% 17,3% 14,8% 2,5% 6,2%
29 27,6% 31,0% 31,0% 3,4% 6,9%
21 38,1% 19,0% 19,0% 4,8% 19,0%
5 40,0% 20,0% 20,0% 20,0%69 23,2% 20,3% 18,8% 20,3% 7,2% 10,1%74 20,3% 12,2% 25,7% 23,0% 6,8% 12,2%
322 52,8% 18,3% 11,2% 6,8% 2,2% 8,7%65 38,5% 13,8% 24,6% 10,8% 4,6% 7,7%85 34,1% 22,4% 12,9% 2,4% 1,2% 27,1%22 31,8% 18,2% 22,7% 22,7% 4,5% 2 100,0%
7 42,9% 42,9% 14,3%
1202 43,3% 21,6% 15,9% 8,4% 1,6% 9,2%146 47,9% 13,0% 17,1% 7,5% 2,7% 11,6%62 12,9% 8,1% 27,4% 25,8% 14,5% 11,3%21 85,7% 14,3% 3 33,3% 66,7% 6 16,7% 50,0% 16,7% 16,7%
22 31,8% 18,2% 22,7% 13,6% 4,5% 9,1%57 38,6% 12,3% 10,5% 19,3% 8,8% 10,5%
132 32,6% 17,4% 21,2% 15,2% 3,0% 10,6%216 38,9% 24,1% 17,6% 13,0% 2,8% 3,7%499 49,3% 20,8% 15,8% 7,4% 1,2% 5,4%118 43,2% 14,4% 11,9% 8,5% 1,7% 20,3%379 42,7% 20,1% 16,6% 5,0% 1,3% 14,2%135 27,4% 17,8% 19,3% 13,3% 3,0% 19,3%354 38,4% 16,4% 18,1% 13,3% 4,2% 9,6%370 45,1% 23,2% 16,2% 9,7% 1,6% 4,1%96 60,4% 16,7% 10,4% 7,3% 5,2%52 46,2% 34,6% 15,4% 1,9% 1,9%29 75,9% 6,9% 13,8% 3,4%37 48,6% 16,2% 10,8% 8,1% 2,7% 13,5%
359 42,9% 20,6% 16,7% 4,7% 1,7% 13,4%584 40,1% 21,6% 15,6% 7,2% 2,2% 13,4%389 43,7% 19,3% 16,7% 9,8% 2,6% 8,0%242 46,3% 17,4% 20,2% 8,3% 2,1% 5,8%217 46,1% 18,9% 14,3% 13,4% 1,8% 5,5%
1432 43,0% 19,8% 16,5% 9,0% 2,2% 9,4%
SofiaRegional centerSmaller townVillage
Type of residence
MaleFemale
Gender
18-3031-4041-5051-6060+
Age
Finished bachelor, master orhigher degreeFinished collegeFinished secondary schoolFinished elementary and lower
Highest level ofeducation achieved
Employee
Other status of employed persons
Business ownerSelf-employed person innon-agricultural activitiesSelf-employed person inagricultural activitiesFamily helperRegistered as unemployedUnregistered unemployedRetired - due to ageRetired - other causesPupil, studentHousewifePerson unable to workAnother status of non workingperson
Main occupationalstatus in the present
BulgarianTurkishRomaOther
Ethnicity
No incomeLess than 100 BGN101-150 BGN151-200 BGN201-300 BGN301-500 BGNMore than 500 BGNDon't knowNA
Total householdincome
No incomeLess than 250 BGN251-500 BGN501-750 BGN751-1000 More than 1000 BGNDon't knowNA
Personal monthlyincome
I don't use financial servicesOneTwoThree and more
Financial servicesusage
Total
Base: Row %Never
Row %Very rarely
Row %Sometimes
Row %Very often
Row %Always
Row %Don't know
How often during the last 12 months your household had to borrow to pay back your otherdebts?
165
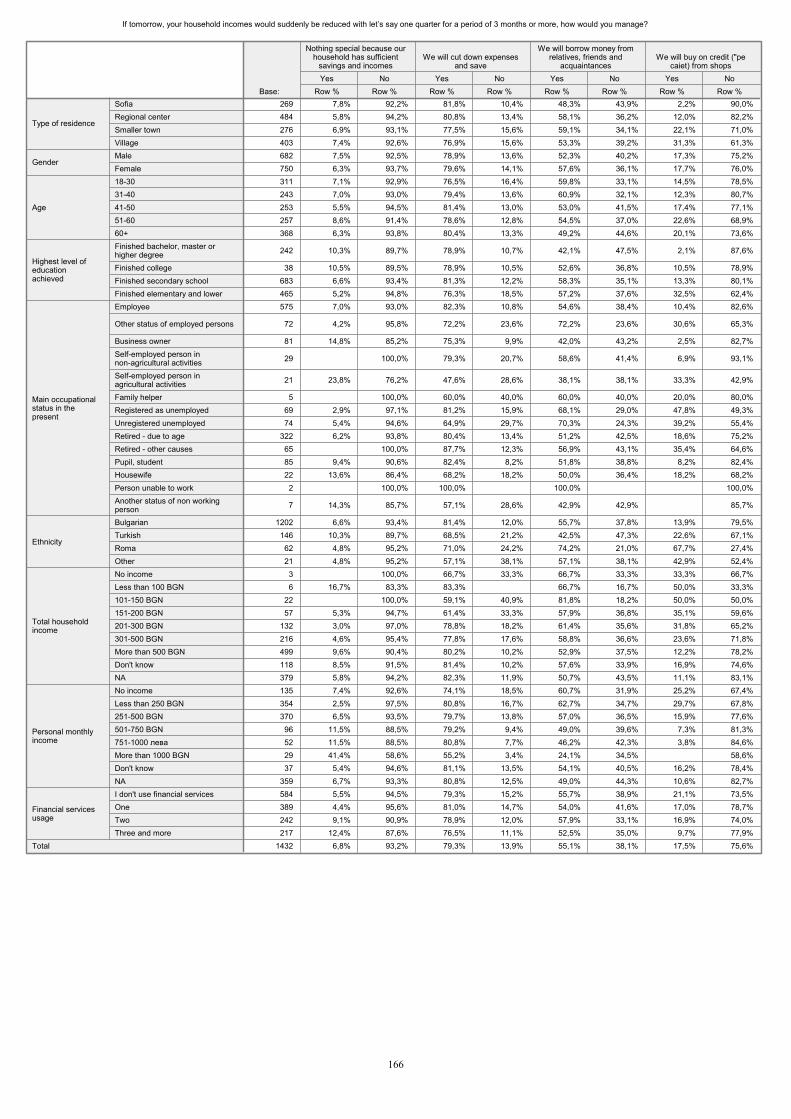
If tomorrow, your household incomes would suddenly be reduced with let�’s say one quarter for a period of 3 months or more, how would you manage?
269 7,8% 92,2% 81,8% 10,4% 48,3% 43,9% 2,2% 90,0%484 5,8% 94,2% 80,8% 13,4% 58,1% 36,2% 12,0% 82,2%276 6,9% 93,1% 77,5% 15,6% 59,1% 34,1% 22,1% 71,0%403 7,4% 92,6% 76,9% 15,6% 53,3% 39,2% 31,3% 61,3%682 7,5% 92,5% 78,9% 13,6% 52,3% 40,2% 17,3% 75,2%750 6,3% 93,7% 79,6% 14,1% 57,6% 36,1% 17,7% 76,0%311 7,1% 92,9% 76,5% 16,4% 59,8% 33,1% 14,5% 78,5%243 7,0% 93,0% 79,4% 13,6% 60,9% 32,1% 12,3% 80,7%253 5,5% 94,5% 81,4% 13,0% 53,0% 41,5% 17,4% 77,1%257 8,6% 91,4% 78,6% 12,8% 54,5% 37,0% 22,6% 68,9%368 6,3% 93,8% 80,4% 13,3% 49,2% 44,6% 20,1% 73,6%
242 10,3% 89,7% 78,9% 10,7% 42,1% 47,5% 2,1% 87,6%
38 10,5% 89,5% 78,9% 10,5% 52,6% 36,8% 10,5% 78,9%683 6,6% 93,4% 81,3% 12,2% 58,3% 35,1% 13,3% 80,1%465 5,2% 94,8% 76,3% 18,5% 57,2% 37,6% 32,5% 62,4%575 7,0% 93,0% 82,3% 10,8% 54,6% 38,4% 10,4% 82,6%
72 4,2% 95,8% 72,2% 23,6% 72,2% 23,6% 30,6% 65,3%
81 14,8% 85,2% 75,3% 9,9% 42,0% 43,2% 2,5% 82,7%
29 100,0% 79,3% 20,7% 58,6% 41,4% 6,9% 93,1%
21 23,8% 76,2% 47,6% 28,6% 38,1% 38,1% 33,3% 42,9%
5 100,0% 60,0% 40,0% 60,0% 40,0% 20,0% 80,0%69 2,9% 97,1% 81,2% 15,9% 68,1% 29,0% 47,8% 49,3%74 5,4% 94,6% 64,9% 29,7% 70,3% 24,3% 39,2% 55,4%
322 6,2% 93,8% 80,4% 13,4% 51,2% 42,5% 18,6% 75,2%65 100,0% 87,7% 12,3% 56,9% 43,1% 35,4% 64,6%85 9,4% 90,6% 82,4% 8,2% 51,8% 38,8% 8,2% 82,4%22 13,6% 86,4% 68,2% 18,2% 50,0% 36,4% 18,2% 68,2%2 100,0% 100,0% 100,0% 100,0%
7 14,3% 85,7% 57,1% 28,6% 42,9% 42,9% 85,7%
1202 6,6% 93,4% 81,4% 12,0% 55,7% 37,8% 13,9% 79,5%146 10,3% 89,7% 68,5% 21,2% 42,5% 47,3% 22,6% 67,1%62 4,8% 95,2% 71,0% 24,2% 74,2% 21,0% 67,7% 27,4%21 4,8% 95,2% 57,1% 38,1% 57,1% 38,1% 42,9% 52,4%3 100,0% 66,7% 33,3% 66,7% 33,3% 33,3% 66,7%6 16,7% 83,3% 83,3% 66,7% 16,7% 50,0% 33,3%
22 100,0% 59,1% 40,9% 81,8% 18,2% 50,0% 50,0%57 5,3% 94,7% 61,4% 33,3% 57,9% 36,8% 35,1% 59,6%
132 3,0% 97,0% 78,8% 18,2% 61,4% 35,6% 31,8% 65,2%216 4,6% 95,4% 77,8% 17,6% 58,8% 36,6% 23,6% 71,8%499 9,6% 90,4% 80,2% 10,2% 52,9% 37,5% 12,2% 78,2%118 8,5% 91,5% 81,4% 10,2% 57,6% 33,9% 16,9% 74,6%379 5,8% 94,2% 82,3% 11,9% 50,7% 43,5% 11,1% 83,1%135 7,4% 92,6% 74,1% 18,5% 60,7% 31,9% 25,2% 67,4%354 2,5% 97,5% 80,8% 16,7% 62,7% 34,7% 29,7% 67,8%370 6,5% 93,5% 79,7% 13,8% 57,0% 36,5% 15,9% 77,6%96 11,5% 88,5% 79,2% 9,4% 49,0% 39,6% 7,3% 81,3%52 11,5% 88,5% 80,8% 7,7% 46,2% 42,3% 3,8% 84,6%29 41,4% 58,6% 55,2% 3,4% 24,1% 34,5% 58,6%37 5,4% 94,6% 81,1% 13,5% 54,1% 40,5% 16,2% 78,4%
359 6,7% 93,3% 80,8% 12,5% 49,0% 44,3% 10,6% 82,7%584 5,5% 94,5% 79,3% 15,2% 55,7% 38,9% 21,1% 73,5%389 4,4% 95,6% 81,0% 14,7% 54,0% 41,6% 17,0% 78,7%242 9,1% 90,9% 78,9% 12,0% 57,9% 33,1% 16,9% 74,0%217 12,4% 87,6% 76,5% 11,1% 52,5% 35,0% 9,7% 77,9%
1432 6,8% 93,2% 79,3% 13,9% 55,1% 38,1% 17,5% 75,6%
SofiaRegional centerSmaller townVillage
Type of residence
MaleFemale
Gender
18-3031-4041-5051-6060+
Age
Finished bachelor, master orhigher degreeFinished collegeFinished secondary schoolFinished elementary and lower
Highest level ofeducationachieved
Employee
Other status of employed persons
Business ownerSelf-employed person innon-agricultural activitiesSelf-employed person inagricultural activitiesFamily helperRegistered as unemployedUnregistered unemployedRetired - due to ageRetired - other causesPupil, studentHousewifePerson unable to workAnother status of non workingperson
Main occupationalstatus in thepresent
BulgarianTurkishRomaOther
Ethnicity
No incomeLess than 100 BGN101-150 BGN151-200 BGN201-300 BGN301-500 BGNMore than 500 BGNDon't knowNA
Total householdincome
No incomeLess than 250 BGN251-500 BGN501-750 BGN751-1000 More than 1000 BGNDon't knowNA
Personal monthlyincome
I don't use financial servicesOneTwoThree and more
Financial servicesusage
Total
Base: Row %Yes
Row %No
Nothing special because ourhousehold has sufficient
savings and incomes
Row %Yes
Row %No
We will cut down expensesand save
Row %Yes
Row %No
We will borrow money fromrelatives, friends and
acquaintances
Row %Yes
Row %No
We will buy on credit ("pecaiet) from shops
166
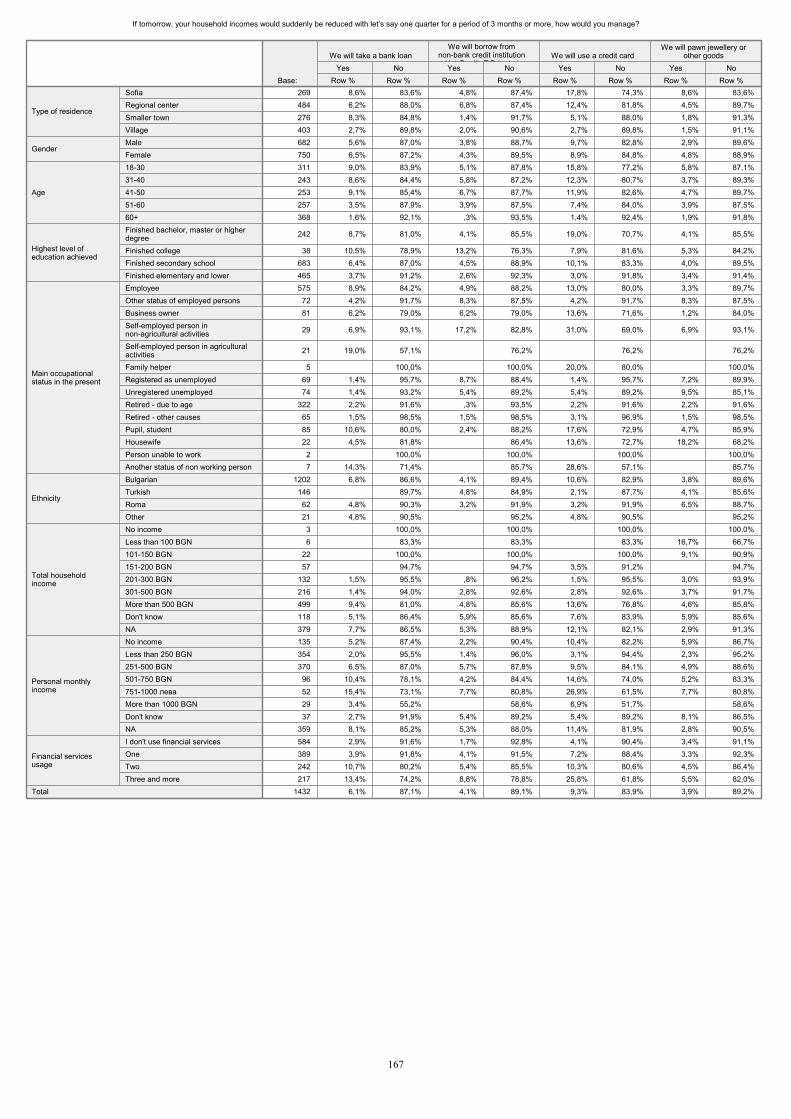
If tomorrow, your household incomes would suddenly be reduced with let�’s say one quarter for a period of 3 months or more, how would you manage?
269 8,6% 83,6% 4,8% 87,4% 17,8% 74,3% 8,6% 83,6%484 6,2% 88,0% 6,8% 87,4% 12,4% 81,8% 4,5% 89,7%276 8,3% 84,8% 1,4% 91,7% 5,1% 88,0% 1,8% 91,3%403 2,7% 89,8% 2,0% 90,6% 2,7% 89,8% 1,5% 91,1%682 5,6% 87,0% 3,8% 88,7% 9,7% 82,8% 2,9% 89,6%750 6,5% 87,2% 4,3% 89,5% 8,9% 84,8% 4,8% 88,9%311 9,0% 83,9% 5,1% 87,8% 15,8% 77,2% 5,8% 87,1%243 8,6% 84,4% 5,8% 87,2% 12,3% 80,7% 3,7% 89,3%253 9,1% 85,4% 6,7% 87,7% 11,9% 82,6% 4,7% 89,7%257 3,5% 87,9% 3,9% 87,5% 7,4% 84,0% 3,9% 87,5%368 1,6% 92,1% ,3% 93,5% 1,4% 92,4% 1,9% 91,8%
242 8,7% 81,0% 4,1% 85,5% 19,0% 70,7% 4,1% 85,5%
38 10,5% 78,9% 13,2% 76,3% 7,9% 81,6% 5,3% 84,2%683 6,4% 87,0% 4,5% 88,9% 10,1% 83,3% 4,0% 89,5%465 3,7% 91,2% 2,6% 92,3% 3,0% 91,8% 3,4% 91,4%575 8,9% 84,2% 4,9% 88,2% 13,0% 80,0% 3,3% 89,7%72 4,2% 91,7% 8,3% 87,5% 4,2% 91,7% 8,3% 87,5%81 6,2% 79,0% 6,2% 79,0% 13,6% 71,6% 1,2% 84,0%
29 6,9% 93,1% 17,2% 82,8% 31,0% 69,0% 6,9% 93,1%
21 19,0% 57,1% 76,2% 76,2% 76,2%
5 100,0% 100,0% 20,0% 80,0% 100,0%69 1,4% 95,7% 8,7% 88,4% 1,4% 95,7% 7,2% 89,9%74 1,4% 93,2% 5,4% 89,2% 5,4% 89,2% 9,5% 85,1%
322 2,2% 91,6% ,3% 93,5% 2,2% 91,6% 2,2% 91,6%65 1,5% 98,5% 1,5% 98,5% 3,1% 96,9% 1,5% 98,5%85 10,6% 80,0% 2,4% 88,2% 17,6% 72,9% 4,7% 85,9%22 4,5% 81,8% 86,4% 13,6% 72,7% 18,2% 68,2%2 100,0% 100,0% 100,0% 100,0%7 14,3% 71,4% 85,7% 28,6% 57,1% 85,7%
1202 6,8% 86,6% 4,1% 89,4% 10,6% 82,9% 3,8% 89,6%146 89,7% 4,8% 84,9% 2,1% 87,7% 4,1% 85,6%62 4,8% 90,3% 3,2% 91,9% 3,2% 91,9% 6,5% 88,7%21 4,8% 90,5% 95,2% 4,8% 90,5% 95,2%3 100,0% 100,0% 100,0% 100,0%6 83,3% 83,3% 83,3% 16,7% 66,7%
22 100,0% 100,0% 100,0% 9,1% 90,9%57 94,7% 94,7% 3,5% 91,2% 94,7%
132 1,5% 95,5% ,8% 96,2% 1,5% 95,5% 3,0% 93,9%216 1,4% 94,0% 2,8% 92,6% 2,8% 92,6% 3,7% 91,7%499 9,4% 81,0% 4,8% 85,6% 13,6% 76,8% 4,6% 85,8%118 5,1% 86,4% 5,9% 85,6% 7,6% 83,9% 5,9% 85,6%379 7,7% 86,5% 5,3% 88,9% 12,1% 82,1% 2,9% 91,3%135 5,2% 87,4% 2,2% 90,4% 10,4% 82,2% 5,9% 86,7%354 2,0% 95,5% 1,4% 96,0% 3,1% 94,4% 2,3% 95,2%370 6,5% 87,0% 5,7% 87,8% 9,5% 84,1% 4,9% 88,6%96 10,4% 78,1% 4,2% 84,4% 14,6% 74,0% 5,2% 83,3%52 15,4% 73,1% 7,7% 80,8% 26,9% 61,5% 7,7% 80,8%29 3,4% 55,2% 58,6% 6,9% 51,7% 58,6%37 2,7% 91,9% 5,4% 89,2% 5,4% 89,2% 8,1% 86,5%
359 8,1% 85,2% 5,3% 88,0% 11,4% 81,9% 2,8% 90,5%584 2,9% 91,6% 1,7% 92,8% 4,1% 90,4% 3,4% 91,1%389 3,9% 91,8% 4,1% 91,5% 7,2% 88,4% 3,3% 92,3%242 10,7% 80,2% 5,4% 85,5% 10,3% 80,6% 4,5% 86,4%217 13,4% 74,2% 8,8% 78,8% 25,8% 61,8% 5,5% 82,0%
1432 6,1% 87,1% 4,1% 89,1% 9,3% 83,9% 3,9% 89,2%
SofiaRegional centerSmaller townVillage
Type of residence
MaleFemale
Gender
18-3031-4041-5051-6060+
Age
Finished bachelor, master or higherdegreeFinished collegeFinished secondary schoolFinished elementary and lower
Highest level ofeducation achieved
EmployeeOther status of employed personsBusiness ownerSelf-employed person innon-agricultural activitiesSelf-employed person in agriculturalactivitiesFamily helperRegistered as unemployedUnregistered unemployedRetired - due to ageRetired - other causesPupil, studentHousewifePerson unable to workAnother status of non working person
Main occupationalstatus in the present
BulgarianTurkishRomaOther
Ethnicity
No incomeLess than 100 BGN101-150 BGN151-200 BGN201-300 BGN301-500 BGNMore than 500 BGNDon't knowNA
Total householdincome
No incomeLess than 250 BGN251-500 BGN501-750 BGN751-1000 More than 1000 BGNDon't knowNA
Personal monthlyincome
I don't use financial servicesOneTwoThree and more
Financial servicesusage
Total
Base: Row %Yes
Row %No
We will take a bank loan
Row %Yes
Row %No
We will borrow fromnon-bank credit institution
(Jet Credit T B I etc )
Row %Yes
Row %No
We will use a credit card
Row %Yes
Row %No
We will pawn jewellery orother goods
167
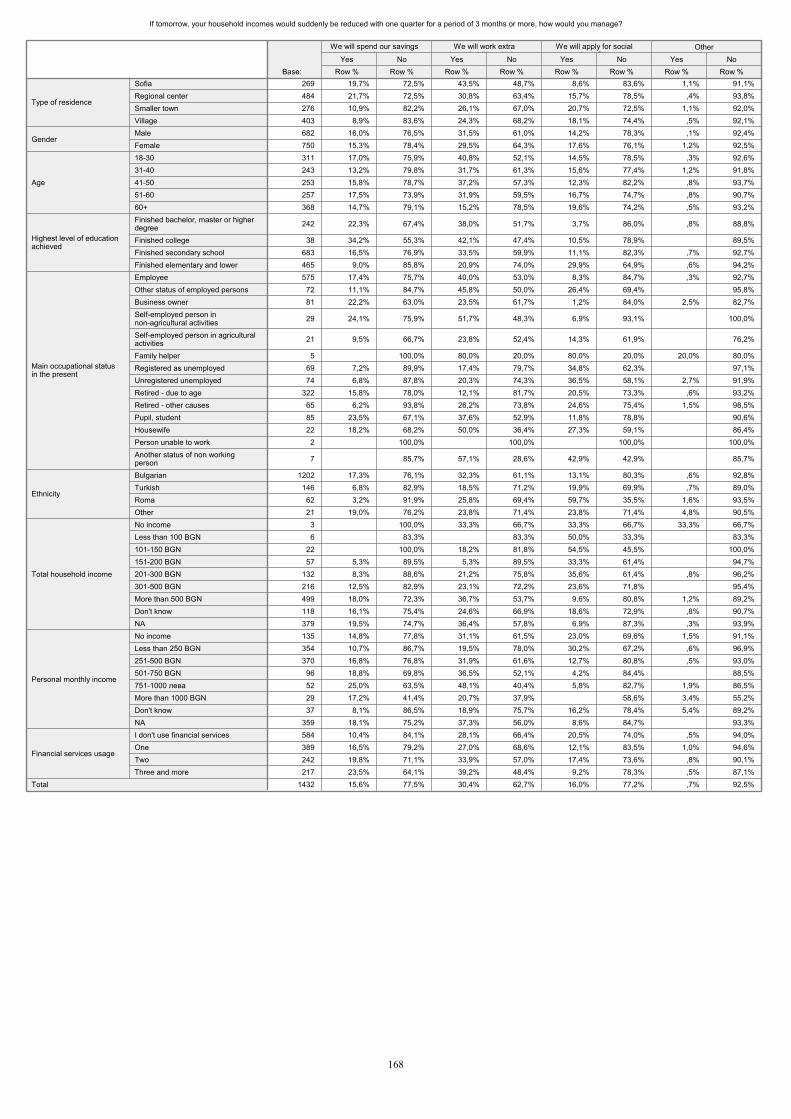
If tomorrow, your household incomes would suddenly be reduced with one quarter for a period of 3 months or more, how would you manage?
269 19,7% 72,5% 43,5% 48,7% 8,6% 83,6% 1,1% 91,1%484 21,7% 72,5% 30,8% 63,4% 15,7% 78,5% ,4% 93,8%276 10,9% 82,2% 26,1% 67,0% 20,7% 72,5% 1,1% 92,0%403 8,9% 83,6% 24,3% 68,2% 18,1% 74,4% ,5% 92,1%682 16,0% 76,5% 31,5% 61,0% 14,2% 78,3% ,1% 92,4%750 15,3% 78,4% 29,5% 64,3% 17,6% 76,1% 1,2% 92,5%311 17,0% 75,9% 40,8% 52,1% 14,5% 78,5% ,3% 92,6%243 13,2% 79,8% 31,7% 61,3% 15,6% 77,4% 1,2% 91,8%253 15,8% 78,7% 37,2% 57,3% 12,3% 82,2% ,8% 93,7%257 17,5% 73,9% 31,9% 59,5% 16,7% 74,7% ,8% 90,7%368 14,7% 79,1% 15,2% 78,5% 19,6% 74,2% ,5% 93,2%
242 22,3% 67,4% 38,0% 51,7% 3,7% 86,0% ,8% 88,8%
38 34,2% 55,3% 42,1% 47,4% 10,5% 78,9% 89,5%683 16,5% 76,9% 33,5% 59,9% 11,1% 82,3% ,7% 92,7%465 9,0% 85,8% 20,9% 74,0% 29,9% 64,9% ,6% 94,2%575 17,4% 75,7% 40,0% 53,0% 8,3% 84,7% ,3% 92,7%
72 11,1% 84,7% 45,8% 50,0% 26,4% 69,4% 95,8%81 22,2% 63,0% 23,5% 61,7% 1,2% 84,0% 2,5% 82,7%
29 24,1% 75,9% 51,7% 48,3% 6,9% 93,1% 100,0%
21 9,5% 66,7% 23,8% 52,4% 14,3% 61,9% 76,2%
5 100,0% 80,0% 20,0% 80,0% 20,0% 20,0% 80,0%69 7,2% 89,9% 17,4% 79,7% 34,8% 62,3% 97,1%74 6,8% 87,8% 20,3% 74,3% 36,5% 58,1% 2,7% 91,9%
322 15,8% 78,0% 12,1% 81,7% 20,5% 73,3% ,6% 93,2%65 6,2% 93,8% 26,2% 73,8% 24,6% 75,4% 1,5% 98,5%85 23,5% 67,1% 37,6% 52,9% 11,8% 78,8% 90,6%22 18,2% 68,2% 50,0% 36,4% 27,3% 59,1% 86,4%
2 100,0% 100,0% 100,0% 100,0%
7 85,7% 57,1% 28,6% 42,9% 42,9% 85,7%
1202 17,3% 76,1% 32,3% 61,1% 13,1% 80,3% ,6% 92,8%146 6,8% 82,9% 18,5% 71,2% 19,9% 69,9% ,7% 89,0%
62 3,2% 91,9% 25,8% 69,4% 59,7% 35,5% 1,6% 93,5%21 19,0% 76,2% 23,8% 71,4% 23,8% 71,4% 4,8% 90,5%
3 100,0% 33,3% 66,7% 33,3% 66,7% 33,3% 66,7%6 83,3% 83,3% 50,0% 33,3% 83,3%
22 100,0% 18,2% 81,8% 54,5% 45,5% 100,0%57 5,3% 89,5% 5,3% 89,5% 33,3% 61,4% 94,7%
132 8,3% 88,6% 21,2% 75,8% 35,6% 61,4% ,8% 96,2%216 12,5% 82,9% 23,1% 72,2% 23,6% 71,8% 95,4%499 18,0% 72,3% 36,7% 53,7% 9,6% 80,8% 1,2% 89,2%118 16,1% 75,4% 24,6% 66,9% 18,6% 72,9% ,8% 90,7%379 19,5% 74,7% 36,4% 57,8% 6,9% 87,3% ,3% 93,9%135 14,8% 77,8% 31,1% 61,5% 23,0% 69,6% 1,5% 91,1%354 10,7% 86,7% 19,5% 78,0% 30,2% 67,2% ,6% 96,9%370 16,8% 76,8% 31,9% 61,6% 12,7% 80,8% ,5% 93,0%
96 18,8% 69,8% 36,5% 52,1% 4,2% 84,4% 88,5%52 25,0% 63,5% 48,1% 40,4% 5,8% 82,7% 1,9% 86,5%29 17,2% 41,4% 20,7% 37,9% 58,6% 3,4% 55,2%37 8,1% 86,5% 18,9% 75,7% 16,2% 78,4% 5,4% 89,2%
359 18,1% 75,2% 37,3% 56,0% 8,6% 84,7% 93,3%584 10,4% 84,1% 28,1% 66,4% 20,5% 74,0% ,5% 94,0%389 16,5% 79,2% 27,0% 68,6% 12,1% 83,5% 1,0% 94,6%242 19,8% 71,1% 33,9% 57,0% 17,4% 73,6% ,8% 90,1%217 23,5% 64,1% 39,2% 48,4% 9,2% 78,3% ,5% 87,1%
1432 15,6% 77,5% 30,4% 62,7% 16,0% 77,2% ,7% 92,5%
SofiaRegional centerSmaller townVillage
Type of residence
MaleFemale
Gender
18-3031-4041-5051-6060+
Age
Finished bachelor, master or higherdegreeFinished collegeFinished secondary schoolFinished elementary and lower
Highest level of educationachieved
EmployeeOther status of employed personsBusiness ownerSelf-employed person innon-agricultural activitiesSelf-employed person in agriculturalactivitiesFamily helperRegistered as unemployedUnregistered unemployedRetired - due to ageRetired - other causesPupil, studentHousewifePerson unable to workAnother status of non workingperson
Main occupational statusin the present
BulgarianTurkishRomaOther
Ethnicity
No incomeLess than 100 BGN101-150 BGN151-200 BGN201-300 BGN301-500 BGNMore than 500 BGNDon't knowNA
Total household income
No incomeLess than 250 BGN251-500 BGN501-750 BGN751-1000 More than 1000 BGNDon't knowNA
Personal monthly income
I don't use financial servicesOneTwoThree and more
Financial services usage
Total
Base: Row %Yes
Row %No
We will spend our savingsin lev
Row %Yes
Row %No
We will work extrahours/additional jobs
Row %Yes
Row %No
We will apply for socialbenefits
Row %Yes
Row %No
Other
168
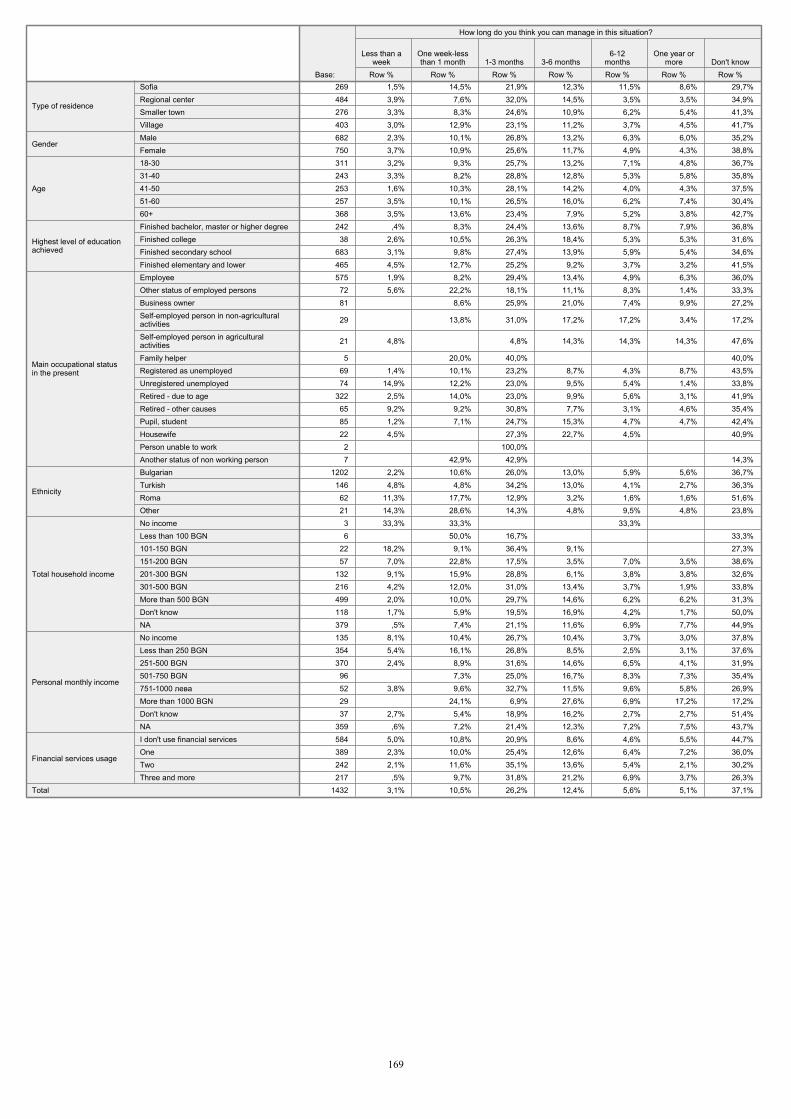
269 1,5% 14,5% 21,9% 12,3% 11,5% 8,6% 29,7%484 3,9% 7,6% 32,0% 14,5% 3,5% 3,5% 34,9%276 3,3% 8,3% 24,6% 10,9% 6,2% 5,4% 41,3%403 3,0% 12,9% 23,1% 11,2% 3,7% 4,5% 41,7%682 2,3% 10,1% 26,8% 13,2% 6,3% 6,0% 35,2%750 3,7% 10,9% 25,6% 11,7% 4,9% 4,3% 38,8%311 3,2% 9,3% 25,7% 13,2% 7,1% 4,8% 36,7%243 3,3% 8,2% 28,8% 12,8% 5,3% 5,8% 35,8%253 1,6% 10,3% 28,1% 14,2% 4,0% 4,3% 37,5%257 3,5% 10,1% 26,5% 16,0% 6,2% 7,4% 30,4%368 3,5% 13,6% 23,4% 7,9% 5,2% 3,8% 42,7%242 ,4% 8,3% 24,4% 13,6% 8,7% 7,9% 36,8%38 2,6% 10,5% 26,3% 18,4% 5,3% 5,3% 31,6%
683 3,1% 9,8% 27,4% 13,9% 5,9% 5,4% 34,6%465 4,5% 12,7% 25,2% 9,2% 3,7% 3,2% 41,5%575 1,9% 8,2% 29,4% 13,4% 4,9% 6,3% 36,0%72 5,6% 22,2% 18,1% 11,1% 8,3% 1,4% 33,3%81 8,6% 25,9% 21,0% 7,4% 9,9% 27,2%
29 13,8% 31,0% 17,2% 17,2% 3,4% 17,2%
21 4,8% 4,8% 14,3% 14,3% 14,3% 47,6%
5 20,0% 40,0% 40,0%69 1,4% 10,1% 23,2% 8,7% 4,3% 8,7% 43,5%74 14,9% 12,2% 23,0% 9,5% 5,4% 1,4% 33,8%
322 2,5% 14,0% 23,0% 9,9% 5,6% 3,1% 41,9%65 9,2% 9,2% 30,8% 7,7% 3,1% 4,6% 35,4%85 1,2% 7,1% 24,7% 15,3% 4,7% 4,7% 42,4%22 4,5% 27,3% 22,7% 4,5% 40,9%2 100,0% 7 42,9% 42,9% 14,3%
1202 2,2% 10,6% 26,0% 13,0% 5,9% 5,6% 36,7%146 4,8% 4,8% 34,2% 13,0% 4,1% 2,7% 36,3%62 11,3% 17,7% 12,9% 3,2% 1,6% 1,6% 51,6%21 14,3% 28,6% 14,3% 4,8% 9,5% 4,8% 23,8%3 33,3% 33,3% 33,3% 6 50,0% 16,7% 33,3%
22 18,2% 9,1% 36,4% 9,1% 27,3%57 7,0% 22,8% 17,5% 3,5% 7,0% 3,5% 38,6%
132 9,1% 15,9% 28,8% 6,1% 3,8% 3,8% 32,6%216 4,2% 12,0% 31,0% 13,4% 3,7% 1,9% 33,8%499 2,0% 10,0% 29,7% 14,6% 6,2% 6,2% 31,3%118 1,7% 5,9% 19,5% 16,9% 4,2% 1,7% 50,0%379 ,5% 7,4% 21,1% 11,6% 6,9% 7,7% 44,9%135 8,1% 10,4% 26,7% 10,4% 3,7% 3,0% 37,8%354 5,4% 16,1% 26,8% 8,5% 2,5% 3,1% 37,6%370 2,4% 8,9% 31,6% 14,6% 6,5% 4,1% 31,9%96 7,3% 25,0% 16,7% 8,3% 7,3% 35,4%52 3,8% 9,6% 32,7% 11,5% 9,6% 5,8% 26,9%29 24,1% 6,9% 27,6% 6,9% 17,2% 17,2%37 2,7% 5,4% 18,9% 16,2% 2,7% 2,7% 51,4%
359 ,6% 7,2% 21,4% 12,3% 7,2% 7,5% 43,7%584 5,0% 10,8% 20,9% 8,6% 4,6% 5,5% 44,7%389 2,3% 10,0% 25,4% 12,6% 6,4% 7,2% 36,0%242 2,1% 11,6% 35,1% 13,6% 5,4% 2,1% 30,2%217 ,5% 9,7% 31,8% 21,2% 6,9% 3,7% 26,3%
1432 3,1% 10,5% 26,2% 12,4% 5,6% 5,1% 37,1%
SofiaRegional centerSmaller townVillage
Type of residence
MaleFemale
Gender
18-3031-4041-5051-6060+
Age
Finished bachelor, master or higher degreeFinished collegeFinished secondary schoolFinished elementary and lower
Highest level of educationachieved
EmployeeOther status of employed personsBusiness ownerSelf-employed person in non-agriculturalactivitiesSelf-employed person in agriculturalactivitiesFamily helperRegistered as unemployedUnregistered unemployedRetired - due to ageRetired - other causesPupil, studentHousewifePerson unable to workAnother status of non working person
Main occupational statusin the present
BulgarianTurkishRomaOther
Ethnicity
No incomeLess than 100 BGN101-150 BGN151-200 BGN201-300 BGN301-500 BGNMore than 500 BGNDon't knowNA
Total household income
No incomeLess than 250 BGN251-500 BGN501-750 BGN751-1000 More than 1000 BGNDon't knowNA
Personal monthly income
I don't use financial servicesOneTwoThree and more
Financial services usage
Total
Base: Row %
Less than aweek
Row %
One week-lessthan 1 month
Row %1-3 months
Row %3-6 months
Row %
6-12months
Row %
One year ormore
Row %Don't know
How long do you think you can manage in this situation?
169
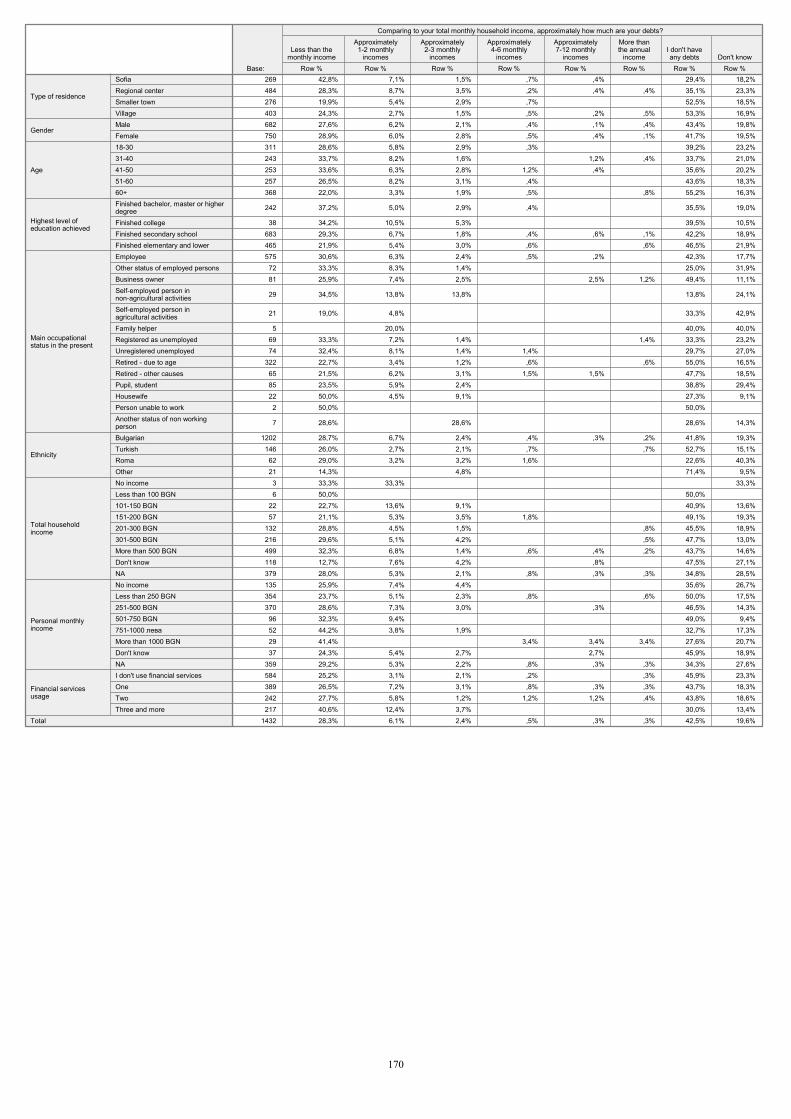
269 42,8% 7,1% 1,5% ,7% ,4% 29,4% 18,2%484 28,3% 8,7% 3,5% ,2% ,4% ,4% 35,1% 23,3%276 19,9% 5,4% 2,9% ,7% 52,5% 18,5%403 24,3% 2,7% 1,5% ,5% ,2% ,5% 53,3% 16,9%682 27,6% 6,2% 2,1% ,4% ,1% ,4% 43,4% 19,8%750 28,9% 6,0% 2,8% ,5% ,4% ,1% 41,7% 19,5%311 28,6% 5,8% 2,9% ,3% 39,2% 23,2%243 33,7% 8,2% 1,6% 1,2% ,4% 33,7% 21,0%253 33,6% 6,3% 2,8% 1,2% ,4% 35,6% 20,2%257 26,5% 8,2% 3,1% ,4% 43,6% 18,3%368 22,0% 3,3% 1,9% ,5% ,8% 55,2% 16,3%
242 37,2% 5,0% 2,9% ,4% 35,5% 19,0%
38 34,2% 10,5% 5,3% 39,5% 10,5%683 29,3% 6,7% 1,8% ,4% ,6% ,1% 42,2% 18,9%465 21,9% 5,4% 3,0% ,6% ,6% 46,5% 21,9%575 30,6% 6,3% 2,4% ,5% ,2% 42,3% 17,7%72 33,3% 8,3% 1,4% 25,0% 31,9%81 25,9% 7,4% 2,5% 2,5% 1,2% 49,4% 11,1%
29 34,5% 13,8% 13,8% 13,8% 24,1%
21 19,0% 4,8% 33,3% 42,9%
5 20,0% 40,0% 40,0%69 33,3% 7,2% 1,4% 1,4% 33,3% 23,2%74 32,4% 8,1% 1,4% 1,4% 29,7% 27,0%
322 22,7% 3,4% 1,2% ,6% ,6% 55,0% 16,5%65 21,5% 6,2% 3,1% 1,5% 1,5% 47,7% 18,5%85 23,5% 5,9% 2,4% 38,8% 29,4%22 50,0% 4,5% 9,1% 27,3% 9,1%2 50,0% 50,0%
7 28,6% 28,6% 28,6% 14,3%
1202 28,7% 6,7% 2,4% ,4% ,3% ,2% 41,8% 19,3%146 26,0% 2,7% 2,1% ,7% ,7% 52,7% 15,1%62 29,0% 3,2% 3,2% 1,6% 22,6% 40,3%21 14,3% 4,8% 71,4% 9,5%3 33,3% 33,3% 33,3%6 50,0% 50,0%
22 22,7% 13,6% 9,1% 40,9% 13,6%57 21,1% 5,3% 3,5% 1,8% 49,1% 19,3%
132 28,8% 4,5% 1,5% ,8% 45,5% 18,9%216 29,6% 5,1% 4,2% ,5% 47,7% 13,0%499 32,3% 6,8% 1,4% ,6% ,4% ,2% 43,7% 14,6%118 12,7% 7,6% 4,2% ,8% 47,5% 27,1%379 28,0% 5,3% 2,1% ,8% ,3% ,3% 34,8% 28,5%135 25,9% 7,4% 4,4% 35,6% 26,7%354 23,7% 5,1% 2,3% ,8% ,6% 50,0% 17,5%370 28,6% 7,3% 3,0% ,3% 46,5% 14,3%96 32,3% 9,4% 49,0% 9,4%52 44,2% 3,8% 1,9% 32,7% 17,3%29 41,4% 3,4% 3,4% 3,4% 27,6% 20,7%37 24,3% 5,4% 2,7% 2,7% 45,9% 18,9%
359 29,2% 5,3% 2,2% ,8% ,3% ,3% 34,3% 27,6%584 25,2% 3,1% 2,1% ,2% ,3% 45,9% 23,3%389 26,5% 7,2% 3,1% ,8% ,3% ,3% 43,7% 18,3%242 27,7% 5,8% 1,2% 1,2% 1,2% ,4% 43,8% 18,6%217 40,6% 12,4% 3,7% 30,0% 13,4%
1432 28,3% 6,1% 2,4% ,5% ,3% ,3% 42,5% 19,6%
SofiaRegional centerSmaller townVillage
Type of residence
MaleFemale
Gender
18-3031-4041-5051-6060+
Age
Finished bachelor, master or higherdegreeFinished collegeFinished secondary schoolFinished elementary and lower
Highest level ofeducation achieved
EmployeeOther status of employed personsBusiness ownerSelf-employed person innon-agricultural activitiesSelf-employed person inagricultural activitiesFamily helperRegistered as unemployedUnregistered unemployedRetired - due to ageRetired - other causesPupil, studentHousewifePerson unable to workAnother status of non workingperson
Main occupationalstatus in the present
BulgarianTurkishRomaOther
Ethnicity
No incomeLess than 100 BGN101-150 BGN151-200 BGN201-300 BGN301-500 BGNMore than 500 BGNDon't knowNA
Total householdincome
No incomeLess than 250 BGN251-500 BGN501-750 BGN751-1000 More than 1000 BGNDon't knowNA
Personal monthlyincome
I don't use financial servicesOneTwoThree and more
Financial servicesusage
Total
Base: Row %
Less than themonthly income
Row %
Approximately1-2 monthly
incomesRow %
Approximately2-3 monthly
incomesRow %
Approximately4-6 monthly
incomesRow %
Approximately7-12 monthly
incomesRow %
More thanthe annual
incomeRow %
I don't haveany debts
Row %Don't know
Comparing to your total monthly household income, approximately how much are your debts?
170
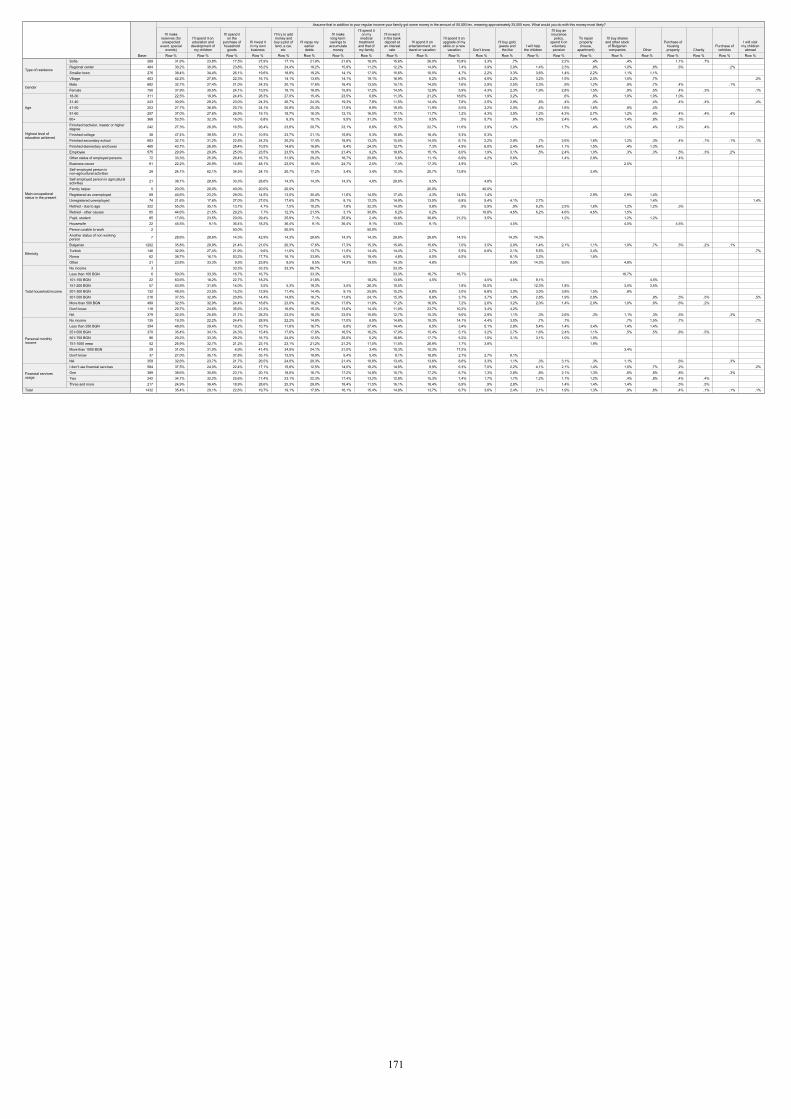
269 31,6% 23,8% 17,5% 27,9% 17,1% 21,9% 21,6% 16,0% 15,6% 26,0% 10,8% 3,3% ,7% 2,2% ,4% ,4% 1,1% ,7% 484 30,2% 30,0% 23,8% 18,2% 24,4% 18,2% 15,9% 11,2% 12,2% 14,9% 7,4% 3,9% 2,9% 1,4% 2,3% ,8% 1,0% ,6% ,6% ,2% 276 38,4% 34,4% 26,1% 19,6% 18,8% 19,2% 14,1% 17,0% 15,6% 10,5% 4,7% 2,2% 3,3% 3,6% 1,4% 2,2% 1,1% 1,1% 403 42,2% 27,8% 22,3% 16,1% 14,1% 13,6% 14,1% 19,1% 16,9% 6,2% 4,5% 4,5% 2,2% 3,2% 1,5% 2,0% 1,0% ,7% ,2%682 32,7% 27,4% 21,0% 24,3% 20,1% 17,6% 16,4% 13,5% 15,1% 14,5% 7,6% 2,9% 2,5% 2,3% ,9% 1,2% ,9% ,7% ,4% ,1% 750 37,9% 30,5% 24,1% 15,5% 18,1% 18,0% 15,9% 17,2% 14,5% 12,9% 5,9% 4,3% 2,3% 1,9% 2,8% 1,5% ,9% ,5% ,4% ,3% ,1%311 22,5% 19,9% 24,4% 28,3% 27,0% 15,4% 23,5% 6,8% 11,3% 21,2% 18,6% 1,9% 3,2% ,6% ,6% 1,0% 1,0% 1,0% 243 30,9% 29,2% 23,0% 24,3% 26,7% 24,3% 19,3% 7,8% 11,5% 14,4% 7,8% 2,5% 2,9% ,8% ,4% ,4% ,4% ,4% ,4% ,4%253 27,7% 36,8% 25,7% 24,1% 20,9% 25,3% 17,8% 9,9% 19,0% 11,9% 5,5% 3,2% 2,0% ,4% 1,6% 1,6% ,8% ,4% 257 37,0% 27,6% 26,5% 19,1% 18,7% 18,3% 12,1% 16,0% 17,1% 11,7% 1,2% 4,3% 3,5% 1,2% 4,3% 2,7% 1,2% ,4% ,4% ,4% ,4% 368 53,5% 32,3% 16,0% 6,8% 6,3% 10,1% 9,5% 31,3% 15,5% 9,5% ,5% 5,7% ,8% 6,5% 2,4% 1,4% 1,4% ,8% ,3%
242 27,3% 26,0% 16,5% 26,4% 23,6% 20,7% 23,1% 6,6% 15,7% 22,7% 11,6% 2,9% 1,2% 1,7% ,4% 1,2% ,4% 1,2% ,4%
38 47,4% 39,5% 21,1% 10,5% 23,7% 21,1% 15,8% 5,3% 15,8% 18,4% 5,3% 5,3% 683 32,1% 31,2% 22,8% 24,2% 20,2% 17,4% 18,9% 13,2% 15,5% 14,5% 6,1% 2,2% 2,9% ,7% 2,6% 1,6% 1,2% ,3% ,4% ,1% ,1% ,1%465 43,7% 26,9% 25,4% 10,5% 14,6% 16,8% 8,4% 24,3% 12,7% 7,3% 4,9% 6,0% 2,4% 5,4% 1,1% 1,5% ,4% 1,3% 575 29,9% 29,9% 25,0% 23,5% 23,5% 19,0% 21,4% 9,2% 18,6% 15,1% 8,0% 1,9% 3,1% ,5% 2,4% 1,0% ,3% ,3% ,5% ,3% ,2% 72 33,3% 25,0% 26,4% 16,7% 31,9% 29,2% 16,7% 20,8% 5,6% 11,1% 6,9% 4,2% 5,6% 1,4% 2,8% 1,4% 81 22,2% 25,9% 14,8% 48,1% 23,5% 18,5% 24,7% 2,5% 7,4% 17,3% 4,9% 1,2% 2,5%
29 24,1% 62,1% 34,5% 24,1% 20,7% 17,2% 3,4% 3,4% 10,3% 20,7% 13,8% 3,4%
21 38,1% 28,6% 33,3% 28,6% 14,3% 14,3% 14,3% 4,8% 28,6% 9,5% 4,8%
5 20,0% 20,0% 40,0% 20,0% 20,0% 20,0% 40,0% 69 40,6% 23,2% 29,0% 14,5% 13,0% 30,4% 11,6% 14,5% 17,4% 4,3% 14,5% 1,4% 2,9% 2,9% 1,4% 74 21,6% 17,6% 27,0% 27,0% 17,6% 29,7% 8,1% 12,2% 14,9% 13,5% 6,8% 5,4% 4,1% 2,7% 1,4% 1,4%
322 55,0% 35,1% 13,7% 4,7% 7,5% 10,2% 7,8% 32,3% 14,0% 9,6% ,9% 5,9% ,9% 6,2% 2,5% 1,6% 1,2% 1,2% ,3% 65 44,6% 21,5% 29,2% 7,7% 12,3% 21,5% 3,1% 30,8% 6,2% 6,2% 10,8% 4,6% 6,2% 4,6% 4,6% 1,5% 85 17,6% 23,5% 20,0% 29,4% 25,9% 7,1% 25,9% 2,4% 10,6% 30,6% 21,2% 3,5% 1,2% 1,2% 1,2% 22 45,5% 9,1% 36,4% 18,2% 36,4% 9,1% 36,4% 9,1% 13,6% 9,1% 4,5% 4,5% 4,5% 2 50,0% 50,0% 50,0%
7 28,6% 28,6% 14,3% 42,9% 14,3% 28,6% 14,3% 14,3% 28,6% 28,6% 14,3% 14,3% 14,3%
1202 35,8% 29,9% 21,4% 21,0% 20,3% 17,6% 17,3% 15,3% 15,4% 15,6% 7,0% 3,5% 2,0% 1,4% 2,1% 1,1% 1,0% ,7% ,5% ,2% ,1% 146 32,9% 27,4% 21,9% 9,6% 11,6% 13,7% 11,0% 14,4% 14,4% 2,7% 5,5% 6,8% 2,1% 5,5% 3,4% ,7%62 38,7% 16,1% 53,2% 17,7% 16,1% 33,9% 6,5% 19,4% 4,8% 6,5% 6,5% 8,1% 3,2% 1,6% 21 23,8% 33,3% 9,5% 23,8% 9,5% 9,5% 14,3% 19,0% 14,3% 4,8% 9,5% 14,3% 9,5% 4,8% 3 33,3% 33,3% 33,3% 66,7% 33,3% 6 50,0% 33,3% 16,7% 16,7% 33,3% 33,3% 16,7% 16,7% 16,7%
22 63,6% 18,2% 22,7% 18,2% 31,8% 18,2% 13,6% 4,5% 4,5% 4,5% 9,1% 4,5% 57 43,9% 31,6% 14,0% 3,5% 5,3% 19,3% 3,5% 26,3% 10,5% 1,8% 10,5% 12,3% 1,8% 3,5% 3,5%
132 48,5% 23,5% 15,2% 12,9% 11,4% 14,4% 9,1% 25,8% 15,2% 6,8% 3,0% 6,8% 3,0% 3,0% 3,8% 1,5% ,8% 216 37,5% 32,9% 20,8% 14,4% 14,8% 16,7% 11,6% 24,1% 15,3% 8,8% 3,7% 3,7% 1,9% 2,8% 1,9% 2,8% ,9% ,5% ,5% ,5%499 32,5% 32,9% 24,4% 18,8% 23,0% 18,2% 17,8% 11,8% 17,2% 16,0% 7,2% 2,6% 3,2% 2,0% 1,4% 2,0% 1,0% ,6% ,6% ,2% 118 29,7% 24,6% 35,6% 21,2% 16,9% 15,3% 13,6% 14,4% 11,0% 23,7% 10,2% 3,4% 4,2% 379 32,5% 25,6% 21,1% 28,2% 23,0% 18,2% 23,0% 10,6% 12,7% 15,3% 9,0% 2,9% 1,1% ,3% 2,6% ,3% 1,1% ,3% ,5% ,3% 135 19,3% 22,2% 24,4% 28,9% 22,2% 14,8% 17,0% 8,9% 14,8% 19,3% 14,1% 4,4% 3,0% ,7% ,7% ,7% 1,5% ,7% ,7%354 48,6% 29,4% 19,2% 10,7% 11,6% 16,7% 6,8% 27,4% 14,4% 6,5% 3,4% 5,1% 2,8% 5,4% 1,4% 3,4% 1,4% 1,4% 370 35,4% 34,1% 24,3% 15,4% 17,8% 17,8% 16,5% 16,2% 17,0% 15,4% 5,1% 3,2% 2,7% 1,6% 2,4% 1,1% ,5% ,5% ,8% ,5% 96 29,2% 33,3% 29,2% 16,7% 24,0% 12,5% 25,0% 5,2% 18,8% 17,7% 5,2% 1,0% 3,1% 3,1% 1,0% 1,0% 52 26,9% 32,7% 21,2% 23,1% 23,1% 21,2% 21,2% 11,5% 11,5% 26,9% 7,7% 3,8% 1,9% 29 31,0% 31,0% 6,9% 41,4% 34,5% 24,1% 31,0% 3,4% 10,3% 10,3% 17,2% 3,4% 37 27,0% 35,1% 37,8% 35,1% 13,5% 18,9% 5,4% 5,4% 8,1% 18,9% 2,7% 2,7% 8,1%
359 32,6% 23,7% 21,7% 26,5% 24,0% 20,3% 21,4% 10,6% 13,4% 13,6% 8,6% 3,3% 1,1% ,3% 3,1% ,3% 1,1% ,6% ,3% 584 37,5% 24,0% 22,4% 17,1% 15,8% 12,5% 14,0% 18,2% 14,6% 8,9% 6,3% 7,0% 2,2% 4,1% 2,1% 1,4% 1,0% ,7% ,2% ,2%389 38,6% 30,6% 23,1% 20,1% 18,0% 16,7% 17,2% 14,9% 15,7% 17,2% 6,7% 1,3% 2,8% ,8% 2,1% 1,3% ,8% ,8% ,8% ,3% 242 34,7% 32,2% 25,6% 17,4% 23,1% 22,3% 17,4% 13,2% 12,8% 15,3% 7,4% 1,7% 1,7% 1,2% 1,7% 1,2% ,4% ,8% ,4% ,4% 217 24,9% 36,4% 18,9% 28,6% 25,3% 29,0% 18,4% 11,5% 16,1% 18,4% 6,9% ,9% 2,8% 1,4% 1,4% 1,4% ,5% ,5%
1432 35,4% 29,1% 22,6% 19,7% 19,1% 17,8% 16,1% 15,4% 14,8% 13,7% 6,7% 3,6% 2,4% 2,1% 1,9% 1,3% ,9% ,6% ,4% ,1% ,1% ,1%
SofiaRegional centerSmaller townVillage
Type of residence
MaleFemale
Gender
18-3031-4041-5051-6060+
Age
Finished bachelor, master or higherdegreeFinished collegeFinished secondary schoolFinished elementary and lower
Highest level ofeducation achieved
EmployeeOther status of employed personsBusiness ownerSelf-employed person innon-agricultural activitiesSelf-employed person in agriculturalactivitiesFamily helperRegistered as unemployedUnregistered unemployedRetired - due to ageRetired - other causesPupil, studentHousewifePerson unable to workAnother status of non workingperson
Main occupationalstatus in the present
BulgarianTurkishRomaOther
Ethnicity
No incomeLess than 100 BGN101-150 BGN151-200 BGN201-300 BGN301-500 BGNMore than 500 BGNDon't knowNA
Total household income
No incomeLess than 250 BGN251-500 BGN501-750 BGN751-1000 More than 1000 BGNDon't knowNA
Personal monthlyincome
I don't use financial servicesOneTwoThree and more
Financial servicesusage
Total
Base: Row %
I'll makereserves (forunexpected
event, specialevents)
Row %
I'll spend it oneducation and
development ofmy children
Row %
I'll spend iton the
purchase ofhousehold
goodsRow %
I'll invest itin my ownbusiness
Row %
I'll try to addmoney andbuy a plot ofland, a car,
etc.Row %
I'll repay myearlierdebts
Row %
I'll makelong-termsavings to
accumulatemoney
Row %
I'll spend iton my
medicaltreatmentand that ofmy family
Row %
I'll invest itin the bankdeposit atan interest
rateRow %
I'll spend it onentertainment, ontravel or vacation
Row %
I'll spend it onupgrade of myskills or a new
vacationRow %
Don't knowRow %
I'll buy gold,jewels and
the likeRow %
I will helpthe children
Row %
I'll buy aninsurance
policy,spend it onvoluntarypension
Row %
To repairproperty(house,
apartment)Row %
I'll buy sharesand other stock
of Bulgariancompanies
Row %Other
Row %
Purchase ofhousingproperty
Row %Charity
Row %
Purchase ofvehicles
Row %
I will visitmy children
abroad
Assume that in addition to your regular income your family got some money in the amount of 50,000 lev, meaning approximately 25,000 euro. What would you do with this money most likely?
171
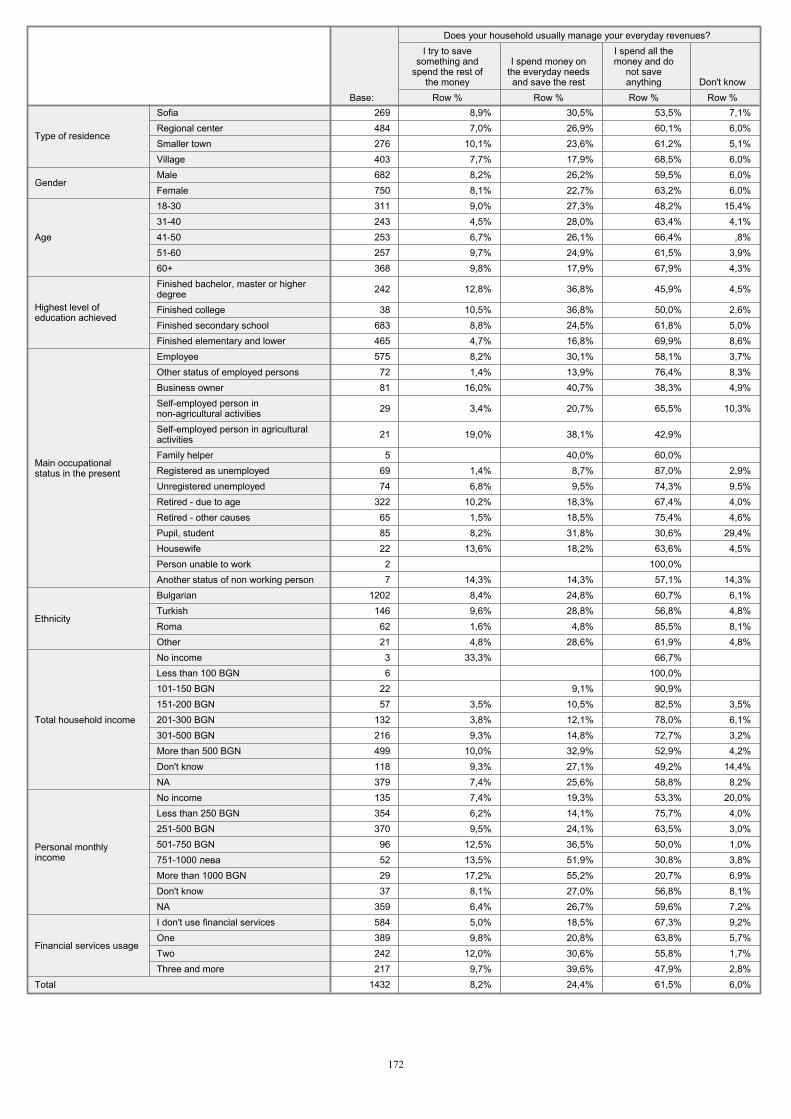
269 8,9% 30,5% 53,5% 7,1%484 7,0% 26,9% 60,1% 6,0%276 10,1% 23,6% 61,2% 5,1%403 7,7% 17,9% 68,5% 6,0%682 8,2% 26,2% 59,5% 6,0%750 8,1% 22,7% 63,2% 6,0%311 9,0% 27,3% 48,2% 15,4%243 4,5% 28,0% 63,4% 4,1%253 6,7% 26,1% 66,4% ,8%257 9,7% 24,9% 61,5% 3,9%368 9,8% 17,9% 67,9% 4,3%
242 12,8% 36,8% 45,9% 4,5%
38 10,5% 36,8% 50,0% 2,6%683 8,8% 24,5% 61,8% 5,0%465 4,7% 16,8% 69,9% 8,6%575 8,2% 30,1% 58,1% 3,7%72 1,4% 13,9% 76,4% 8,3%81 16,0% 40,7% 38,3% 4,9%
29 3,4% 20,7% 65,5% 10,3%
21 19,0% 38,1% 42,9%
5 40,0% 60,0% 69 1,4% 8,7% 87,0% 2,9%74 6,8% 9,5% 74,3% 9,5%
322 10,2% 18,3% 67,4% 4,0%65 1,5% 18,5% 75,4% 4,6%85 8,2% 31,8% 30,6% 29,4%22 13,6% 18,2% 63,6% 4,5%2 100,0% 7 14,3% 14,3% 57,1% 14,3%
1202 8,4% 24,8% 60,7% 6,1%146 9,6% 28,8% 56,8% 4,8%62 1,6% 4,8% 85,5% 8,1%21 4,8% 28,6% 61,9% 4,8%3 33,3% 66,7% 6 100,0%
22 9,1% 90,9% 57 3,5% 10,5% 82,5% 3,5%
132 3,8% 12,1% 78,0% 6,1%216 9,3% 14,8% 72,7% 3,2%499 10,0% 32,9% 52,9% 4,2%118 9,3% 27,1% 49,2% 14,4%379 7,4% 25,6% 58,8% 8,2%135 7,4% 19,3% 53,3% 20,0%354 6,2% 14,1% 75,7% 4,0%370 9,5% 24,1% 63,5% 3,0%96 12,5% 36,5% 50,0% 1,0%52 13,5% 51,9% 30,8% 3,8%29 17,2% 55,2% 20,7% 6,9%37 8,1% 27,0% 56,8% 8,1%
359 6,4% 26,7% 59,6% 7,2%584 5,0% 18,5% 67,3% 9,2%389 9,8% 20,8% 63,8% 5,7%242 12,0% 30,6% 55,8% 1,7%217 9,7% 39,6% 47,9% 2,8%
1432 8,2% 24,4% 61,5% 6,0%
SofiaRegional centerSmaller townVillage
Type of residence
MaleFemale
Gender
18-3031-4041-5051-6060+
Age
Finished bachelor, master or higherdegreeFinished collegeFinished secondary schoolFinished elementary and lower
Highest level ofeducation achieved
EmployeeOther status of employed personsBusiness ownerSelf-employed person innon-agricultural activitiesSelf-employed person in agriculturalactivitiesFamily helperRegistered as unemployedUnregistered unemployedRetired - due to ageRetired - other causesPupil, studentHousewifePerson unable to workAnother status of non working person
Main occupationalstatus in the present
BulgarianTurkishRomaOther
Ethnicity
No incomeLess than 100 BGN101-150 BGN151-200 BGN201-300 BGN301-500 BGNMore than 500 BGNDon't knowNA
Total household income
No incomeLess than 250 BGN251-500 BGN501-750 BGN751-1000 More than 1000 BGNDon't knowNA
Personal monthlyincome
I don't use financial servicesOneTwoThree and more
Financial services usage
Total
Base: Row %
I try to savesomething and
spend the rest ofthe money
Row %
I spend money onthe everyday needsand save the rest
Row %
I spend all themoney and do
not saveanything
Row %Don't know
Does your household usually manage your everyday revenues?
172
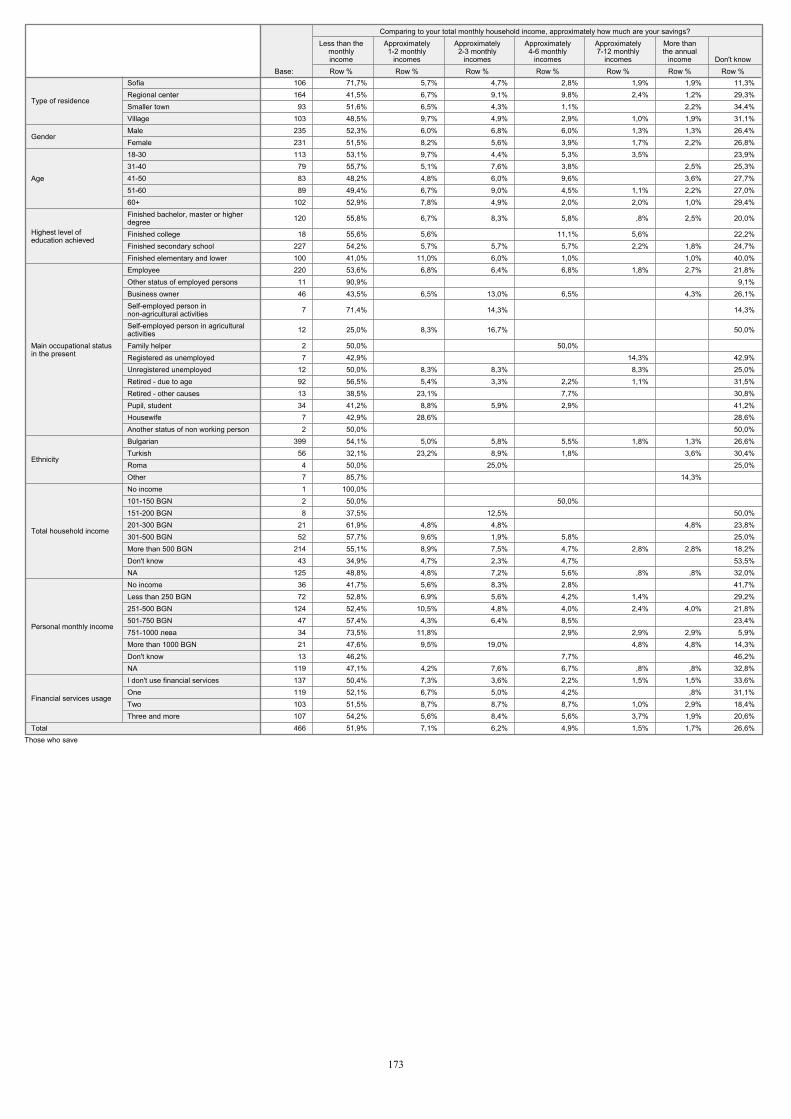
106 71,7% 5,7% 4,7% 2,8% 1,9% 1,9% 11,3%164 41,5% 6,7% 9,1% 9,8% 2,4% 1,2% 29,3%
93 51,6% 6,5% 4,3% 1,1% 2,2% 34,4%103 48,5% 9,7% 4,9% 2,9% 1,0% 1,9% 31,1%235 52,3% 6,0% 6,8% 6,0% 1,3% 1,3% 26,4%231 51,5% 8,2% 5,6% 3,9% 1,7% 2,2% 26,8%113 53,1% 9,7% 4,4% 5,3% 3,5% 23,9%
79 55,7% 5,1% 7,6% 3,8% 2,5% 25,3%83 48,2% 4,8% 6,0% 9,6% 3,6% 27,7%89 49,4% 6,7% 9,0% 4,5% 1,1% 2,2% 27,0%
102 52,9% 7,8% 4,9% 2,0% 2,0% 1,0% 29,4%
120 55,8% 6,7% 8,3% 5,8% ,8% 2,5% 20,0%
18 55,6% 5,6% 11,1% 5,6% 22,2%227 54,2% 5,7% 5,7% 5,7% 2,2% 1,8% 24,7%100 41,0% 11,0% 6,0% 1,0% 1,0% 40,0%220 53,6% 6,8% 6,4% 6,8% 1,8% 2,7% 21,8%
11 90,9% 9,1%46 43,5% 6,5% 13,0% 6,5% 4,3% 26,1%
7 71,4% 14,3% 14,3%
12 25,0% 8,3% 16,7% 50,0%
2 50,0% 50,0% 7 42,9% 14,3% 42,9%
12 50,0% 8,3% 8,3% 8,3% 25,0%92 56,5% 5,4% 3,3% 2,2% 1,1% 31,5%13 38,5% 23,1% 7,7% 30,8%34 41,2% 8,8% 5,9% 2,9% 41,2%
7 42,9% 28,6% 28,6%2 50,0% 50,0%
399 54,1% 5,0% 5,8% 5,5% 1,8% 1,3% 26,6%56 32,1% 23,2% 8,9% 1,8% 3,6% 30,4%
4 50,0% 25,0% 25,0%7 85,7% 14,3% 1 100,0% 2 50,0% 50,0% 8 37,5% 12,5% 50,0%
21 61,9% 4,8% 4,8% 4,8% 23,8%52 57,7% 9,6% 1,9% 5,8% 25,0%
214 55,1% 8,9% 7,5% 4,7% 2,8% 2,8% 18,2%43 34,9% 4,7% 2,3% 4,7% 53,5%
125 48,8% 4,8% 7,2% 5,6% ,8% ,8% 32,0%36 41,7% 5,6% 8,3% 2,8% 41,7%72 52,8% 6,9% 5,6% 4,2% 1,4% 29,2%
124 52,4% 10,5% 4,8% 4,0% 2,4% 4,0% 21,8%47 57,4% 4,3% 6,4% 8,5% 23,4%34 73,5% 11,8% 2,9% 2,9% 2,9% 5,9%21 47,6% 9,5% 19,0% 4,8% 4,8% 14,3%13 46,2% 7,7% 46,2%
119 47,1% 4,2% 7,6% 6,7% ,8% ,8% 32,8%137 50,4% 7,3% 3,6% 2,2% 1,5% 1,5% 33,6%119 52,1% 6,7% 5,0% 4,2% ,8% 31,1%103 51,5% 8,7% 8,7% 8,7% 1,0% 2,9% 18,4%107 54,2% 5,6% 8,4% 5,6% 3,7% 1,9% 20,6%466 51,9% 7,1% 6,2% 4,9% 1,5% 1,7% 26,6%
SofiaRegional centerSmaller townVillage
Type of residence
MaleFemale
Gender
18-3031-4041-5051-6060+
Age
Finished bachelor, master or higherdegreeFinished collegeFinished secondary schoolFinished elementary and lower
Highest level ofeducation achieved
EmployeeOther status of employed personsBusiness ownerSelf-employed person innon-agricultural activitiesSelf-employed person in agriculturalactivitiesFamily helperRegistered as unemployedUnregistered unemployedRetired - due to ageRetired - other causesPupil, studentHousewifeAnother status of non working person
Main occupational statusin the present
BulgarianTurkishRomaOther
Ethnicity
No income101-150 BGN151-200 BGN201-300 BGN301-500 BGNMore than 500 BGNDon't knowNA
Total household income
No incomeLess than 250 BGN251-500 BGN501-750 BGN751-1000 More than 1000 BGNDon't knowNA
Personal monthly income
I don't use financial servicesOneTwoThree and more
Financial services usage
Total
Base: Row %
Less than themonthlyincome
Row %
Approximately1-2 monthly
incomesRow %
Approximately2-3 monthly
incomesRow %
Approximately4-6 monthly
incomesRow %
Approximately7-12 monthly
incomesRow %
More thanthe annual
incomeRow %
Don't know
Comparing to your total monthly household income, approximately how much are your savings?
Those who save
173
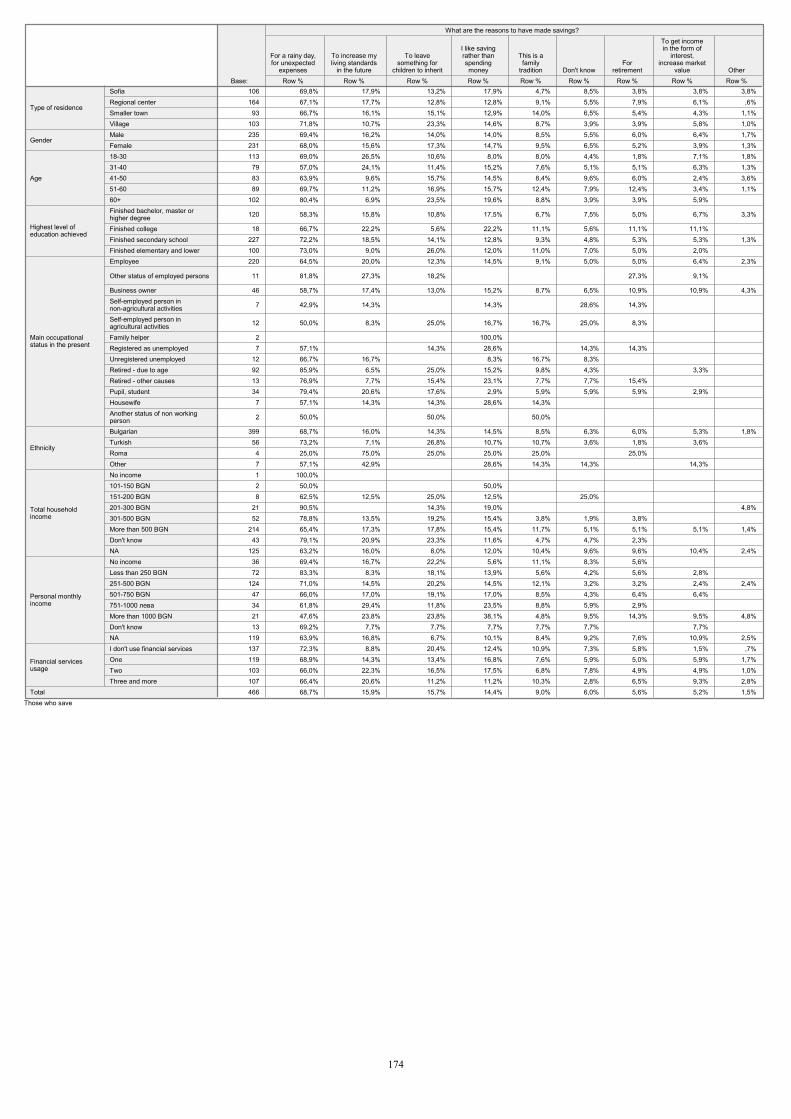
106 69,8% 17,9% 13,2% 17,9% 4,7% 8,5% 3,8% 3,8% 3,8%164 67,1% 17,7% 12,8% 12,8% 9,1% 5,5% 7,9% 6,1% ,6%93 66,7% 16,1% 15,1% 12,9% 14,0% 6,5% 5,4% 4,3% 1,1%
103 71,8% 10,7% 23,3% 14,6% 8,7% 3,9% 3,9% 5,8% 1,0%235 69,4% 16,2% 14,0% 14,0% 8,5% 5,5% 6,0% 6,4% 1,7%231 68,0% 15,6% 17,3% 14,7% 9,5% 6,5% 5,2% 3,9% 1,3%113 69,0% 26,5% 10,6% 8,0% 8,0% 4,4% 1,8% 7,1% 1,8%79 57,0% 24,1% 11,4% 15,2% 7,6% 5,1% 5,1% 6,3% 1,3%83 63,9% 9,6% 15,7% 14,5% 8,4% 9,6% 6,0% 2,4% 3,6%89 69,7% 11,2% 16,9% 15,7% 12,4% 7,9% 12,4% 3,4% 1,1%
102 80,4% 6,9% 23,5% 19,6% 8,8% 3,9% 3,9% 5,9%
120 58,3% 15,8% 10,8% 17,5% 6,7% 7,5% 5,0% 6,7% 3,3%
18 66,7% 22,2% 5,6% 22,2% 11,1% 5,6% 11,1% 11,1% 227 72,2% 18,5% 14,1% 12,8% 9,3% 4,8% 5,3% 5,3% 1,3%100 73,0% 9,0% 26,0% 12,0% 11,0% 7,0% 5,0% 2,0% 220 64,5% 20,0% 12,3% 14,5% 9,1% 5,0% 5,0% 6,4% 2,3%
11 81,8% 27,3% 18,2% 27,3% 9,1%
46 58,7% 17,4% 13,0% 15,2% 8,7% 6,5% 10,9% 10,9% 4,3%
7 42,9% 14,3% 14,3% 28,6% 14,3%
12 50,0% 8,3% 25,0% 16,7% 16,7% 25,0% 8,3%
2 100,0% 7 57,1% 14,3% 28,6% 14,3% 14,3%
12 66,7% 16,7% 8,3% 16,7% 8,3% 92 85,9% 6,5% 25,0% 15,2% 9,8% 4,3% 3,3% 13 76,9% 7,7% 15,4% 23,1% 7,7% 7,7% 15,4% 34 79,4% 20,6% 17,6% 2,9% 5,9% 5,9% 5,9% 2,9% 7 57,1% 14,3% 14,3% 28,6% 14,3%
2 50,0% 50,0% 50,0%
399 68,7% 16,0% 14,3% 14,5% 8,5% 6,3% 6,0% 5,3% 1,8%56 73,2% 7,1% 26,8% 10,7% 10,7% 3,6% 1,8% 3,6% 4 25,0% 75,0% 25,0% 25,0% 25,0% 25,0% 7 57,1% 42,9% 28,6% 14,3% 14,3% 14,3% 1 100,0% 2 50,0% 50,0% 8 62,5% 12,5% 25,0% 12,5% 25,0%
21 90,5% 14,3% 19,0% 4,8%52 78,8% 13,5% 19,2% 15,4% 3,8% 1,9% 3,8%
214 65,4% 17,3% 17,8% 15,4% 11,7% 5,1% 5,1% 5,1% 1,4%43 79,1% 20,9% 23,3% 11,6% 4,7% 4,7% 2,3%
125 63,2% 16,0% 8,0% 12,0% 10,4% 9,6% 9,6% 10,4% 2,4%36 69,4% 16,7% 22,2% 5,6% 11,1% 8,3% 5,6% 72 83,3% 8,3% 18,1% 13,9% 5,6% 4,2% 5,6% 2,8%
124 71,0% 14,5% 20,2% 14,5% 12,1% 3,2% 3,2% 2,4% 2,4%47 66,0% 17,0% 19,1% 17,0% 8,5% 4,3% 6,4% 6,4% 34 61,8% 29,4% 11,8% 23,5% 8,8% 5,9% 2,9% 21 47,6% 23,8% 23,8% 38,1% 4,8% 9,5% 14,3% 9,5% 4,8%13 69,2% 7,7% 7,7% 7,7% 7,7% 7,7% 7,7%
119 63,9% 16,8% 6,7% 10,1% 8,4% 9,2% 7,6% 10,9% 2,5%137 72,3% 8,8% 20,4% 12,4% 10,9% 7,3% 5,8% 1,5% ,7%119 68,9% 14,3% 13,4% 16,8% 7,6% 5,9% 5,0% 5,9% 1,7%103 66,0% 22,3% 16,5% 17,5% 6,8% 7,8% 4,9% 4,9% 1,0%107 66,4% 20,6% 11,2% 11,2% 10,3% 2,8% 6,5% 9,3% 2,8%466 68,7% 15,9% 15,7% 14,4% 9,0% 6,0% 5,6% 5,2% 1,5%
SofiaRegional centerSmaller townVillage
Type of residence
MaleFemale
Gender
18-3031-4041-5051-6060+
Age
Finished bachelor, master orhigher degreeFinished collegeFinished secondary schoolFinished elementary and lower
Highest level ofeducation achieved
Employee
Other status of employed persons
Business ownerSelf-employed person innon-agricultural activitiesSelf-employed person inagricultural activitiesFamily helperRegistered as unemployedUnregistered unemployedRetired - due to ageRetired - other causesPupil, studentHousewifeAnother status of non workingperson
Main occupationalstatus in the present
BulgarianTurkishRomaOther
Ethnicity
No income101-150 BGN151-200 BGN201-300 BGN301-500 BGNMore than 500 BGNDon't knowNA
Total householdincome
No incomeLess than 250 BGN251-500 BGN501-750 BGN751-1000 More than 1000 BGNDon't knowNA
Personal monthlyincome
I don't use financial servicesOneTwoThree and more
Financial servicesusage
Total
Base: Row %
For a rainy day,for unexpected
expensesRow %
To increase myliving standards
in the futureRow %
To leavesomething for
children to inheritRow %
I like savingrather thanspendingmoney
Row %
This is afamily
traditionRow %
Don't knowRow %
Forretirement
Row %
To get incomein the form of
interest,increase market
valueRow %Other
What are the reasons to have made savings?
Those who save
174
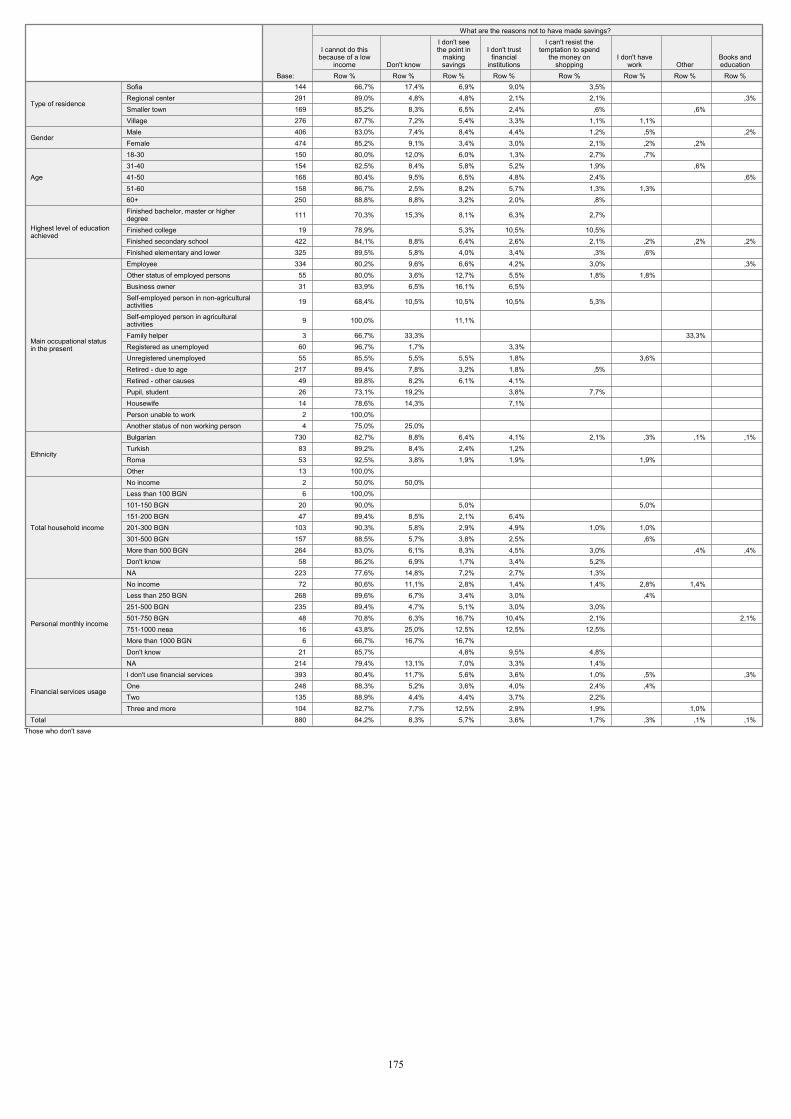
144 66,7% 17,4% 6,9% 9,0% 3,5% 291 89,0% 4,8% 4,8% 2,1% 2,1% ,3%169 85,2% 8,3% 6,5% 2,4% ,6% ,6% 276 87,7% 7,2% 5,4% 3,3% 1,1% 1,1% 406 83,0% 7,4% 8,4% 4,4% 1,2% ,5% ,2%474 85,2% 9,1% 3,4% 3,0% 2,1% ,2% ,2% 150 80,0% 12,0% 6,0% 1,3% 2,7% ,7% 154 82,5% 8,4% 5,8% 5,2% 1,9% ,6% 168 80,4% 9,5% 6,5% 4,8% 2,4% ,6%158 86,7% 2,5% 8,2% 5,7% 1,3% 1,3% 250 88,8% 8,8% 3,2% 2,0% ,8%
111 70,3% 15,3% 8,1% 6,3% 2,7%
19 78,9% 5,3% 10,5% 10,5% 422 84,1% 8,8% 6,4% 2,6% 2,1% ,2% ,2% ,2%325 89,5% 5,8% 4,0% 3,4% ,3% ,6% 334 80,2% 9,6% 6,6% 4,2% 3,0% ,3%55 80,0% 3,6% 12,7% 5,5% 1,8% 1,8% 31 83,9% 6,5% 16,1% 6,5%
19 68,4% 10,5% 10,5% 10,5% 5,3%
9 100,0% 11,1%
3 66,7% 33,3% 33,3% 60 96,7% 1,7% 3,3% 55 85,5% 5,5% 5,5% 1,8% 3,6%
217 89,4% 7,8% 3,2% 1,8% ,5% 49 89,8% 8,2% 6,1% 4,1% 26 73,1% 19,2% 3,8% 7,7% 14 78,6% 14,3% 7,1% 2 100,0% 4 75,0% 25,0%
730 82,7% 8,8% 6,4% 4,1% 2,1% ,3% ,1% ,1%83 89,2% 8,4% 2,4% 1,2% 53 92,5% 3,8% 1,9% 1,9% 1,9% 13 100,0% 2 50,0% 50,0% 6 100,0%
20 90,0% 5,0% 5,0% 47 89,4% 8,5% 2,1% 6,4%
103 90,3% 5,8% 2,9% 4,9% 1,0% 1,0% 157 88,5% 5,7% 3,8% 2,5% ,6% 264 83,0% 6,1% 8,3% 4,5% 3,0% ,4% ,4%58 86,2% 6,9% 1,7% 3,4% 5,2%
223 77,6% 14,8% 7,2% 2,7% 1,3% 72 80,6% 11,1% 2,8% 1,4% 1,4% 2,8% 1,4%
268 89,6% 6,7% 3,4% 3,0% ,4% 235 89,4% 4,7% 5,1% 3,0% 3,0% 48 70,8% 6,3% 16,7% 10,4% 2,1% 2,1%16 43,8% 25,0% 12,5% 12,5% 12,5% 6 66,7% 16,7% 16,7%
21 85,7% 4,8% 9,5% 4,8% 214 79,4% 13,1% 7,0% 3,3% 1,4% 393 80,4% 11,7% 5,6% 3,6% 1,0% ,5% ,3%248 88,3% 5,2% 3,6% 4,0% 2,4% ,4% 135 88,9% 4,4% 4,4% 3,7% 2,2% 104 82,7% 7,7% 12,5% 2,9% 1,9% 1,0% 880 84,2% 8,3% 5,7% 3,6% 1,7% ,3% ,1% ,1%
SofiaRegional centerSmaller townVillage
Type of residence
MaleFemale
Gender
18-3031-4041-5051-6060+
Age
Finished bachelor, master or higherdegreeFinished collegeFinished secondary schoolFinished elementary and lower
Highest level of educationachieved
EmployeeOther status of employed personsBusiness ownerSelf-employed person in non-agriculturalactivitiesSelf-employed person in agriculturalactivitiesFamily helperRegistered as unemployedUnregistered unemployedRetired - due to ageRetired - other causesPupil, studentHousewifePerson unable to workAnother status of non working person
Main occupational statusin the present
BulgarianTurkishRomaOther
Ethnicity
No incomeLess than 100 BGN101-150 BGN151-200 BGN201-300 BGN301-500 BGNMore than 500 BGNDon't knowNA
Total household income
No incomeLess than 250 BGN251-500 BGN501-750 BGN751-1000 More than 1000 BGNDon't knowNA
Personal monthly income
I don't use financial servicesOneTwoThree and more
Financial services usage
Total
Base: Row %
I cannot do thisbecause of a low
incomeRow %
Don't knowRow %
I don't seethe point in
makingsavings
Row %
I don't trustfinancial
institutionsRow %
I can't resist thetemptation to spend
the money onshopping
Row %
I don't havework
Row %Other
Row %
Books andeducation
What are the reasons not to have made savings?
Those who don't save
175
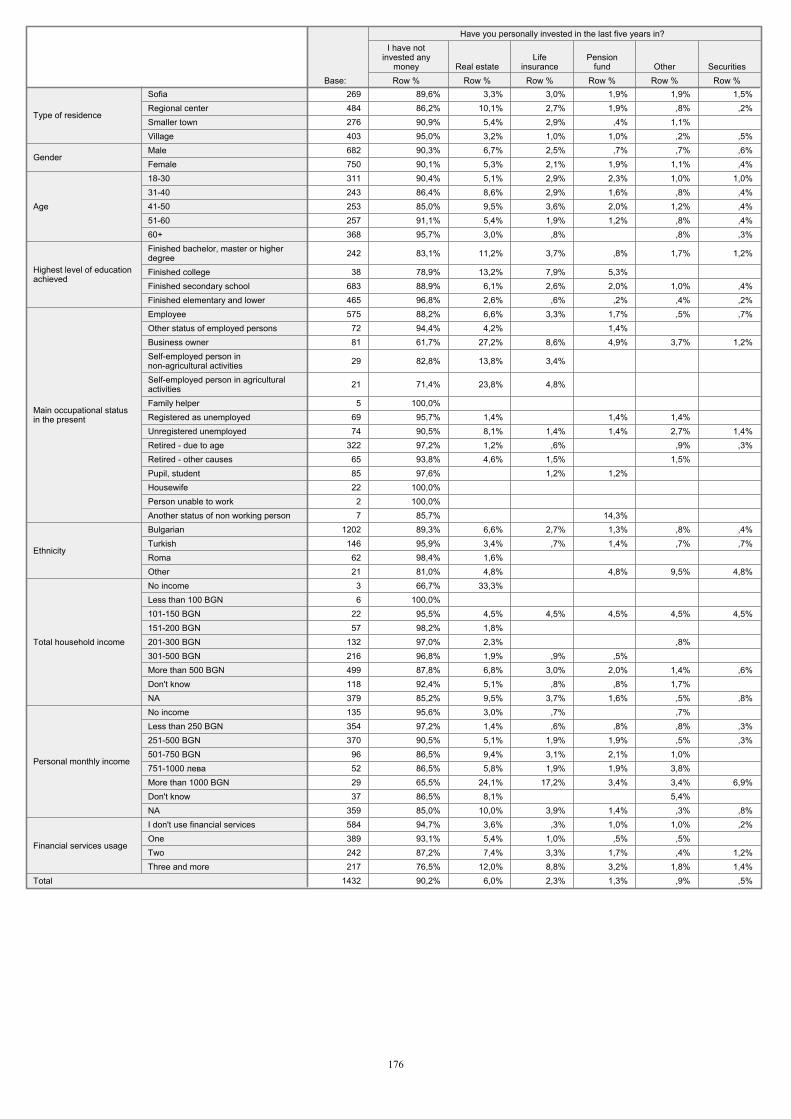
269 89,6% 3,3% 3,0% 1,9% 1,9% 1,5%484 86,2% 10,1% 2,7% 1,9% ,8% ,2%276 90,9% 5,4% 2,9% ,4% 1,1% 403 95,0% 3,2% 1,0% 1,0% ,2% ,5%682 90,3% 6,7% 2,5% ,7% ,7% ,6%750 90,1% 5,3% 2,1% 1,9% 1,1% ,4%311 90,4% 5,1% 2,9% 2,3% 1,0% 1,0%243 86,4% 8,6% 2,9% 1,6% ,8% ,4%253 85,0% 9,5% 3,6% 2,0% 1,2% ,4%257 91,1% 5,4% 1,9% 1,2% ,8% ,4%368 95,7% 3,0% ,8% ,8% ,3%
242 83,1% 11,2% 3,7% ,8% 1,7% 1,2%
38 78,9% 13,2% 7,9% 5,3% 683 88,9% 6,1% 2,6% 2,0% 1,0% ,4%465 96,8% 2,6% ,6% ,2% ,4% ,2%575 88,2% 6,6% 3,3% 1,7% ,5% ,7%
72 94,4% 4,2% 1,4% 81 61,7% 27,2% 8,6% 4,9% 3,7% 1,2%
29 82,8% 13,8% 3,4%
21 71,4% 23,8% 4,8%
5 100,0% 69 95,7% 1,4% 1,4% 1,4% 74 90,5% 8,1% 1,4% 1,4% 2,7% 1,4%
322 97,2% 1,2% ,6% ,9% ,3%65 93,8% 4,6% 1,5% 1,5% 85 97,6% 1,2% 1,2% 22 100,0%
2 100,0% 7 85,7% 14,3%
1202 89,3% 6,6% 2,7% 1,3% ,8% ,4%146 95,9% 3,4% ,7% 1,4% ,7% ,7%
62 98,4% 1,6% 21 81,0% 4,8% 4,8% 9,5% 4,8%
3 66,7% 33,3% 6 100,0%
22 95,5% 4,5% 4,5% 4,5% 4,5% 4,5%57 98,2% 1,8%
132 97,0% 2,3% ,8% 216 96,8% 1,9% ,9% ,5% 499 87,8% 6,8% 3,0% 2,0% 1,4% ,6%118 92,4% 5,1% ,8% ,8% 1,7% 379 85,2% 9,5% 3,7% 1,6% ,5% ,8%135 95,6% 3,0% ,7% ,7% 354 97,2% 1,4% ,6% ,8% ,8% ,3%370 90,5% 5,1% 1,9% 1,9% ,5% ,3%
96 86,5% 9,4% 3,1% 2,1% 1,0% 52 86,5% 5,8% 1,9% 1,9% 3,8% 29 65,5% 24,1% 17,2% 3,4% 3,4% 6,9%37 86,5% 8,1% 5,4%
359 85,0% 10,0% 3,9% 1,4% ,3% ,8%584 94,7% 3,6% ,3% 1,0% 1,0% ,2%389 93,1% 5,4% 1,0% ,5% ,5% 242 87,2% 7,4% 3,3% 1,7% ,4% 1,2%217 76,5% 12,0% 8,8% 3,2% 1,8% 1,4%
1432 90,2% 6,0% 2,3% 1,3% ,9% ,5%
SofiaRegional centerSmaller townVillage
Type of residence
MaleFemale
Gender
18-3031-4041-5051-6060+
Age
Finished bachelor, master or higherdegreeFinished collegeFinished secondary schoolFinished elementary and lower
Highest level of educationachieved
EmployeeOther status of employed personsBusiness ownerSelf-employed person innon-agricultural activitiesSelf-employed person in agriculturalactivitiesFamily helperRegistered as unemployedUnregistered unemployedRetired - due to ageRetired - other causesPupil, studentHousewifePerson unable to workAnother status of non working person
Main occupational statusin the present
BulgarianTurkishRomaOther
Ethnicity
No incomeLess than 100 BGN101-150 BGN151-200 BGN201-300 BGN301-500 BGNMore than 500 BGNDon't knowNA
Total household income
No incomeLess than 250 BGN251-500 BGN501-750 BGN751-1000 More than 1000 BGNDon't knowNA
Personal monthly income
I don't use financial servicesOneTwoThree and more
Financial services usage
Total
Base: Row %
I have notinvested any
moneyRow %
Real estateRow %
Lifeinsurance
Row %
Pensionfund
Row %Other
Row %Securities
Have you personally invested in the last five years in?
176
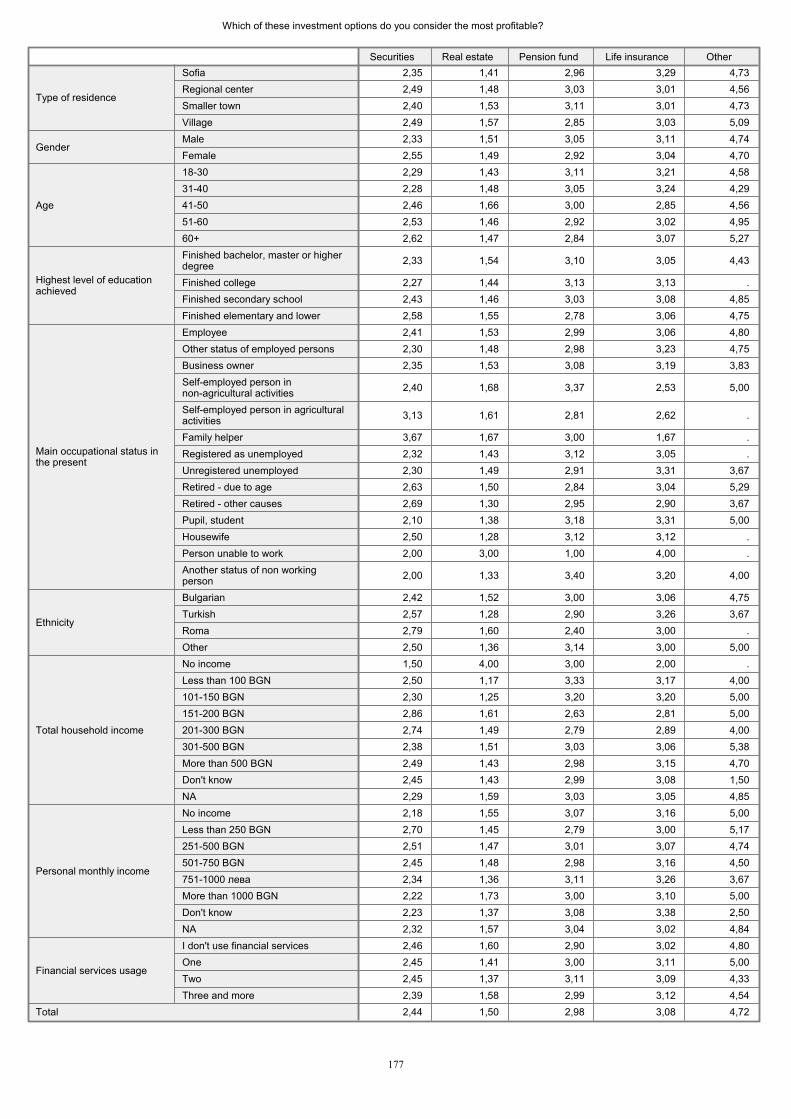
Which of these investment options do you consider the most profitable?
2,35 1,41 2,96 3,29 4,732,49 1,48 3,03 3,01 4,562,40 1,53 3,11 3,01 4,732,49 1,57 2,85 3,03 5,092,33 1,51 3,05 3,11 4,742,55 1,49 2,92 3,04 4,702,29 1,43 3,11 3,21 4,582,28 1,48 3,05 3,24 4,292,46 1,66 3,00 2,85 4,562,53 1,46 2,92 3,02 4,952,62 1,47 2,84 3,07 5,27
2,33 1,54 3,10 3,05 4,43
2,27 1,44 3,13 3,13 .2,43 1,46 3,03 3,08 4,852,58 1,55 2,78 3,06 4,752,41 1,53 2,99 3,06 4,802,30 1,48 2,98 3,23 4,752,35 1,53 3,08 3,19 3,83
2,40 1,68 3,37 2,53 5,00
3,13 1,61 2,81 2,62 .
3,67 1,67 3,00 1,67 .2,32 1,43 3,12 3,05 .2,30 1,49 2,91 3,31 3,672,63 1,50 2,84 3,04 5,292,69 1,30 2,95 2,90 3,672,10 1,38 3,18 3,31 5,002,50 1,28 3,12 3,12 .2,00 3,00 1,00 4,00 .
2,00 1,33 3,40 3,20 4,00
2,42 1,52 3,00 3,06 4,752,57 1,28 2,90 3,26 3,672,79 1,60 2,40 3,00 .2,50 1,36 3,14 3,00 5,001,50 4,00 3,00 2,00 .2,50 1,17 3,33 3,17 4,002,30 1,25 3,20 3,20 5,002,86 1,61 2,63 2,81 5,002,74 1,49 2,79 2,89 4,002,38 1,51 3,03 3,06 5,382,49 1,43 2,98 3,15 4,702,45 1,43 2,99 3,08 1,502,29 1,59 3,03 3,05 4,852,18 1,55 3,07 3,16 5,002,70 1,45 2,79 3,00 5,172,51 1,47 3,01 3,07 4,742,45 1,48 2,98 3,16 4,502,34 1,36 3,11 3,26 3,672,22 1,73 3,00 3,10 5,002,23 1,37 3,08 3,38 2,502,32 1,57 3,04 3,02 4,842,46 1,60 2,90 3,02 4,802,45 1,41 3,00 3,11 5,002,45 1,37 3,11 3,09 4,332,39 1,58 2,99 3,12 4,542,44 1,50 2,98 3,08 4,72
SofiaRegional centerSmaller townVillage
Type of residence
MaleFemale
Gender
18-3031-4041-5051-6060+
Age
Finished bachelor, master or higherdegreeFinished collegeFinished secondary schoolFinished elementary and lower
Highest level of educationachieved
EmployeeOther status of employed personsBusiness ownerSelf-employed person innon-agricultural activitiesSelf-employed person in agriculturalactivitiesFamily helperRegistered as unemployedUnregistered unemployedRetired - due to ageRetired - other causesPupil, studentHousewifePerson unable to workAnother status of non workingperson
Main occupational status inthe present
BulgarianTurkishRomaOther
Ethnicity
No incomeLess than 100 BGN101-150 BGN151-200 BGN201-300 BGN301-500 BGNMore than 500 BGNDon't knowNA
Total household income
No incomeLess than 250 BGN251-500 BGN501-750 BGN751-1000 More than 1000 BGNDon't knowNA
Personal monthly income
I don't use financial servicesOneTwoThree and more
Financial services usage
Total
Securities Real estate Pension fund Life insurance Other
177
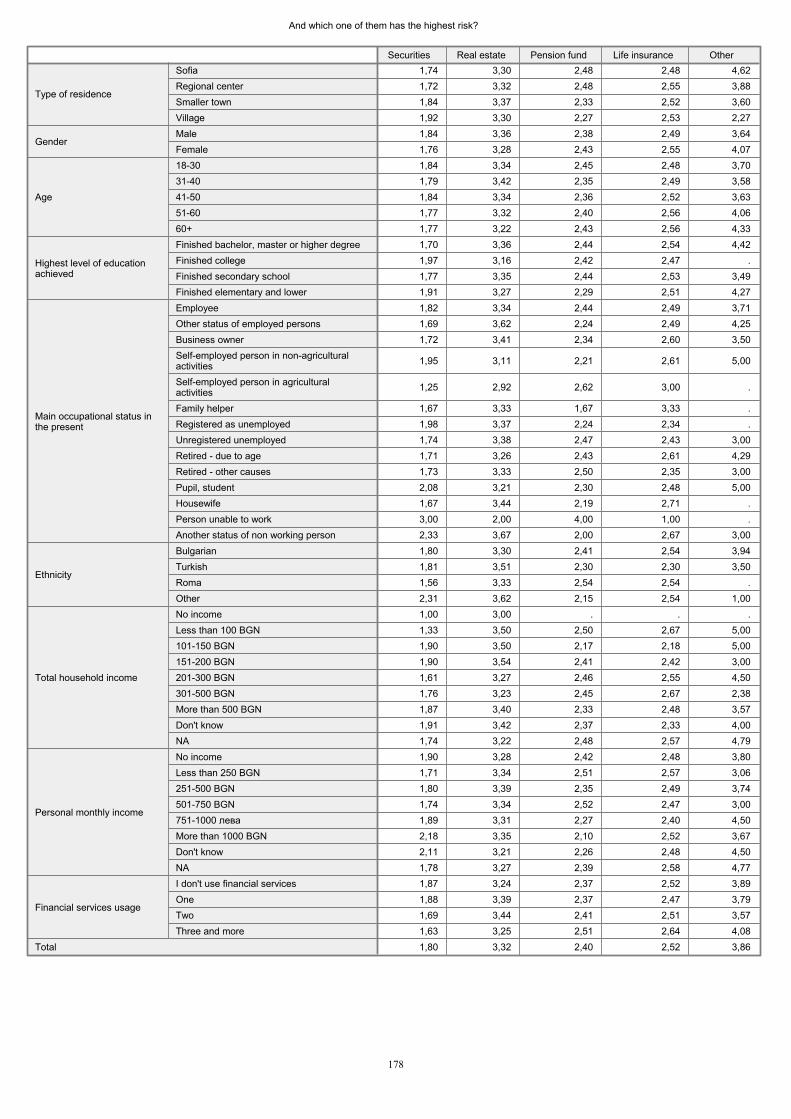
And which one of them has the highest risk?
1,74 3,30 2,48 2,48 4,621,72 3,32 2,48 2,55 3,881,84 3,37 2,33 2,52 3,601,92 3,30 2,27 2,53 2,271,84 3,36 2,38 2,49 3,641,76 3,28 2,43 2,55 4,071,84 3,34 2,45 2,48 3,701,79 3,42 2,35 2,49 3,581,84 3,34 2,36 2,52 3,631,77 3,32 2,40 2,56 4,061,77 3,22 2,43 2,56 4,331,70 3,36 2,44 2,54 4,421,97 3,16 2,42 2,47 .1,77 3,35 2,44 2,53 3,491,91 3,27 2,29 2,51 4,271,82 3,34 2,44 2,49 3,711,69 3,62 2,24 2,49 4,251,72 3,41 2,34 2,60 3,50
1,95 3,11 2,21 2,61 5,00
1,25 2,92 2,62 3,00 .
1,67 3,33 1,67 3,33 .1,98 3,37 2,24 2,34 .1,74 3,38 2,47 2,43 3,001,71 3,26 2,43 2,61 4,291,73 3,33 2,50 2,35 3,002,08 3,21 2,30 2,48 5,001,67 3,44 2,19 2,71 .3,00 2,00 4,00 1,00 .2,33 3,67 2,00 2,67 3,001,80 3,30 2,41 2,54 3,941,81 3,51 2,30 2,30 3,501,56 3,33 2,54 2,54 .2,31 3,62 2,15 2,54 1,001,00 3,00 . . .1,33 3,50 2,50 2,67 5,001,90 3,50 2,17 2,18 5,001,90 3,54 2,41 2,42 3,001,61 3,27 2,46 2,55 4,501,76 3,23 2,45 2,67 2,381,87 3,40 2,33 2,48 3,571,91 3,42 2,37 2,33 4,001,74 3,22 2,48 2,57 4,791,90 3,28 2,42 2,48 3,801,71 3,34 2,51 2,57 3,061,80 3,39 2,35 2,49 3,741,74 3,34 2,52 2,47 3,001,89 3,31 2,27 2,40 4,502,18 3,35 2,10 2,52 3,672,11 3,21 2,26 2,48 4,501,78 3,27 2,39 2,58 4,771,87 3,24 2,37 2,52 3,891,88 3,39 2,37 2,47 3,791,69 3,44 2,41 2,51 3,571,63 3,25 2,51 2,64 4,081,80 3,32 2,40 2,52 3,86
SofiaRegional centerSmaller townVillage
Type of residence
MaleFemale
Gender
18-3031-4041-5051-6060+
Age
Finished bachelor, master or higher degreeFinished collegeFinished secondary schoolFinished elementary and lower
Highest level of educationachieved
EmployeeOther status of employed personsBusiness ownerSelf-employed person in non-agriculturalactivitiesSelf-employed person in agriculturalactivitiesFamily helperRegistered as unemployedUnregistered unemployedRetired - due to ageRetired - other causesPupil, studentHousewifePerson unable to workAnother status of non working person
Main occupational status inthe present
BulgarianTurkishRomaOther
Ethnicity
No incomeLess than 100 BGN101-150 BGN151-200 BGN201-300 BGN301-500 BGNMore than 500 BGNDon't knowNA
Total household income
No incomeLess than 250 BGN251-500 BGN501-750 BGN751-1000 More than 1000 BGNDon't knowNA
Personal monthly income
I don't use financial servicesOneTwoThree and more
Financial services usage
Total
Securities Real estate Pension fund Life insurance Other
178
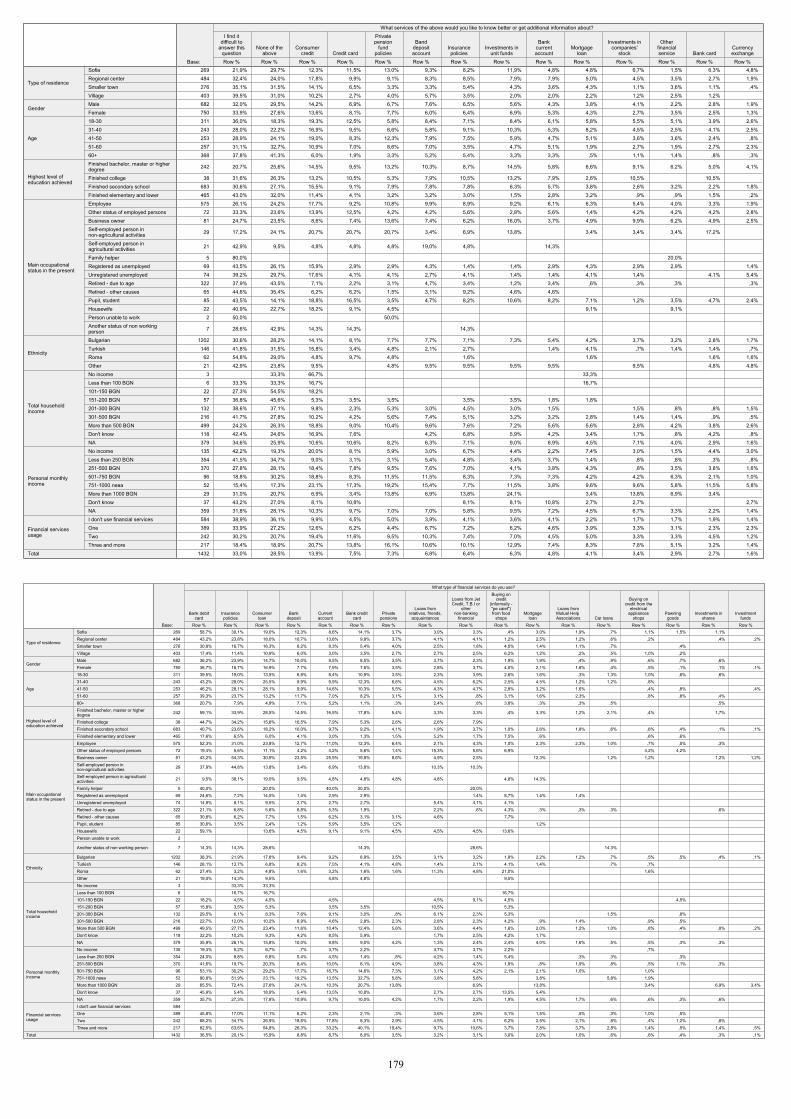
269 21,9% 29,7% 12,3% 11,5% 13,0% 9,3% 8,2% 11,9% 4,8% 4,8% 6,7% 1,5% 6,3% 4,8%484 32,4% 24,0% 17,8% 9,9% 9,1% 8,3% 8,5% 7,9% 7,9% 5,0% 4,5% 3,5% 2,7% 1,9%276 35,1% 31,5% 14,1% 6,5% 3,3% 3,3% 5,4% 4,3% 3,6% 4,3% 1,1% 3,6% 1,1% ,4%403 39,5% 31,0% 10,2% 2,7% 4,0% 5,7% 3,5% 2,0% 2,0% 2,2% 1,2% 2,5% 1,2% 682 32,0% 29,5% 14,2% 6,9% 6,7% 7,6% 6,5% 5,6% 4,3% 3,8% 4,1% 2,2% 2,8% 1,9%750 33,9% 27,6% 13,6% 8,1% 7,7% 6,0% 6,4% 6,9% 5,3% 4,3% 2,7% 3,5% 2,5% 1,3%311 36,0% 18,3% 19,3% 12,5% 5,8% 8,4% 7,1% 8,4% 6,1% 5,8% 5,5% 5,1% 3,9% 2,6%243 28,0% 22,2% 16,9% 9,5% 8,6% 5,8% 9,1% 10,3% 5,3% 8,2% 4,5% 2,5% 4,1% 2,5%253 28,9% 24,1% 19,0% 8,3% 12,3% 7,9% 7,5% 5,9% 4,7% 5,1% 3,6% 3,6% 2,4% ,8%257 31,1% 32,7% 10,9% 7,0% 8,6% 7,0% 3,5% 4,7% 5,1% 1,9% 2,7% 1,9% 2,7% 2,3%368 37,8% 41,3% 6,0% 1,9% 3,3% 5,2% 5,4% 3,3% 3,3% ,5% 1,1% 1,4% ,8% ,3%
242 20,7% 25,6% 14,5% 9,5% 13,2% 10,3% 8,7% 14,5% 5,8% 6,6% 9,1% 6,2% 5,0% 4,1%
38 31,6% 26,3% 13,2% 10,5% 5,3% 7,9% 10,5% 13,2% 7,9% 2,6% 10,5% 10,5% 683 30,6% 27,1% 15,5% 9,1% 7,9% 7,8% 7,8% 6,3% 5,7% 3,8% 2,6% 3,2% 2,2% 1,8%465 43,0% 32,0% 11,4% 4,1% 3,2% 3,2% 3,0% 1,5% 2,8% 3,2% ,9% ,9% 1,5% ,2%575 26,1% 24,2% 17,7% 9,2% 10,8% 9,9% 8,9% 9,2% 6,1% 6,3% 5,4% 4,0% 3,3% 1,9%72 33,3% 23,6% 13,9% 12,5% 4,2% 4,2% 5,6% 2,8% 5,6% 1,4% 4,2% 4,2% 4,2% 2,8%81 24,7% 23,5% 8,6% 7,4% 13,6% 7,4% 6,2% 16,0% 3,7% 4,9% 9,9% 6,2% 4,9% 2,5%
29 17,2% 24,1% 20,7% 20,7% 20,7% 3,4% 6,9% 13,8% 3,4% 3,4% 3,4% 17,2%
21 42,9% 9,5% 4,8% 4,8% 4,8% 19,0% 4,8% 14,3%
5 80,0% 20,0% 69 43,5% 26,1% 15,9% 2,9% 2,9% 4,3% 1,4% 1,4% 2,9% 4,3% 2,9% 2,9% 1,4%74 39,2% 29,7% 17,6% 4,1% 4,1% 2,7% 4,1% 1,4% 1,4% 4,1% 1,4% 4,1% 5,4%
322 37,9% 43,5% 7,1% 2,2% 3,1% 4,7% 3,4% 1,2% 3,4% ,6% ,3% ,3% ,3%65 44,6% 35,4% 6,2% 6,2% 1,5% 3,1% 9,2% 4,6% 4,6% 85 43,5% 14,1% 18,8% 16,5% 3,5% 4,7% 8,2% 10,6% 8,2% 7,1% 1,2% 3,5% 4,7% 2,4%22 40,9% 22,7% 18,2% 9,1% 4,5% 9,1% 9,1% 2 50,0% 50,0%
7 28,6% 42,9% 14,3% 14,3% 14,3%
1202 30,6% 28,2% 14,1% 8,1% 7,7% 7,7% 7,1% 7,3% 5,4% 4,2% 3,7% 3,2% 2,8% 1,7%146 41,8% 31,5% 15,8% 3,4% 4,8% 2,1% 2,7% 1,4% 4,1% ,7% 1,4% 1,4% ,7%62 54,8% 29,0% 4,8% 9,7% 4,8% 1,6% 1,6% 1,6% 1,6%21 42,9% 23,8% 9,5% 4,8% 9,5% 9,5% 9,5% 9,5% 9,5% 4,8% 4,8%3 33,3% 66,7% 33,3% 6 33,3% 33,3% 16,7% 16,7%
22 27,3% 54,5% 18,2% 57 36,8% 45,6% 5,3% 3,5% 3,5% 3,5% 3,5% 1,8% 1,8%
132 38,6% 37,1% 9,8% 2,3% 5,3% 3,0% 4,5% 3,0% 1,5% 1,5% ,8% ,8% 1,5%216 41,7% 27,8% 10,2% 4,2% 5,6% 7,4% 5,1% 3,2% 3,2% 2,8% 1,4% 1,4% ,9% ,5%499 24,2% 26,3% 18,8% 9,0% 10,4% 9,6% 7,6% 7,2% 5,6% 5,6% 2,8% 4,2% 3,8% 2,6%118 42,4% 24,6% 16,9% 7,6% 4,2% 6,8% 5,9% 4,2% 3,4% 1,7% ,8% 4,2% ,8%379 34,6% 25,9% 10,6% 10,6% 8,2% 6,3% 7,1% 9,0% 6,9% 4,5% 7,1% 4,0% 2,9% 1,6%135 42,2% 19,3% 20,0% 8,1% 5,9% 3,0% 6,7% 4,4% 2,2% 7,4% 3,0% 1,5% 4,4% 3,0%354 41,5% 34,7% 9,0% 3,1% 3,1% 5,4% 4,8% 3,4% 3,7% 1,4% ,8% ,8% ,3% ,8%370 27,8% 28,1% 18,4% 7,8% 9,5% 7,6% 7,0% 4,1% 3,8% 4,3% ,8% 3,5% 3,8% 1,6%96 18,8% 30,2% 18,8% 8,3% 11,5% 11,5% 8,3% 7,3% 7,3% 4,2% 4,2% 6,3% 2,1% 1,0%52 15,4% 17,3% 23,1% 17,3% 19,2% 15,4% 7,7% 11,5% 3,8% 9,6% 9,6% 5,8% 11,5% 5,8%29 31,0% 20,7% 6,9% 3,4% 13,8% 6,9% 13,8% 24,1% 3,4% 13,8% 6,9% 3,4% 37 43,2% 27,0% 8,1% 10,8% 8,1% 8,1% 10,8% 2,7% 2,7% 2,7%
359 31,8% 28,1% 10,3% 9,7% 7,0% 7,0% 5,8% 9,5% 7,2% 4,5% 6,7% 3,3% 2,2% 1,4%584 38,9% 36,1% 9,9% 4,5% 5,0% 3,9% 4,1% 3,6% 4,1% 2,2% 1,7% 1,7% 1,9% 1,4%389 33,9% 27,2% 12,6% 6,2% 4,4% 6,7% 7,2% 6,2% 4,6% 3,9% 3,3% 3,1% 2,3% 2,3%242 30,2% 20,7% 19,4% 11,6% 9,5% 10,3% 7,4% 7,0% 4,5% 5,0% 3,3% 3,3% 4,5% 1,2%217 18,4% 18,9% 20,7% 13,8% 16,1% 10,6% 10,1% 12,9% 7,4% 8,3% 7,8% 5,1% 3,2% 1,4%
1432 33,0% 28,5% 13,9% 7,5% 7,3% 6,8% 6,4% 6,3% 4,8% 4,1% 3,4% 2,9% 2,7% 1,6%
SofiaRegional centerSmaller townVillage
Type of residence
MaleFemale
Gender
18-3031-4041-5051-6060+
Age
Finished bachelor, master or higherdegreeFinished collegeFinished secondary schoolFinished elementary and lower
Highest level ofeducation achieved
EmployeeOther status of employed personsBusiness ownerSelf-employed person innon-agricultural activitiesSelf-employed person inagricultural activitiesFamily helperRegistered as unemployedUnregistered unemployedRetired - due to ageRetired - other causesPupil, studentHousewifePerson unable to workAnother status of non workingperson
Main occupationalstatus in the present
BulgarianTurkishRomaOther
Ethnicity
No incomeLess than 100 BGN101-150 BGN151-200 BGN201-300 BGN301-500 BGNMore than 500 BGNDon't knowNA
Total householdincome
No incomeLess than 250 BGN251-500 BGN501-750 BGN751-1000 More than 1000 BGNDon't knowNA
Personal monthlyincome
I don't use financial servicesOneTwoThree and more
Financial servicesusage
Total
Base: Row %
I find itdifficult to
answer thisquestion
Row %
None of theabove
Row %
Consumercredit
Row %Credit card
Row %
Privatepension
fundpolicies
Row %
Banddepositaccount
Row %
Insurancepolicies
Row %
Investments inunit funds
Row %
Bankcurrentaccount
Row %
Mortgageloan
Row %
Investments incompanies'
stockRow %
Otherfinancialservice
Row %Bank card
Row %
Currencyexchange
What services of the above would you like to know better or get additional information about?
269 58,7% 30,1% 19,0% 12,3% 8,6% 14,1% 3,7% 3,0% 3,3% ,4% 3,0% 1,9% ,7% 1,1% 1,5% 1,1% 484 43,2% 23,8% 18,0% 10,7% 13,6% 9,9% 3,7% 4,1% 4,1% 1,2% 2,5% 1,2% ,6% ,2% ,4% ,2%276 30,8% 16,7% 16,3% 6,2% 8,3% 5,4% 4,0% 2,5% 1,8% 4,0% 1,4% 1,1% ,7% ,4% 403 17,4% 11,4% 10,9% 6,0% 3,0% 3,5% 2,7% 2,7% 2,5% 6,2% 1,2% ,2% ,5% 1,0% ,2% 682 36,2% 23,9% 14,7% 10,0% 9,5% 8,5% 3,5% 3,7% 2,3% 1,9% 1,9% ,4% ,9% ,6% ,7% ,6% 750 36,7% 16,7% 16,9% 7,7% 7,9% 7,6% 3,5% 2,8% 3,7% 4,0% 2,1% 1,6% ,4% ,5% ,1% ,1% ,1%311 39,5% 19,0% 13,5% 6,8% 8,4% 10,9% 3,5% 2,3% 3,9% 2,6% 1,6% ,3% 1,3% 1,0% ,6% ,6% 243 43,2% 28,0% 25,5% 9,9% 9,9% 12,3% 6,6% 4,5% 6,2% 2,5% 4,5% 1,2% 1,2% ,8% 253 46,2% 28,1% 28,1% 9,9% 14,6% 10,3% 5,5% 4,3% 4,7% 2,8% 3,2% 1,6% ,4% ,8% ,4%257 39,3% 23,7% 13,2% 11,7% 7,0% 8,2% 3,1% 3,1% ,8% 3,1% 1,6% 2,3% ,8% ,8% ,4% 368 20,7% 7,9% 4,9% 7,1% 5,2% 1,1% ,3% 2,4% ,8% 3,8% ,3% ,3% ,5% ,5%
242 59,1% 33,9% 28,5% 14,5% 16,5% 17,8% 5,4% 3,3% 3,3% ,4% 3,3% 1,2% 2,1% ,4% 1,7%
38 44,7% 34,2% 15,8% 10,5% 7,9% 5,3% 2,6% 2,6% 7,9% 683 40,7% 23,6% 18,2% 10,0% 9,7% 9,2% 4,1% 1,9% 3,7% 1,0% 2,6% 1,8% ,6% ,6% ,4% ,1% ,1%465 17,6% 6,5% 6,0% 4,1% 3,0% 1,3% 1,5% 5,2% 1,7% 7,5% ,6% ,6% ,6% 575 52,3% 31,0% 23,8% 12,7% 11,0% 12,3% 6,4% 2,1% 4,3% 1,0% 2,3% 2,3% 1,0% ,7% ,5% ,3% 72 19,4% 5,6% 11,1% 4,2% 4,2% 5,6% 1,4% 15,3% 5,6% 6,9% 4,2% 4,2% 81 43,2% 54,3% 30,9% 23,5% 25,9% 19,8% 8,6% 4,9% 2,5% 12,3% 1,2% 1,2% 1,2% 1,2%
29 37,9% 44,8% 13,8% 3,4% 6,9% 13,8% 10,3% 10,3%
21 9,5% 38,1% 19,0% 9,5% 4,8% 4,8% 4,8% 4,8% 4,8% 14,3%
5 40,0% 20,0% 40,0% 20,0% 20,0% 69 24,6% 7,2% 14,5% 1,4% 2,9% 2,9% 1,4% 8,7% 1,4% 1,4% 74 14,9% 8,1% 9,5% 2,7% 2,7% 2,7% 5,4% 4,1% 4,1%
322 21,1% 6,8% 5,6% 6,8% 5,3% 1,9% 2,2% ,6% 4,3% ,3% ,3% ,3% ,6% 65 30,8% 6,2% 7,7% 1,5% 6,2% 3,1% 3,1% 4,6% 7,7% 85 30,6% 3,5% 2,4% 1,2% 5,9% 3,5% 1,2% 1,2% 22 59,1% 13,6% 4,5% 9,1% 9,1% 4,5% 4,5% 4,5% 13,6% 2
7 14,3% 14,3% 28,6% 14,3% 28,6% 14,3%
1202 38,3% 21,9% 17,6% 9,4% 9,2% 8,9% 3,5% 3,1% 3,2% 1,8% 2,2% 1,2% ,7% ,5% ,5% ,4% ,1%146 28,1% 13,7% 6,8% 8,2% 7,5% 4,1% 4,8% 1,4% 2,1% 4,1% 1,4% ,7% ,7% 62 27,4% 3,2% 4,8% 1,6% 3,2% 1,6% 1,6% 11,3% 4,8% 21,0% 1,6% 21 19,0% 14,3% 9,5% 4,8% 4,8% 9,5% 3 33,3% 33,3% 6 16,7% 16,7% 16,7%
22 18,2% 4,5% 4,5% 4,5% 4,5% 9,1% 4,5% 4,5% 57 15,8% 3,5% 5,3% 3,5% 3,5% 10,5% 5,3%
132 29,5% 6,1% 8,3% 7,6% 9,1% 3,0% ,8% 6,1% 2,3% 5,3% 1,5% ,8% 216 22,7% 12,0% 10,2% 6,9% 4,6% 2,8% 2,3% 2,8% 2,3% 4,2% ,9% 1,4% ,9% ,5% 499 49,5% 27,7% 23,4% 11,6% 10,4% 12,4% 5,6% 3,6% 4,4% 1,6% 2,0% 1,2% 1,0% ,8% ,4% ,8% ,2%118 32,2% 10,2% 9,3% 4,2% 8,5% 5,9% 1,7% 2,5% 4,2% 1,7% 379 35,9% 26,1% 15,8% 10,0% 9,8% 9,0% 4,2% 1,3% 2,4% 2,4% 4,0% 1,6% ,5% ,5% ,3% ,3% 135 19,3% 5,2% 6,7% ,7% 3,7% 2,2% 3,7% 3,7% 2,2% ,7% 354 24,0% 8,8% 6,8% 5,4% 4,5% 1,4% ,8% 4,2% 1,4% 5,4% ,3% ,3% ,3% 370 41,6% 19,7% 20,3% 8,4% 10,0% 8,1% 4,9% 3,8% 4,3% 1,9% ,8% 1,9% ,8% ,5% 1,1% ,3% 96 53,1% 30,2% 29,2% 17,7% 16,7% 14,6% 7,3% 3,1% 4,2% 2,1% 2,1% 1,0% 1,0% 52 80,8% 51,9% 23,1% 19,2% 13,5% 32,7% 5,8% 3,8% 5,8% 3,8% 5,8% 1,9% 29 65,5% 72,4% 27,6% 24,1% 10,3% 20,7% 13,8% 6,9% 13,8% 3,4% 6,9% 3,4%37 45,9% 5,4% 18,9% 5,4% 13,5% 10,8% 2,7% 2,7% 13,5% 5,4%
359 35,7% 27,3% 17,8% 10,9% 9,7% 10,0% 4,2% 1,7% 2,2% 1,9% 4,5% 1,7% ,6% ,6% ,3% ,6% 584 389 45,8% 17,0% 11,1% 6,2% 2,3% 2,1% ,3% 3,6% 2,8% 5,1% 1,5% ,5% ,3% 1,0% ,5% 242 68,2% 34,7% 26,9% 18,6% 17,8% 8,3% 2,9% 4,5% 4,1% 6,2% 2,5% 2,1% ,8% ,4% 1,2% ,8% 217 82,5% 63,6% 54,8% 26,3% 33,2% 40,1% 19,4% 9,7% 10,6% 3,7% 7,8% 3,7% 2,8% 1,4% ,5% 1,4% ,5%
1432 36,5% 20,1% 15,9% 8,8% 8,7% 8,0% 3,5% 3,2% 3,1% 3,0% 2,0% 1,0% ,6% ,6% ,4% ,3% ,1%
SofiaRegional centerSmaller townVillage
Type of residence
MaleFemale
Gender
18-3031-4041-5051-6060+
Age
Finished bachelor, master or higherdegreeFinished collegeFinished secondary schoolFinished elementary and lower
Highest level ofeducation achieved
EmployeeOther status of employed personsBusiness ownerSelf-employed person innon-agricultural activitiesSelf-employed person in agriculturalactivitiesFamily helperRegistered as unemployedUnregistered unemployedRetired - due to ageRetired - other causesPupil, studentHousewifePerson unable to work
Another status of non working person
Main occupationalstatus in the present
BulgarianTurkishRomaOther
Ethnicity
No incomeLess than 100 BGN101-150 BGN151-200 BGN201-300 BGN301-500 BGNMore than 500 BGNDon't knowNA
Total householdincome
No incomeLess than 250 BGN251-500 BGN501-750 BGN751-1000 More than 1000 BGNDon't knowNA
Personal monthlyincome
I don't use financial servicesOneTwoThree and more
Financial servicesusage
Total
Base: Row %
Bank debitcard
Row %
Insurancepolicies
Row %
Consumerloan
Row %
Bankdeposit
Row %
Currentaccount
Row %
Bank creditcard
Row %
Privatepensions
Row %
Loans fromrelatives, friends,
acquaintancesRow %
Loans from JetCredit, T.B.I or
othernon-banking
financialRow %
Buying oncredit
(informally -"pe caiet")from food
shopsRow %
Mortgageloan
Row %
Loans fromMutual Help Associations
Row %Car loans
Row %
Buying oncredit from the
electricalappliances
shopsRow %
Pawninggoods
Row %
Investments inshares
Row %
Investmentfunds
What type of financial services do you use?
179
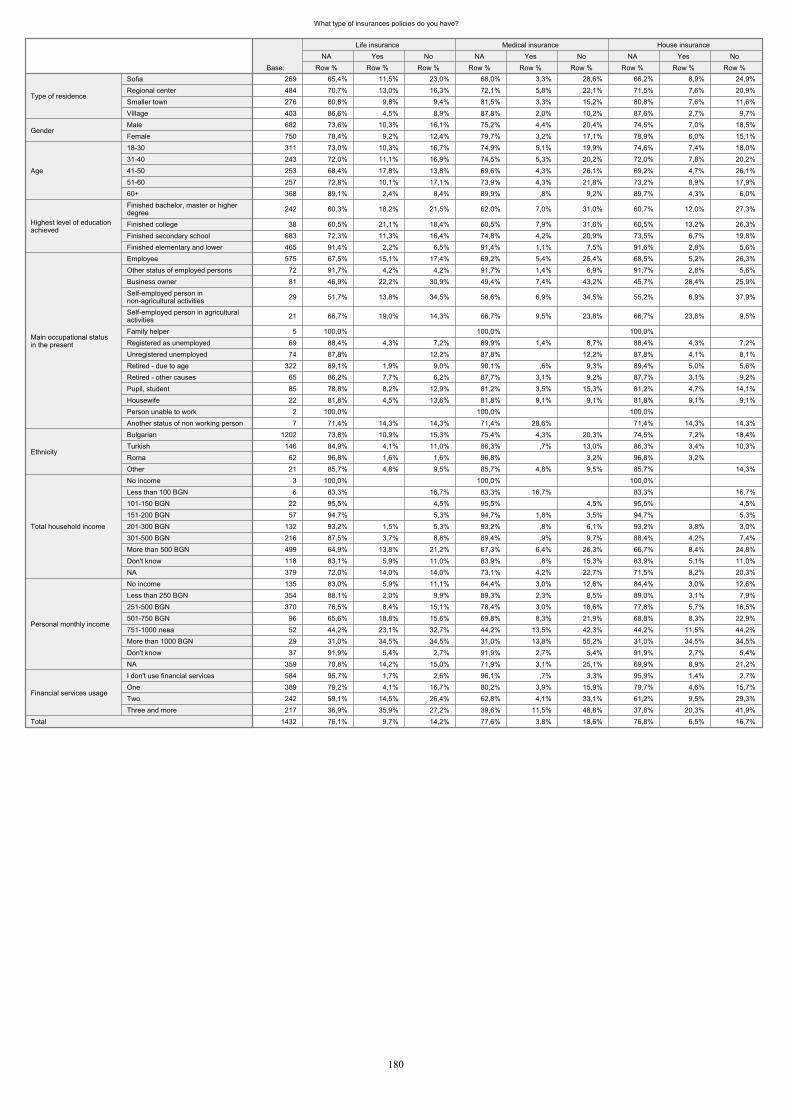
What type of insurances policies do you have?
269 65,4% 11,5% 23,0% 68,0% 3,3% 28,6% 66,2% 8,9% 24,9%484 70,7% 13,0% 16,3% 72,1% 5,8% 22,1% 71,5% 7,6% 20,9%276 80,8% 9,8% 9,4% 81,5% 3,3% 15,2% 80,8% 7,6% 11,6%403 86,6% 4,5% 8,9% 87,8% 2,0% 10,2% 87,6% 2,7% 9,7%682 73,6% 10,3% 16,1% 75,2% 4,4% 20,4% 74,5% 7,0% 18,5%750 78,4% 9,2% 12,4% 79,7% 3,2% 17,1% 78,9% 6,0% 15,1%311 73,0% 10,3% 16,7% 74,9% 5,1% 19,9% 74,6% 7,4% 18,0%243 72,0% 11,1% 16,9% 74,5% 5,3% 20,2% 72,0% 7,8% 20,2%253 68,4% 17,8% 13,8% 69,6% 4,3% 26,1% 69,2% 4,7% 26,1%257 72,8% 10,1% 17,1% 73,9% 4,3% 21,8% 73,2% 8,9% 17,9%368 89,1% 2,4% 8,4% 89,9% ,8% 9,2% 89,7% 4,3% 6,0%
242 60,3% 18,2% 21,5% 62,0% 7,0% 31,0% 60,7% 12,0% 27,3%
38 60,5% 21,1% 18,4% 60,5% 7,9% 31,6% 60,5% 13,2% 26,3%683 72,3% 11,3% 16,4% 74,8% 4,2% 20,9% 73,5% 6,7% 19,8%465 91,4% 2,2% 6,5% 91,4% 1,1% 7,5% 91,6% 2,8% 5,6%575 67,5% 15,1% 17,4% 69,2% 5,4% 25,4% 68,5% 5,2% 26,3%
72 91,7% 4,2% 4,2% 91,7% 1,4% 6,9% 91,7% 2,8% 5,6%81 46,9% 22,2% 30,9% 49,4% 7,4% 43,2% 45,7% 28,4% 25,9%
29 51,7% 13,8% 34,5% 58,6% 6,9% 34,5% 55,2% 6,9% 37,9%
21 66,7% 19,0% 14,3% 66,7% 9,5% 23,8% 66,7% 23,8% 9,5%
5 100,0% 100,0% 100,0% 69 88,4% 4,3% 7,2% 89,9% 1,4% 8,7% 88,4% 4,3% 7,2%74 87,8% 12,2% 87,8% 12,2% 87,8% 4,1% 8,1%
322 89,1% 1,9% 9,0% 90,1% ,6% 9,3% 89,4% 5,0% 5,6%65 86,2% 7,7% 6,2% 87,7% 3,1% 9,2% 87,7% 3,1% 9,2%85 78,8% 8,2% 12,9% 81,2% 3,5% 15,3% 81,2% 4,7% 14,1%22 81,8% 4,5% 13,6% 81,8% 9,1% 9,1% 81,8% 9,1% 9,1%
2 100,0% 100,0% 100,0% 7 71,4% 14,3% 14,3% 71,4% 28,6% 71,4% 14,3% 14,3%
1202 73,8% 10,9% 15,3% 75,4% 4,3% 20,3% 74,5% 7,2% 18,4%146 84,9% 4,1% 11,0% 86,3% ,7% 13,0% 86,3% 3,4% 10,3%
62 96,8% 1,6% 1,6% 96,8% 3,2% 96,8% 3,2% 21 85,7% 4,8% 9,5% 85,7% 4,8% 9,5% 85,7% 14,3%
3 100,0% 100,0% 100,0% 6 83,3% 16,7% 83,3% 16,7% 83,3% 16,7%
22 95,5% 4,5% 95,5% 4,5% 95,5% 4,5%57 94,7% 5,3% 94,7% 1,8% 3,5% 94,7% 5,3%
132 93,2% 1,5% 5,3% 93,2% ,8% 6,1% 93,2% 3,8% 3,0%216 87,5% 3,7% 8,8% 89,4% ,9% 9,7% 88,4% 4,2% 7,4%499 64,9% 13,8% 21,2% 67,3% 6,4% 26,3% 66,7% 8,4% 24,8%118 83,1% 5,9% 11,0% 83,9% ,8% 15,3% 83,9% 5,1% 11,0%379 72,0% 14,0% 14,0% 73,1% 4,2% 22,7% 71,5% 8,2% 20,3%135 83,0% 5,9% 11,1% 84,4% 3,0% 12,6% 84,4% 3,0% 12,6%354 88,1% 2,0% 9,9% 89,3% 2,3% 8,5% 89,0% 3,1% 7,9%370 76,5% 8,4% 15,1% 78,4% 3,0% 18,6% 77,8% 5,7% 16,5%
96 65,6% 18,8% 15,6% 69,8% 8,3% 21,9% 68,8% 8,3% 22,9%52 44,2% 23,1% 32,7% 44,2% 13,5% 42,3% 44,2% 11,5% 44,2%29 31,0% 34,5% 34,5% 31,0% 13,8% 55,2% 31,0% 34,5% 34,5%37 91,9% 5,4% 2,7% 91,9% 2,7% 5,4% 91,9% 2,7% 5,4%
359 70,8% 14,2% 15,0% 71,9% 3,1% 25,1% 69,9% 8,9% 21,2%584 95,7% 1,7% 2,6% 96,1% ,7% 3,3% 95,9% 1,4% 2,7%389 79,2% 4,1% 16,7% 80,2% 3,9% 15,9% 79,7% 4,6% 15,7%242 59,1% 14,5% 26,4% 62,8% 4,1% 33,1% 61,2% 9,5% 29,3%217 36,9% 35,9% 27,2% 39,6% 11,5% 48,8% 37,8% 20,3% 41,9%
1432 76,1% 9,7% 14,2% 77,6% 3,8% 18,6% 76,8% 6,5% 16,7%
SofiaRegional centerSmaller townVillage
Type of residence
MaleFemale
Gender
18-3031-4041-5051-6060+
Age
Finished bachelor, master or higherdegreeFinished collegeFinished secondary schoolFinished elementary and lower
Highest level of educationachieved
EmployeeOther status of employed personsBusiness ownerSelf-employed person innon-agricultural activitiesSelf-employed person in agriculturalactivitiesFamily helperRegistered as unemployedUnregistered unemployedRetired - due to ageRetired - other causesPupil, studentHousewifePerson unable to workAnother status of non working person
Main occupational statusin the present
BulgarianTurkishRomaOther
Ethnicity
No incomeLess than 100 BGN101-150 BGN151-200 BGN201-300 BGN301-500 BGNMore than 500 BGNDon't knowNA
Total household income
No incomeLess than 250 BGN251-500 BGN501-750 BGN751-1000 More than 1000 BGNDon't knowNA
Personal monthly income
I don't use financial servicesOneTwoThree and more
Financial services usage
Total
Base: Row %NA
Row %Yes
Row %No
Life insurance
Row %NA
Row %Yes
Row %No
Medical insurance
Row %NA
Row %Yes
Row %No
House insurance
180

What type of insurances policies do you have?
269 65,8% 30,1% 4,1% 71,0% ,4% 28,6% 85,9% ,7% 13,4%484 71,3% 14,7% 14,0% 72,5% ,2% 27,3% 84,3% 3,1% 12,6%276 81,5% 4,7% 13,8% 81,2% 1,4% 17,4% 87,3% 2,9% 9,8%403 86,8% 5,0% 8,2% 87,8% 1,0% 11,2% 93,3% 1,2% 5,5%682 74,8% 15,0% 10,3% 76,2% ,9% 22,9% 87,8% 2,2% 10,0%750 78,3% 11,1% 10,7% 80,0% ,5% 19,5% 87,6% 2,0% 10,4%311 74,0% 16,4% 9,6% 75,6% ,3% 24,1% 85,9% 3,2% 10,9%243 72,0% 16,0% 11,9% 74,9% ,8% 24,3% 87,7% 2,5% 9,9%253 68,4% 15,8% 15,8% 69,2% ,4% 30,4% 82,6% 3,2% 14,2%257 73,5% 14,0% 12,5% 75,1% 1,6% 23,3% 85,6% 1,2% 13,2%368 89,7% 5,2% 5,2% 91,0% ,5% 8,4% 94,3% ,8% 4,9%
242 59,5% 26,4% 14,0% 63,2% ,8% 36,0% 78,9% 2,1% 19,0%
38 60,5% 28,9% 10,5% 63,2% 36,8% 71,1% 5,3% 23,7%683 73,9% 12,9% 13,2% 75,3% ,7% 24,0% 85,9% 2,9% 11,1%465 91,0% 4,3% 4,7% 91,6% ,6% 7,7% 96,1% ,6% 3,2%575 68,0% 17,4% 14,6% 69,9% ,7% 29,4% 81,7% 1,9% 16,3%72 91,7% 4,2% 4,2% 91,7% 8,3% 95,8% 4,2%81 48,1% 34,6% 17,3% 50,6% 1,2% 48,1% 74,1% 7,4% 18,5%
29 51,7% 44,8% 3,4% 58,6% 3,4% 37,9% 86,2% 3,4% 10,3%
21 61,9% 19,0% 19,0% 66,7% 9,5% 23,8% 90,5% 4,8% 4,8%
5 100,0% 100,0% 100,0% 69 88,4% 2,9% 8,7% 89,9% 10,1% 91,3% 2,9% 5,8%74 86,5% 9,5% 4,1% 87,8% 12,2% 94,6% 4,1% 1,4%
322 90,1% 4,0% 5,9% 91,0% ,6% 8,4% 94,7% ,3% 5,0%65 87,7% 1,5% 10,8% 89,2% 10,8% 93,8% 4,6% 1,5%85 80,0% 11,8% 8,2% 81,2% 18,8% 90,6% 2,4% 7,1%22 81,8% 13,6% 4,5% 81,8% 18,2% 95,5% 4,5%2 100,0% 100,0% 100,0% 7 71,4% 14,3% 14,3% 71,4% 28,6% 85,7% 14,3%
1202 74,5% 14,1% 11,4% 76,2% ,5% 23,3% 86,3% 2,4% 11,3%146 85,6% 8,2% 6,2% 85,6% 2,1% 12,3% 94,5% 5,5%62 95,2% 1,6% 3,2% 96,8% 1,6% 1,6% 100,0% 21 81,0% 9,5% 9,5% 85,7% 14,3% 85,7% 4,8% 9,5%3 100,0% 100,0% 66,7% 33,3% 6 83,3% 16,7% 83,3% 16,7% 100,0%
22 95,5% 4,5% 95,5% 4,5% 95,5% 4,5% 57 94,7% 1,8% 3,5% 94,7% 5,3% 98,2% 1,8%
132 93,9% 1,5% 4,5% 93,9% 6,1% 96,2% 1,5% 2,3%216 89,8% 3,2% 6,9% 89,4% ,9% 9,7% 95,8% ,9% 3,2%499 65,9% 19,4% 14,6% 69,1% ,8% 30,1% 82,0% 3,2% 14,8%118 83,9% 9,3% 6,8% 83,9% ,8% 15,3% 92,4% ,8% 6,8%379 70,7% 17,7% 11,6% 72,8% ,8% 26,4% 84,2% 1,6% 14,2%135 83,7% 10,4% 5,9% 84,4% 15,6% 91,9% 2,2% 5,9%354 89,3% 4,5% 6,2% 89,3% ,6% 10,2% 94,4% ,8% 4,8%370 78,1% 10,3% 11,6% 79,2% ,8% 20,0% 88,1% 3,2% 8,6%96 66,7% 19,8% 13,5% 69,8% 30,2% 81,3% 3,1% 15,6%52 44,2% 36,5% 19,2% 50,0% 1,9% 48,1% 73,1% 1,9% 25,0%29 34,5% 44,8% 20,7% 34,5% 3,4% 62,1% 72,4% 6,9% 20,7%37 91,9% 8,1% 91,9% 8,1% 91,9% 8,1%
359 69,1% 18,4% 12,5% 72,4% ,8% 26,7% 83,8% 1,7% 14,5%584 95,5% 3,1% 1,4% 96,2% 3,8% 97,9% ,5% 1,5%389 79,4% 12,6% 8,0% 81,2% ,5% 18,3% 88,9% 2,3% 8,7%242 61,2% 21,1% 17,8% 63,2% 2,1% 34,7% 81,8% 3,3% 14,9%217 37,8% 30,9% 31,3% 41,0% 1,4% 57,6% 64,5% 4,6% 30,9%
1432 76,6% 12,9% 10,5% 78,2% ,7% 21,1% 87,7% 2,1% 10,2%
SofiaRegional centerSmaller townVillage
Type of residence
MaleFemale
Gender
18-3031-4041-5051-6060+
Age
Finished bachelor, master or higherdegreeFinished collegeFinished secondary schoolFinished elementary and lower
Highest level of educationachieved
EmployeeOther status of employed personsBusiness ownerSelf-employed person in non-agriculturalactivitiesSelf-employed person in agriculturalactivitiesFamily helperRegistered as unemployedUnregistered unemployedRetired - due to ageRetired - other causesPupil, studentHousewifePerson unable to workAnother status of non working person
Main occupational status inthe present
BulgarianTurkishRomaOther
Ethnicity
No incomeLess than 100 BGN101-150 BGN151-200 BGN201-300 BGN301-500 BGNMore than 500 BGNDon't knowNA
Total household income
No incomeLess than 250 BGN251-500 BGN501-750 BGN751-1000 More than 1000 BGNDon't knowNA
Personal monthly income
I don't use financial servicesOneTwoThree and more
Financial services usage
Total
Base: Row %NA
Row %Yes
Row %No
Car insurance - CASCO
Row %NA
Row %Yes
Row %No
Terrains and/ or crop insurance
Row %NA
Row %Yes
Row %No
Other
181
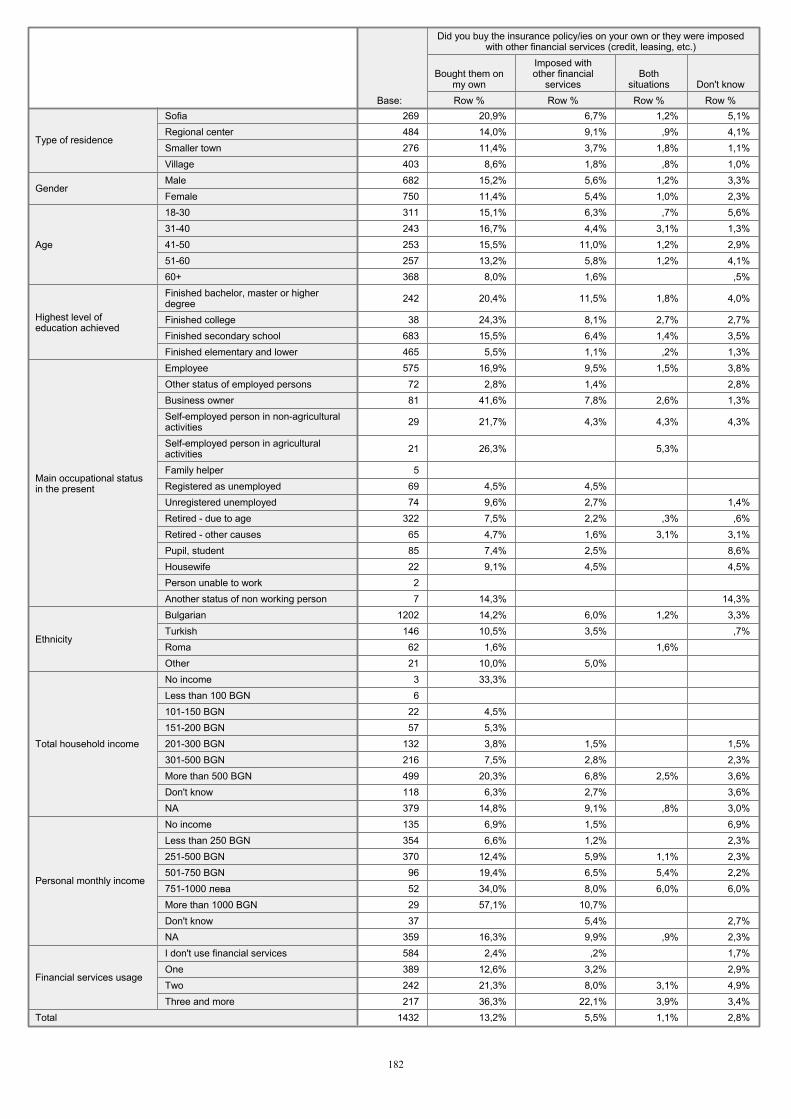
269 20,9% 6,7% 1,2% 5,1%484 14,0% 9,1% ,9% 4,1%276 11,4% 3,7% 1,8% 1,1%403 8,6% 1,8% ,8% 1,0%682 15,2% 5,6% 1,2% 3,3%750 11,4% 5,4% 1,0% 2,3%311 15,1% 6,3% ,7% 5,6%243 16,7% 4,4% 3,1% 1,3%253 15,5% 11,0% 1,2% 2,9%257 13,2% 5,8% 1,2% 4,1%368 8,0% 1,6% ,5%
242 20,4% 11,5% 1,8% 4,0%
38 24,3% 8,1% 2,7% 2,7%683 15,5% 6,4% 1,4% 3,5%465 5,5% 1,1% ,2% 1,3%575 16,9% 9,5% 1,5% 3,8%72 2,8% 1,4% 2,8%81 41,6% 7,8% 2,6% 1,3%
29 21,7% 4,3% 4,3% 4,3%
21 26,3% 5,3%
5 69 4,5% 4,5% 74 9,6% 2,7% 1,4%
322 7,5% 2,2% ,3% ,6%65 4,7% 1,6% 3,1% 3,1%85 7,4% 2,5% 8,6%22 9,1% 4,5% 4,5%2 7 14,3% 14,3%
1202 14,2% 6,0% 1,2% 3,3%146 10,5% 3,5% ,7%62 1,6% 1,6% 21 10,0% 5,0% 3 33,3% 6
22 4,5% 57 5,3%
132 3,8% 1,5% 1,5%216 7,5% 2,8% 2,3%499 20,3% 6,8% 2,5% 3,6%118 6,3% 2,7% 3,6%379 14,8% 9,1% ,8% 3,0%135 6,9% 1,5% 6,9%354 6,6% 1,2% 2,3%370 12,4% 5,9% 1,1% 2,3%96 19,4% 6,5% 5,4% 2,2%52 34,0% 8,0% 6,0% 6,0%29 57,1% 10,7% 37 5,4% 2,7%
359 16,3% 9,9% ,9% 2,3%584 2,4% ,2% 1,7%389 12,6% 3,2% 2,9%242 21,3% 8,0% 3,1% 4,9%217 36,3% 22,1% 3,9% 3,4%
1432 13,2% 5,5% 1,1% 2,8%
SofiaRegional centerSmaller townVillage
Type of residence
MaleFemale
Gender
18-3031-4041-5051-6060+
Age
Finished bachelor, master or higherdegreeFinished collegeFinished secondary schoolFinished elementary and lower
Highest level ofeducation achieved
EmployeeOther status of employed personsBusiness ownerSelf-employed person in non-agriculturalactivitiesSelf-employed person in agriculturalactivitiesFamily helperRegistered as unemployedUnregistered unemployedRetired - due to ageRetired - other causesPupil, studentHousewifePerson unable to workAnother status of non working person
Main occupational statusin the present
BulgarianTurkishRomaOther
Ethnicity
No incomeLess than 100 BGN101-150 BGN151-200 BGN201-300 BGN301-500 BGNMore than 500 BGNDon't knowNA
Total household income
No incomeLess than 250 BGN251-500 BGN501-750 BGN751-1000 More than 1000 BGNDon't knowNA
Personal monthly income
I don't use financial servicesOneTwoThree and more
Financial services usage
Total
Base: Row %
Bought them onmy own
Row %
Imposed withother financial
servicesRow %
Bothsituations
Row %Don't know
Did you buy the insurance policy/ies on your own or they were imposedwith other financial services (credit, leasing, etc.)
182
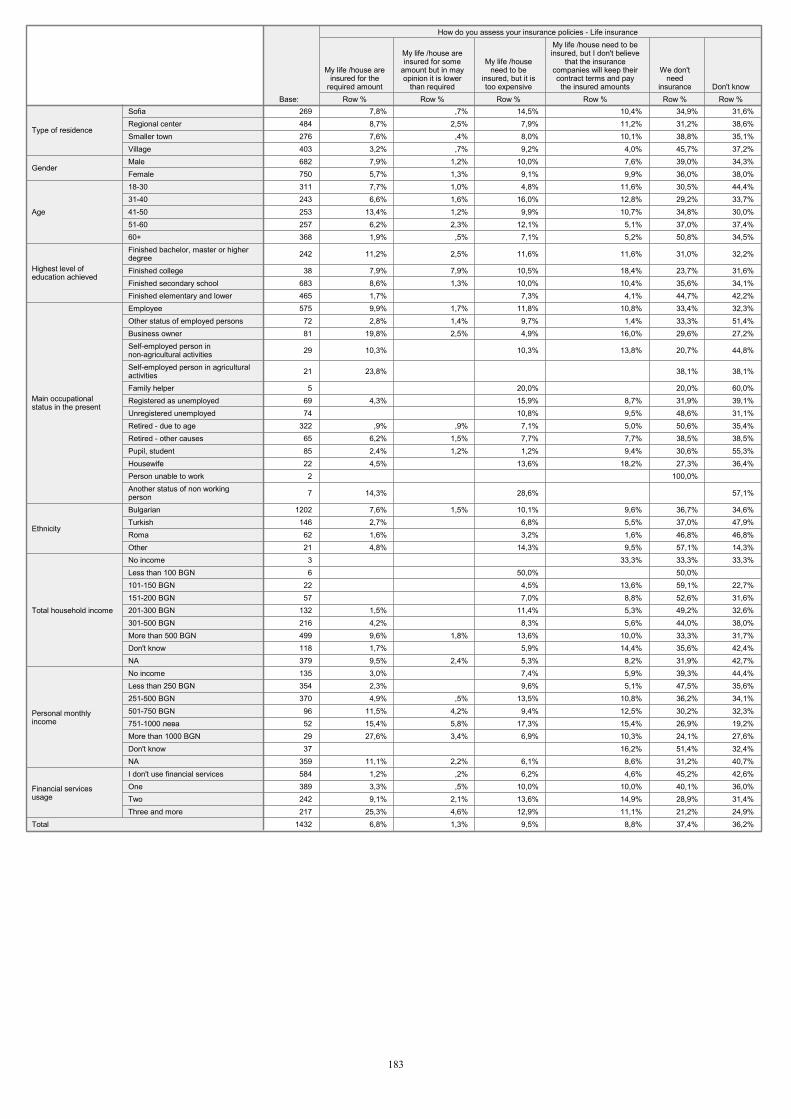
269 7,8% ,7% 14,5% 10,4% 34,9% 31,6%484 8,7% 2,5% 7,9% 11,2% 31,2% 38,6%276 7,6% ,4% 8,0% 10,1% 38,8% 35,1%403 3,2% ,7% 9,2% 4,0% 45,7% 37,2%682 7,9% 1,2% 10,0% 7,6% 39,0% 34,3%750 5,7% 1,3% 9,1% 9,9% 36,0% 38,0%311 7,7% 1,0% 4,8% 11,6% 30,5% 44,4%243 6,6% 1,6% 16,0% 12,8% 29,2% 33,7%253 13,4% 1,2% 9,9% 10,7% 34,8% 30,0%257 6,2% 2,3% 12,1% 5,1% 37,0% 37,4%368 1,9% ,5% 7,1% 5,2% 50,8% 34,5%
242 11,2% 2,5% 11,6% 11,6% 31,0% 32,2%
38 7,9% 7,9% 10,5% 18,4% 23,7% 31,6%683 8,6% 1,3% 10,0% 10,4% 35,6% 34,1%465 1,7% 7,3% 4,1% 44,7% 42,2%575 9,9% 1,7% 11,8% 10,8% 33,4% 32,3%72 2,8% 1,4% 9,7% 1,4% 33,3% 51,4%81 19,8% 2,5% 4,9% 16,0% 29,6% 27,2%
29 10,3% 10,3% 13,8% 20,7% 44,8%
21 23,8% 38,1% 38,1%
5 20,0% 20,0% 60,0%69 4,3% 15,9% 8,7% 31,9% 39,1%74 10,8% 9,5% 48,6% 31,1%
322 ,9% ,9% 7,1% 5,0% 50,6% 35,4%65 6,2% 1,5% 7,7% 7,7% 38,5% 38,5%85 2,4% 1,2% 1,2% 9,4% 30,6% 55,3%22 4,5% 13,6% 18,2% 27,3% 36,4%2 100,0%
7 14,3% 28,6% 57,1%
1202 7,6% 1,5% 10,1% 9,6% 36,7% 34,6%146 2,7% 6,8% 5,5% 37,0% 47,9%62 1,6% 3,2% 1,6% 46,8% 46,8%21 4,8% 14,3% 9,5% 57,1% 14,3%3 33,3% 33,3% 33,3%6 50,0% 50,0%
22 4,5% 13,6% 59,1% 22,7%57 7,0% 8,8% 52,6% 31,6%
132 1,5% 11,4% 5,3% 49,2% 32,6%216 4,2% 8,3% 5,6% 44,0% 38,0%499 9,6% 1,8% 13,6% 10,0% 33,3% 31,7%118 1,7% 5,9% 14,4% 35,6% 42,4%379 9,5% 2,4% 5,3% 8,2% 31,9% 42,7%135 3,0% 7,4% 5,9% 39,3% 44,4%354 2,3% 9,6% 5,1% 47,5% 35,6%370 4,9% ,5% 13,5% 10,8% 36,2% 34,1%96 11,5% 4,2% 9,4% 12,5% 30,2% 32,3%52 15,4% 5,8% 17,3% 15,4% 26,9% 19,2%29 27,6% 3,4% 6,9% 10,3% 24,1% 27,6%37 16,2% 51,4% 32,4%
359 11,1% 2,2% 6,1% 8,6% 31,2% 40,7%584 1,2% ,2% 6,2% 4,6% 45,2% 42,6%389 3,3% ,5% 10,0% 10,0% 40,1% 36,0%242 9,1% 2,1% 13,6% 14,9% 28,9% 31,4%217 25,3% 4,6% 12,9% 11,1% 21,2% 24,9%
1432 6,8% 1,3% 9,5% 8,8% 37,4% 36,2%
SofiaRegional centerSmaller townVillage
Type of residence
MaleFemale
Gender
18-3031-4041-5051-6060+
Age
Finished bachelor, master or higherdegreeFinished collegeFinished secondary schoolFinished elementary and lower
Highest level ofeducation achieved
EmployeeOther status of employed personsBusiness ownerSelf-employed person innon-agricultural activitiesSelf-employed person in agriculturalactivitiesFamily helperRegistered as unemployedUnregistered unemployedRetired - due to ageRetired - other causesPupil, studentHousewifePerson unable to workAnother status of non workingperson
Main occupationalstatus in the present
BulgarianTurkishRomaOther
Ethnicity
No incomeLess than 100 BGN101-150 BGN151-200 BGN201-300 BGN301-500 BGNMore than 500 BGNDon't knowNA
Total household income
No incomeLess than 250 BGN251-500 BGN501-750 BGN751-1000 More than 1000 BGNDon't knowNA
Personal monthlyincome
I don't use financial servicesOneTwoThree and more
Financial servicesusage
Total
Base: Row %
My life /house areinsured for the
required amountRow %
My life /house areinsured for some
amount but in mayopinion it is lower
than requiredRow %
My life /houseneed to be
insured, but it istoo expensive
Row %
My life /house need to beinsured, but I don't believe
that the insurancecompanies will keep theircontract terms and pay
the insured amountsRow %
We don'tneed
insuranceRow %
Don't know
How do you assess your insurance policies - Life insurance
183
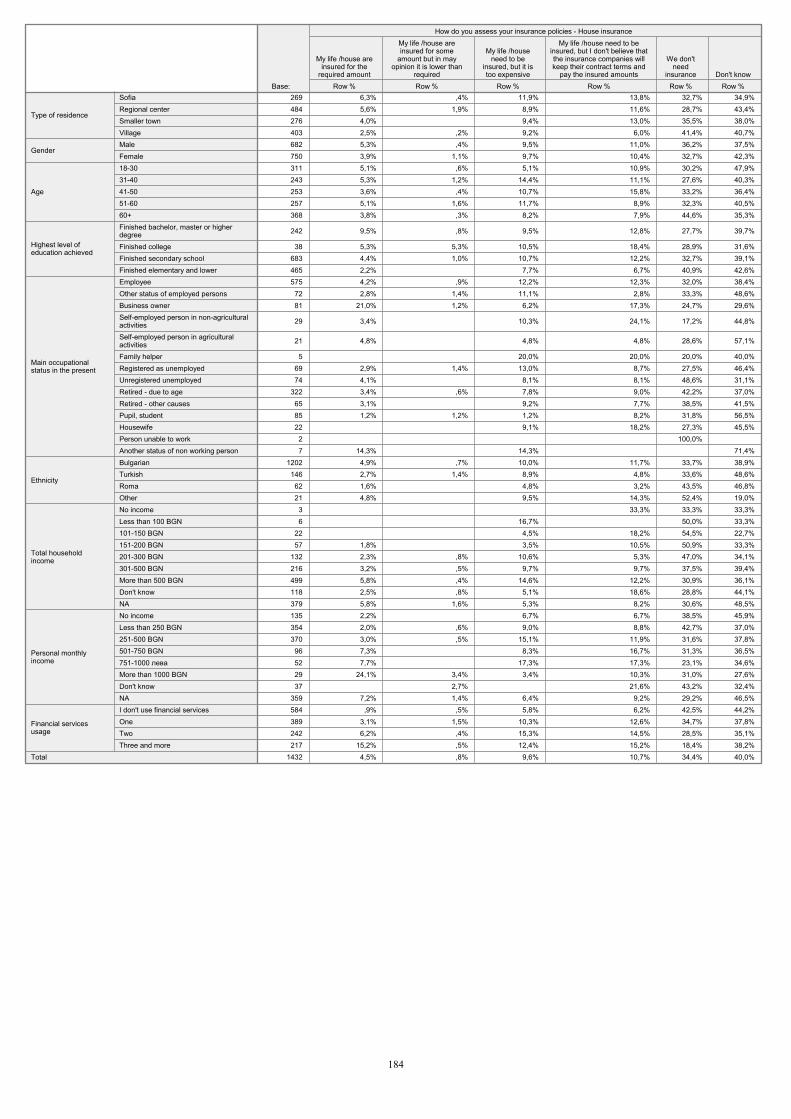
269 6,3% ,4% 11,9% 13,8% 32,7% 34,9%484 5,6% 1,9% 8,9% 11,6% 28,7% 43,4%276 4,0% 9,4% 13,0% 35,5% 38,0%403 2,5% ,2% 9,2% 6,0% 41,4% 40,7%682 5,3% ,4% 9,5% 11,0% 36,2% 37,5%750 3,9% 1,1% 9,7% 10,4% 32,7% 42,3%311 5,1% ,6% 5,1% 10,9% 30,2% 47,9%243 5,3% 1,2% 14,4% 11,1% 27,6% 40,3%253 3,6% ,4% 10,7% 15,8% 33,2% 36,4%257 5,1% 1,6% 11,7% 8,9% 32,3% 40,5%368 3,8% ,3% 8,2% 7,9% 44,6% 35,3%
242 9,5% ,8% 9,5% 12,8% 27,7% 39,7%
38 5,3% 5,3% 10,5% 18,4% 28,9% 31,6%683 4,4% 1,0% 10,7% 12,2% 32,7% 39,1%465 2,2% 7,7% 6,7% 40,9% 42,6%575 4,2% ,9% 12,2% 12,3% 32,0% 38,4%72 2,8% 1,4% 11,1% 2,8% 33,3% 48,6%81 21,0% 1,2% 6,2% 17,3% 24,7% 29,6%
29 3,4% 10,3% 24,1% 17,2% 44,8%
21 4,8% 4,8% 4,8% 28,6% 57,1%
5 20,0% 20,0% 20,0% 40,0%69 2,9% 1,4% 13,0% 8,7% 27,5% 46,4%74 4,1% 8,1% 8,1% 48,6% 31,1%
322 3,4% ,6% 7,8% 9,0% 42,2% 37,0%65 3,1% 9,2% 7,7% 38,5% 41,5%85 1,2% 1,2% 1,2% 8,2% 31,8% 56,5%22 9,1% 18,2% 27,3% 45,5%2 100,0% 7 14,3% 14,3% 71,4%
1202 4,9% ,7% 10,0% 11,7% 33,7% 38,9%146 2,7% 1,4% 8,9% 4,8% 33,6% 48,6%62 1,6% 4,8% 3,2% 43,5% 46,8%21 4,8% 9,5% 14,3% 52,4% 19,0%3 33,3% 33,3% 33,3%6 16,7% 50,0% 33,3%
22 4,5% 18,2% 54,5% 22,7%57 1,8% 3,5% 10,5% 50,9% 33,3%
132 2,3% ,8% 10,6% 5,3% 47,0% 34,1%216 3,2% ,5% 9,7% 9,7% 37,5% 39,4%499 5,8% ,4% 14,6% 12,2% 30,9% 36,1%118 2,5% ,8% 5,1% 18,6% 28,8% 44,1%379 5,8% 1,6% 5,3% 8,2% 30,6% 48,5%135 2,2% 6,7% 6,7% 38,5% 45,9%354 2,0% ,6% 9,0% 8,8% 42,7% 37,0%370 3,0% ,5% 15,1% 11,9% 31,6% 37,8%96 7,3% 8,3% 16,7% 31,3% 36,5%52 7,7% 17,3% 17,3% 23,1% 34,6%29 24,1% 3,4% 3,4% 10,3% 31,0% 27,6%37 2,7% 21,6% 43,2% 32,4%
359 7,2% 1,4% 6,4% 9,2% 29,2% 46,5%584 ,9% ,5% 5,8% 6,2% 42,5% 44,2%389 3,1% 1,5% 10,3% 12,6% 34,7% 37,8%242 6,2% ,4% 15,3% 14,5% 28,5% 35,1%217 15,2% ,5% 12,4% 15,2% 18,4% 38,2%
1432 4,5% ,8% 9,6% 10,7% 34,4% 40,0%
SofiaRegional centerSmaller townVillage
Type of residence
MaleFemale
Gender
18-3031-4041-5051-6060+
Age
Finished bachelor, master or higherdegreeFinished collegeFinished secondary schoolFinished elementary and lower
Highest level ofeducation achieved
EmployeeOther status of employed personsBusiness ownerSelf-employed person in non-agriculturalactivitiesSelf-employed person in agriculturalactivitiesFamily helperRegistered as unemployedUnregistered unemployedRetired - due to ageRetired - other causesPupil, studentHousewifePerson unable to workAnother status of non working person
Main occupationalstatus in the present
BulgarianTurkishRomaOther
Ethnicity
No incomeLess than 100 BGN101-150 BGN151-200 BGN201-300 BGN301-500 BGNMore than 500 BGNDon't knowNA
Total householdincome
No incomeLess than 250 BGN251-500 BGN501-750 BGN751-1000 More than 1000 BGNDon't knowNA
Personal monthlyincome
I don't use financial servicesOneTwoThree and more
Financial servicesusage
Total
Base: Row %
My life /house areinsured for the
required amountRow %
My life /house areinsured for some
amount but in mayopinion it is lower than
requiredRow %
My life /houseneed to be
insured, but it istoo expensive
Row %
My life /house need to beinsured, but I don't believe thatthe insurance companies willkeep their contract terms and
pay the insured amountsRow %
We don'tneed
insuranceRow %
Don't know
How do you assess your insurance policies - House insurance
184
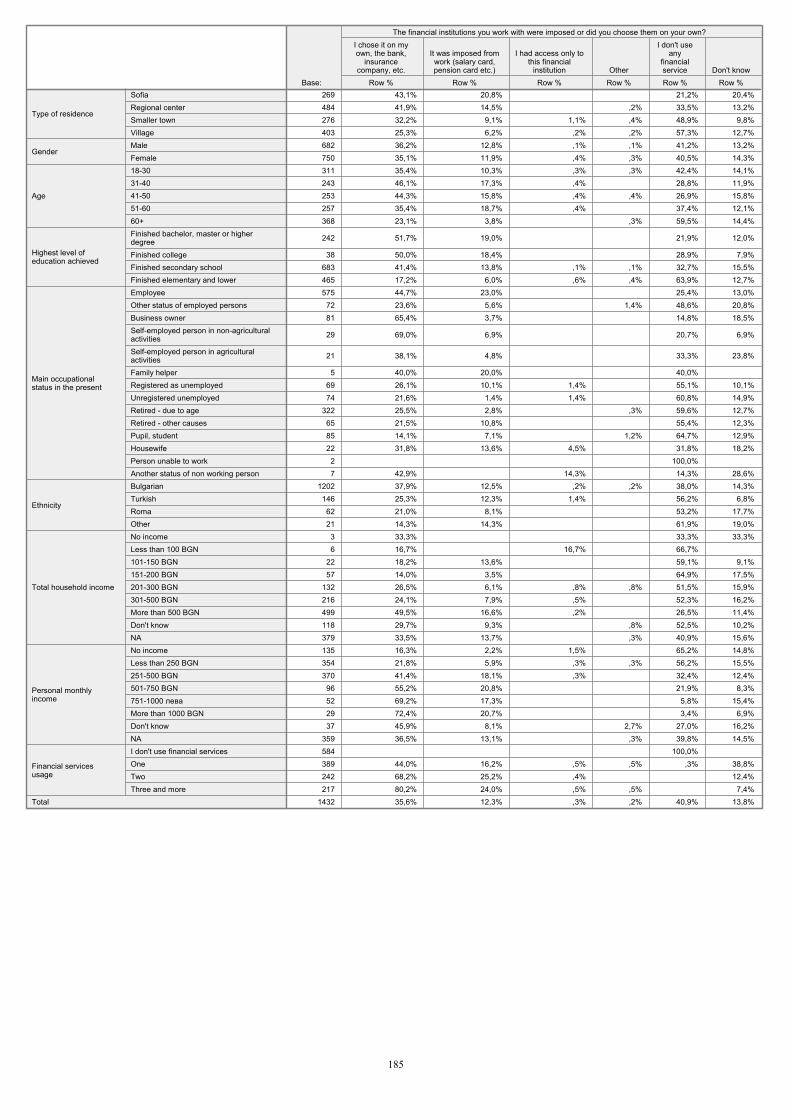
269 43,1% 20,8% 21,2% 20,4%484 41,9% 14,5% ,2% 33,5% 13,2%276 32,2% 9,1% 1,1% ,4% 48,9% 9,8%403 25,3% 6,2% ,2% ,2% 57,3% 12,7%682 36,2% 12,8% ,1% ,1% 41,2% 13,2%750 35,1% 11,9% ,4% ,3% 40,5% 14,3%311 35,4% 10,3% ,3% ,3% 42,4% 14,1%243 46,1% 17,3% ,4% 28,8% 11,9%253 44,3% 15,8% ,4% ,4% 26,9% 15,8%257 35,4% 18,7% ,4% 37,4% 12,1%368 23,1% 3,8% ,3% 59,5% 14,4%
242 51,7% 19,0% 21,9% 12,0%
38 50,0% 18,4% 28,9% 7,9%683 41,4% 13,8% ,1% ,1% 32,7% 15,5%465 17,2% 6,0% ,6% ,4% 63,9% 12,7%575 44,7% 23,0% 25,4% 13,0%
72 23,6% 5,6% 1,4% 48,6% 20,8%81 65,4% 3,7% 14,8% 18,5%
29 69,0% 6,9% 20,7% 6,9%
21 38,1% 4,8% 33,3% 23,8%
5 40,0% 20,0% 40,0% 69 26,1% 10,1% 1,4% 55,1% 10,1%74 21,6% 1,4% 1,4% 60,8% 14,9%
322 25,5% 2,8% ,3% 59,6% 12,7%65 21,5% 10,8% 55,4% 12,3%85 14,1% 7,1% 1,2% 64,7% 12,9%22 31,8% 13,6% 4,5% 31,8% 18,2%
2 100,0% 7 42,9% 14,3% 14,3% 28,6%
1202 37,9% 12,5% ,2% ,2% 38,0% 14,3%146 25,3% 12,3% 1,4% 56,2% 6,8%
62 21,0% 8,1% 53,2% 17,7%21 14,3% 14,3% 61,9% 19,0%
3 33,3% 33,3% 33,3%6 16,7% 16,7% 66,7%
22 18,2% 13,6% 59,1% 9,1%57 14,0% 3,5% 64,9% 17,5%
132 26,5% 6,1% ,8% ,8% 51,5% 15,9%216 24,1% 7,9% ,5% 52,3% 16,2%499 49,5% 16,6% ,2% 26,5% 11,4%118 29,7% 9,3% ,8% 52,5% 10,2%379 33,5% 13,7% ,3% 40,9% 15,6%135 16,3% 2,2% 1,5% 65,2% 14,8%354 21,8% 5,9% ,3% ,3% 56,2% 15,5%370 41,4% 18,1% ,3% 32,4% 12,4%
96 55,2% 20,8% 21,9% 8,3%52 69,2% 17,3% 5,8% 15,4%29 72,4% 20,7% 3,4% 6,9%37 45,9% 8,1% 2,7% 27,0% 16,2%
359 36,5% 13,1% ,3% 39,8% 14,5%584 100,0% 389 44,0% 16,2% ,5% ,5% ,3% 38,8%242 68,2% 25,2% ,4% 12,4%217 80,2% 24,0% ,5% ,5% 7,4%
1432 35,6% 12,3% ,3% ,2% 40,9% 13,8%
SofiaRegional centerSmaller townVillage
Type of residence
MaleFemale
Gender
18-3031-4041-5051-6060+
Age
Finished bachelor, master or higherdegreeFinished collegeFinished secondary schoolFinished elementary and lower
Highest level ofeducation achieved
EmployeeOther status of employed personsBusiness ownerSelf-employed person in non-agriculturalactivitiesSelf-employed person in agriculturalactivitiesFamily helperRegistered as unemployedUnregistered unemployedRetired - due to ageRetired - other causesPupil, studentHousewifePerson unable to workAnother status of non working person
Main occupationalstatus in the present
BulgarianTurkishRomaOther
Ethnicity
No incomeLess than 100 BGN101-150 BGN151-200 BGN201-300 BGN301-500 BGNMore than 500 BGNDon't knowNA
Total household income
No incomeLess than 250 BGN251-500 BGN501-750 BGN751-1000 More than 1000 BGNDon't knowNA
Personal monthlyincome
I don't use financial servicesOneTwoThree and more
Financial servicesusage
Total
Base: Row %
I chose it on myown, the bank,
insurancecompany, etc.
Row %
It was imposed fromwork (salary card,pension card etc.)
Row %
I had access only tothis financial
institutionRow %Other
Row %
I don't useany
financialservice
Row %Don't know
The financial institutions you work with were imposed or did you choose them on your own?
185
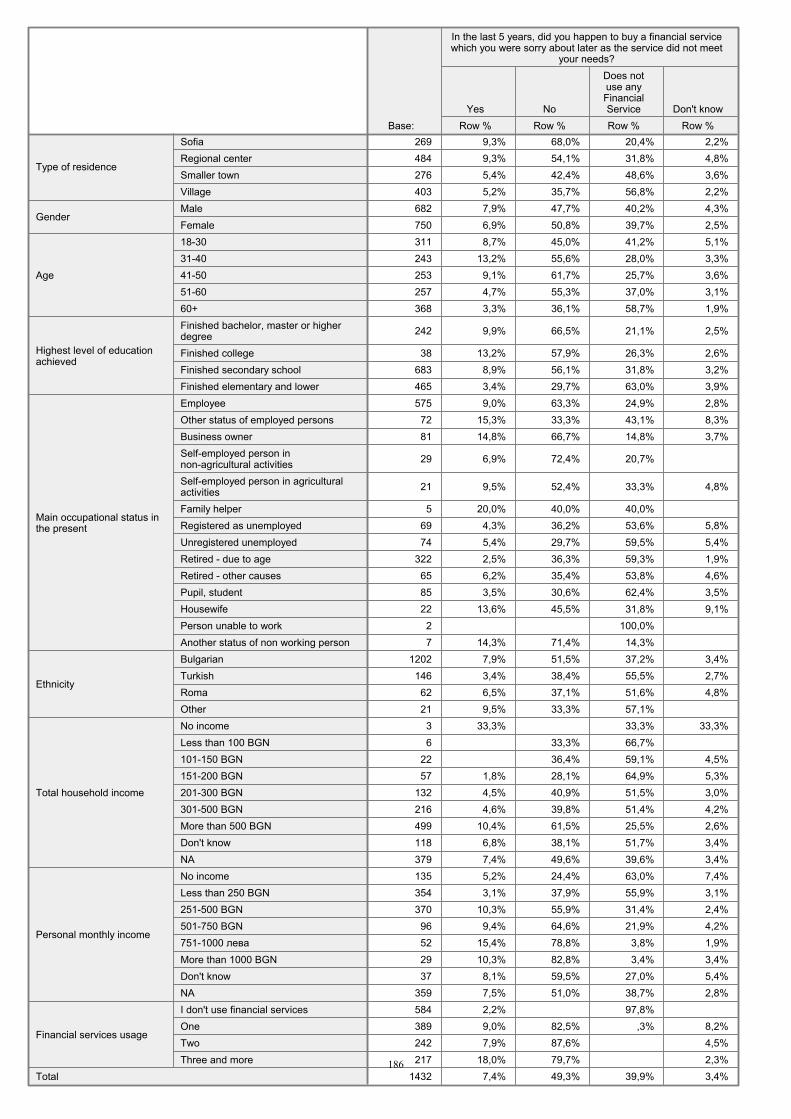
269 9,3% 68,0% 20,4% 2,2%484 9,3% 54,1% 31,8% 4,8%276 5,4% 42,4% 48,6% 3,6%403 5,2% 35,7% 56,8% 2,2%682 7,9% 47,7% 40,2% 4,3%750 6,9% 50,8% 39,7% 2,5%311 8,7% 45,0% 41,2% 5,1%243 13,2% 55,6% 28,0% 3,3%253 9,1% 61,7% 25,7% 3,6%257 4,7% 55,3% 37,0% 3,1%368 3,3% 36,1% 58,7% 1,9%
242 9,9% 66,5% 21,1% 2,5%
38 13,2% 57,9% 26,3% 2,6%683 8,9% 56,1% 31,8% 3,2%465 3,4% 29,7% 63,0% 3,9%575 9,0% 63,3% 24,9% 2,8%72 15,3% 33,3% 43,1% 8,3%81 14,8% 66,7% 14,8% 3,7%
29 6,9% 72,4% 20,7%
21 9,5% 52,4% 33,3% 4,8%
5 20,0% 40,0% 40,0% 69 4,3% 36,2% 53,6% 5,8%74 5,4% 29,7% 59,5% 5,4%
322 2,5% 36,3% 59,3% 1,9%65 6,2% 35,4% 53,8% 4,6%85 3,5% 30,6% 62,4% 3,5%22 13,6% 45,5% 31,8% 9,1%2 100,0% 7 14,3% 71,4% 14,3%
1202 7,9% 51,5% 37,2% 3,4%146 3,4% 38,4% 55,5% 2,7%62 6,5% 37,1% 51,6% 4,8%21 9,5% 33,3% 57,1% 3 33,3% 33,3% 33,3%6 33,3% 66,7%
22 36,4% 59,1% 4,5%57 1,8% 28,1% 64,9% 5,3%
132 4,5% 40,9% 51,5% 3,0%216 4,6% 39,8% 51,4% 4,2%499 10,4% 61,5% 25,5% 2,6%118 6,8% 38,1% 51,7% 3,4%379 7,4% 49,6% 39,6% 3,4%135 5,2% 24,4% 63,0% 7,4%354 3,1% 37,9% 55,9% 3,1%370 10,3% 55,9% 31,4% 2,4%96 9,4% 64,6% 21,9% 4,2%52 15,4% 78,8% 3,8% 1,9%29 10,3% 82,8% 3,4% 3,4%37 8,1% 59,5% 27,0% 5,4%
359 7,5% 51,0% 38,7% 2,8%584 2,2% 97,8% 389 9,0% 82,5% ,3% 8,2%242 7,9% 87,6% 4,5%217 18,0% 79,7% 2,3%
1432 7,4% 49,3% 39,9% 3,4%
SofiaRegional centerSmaller townVillage
Type of residence
MaleFemale
Gender
18-3031-4041-5051-6060+
Age
Finished bachelor, master or higherdegreeFinished collegeFinished secondary schoolFinished elementary and lower
Highest level of educationachieved
EmployeeOther status of employed personsBusiness ownerSelf-employed person innon-agricultural activitiesSelf-employed person in agriculturalactivitiesFamily helperRegistered as unemployedUnregistered unemployedRetired - due to ageRetired - other causesPupil, studentHousewifePerson unable to workAnother status of non working person
Main occupational status inthe present
BulgarianTurkishRomaOther
Ethnicity
No incomeLess than 100 BGN101-150 BGN151-200 BGN201-300 BGN301-500 BGNMore than 500 BGNDon't knowNA
Total household income
No incomeLess than 250 BGN251-500 BGN501-750 BGN751-1000 More than 1000 BGNDon't knowNA
Personal monthly income
I don't use financial servicesOneTwoThree and more
Financial services usage
Total
Base: Row %Yes
Row %No
Row %
Does notuse anyFinancialService
Row %Don't know
In the last 5 years, did you happen to buy a financial servicewhich you were sorry about later as the service did not meet
your needs?
186
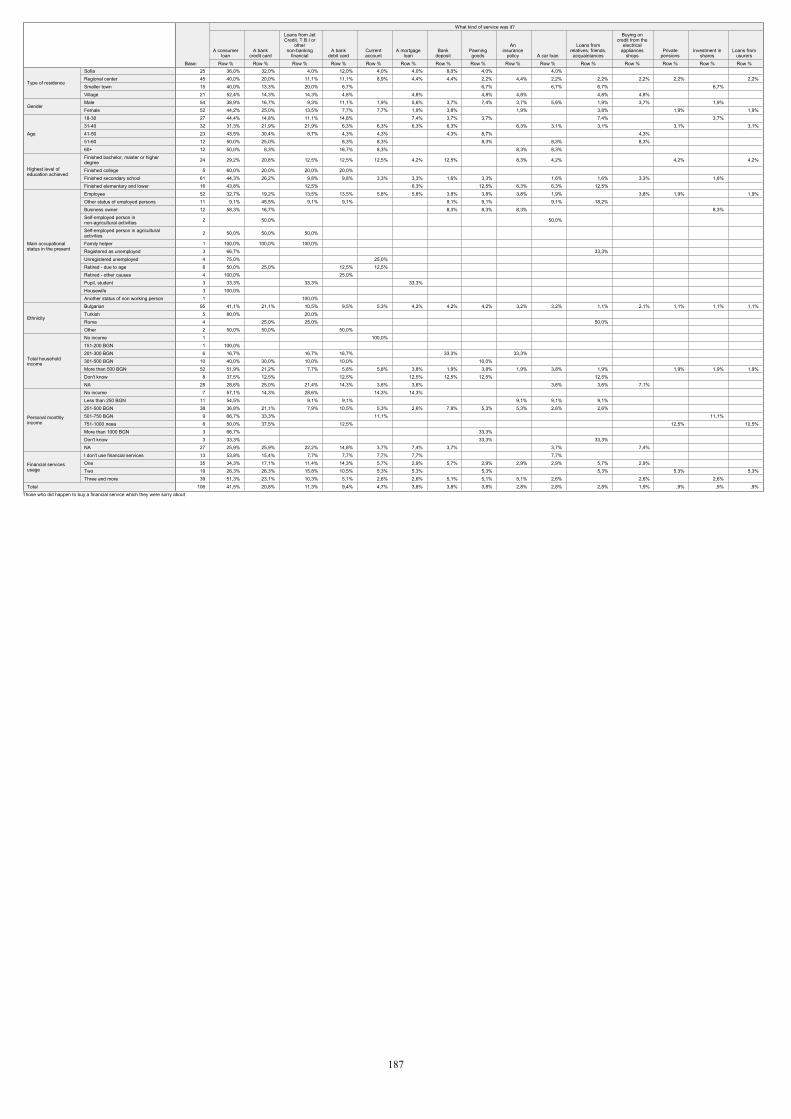
25 36,0% 32,0% 4,0% 12,0% 4,0% 4,0% 8,0% 4,0% 4,0% 45 40,0% 20,0% 11,1% 11,1% 8,9% 4,4% 4,4% 2,2% 4,4% 2,2% 2,2% 2,2% 2,2% 2,2%15 40,0% 13,3% 20,0% 6,7% 6,7% 6,7% 6,7% 6,7% 21 52,4% 14,3% 14,3% 4,8% 4,8% 4,8% 4,8% 4,8% 4,8% 54 38,9% 16,7% 9,3% 11,1% 1,9% 5,6% 3,7% 7,4% 3,7% 5,6% 1,9% 3,7% 1,9% 52 44,2% 25,0% 13,5% 7,7% 7,7% 1,9% 3,8% 1,9% 3,8% 1,9% 1,9%27 44,4% 14,8% 11,1% 14,8% 7,4% 3,7% 3,7% 7,4% 3,7% 32 31,3% 21,9% 21,9% 6,3% 6,3% 6,3% 6,3% 6,3% 3,1% 3,1% 3,1% 3,1%23 43,5% 30,4% 8,7% 4,3% 4,3% 4,3% 8,7% 4,3% 12 50,0% 25,0% 8,3% 8,3% 8,3% 8,3% 8,3% 12 50,0% 8,3% 16,7% 8,3% 8,3% 8,3%
24 29,2% 20,8% 12,5% 12,5% 12,5% 4,2% 12,5% 8,3% 4,2% 4,2% 4,2%
5 60,0% 20,0% 20,0% 20,0% 61 44,3% 26,2% 9,8% 9,8% 3,3% 3,3% 1,6% 3,3% 1,6% 1,6% 3,3% 1,6% 16 43,8% 12,5% 6,3% 12,5% 6,3% 6,3% 12,5% 52 32,7% 19,2% 13,5% 13,5% 5,8% 5,8% 3,8% 3,8% 3,8% 1,9% 3,8% 1,9% 1,9%11 9,1% 45,5% 9,1% 9,1% 9,1% 9,1% 9,1% 18,2% 12 58,3% 16,7% 8,3% 8,3% 8,3% 8,3%
2 50,0% 50,0%
2 50,0% 50,0% 50,0%
1 100,0% 100,0% 100,0% 3 66,7% 33,3% 4 75,0% 25,0% 8 50,0% 25,0% 12,5% 12,5% 4 100,0% 25,0% 3 33,3% 33,3% 33,3% 3 100,0% 1 100,0%
95 41,1% 21,1% 10,5% 9,5% 5,3% 4,2% 4,2% 4,2% 3,2% 3,2% 1,1% 2,1% 1,1% 1,1% 1,1%5 80,0% 20,0% 4 25,0% 25,0% 50,0% 2 50,0% 50,0% 50,0% 1 100,0% 1 100,0% 6 16,7% 16,7% 16,7% 33,3% 33,3%
10 40,0% 30,0% 10,0% 10,0% 10,0% 52 51,9% 21,2% 7,7% 5,8% 5,8% 3,8% 1,9% 3,8% 1,9% 3,8% 1,9% 1,9% 1,9% 1,9%8 37,5% 12,5% 12,5% 12,5% 12,5% 12,5% 12,5%
28 28,6% 25,0% 21,4% 14,3% 3,6% 3,6% 3,6% 3,6% 7,1% 7 57,1% 14,3% 28,6% 14,3% 14,3%
11 54,5% 9,1% 9,1% 9,1% 9,1% 9,1% 38 36,8% 21,1% 7,9% 10,5% 5,3% 2,6% 7,9% 5,3% 5,3% 2,6% 2,6% 9 66,7% 33,3% 11,1% 11,1% 8 50,0% 37,5% 12,5% 12,5% 12,5%3 66,7% 33,3% 3 33,3% 33,3% 33,3%
27 25,9% 25,9% 22,2% 14,8% 3,7% 7,4% 3,7% 3,7% 7,4% 13 53,8% 15,4% 7,7% 7,7% 7,7% 7,7% 7,7% 35 34,3% 17,1% 11,4% 14,3% 5,7% 2,9% 5,7% 2,9% 2,9% 2,9% 5,7% 2,9% 19 26,3% 26,3% 15,8% 10,5% 5,3% 5,3% 5,3% 5,3% 5,3% 5,3%39 51,3% 23,1% 10,3% 5,1% 2,6% 2,6% 5,1% 5,1% 5,1% 2,6% 2,6% 2,6%
106 41,5% 20,8% 11,3% 9,4% 4,7% 3,8% 3,8% 3,8% 2,8% 2,8% 2,8% 1,9% ,9% ,9% ,9%
SofiaRegional centerSmaller townVillage
Type of residence
MaleFemale
Gender
18-3031-4041-5051-6060+
Age
Finished bachelor, master or higherdegreeFinished collegeFinished secondary schoolFinished elementary and lower
Highest level ofeducation achieved
EmployeeOther status of employed personsBusiness ownerSelf-employed person innon-agricultural activitiesSelf-employed person in agriculturalactivitiesFamily helperRegistered as unemployedUnregistered unemployedRetired - due to ageRetired - other causesPupil, studentHousewifeAnother status of non working person
Main occupationalstatus in the present
BulgarianTurkishRomaOther
Ethnicity
No income151-200 BGN201-300 BGN301-500 BGNMore than 500 BGNDon't knowNA
Total householdincome
No incomeLess than 250 BGN251-500 BGN501-750 BGN751-1000 More than 1000 BGNDon't knowNA
Personal monthlyincome
I don't use financial servicesOneTwoThree and more
Financial servicesusage
Total
Base: Row %
A consumerloan
Row %
A bankcredit card
Row %
Loans from JetCredit, T.B.I or
othernon-banking
financialRow %
A bankdebit card
Row %
Currentaccount
Row %
A mortgageloan
Row %
Bankdeposit
Row %
Pawninggoods
Row %
Aninsurance
policyRow %
A car loanRow %
Loans fromrelatives, friends,
acquaintancesRow %
Buying oncredit from the
electricalappliances
shopsRow %
Privatepensions
Row %
Investment inshares
Row %
Loans fromusurers
What kind of service was it?
Those who did happen to buy a financial service which they were sorry about
187
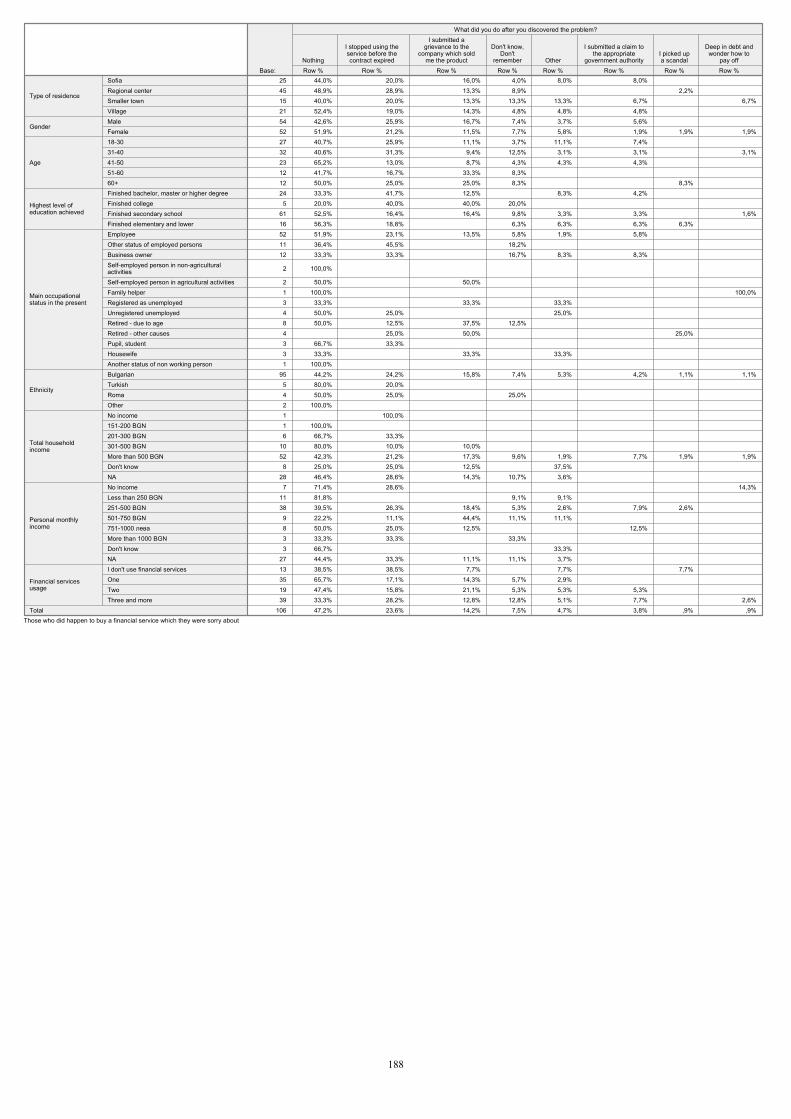
25 44,0% 20,0% 16,0% 4,0% 8,0% 8,0% 45 48,9% 28,9% 13,3% 8,9% 2,2% 15 40,0% 20,0% 13,3% 13,3% 13,3% 6,7% 6,7%21 52,4% 19,0% 14,3% 4,8% 4,8% 4,8% 54 42,6% 25,9% 16,7% 7,4% 3,7% 5,6% 52 51,9% 21,2% 11,5% 7,7% 5,8% 1,9% 1,9% 1,9%27 40,7% 25,9% 11,1% 3,7% 11,1% 7,4% 32 40,6% 31,3% 9,4% 12,5% 3,1% 3,1% 3,1%23 65,2% 13,0% 8,7% 4,3% 4,3% 4,3% 12 41,7% 16,7% 33,3% 8,3% 12 50,0% 25,0% 25,0% 8,3% 8,3% 24 33,3% 41,7% 12,5% 8,3% 4,2%
5 20,0% 40,0% 40,0% 20,0% 61 52,5% 16,4% 16,4% 9,8% 3,3% 3,3% 1,6%16 56,3% 18,8% 6,3% 6,3% 6,3% 6,3% 52 51,9% 23,1% 13,5% 5,8% 1,9% 5,8% 11 36,4% 45,5% 18,2% 12 33,3% 33,3% 16,7% 8,3% 8,3%
2 100,0%
2 50,0% 50,0% 1 100,0% 100,0%3 33,3% 33,3% 33,3% 4 50,0% 25,0% 25,0% 8 50,0% 12,5% 37,5% 12,5% 4 25,0% 50,0% 25,0% 3 66,7% 33,3% 3 33,3% 33,3% 33,3% 1 100,0%
95 44,2% 24,2% 15,8% 7,4% 5,3% 4,2% 1,1% 1,1%5 80,0% 20,0% 4 50,0% 25,0% 25,0% 2 100,0% 1 100,0% 1 100,0% 6 66,7% 33,3%
10 80,0% 10,0% 10,0% 52 42,3% 21,2% 17,3% 9,6% 1,9% 7,7% 1,9% 1,9%
8 25,0% 25,0% 12,5% 37,5% 28 46,4% 28,6% 14,3% 10,7% 3,6%
7 71,4% 28,6% 14,3%11 81,8% 9,1% 9,1% 38 39,5% 26,3% 18,4% 5,3% 2,6% 7,9% 2,6%
9 22,2% 11,1% 44,4% 11,1% 11,1% 8 50,0% 25,0% 12,5% 12,5% 3 33,3% 33,3% 33,3% 3 66,7% 33,3%
27 44,4% 33,3% 11,1% 11,1% 3,7% 13 38,5% 38,5% 7,7% 7,7% 7,7% 35 65,7% 17,1% 14,3% 5,7% 2,9% 19 47,4% 15,8% 21,1% 5,3% 5,3% 5,3% 39 33,3% 28,2% 12,8% 12,8% 5,1% 7,7% 2,6%
106 47,2% 23,6% 14,2% 7,5% 4,7% 3,8% ,9% ,9%
SofiaRegional centerSmaller townVillage
Type of residence
MaleFemale
Gender
18-3031-4041-5051-6060+
Age
Finished bachelor, master or higher degreeFinished collegeFinished secondary schoolFinished elementary and lower
Highest level ofeducation achieved
EmployeeOther status of employed personsBusiness ownerSelf-employed person in non-agriculturalactivitiesSelf-employed person in agricultural activitiesFamily helperRegistered as unemployedUnregistered unemployedRetired - due to ageRetired - other causesPupil, studentHousewifeAnother status of non working person
Main occupationalstatus in the present
BulgarianTurkishRomaOther
Ethnicity
No income151-200 BGN201-300 BGN301-500 BGNMore than 500 BGNDon't knowNA
Total householdincome
No incomeLess than 250 BGN251-500 BGN501-750 BGN751-1000 More than 1000 BGNDon't knowNA
Personal monthlyincome
I don't use financial servicesOneTwoThree and more
Financial servicesusage
Total
Base: Row %Nothing
Row %
I stopped using theservice before thecontract expired
Row %
I submitted agrievance to the
company which soldme the product
Row %
Don't know,Don't
rememberRow %Other
Row %
I submitted a claim tothe appropriate
government authorityRow %
I picked upa scandal
Row %
Deep in debt andwonder how to
pay off
What did you do after you discovered the problem?
Those who did happen to buy a financial service which they were sorry about
188
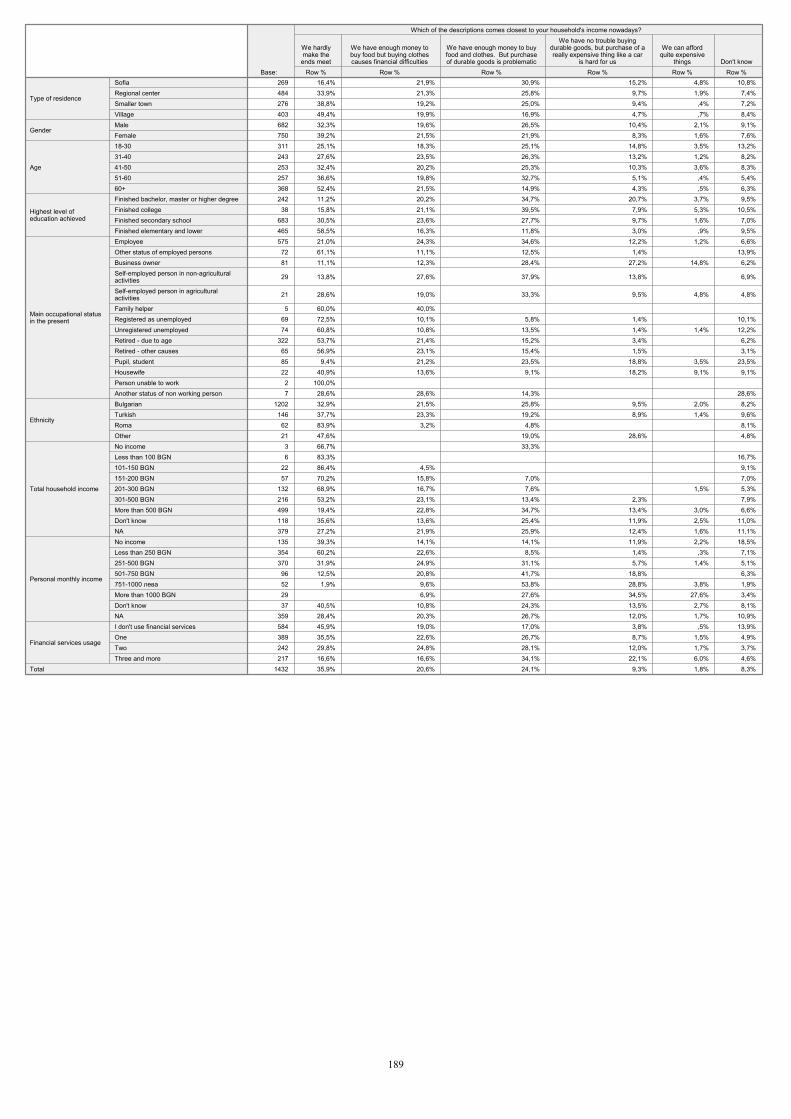
269 16,4% 21,9% 30,9% 15,2% 4,8% 10,8%484 33,9% 21,3% 25,8% 9,7% 1,9% 7,4%276 38,8% 19,2% 25,0% 9,4% ,4% 7,2%403 49,4% 19,9% 16,9% 4,7% ,7% 8,4%682 32,3% 19,6% 26,5% 10,4% 2,1% 9,1%750 39,2% 21,5% 21,9% 8,3% 1,6% 7,6%311 25,1% 18,3% 25,1% 14,8% 3,5% 13,2%243 27,6% 23,5% 26,3% 13,2% 1,2% 8,2%253 32,4% 20,2% 25,3% 10,3% 3,6% 8,3%257 36,6% 19,8% 32,7% 5,1% ,4% 5,4%368 52,4% 21,5% 14,9% 4,3% ,5% 6,3%242 11,2% 20,2% 34,7% 20,7% 3,7% 9,5%38 15,8% 21,1% 39,5% 7,9% 5,3% 10,5%
683 30,5% 23,6% 27,7% 9,7% 1,6% 7,0%465 58,5% 16,3% 11,8% 3,0% ,9% 9,5%575 21,0% 24,3% 34,6% 12,2% 1,2% 6,6%72 61,1% 11,1% 12,5% 1,4% 13,9%81 11,1% 12,3% 28,4% 27,2% 14,8% 6,2%
29 13,8% 27,6% 37,9% 13,8% 6,9%
21 28,6% 19,0% 33,3% 9,5% 4,8% 4,8%
5 60,0% 40,0% 69 72,5% 10,1% 5,8% 1,4% 10,1%74 60,8% 10,8% 13,5% 1,4% 1,4% 12,2%
322 53,7% 21,4% 15,2% 3,4% 6,2%65 56,9% 23,1% 15,4% 1,5% 3,1%85 9,4% 21,2% 23,5% 18,8% 3,5% 23,5%22 40,9% 13,6% 9,1% 18,2% 9,1% 9,1%2 100,0% 7 28,6% 28,6% 14,3% 28,6%
1202 32,9% 21,5% 25,8% 9,5% 2,0% 8,2%146 37,7% 23,3% 19,2% 8,9% 1,4% 9,6%62 83,9% 3,2% 4,8% 8,1%21 47,6% 19,0% 28,6% 4,8%3 66,7% 33,3% 6 83,3% 16,7%
22 86,4% 4,5% 9,1%57 70,2% 15,8% 7,0% 7,0%
132 68,9% 16,7% 7,6% 1,5% 5,3%216 53,2% 23,1% 13,4% 2,3% 7,9%499 19,4% 22,8% 34,7% 13,4% 3,0% 6,6%118 35,6% 13,6% 25,4% 11,9% 2,5% 11,0%379 27,2% 21,9% 25,9% 12,4% 1,6% 11,1%135 39,3% 14,1% 14,1% 11,9% 2,2% 18,5%354 60,2% 22,6% 8,5% 1,4% ,3% 7,1%370 31,9% 24,9% 31,1% 5,7% 1,4% 5,1%96 12,5% 20,8% 41,7% 18,8% 6,3%52 1,9% 9,6% 53,8% 28,8% 3,8% 1,9%29 6,9% 27,6% 34,5% 27,6% 3,4%37 40,5% 10,8% 24,3% 13,5% 2,7% 8,1%
359 28,4% 20,3% 26,7% 12,0% 1,7% 10,9%584 45,9% 19,0% 17,0% 3,8% ,5% 13,9%389 35,5% 22,6% 26,7% 8,7% 1,5% 4,9%242 29,8% 24,8% 28,1% 12,0% 1,7% 3,7%217 16,6% 16,6% 34,1% 22,1% 6,0% 4,6%
1432 35,9% 20,6% 24,1% 9,3% 1,8% 8,3%
SofiaRegional centerSmaller townVillage
Type of residence
MaleFemale
Gender
18-3031-4041-5051-6060+
Age
Finished bachelor, master or higher degreeFinished collegeFinished secondary schoolFinished elementary and lower
Highest level ofeducation achieved
EmployeeOther status of employed personsBusiness ownerSelf-employed person in non-agriculturalactivitiesSelf-employed person in agriculturalactivitiesFamily helperRegistered as unemployedUnregistered unemployedRetired - due to ageRetired - other causesPupil, studentHousewifePerson unable to workAnother status of non working person
Main occupational statusin the present
BulgarianTurkishRomaOther
Ethnicity
No incomeLess than 100 BGN101-150 BGN151-200 BGN201-300 BGN301-500 BGNMore than 500 BGNDon't knowNA
Total household income
No incomeLess than 250 BGN251-500 BGN501-750 BGN751-1000 More than 1000 BGNDon't knowNA
Personal monthly income
I don't use financial servicesOneTwoThree and more
Financial services usage
Total
Base: Row %
We hardlymake the
ends meetRow %
We have enough money tobuy food but buying clothescauses financial difficulties
Row %
We have enough money to buyfood and clothes. But purchaseof durable goods is problematic
Row %
We have no trouble buyingdurable goods, but purchase of areally expensive thing like a car
is hard for usRow %
We can affordquite expensive
thingsRow %
Don't know
Which of the descriptions comes closest to your household's income nowadays?
189
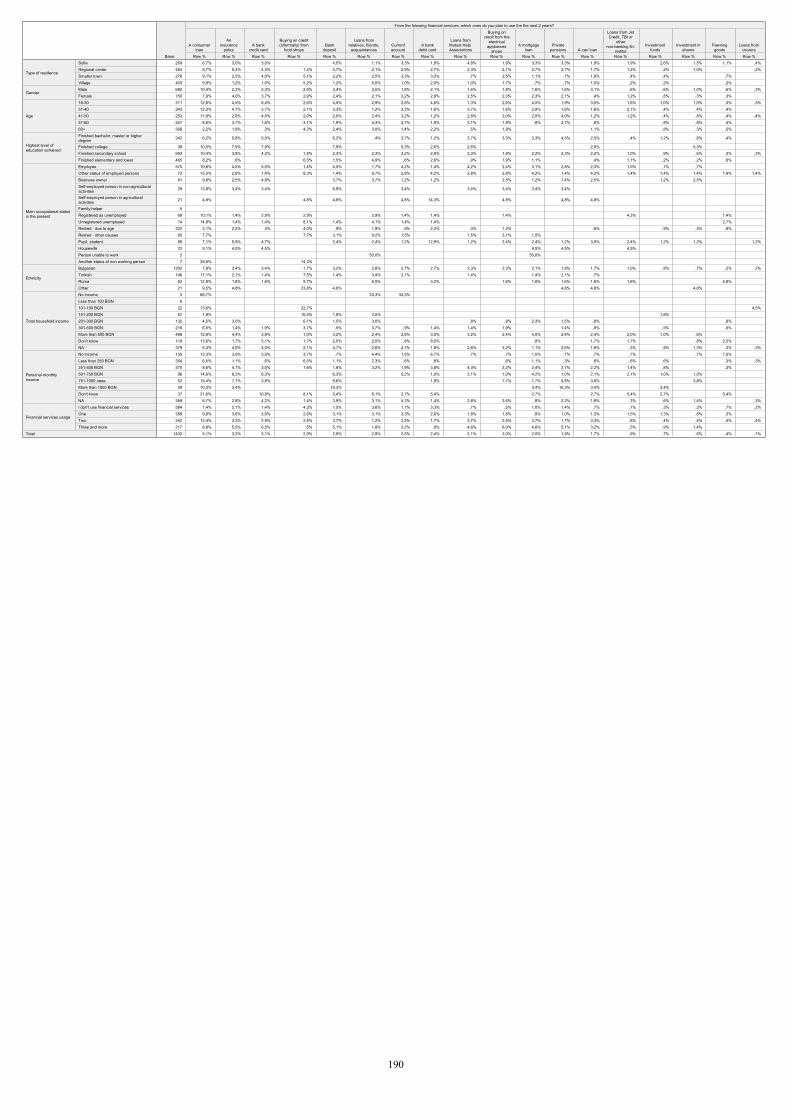
269 6,7% 3,0% 3,0% 4,5% 1,1% 3,3% 1,9% 4,8% 1,9% 3,3% 3,3% 1,9% 1,9% 2,6% 1,5% 1,1% ,4%484 9,7% 5,4% 4,3% 1,4% 3,7% 2,1% 2,9% 2,7% 2,3% 2,1% 2,7% 2,7% 1,7% 1,2% ,2% 1,0% ,2%276 9,1% 2,5% 4,0% 5,1% 2,2% 2,5% 3,3% 3,3% ,7% 2,5% 1,1% ,7% 1,8% ,4% ,4% ,7% 403 9,9% 1,2% 1,0% 5,2% 1,2% 5,0% 1,0% 2,0% 1,0% 1,7% ,7% ,7% 1,5% ,2% ,2% ,2% 682 10,4% 2,3% 2,3% 2,9% 3,4% 3,5% 1,8% 2,1% 1,6% 1,8% 1,6% 1,6% 3,1% ,6% ,6% 1,0% ,6% ,3%750 7,9% 4,0% 3,7% 2,9% 2,4% 2,1% 3,2% 2,8% 2,5% 2,3% 2,3% 2,1% ,4% 1,2% ,8% ,3% ,3% 311 12,9% 4,5% 6,4% 2,6% 4,5% 2,9% 2,6% 4,8% 1,3% 2,6% 4,5% 1,9% 3,5% 1,6% 1,0% 1,0% ,3% ,3%243 12,3% 4,1% 3,7% 2,1% 3,3% 1,2% 3,3% 1,6% 3,7% 1,6% 2,9% 1,6% 1,6% 2,1% ,4% ,4% ,4% 253 11,9% 2,8% 4,0% 2,0% 2,0% 2,4% 3,2% 1,2% 2,8% 2,0% 2,0% 4,0% 1,2% 1,2% ,4% ,8% ,4% ,4%257 8,6% 3,1% 1,6% 3,1% 1,9% 4,3% 2,7% 1,9% 3,1% 1,9% ,8% 2,7% ,8% ,8% ,8% ,4% 368 2,2% 1,9% ,3% 4,3% 2,4% 3,0% 1,4% 2,2% ,5% 1,9% 1,1% ,8% ,3% ,5%
242 6,2% 5,8% 5,0% 6,2% ,4% 3,7% 1,2% 3,7% 3,3% 3,3% 4,5% 2,5% ,4% 1,2% ,8% ,4%
38 10,5% 7,9% 7,9% 7,9% 5,3% 2,6% 2,6% 2,6% 5,3% 683 10,4% 3,8% 4,2% 1,8% 2,3% 2,3% 3,2% 2,8% 2,3% 1,8% 2,2% 2,3% 2,2% 1,0% ,9% ,6% ,3% ,3%465 8,2% ,6% 6,5% 1,5% 4,9% ,6% 2,6% ,9% 1,9% 1,1% ,4% 1,1% ,2% ,2% ,6% 575 10,8% 4,5% 5,0% 1,4% 4,5% 1,7% 4,2% 1,4% 4,2% 2,4% 3,1% 2,8% 2,3% 1,0% ,7% ,7% 72 15,3% 2,8% 1,4% 8,3% 1,4% 9,7% 2,8% 4,2% 2,8% 2,8% 4,2% 1,4% 4,2% 1,4% 1,4% 1,4% 1,4% 1,4%81 9,9% 2,5% 4,9% 3,7% 3,7% 1,2% 1,2% 2,5% 1,2% 7,4% 2,5% 1,2% 2,5%
29 13,8% 3,4% 3,4% 6,9% 3,4% 3,4% 3,4% 3,4% 3,4%
21 4,8% 4,8% 4,8% 4,8% 14,3% 4,8% 4,8% 4,8%
5 69 10,1% 1,4% 2,9% 2,9% 2,9% 1,4% 1,4% 1,4% 4,3% 1,4% 74 14,9% 1,4% 1,4% 8,1% 1,4% 4,1% 1,4% 1,4% 2,7%
322 3,1% 2,2% ,3% 4,0% ,9% 1,9% ,9% 2,2% ,3% 1,2% ,6% ,9% ,3% ,6% 65 7,7% 7,7% 3,1% 9,2% 1,5% 1,5% 3,1% 1,5% 85 7,1% 5,9% 4,7% 2,4% 2,4% 1,2% 12,9% 1,2% 2,4% 2,4% 1,2% 3,5% 2,4% 1,2% 1,2% 1,2%22 9,1% 4,5% 4,5% 4,5% 4,5% 4,5% 2 50,0% 50,0% 7 28,6% 14,3%
1202 7,8% 3,4% 3,4% 1,7% 3,2% 2,6% 2,7% 2,7% 2,3% 2,3% 2,1% 1,8% 1,7% 1,0% ,8% ,7% ,2% ,2%146 17,1% 2,1% 1,4% 7,5% 1,4% 3,4% 2,1% 1,4% 1,4% 2,1% ,7% 62 12,9% 1,6% 1,6% 9,7% 6,5% 3,2% 1,6% 1,6% 1,6% 1,6% 1,6% 4,8% 21 9,5% 4,8% 23,8% 4,8% 4,8% 4,8% 4,8% 3 66,7% 33,3% 33,3% 6
22 13,6% 22,7% 4,5%57 1,8% 10,5% 1,8% 3,5% 1,8%
132 4,5% 3,0% 6,1% 1,5% 3,0% ,8% ,8% 2,3% 1,5% ,8% ,8% 216 6,5% 1,4% 1,9% 3,7% ,5% 3,7% ,9% 1,4% 1,4% 1,9% 1,4% ,9% ,5% ,5% 499 12,8% 4,4% 3,8% 1,0% 3,2% 2,4% 2,8% 3,0% 3,2% 2,4% 4,0% 2,4% 2,4% 2,0% 1,0% ,6% 118 13,6% 1,7% 5,1% 1,7% 2,5% 2,5% ,8% 8,5% ,8% 1,7% 1,7% ,8% 2,5% 379 6,3% 4,0% 4,0% 2,1% 4,7% 2,6% 4,7% 1,8% 2,6% 3,2% 1,1% 2,6% 1,8% ,3% ,8% 1,3% ,3% ,3%135 13,3% 3,0% 3,0% 3,7% ,7% 4,4% 1,5% 6,7% ,7% ,7% 1,5% ,7% ,7% ,7% ,7% 1,5% 354 6,5% 1,1% ,6% 6,5% 1,1% 2,3% ,6% ,8% ,6% 1,1% ,3% ,6% ,6% ,6% ,3% ,3%370 8,6% 4,1% 3,0% 1,6% 1,6% 3,2% 1,9% 3,8% 4,3% 2,2% 2,4% 2,7% 2,2% 1,4% ,8% ,3% 96 14,6% 8,3% 6,3% 6,3% 5,2% 1,0% 3,1% 1,0% 4,2% 1,0% 2,1% 2,1% 1,0% 1,0% 52 15,4% 7,7% 3,8% 9,6% 1,9% 7,7% 7,7% 5,8% 3,8% 3,8% 29 10,3% 3,4% 10,3% 3,4% 10,3% 3,4% 3,4% 37 21,6% 10,8% 8,1% 5,4% 8,1% 2,7% 5,4% 2,7% 2,7% 5,4% 2,7% 5,4%
359 6,7% 2,8% 4,2% 1,4% 3,9% 3,1% 5,3% 1,4% 2,8% 3,6% ,8% 2,2% 1,9% ,3% ,6% 1,4% ,3%584 7,4% 2,1% 1,4% 4,3% 1,5% 3,6% 1,7% 3,3% ,7% ,5% 1,0% 1,4% ,7% ,7% ,3% ,3% ,7% ,2%389 9,8% 3,6% 3,9% 2,6% 3,1% 3,1% 3,3% 2,6% 1,8% 1,8% ,8% 1,0% 1,3% 1,5% 1,3% ,8% ,3% 242 12,4% 3,3% 2,9% 2,5% 3,7% 1,2% 2,5% 1,7% 3,7% 2,5% 3,7% 1,7% 3,3% ,8% ,4% ,4% ,4% ,4%217 8,8% 5,5% 6,5% ,5% 5,1% 1,8% 3,2% ,9% 4,6% 6,0% 4,6% 5,1% 3,2% ,5% ,9% 1,4%
1432 9,1% 3,2% 3,1% 2,9% 2,9% 2,8% 2,5% 2,4% 2,1% 2,0% 2,0% 1,9% 1,7% ,9% ,7% ,6% ,4% ,1%
SofiaRegional centerSmaller townVillage
Type of residence
MaleFemale
Gender
18-3031-4041-5051-6060+
Age
Finished bachelor, master or higherdegreeFinished collegeFinished secondary schoolFinished elementary and lower
Highest level ofeducation achieved
EmployeeOther status of employed personsBusiness ownerSelf-employed person in non-agriculturalactivitiesSelf-employed person in agriculturalactivitiesFamily helperRegistered as unemployedUnregistered unemployedRetired - due to ageRetired - other causesPupil, studentHousewifePerson unable to workAnother status of non working person
Main occupational statusin the present
BulgarianTurkishRomaOther
Ethnicity
No incomeLess than 100 BGN101-150 BGN151-200 BGN201-300 BGN301-500 BGNMore than 500 BGNDon't knowNA
Total household income
No incomeLess than 250 BGN251-500 BGN501-750 BGN751-1000 More than 1000 BGNDon't knowNA
Personal monthlyincome
I don't use financial servicesOneTwoThree and more
Financial services usage
Total
Base: Row %
A consumerloan
Row %
Aninsurance
policyRow %
A bankcredit card
Row %
Buying on credit(informally) from
food shopsRow %
Bankdeposit
Row %
Loans fromrelatives, friends,acquaintances
Row %
Currentaccount
Row %
A bankdebit card
Row %
Loans fromMutual Help Associations
Row %
Buying oncredit from the
electricalappliances
shopsRow %
A mortgageloan
Row %
Privatepensions
Row %A car/ loan
Row %
Loans from JetCredit, TBI or
othernon-banking fin.
institutRow %
Investmentfunds
Row %
Investment inshares
Row %
Pawninggoods
Row %
Loans fromusurers
From the folowing financial services, which ones do you plan to use the the next 2 years?
190