Embed Size (px)
Citation preview
1
BIS RESEARCH PAPER NUMBER 81
The 2011 Skills for Life Survey: A Survey of Literacy, Numeracy and ICT Levels in England
DECEMBER 2012

The 2011 Skills for Life Survey: a Survey of Literacy, Numeracy, and ICT Levels in England
2
Views expressed in this report are those of the authors and not necessarily those of the Department for Business Innovation and Skills or any other Government Department
Department for Business, Innovation and Skills
1 Victoria Street
London, SW1H 0ET
www.BIS.gov.uk
BIS Research paper number 81
November 2012

The 2011 Skills for Life Survey: a Survey of Literacy, Numeracy, and ICT Levels in England
i
Table of Contents Table of Contents ....................................................................................................................................... i
List of Figures ..........................................................................................................................................xii
List of Tables............................................................................................................................................xv
Glossary of Terms ................................................................................................................................xxiii
Report Authors and Acknowledgements ...........................................................................................xxix
1 Summary of Findings ....................................................................................................................1
1.1 The Skills for Life 2011 Survey ....................................................................................................1
1.2 Profile of the population of 16-65 year-olds in 2011.....................................................................1
1.3 Distribution of skills ......................................................................................................................2
1.4 Skills levels by demographic characteristics ................................................................................4
1.5 Personal characteristics associated with weak skills ...................................................................4
1.6 Changes in literacy and numeracy performance over time..........................................................5
1.7 Basic skills and education............................................................................................................6
1.8 Literacy and numeracy in everyday life........................................................................................6
1.9 Basic skills in work .......................................................................................................................7
1.10 Basic skills and computer use......................................................................................................7
1.11 Training in basic skills ..................................................................................................................8
1.12 Attitudes towards learning............................................................................................................8
1.13 A focus on policy sub-groups.......................................................................................................9
1.14 A focus on sub-skills ....................................................................................................................9
1.15 Comparison of assessments......................................................................................................10
1.16 Conclusions ...............................................................................................................................10
2 Introduction ..................................................................................................................................11
2.1 General introduction...................................................................................................................11
2.2 Policy background and standards..............................................................................................11
2.3 Research aims and objectives ...................................................................................................14
2.4 The Skills for Life 2003 Survey ..................................................................................................14
2.5 Development and piloting of the Skills for Life 2011 Survey ......................................................15
2.6 The Skills for Life 2011 Survey ..................................................................................................16
2.6.1 The background questionnaire...............................................................................................16
2.6.2 The skills assessments ..........................................................................................................17
2.6.3 The research team.................................................................................................................18
The 2011 Skills for Life Survey: a Survey of Literacy, Numeracy, and ICT Levels in England
ii
2.6.4 Comparison between the 2003 and 2011 surveys.................................................................18
2.7 Scope and structure of the report...............................................................................................19
2.8 Notes on the report ....................................................................................................................21
3 Population profile ........................................................................................................................23
3.1 Key findings ...............................................................................................................................23
3.2 Introduction ................................................................................................................................23
3.3 Profile of population aged 16 to 65 in 2011................................................................................24
3.4 The relevance of population profile to findings in the Skills for Life 2011 Survey ......................29
3.5 Profile of population in 2003 and 2011.......................................................................................30
4 Distributions of literacy, numeracy and ICT skills....................................................................32
4.1 Key Findings ..............................................................................................................................32
4.2 Introduction ................................................................................................................................33
4.3 Overall distribution of Literacy Levels ........................................................................................33
4.4 Overall distribution of Numeracy Levels.....................................................................................37
4.5 Overall distribution of the ICT components ................................................................................39
4.6 Literacy, numeracy and ICT distributions by age.......................................................................41
4.7 The Relationship between Literacy, Numeracy and ICT skills ...................................................43
4.7.1 Literacy and Numeracy ..........................................................................................................43
4.7.2 Literacy, Numeracy and ICT ..................................................................................................46
4.7.3 Correlations between ICT components..................................................................................46
5 Skills Levels and demographic characteristics ........................................................................47
5.1 Key Findings ..............................................................................................................................47
5.2 Introduction ................................................................................................................................48
5.3 Skills amongst respondents from different linguistic and cultural backgrounds .........................48
5.3.1 Language ...............................................................................................................................48
5.3.2 Ethnicity..................................................................................................................................54
5.4 The relationship between skills and geo-demographic characteristics ......................................59
5.4.1 The Index of Multiple Deprivation...........................................................................................59
5.4.2 The Regions...........................................................................................................................64
5.4.3 Urban and rural areas ............................................................................................................72
5.4.4 Type of neighbourhood ..........................................................................................................74
5.4.5 Housing tenure.......................................................................................................................78
5.5 The relationship between skills and personal demographic characteristics...............................80
5.5.1 Age.........................................................................................................................................80
The 2011 Skills for Life Survey: a Survey of Literacy, Numeracy, and ICT Levels in England
iii
The relationship between literacy, numeracy and ICT by age ............................................................86
5.5.2 Gender ...................................................................................................................................87
5.5.3 Social classifications (NS-SEC) .............................................................................................92
5.5.4 Health issues..........................................................................................................................95
6 Understanding the relationship between skills and personal characteristics.......................98
6.1 Key findings ...............................................................................................................................98
6.2 Introduction ................................................................................................................................99
6.3 Personal characteristics that predict ‘weak’ skills – results of regression analysis ..................100
6.3.1 Introduction ..........................................................................................................................100
6.3.2 The models ..........................................................................................................................101
6.3.3 Model 1: The likelihood of weak literacy assessment performance .....................................104
6.3.4 Model 2: The likelihood of weak numeracy assessment performance.................................107
6.3.5 Model 3: The likelihood of weak ICT assessment performance...........................................109
6.4 Simple Generational Analysis ..................................................................................................111
6.4.1 Introduction ..........................................................................................................................111
6.4.2 Analysis: literacy ..................................................................................................................113
6.4.3 Analysis: numeracy ..............................................................................................................116
6.4.4 Summary..............................................................................................................................118
7 Education....................................................................................................................................119
7.1 Key Findings ............................................................................................................................119
7.2 Introduction ..............................................................................................................................120
7.3 When left education .................................................................................................................120
7.3.1 Literacy and Numeracy ........................................................................................................121
7.3.2 ICT .......................................................................................................................................123
7.4 Highest qualifications ...............................................................................................................124
7.4.1 Literacy and Numeracy ........................................................................................................126
7.4.2 ICT .......................................................................................................................................132
7.5 Specific English and Maths qualifications ................................................................................134
7.5.1 English Language GCSE .....................................................................................................134
7.5.2 Maths GCSE ........................................................................................................................136
7.6 Parental education ...................................................................................................................138
7.6.1 Literacy and Numeracy ........................................................................................................139
7.6.2 ICT .......................................................................................................................................140
8 Literacy, numeracy and ICT skills in everyday life and work ................................................142
The 2011 Skills for Life Survey: a Survey of Literacy, Numeracy, and ICT Levels in England
iv
8.1 Key findings ...................................................................................................................................142
8.2 Introduction ....................................................................................................................................143
8.3 Self-assessment of everyday literacy and numeracy skills............................................................143
8.3.1 Self-assessment of literacy skills ............................................................................................144
8.3.2 Self-assessment of numeracy..............................................................................................148
8.4 Using literacy and numeracy in everyday life...........................................................................150
8.4.1 Reading in everyday life.......................................................................................................151
8.4.2 Writing in everyday life .........................................................................................................155
8.4.3 Maths in everyday life ..........................................................................................................157
8.5 Basic skills and job prospects ..................................................................................................158
8.5.1 Self-assessed literacy and impact on job prospects ............................................................159
8.5.2 Self-assessed numeracy and impact on job prospects........................................................160
8.6 Basic skills and economic activity ............................................................................................161
8.6.1 Performance in the assessments by economic activity........................................................162
8.7 Basic skills and occupation ......................................................................................................164
8.7.1 Performance in the assessments by occupation..................................................................166
8.8 Basic skills and industry sector ................................................................................................170
8.8.1 Performance in the assessments by industry sector............................................................171
8.9 Basic skills and earnings..........................................................................................................176
8.9.1 Performance in the assessments by earnings .....................................................................177
8.10 Basic skills and benefits ...........................................................................................................180
8.10.1 Performance in the assessments by benefit receipt ........................................................181
9 Computer use.............................................................................................................................184
9.1 Key Findings ............................................................................................................................184
9.2 Introduction ..............................................................................................................................185
9.3 Computer access .....................................................................................................................185
9.3.1 Computer access and Literacy and Numeracy Levels.........................................................187
9.4 Frequency of computer use .....................................................................................................188
9.5 How computers are used .........................................................................................................190
9.6 Internet access.........................................................................................................................195
9.6.1 Reasons for not having the internet at home .......................................................................197
9.6.2 Broadband access ...............................................................................................................197
9.6.3 Encouraging access.............................................................................................................198
9.7 How the internet is used...........................................................................................................199
The 2011 Skills for Life Survey: a Survey of Literacy, Numeracy, and ICT Levels in England
v
9.8 Frequency of internet use ........................................................................................................200
9.9 Self-assessment of computer skills..........................................................................................203
10 Training in basic skills ..............................................................................................................206
10.1 Key findings .............................................................................................................................206
10.2 Introduction ..............................................................................................................................207
10.3 Literacy training........................................................................................................................208
10.3.1 Types of literacy training received....................................................................................209
10.3.2 Timing of literacy training .................................................................................................210
10.3.3 Who received literacy training ..........................................................................................212
10.3.4 Self-assessed abilities and the need for literacy training .................................................214
10.3.5 Confidence in literacy skills following attendance of literacy training ...............................216
10.3.6 The relationship between literacy training and Numeracy and ICT Levels ......................217
10.4 Numeracy training....................................................................................................................218
10.4.1 Timing of numeracy training.............................................................................................218
10.4.2 Who received numeracy training......................................................................................220
10.4.3 Self-assessed abilities and the need for numeracy training.............................................223
10.4.4 Confidence in numeracy following attendance of maths training .....................................223
10.4.5 The relationship between maths training and Literacy and ICT Levels............................224
10.5 ICT training ..............................................................................................................................225
10.5.1 Timing of ICT training.......................................................................................................226
10.5.2 Who received ICT training................................................................................................228
10.5.3 The location of ICT training ..............................................................................................229
10.5.4 Self-assessed abilities and the need for ICT training.......................................................231
10.5.5 Confidence in computer skills following attendance of ICT training .................................232
10.5.6 The relationship between ICT training and Literacy and Numeracy Levels .....................233
11 Attitudes towards learning........................................................................................................234
11.1 Key Findings ............................................................................................................................234
11.2 Introduction .............................................................................................................................235
11.3 Attitudes towards learning.......................................................................................................235
11.3.1 Personal enjoyment and confidence in learning...............................................................236
11.3.2 Views on education received thus far ..............................................................................240
11.3.3 The practical value of education and qualifications..........................................................242
11.3.4 Learning as a continuous process ...................................................................................247
11.4 Future intentions towards learning...........................................................................................250
The 2011 Skills for Life Survey: a Survey of Literacy, Numeracy, and ICT Levels in England
vi
11.5 Reasons for future learning......................................................................................................254
11.6 Barriers against future learning................................................................................................255
12 Analysis of policy subgroups...................................................................................................258
12.1 Key Findings ................................................................................................................................258
12.2 Introduction ..............................................................................................................................259
12.3 People who are unemployed and on benefits ..........................................................................260
12.3.1 Unemployed and seeking work ........................................................................................260
12.3.2 People on active work-seeking benefits...........................................................................261
12.4 Low skilled adults in employment.............................................................................................263
12.4.1 Low skilled adults in low paid employment ......................................................................266
12.5 Individuals who are not in education, employment or training ................................................266
12.5.1 Young people who are Not in Employment Education or Training (NEET)......................272
12.6 Individuals at risk from social exclusion ...................................................................................274
12.6.1 Relative poverty ...............................................................................................................274
12.6.2 Other indicators of social exclusion..................................................................................275
12.7 Individuals at risk from digital exclusion ...................................................................................276
12.8 Individuals whose first language is not English........................................................................278
12.9 Individuals with disabilities, including learning difficulties .......................................................281
12.10 Young people ......................................................................................................................286
12.10.1 Young lone parents ..........................................................................................................288
13 Spiky profiles .............................................................................................................................289
13.1 Key Findings ................................................................................................................................289
13.2 Introduction ..............................................................................................................................290
13.3 Methodology for analysis of literacy and numeracy sub-skills .................................................291
13.3.1 Classification of literacy and numeracy assessment items ..............................................291
13.3.2 Calculation of sub-skill topic performance index for literacy and numeracy.....................291
13.3.3 Issues with the literacy and numeracy data .....................................................................293
13.3.4 Caveats for the literacy and numeracy sub-skill analysis.................................................293
13.4 Sub-skill outcomes for literacy .................................................................................................295
13.4.1 Literacy coverage.............................................................................................................296
13.4.2 Entry Level 1 or below Literacy ........................................................................................297
13.4.3 Entry Level 2 Literacy.......................................................................................................298
13.4.4 Entry Level 3 Literacy.......................................................................................................300
13.4.5 Level 1 Literacy ................................................................................................................301
The 2011 Skills for Life Survey: a Survey of Literacy, Numeracy, and ICT Levels in England
vii
13.4.6 Level 2 or above Literacy .................................................................................................302
13.4.7 Conclusions: literacy spiky profiles ..................................................................................304
13.5 Sub-skill outcomes for numeracy.............................................................................................305
13.5.1 Numeracy coverage .........................................................................................................305
13.5.2 Entry Level 1 or below Numeracy ....................................................................................305
13.5.3 Entry Level 2 Numeracy...................................................................................................306
13.5.4 Entry Level 3 Numeracy...................................................................................................307
13.5.5 Level 1 Numeracy ............................................................................................................309
13.5.6 Level 2 or above Numeracy .............................................................................................310
13.5.7 Conclusions: numeracy spiky profiles ..............................................................................311
13.6 Methodology for analysis of ICT sub-skills...............................................................................311
13.7 Sub-skills outcomes for ICT .....................................................................................................312
13.7.1 Correlations between the ICT assessment components..................................................313
13.7.2 ICT spiky profiles..............................................................................................................314
14 Comparisons of survey results with other surveys and standards......................................316
14.1 Key Findings ................................................................................................................................316
14.2 Introduction ..............................................................................................................................317
14.3 The Skills for Life literacy assessment background ................................................................317
14.3.1 Skills for Life Literacy Levels............................................................................................317
14.3.2 Literacy criteria tested in the Skills for Life Survey literacy assessment ..........................318
14.3.3 The structure of the Skills for Life Survey literacy assessment ........................................318
14.4 Comparisons between Skills for Life literacy assessment with National Tests, Key Skills tests, and Functional Skills assessments ......................................................................................................319
14.4.1 Comparisons between the Skills for Life literacy assessment and National Tests in Adult Literacy and Key Skills Communication assessments.....................................................................319
14.4.2 Comparisons between the Skills for Life survey literacy assessment and Functional Skills English assessments .......................................................................................................................320
14.4.3 Summary of the literacy comparisons ..............................................................................321
14.5 Comparisons between the Skills for Life 2011 literacy survey, the International Adult Literacy Survey (IALS 1997) and the Centre for Longitudinal Studies/National Foundation for Educational Research 1997 survey for literacy .......................................................................................................323
14.5.1 Methodology of IALS........................................................................................................323
14.5.2 Methodology of CLS/NFER NCDS survey, 1997 .............................................................325
14.5.3 Broad findings from IALS and CLS/NFER NCDS ............................................................326
14.5.4 Summary of the comparisons ..........................................................................................328
The 2011 Skills for Life Survey: a Survey of Literacy, Numeracy, and ICT Levels in England
viii
14.6 Comparisons between the Skills for Life 2011 literacy survey and the National Survey of Adult Skills in Wales, 2010 for literacy ..........................................................................................................329
14.6.1 Methodology.....................................................................................................................329
14.6.2 Broad findings ..................................................................................................................329
14.6.3 Summary of the comparison ............................................................................................330
14.7 Comparisons between the Skills for Life 2011 literacy survey and the Scottish Survey of Adult Literacies (SSAL), 2009.......................................................................................................................331
14.7.1 Methodology.....................................................................................................................331
14.7.2 Broad findings ..................................................................................................................332
14.7.3 Summary of the comparison ............................................................................................333
14.8 Comparisons between the Skills for Life 2011 literacy survey and the Progress in International Reading Literacy Study (PIRLS) for literacy ........................................................................................334
14.8.1 Methodology.....................................................................................................................334
14.8.2 Broad findings ..................................................................................................................336
14.8.3 Summary of the comparison ............................................................................................336
14.9 Comparisons between the Skills for Life 2011 literacy survey and the Programme for International Student Assessment (PISA) (2000, 2003, 2006, 2009)reading outcomes......................337
14.9.1 Methodology.....................................................................................................................337
14.9.2 Broad findings ..................................................................................................................337
14.9.3 Summary of the comparison.................................................................................................338
14.10 The Skills for Life numeracy assessment background.........................................................338
14.10.1 Skills for Life Numeracy Levels ........................................................................................338
14.10.2 Numeracy criteria tested in the Skills for Life numeracy assessment ..............................340
14.10.3 The structure of the Skills for Life survey numeracy assessment ....................................340
14.11 Comparisons between Skills for Life numeracy assessment with National Tests, Key Skills tests, and Functional Skills assessments ............................................................................................341
14.11.1 Comparisons between the Skills for Life numeracy assessment and National Tests in Adult Numeracy and Key Skills Application of Number assessments.......................................................341
14.11.2 Comparisons between the Skills for Life survey numeracy assessment and Functional Skills Mathematics assessments .....................................................................................................342
14.11.3 Summary of the comparisons .............................................................................................343
14.12 Comparisons between the Skills for Life 2011 numeracy survey, the International Adult Literacy Survey (IALS 1997) and the Centre for Longitudinal Studies/ National Foundation for Educational Research 1997 survey for numeracy ...............................................................................344
14.12.1 Broad findings from IALS and CLS/NFER NCDS ............................................................344
14.12.2 Summary of the comparisons ..........................................................................................347
The 2011 Skills for Life Survey: a Survey of Literacy, Numeracy, and ICT Levels in England
ix
14.13 Comparisons between the Skills for Life 2011 Survey and the National Survey of Adult Skills in Wales, 2010 for numeracy ...............................................................................................................348
14.13.1 Broad findings ..................................................................................................................348
14.13.2 Summary of the comparison ............................................................................................349
14.14 Comparisons between the Skills for Life 2011 numeracy survey and the Scottish Survey of Adult Literacies (SSAL) (numeracy outcomes), 2009 ..........................................................................349
14.14.1 Broad findings ..................................................................................................................349
14.14.2 Summary of the comparison ............................................................................................349
14.15 Comparisons between the Skills for Life 2011 Survey and the Trends in International Mathematics and Science Study (TIMSS) for numeracy .....................................................................349
14.15.1 Methodology.....................................................................................................................349
14.15.2 Broad findings ..................................................................................................................350
14.15.3 Summary of the comparisons ..........................................................................................350
14.16 Comparisons between the Skills for Life 2011 numeracy survey and the Programme for International Student Assessment (PISA) (2000, 2003, 2006, 2009)mathematics outcomes .............350
14.16.1 Broad findings ..................................................................................................................350
14.16.2 Summary of the comparison ............................................................................................351
14.17 Future international survey of literacy and numeracy: Programme for the International Assessment of Adult Competences (PIAAC).......................................................................................351
14.17.1 PIAAC and the Skills for Life 2011 Survey: alignment, coverage and Levels ..................352
14.18 Comparisons of the Skills for Life 2011 Survey ICT assessment ........................................354
14.19 The Skills for Life 2011 ICT assessment and national IT standards ....................................355
14.19.1 Nature of skills assessed .................................................................................................356
14.19.2 Rationale for the Skills for Life 2011 ICT assessment......................................................356
14.20 The Skills for Life 2011 ICT assessment and Functional Skills ICT assessments ...............357
15 Summary of findings and issues for further consideration...................................................358
15.1 Introduction ..............................................................................................................................358
15.2 Summary of the findings from the Skills for Life 2011 Survey..................................................358
15.2.1 Survey background ..........................................................................................................358
15.2.2 Overall distribution of Literacy Levels ..............................................................................358
15.2.3 Overall distribution of Numeracy Levels...........................................................................359
15.2.4 Overall distribution of ICT Levels .....................................................................................360
15.2.5 The relationship between literacy, numeracy and ICT skills ............................................361
15.2.6 Linguistic and cultural backgrounds .................................................................................363
15.2.7 Skills in different parts of England....................................................................................363
15.2.8 The relationship between personal characteristics and skills...........................................363
The 2011 Skills for Life Survey: a Survey of Literacy, Numeracy, and ICT Levels in England
x
15.2.9 The impact of education on skills .....................................................................................365
15.2.10 Literacy, numeracy and ICT in life and work ....................................................................366
15.2.11 Use of computers .............................................................................................................366
15.2.12 Basic skills training...........................................................................................................367
15.2.13 Sub-skills..........................................................................................................................368
15.2.14 Policy Sub-groups ............................................................................................................369
15.2.15 Summary..........................................................................................................................369
15.3 Survey validity and comparability.............................................................................................371
15.3.1 Comparability of results from 2003 and 2011...................................................................371
15.3.2 Numeracy and literacy assessment validity and reliability ...............................................371
15.3.3 The possibility of reading, writing and cultural bias contaminating assessment results...373
15.3.4 The possibility that population sampling led to skills improvements being missed ..........374
15.4 Initial interpretation of trends in literacy and numeracy............................................................375
15.4.1 Introduction ......................................................................................................................375
15.4.2 Skills loss in literacy and numeracy..................................................................................377
15.4.3 Numeracy skills have worsened due to poorly skilled young people entering the survey population. .......................................................................................................................................378
15.4.4 Ineffective training in numeracy .......................................................................................378
15.4.5 Population changes relating to migration balance out literacy and numeracy skills gains in the ‘base population’. .......................................................................................................................380
15.4.6 Skills improvement is marginal or long term, or not measured in terms of literacy and numeracy .........................................................................................................................................380
15.4.7 Other possibilities.............................................................................................................381
15.5 Discussion and initial interpretation of the ICT headline findings.............................................382
15.5.1 ICT Skills in the 2011 survey............................................................................................382
15.5.2 ICT skills in work and society ...........................................................................................382
15.6 Further work.............................................................................................................................383
Bibliography...........................................................................................................................................385
Quality assurance statement................................................................................................................392
The 2011 Skills for Life Survey: a Survey of Literacy, Numeracy, and ICT Levels in England
xi
Appendix of Tables and Annexes (in separate documents):
Appendix of Tables
Annex 1 Research design and conduct
Annex 2 Development and piloting of the Skills for Life survey tools
Annex 3 Development of the background questionnaire
Annex 4 Performance analysis of the assessment tools
Annex 5 The use of correlation coefficients in the 2011 Skills for Life survey
Annex 6 Quantification of the ‘data-non capture’ issue affecting the 2003 Skills for Life survey
Annex 7 Regression model coefficients
Annex 8 Tree diagrams based on the regression model variables
The 2011 Skills for Life Survey: a Survey of Literacy, Numeracy, and ICT Levels in England
xii
List of Figures Figure 1.1 Literacy Levels in 2003 and 2011 (%) ..........................................................................................2
Figure 1.2 Numeracy Levels in 2003 and 2011 (%) ......................................................................................3
Figure 1.3 ICT Levels (%)..............................................................................................................................4
Figure 4.1 Literacy Levels in 2003 and 2011 (%) ........................................................................................33
Figure 4.2 Literacy Levels in 2003 and 2011 (%) ........................................................................................34
Figure 4.3 Numeracy Levels in 2003 and 2011 (%) ....................................................................................37
Figure 4.4 Numeracy Levels in 2003 and 2011 (%) ....................................................................................38
Figure 4.5 ICT Levels (%)............................................................................................................................40
Figure 4.6 Numeracy Level measured against Literacy Level in 2003 and 2011 (%) .................................43
Figure 4.7 Minimum Levels of combined Literacy and Numeracy in 2003 and 2011 ..................................45
Figure 5.1 Literacy and Numeracy Levels by ethnicity (%)..........................................................................54
Figure 5.2 Cumulative IMD values (%) ........................................................................................................61
Figure 5.3 Literacy Levels by Region (%)....................................................................................................65
Figure 5.4 Literacy Levels by Region amongst respondents with EFL (%) .................................................65
Figure 5.5 Numeracy Levels by Region (%) ................................................................................................68
Figure 5.6 Numeracy Levels by Region amongst respondents with EFL (%) .............................................69
Figure 5.7 ICT Levels by type of area (urban/rural) (%) ..............................................................................74
Figure 5.8 Literacy Levels by age (%) .........................................................................................................81
Figure 5.9 Numeracy Levels by age (%) .....................................................................................................83
Figure 5.10 Literacy Levels by gender (%) ..................................................................................................88
Figure 6.1: Likelihoods of various magnitudes of change in the proportions achieving Literacy Level 1 or above among those with EFL ....................................................................................................................115
Figure 6.2 Likelihoods of various magnitudes of change in the proportions achieving Numeracy Entry Level 3 or above among those with EFL .............................................................................................................118
Figure 7.1 Literacy Levels by terminal education age in 2003 and 2011 (%) ............................................121
Figure 7.2 Numeracy Levels by terminal education age in 2003 and 2011 (%) ........................................122
Figure 7.3 Highest qualification amongst those no longer in education in 2003 and 2011 (%) .................125
Figure 7.4 Literacy Levels by highest qualification amongst those no longer in education in 2003 and 2011 (%) .............................................................................................................................................................127
Figure 7.5 Numeracy Levels by highest qualification amongst those no longer in education in 2003 and 2011 (%) ....................................................................................................................................................128
Figure 7.6 Literacy Levels by whether hold English Language GCSE (or equivalent) at grades A*-C (%)...................................................................................................................................................................135
Figure 7.7 Numeracy Levels by whether hold Maths GCSE (or equivalent) at grades A*-C (%) ..............137
Figure 8.1 Self-assessed reading and writing skills in 2003 and 2011 (%) ...............................................144
Figure 8.2 Weaknesses in reading, writing and English speaking skills amongst people with ENFL (%) .147

The 2011 Skills for Life Survey: a Survey of Literacy, Numeracy, and ICT Levels in England
xiii
Figure 8.3 Self-assessed maths skills in 2003 and 2011 (%) ....................................................................148
Figure 8.4 Frequency of five commonplace activities (%) .........................................................................150
Figure 8.5 Frequency of five commonplace activities in 2003 and 2011 (%) ............................................151
Figure 8.6 Proportions who read each newspaper section (%) .................................................................154
Figure 8.7 Proportions who felt that a weakness in basic skills had impacted on their job opportunities (%)...................................................................................................................................................................158
Figure 8.8 Proportions who felt that a weakness in basic skills had impacted on their job opportunities in 2003 and 2011(%) .....................................................................................................................................159
Figure 9.1 Frequency of computer usage (%) ...........................................................................................188
Figure 9.2 Computer uses (%) (all activities mentioned by one per cent or more of respondents) ...........191
Figure 9.3 Proportions who have and use home internet (%) ...................................................................195
Figure 9.4 Reasons for absence of internet connection at home (%)........................................................197
Figure 9.5 Factors that might encourage getting an internet connection (%) ............................................198
Figure 9.6 Internet uses.............................................................................................................................199
Figure 9.7 Frequency of internet tasks amongst internet users selected for the ICT assessment (%)......201
Figure 9.8 Self-assessment of computer skills (%)....................................................................................203
Figure 10.1 Proportions who trained in each literacy skill (%) ...................................................................211
Figure 10.2 Proportions who received literacy training amongst people with EFL and people with ENFL (%)...................................................................................................................................................................212
Figure 10.3 Self-assessed reading and writing skills by whether received literacy training (%)................214
Figure 10.4 Self-assessed reading and writing skills amongst those who received literacy training by timing of literacy training (%) ................................................................................................................................216
Figure 10.5 Self-assessed maths skills by whether attended maths training (%)......................................223
Figure 10.6 Self-assessed maths skills amongst those who received maths training by timing of maths training (%) ................................................................................................................................................224
Figure 10.7 Location where ICT training was undertaken in the past (all locations mentioned by one per cent or more of respondents) (%) ..............................................................................................................229
Figure 10.8 Self-assessed ICT skills by whether attended ICT training ....................................................231
Figure 10.9 Sources of advice for improving computer skills that people who never received ICT training and had weak skills, or who never used a computer might seek (%) ........................................................232
Figure 10.10 Self-assessed ICT skills amongst those who received ICT training, by timing of ICT training (%) .............................................................................................................................................................232
Figure 11.1 Agreement with statements about personal enjoyment and confidence in learning (%) ........236
Figure 11.2 Agreement with statements about education received thus far (%) .......................................240
Figure 11.3 Agreement with statements about the practical (and financial) value of education and qualifications (%) .......................................................................................................................................243
Figure 11.4 Agreement with statements about learning as an ongoing process .......................................247
Figure 11.5 Proportions who intend to do any learning, training or education in the next two to three years (%) .............................................................................................................................................................250
Figure 11.6 Reasons for intending to undertake future learning, training or education (%).......................254
The 2011 Skills for Life Survey: a Survey of Literacy, Numeracy, and ICT Levels in England
xiv
Figure 11.7 Reasons why would be deterred from undertaking future learning, education or learning (%)...................................................................................................................................................................255
Figure 12.1 Literacy Levels amongst those claiming JSA (%)...................................................................262
Figure 12.2 Illness, disabilities and infirmities reported to be limiting amongst those with each illness/disability/infirmity (%) ......................................................................................................................282
Figure 12.3 Numeracy Levels by age in 2003 and 2011(%)......................................................................287
Figure 13.1 Literacy Entry Level 1 or below Group – relative performance by topic ................................298
Figure 13.2 Literacy Entry Level 2 Group – relative performance by topic ...............................................300
Figure 13.3 Literacy Entry Level 3 Group – relative performance by topic ...............................................301
Figure 13.4 Literacy Level 1 Group – relative performance by topic ........................................................302
Figure 13.5 Literacy Level 2 or above Group – relative performance by topic .........................................304
Figure 13.6 Numeracy Entry Level 1 or below Group – relative performance by topic ............................306
Figure 13.7 Numeracy Entry Level 2 Group – relative performance by topic ...........................................307
Figure 13.8 Numeracy Entry Level 3 Group – relative performance by topic ...........................................308
Figure 13.9 Numeracy Level 1 Group – relative performance by topic ....................................................309
Figure 13.10 Numeracy Level 2 or above Group – relative performance by topic ...................................311
Figure 14.1 IALS Survey (1997) Literacy Levels for the United Kingdom (%)...........................................326
Figure 14.2 IALS Survey (1997) and Skills for Life 2003 and 2011 Literacy Levels (%) ...........................327
Figure 14.3 Distribution of Literacy Levels across the Scottish population (From SSAL) (%) ...................333
Figure 14.4 IALS Survey (1997) and Skills for Life 2011 Numeracy Levels (%) .......................................346
Figure 15.1 Literacy Levels in 2003 and 2011 (%) ....................................................................................359
Figure 15.2 Numeracy Levels in 2003 and 2011 (%) ................................................................................360
Figure 15.3 ICT Levels (%)........................................................................................................................361
Figure 15.4 Numeracy Level measured against Literacy Level in 2003 and 2011 (%) .............................362
The 2011 Skills for Life Survey: a Survey of Literacy, Numeracy, and ICT Levels in England
xv
List of Tables Table 3.1 Ethnic distribution ......................................................................................................................24
Table 3.2 Distribution across Regions .......................................................................................................25
Table 3.3 Age distribution ..........................................................................................................................26
Table 3.4 Distribution of limiting disabilities ...............................................................................................27
Table 3.5 Working status distribution.........................................................................................................28
Table 3.6 Distribution of gross earnings (per annum)................................................................................28
Table 3.7 Distribution of tenures................................................................................................................29
Table 3.8 Population profile in 2003 and 2011 ..........................................................................................31
Table 4.1 Literacy Levels in 2003 and 2011 including population estimates.............................................35
Table 4.2 Percentage achieving Level 1 or above Literacy – likelihood of different magnitudes of change...................................................................................................................................................................36
Table 4.3 Percentage achieving Level 2 or above Literacy – likelihood of different magnitudes of change...................................................................................................................................................................36
Table 4.4 Numeracy Levels in 2003 and 2011 including population estimates .........................................38
Table 4.5 Percentage achieving Entry Level 3 or above Numeracy – likelihood of different magnitudes of change .......................................................................................................................................................39
Table 4.6 ICT Levels..................................................................................................................................39
Table 4.7 ICT Levels - population estimates .............................................................................................41
Table 4.8 Literacy Levels by age (16-18 and 19-65) .................................................................................41
Table 4.9 Numeracy Levels by age (16-18 and 19-65) .............................................................................42
Table 4.10 ICT Levels by age (16-18 and 19-65) ......................................................................................42
Table 4.11 Numeracy Level by Literacy Level ...........................................................................................44
Table 4.12 Literacy and Numeracy combinations – overall percentage of sample in each cell in 2003 and 2011...........................................................................................................................................................44
Table 4.13 Literacy and Numeracy combinations – overall percentage of sample in each cell ................45
Table 4.14 Literacy / Numeracy and ICT correlation coefficients ..............................................................46
Table 4.15 ICT – correlation co-efficients .................................................................................................46
Table 5.1 Location of respondents by first language (EFL / ENFL)...........................................................49
Table 5.2 First language (EFL / ENFL) by Region.....................................................................................49
Table 5.3 First language (EFL / ENFL) by age ..........................................................................................50
Table 5.4 Literacy and Numeracy Levels by first language (EFL / ENFL).................................................51
Table 5.5 Literacy and Numeracy Levels by first language (EFL / ENFL) and self assessment of spoken English .......................................................................................................................................................52
Table 5.6 ICT Levels by first language (EFL / ENFL) ................................................................................53
Table 5.7 Literacy Levels by ethnicity........................................................................................................55
Table 5.8 Literacy Levels by ethnicity amongst respondents with EFL .....................................................56
The 2011 Skills for Life Survey: a Survey of Literacy, Numeracy, and ICT Levels in England
xvi
Table 5.9 Numeracy Levels by ethnicity ....................................................................................................56
Table 5.10 Numeracy Levels by ethnicity amongst respondents with EFL ...............................................57
Table 5.11 Literacy and Numeracy Levels by ethnicity amongst respondent with EFL.............................58
Table 5.12 ICT Levels by ethnicity.............................................................................................................58
Table 5.13 ICT Levels by ethnicity amongst respondents with EFL .........................................................59
Table 5.14 Literacy Levels by IMD category..............................................................................................62
Table 5.15 Numeracy Levels by IMD category..........................................................................................63
Table 5.16 ICT Levels by IMD category ....................................................................................................64
Table 5.17 IMD by Region .........................................................................................................................66
Table 5.18 Literacy Levels by Region of those living in areas within IMD values 10-19/ 20-29/ 30+ with EFL ............................................................................................................................................................67
Table 5.19 Numeracy Levels by Region of those living in areas within IMD bands 10-19 / 20-29 / 30+ with EFL.....................................................................................................................................................70
Table 5.20 ICT Levels by Region ..............................................................................................................71
Table 5.21 ICT Levels by Region amongst respondents with EFL who are ‘frequent’ computer ..............72
Table 5.22 Literacy and Numeracy Levels by type of area (urban/rural) amongst all respondents and those with EFL ...........................................................................................................................................73
Table 5.23 Characteristics of Supergroups ...............................................................................................75
Table 5.24 Supergroup distribution............................................................................................................76
Table 5.25 Literacy and Numeracy Levels by Supergroups ......................................................................76
Table 5.26 ICT Levels by Supergroups .....................................................................................................78
Table 5.27 Literacy and Numeracy Levels by housing tenure in 2003 and 2011 ......................................79
Table 5.28 ICT Levels by housing tenure ..................................................................................................80
Table 5.29 Literacy Levels by age in 2003 and 2011 ................................................................................82
Table 5.30 Numeracy Levels by age in 2003 and 2011 ............................................................................84
Table 5.31 Numeracy Levels by age amongst EFL in 2003 and 2011 ......................................................85
Table 5.32 ICT Levels by age....................................................................................................................86
Table 5.33 Literacy / Numeracy and ICT Correlation Coefficients by age................................................87
Table 5.34 Literacy Levels by age and gender..........................................................................................89
Table 5.35 Numeracy Levels by age and gender ......................................................................................90
Table 5.36 Literacy Levels by household occupation in 2003 and 2011 ...................................................93
Table 5.37 Numeracy Levels by household occupation in 2003 and 2011 ...............................................94
Table 5.38 ICT Levels by household occupation.......................................................................................94
Table 5.39 Literacy and Numeracy Levels by health.................................................................................96
Table 5.40 ICT Levels by health ................................................................................................................97
Table 6.1 Personal characteristics considered for regression models ....................................................102
Table 6.2 Generation definitions..............................................................................................................112
Table 6.3 Generation proportions with EFL in 2003 and 2011 ................................................................112
The 2011 Skills for Life Survey: a Survey of Literacy, Numeracy, and ICT Levels in England
xvii
Table 6.4 Generation proportions reaching Literacy Level 1 or above in 2003 and 2011 .......................113
Table 6.5 Generation proportions with EFL reaching Literacy Level 1 in 2003 and 2011 .......................114
Table 6.6 Generation proportions with EFL reaching Literacy Level 2 or above in 2003 and 2011 ........116
Table 6.7 Generation proportions reaching Numeracy Entry Level 3 or above in 2003 and 2011 ..........116
Table 6.8 Generation proportion with EFL reaching Numeracy Entry Level 3 or above in 2003 and 2011.................................................................................................................................................................117
Table 7.1 Terminal education age in 2003 and 2011 ..............................................................................120
Table 7.2 Terminal education age by age (of respondent) ......................................................................121
Table 7.3 Literacy Levels by terminal education age in 2003 and 2011..................................................123
Table 7.4 Numeracy Levels by terminal education age in 2003 and 2011 ..............................................123
Table 7.5 ICT Levels by terminal education age .....................................................................................124
Table 7.6 Highest qualification by age amongst those no longer in education........................................126
Table 7.7 Literacy Levels by highest qualification amongst those no longer in education in 2003 and 2011.................................................................................................................................................................129
Table 7.8 Numeracy Levels by highest qualification amongst those no longer in education in 2003 and 2011.........................................................................................................................................................129
Table 7.9 Literacy Levels within age, by highest qualification amongst those no longer in education ....130
Table 7.10 Numeracy Levels within age by highest qualification amongst those no longer in education132
Table 7.11 ICT Levels by highest qualification amongst those no longer in education ...........................133
Table 7.12 ICT Level 2 or above by highest qualification amongst ‘frequent’ computer users who are no longer in education ..................................................................................................................................134
Table 7.13 Literacy Levels by whether hold English Language GCSE (or equivalent) at A*-C............136
Table 7.14 Numeracy Levels by whether hold Maths GCSE (or equivalent) at A*-C ..............................138
Table 7.15 Whether parent stayed in education past 16 .........................................................................139
Table 7.16 Literacy Levels by parental education ..................................................................................140
Table 7.17 Numeracy Levels by parental education...............................................................................140
Table 7.18 ICT Levels by parental education .........................................................................................141
Table 8.1 Literacy Levels by self-assessed reading and writing skills .....................................................145
Table 8.2 Self-assessed reading and writing skills of respondents with ENFL, by self-assessed ability to speak in English.......................................................................................................................................146
Table 8.3 Literacy Levels of respondents with ENFL, by self-assessed reading, writing and speaking skills.................................................................................................................................................................147
Table 8.4 Self-assessed maths skills by self-assessed reading and writing skills...................................148
Table 8.5 Numeracy Levels by self-assessed maths skills......................................................................149
Table 8.6 Literacy Levels by frequency of reading books, magazines or newspapers in English ...........152
Table 8.7 Literacy Levels by number of books owned.............................................................................153
Table 8.8 Number of newspaper sections read by self-assessed reading skills and frequency of reading.................................................................................................................................................................154
Table 8.9 Whether writes, texts or emails by self-assessed writing skills................................................155
The 2011 Skills for Life Survey: a Survey of Literacy, Numeracy, and ICT Levels in England
xviii
Table 8.10 Literacy Levels by frequency of writing in different media .....................................................156
Table 8.11 Numeracy Levels by frequency of checking bills or bank statements ...................................157
Table 8.12 Literacy Levels amongst people who gave a negative rating of their reading and writing skills, by perceived impact of weak literacy on job opportunities.......................................................................160
Table 8.13 Numeracy Levels amongst people who gave a negative rating of their maths skills, by perceived impact of weak maths skills on job opportunities ....................................................................161
Table 8.14 Distributions of those not in employment in 2003 and 2011 ..................................................162
Table 8.15 Literacy and Numeracy Levels by working status..................................................................163
Table 8.16 ICT Levels by working status................................................................................................164
Table 8.17 Distribution of occupations in 2003 and 2011........................................................................164
Table 8.18 Occupations amongst those who have ever been in work, by self- assessed abilities in literacy, numeracy and ICT......................................................................................................................166
Table 8.19 Literacy Levels amongst those who work, by occupation......................................................166
Table 8.20 Numeracy Levels amongst those who work, by occupation ..................................................167
Table 8.21 ICT Levels amongst those who work, by occupation.............................................................169
Table 8.22 Distribution of industry categories..........................................................................................170
Table 8.23 Literacy Levels amongst people who work by industry..........................................................172
Table 8.24 Numeracy Levels amongst people who work by industry......................................................172
Table 8.25 Word Processing Levels amongst people who work by industry ...........................................174
Table 8.26 Email Levels amongst people who work by industry .............................................................174
Table 8.27 Spreadsheet Levels amongst people who work by industry..................................................175
Table 8.28 Multiple Choice Levels amongst people who work by industry..............................................175
Table 8.29 Gross annual earnings...........................................................................................................176
Table 8.30 Literacy Levels amongst full-time workers by gross annual earnings....................................177
Table 8.31 Gross annual earnings amongst full-time workers by Literacy Levels ...................................178
Table 8.32 Numeracy Levels amongst full-time workers by gross annual earnings................................178
Table 8.33 Gross annual earnings amongst full-time workers by Numeracy Levels ...............................179
Table 8.34 ICT Levels amongst full-time workers by gross annual earnings ..........................................179
Table 8.35 Distribution of benefits received.............................................................................................180
Table 8.36 Literacy Levels by types of benefit received ..........................................................................181
Table 8.37 Numeracy Levels by types of benefit received .....................................................................182
Table 8.38 ICT Performance by types of benefit received.......................................................................183
Table 9.1 Proportions with access to a computer in 2003 and 2011 .......................................................185
Table 9.2 ICT Levels by whether has access to a computer at home or work .......................................186
Table 9.3 ICT Levels by whether has access to a computer at work .....................................................187
Table 9.4 Literacy and Numeracy Levels by computer access ...............................................................187
Table 9.5 Frequency of computer usage in 2003 and 2011 ....................................................................189
Table 9.6 ICT Levels by frequency of computer usage ...........................................................................190
The 2011 Skills for Life Survey: a Survey of Literacy, Numeracy, and ICT Levels in England
xix
Table 9.7 Top seven computer uses amongst those with access to a computer in 2003 and 2011 .......192
Table 9.8 Email, word processing and spreadsheet use amongst people in work who had access to a computer, by occupation..........................................................................................................................193
Table 9.9 ICT Levels amongst people who performed at least one task on a home or work computer, by number and types of tasks performed .....................................................................................................194
Table 9.10 ICT Levels amongst those with access to a computer, by whether has internet access......196
Table 9.11 Literacy and Numeracy Levels amongst those with access to a computer, by whether has internet access.........................................................................................................................................196
Table 9.12 ICT Levels by types of internet access (dial-up or broadband) ............................................198
Table 9.13 ICT Levels amongst internet users who carried out at least one of the listed activities, by number of internet activities carried out in a typical month......................................................................200
Table 9.14 ICT Levels amongst internet users who carried out at least one of the listed activities, by daily internet usage ..........................................................................................................................................202
Table 9.15 ICT Levels amongst internet users who carried out at least one of the listed activities, by frequency of email usage.........................................................................................................................202
Table 9.16 Self-assessment of computer skills in 2003 and 2011...........................................................204
Table 9.17 ICT Levels amongst those who have ever used a computer, by self-assessment of computer skills .........................................................................................................................................................204
Table 10.1 Literacy Levels in 2003 and 2011 by whether received literacy training................................208
Table 10.2 Proportion who received literacy training in 2003 and 2011 ..................................................209
Table 10.3 Literacy Levels by types of literacy training received.............................................................210
Table 10.4 Literacy Levels amongst those who received literacy training, by timing of literacy training .211
Table 10.5 Literacy Levels by first language and whether received literacy training...............................213
Table 10.6 Numeracy Levels by first language and whether received literacy training ...........................217
Table 10.7 ICT Levels by first language and whether received literacy training.....................................217
Table 10.8 Numeracy Levels in 2003 and 2011 by whether received numeracy training .......................218
Table 10.9 Numeracy Levels of people currently training in maths in 2003 and 2011 ............................219
Table 10.10 Numeracy Levels by timing of maths training ......................................................................219
Table 10.11 Numeracy Levels of people who received maths training more than three years ago in 2003 and 2011..................................................................................................................................................220
Table 10.12 Numeracy Levels of people who received maths training, by age.......................................221
Table 10.13 Numeracy Levels in 2003 and 2011 amongst people with EFL who received maths training.................................................................................................................................................................222
Table 10.14 Numeracy Levels by first language and whether received maths training...........................222
Table 10.15 Literacy Levels by whether received maths training ............................................................224
Table 10.16 ICT Levels by whether received maths training..................................................................225
Table 10.17 ICT Levels by whether received ICT training.......................................................................226
Table 10.18 ICT Levels amongst those who received ICT training by timing of ICT training ..................227
Table 10.19 ICT Levels by location where ICT training was undertaken in the past ...............................230
Table 10.20 Literacy Levels by whether received ICT training ................................................................233
The 2011 Skills for Life Survey: a Survey of Literacy, Numeracy, and ICT Levels in England
xx
Table 10.21 Numeracy Levels by whether received ICT training ............................................................233
Table 11.1 Outlook on learning by terminal education age .....................................................................237
Table 11.2 Literacy and Numeracy Levels by outlook on learning ..........................................................238
Table 11.3 ICT Levels by outlook on learning .........................................................................................239
Table 11.4 Literacy and Numeracy Levels by experience of school........................................................241
Table 11.5 ICT Levels by experience of school.......................................................................................241
Table 11.6 Literacy and Numeracy Levels by desire to continue education............................................242
Table 11.7 ICT Levels by desire to continue education...........................................................................242
Table 11.8 Literacy and Numeracy Levels by views on the practical value of learning...........................244
Table 11.9 ICT Levels by views on the practical value of learning .........................................................245
Table 11.10 Views on education as an investment by terminal education age .......................................246
Table 11.11 Literacy and Numeracy Levels by views on education as an investment............................246
Table 11.12 ICT Levels by views on education as an investment ..........................................................247
Table 11.13 Views on learning as a continuous process by terminal education age ..............................248
Table 11.14 Literacy and Numeracy Levels by views on learning as a continuous process ...................249
Table 11.15 ICT Levels by views on learning as a continuous process .................................................249
Table 11.16 Proportions with definite plans for future learning by terminal education age .....................251
Table 11.17 Literacy and Numeracy Levels by whether intends to undertake future learning ................252
Table 11.18 ICT Levels by whether intends to undertake future learning ..............................................253
Table 11.19 Literacy Levels by literacy-related barriers to future learning ..............................................256
Table 11.20 Whether intends to undertake future learning by time-related barriers to future learning....257
Table 12.1 Literacy and Numeracy Levels amongst those who are unemployed and looking for work ..261
Table 12.2 ICT Levels amongst those who are unemployed and looking for work .................................261
Table 12.3 Literacy and Numeracy Levels amongst those claiming JSA ................................................262
Table 12.4 ICT Levels amongst those claiming JSA ...............................................................................263
Table 12.5 Literacy Levels amongst ‘low skilled’ respondents in paid employment in 2003 and 2011 ...264
Table 12.6 Numeracy Levels amongst ‘low skilled’ respondents in paid employment in 2003 and 2011265
Table 12.7 ICT Levels of ‘low skilled’ respondents in paid employment..................................................266
Table 12.8 Breakdown of the NEET group ..............................................................................................267
Table 12.9 Literacy Levels amongst the NEET group .............................................................................268
Table 12.10 Numeracy Levels amongst the NEET group .......................................................................269
Table 12.11 ICT Levels amongst the NEET group ..................................................................................270
Table 12.12 Literacy and Numeracy Levels amongst the NEET ‘economically inactive’ group ..............271
Table 12.13 Literacy Levels amongst 16-24 year-olds and amongst 16-24 year old NEET respondents.................................................................................................................................................................272
Table 12.14 Numeracy Levels amongst 16-24 year-olds and amongst 16-24 year old NEET respondents.................................................................................................................................................................273
The 2011 Skills for Life Survey: a Survey of Literacy, Numeracy, and ICT Levels in England
xxi
Table 12.15 Literacy Levels amongst 16-24 year-olds and 25-65 year-old NEET respondents..............273
Table 12.16 Numeracy Levels amongst 16-24 year-olds and 25-65 year-old NEET respondents..........274
Table 12.17 Literacy and Numeracy Levels by computer and internet use.............................................277
Table 12.18 ICT Levels by computer and internet use ............................................................................278
Table 12.19 Literacy Levels by first language in 2003 and 2011.............................................................279
Table 12.20 Numeracy Levels by first language in 2003 and 2011.........................................................280
Table 12.21 Self reported illnesses, disabilities and infirmities amongst those with a self reported illness, disability of infirmity..................................................................................................................................281
Table 12.22 Literacy and Numeracy Levels by disability and learning difficulty ......................................283
Table 12.23 Literacy Levels by disability and learning difficulty in 2003 and 2011..................................284
Table 12.24 ICT Levels by disability and learning difficulty .....................................................................285
Table 13.1 Entry Level 1 or below Literacy performance indices by sub-skill topic area.........................297
Table 13.2 Entry Level 2 Literacy performance indices by sub-skill topic area .......................................299
Table 13.3 Entry Level 3 Literacy performance indices by sub-skill topic area .......................................300
Table 13.4 Level 1 Literacy performance indices by sub-skill topic area.................................................301
Table 13.5 Level 2 or above Literacy performance indices by sub-skill topic area..................................303
Table 13.6 Entry Level 1 or below Numeracy performance indices by sub-skill topic area.....................306
Table 13.7 Entry Level 2 Numeracy performance indices by sub-skill topic area ...................................307
Table 13.8 Entry Level 3 numeracy performance indices by sub-skill topic area ....................................308
Table 13.9 Level 1 numeracy performance indices by sub-skill topic area .............................................309
Table 13.10 Level 2 or above Numeracy performance indices by sub-skill topic area............................310
Table 13.11 Adult ICT performance in England.......................................................................................312
Table 13.12 Comparisons between achieving Level 2 or above in each of the ICT components ...........313
Table 13.13 Comparisons between achieving Level 1 or above in each of the ICT components ...........314
Table 13.14 Comparisons between achieving below Level 1 on the ICT components ...........................314
Table 14.1 Key Skills Communication / National Skills Tests at Levels 1 and 2 .....................................319
Table 14.2 Comparisons of the Skills for Life 2011 literacy assessment with the Functional Skills English assessments at Levels 1 and 2 ...............................................................................................................321
Table 14.3 Literacy Levels among 37 year-olds, CLS/NFER NCDS Cohort Study, 1997 .......................327
Table 14.4 Literacy levels from Skills for Life surveys in England (2003, 2011) for EFL speakers and the Welsh ‘English Medium’ survey (2004, 2010)..........................................................................................330
Table 14.5 IALS Levels from the Scottish Survey of Adult Literacies, 2009............................................331
Table 14.6 PIRLS weighting of assessment components .......................................................................335
Table 14.7 Numeracy Skills for Life Curriculum sections and sub-sections ............................................340
Table 14.8 Key Skills Application of Number/adult numeracy tests at Levels 1 and 2 ............................341
Table 14.9 Functional skills mathematics at Entry Levels and Levels 1 and 2.......................................343
Table 14.10 Numeracy Levels among 37 year-olds, CLS/NFER NCDS Cohort Study 1997 ..................347

The 2011 Skills for Life Survey: a Survey of Literacy, Numeracy, and ICT Levels in England
xxii
Table 14.11 Numeracy levels from Skills for Life surveys in England (2003, 2011) for EFL speakers and the Welsh ‘English medium’ survey (2004, 2010)....................................................................................348
Table 15.1 Literacy and Numeracy combinations – overall percentage of sample in each cell in 2003 and 2011.........................................................................................................................................................362
Table 15.2 Literacy and Numeracy Levels (Level 1 and above, Level 2 and above) in 2003 and 2011376
The 2011 Skills for Life Survey: a Survey of Literacy, Numeracy, and ICT Levels in England
xxiii
Glossary of Terms BCS70 1970 British Cohort Study
A continuing, multi-disciplinary longitudinal study which takes as its subjects all those living in England, Scotland and Wales who were born in one particular week in April 1970.
BIS Department for Business, Innovation and Skills The current ministerial department of the United Kingdom Government responsible for enterprise, business relations, regional development and fair markets, along with responsibility for science and innovation, further and higher education and skills.
BME Black and Minority Ethnic Groups A summarised descriptor used to distinguish non-white and culturally distinct minority groups and individuals within British society. In this report it is used to categorise people who describe their cultural background as anything other than ‘White British’, ‘White Irish’ and ‘White other’.
CBI Confederation of British Industry A third sector organisation representing UK businesses of all sizes and sectors.
CDELL Centre for Developing and Evaluating Lifelong Learning An agency which undertakes research programmes in lifelong learning, based in the School of Education at the University of Nottingham.
CHAID Chi-squared Automatic Interaction Detector An exploratory data analysis method used to study the relationships between a dependent measure and a large series of possible predictor variables that themselves may interact.
CLS Centre for Longitudinal Studies An ESRC resource centre based at the Institute of Education. It houses three internationally renowned birth cohort studies.
CPU Central Processing Unit The portion of a computer system that carries out the instructions of a computer program, to perform the basic arithmetical, logical, and input/output operations of the system.
DfES Department for Education and Skills The UK government department responsible for the education system and children's services in England between 2001 and 2007.
DIUS Department for Innovation, Universities and Skills The UK government department responsible for adult learning, some parts of further education, higher education, skills, science and innovation from June 2007 to June 2009, (It was created in June 2007 to take over some of the functions of the Department of Education and Skills and of the Department of Trade and Industry. In June 2009 it was merged into the newly formed Department for Business, Innovation and Skills.

The 2011 Skills for Life Survey: a Survey of Literacy, Numeracy, and ICT Levels in England
xxiv
EFL People for whom English is the First spoken Language
ENFL People for whom English is Not the First spoken Language
ESOL English for Speakers of Other Languages English spoken as a ‘second’ language (rather than as a ‘first’ language).
HE
Higher Education Education provision at a higher level than Level 3 qualifications. HE takes place primarily in universities and colleges, and can include degree courses, postgraduate courses and Higher National Diplomas.
HRP Household Reference Person The person within the household who is chosen to characterise the household's social position. This must be a householder (i.e. a person in whose name the accommodation is owned or rented). Where there are joint householders, the person with the highest income is selected. If two or more householders have exactly the same income the oldest is selected.
IA Initial Assessments Part of a suite of assessment tools commissioned by the Department for Education and Skills to support organisations with identifying adults with skills shortages.
IALS The International Adult Literacy Survey An international survey of adult literacy carried out in the 1990s. One of the first ever comparative surveys of adults designed to profile and explore literacy distributions amongst participating countries.
ICT Information and Communication Technology
IEA International Association for the Evaluation of Educational Achievement An independent, international cooperative of national research institutions and governmental research agencies. It conducts large-scale comparative studies of educational achievement and other aspects of education.
IMD Indices of Multiple Deprivation IMD identifies the most deprived areas across the country by combining a number of indicators covering a range of economic, social and housing issues, into a single deprivation score for each small area in England. The 2010 version of IMD uses 38 separate indicators, organised across seven distinct domains (income, employment, health and disability, education skills and training, barriers to housing and other services, and crime and living environment) which are combined using appropriate weights.
IRT Items Response Theory A statistical method for considering assessment performance and supporting assessment design, which is used extensively in the USA for assessment evaluation.
ITQ Information Technology Qualification A nationally-recognised programme designed by employers to meet the needs of businesses. It aims to develop computer skills that will help people do their job more effectively and productively.
The 2011 Skills for Life Survey: a Survey of Literacy, Numeracy, and ICT Levels in England
xxv
LSOA Lower Layer Super Output Area Geographic areas built from groups of contiguous Output Areas. LSOAs typically contain from four to six Output Areas with a minimum population of 1000 (the mean is 1500) and are automatically generated to be as consistent in population size as possible. LSOAs form a hierarchy designed to improve the reporting of small area statistics in England and Wales.
NCDS National Child Development Study A continuing, multi-disciplinary longitudinal study which takes as its subjects all the people born in one week in England, Scotland and Wales in one week in March 1958.
NFER The National Foundation for Educational Research A foundation for educational research which aims to improve education nationally and internationally by undertaking research and dissemination activities.
NOS The National Occupation Standards for IT users Statements of the standards of performance that individuals must achieve when carrying out functions in the workplace.
NRDC National Research and Development Centre A consortium of partners, dedicated to conducting research and development projects into adult literacy, numeracy, ESOL and ICT.
NSSEC National Statistics Socio-economic Classification An occupationally based classification which aims to differentiate positions within labour markets and production units in terms of their typical ‘employment relations’. The eight NS-SEC categories distinguish different positions (not people) as defined by social relationships in the workplace, i.e. by how employees are regulated by employers through employment contracts.
NQF National Qualifications Framework A framework which sets out the level at which a qualification can be recognised in England, Northern Ireland and Wales. The framework included Skills for Life qualifications. For vocational qualifications the NQF began to be superseded by the Qualifications and Credit Framework from 2011.
OA
Output Area The smallest geographic entities for which detailed 2001 Census results are available. OAs are built from clusters of adjacent unit postcodes. They are designed to have similar population sizes and be as socially homogenous as possible (based on tenure of household and dwelling type). OAs have an average population size of 125 households and around 300 residents, each clustered around a single mode. There are a total of 175,434 OAs in England and Wales (165,665 and 9,769, respectively).
OAC
Output Area Classification A geo-demographic and social classification tool which categorises geographic entities (Output Areas) according to key characteristics that are common to the population in that grouping.
OECD Organisation for Economic Co-operation and Development An international organisation which helps governments tackle economic, social and governances challenges of a globalised economy.
The 2011 Skills for Life Survey: a Survey of Literacy, Numeracy, and ICT Levels in England
xxvi
ONS Office of National Statistics An executive office of the UK Statistics Authority.
PIAAC The Programme for International Assessment of Adult Competences An international survey of adult skills, undertaken as a collaboration between governments, an international consortium of organisations and the OECD. The survey is taking place across OECD and partner countries in 2011, with results being published in 2013. It aims to measure the skills and competencies needed for individuals to participate in society and for economies to prosper.
PIRLS The Progress in International Reading Literacy Study An international study which aims to examine the trends in reading achievement of children aged 10 from different counties.
PISA The Programme for International Student Assessment An internationally standardised assessment that was jointly developed by participating economies that is administered to 15 year olds in schools. It has been conducted every three years to assess the extent to which students near the end of compulsory education have acquired some of the knowledge and skills essential for full participation in society. The PISA targets are however no longer extant.
PSA
Public Service Agreements Previous targets and objectives set for Government departments (which are no longer extant) which aimed at delivering modern responsive public services. Departmental budgets were linked to how departments perform in relation to PSAs.
PSU Primary Sample Unit A Primary Sampling Unit is the first sample entity drawn in a multi-stage sample.
QCA Qualifications and Curriculum Authority An organisation responsible for developing both the National Curriculum for children and young people and the National Qualifications Framework for learners and employers.
QCDA Qualifications and Curriculum Development Agency An organisation responsible for developing both the National Curriculum for children and young people and the National Qualifications Framework for learners and employers. Previously known as QCA (see above). QCDA closes in March 2012 with responsibilities transferring to the Department for Education.
QCF Qualifications and Credit Framework A system for recognising skills and qualifications. It allows achievements to be recognised and recorded through the award of credits and qualifications.
RATE Real Applications Test Environment A technology which employs real applications that are typical of modern office type applications in appearance, facilities and capability.
SfL2003 2003 Skills for Life Survey
SfL2011 2011 Skills for Life Survey
The 2011 Skills for Life Survey: a Survey of Literacy, Numeracy, and ICT Levels in England
xxvii
SIC UK Standard Industrial Classification SIC is used to classify business establishments, individuals and other statistical units by the type of economic activity in which they are engaged. The 2007 version of SIC is a hierarchical five digit system divided into 21 sections, each denoted by a single letter from A to U.
SMS Short Message Service Text messaging service component of a phone, web or mobile communication system.
SSAL The Scottish Survey of Adult Literacies A study of adult literacy in Scotland carried out in 2009, commissioned by the Scottish Government.
TIMSS The Trends in International Mathematics and Science Study An international study which measures tends in mathematics and science achievement in schools in 52 countries around the world.
UKCES The UK Commission for Employment and Skills A social partnership, led by Commissioners from large and small employers, trade unions and the voluntary sector. Their mission is to raise skill levels to help drive enterprise, create more and better jobs and economic growth.
Adaptive algorithm The literacy and numeracy assessments used in the Skills for Life surveys based on an ‘adaptive algorithm’. They are adaptive by selecting and presenting questions based on the scoring of candidates’ responses to previous questions.
Age groups and generations Age groups – The term used in this report which compares respondents of the same age between the 2003 and 2011 surveys e.g. 16-24 year-olds in 2003 and 16-24 year-olds in 2011.
Generations – The term used in this report which compares groups of respondents as they have aged over time between the 2003 and 2011 surveys e.g. 16-19 year-olds in 2003 and 24-27 year-olds in 2011.
Leitch Thresholds Levels referred to in the Leitch Review. The Leitch review set minimum standards for literacy and numeracy to allow the UK to meet its economic targets, and described these as ‘functional’ literacy (defined as Level 1 or above) and ‘functional’ numeracy (Entry Level 3 or above)
NQF Skill Levels The skill Levels set out in the NQF. This report includes breakdowns of literacy, numeracy and ICT across five lowest NQF Levels: Entry Level 1 is the national school curriculum equivalent for attainment at age 5-7. Adults below Entry Level 1 may not be able to write short messages to family or select floor numbers in lifts. Adults with ICT Entry Level 1 skills are able to get information from an ICT-based source and follow recommended safe practices. Entry Level 2 is the national school curriculum equivalent for attainment at age 7-9. Adults with below Entry Level 2 may not be able to describe a child’s symptoms to a doctor or use a cash point to withdraw cash. Adults with ICT Entry Level 2 skills are able to use ICT to communicate, as well as enter and edit small amounts of information
The 2011 Skills for Life Survey: a Survey of Literacy, Numeracy, and ICT Levels in England
xxviii
in ways that are fit for purpose and audience. Entry Level 3 is the national school curriculum equivalent for attainment at age 9-11. Adults with skills below Entry Level 3 may not be able to understand price labels on pre-packaged food or pay household bills. Adults with ICT Entry Level 3 skills are able to interact with and use an ICT system to meet needs, as well as present information in ways that are fit for purpose and audience. Level 1 is equivalent to GCSE grades D-G. Adults with skills below Level 1 may not be able to read bus or train timetables or check the pay and deductions on a wage slip. Adults with ICT Level 1 skills are able to select and use a variety of appropriate sources of information, as well as enter, organise, develop format and bring together information to suit content and purpose. Level 2 is equivalent to GCSE grades A*-C. Adults with skills below Level 2 may not be able to compare products and services for the best buy, or work out a household budget. Adults with ICT Level 2 skills are able to use a variety of appropriate sources of information and evaluate its fitness for purpose, as well as evaluate and use different methods of organising and presenting information, taking into account fitness for purpose and audience.
The 2011 Skills for Life Survey: a Survey of Literacy, Numeracy, and ICT Levels in England
xxix
Report Authors and Acknowledgements The 2011 Skills for Life survey was conducted by a partnership of two complementary agencies: TNS-BMRB, a research agency and AlphaPlus Consultancy Ltd. TNS-BMRB was responsible for all data collection and primary data processing, whilst AlphaPlus provided advice on Skills for Life policy and related issues throughout the survey. Both agencies were responsible for the analysis and reporting. TNS-BMRB authors: Carrie Harding, Eleni Romanou, Joel Williams and Mark Peters. AlphaPlus Consultancy Ltd authors: John Winkley, Peter Burke, John Hamer, Keith Jeram, Nick Nelson, Bob Rainbow, Bruce Bond and Malcolm Shay. The authors would like to acknowledge the support and advice provided during the course of the project by the project steering group. In particular we would like to thank Kris Chapman and Mark Langdon at the Department for Business, Innovations and Skills for their expertise and dedication in the management of this research project. We would also like to thank all the operation teams at TNS-BMRB for all their hard work on the project and all the interviewers who worked on the survey. Above all we would like to thank all those who gave up their time to take part in the survey.

Chapter 1: Summary of findings
1
1 Summary of Findings 1.1 The Skills for Life 2011 Survey
The Skills for Life 2011 Survey (SfL2011) was commissioned by the Department for Business, Innovation and Skills and designed to measure basic skills amongst people aged between 16 and 65 (inclusive) in England. In a large part, the survey replicated the Skills for Life 2003 Survey (SfL2003), using the same literacy and numeracy tools to assess people’s skills.
The aim of SfL2011 was to provide an evidence base upon which the government could judge what progress has been made on literacy and numeracy amongst adults of working age in England since 2003, while providing robust evidence on the standard of ICT skills in the population. This was achieved by administering 25-minute-long, computerised assessments in literacy, numeracy and ICT topics to respondents during their interviews. Additional information was collected from respondents during the face-to-face interviews to help understand the demographic, social and motivational factors related to basic skills.
In all, 7,230 interviews were conducted between May 2010 and February 2011. Literacy Levels were established for 5,824 individuals, and Numeracy Levels for 5,823 individuals. Over 2,220 people were rated on one or more of their ICT skills: specifically, 2253 on their word processing abilities, 2247 on their email skills, 2228 on their skills in using spreadsheets, and 2274 on their general ICT knowledge (based on answers given to a multiple choice questionnaire).
This report presents the main findings from SfL2011.
1.2 Profile of the population of 16-65 year-olds in 2011
SfL2011 was designed to provide an accurate reflection of the skills, behaviours, and views of people aged between 16 and 65 in England during 2010/11. Consequently, the proportion of respondents in each age band and ethnic group, the relative numbers of each gender, and the proportion who were disabled, employed, or outside the labour market, was representative of the broader population of 16-65 year-olds currently living in England.
Before looking at the SfL2011 findings, it is important to point out that the eight-year gap between SfL2003 and SfL2011 has seen two major changes in the demographic makeup of 16-65 year-olds. There are now more people who identify themselves as belonging to Black and Minority ethnic groups(14 per cent, up from nine per cent in 2003); and a greater proportion of people whose first language is not English (11 per cent, up from seven per cent in 2003). The increase of these groups in the population should be taken into consideration when interpreting the findings from SfL2003 and SfL2011.This aside, what can loosely be referred to as ‘the working age population’ has retained the same characteristics, consisting of a fairly even distribution of people across ten-year age bands and equal proportions of men and women.
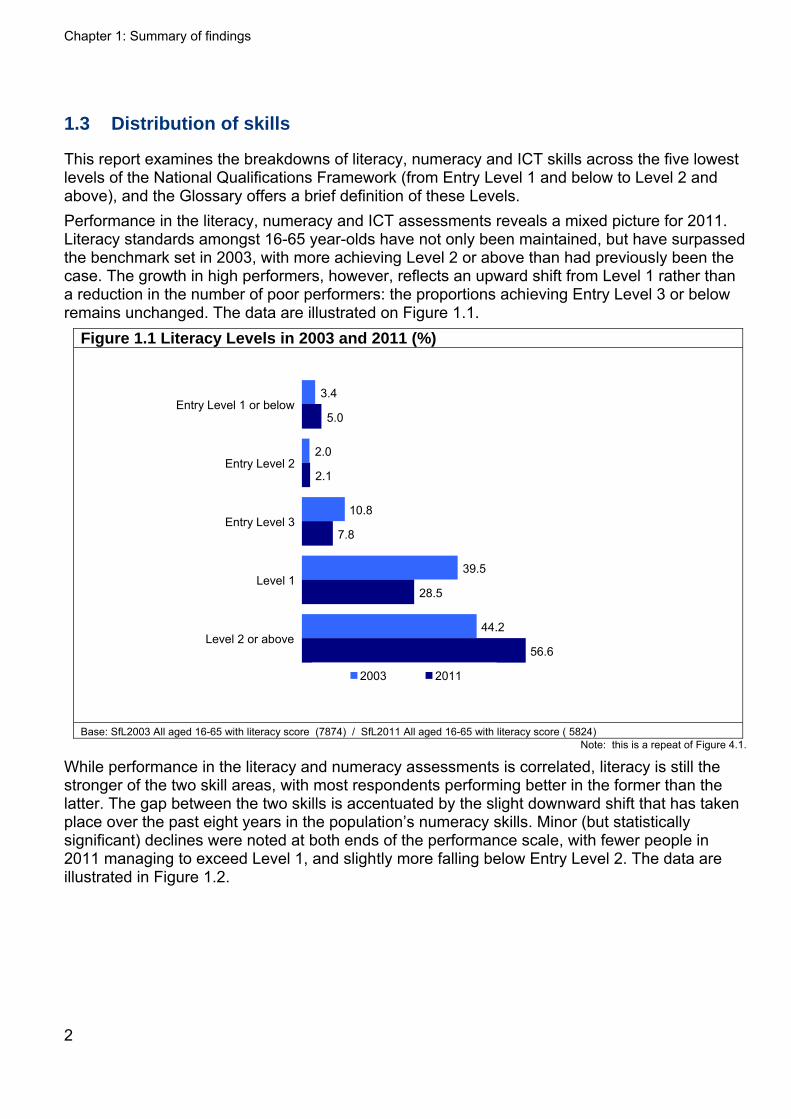
Chapter 1: Summary of findings
1.3 Distribution of skills
This report examines the breakdowns of literacy, numeracy and ICT skills across the five lowest levels of the National Qualifications Framework (from Entry Level 1 and below to Level 2 and above), and the Glossary offers a brief definition of these Levels. Performance in the literacy, numeracy and ICT assessments reveals a mixed picture for 2011. Literacy standards amongst 16-65 year-olds have not only been maintained, but have surpassed the benchmark set in 2003, with more achieving Level 2 or above than had previously been the case. The growth in high performers, however, reflects an upward shift from Level 1 rather than a reduction in the number of poor performers: the proportions achieving Entry Level 3 or below remains unchanged. The data are illustrated on Figure 1.1.
Figure 1.1 Literacy Levels in 2003 and 2011 (%)
Base: SfL2003 All aged 16-65 with literacy score (7874) / SfL2011 All aged 16-65 with literacy score ( 5824)
20112003
Level 2 or above
Level 1
Entry Level 3
56.6
28.5
7.8
44.2
39.5
10.8
2.0
2.1Entry Level 2
3.4
5.0Entry Level 1 or below
Note: this is a repeat of Figure 4.1.
While performance in the literacy and numeracy assessments is correlated, literacy is still the stronger of the two skill areas, with most respondents performing better in the former than the latter. The gap between the two skills is accentuated by the slight downward shift that has taken place over the past eight years in the population’s numeracy skills. Minor (but statistically significant) declines were noted at both ends of the performance scale, with fewer people in 2011 managing to exceed Level 1, and slightly more falling below Entry Level 2. The data are illustrated in Figure 1.2.
2
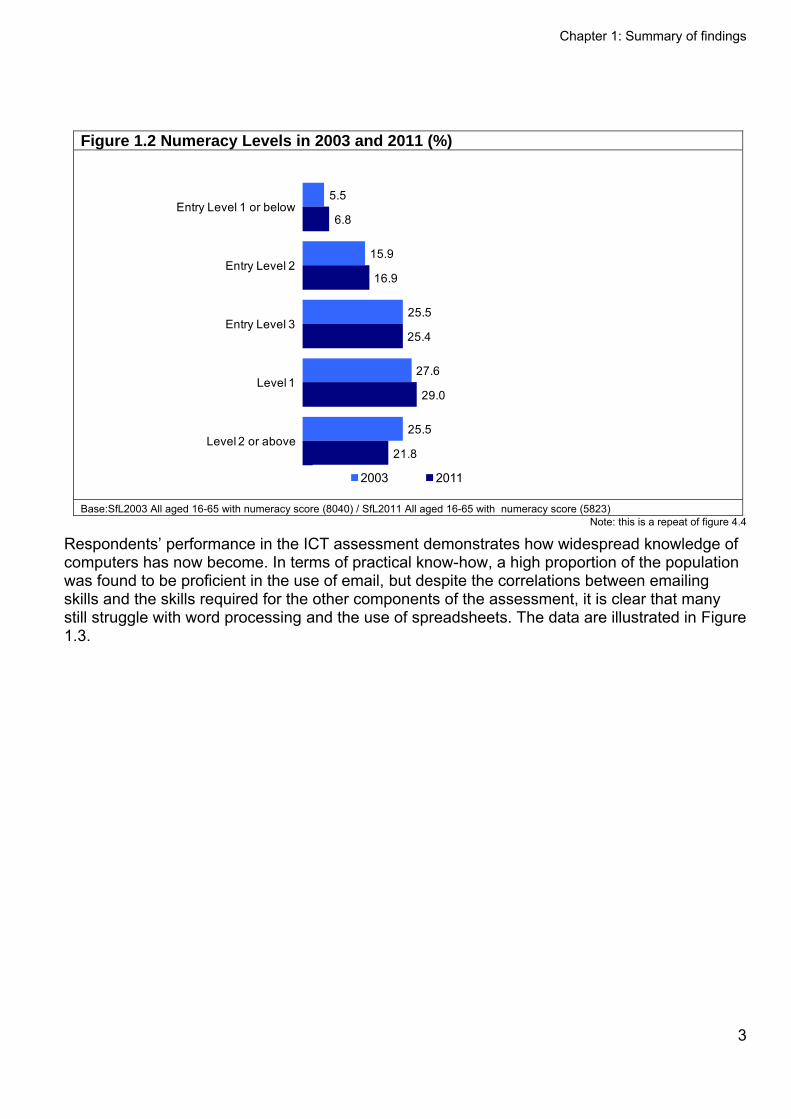
Chapter 1: Summary of findings
Figure 1.2 Numeracy Levels in 2003 and 2011 (%)
5.5
15.9
25.5
27.6
25.5
6.8
16.9
25.4
29.0
21.8
Entry Level 1 or below
Entry Level 2
Entry Level 3
Level 1
Level 2 or above
2003 2011
Base:SfL2003 All aged 16-65 with numeracy score (8040) / SfL2011 All aged 16-65 with numeracy score (5823) Note: this is a repeat of figure 4.4
Respondents’ performance in the ICT assessment demonstrates how widespread knowledge of computers has now become. In terms of practical know-how, a high proportion of the population was found to be proficient in the use of email, but despite the correlations between emailing skills and the skills required for the other components of the assessment, it is clear that many still struggle with word processing and the use of spreadsheets. The data are illustrated in Figure 1.3.
3
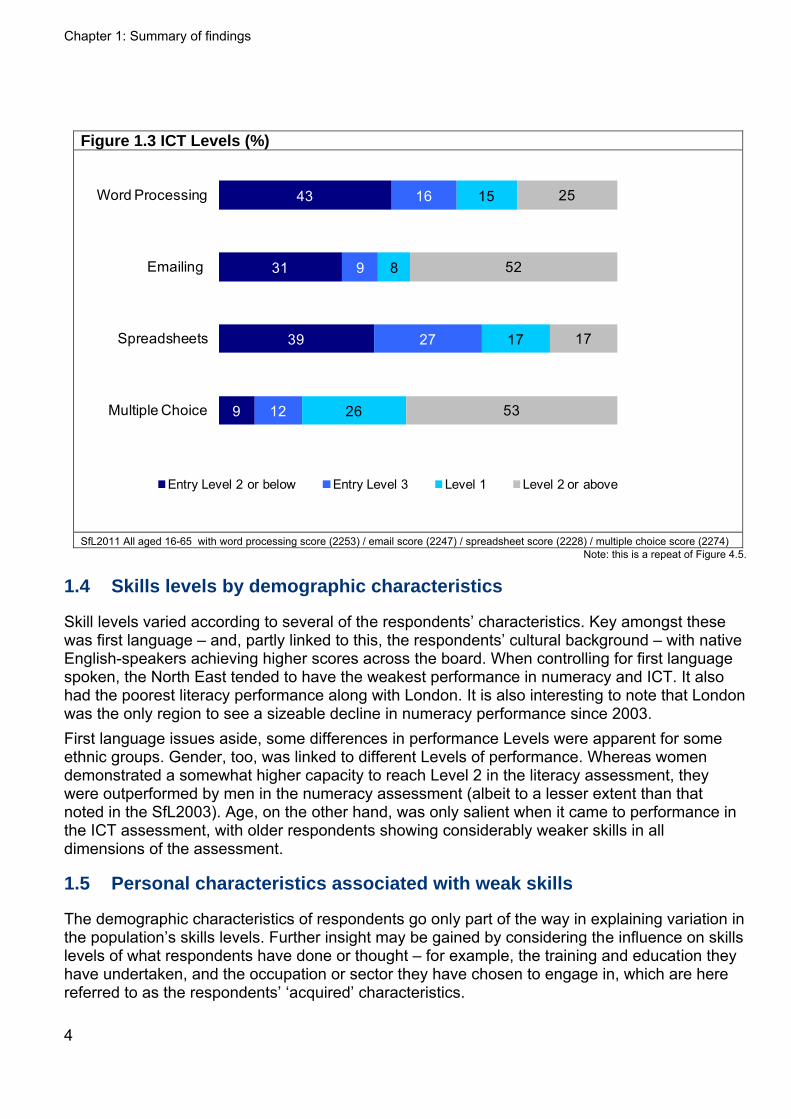
Chapter 1: Summary of findings
Figure 1.3 ICT Levels (%)
9
39
31
43
12
27
9
16
26
17
8
15
53
17
52
25
Multiple Choice
Spreadsheets
Emailing
Word Processing
Entry Level 2 or below Entry Level 3 Level 1 Level 2 or above
SfL2011 All aged 16-65 with word processing score (2253) / email score (2247) / spreadsheet score (2228) / multiple choice score (2274)
Note: this is a repeat of Figure 4.5.
1.4 Skills levels by demographic characteristics
Skill levels varied according to several of the respondents’ characteristics. Key amongst these was first language – and, partly linked to this, the respondents’ cultural background – with native English-speakers achieving higher scores across the board. When controlling for first language spoken, the North East tended to have the weakest performance in numeracy and ICT. It also had the poorest literacy performance along with London. It is also interesting to note that London was the only region to see a sizeable decline in numeracy performance since 2003. First language issues aside, some differences in performance Levels were apparent for some ethnic groups. Gender, too, was linked to different Levels of performance. Whereas women demonstrated a somewhat higher capacity to reach Level 2 in the literacy assessment, they were outperformed by men in the numeracy assessment (albeit to a lesser extent than that noted in the SfL2003). Age, on the other hand, was only salient when it came to performance in the ICT assessment, with older respondents showing considerably weaker skills in all dimensions of the assessment.
1.5 Personal characteristics associated with weak skills
The demographic characteristics of respondents go only part of the way in explaining variation in the population’s skills levels. Further insight may be gained by considering the influence on skills levels of what respondents have done or thought – for example, the training and education they have undertaken, and the occupation or sector they have chosen to engage in, which are here referred to as the respondents’ ‘acquired’ characteristics.
4
Chapter 1: Summary of findings
5
A range of demographic factors can help predict whether a SfL2011 respondent are more likely to have weak literacy (a score below Level 1): above all, having a first language other than English, having parents who did not continue their education past the age of 16, having a learning difficulty, or being aged 45 or older. Adding a “blue collar” occupation, infrequent or no use of computers, low qualifications and a lack of a Level 2 English qualification to the mix almost doubles the chances of a poor score. The extent to which these ‘acquired’ characteristics can sway respondents’ performance in the literacy assessment depends on how many of the ‘predictive’ demographic attributes each respondent holds, and the interaction between them. For numeracy, very similar demographic factors predict a weak skill Level. However, an important difference is the impact of gender, with being female predicting a weak score (below Entry Level 3). Similarly to literacy, the addition of certain ‘acquired’ characteristics almost doubles the explanatory power on the model, particularly by the inclusion of a lack of a Level 2 Maths qualification, low qualifications, infrequent computer use and working in particular industry sectors. Whilst attending a basic skills course does not appear to be associated with performance in either the literacy or the numeracy assessment, it is not possible to draw conclusions around the impact of training. A cross-sectional survey like this one is not an appropriate tool for judging what effects training might have had on skills Levels. SfL2011 does not measure the skills of individuals immediately before and after they attended a course: hence, it is not possible to track the progress that learners may have made as a result of their training. The absence of computer training, on the other hand, is one of several factors affecting ICT performance. The most significant influence on ICT Levels by far is age: this had more explanatory power than any other of the respondents’ demographic or ‘acquired’ characteristics. Having parents who did not continue in education beyond the age of 16, having a first language other than English, having a learning difficulty, lacking any qualifications, or being employed in a non-professional or managerial occupation were also significant predictors of weak ICT skills (below Entry Level 3 in all three practical components of the assessment).
1.6 Changes in literacy and numeracy performance over time
The use of the same assessment tools in the 2003 and 2011 surveys allows between cohort differences to be examined as well as passage of time differences. Little change in the literacy performance of each of the age groups is evident since 2003. However, the exception to this is amongst the oldest age group where an increase in skills is apparent. This may be a generational effect possibly due to the educational circumstances of this oldest group in the 2003 survey, who were raised during WII and may have lost out educationally.1 For numeracy, however, the emergent trend is different. The youngest age group in 2011 have far poorer numeracy skills than their equivalent counterparts in 2003. This cannot wholly be accounted for by the increase non-native English speakers in this age group as the trend is still apparent amongst native English speakers. Few passage of time effects are apparent for literacy, with the exception of the youngest generation reaching the standard of their slightly older peers, suggesting that for most people literacy reaches a ‘steady state’ by the mid twenties. For numeracy most generations display a small decline in skills between 2003 and 2011. This is most noticeable in the oldest generation,
1 The school leaving age was raised to 15 in 1947.
Chapter 1: Summary of findings
6
however, even there it is not dramatic. It seems unlikely that retirement is the causal variable, as retirees performed at a similar standard to their working counterparts. The language profile of some of the younger respondents has changed substantially between 2003 and 2011, and this obscures some of the emergent trends. This change in composition must be borne in mind when interpreting the generational analysis.
1.7 Basic skills and education
The impact of educational attainment on literacy, numeracy and ICT performance was relatively clear-cut: scores in all three assessments were higher amongst people who continued their education for longer or achieved higher qualifications, and low amongst those who terminated their education when they were young or did not pursue any qualifications. As might be expected, the relevance of the qualification held also made a difference to performance, with holders of an English GCSE (Grade C or above) having higher literacy skills than those without, and those with a Maths GCSE (Grade C or above) also performing better in the numeracy assessment than those without. However, it should be noted that not all who had achieved a grade C in GCSE English or maths in the past, demonstrated Level 2 in skills in literacy or numeracy (respectively) in SfL2011. Whereas the respondent’s own education clearly had a bearing on how they performed, parental education was an important factor for some, and less so for others. When respondents held no qualifications or only very low ones, their parents’ education made a substantial difference to their literacy and numeracy scores; for the rest of the population, parents’ achievements barely mattered. The last eight years have seen an increase in the proportion of 16-65 year-olds (particularly those in younger age bands) staying on in education for longer, holding qualifications, and gaining degrees. Set against this background, the stability in the overall proportion of respondents achieving Level 1 or above in literacy, or Entry Level 3 or above in numeracy, is worth remarking on. Level 2 or above literacy scores, on the other hand, have become more common since 2003 across the educational spectrum, from those who held a degree right through to those who held no qualifications at all.
1.8 Literacy and numeracy in everyday life
On the whole, people tended to be aware of their weaknesses and strengths in literacy and numeracy, with relatively few making over-claims about their abilities. Those who rated one of their abilities highly had a tendency to do the same regarding their other abilities; these were the same people most likely to perform well in the assessments. Perceived – and actual – strengths in literacy and numeracy were reflected, to some extent, in how often people chose to read, write and use calculations in their everyday lives. The respondents who professed themselves to have good reading skills were the most likely to own an extensive book collection (25 books or more) and were also the most regular readers of books, magazines or newspapers; all of these things, in turn, were linked to high literacy scores. In the same way, people who felt confident about their writing tended to write on paper more frequently (though less so in emails and texts, which require a level of comfort with technology), and performed well in the literacy assessment. Meanwhile, those who felt their numeracy was weak tended to avoid checking their bills and bank statements altogether. Many of the respondents who believed they had weak skills were concerned that their perceived shortcomings had impacted on their job opportunities, with the most poorly-skilled (as measured
Chapter 1: Summary of findings
7
by the assessments) most likely to report that they had felt some sort of impact. People who judged themselves to have weaknesses in reading were more inclined to believe that this posed a hindrance to their job prospects in 2011 than their counterparts had been in 2003 (though the same was not true of perceived deficiencies in either writing or maths, where no differences were apparent between 2003 and 2011). The escalation in anxiety concerning reading is perhaps best understood against the backdrop of an overall population whose confidence in literacy and numeracy has grown, with more 16-65 year-olds now willing to describe their abilities in reading, writing, and using numbers as ‘very good’. It is worth noting that this growth in confidence was not accompanied by unequivocal improvements in the population’s skills. While 2011 saw a rise in the numbers achieving Literacy Level 2 or above, there was no equivalent improvement in numeracy – instead, SfL2011 respondents seemed more inclined than their SfL2003 counterparts to misjudge or misrepresent their true abilities in working with numbers.
1.9 Basic skills in work
A good performance in the assessments was contingent, amongst other things, on the type of employment respondents were engaged in, and the very fact of being employed. People who were economically active, and particularly those working in the higher occupation categories (as defined by the NS-SEC classification) achieved higher scores than the rest of the population in all three assessments. Above-average performance was also noted amongst those employed in the Education, Information and Communication, and Public Administration sectors. Amongst the employed, full-time workers had better numeracy than respondents who worked on a part-time basis, but Literacy Levels did not vary between the two groups. In general, skills Levels appeared to be directly related to gross earnings. Respondents who were outside the labour market did not perform as well as those who were economically active. Those in receipt of working age benefits were especially likely to score poorly in the assessments; however, their scores were not out-of-step with those of other respondents who shared their demographic characteristics. The skills of the minority of respondents who were actively seeking work were no better than the skills of the remainder of unemployed 16-65 year-olds.
1.10 Basic skills and computer use
One of the most remarkable changes to have occurred over the last eight years is the dramatic rise in access to, and use of, computers. By 2011, the prevalence of computer activities such as searching the internet and emailing had risen greatly; there was a substantial expansion in weekly and daily usage of computers; computer users felt more self-assured about their ICT skills; and only a minority remained – mostly older members of the population – who had never used a computer or lacked an internet connection in their home. It is against this backdrop that the ICT skills levels of the 2011 respondents should be viewed. Simply put, performance in the assessment was positively correlated with experience of computers. Thus, the higher the frequency of computer usage or online activity, the higher respondents tended to score in the four components of the ICT assessment. Moreover, the more types of tasks a user performed on a computer or on the internet, the more likely they were to exhibit sound ICT skills. By contrast, respondents who lacked ready access to a computer in their home or workplace or who did not have internet access in their home tended to perform poorly, not only in the ICT assessments but also in the literacy and numeracy assessments.
Chapter 1: Summary of findings
8
1.11 Training in basic skills
The prevalence of training in literacy, numeracy and computer skills amongst 16-65 year-olds has remained unchanged since 2003, with ICT training by far the most common of the three types of training. While the demographic characteristics of those who attended a literacy or ICT course are the same as in SfL2003, the profile of numeracy learners has changed. The respondents now most likely to report having taken a course in basic maths were those in search of employment or aged below 25. SfL2011 does not measure the skills of individuals immediately before and after they attended a course: hence, it is not possible to track the progress that learners may have made as a result of their training. This, and the fact that little detail was collected about the nature of the training received, means it is not possible to discern from the survey what influence training might have on the skill Levels of those who receive it.
Instead, it is possible to infer from the data that respondents who sought out training, either in literacy or in numeracy, were generally those who felt the least confident about their abilities. Their literacy and numeracy were also weaker compared with the skills of respondents who never undertook training – a result, almost certainly, of having started off with lower skills than the general population. Current learners, who may not yet have felt the full benefit of the instruction they were receiving, performed less well than those who had already completed a course, but once a course was behind them there are indications that people tend to retain the skills they had gained. This is evidenced by the fact that people who trained more than three years ago performed no worse in the assessments that people who finished their training more recently (though not enough is known about skills levels prior to, and immediately subsequent to, training to be able to confirm this). People who attended a literacy course further in the past were also more likely than those who attended within the last three years to rate their literacy positively, suggesting that confidence in this skill may rise over time. Having weak skills did not always prompt people to seek out training. The vast majority of those who scored below Level 1 Literacy or Entry Level 3 Numeracy – and could therefore be described as having a substantial training need – did not enrol on any courses. Misplaced confidence may have played a part in hindering access, at least with regards to literacy courses: people who did not access a literacy course were more inclined than others with a training need to describe their reading and writing abilities as ‘very good’. Amongst those with a training need, those who had not yet attended a course were the least likely to have any plans for future learning. The picture regarding ICT training was slightly different. In this case, it was respondents who felt most confident about their abilities, and who possessed better ICT skills than the general population, who were most inclined to seek out training. The ICT scores of current learners were no different to the scores of past learners: an indication, perhaps, that learners already possess a degree of competence before they enrol, and can pick up additional skills fairly quickly once they begin their training.
1.12 Attitudes towards learning
The performance of respondents in the assessments owes to a host of practical and social factors and life circumstances but, to some degree, it also owes to their attitudes regarding learning, education and qualifications. People who had a positive outlook on learning – indicated by confidence in the learning process, a belief that ‘learning is fun’, and objections to notions
Chapter 1: Summary of findings
9
such as ‘learning isn’t for people like me’ – tended to be high performers across all three assessments. Likewise for those who believed qualifications were worth paying for, and those who felt that learning should be a lifelong process of personal development. Other attitudes were linked to poor scores. Respondents who felt they had got nothing useful out of school, for example, tended to have weak skills; though, encouragingly, they were the most likely to report that they wished they had continued further with their education. More generally, half of 16-65 year-olds had definite plans to undertake further learning in the next two to three years, mostly in job-related subjects, and more than half again were considering doing the same. Those who reported no such intentions had the most room to improve their skills.
1.13 A focus on policy sub-groups
The abilities of several socio-demographic groups were looked at more closely, as they are generally thought to require special support to improve their basic skills. In most regards, the picture surrounding these groups remains unchanged from that seen in 2003. As in the SfL2003, performance in the three assessments was poorer than average for respondents who were unemployed and in receipt of benefits; those not in education, employment or training (‘NEET’) respondents; those at risk of social and digital exclusion; individuals whose first language was not English; and respondents with limiting disabilities or self-reported learning difficulties. The two latter groups were the only ones to have shown any improvement, though this was limited to their literacy skills, with more now achieving Level 1 or above than had been the case eight years ago. Respondents under the age of 25 were also examined separately. The literacy of this group was of an equal standard to that of older respondents, while their ICT skills were stronger than average. Numeracy, however, was a particular weak point for this group. Their performance in the numeracy assessment was poor compared to other age groups, and scores were significantly worse than those of their counterparts from SfL2003. Young lone parents were even less likely to achieve Entry Level 3 or above in numeracy but did not otherwise stand out from the rest of the group.
1.14 A focus on sub-skills
Each of the skills measured by the assessments involve a range of sub-skills. It is possible for respondents to achieve broadly similar scores in one of the skills, say literacy, but at the same time vary in the strength of their individual sub-skills (e.g. spelling or grammar). Allowing for a range of caveats in the methodology used, it is possible to discern where respondents’ individual strengths and weaknesses lie. In general, profiles of sub-skills were very similar in 2003 and 2011. In literacy, reading and word recognition was the strongest skill area for both SfL2003 and SfL2011 respondents at all Literacy Levels. The 2011 population was strong in Comprehension, but generally weaker in most of the skills areas concerned with writing. In this respect, performance was similar to 2003. The biggest gap between the literacy skills of 2003 and 2011 respondents was in elements of Composition; the improvement in the latter skills area (as well as in Grammar and Punctuation) may lie behind the higher likelihood of SfL2011 respondents to reach Literacy Level 2 or above.
There were parallels between SfL2003 and SfL2011 respondents in respect of the numeracy sub-skills which they performed well. However, whilst the population at the two points in time
Chapter 1: Summary of findings
10
shared the same strengths and weaknesses, SfL2011 respondents never managed to outperform their SfL2003 counterparts.
In the ICT assessment, respondents tended to perform better in the multiple-choice knowledge component that in the practical components. Far fewer did well on the spreadsheet task, but success in this area was a good predictor of sound ICT knowledge and practical skills in other areas.
1.15 Comparison of assessments
The literacy and numeracy assessments used in 2003 and 2011 were identical, allowing scores to be compared across the two surveys. The assessments and standards that were selected for use in the Skills for Life Survey(s) included paper-based items borrowed from nationally-developed tests, such as those commissioned and owned by the three regulatory authorities for England, Wales and Northern Ireland (QCA, DELLS and CCEA), which were already 'tried and tested' in live assessments. In addition, new items were developed in 2003 to assess adults operating below Level 1, as testing at these levels did not exist at that time. The comparability of the assessments used in the survey(s) with those employed in the tests used by awarding organisations accredited to offer qualifications, as well as in other similar surveys, (including the International Adult Literacy Survey (IALS), the National Surveys of Adult Skills in Wales, The Scottish Survey of Adult Literacies (SSAL) and the Programme for the International Assessment of Adult Competences (PIAAC) are discussed in some detail in Chapter 14.
1.16 Conclusions
Following the substantial investment in adult skills provision since the Moser report there has been a large improvement in Level 2 and above literacy skills, but a lack of improvement in low level literacy and numeracy. Although the scope of this report is largely descriptive, the concluding section reflects on initial investigation of possible explanations for these findings. It demonstrates why the survey comparisons are reliable and then considers factors among the surveyed populations which might offer explanations, including the possibilities of skills loss, the effect of interventions and migration.
Chapter 2: Introduction
11
2 Introduction
General introduction
The first Skills for Life Survey (sometimes known as the National Baseline Survey of Adult Basic Skills) was commissioned by the then Department for Education and Skills (DfES) in 2002. The survey aimed to produce a national profile of adult literacy, numeracy, and information and communication technology (ICT) skills, and to assess the impact different skills had on people’s lives. The official report on the survey was published in October 2003.2
In 2010, the Department for Business, Innovation and Skills (BIS) commissioned a follow up to the 2003 survey, with the key purpose of identifying the change in Literacy and Numeracy Levels over time amongst the population of 16-65 year-olds in England to inform future policy. A major consideration was comparability in order to analyse changes in literacy and numeracy skills amongst the population between 2003 and 2011. For ICT however, there was a need to establish a new baseline as advances in technology since 2003 required a new and more valid assessment to be used in the survey (and as a result comparisons between the ICT results from the surveys in 2003 and 2011 are not drawn in this report).
Policy background and standards
The development of literacy and numeracy skills amongst lower-level employees is deemed to be a vital means of enhancing the UK’s global economic competitiveness. In 1999, the Moser Report estimated that there were 7 million people with skills below Level 1 in the UK, and it was claimed that people with poor literacy, language or numeracy skills are less productive at work, earn lower wages, are more likely to suffer from ill health and experience social exclusion. 3 Tackling this skills problem was given a high priority and in 2001 the Government launched its Skills for Life Strategy for improving the nation's skills in literacy, language and numeracy.4
A number of priority groups were identified, including:
1. the unemployed and those on benefits,
2 Williams, J., S. Clemens, S. Oleinikova, and K. Tarvin (2003) The Skills for Life Survey: a National Needs and Impact Survey of Literacy, Numeracy and ICT skills. Department for Education and Skills Research Report 490, available online at: https://www.education.gov.uk/publications/standard/publicationDetail/Page1/RR490, accessed on 28/03/12.
3 Moser, C. et al. (1999) Improving literacy and numeracy: a fresh start. The report of the working group chaired by Sir Claus Moser on behalf of the Department for Education and Skills, available online at: http://www.lifelonglearning.co.uk/mosergroup/index, accessed on 28/03/12: Annex A paragraphs 17-19. 4 Department for Education and Skills (2002) Skills for Life: The National Strategy for Improving Adult Literacy and Numeracy Skills. ‘What Works’ Early Findings from the Pathfinder Projects. Department for Education and Skills Research Report RR342, available online at https://www.education.gov.uk/publications/eOrderingDownload/RR342.pdf, accessed on 28/03/12.
Chapter 2: Introduction
12
2. prisoners and those supervised in the community,
3. low skilled employees,
4. public sector employees, and
5. other groups at risk of social exclusion.
National standards for literacy and numeracy were published in 2001 with an accompanying curriculum framework, and a number of regional pathfinder projects were set up to pilot new approaches to improving basic skills. Initiatives such as Move On also set out to encourage adults to engage in skills development programmes. Considerable investment was made for adult skills development and Public Service Agreement (PSA) targets were set to improve the literacy and numeracy skills of 2.25 million adults by 2010, with an interim target of improving the skills of 1.5 million adults by 2007.5
In October 2003, the publication of ‘The Skills for Life Survey: A national needs and impact survey of literacy, numeracy and ICT skills’ emphasised the need for the Government not to ease up on its drive to improve skills.6 Although the number of adults with literacy skills below Level 1 (equivalent to grade D-G GCSE) had fallen since the introduction of the Skills for Life Strategy, the survey revealed that 5.2 million adults still had literacy skills below this Level compared to the Moser estimate of 7 million in 1999. The number of adults with numeracy skills below Entry Level 3 had fallen only slightly to 6.8 million.
Further policy initiatives, such as the Skills White Paper7 and the 14-19 Education and Skills White Paper8 both published in 2005, were to follow. The Skills White Paper included Skills for Life as a main objective. The policy on 14-19 education stressed the importance of functional skills in English and mathematics, and established the place of ICT as an essential skill for the modern world and one of the skills that all young people are now expected to acquire as part of their education.
Further details about government policy regarding adult ICT skills can be found in the following sources:
5 HM Treasury (1998) Public Services for the Future: Modernisation, Reform, Accountability. Comprehensive Spending Review: Public Service Agreements 1999–2002, available online at: http://archive.treasury.gov.uk/pub/html/psa/csrpsa.pdf, accessed on 28/03/12.
6 Williams, J., S. Clemens, S. Oleinikova, and K. Tarvin (2003) The Skills for Life Survey: a National Needs and Impact Survey of Literacy, Numeracy and ICT skills. Department for Education and Skills Research Report 490, available online at: https://www.education.gov.uk/publications/standard/publicationDetail/Page1/RR490, accessed on 28/03/12.
7 Department for Innovation, Universities and Skills (2005) Skills: Getting on in Business, Getting on at Work. Government White Paper, available online at: https://www.education.gov.uk/publications/standard/publicationDetail/Page1/CM%206483, accessed on 28/03/12. 8 Department for Education and Skills (2005) 14-19 Education and Skills. Government White Paper, available online at: https://www.education.gov.uk/publications/eOrderingDownload/CM%206476.pdf, accessed on 28/03/12.

Chapter 2: Introduction
13
Government White Paper ‘21st Century Skills, Realising Our Potential’;9
‘Independent Review of ICT User Skills’ by Baroness Morris;10
‘Manifesto for a Networked Nation’ by Race Online 2012;11 and
Strategy document ‘Skills for Sustainable Growth’.12
The next important policy development was the Leitch Review of Skills.13 In his report, published in December 2006, Leitch proposed that by 2020, 95 per cent of adults should be able to achieve the basic skills of functional literacy and numeracy.
In March 2009, the Department for Innovation, Universities and Skills (DIUS) confirmed that over 5.7 million learners had taken training courses and 2.8 million had achieved nationally recognised qualifications, exceeding the 2010 Public Service Agreement target to improve the literacy, language and numeracy skills of 2.25 million adults more than two years early.14
Following the election in May 2010 the Coalition Government published its skills strategy for England, Skills for Sustainable Growth in which it set out the continuation of funding for adults to improve their literacy and numeracy skills.15 To improve the economic and personal returns to this investment, the Government announced that it would review how provision is delivered and take steps to make this training more effective, moving away from targets to focus on fully equipping individuals with the skills and qualifications they need to get a job, progress in work and play a full part in society. Following its review, in December 2011 the Government
9 Department for Education and Skills (2003) 21st Century Skills, Realising Our Potential. Individual, Employers, Nation. Government White Paper, available online at: http://www.bis.gov.uk/assets/biscore/corporate/migratedd/publications/2/21st%20century%20skills.pdf, accessed on 28/03/12. 10 Morris, E. (2009) Independent Review of ICT User Skills, available online at: http://www.dius.gov.uk/~/media/3F79A51589404CFDB62F3DA0DEBA69A1.ashx, accessed on 28/03/12. 11 Race Online 2012 (2010) Manifesto for a Networked Nation, available online at: http://raceonline2012.org/sites/default/files/resources/manifesto_for_a_networked_nation_-_race_online_2012.pdf, accessed on 28/03/12. 12 Department for Business, Innovation and Skills (2010) Skills for Sustainable Growth – Consultation on the Future Direction of Skills Policy. Strategy Document, available online at: http://www.bis.gov.uk/assets/biscore/further-education-skills/docs/s/10-1274-skills-for-sustainable-growth-strategy.pdf, accessed on 28/03/12.
13 HM Treasury (2006) Leitch Review of Skills. Prosperity for All in the Global Economy - World Class Skills. Final Report, available online at: http://webarchive.nationalarchives.gov.uk/+/http://www.hm-treasury.gov.uk/media/6/4/leitch_finalreport051206.pdf, accessed on 28/03/12: p62.
14 Department for Innovation, Universities and Skills (2009) Skills for Life: Changing Lives, available online at: http://www.bis.gov.uk/assets/biscore/corporate/migratedD/publications/S/SkillsforLifeChangingLives, accessed on 28/03/12. 15 Department for Business, Innovation and Skills (2010) Skills for Sustainable Growth – Consultation on the Future Direction of Skills Policy. Strategy Document, available online at: http://www.bis.gov.uk/assets/biscore/further-education-skills/docs/s/10-1274-skills-for-sustainable-growth-strategy.pdf, accessed on 28/03/12.
Chapter 2: Introduction
14
published the actions it is taking in New Challenges, New Chances - Further Education and Skills System Reform Plan: Building A World Class Skills System.16
Research aims and objectives
The Skills for Life 2011 Survey (SfL2011) was commissioned in order to update the baseline information collected about adult literacy and numeracy in the Skills for Life 2003 Survey (SfL2003), and to set a more functional baseline than was possible in 2003 for the present ICT skills among adults aged between 16 and 65 (inclusive) by using a more task-based assessment of ICT skills. The aims were to provide an evidence base upon which the government could judge what progress has been made on literacy and numeracy amongst the adult population (aged 16 to 65) of England, and to inform policy development while also providing more robust evidence on ICT skills among this population (focusing on practical abilities in word processing, emailing and spreadsheet usage as well as awareness of ICT issues).
The purpose of the survey was also to understand the demographic, social and motivational factors related to skills using information elicited from a background questionnaire administered to all respondents.
The Skills for Life 2003 Survey
SfL2003 was commissioned by the then DfES, and fieldwork was carried out between June 2002 and May 2003. Interviews were conducted with 8,730 adults aged between 16 and 65, and 4,656 of these respondents completed a second interview. The first interview comprised a ‘background’ questionnaire, collecting behavioural and demographic data, and two assessments, one for literacy and one for numeracy. The second interview comprised two ICT assessments, the first an assessment of awareness, and the second an assessment of practical skills.
The aims of SfL2003 were to produce a national profile of adult basic skills over five broad levels of competence corresponding with the National Standards for adult literacy and numeracy and to assess the impact different skills had on people’s lives.
The results of the literacy assessment indicated that almost half the respondents (44 per cent) achieved Level 2 or above, whilst 16 per cent were classified as Entry Level 3 or below. Respondents tended to perform at a lower standard in the numeracy assessment, with only a quarter achieving Level 2 or above, and 47 per cent were classified as Entry Level 3 or below. In the ICT assessment, 50 per cent were recorded at Level 2 or above in awareness terms, with 25 per cent at Entry Level or below, but only nine per cent demonstrated Level 2 practical skills with
16 Department for Business, Innovation and Skills (2011) New Challenges, New Chances – Further Education and Skills System Reform Plan: Building a World Class Skills System. Strategy Document, available online at: http://www.bis.gov.uk/assets/biscore/further-education-skills/docs/f/11-1380-further-education-skills-system-reform-plan.pdf, accessed on 28/03/12.
Chapter 2: Introduction
15
53 per cent at Entry Level or below. The full survey report was published in 2003 and is available online.17
Development and piloting of the Skills for Life 2011 Survey
For literacy and numeracy the decision was taken to use the same tools used in 2003 to ensure absolute comparability between the 2003 and 2011 surveys. For ICT the decision was taken to include the new RATE ICT assessment in the 2011 survey (but not to attempt to draw comparisons with results from the ICT assessment made in 2003).
A detailed description of how the assessments used in SfL2011were developed and piloted, and the background to the decision taken to reuse the 2003 tools for the purposes of comparability are contained in Annex 2.
In 2009, BIS commissioned a research development and piloting project to consider the best design options for the new Skills for Life survey which was planned to be conducted in 2010/11. The research development and piloting project was conducted by the AlphaPlus Consultancy and TNS-BMRB and carried out in three phases:
Phase 1 – a review of the tools used in the 2003 survey and provisional recommendations on tools for the 2011 survey,
Phase 2 – the conduct of a Pilot Survey,
Phase 3 – final recommendations on the tools for the 2011 survey.
The main activities in Phase 1 were to:
review the literacy and numeracy assessment tools used in the 2003 survey to judge their suitability for use in the 2011 survey;
review the ICT tool used in the 2003 survey to judge its suitability for use in the 2011 survey;
consider alternative assessment tools that might be suitable for the planned SfL2011 survey;
make recommendations for the assessment tools to be used in the 2011 survey; and develop for potential use in the 2011 survey: new literacy and numeracy assessment
tools (based primarily on the existing Skills for Life Initial Assessment tools) and an ICT assessment tool using the Real Applications Test Environment (RATE) technology.
Phase 2 of the research development and piloting project was the conduct a Pilot Survey with a sample group of around 1000 interviewees. The purpose of the pilot survey was to:
17 Williams, J., S. Clemens, S. Oleinikova, and K. Tarvin (2003) The Skills for Life Survey: a National Needs and Impact Survey of Literacy, Numeracy and ICT skills. Department for Education and Skills Research Report 490, available online at: https://www.education.gov.uk/publications/standard/publicationDetail/Page1/RR490, accessed on 28/03/12.
Chapter 2: Introduction
16
examine the feasibility of generating a conversion function for use in the 2011 survey which would allow results from the alternative Skills for Life literacy and numeracy assessments to be calibrated against results for the 2003 assessments and hence the survey results from 2003;
review the functioning of the alternative literacy and numeracy assessments as survey tools; and
assess the suitability of the proposed RATE ICT assessment tool for use in the 2011 survey.
In Phase 3, the research development and piloting project team analysed the outcomes of the Phase 2 pilot together with the evidence from the Phase 1 review and recommended that the alternative Skills for Life literacy and numeracy tools, and the RATE ICT tool should be used for SfL2011. However, the decision was taken to use the 2003 literacy and numeracy tools to ensure absolute comparability between the 2003 and 2011 Skills for Life surveys which is a key objective of the research. The new ICT assessment tool was, however, adopted for the 2011 survey.
The Skills for Life 2011 Survey
Fieldwork for SfL2011 was carried out between May 2010 and February 2011, with 7,230 interviews being conducted. The survey population was all adults aged between 16 and 65 (inclusive), normally resident in England. Residents of institutions were excluded for practical reasons. The interview comprised the background questionnaire followed by a pre-assigned random combination of two of the three skills assessments: literacy, numeracy and ICT. The assessments were presented in a randomised order. In total, 6,049 respondents were assigned to the literacy assessment, 6,053 respondents were assigned to the numeracy assessment and 2,358 respondents were assigned to the ICT assessment. The interview lasted on average 70 minutes. Prior to the interview, all households which were selected to take part in the survey were sent an advance letter and information leaflet about the survey and informed consent was sought and obtained from all respondents. In line with the 2003 survey, in some rare cases respondents were excused from the literacy and numeracy assessments. These included:
1. Anyone who said they could not read English when asked in the background questionnaire. 2. Respondents who said their reading of English was ‘poor’ and required a full translation of
the background questionnaire. These respondents were given the option of continuing or not.
3. Those who required help with the background questionnaire due to poor eyesight. These respondents were given the option of continuing or not.
In addition, respondents who said they had never used a computer before were excluded from the ICT assessment. The background questionnaire The background questionnaire was designed to collect a broad set of relevant demographic and behavioural data. A refined and updated version of the SfL2003 background questionnaire was used; redundant items were removed and some new questions were added. The development
Chapter 2: Introduction
17
and piloting of the questionnaire took place in the 2009 development project. The questionnaire took 20-25 minutes to complete and covered the following topics: Household structure
Languages and ethnicity
Use of computers and any training received
Internet use
Education and qualifications
Self-assessment of skills in speaking, reading and writing English
Self-assessment of working with numbers
Any training taken to improve such skills
Attitudes towards learning
Current / most recent employment
Other social, economic and demographic data (including health, housing tenure, income etc.)
The full questionnaire is included in Annex 3. In the questionnaire respondents pre-selected to complete the ICT assessment were asked a small number of additional questions predominately regarding their use of computers. Further details of these are documented in the questionnaire.
The skills assessments The literacy, numeracy and ICT survey tools were designed to take a maximum of 25 minutes each to complete. The literacy and numeracy assessments are adaptive, selecting and presenting questions based on the scoring of respondents’ responses to previous questions. This approach reduces the overall assessment time, and helps to maximise the number of questions that challenge respondents (without being too easy or difficult), hence improving completion rates.
Respondents typically answer 25 literacy questions out of 70, depending on the route they take through the assessment. The assessment starts with screening questions which make an assessment of level at Entry Level, Level 1 or Level 2, and then proceeds through two blocks of approximately eight questions covering a mixture of topics at a standard of difficulty determined on the basis of the assessment of Level in the preceding block. The judgement of a respondent’s final Level is based on a combination of the standard of difficulty of the final block attempted and a series of cut scores (that define the borderlines between the different skill Levels) for the score achieved on the final block.
Respondents answer 19 numeracy questions from a bank of 48 questions. Following a screening phase of nine items, respondents are routed according to a provisional judgement of
Chapter 2: Introduction
18
level, and then 10 further questions at suitable standards are presented with each subsequent question selected based on performance on the previous question. The respondent’s score is totalled and weighted according to the Level of the question (Entry Level 1 questions count for 1 mark, Level 2 questions count for 5 marks), and the respondent’s total score is compared against a set of cut scores to determine final Level.
The use of partly compensatory approaches to assess a person’s Level (allowing strength in one area to compensate for weakness in another) is counter to most practice in competency assessment. However, the design constraints of the assessment made it essential: the assessments had to make a judgement about Level for a very wide range of skills in just 25 minutes. For example, in numeracy an Entry Level 1 task involves calculating how many coins are left from a pile of ten after four have been removed, whereas at Level 2 candidates are expected to assess (in fractions and percentages) the price reduction if a customer receives nine free bars in a packet of 27. In terms of school age this represents the assessment of skills from the lower end of Key Stage 1 (age 5-6) through to average performance at GCSE (Key Stage 4 age 14-16). Similar challenges apply to the literacy assessment. With such a broad range of ability to assess in such a short time, an adaptive approach with a degree of compensation was deemed essential to producing a reliable assessment measure.
The ICT assessment does not function adaptively. It is presented in four separate sections: word processing, email and spreadsheet skills, and a set of 15 multiple choice questions assessing other ICT skills such as internet use. All items in the ICT assessment were written from scratch with consideration of the nature of assessment activities included in contemporary ICT skills assessments such as Functional Skills. The assessment requires respondents to undertake real ICT tasks such as entering formulae into cells on a spreadsheet, creating, addressing and sending an email, creating and editing a document including tables and embedded images. Respondents’ scores for each task are totalled and compared against cut scores to produce an outcome Level for each assessment area individually. No attempt is made to aggregate skills into a single outcome level for ICT because the skill Levels on each of the applications can vary widely.
The research team SfL2011 was conducted by a partnership of two complementary agencies: TNS-BMRB, a research agency, and AlphaPlus Consultancy Ltd.
TNS-BMRB was responsible for all data collection and primary data processing, whilst AlphaPlus provided advice on Skills for Life policy and related issues throughout the survey. Both agencies were responsible for the analysis presented in this report.
Comparison between the 2003 and 2011 surveys Complete comparability between SfL2003 and SfL2011, in terms of methods and tools used, was regarded as key to the 2011 survey. The sampling strategy, while interviewing fewer respondents (6,049 respondents allocated to literacy assessments, 6,053 to numeracy assessments and 2,358 to ICT assessments), was designed to achieve a similar effective sample size to that achieved in 2003, and uses 2003 statistical wards as the Primary Sampling Units to ensure comparability. The weighting and imputation strategy used were similarly in line with those used in 2003. Full details can be found in Annex 1.
Chapter 2: Introduction
19
As discussed in Section 2.6.1, the SfL2011 background questionnaire was largely identical to the SfL2003 version. As a result of the development stage, some redundant items were removed, and additional questions around attitudes and behavioural motivations towards learning and skill development were included. Further details about the development of the questionnaire are provided about this in Annex 3. As detailed at the start of Section 2.6, in some rare cases respondents were excluded from the literacy and numeracy assessments, and the rules for this were identical to those implemented in SfL2003.
The same literacy and numeracy skills assessments were used in both SfL2003 and SfL2011 to ensure the results of the two surveys were comparable. To further ensure comparability with SfL2003, none of the items in the literacy and numeracy assessment used in the research development and piloting project (prior to the main stage) were altered.
A small number of data collection errors had occurred in 2003 (this is discussed in more detail in Annex 4). To safeguard against the possibility of a repeat of this data non-capture in SfL2011, a ‘security wrapper’ was used to surround the software and report on any errors in its operation or errors involving modification of the core software from 2003. No data non-capture issues were reported in SfL2011.18
An entirely new ICT assessment was developed for SfL2011, so the issue of comparability did not arise.
Scope and structure of the report
This report presents the findings from SfL2011 in relation to the research aims and objectives stated in Section 2.3. The report is largely descriptive; however, it does include some small elements of regression modelling and simple generational analysis.
Whilst analysis of literacy and numeracy skills was conducted across the full five Level distribution (from Entry Level 1 and below to Level 2 and above),19 the majority of the analysis presented in the report is focused around the threshold Levels referred to in the Leitch Review,20 which, for literacy was Level 1 or above; and for numeracy was Entry Level 3 or above. It should be noted that these are now historical in terms of Public Service Agreement targets, which currently focus more on outcomes at Level 2 and above.
18 Follow-up work was conducted to quantify the potential impact of the data non-capture detailed in Annex 6. 19 The Skills for Life Levels are described in Chapter 14, and published in the Skills for Life core curricula. For literacy, see: Department for Education and Skills (2001) Adult Literacy Core Curriculum including Spoken Communication, available online at: http://rwp.excellencegateway.org.uk/resource/Adult+literacy+core+curriculum/pdf/, accessed on 28/03/12. For numeracy, see: Department for Education and Skills (2001) Adult Numeracy Core Curriculum, available online at: http://rwp.excellencegateway.org.uk/resource/Adult+numeracy+core+curriculum/pdf/, accessed on 28/03/12. 20 HM Treasury (2006) Leitch Review of Skills. Prosperity for All in the Global Economy - World Class Skills. Final Report, available online at: http://webarchive.nationalarchives.gov.uk/+/http://www.hm-treasury.gov.uk/media/6/4/leitch_finalreport051206.pdf, accessed on 28/03/12, p62.
Chapter 2: Introduction
20
For the ICT assessment the issue of threshold skills21 is less clear cut, and therefore analysis focuses on the full distribution of Levels. However, the majority of tables in the report body display Email Levels, Word Processing Levels, Spreadsheet Levels and Multiple Choice Levels (reflecting ICT and internet awareness) using the aggregated categories: ‘Entry Level 2 and below’ and ‘Entry Level 3 and above’. These categories are used as a proxy for ‘adequate’ ICT skills. Where tables with the full distribution of Levels are not included in the main report chapters, these can be found in the Appendix of tables.
This report is divided into the following sections:22
Chapter 1 Summary of Findings
Chapter 2 Introduction
Chapter 3 Profile of the population of 16-65 years olds in 2011
Chapter 4 Distribution of literacy, numeracy and ICT skills
Chapter 5 Skill Levels and demographic subgroups
Chapter 6 Understanding the relationship between skills and personal characteristics
Chapter 7 Education
Chapter 8 Literacy, numeracy and ICT skills in everyday life and work
Chapter 9 Computer use
Chapter 10 Training in basic skills
Chapter 11 Attitudes towards learning
Chapter 12 Analysis of policy subgroups
Chapter 13 Spiky Profiles
Chapter 14 Comparison of survey results against other surveys and standards
Chapter 15 Summary of findings and conclusions
21 Note that the Leitch threshold Levels as defined in the Leitch and Moser reports refers to adequate levels of skills (based on the Basic Skills levels in place in 1999 in the case of Moser, and their successor standards, the Skills for Life core curricula for literacy and numeracy). The term does not relate to Functional Skills, a new set of qualifications, introduced in pilot in 2007 which cover Entry Levels 1 to 3 and Levels 1 and 2, and which are described in more detail in Chapter 14. 22 Note that the Appendix of Tables and Annexes are in two separate documents.
Chapter 2: Introduction
21
The following appendix and annexes are also included as part of the report:
Appendix of Tables
Annex 1 Research design and conduct
Annex 2 Development and piloting of the Skills for Life survey tools
Annex 3 Development of the background questionnaire
Annex 4 Performance analysis of the assessment tools
Annex 5 The use of correlation coefficients in the 2011 Skills for Life survey
Annex 6 Quantification of the ‘data-non capture’ issue affecting the 2003 Skills for Life survey
Annex 7 Regression model coefficients
Annex 8 Tree diagrams based on the regression model variables
Notes on the report
Significance testing has been carried out at the five per cent confidence level unless otherwise stated. All comparative data described in the report text are statistically significant unless otherwise stated.
The figures presented in this report have been weighted to take account of the sample design and non-response. Details of the weighting applied are provided in Annex 1. All bases given in the tables or charts are, however, unweighted.
When interpreting the analysis presented in this report, issues around the correspondence of variables should be borne in mind. There is a key distinction between a correlation relationship and a causal relationship; a correlation between two variables does not imply that one causes the other, and therefore assumptions should not be made about causality.
Any data referred to in the report that is not included in a table or chart as part of the relevant chapter can be found in the Appendix tables.
The majority of percentages are rounded to the nearest whole number. However, there are a small number of exceptions where it was felt that data presented to the nearest single decimal place was more appropriate and useful (for example the comparative analysis of the SfL2003 and SfL2011 headline findings presented in Chapter 4).
All tables unless otherwise stated show column percentages.
Chapter 2: Introduction
22
The percentage in the table columns do not always add to 100 per cent due to rounding. Where percentages in the text differ to the sum of percentages in the tables this too will be due to rounding.
A * symbol in a table signifies a value between 0 and 0.49, while a – symbol signifies a zero.
Where a table or figure displays data where multiple responses were permitted, this is indicated at the bottom on the table.
Some tables and figures display data based on a very small number of respondents. Where the base size is 50 or less this is indicated, and such data must be treated with caution.
Chapter 3: Population profile
23
3 Population profile 3.1 Key findings
This chapter provides a descriptive overview of the population which took part in the Skills for Life 2011 Survey. The survey population was all adults aged between 16 and 65 (inclusive), normally resident in England. In 2011, England’s population of 16-65 year-olds was evenly split between men and
women and across ten-year age-bands. One in seven belonged to Black and Minority Ethnic groups, and a similar proportion had a limiting disability. Two thirds were in paid work. Home ownership was reported by three fifths of the population, and 14 per cent earned £30,000 or more per annum in gross earnings.
Five of the respondents’ demographic characteristics form the core analytical variables used in this study: gender, age, ethnicity, limiting disability, and working status. Where appropriate, additional variables have also been used to categorise respondents and analyse their responses.
Certain demographic subgroups overlap in their compositions and, for this reason, frequently appear together in the report in association with a specific behaviour, level of ability, or attitude. The most common instances of this concern people aged 45-65, people who finished their education before the age of 17, and people who were not in work. Two more groups which often appear together because their compositions overlap are those which consist of people from Black and Minority Ethnic backgrounds and people whose first language is not English.
Since 2003, the population has seen an increase in the proportion of people from Black and Minority Ethnic backgrounds and people whose first language is not English. This may lie behind some of the differences between the findings from the two surveys.
3.2 Introduction
This chapter provides a descriptive overview of the population which took part in the Skills for Life 2011 Survey. Its aim is to familiarise readers with the basic demographic characteristics of the SFL2011 respondents. Since much of the analysis in the present report is based on these demographic attributes, another aim of the chapter is to introduce the core analytical variables used in this study and discuss their inter-relationships.
The SFL2011 data has been ‘weighted’ in order to compensate for the fact that individuals did not have a completely even chance of being selected for an interview, or of being willing to
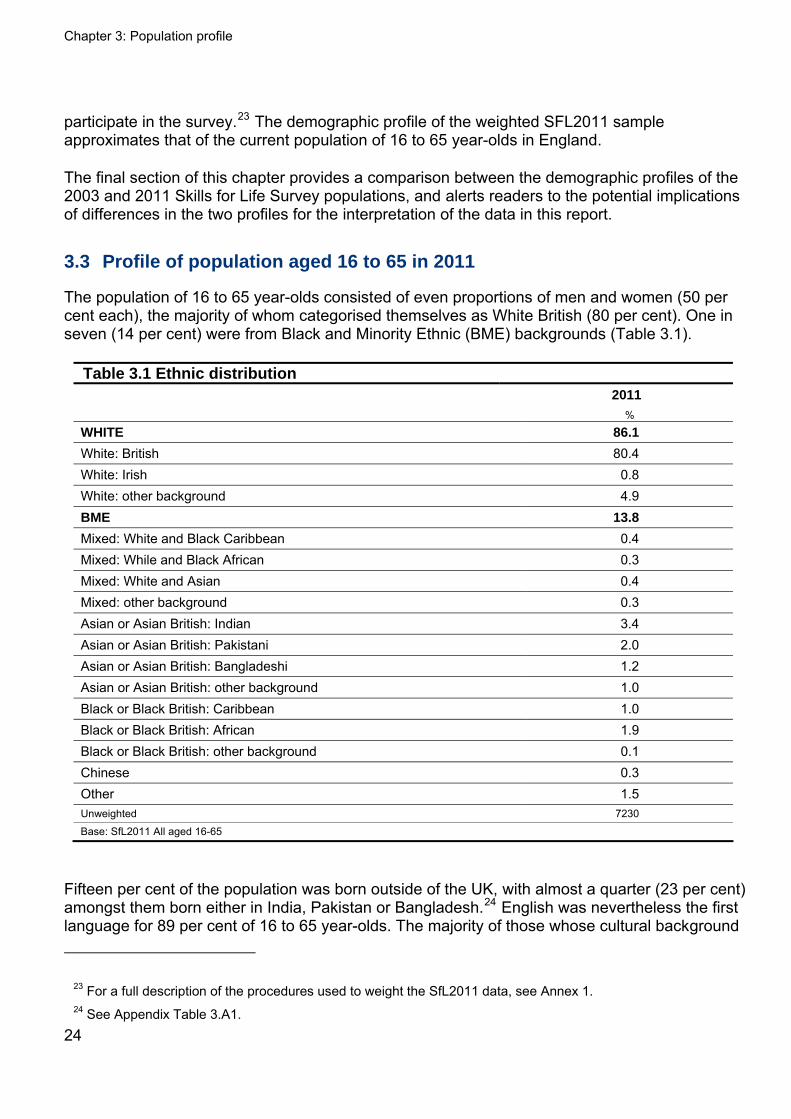
Chapter 3: Population profile
24
participate in the survey.23 The demographic profile of the weighted SFL2011 sample approximates that of the current population of 16 to 65 year-olds in England.
The final section of this chapter provides a comparison between the demographic profiles of the 2003 and 2011 Skills for Life Survey populations, and alerts readers to the potential implications of differences in the two profiles for the interpretation of the data in this report.
3.3 Profile of population aged 16 to 65 in 2011
The population of 16 to 65 year-olds consisted of even proportions of men and women (50 per cent each), the majority of whom categorised themselves as White British (80 per cent). One in seven (14 per cent) were from Black and Minority Ethnic (BME) backgrounds (Table 3.1).
Table 3.1 Ethnic distribution 2011
%
WHITE 86.1
White: British 80.4 White: Irish 0.8 White: other background 4.9 BME 13.8
Mixed: White and Black Caribbean 0.4 Mixed: While and Black African 0.3 Mixed: White and Asian 0.4 Mixed: other background 0.3 Asian or Asian British: Indian 3.4 Asian or Asian British: Pakistani 2.0 Asian or Asian British: Bangladeshi 1.2 Asian or Asian British: other background 1.0 Black or Black British: Caribbean 1.0 Black or Black British: African 1.9 Black or Black British: other background 0.1 Chinese 0.3 Other 1.5 Unweighted 7230
Base: SfL2011 All aged 16-65
Fifteen per cent of the population was born outside of the UK, with almost a quarter (23 per cent) amongst them born either in India, Pakistan or Bangladesh.24 English was nevertheless the first language for 89 per cent of 16 to 65 year-olds. The majority of those whose cultural background
23 For a full description of the procedures used to weight the SfL2011 data, see Annex 1. 24 See Appendix Table 3.A1.

Chapter 3: Population profile
25
was Other White, Black or Black British African, Asian or Asian British, Chinese, or Other did not have English as their first language (ENFL).25
People with ENFL made up just 11 per cent of the overall population, but constituted over one in six of the population of 25-34 year-olds (17 per cent) and around one in seven 35-44 year-olds (13 per cent).26 Further information about people with English as a first language (EFL) and people with ENFL – such as their distribution across Regions – is presented in Chapter 5.
The population was unevenly distributed across England, with over three in ten living in London and the South East (Table 3.2). The population in most Regions was White, but London accommodated a disproportionately large number of people from BME backgrounds (40 per cent, compared with an average of 14 per cent nationwide).27 Londoners were also disproportionately more likely than people from other Regions not to have English as their first language.28
Table 3.2 Distribution across Regions 2011
%
South East 16.1 London 15.8 North West 13.2 East 10.9 West Midlands 10.3 Yorkshire and the Humber 10.2 South West 9.8 East Midlands 8.6 North East 5.0 Unweighted 7230
Base: SfL2011 All aged 16-65
The population was distributed in roughly equal proportions across ten-year age bands (Table 3.3).
25 This was also the case in SFL2003, although the proportion of people from Other White backgrounds with ENFL has risen since 2003 by 13 percentage points. See Appendix Tables 3.A2 and 3.A3. 26 In 2003, people with ENFL were over-represented only amongst the 25-34 age bracket. See Appendix Tables 3.A4 and 3.A5. 27See Appendix Table 3.A6. 28 See Appendix Table 3.A7.
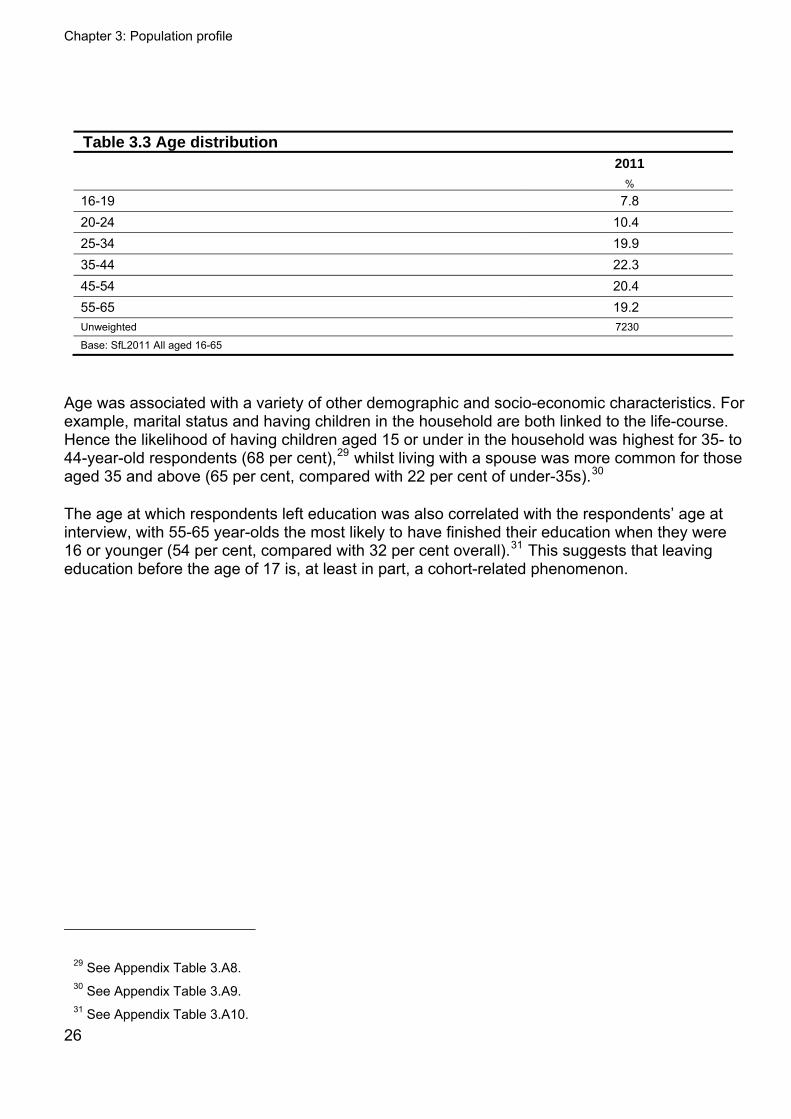
Chapter 3: Population profile
26
Table 3.3 Age distribution 2011
%
16-19 7.8 20-24 10.4 25-34 19.9 35-44 22.3 45-54 20.4 55-65 19.2 Unweighted 7230
Base: SfL2011 All aged 16-65
Age was associated with a variety of other demographic and socio-economic characteristics. For example, marital status and having children in the household are both linked to the life-course. Hence the likelihood of having children aged 15 or under in the household was highest for 35- to 44-year-old respondents (68 per cent),29 whilst living with a spouse was more common for those aged 35 and above (65 per cent, compared with 22 per cent of under-35s).30
The age at which respondents left education was also correlated with the respondents’ age at interview, with 55-65 year-olds the most likely to have finished their education when they were 16 or younger (54 per cent, compared with 32 per cent overall).31 This suggests that leaving education before the age of 17 is, at least in part, a cohort-related phenomenon.
29 See Appendix Table 3.A8. 30 See Appendix Table 3.A9. 31 See Appendix Table 3.A10.
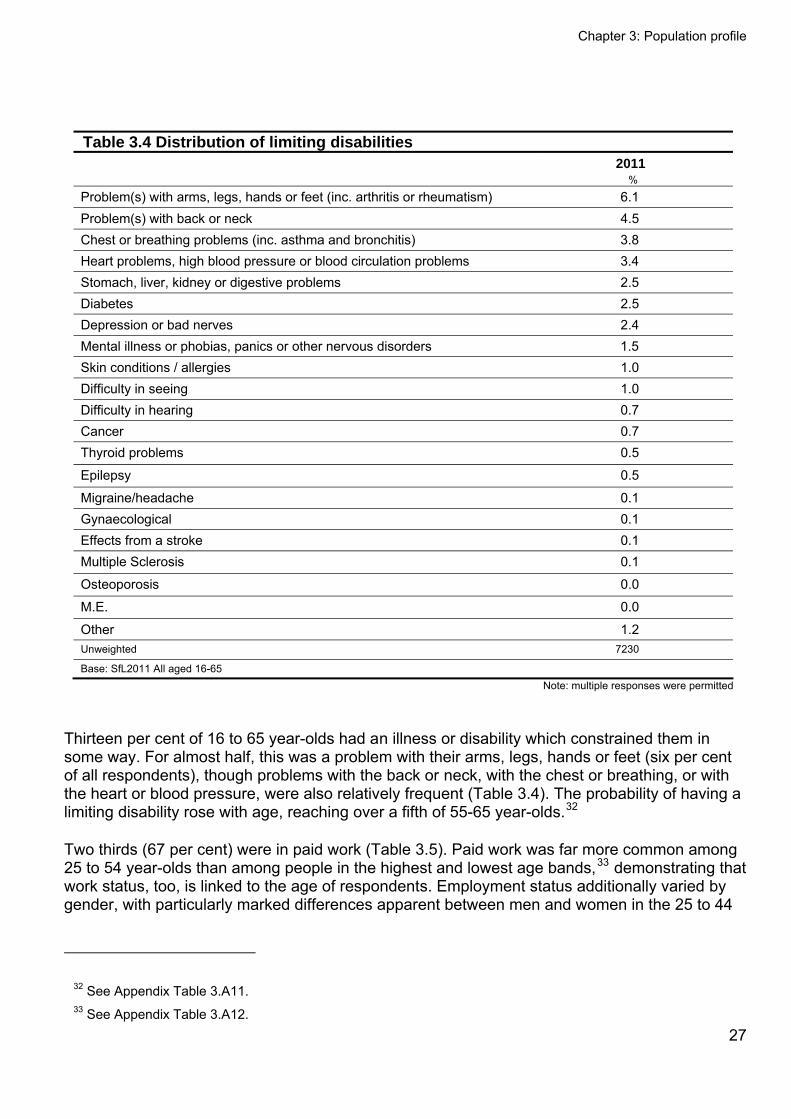
Chapter 3: Population profile
27
Table 3.4 Distribution of limiting disabilities 2011 %
Problem(s) with arms, legs, hands or feet (inc. arthritis or rheumatism) 6.1 Problem(s) with back or neck 4.5 Chest or breathing problems (inc. asthma and bronchitis) 3.8 Heart problems, high blood pressure or blood circulation problems 3.4 Stomach, liver, kidney or digestive problems 2.5 Diabetes 2.5 Depression or bad nerves 2.4 Mental illness or phobias, panics or other nervous disorders 1.5 Skin conditions / allergies 1.0 Difficulty in seeing 1.0 Difficulty in hearing 0.7 Cancer 0.7 Thyroid problems 0.5
Epilepsy 0.5
Migraine/headache 0.1 Gynaecological 0.1 Effects from a stroke 0.1 Multiple Sclerosis 0.1
Osteoporosis 0.0
M.E. 0.0
Other 1.2 Unweighted 7230
Base: SfL2011 All aged 16-65 Note: multiple responses were permitted
Thirteen per cent of 16 to 65 year-olds had an illness or disability which constrained them in some way. For almost half, this was a problem with their arms, legs, hands or feet (six per cent of all respondents), though problems with the back or neck, with the chest or breathing, or with the heart or blood pressure, were also relatively frequent (Table 3.4). The probability of having a limiting disability rose with age, reaching over a fifth of 55-65 year-olds.32
Two thirds (67 per cent) were in paid work (Table 3.5). Paid work was far more common among 25 to 54 year-olds than among people in the highest and lowest age bands,33 demonstrating that work status, too, is linked to the age of respondents. Employment status additionally varied by gender, with particularly marked differences apparent between men and women in the 25 to 44
32 See Appendix Table 3.A11. 33 See Appendix Table 3.A12.
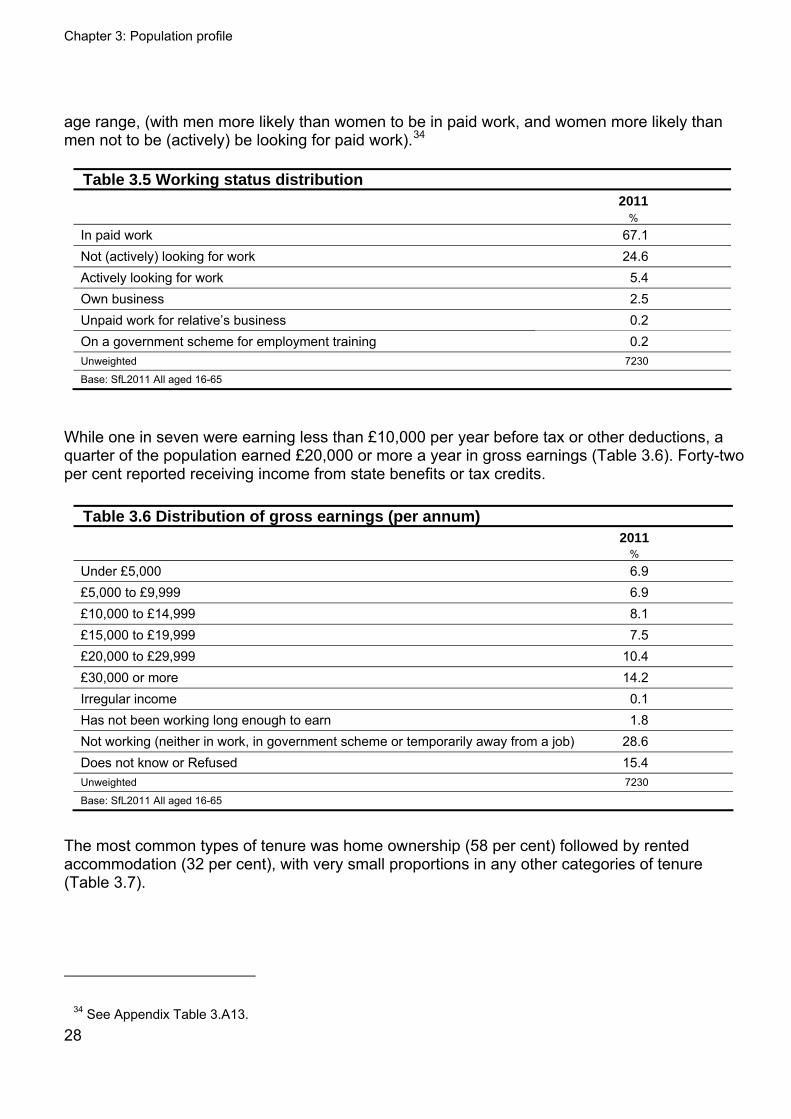
Chapter 3: Population profile
28
age range, (with men more likely than women to be in paid work, and women more likely than men not to be (actively) be looking for paid work).34
Table 3.5 Working status distribution 2011
%
In paid work 67.1 Not (actively) looking for work 24.6 Actively looking for work 5.4 Own business 2.5 Unpaid work for relative’s business 0.2 On a government scheme for employment training 0.2 Unweighted 7230
Base: SfL2011 All aged 16-65
While one in seven were earning less than £10,000 per year before tax or other deductions, a quarter of the population earned £20,000 or more a year in gross earnings (Table 3.6). Forty-two per cent reported receiving income from state benefits or tax credits.
Table 3.6 Distribution of gross earnings (per annum) 2011 %
Under £5,000 6.9 £5,000 to £9,999 6.9 £10,000 to £14,999 8.1 £15,000 to £19,999 7.5 £20,000 to £29,999 10.4 £30,000 or more 14.2 Irregular income 0.1 Has not been working long enough to earn 1.8 Not working (neither in work, in government scheme or temporarily away from a job) 28.6 Does not know or Refused 15.4 Unweighted 7230
Base: SfL2011 All aged 16-65
The most common types of tenure was home ownership (58 per cent) followed by rented accommodation (32 per cent), with very small proportions in any other categories of tenure (Table 3.7).
34 See Appendix Table 3.A13.
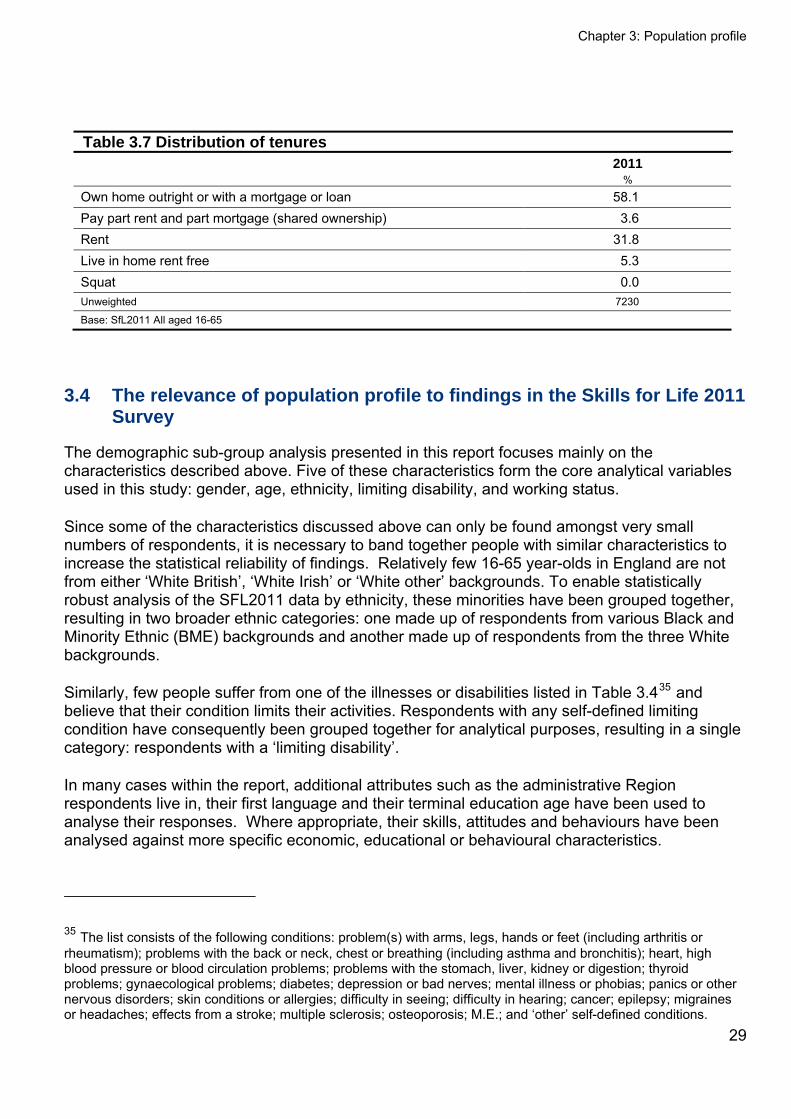
Chapter 3: Population profile
29
Table 3.7 Distribution of tenures 2011 %
Own home outright or with a mortgage or loan 58.1 Pay part rent and part mortgage (shared ownership) 3.6 Rent 31.8 Live in home rent free 5.3 Squat 0.0 Unweighted 7230
Base: SfL2011 All aged 16-65
3.4 The relevance of population profile to findings in the Skills for Life 2011 Survey
The demographic sub-group analysis presented in this report focuses mainly on the characteristics described above. Five of these characteristics form the core analytical variables used in this study: gender, age, ethnicity, limiting disability, and working status.
Since some of the characteristics discussed above can only be found amongst very small numbers of respondents, it is necessary to band together people with similar characteristics to increase the statistical reliability of findings. Relatively few 16-65 year-olds in England are not from either ‘White British’, ‘White Irish’ or ‘White other’ backgrounds. To enable statistically robust analysis of the SFL2011 data by ethnicity, these minorities have been grouped together, resulting in two broader ethnic categories: one made up of respondents from various Black and Minority Ethnic (BME) backgrounds and another made up of respondents from the three White backgrounds.
Similarly, few people suffer from one of the illnesses or disabilities listed in Table 3.435 and believe that their condition limits their activities. Respondents with any self-defined limiting condition have consequently been grouped together for analytical purposes, resulting in a single category: respondents with a ‘limiting disability’.
In many cases within the report, additional attributes such as the administrative Region respondents live in, their first language and their terminal education age have been used to analyse their responses. Where appropriate, their skills, attitudes and behaviours have been analysed against more specific economic, educational or behavioural characteristics.
35 The list consists of the following conditions: problem(s) with arms, legs, hands or feet (including arthritis or rheumatism); problems with the back or neck, chest or breathing (including asthma and bronchitis); heart, high blood pressure or blood circulation problems; problems with the stomach, liver, kidney or digestion; thyroid problems; gynaecological problems; diabetes; depression or bad nerves; mental illness or phobias; panics or other nervous disorders; skin conditions or allergies; difficulty in seeing; difficulty in hearing; cancer; epilepsy; migraines or headaches; effects from a stroke; multiple sclerosis; osteoporosis; M.E.; and ‘other’ self-defined conditions.
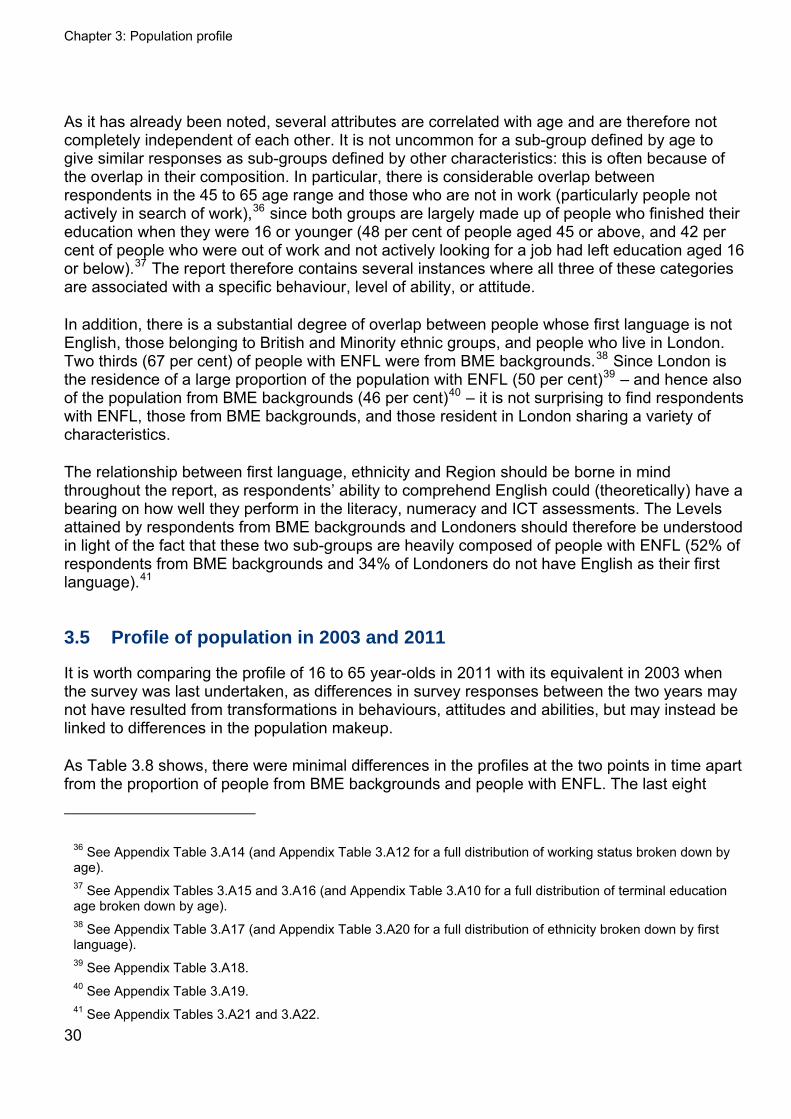
Chapter 3: Population profile
30
As it has already been noted, several attributes are correlated with age and are therefore not completely independent of each other. It is not uncommon for a sub-group defined by age to give similar responses as sub-groups defined by other characteristics: this is often because of the overlap in their composition. In particular, there is considerable overlap between respondents in the 45 to 65 age range and those who are not in work (particularly people not actively in search of work),36 since both groups are largely made up of people who finished their education when they were 16 or younger (48 per cent of people aged 45 or above, and 42 per cent of people who were out of work and not actively looking for a job had left education aged 16 or below).37 The report therefore contains several instances where all three of these categories are associated with a specific behaviour, level of ability, or attitude.
In addition, there is a substantial degree of overlap between people whose first language is not English, those belonging to British and Minority ethnic groups, and people who live in London. Two thirds (67 per cent) of people with ENFL were from BME backgrounds.38 Since London is the residence of a large proportion of the population with ENFL (50 per cent)39 – and hence also of the population from BME backgrounds (46 per cent)40 – it is not surprising to find respondents with ENFL, those from BME backgrounds, and those resident in London sharing a variety of characteristics.
The relationship between first language, ethnicity and Region should be borne in mind throughout the report, as respondents’ ability to comprehend English could (theoretically) have a bearing on how well they perform in the literacy, numeracy and ICT assessments. The Levels attained by respondents from BME backgrounds and Londoners should therefore be understood in light of the fact that these two sub-groups are heavily composed of people with ENFL (52% of respondents from BME backgrounds and 34% of Londoners do not have English as their first language).41
3.5 Profile of population in 2003 and 2011
It is worth comparing the profile of 16 to 65 year-olds in 2011 with its equivalent in 2003 when the survey was last undertaken, as differences in survey responses between the two years may not have resulted from transformations in behaviours, attitudes and abilities, but may instead be linked to differences in the population makeup.
As Table 3.8 shows, there were minimal differences in the profiles at the two points in time apart from the proportion of people from BME backgrounds and people with ENFL. The last eight
36 See Appendix Table 3.A14 (and Appendix Table 3.A12 for a full distribution of working status broken down by age). 37 See Appendix Tables 3.A15 and 3.A16 (and Appendix Table 3.A10 for a full distribution of terminal education age broken down by age). 38 See Appendix Table 3.A17 (and Appendix Table 3.A20 for a full distribution of ethnicity broken down by first language). 39 See Appendix Table 3.A18. 40 See Appendix Table 3.A19. 41 See Appendix Tables 3.A21 and 3.A22.
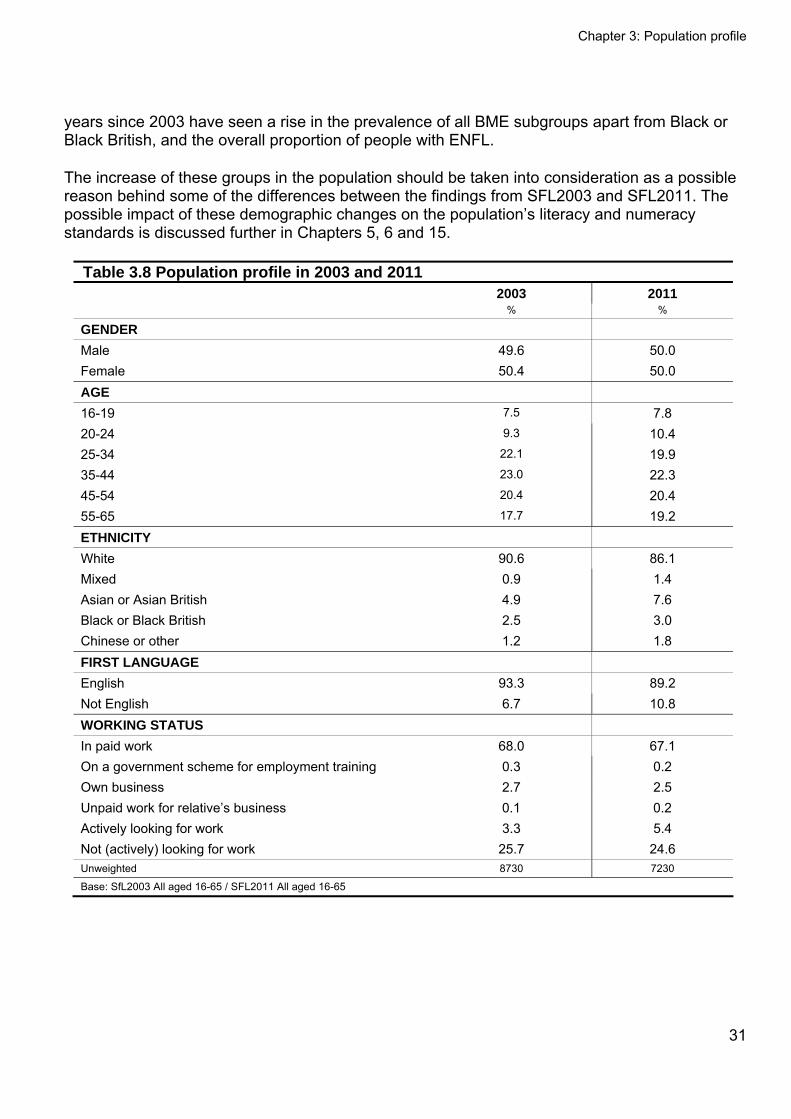
Chapter 3: Population profile
31
years since 2003 have seen a rise in the prevalence of all BME subgroups apart from Black or Black British, and the overall proportion of people with ENFL.
The increase of these groups in the population should be taken into consideration as a possible reason behind some of the differences between the findings from SFL2003 and SFL2011. The possible impact of these demographic changes on the population’s literacy and numeracy standards is discussed further in Chapters 5, 6 and 15.
Table 3.8 Population profile in 2003 and 2011 2003 2011 % %
GENDER
Male 49.6 50.0 Female 50.4 50.0 AGE 16-19 7.5 7.8 20-24 9.3 10.4 25-34 22.1 19.9 35-44 23.0 22.3 45-54 20.4 20.4 55-65 17.7 19.2 ETHNICITY White 90.6 86.1 Mixed 0.9 1.4 Asian or Asian British 4.9 7.6 Black or Black British 2.5 3.0 Chinese or other 1.2 1.8 FIRST LANGUAGE
English 93.3 89.2 Not English 6.7 10.8 WORKING STATUS In paid work 68.0 67.1 On a government scheme for employment training 0.3 0.2 Own business 2.7 2.5 Unpaid work for relative’s business 0.1 0.2 Actively looking for work 3.3 5.4 Not (actively) looking for work 25.7 24.6 Unweighted 8730 7230
Base: SfL2003 All aged 16-65 / SFL2011 All aged 16-65

Chapter 4: Distributions of literacy, numeracy and ICT skills
32
4 Distributions of literacy, numeracy and ICT skills
4.1 Key Findings
Literacy skills Eighty five per cent of respondents achieved Level 1 or above in literacy, with 15 per
cent performing at Entry Level 3 or below. This represents no significant change since 2003.
Overall 57 per cent of respondents achieved a Level 2 or above score in literacy, which is a large increase from 44 per cent in 2003. Amongst 16-18 year-olds there has been a 13 percentage point rise in the proportion achieving a Level 2 or above score since 2003, and amongst 19-65 year-olds there has been a 12 percentage point rise.
Numeracy skills Three quarters (76 per cent) of respondents achieved Entry Level 3 or above in
numeracy, with one quarter (24 per cent) scoring below this. This represents a small decline in numeracy skills, as 79 per cent achieved Entry Level 3 or above in 2003.
ICT skills The following proportions of respondents achieved Entry Level 3 or above in the
various components of the ICT assessment: 57 per cent on the word processing component, 69 per cent on the email component, 61 per cent on the spreadsheet component and 91 per cent on the multiple choice component
Relationship between skills
In line with 2003, the numeracy assessment performance correlated with the literacy assessment performance.
Just over six in ten respondents (62 per cent) performed at a higher standard on the literacy assessment than the numeracy assessment. Only one in ten (10 per cent) had stronger performance on the numeracy assessment.
Seven in ten respondents (72 per cent) achieved Level 1 or above in literacy and Entry Level 3 or above in numeracy. One in ten (10 per cent) performed below both of these Levels.
The literacy and numeracy assessments both correlated positively with the ICT assessment.
Whilst the four ICT components measure different skills sets, correlations were found between all four components.
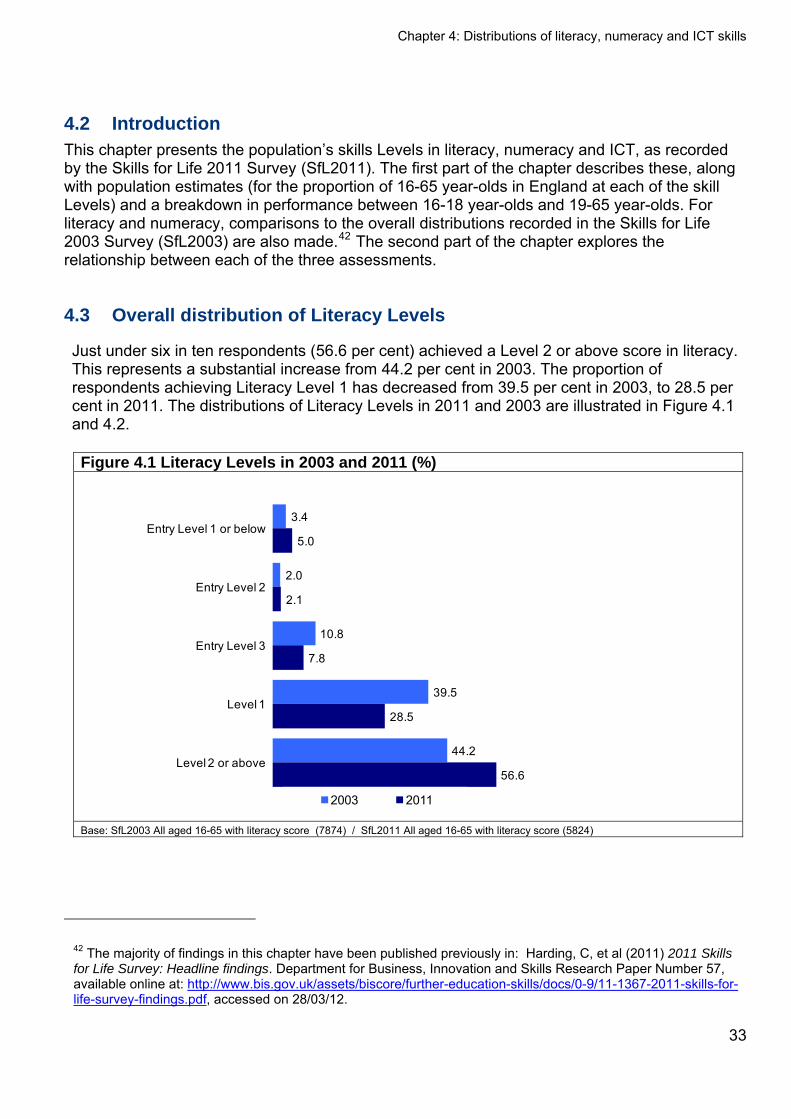
Chapter 4: Distributions of literacy, numeracy and ICT skills
4.2 Introduction This chapter presents the population’s skills Levels in literacy, numeracy and ICT, as recorded by the Skills for Life 2011 Survey (SfL2011). The first part of the chapter describes these, along with population estimates (for the proportion of 16-65 year-olds in England at each of the skill Levels) and a breakdown in performance between 16-18 year-olds and 19-65 year-olds. For literacy and numeracy, comparisons to the overall distributions recorded in the Skills for Life 2003 Survey (SfL2003) are also made.42 The second part of the chapter explores the relationship between each of the three assessments.
4.3 Overall distribution of Literacy Levels
Just under six in ten respondents (56.6 per cent) achieved a Level 2 or above score in literacy. This represents a substantial increase from 44.2 per cent in 2003. The proportion of respondents achieving Literacy Level 1 has decreased from 39.5 per cent in 2003, to 28.5 per cent in 2011. The distributions of Literacy Levels in 2011 and 2003 are illustrated in Figure 4.1 and 4.2.
Figure 4.1 Literacy Levels in 2003 and 2011 (%)
3.4
2.0
10.8
39.5
44.2
5.0
2.1
7.8
28.5
56.6
Entry Level 1 or below
Entry Level 2
Entry Level 3
Level 1
Level 2 or above
2003 2011
Base: SfL2003 All aged 16-65 with literacy score (7874) / SfL2011 All aged 16-65 with literacy score (5824)
42 The majority of findings in this chapter have been published previously in: Harding, C, et al (2011) 2011 Skills for Life Survey: Headline findings. Department for Business, Innovation and Skills Research Paper Number 57, available online at: http://www.bis.gov.uk/assets/biscore/further-education-skills/docs/0-9/11-1367-2011-skills-for-life-survey-findings.pdf, accessed on 28/03/12.
33
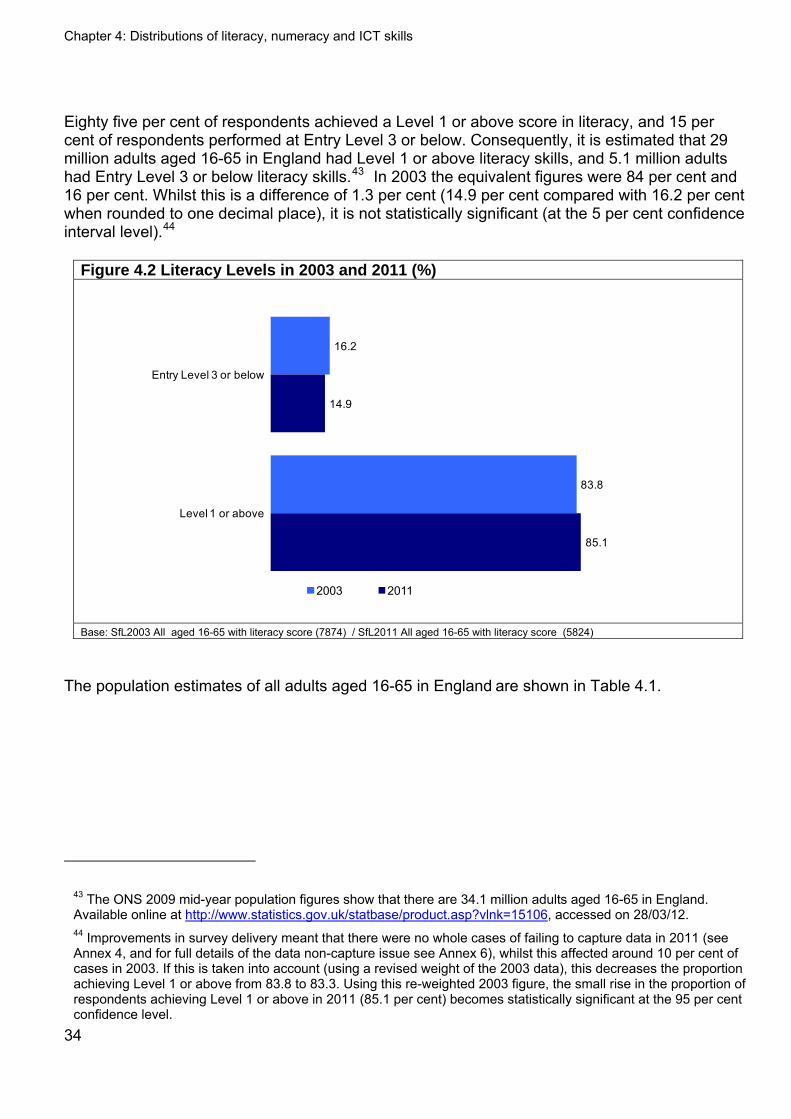
Chapter 4: Distributions of literacy, numeracy and ICT skills
Eighty five per cent of respondents achieved a Level 1 or above score in literacy, and 15 per cent of respondents performed at Entry Level 3 or below. Consequently, it is estimated that 29 million adults aged 16-65 in England had Level 1 or above literacy skills, and 5.1 million adults had Entry Level 3 or below literacy skills.43 In 2003 the equivalent figures were 84 per cent and 16 per cent. Whilst this is a difference of 1.3 per cent (14.9 per cent compared with 16.2 per cent when rounded to one decimal place), it is not statistically significant (at the 5 per cent confidence interval level).44
Figure 4.2 Literacy Levels in 2003 and 2011 (%)
16.2
83.8
14.9
85.1
Entry Level 3 or below
Level 1 or above
2003 2011
Base: SfL2003 All aged 16-65 with literacy score (7874) / SfL2011 All aged 16-65 with literacy score (5824)
The population estimates of all adults aged 16-65 in England are shown in Table 4.1.
43 The ONS 2009 mid-year population figures show that there are 34.1 million adults aged 16-65 in England. Available online at http://www.statistics.gov.uk/statbase/product.asp?vlnk=15106, accessed on 28/03/12. 44 Improvements in survey delivery meant that there were no whole cases of failing to capture data in 2011 (see Annex 4, and for full details of the data non-capture issue see Annex 6), whilst this affected around 10 per cent of cases in 2003. If this is taken into account (using a revised weight of the 2003 data), this decreases the proportion achieving Level 1 or above from 83.8 to 83.3. Using this re-weighted 2003 figure, the small rise in the proportion of respondents achieving Level 1 or above in 2011 (85.1 per cent) becomes statistically significant at the 95 per cent confidence level.
34

Chapter 4: Distributions of literacy, numeracy and ICT skills
35
Table 4.1 Literacy Levels in 2003 and 2011 including population estimates 2003 2011
% Margins of Error Population estimate (million)45
% Margins of Error
Population estimate (million)
Entry Level 1 or below 3.4 (2.9 - 4.0) 1.1 5.0 (4.3 – 5.8) 1.7 Entry Level 2 2.0 (1.7 - 2.4) 0.6 2.1 (1.7 – 2.6) 0.7 Entry Level 3 10.8 (10.0 – 11.7) 3.5 7.8 (7.0 – 8.8) 2.7
Level 1 39.5 (38.2 – 40.9) 12.6 28.5 (27.0 – 29.9) 9.7 Level 2 or above 44.2 (42.7 – 45.7) 14.1 56.6 (55.0 – 58.2) 19.3 Entry Level 3 or below 16.2 (15 .1– 17.4) 5.2 14.9 (13.7 – 16.2) 5.1 Level 1 or above 83.8 (82.6 – 84.9) 26.7 85.1 (83.8 – 86.3) 29.0 Unweighted 7874 (31.9 million) 5824 (34.1 million)
Base: SfL2003 All aged 16-65 with literacy scores / SfL2011 All aged 16-65 with literacy scores
Although there has been no statistically significant change (at the five per cent confidence level) in the proportion of respondents achieving Entry Level 3 or below, there has been a change to the number of respondents achieving Entry Level 1 and Entry Level 3. As displayed in Table 4.1, the number of respondents achieving Entry Level 3 has decreased since 2003, and conversely the proportion of respondents achieving Entry Level 1 and below has increased. An alternative way of looking at the changes between 2003 and 2011 is to not just look at the point estimates and whether a change is ‘statistically significant’, but to consider the likelihood of various magnitudes of change. Tables 4.2 and 4.3 show a range of possible values for this magnitude of change (Table 4.2 for the proportion at Level 1 or above, and Table 4.3 for the proportion at Level 2 or above). Each possible value for this magnitude of change is given a likelihood score. For example, in Table 4.2 we can see that the likelihood that the change in the proportion reaching Level 1 or above is less than or equal to 2 per cent is 79 per cent. The second row breaks down these cumulative values to show the likelihood of change between two values. For example, the likelihood that the increase is between 1.5 percentage points and 2.0 percentage points is 20 per cent. From Table 4.2, there is a six percent likelihood of a negative change since 2003 in the proportion of respondents achieving Literacy Level 1 or above. The most likely level of change is between +1.0 and +1.5 percentage points. When examining the increase in the proportion at
45 In line with the 2003 report this is based on the 2001 Census figures. This showed that there were 31.9 million adults aged 16-65 in England.
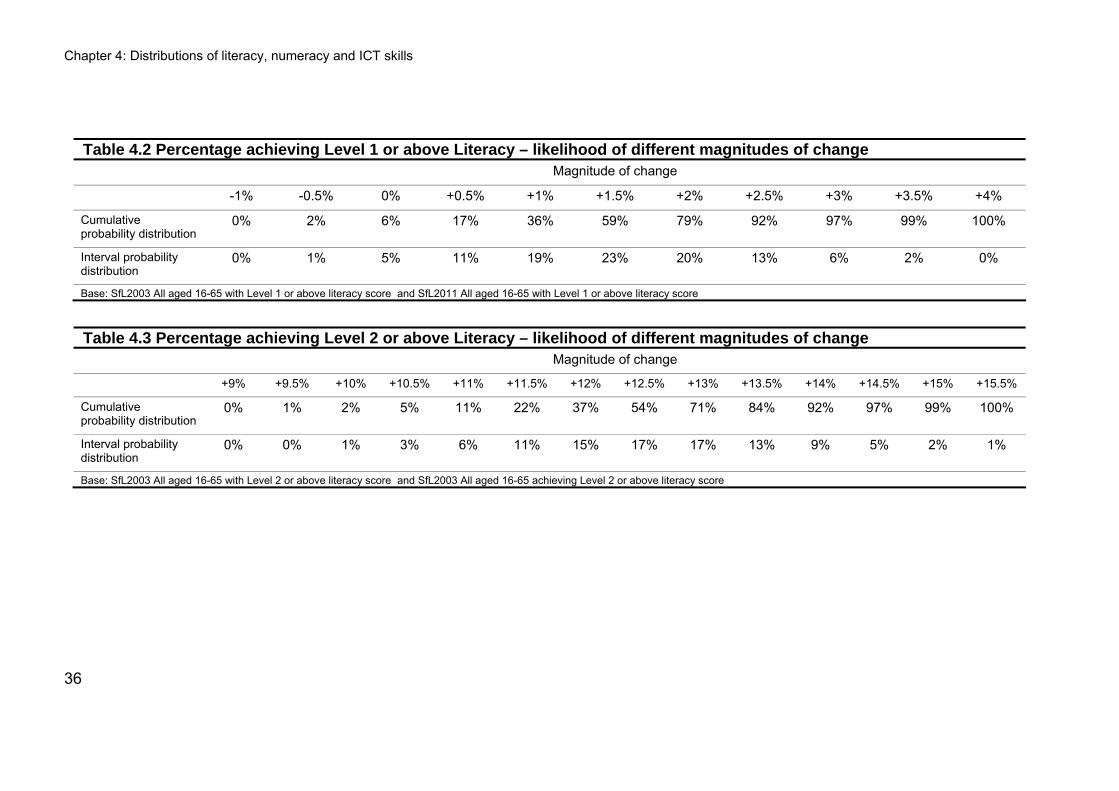
Chapter 4: Distributions of literacy, numeracy and ICT skills
36
Table 4.2 Percentage achieving Level 1 or above Literacy – likelihood of different magnitudes of change Magnitude of change
-1% -0.5% 0% +0.5% +1% +1.5% +2% +2.5% +3% +3.5% +4%
Cumulative probability distribution
0% 2% 6% 17% 36% 59% 79% 92% 97% 99% 100%
Interval probability distribution
0% 1% 5% 11% 19% 23% 20% 13% 6% 2% 0%
Base: SfL2003 All aged 16-65 with Level 1 or above literacy score and SfL2011 All aged 16-65 with Level 1 or above literacy score
Table 4.3 Percentage achieving Level 2 or above Literacy – likelihood of different magnitudes of change Magnitude of change
+9% +9.5% +10% +10.5% +11% +11.5% +12% +12.5% +13% +13.5% +14% +14.5% +15% +15.5%
Cumulative probability distribution
0% 1% 2% 5% 11% 22% 37% 54% 71% 84% 92% 97% 99% 100%
Interval probability distribution
0% 0% 1% 3% 6% 11% 15% 17% 17% 13% 9% 5% 2% 1%
Base: SfL2003 All aged 16-65 with Level 2 or above literacy score and SfL2003 All aged 16-65 achieving Level 2 or above literacy score
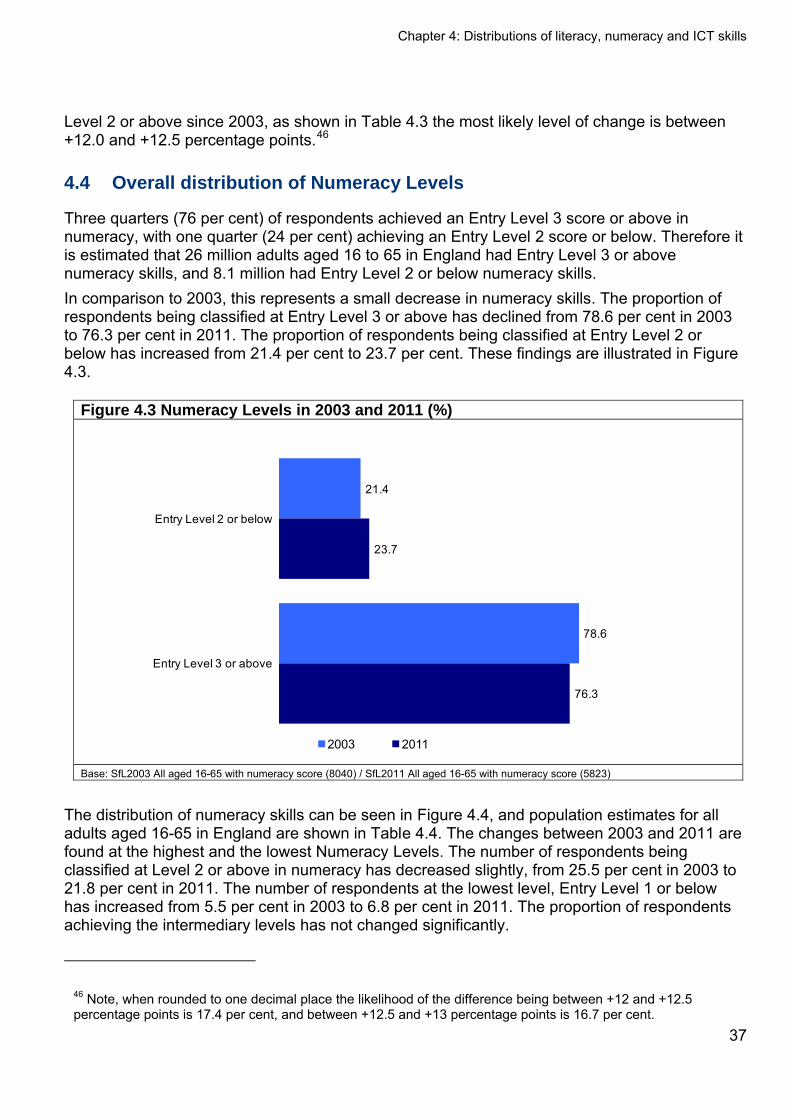
Chapter 4: Distributions of literacy, numeracy and ICT skills
Level 2 or above since 2003, as shown in Table 4.3 the most likely level of change is between +12.0 and +12.5 percentage points.46
4.4 Overall distribution of Numeracy Levels
Three quarters (76 per cent) of respondents achieved an Entry Level 3 score or above in numeracy, with one quarter (24 per cent) achieving an Entry Level 2 score or below. Therefore it is estimated that 26 million adults aged 16 to 65 in England had Entry Level 3 or above numeracy skills, and 8.1 million had Entry Level 2 or below numeracy skills. In comparison to 2003, this represents a small decrease in numeracy skills. The proportion of respondents being classified at Entry Level 3 or above has declined from 78.6 per cent in 2003 to 76.3 per cent in 2011. The proportion of respondents being classified at Entry Level 2 or below has increased from 21.4 per cent to 23.7 per cent. These findings are illustrated in Figure 4.3.
Figure 4.3 Numeracy Levels in 2003 and 2011 (%)
21.4
78.6
23.7
76.3
Entry Level 2 or below
Entry Level 3 or above
2003 2011 Base: SfL2003 All aged 16-65 with numeracy score (8040) / SfL2011 All aged 16-65 with numeracy score (5823)
The distribution of numeracy skills can be seen in Figure 4.4, and population estimates for all adults aged 16-65 in England are shown in Table 4.4. The changes between 2003 and 2011 are found at the highest and the lowest Numeracy Levels. The number of respondents being classified at Level 2 or above in numeracy has decreased slightly, from 25.5 per cent in 2003 to 21.8 per cent in 2011. The number of respondents at the lowest level, Entry Level 1 or below has increased from 5.5 per cent in 2003 to 6.8 per cent in 2011. The proportion of respondents achieving the intermediary levels has not changed significantly.
46 Note, when rounded to one decimal place the likelihood of the difference being between +12 and +12.5 percentage points is 17.4 per cent, and between +12.5 and +13 percentage points is 16.7 per cent.
37
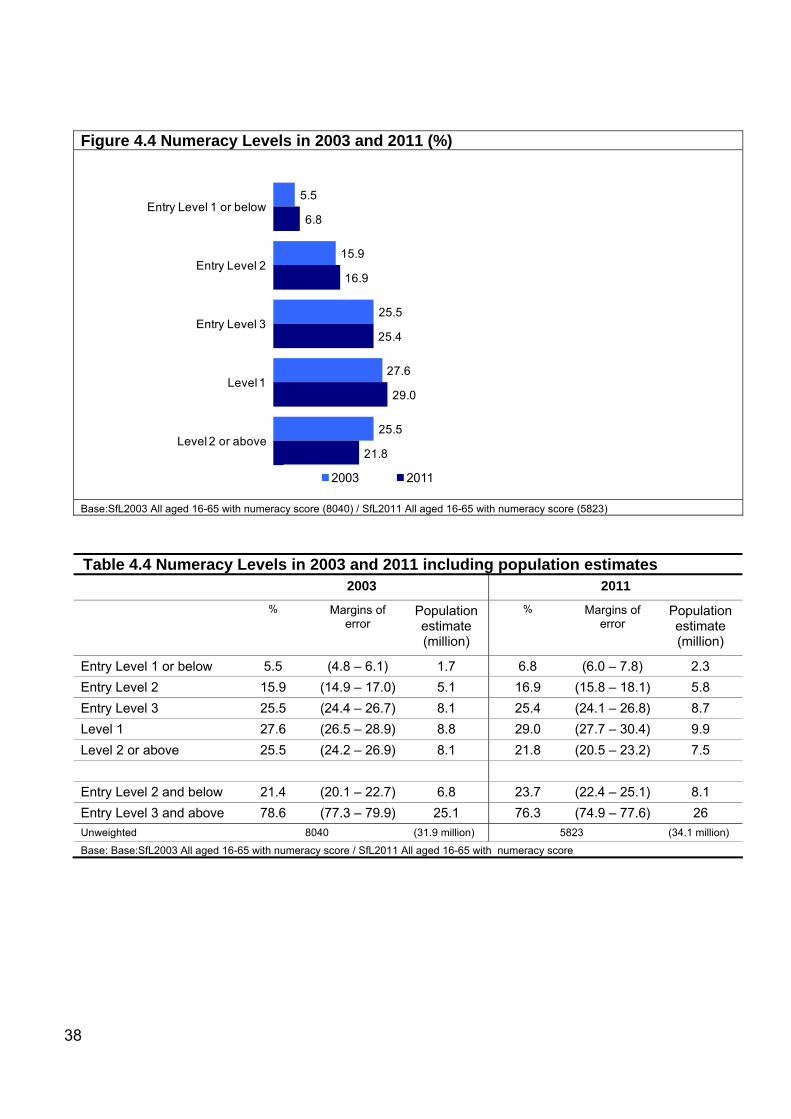
Figure 4.4 Numeracy Levels in 2003 and 2011 (%)
5.5
15.9
25.5
27.6
25.5
6.8
16.9
25.4
29.0
21.8
Entry Level 1 or below
Entry Level 2
Entry Level 3
Level 1
Level 2 or above
2003 2011
Base:SfL2003 All aged 16-65 with numeracy score (8040) / SfL2011 All aged 16-65 with numeracy score (5823)
Table 4.4 Numeracy Levels in 2003 and 2011 including population estimates 2003 2011
% Margins of error
Population estimate (million)
% Margins of error
Population estimate (million)
Entry Level 1 or below 5.5 (4.8 – 6.1) 1.7 6.8 (6.0 – 7.8) 2.3 Entry Level 2 15.9 (14.9 – 17.0) 5.1 16.9 (15.8 – 18.1) 5.8 Entry Level 3 25.5 (24.4 – 26.7) 8.1 25.4 (24.1 – 26.8) 8.7 Level 1 27.6 (26.5 – 28.9) 8.8 29.0 (27.7 – 30.4) 9.9 Level 2 or above 25.5 (24.2 – 26.9) 8.1 21.8 (20.5 – 23.2) 7.5 Entry Level 2 and below 21.4 (20.1 – 22.7) 6.8 23.7 (22.4 – 25.1) 8.1 Entry Level 3 and above 78.6 (77.3 – 79.9) 25.1 76.3 (74.9 – 77.6) 26 Unweighted 8040 (31.9 million) 5823 (34.1 million)
Base: Base:SfL2003 All aged 16-65 with numeracy score / SfL2011 All aged 16-65 with numeracy score
38
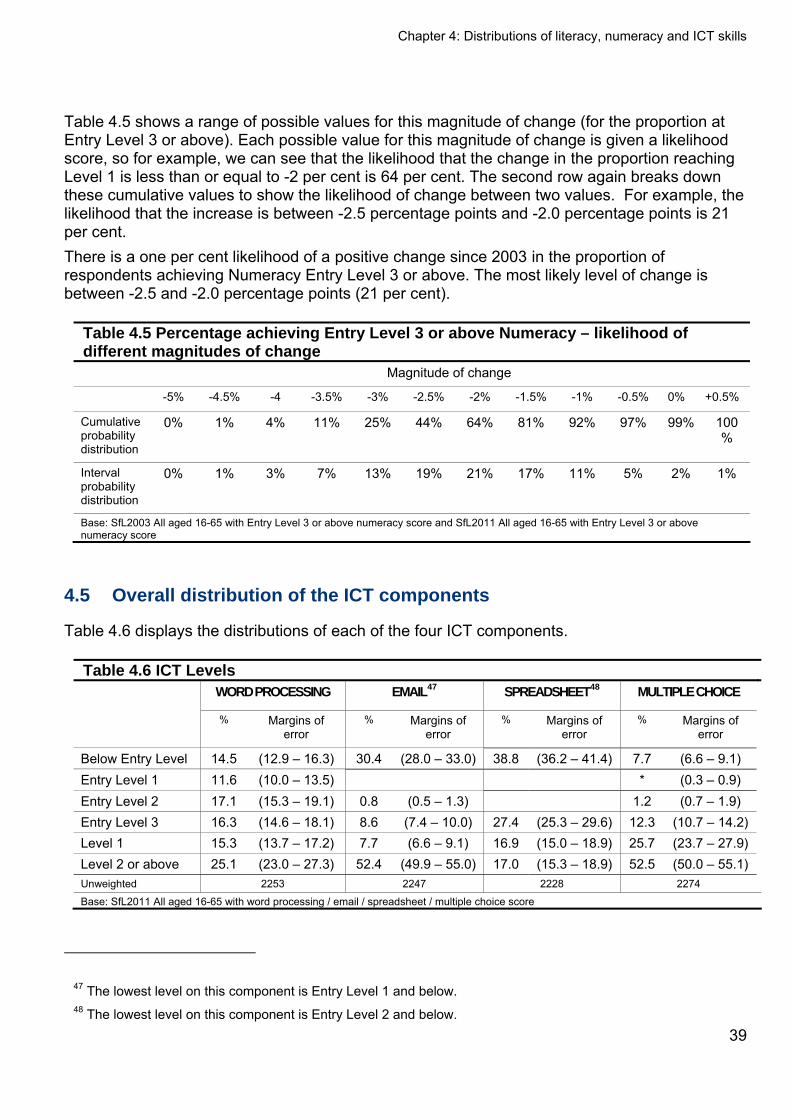
Chapter 4: Distributions of literacy, numeracy and ICT skills
39
Table 4.5 shows a range of possible values for this magnitude of change (for the proportion at Entry Level 3 or above). Each possible value for this magnitude of change is given a likelihood score, so for example, we can see that the likelihood that the change in the proportion reaching Level 1 is less than or equal to -2 per cent is 64 per cent. The second row again breaks down these cumulative values to show the likelihood of change between two values. For example, the likelihood that the increase is between -2.5 percentage points and -2.0 percentage points is 21 per cent. There is a one per cent likelihood of a positive change since 2003 in the proportion of respondents achieving Numeracy Entry Level 3 or above. The most likely level of change is between -2.5 and -2.0 percentage points (21 per cent).
Table 4.5 Percentage achieving Entry Level 3 or above Numeracy – likelihood of different magnitudes of change Magnitude of change
-5% -4.5% -4 -3.5% -3% -2.5% -2% -1.5% -1% -0.5% 0% +0.5%
Cumulative probability distribution
0% 1% 4% 11% 25% 44% 64% 81% 92% 97% 99% 100%
Interval probability distribution
0% 1% 3% 7% 13% 19% 21% 17% 11% 5% 2% 1%
Base: SfL2003 All aged 16-65 with Entry Level 3 or above numeracy score and SfL2011 All aged 16-65 with Entry Level 3 or above numeracy score
4.5 Overall distribution of the ICT components
Table 4.6 displays the distributions of each of the four ICT components.
Table 4.6 ICT Levels WORD PROCESSING EMAIL47 SPREADSHEET48 MULTIPLE CHOICE
% Margins of error
% Margins of error
% Margins of error
% Margins of error
Below Entry Level 14.5 (12.9 – 16.3) 30.4 (28.0 – 33.0) 38.8 (36.2 – 41.4) 7.7 (6.6 – 9.1) Entry Level 1 11.6 (10.0 – 13.5) * (0.3 – 0.9) Entry Level 2 17.1 (15.3 – 19.1) 0.8 (0.5 – 1.3) 1.2 (0.7 – 1.9) Entry Level 3 16.3 (14.6 – 18.1) 8.6 (7.4 – 10.0) 27.4 (25.3 – 29.6) 12.3 (10.7 – 14.2) Level 1 15.3 (13.7 – 17.2) 7.7 (6.6 – 9.1) 16.9 (15.0 – 18.9) 25.7 (23.7 – 27.9) Level 2 or above 25.1 (23.0 – 27.3) 52.4 (49.9 – 55.0) 17.0 (15.3 – 18.9) 52.5 (50.0 – 55.1) Unweighted 2253 2247 2228 2274
Base: SfL2011 All aged 16-65 with word processing / email / spreadsheet / multiple choice score
47 The lowest level on this component is Entry Level 1 and below. 48 The lowest level on this component is Entry Level 2 and below.
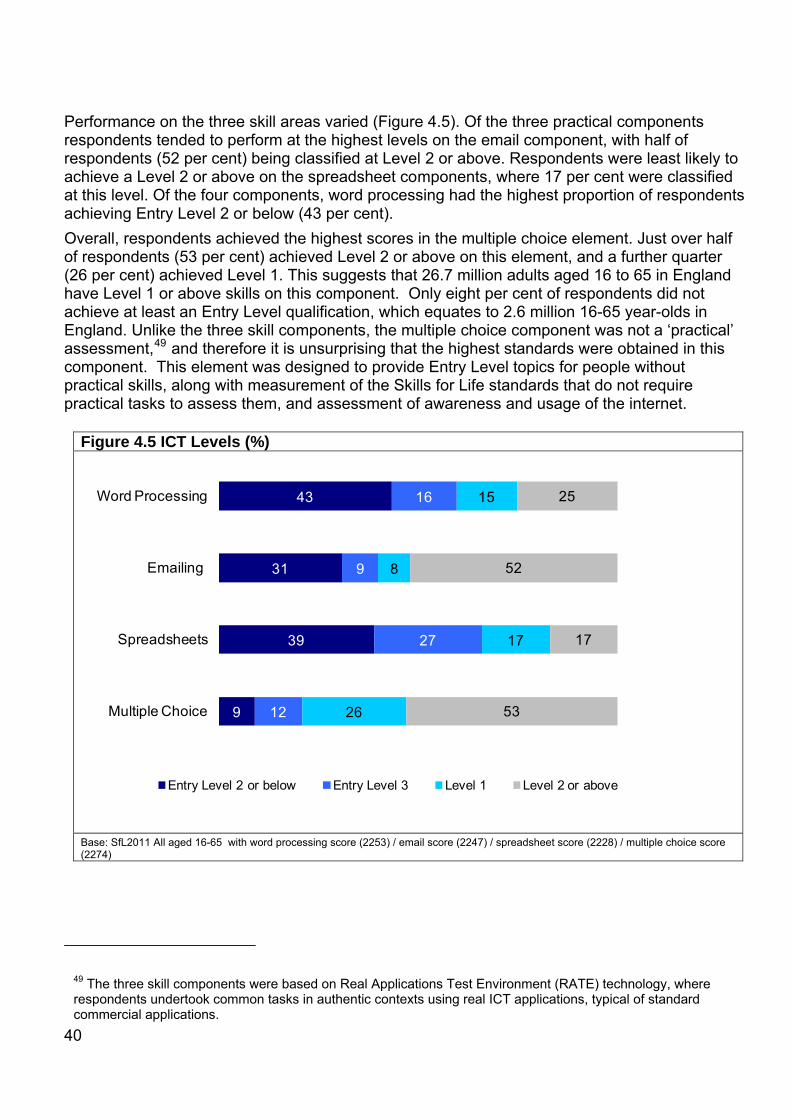
Performance on the three skill areas varied (Figure 4.5). Of the three practical components respondents tended to perform at the highest levels on the email component, with half of respondents (52 per cent) being classified at Level 2 or above. Respondents were least likely to achieve a Level 2 or above on the spreadsheet components, where 17 per cent were classified at this level. Of the four components, word processing had the highest proportion of respondents achieving Entry Level 2 or below (43 per cent). Overall, respondents achieved the highest scores in the multiple choice element. Just over half of respondents (53 per cent) achieved Level 2 or above on this element, and a further quarter (26 per cent) achieved Level 1. This suggests that 26.7 million adults aged 16 to 65 in England have Level 1 or above skills on this component. Only eight per cent of respondents did not achieve at least an Entry Level qualification, which equates to 2.6 million 16-65 year-olds in England. Unlike the three skill components, the multiple choice component was not a ‘practical’ assessment,49 and therefore it is unsurprising that the highest standards were obtained in this component. This element was designed to provide Entry Level topics for people without practical skills, along with measurement of the Skills for Life standards that do not require practical tasks to assess them, and assessment of awareness and usage of the internet.
Figure 4.5 ICT Levels (%)
9
39
31
43
12
27
9
16
26
17
8
15
53
17
52
25
Multiple Choice
Spreadsheets
Emailing
Word Processing
Entry Level 2 or below Entry Level 3 Level 1 Level 2 or above
Base: SfL2011 All aged 16-65 with word processing score (2253) / email score (2247) / spreadsheet score (2228) / multiple choice score (2274)
49 The three skill components were based on Real Applications Test Environment (RATE) technology, where respondents undertook common tasks in authentic contexts using real ICT applications, typical of standard commercial applications.
40
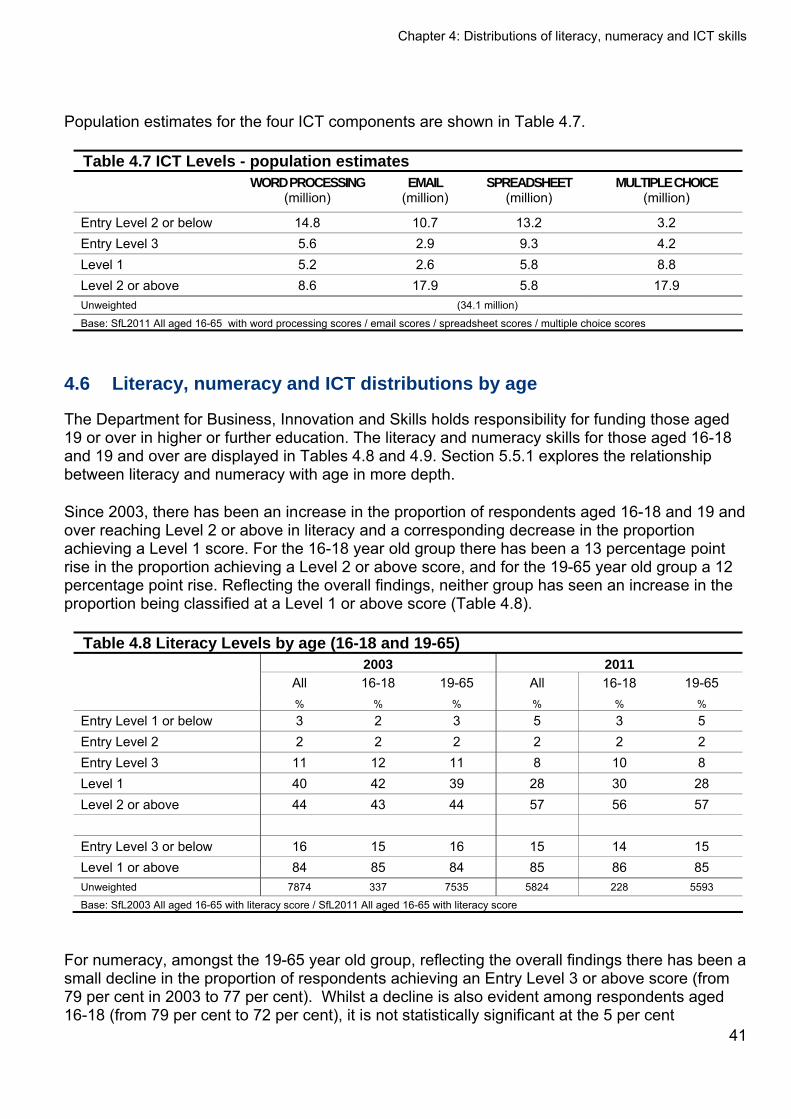
Chapter 4: Distributions of literacy, numeracy and ICT skills
41
Population estimates for the four ICT components are shown in Table 4.7.
Table 4.7 ICT Levels - population estimates WORD PROCESSING
(million) EMAIL
(million) SPREADSHEET
(million) MULTIPLE CHOICE
(million)
Entry Level 2 or below 14.8 10.7 13.2 3.2 Entry Level 3 5.6 2.9 9.3 4.2 Level 1 5.2 2.6 5.8 8.8 Level 2 or above 8.6 17.9 5.8 17.9 Unweighted (34.1 million)
Base: SfL2011 All aged 16-65 with word processing scores / email scores / spreadsheet scores / multiple choice scores
4.6 Literacy, numeracy and ICT distributions by age
The Department for Business, Innovation and Skills holds responsibility for funding those aged 19 or over in higher or further education. The literacy and numeracy skills for those aged 16-18 and 19 and over are displayed in Tables 4.8 and 4.9. Section 5.5.1 explores the relationship between literacy and numeracy with age in more depth.
Since 2003, there has been an increase in the proportion of respondents aged 16-18 and 19 and over reaching Level 2 or above in literacy and a corresponding decrease in the proportion achieving a Level 1 score. For the 16-18 year old group there has been a 13 percentage point rise in the proportion achieving a Level 2 or above score, and for the 19-65 year old group a 12 percentage point rise. Reflecting the overall findings, neither group has seen an increase in the proportion being classified at a Level 1 or above score (Table 4.8).
Table 4.8 Literacy Levels by age (16-18 and 19-65) 2003 2011
All 16-18 19-65 All 16-18 19-65 % % % % % %
Entry Level 1 or below 3 2 3 5 3 5 Entry Level 2 2 2 2 2 2 2 Entry Level 3 11 12 11 8 10 8 Level 1 40 42 39 28 30 28 Level 2 or above 44 43 44 57 56 57 Entry Level 3 or below 16 15 16 15 14 15 Level 1 or above 84 85 84 85 86 85 Unweighted 7874 337 7535 5824 228 5593
Base: SfL2003 All aged 16-65 with literacy score / SfL2011 All aged 16-65 with literacy score
For numeracy, amongst the 19-65 year old group, reflecting the overall findings there has been a small decline in the proportion of respondents achieving an Entry Level 3 or above score (from 79 per cent in 2003 to 77 per cent). Whilst a decline is also evident among respondents aged 16-18 (from 79 per cent to 72 per cent), it is not statistically significant at the 5 per cent
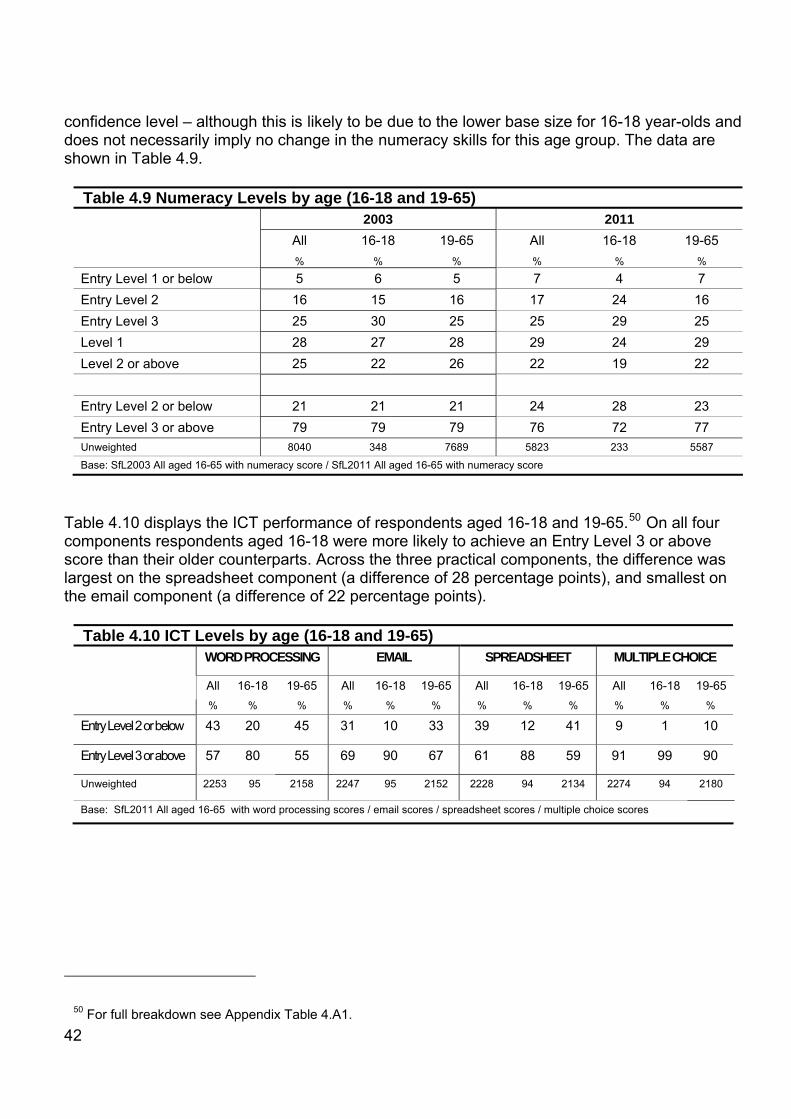
42
confidence level – although this is likely to be due to the lower base size for 16-18 year-olds and does not necessarily imply no change in the numeracy skills for this age group. The data are shown in Table 4.9.
Table 4.9 Numeracy Levels by age (16-18 and 19-65) 2003 2011
All 16-18 19-65 All 16-18 19-65 % % % % % %
Entry Level 1 or below 5 6 5 7 4 7 Entry Level 2 16 15 16 17 24 16 Entry Level 3 25 30 25 25 29 25 Level 1 28 27 28 29 24 29 Level 2 or above 25 22 26 22 19 22 Entry Level 2 or below 21 21 21 24 28 23 Entry Level 3 or above 79 79 79 76 72 77 Unweighted 8040 348 7689 5823 233 5587
Base: SfL2003 All aged 16-65 with numeracy score / SfL2011 All aged 16-65 with numeracy score
Table 4.10 displays the ICT performance of respondents aged 16-18 and 19-65.50 On all four components respondents aged 16-18 were more likely to achieve an Entry Level 3 or above score than their older counterparts. Across the three practical components, the difference was largest on the spreadsheet component (a difference of 28 percentage points), and smallest on the email component (a difference of 22 percentage points).
Table 4.10 ICT Levels by age (16-18 and 19-65) WORD PROCESSING EMAIL SPREADSHEET MULTIPLE CHOICE
All 16-18 19-65 All 16-18 19-65 All 16-18 19-65 All 16-18 19-65
% % % % % % % % % % % %
Entry Level 2 or below 43 20 45 31 10 33 39 12 41 9 1 10
Entry Level 3 or above 57 80 55 69 90 67 61 88 59 91 99 90
Unweighted 2253 95 2158 2247 95 2152 2228 94 2134 2274 94 2180
Base: SfL2011 All aged 16-65 with word processing scores / email scores / spreadsheet scores / multiple choice scores
50 For full breakdown see Appendix Table 4.A1.
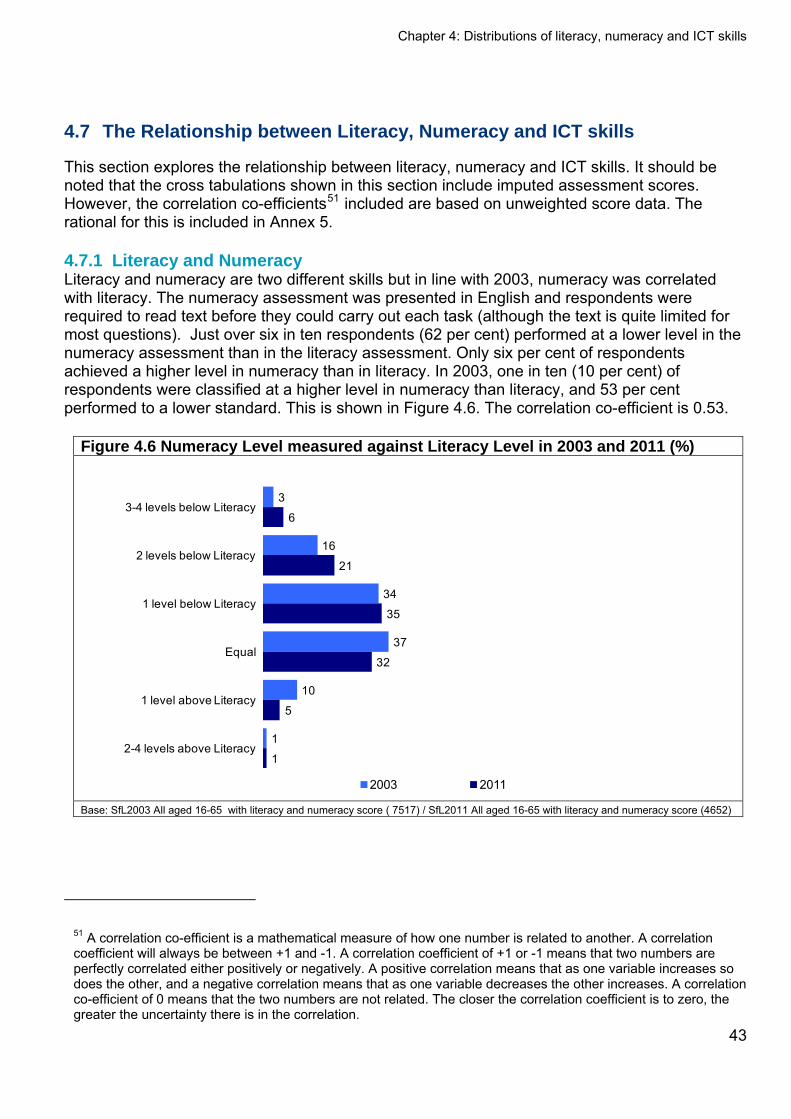
Chapter 4: Distributions of literacy, numeracy and ICT skills
4.7 The Relationship between Literacy, Numeracy and ICT skills
This section explores the relationship between literacy, numeracy and ICT skills. It should be noted that the cross tabulations shown in this section include imputed assessment scores. However, the correlation co-efficients51 included are based on unweighted score data. The rational for this is included in Annex 5.
4.7.1 Literacy and Numeracy Literacy and numeracy are two different skills but in line with 2003, numeracy was correlated with literacy. The numeracy assessment was presented in English and respondents were required to read text before they could carry out each task (although the text is quite limited for most questions). Just over six in ten respondents (62 per cent) performed at a lower level in the numeracy assessment than in the literacy assessment. Only six per cent of respondents achieved a higher level in numeracy than in literacy. In 2003, one in ten (10 per cent) of respondents were classified at a higher level in numeracy than literacy, and 53 per cent performed to a lower standard. This is shown in Figure 4.6. The correlation co-efficient is 0.53.
Figure 4.6 Numeracy Level measured against Literacy Level in 2003 and 2011 (%)
3
16
34
37
10
1
6
21
35
32
5
1
3-4 levels below Literacy
2 levels below Literacy
1 level below Literacy
Equal
1 level above Literacy
2-4 levels above Literacy
2003 2011 Base: SfL2003 All aged 16-65 with literacy and numeracy score ( 7517) / SfL2011 All aged 16-65 with literacy and numeracy score (4652)
51 A correlation co-efficient is a mathematical measure of how one number is related to another. A correlation coefficient will always be between +1 and -1. A correlation coefficient of +1 or -1 means that two numbers are perfectly correlated either positively or negatively. A positive correlation means that as one variable increases so does the other, and a negative correlation means that as one variable decreases the other increases. A correlation co-efficient of 0 means that the two numbers are not related. The closer the correlation coefficient is to zero, the greater the uncertainty there is in the correlation.
43
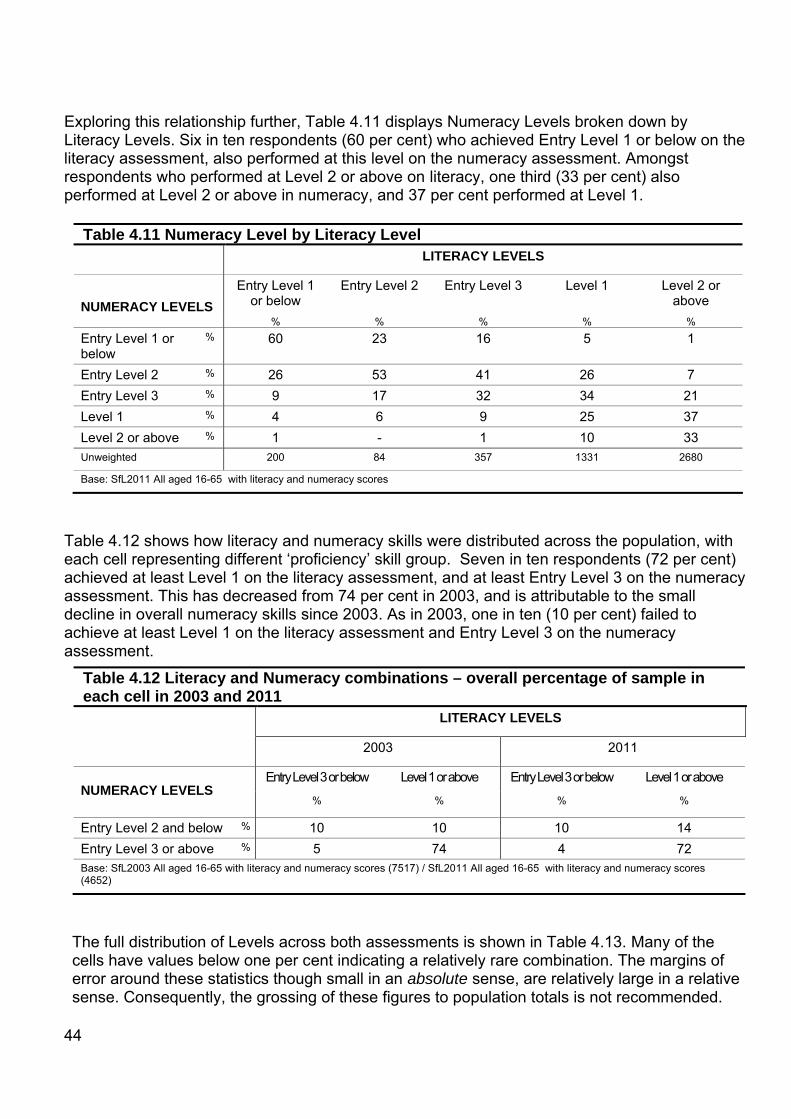
44
Exploring this relationship further, Table 4.11 displays Numeracy Levels broken down by Literacy Levels. Six in ten respondents (60 per cent) who achieved Entry Level 1 or below on the literacy assessment, also performed at this level on the numeracy assessment. Amongst respondents who performed at Level 2 or above on literacy, one third (33 per cent) also performed at Level 2 or above in numeracy, and 37 per cent performed at Level 1.
Table 4.11 Numeracy Level by Literacy Level LITERACY LEVELS
Entry Level 1 or below
Entry Level 2 Entry Level 3 Level 1 Level 2 or above NUMERACY LEVELS
% % % % % Entry Level 1 or below
% 60 23 16 5 1
Entry Level 2 % 26 53 41 26 7 Entry Level 3 % 9 17 32 34 21 Level 1 % 4 6 9 25 37 Level 2 or above % 1 - 1 10 33 Unweighted 200 84 357 1331 2680
Base: SfL2011 All aged 16-65 with literacy and numeracy scores
Table 4.12 shows how literacy and numeracy skills were distributed across the population, with each cell representing different ‘proficiency’ skill group. Seven in ten respondents (72 per cent) achieved at least Level 1 on the literacy assessment, and at least Entry Level 3 on the numeracy assessment. This has decreased from 74 per cent in 2003, and is attributable to the small decline in overall numeracy skills since 2003. As in 2003, one in ten (10 per cent) failed to achieve at least Level 1 on the literacy assessment and Entry Level 3 on the numeracy assessment.
Table 4.12 Literacy and Numeracy combinations – overall percentage of sample in each cell in 2003 and 2011 LITERACY LEVELS
2003 2011
Entry Level 3 or below Level 1 or above Entry Level 3 or below Level 1 or above NUMERACY LEVELS
% % % %
Entry Level 2 and below % 10 10 10 14 Entry Level 3 or above % 5 74 4 72 Base: SfL2003 All aged 16-65 with literacy and numeracy scores (7517) / SfL2011 All aged 16-65 with literacy and numeracy scores (4652)
The full distribution of Levels across both assessments is shown in Table 4.13. Many of the cells have values below one per cent indicating a relatively rare combination. The margins of error around these statistics though small in an absolute sense, are relatively large in a relative sense. Consequently, the grossing of these figures to population totals is not recommended.
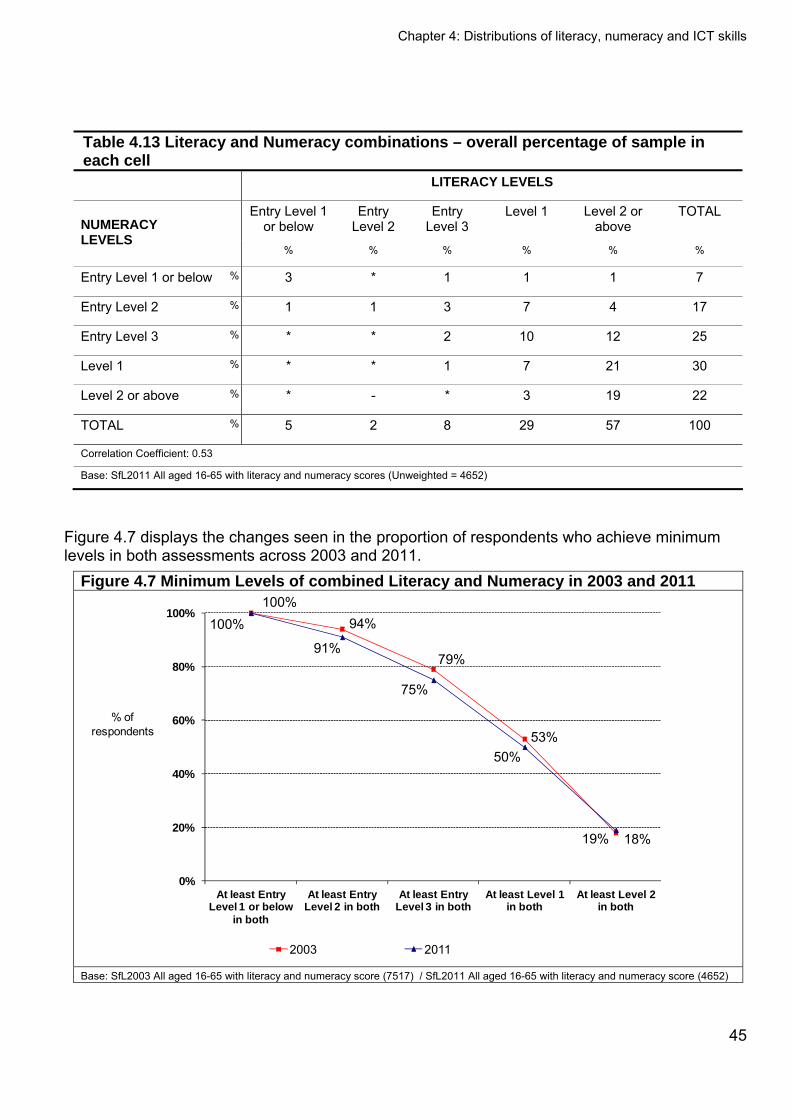
Chapter 4: Distributions of literacy, numeracy and ICT skills
Table 4.13 Literacy and Numeracy combinations – overall percentage of sample in each cell LITERACY LEVELS
Entry Level 1 or below
Entry Level 2
Entry Level 3
Level 1 Level 2 or above
TOTAL NUMERACY LEVELS
% % % % % %
Entry Level 1 or below % 3 * 1 1 1 7
Entry Level 2 % 1 1 3 7 4 17
Entry Level 3 % * * 2 10 12 25
Level 1 % * * 1 7 21 30
Level 2 or above % * - * 3 19 22
TOTAL % 5 2 8 29 57 100
Correlation Coefficient: 0.53
Base: SfL2011 All aged 16-65 with literacy and numeracy scores (Unweighted = 4652)
Figure 4.7 displays the changes seen in the proportion of respondents who achieve minimum levels in both assessments across 2003 and 2011.
Figure 4.7 Minimum Levels of combined Literacy and Numeracy in 2003 and 2011 100%
94%
79%
53%
18%
100%
91%
75%
50%
19%
0%
20%
40%
60%
80%
100%
At least Entry Level 1 or below
in both
At least Entry Level 2 in both
At least Entry Level 3 in both
At least Level 1 in both
At least Level 2 in both
2003 2011
% of respondents
Base: SfL2003 All aged 16-65 with literacy and numeracy score (7517) / SfL2011 All aged 16-65 with literacy and numeracy score (4652)
45
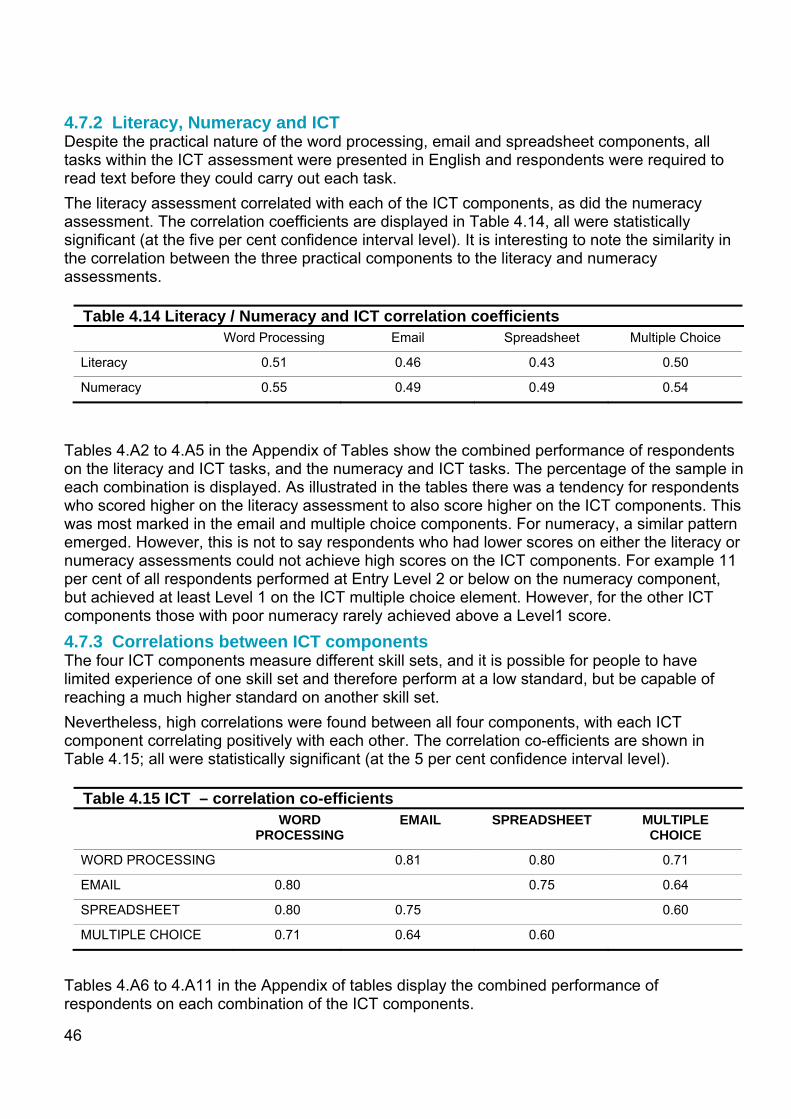
46
4.7.2 Literacy, Numeracy and ICT Despite the practical nature of the word processing, email and spreadsheet components, all tasks within the ICT assessment were presented in English and respondents were required to read text before they could carry out each task. The literacy assessment correlated with each of the ICT components, as did the numeracy assessment. The correlation coefficients are displayed in Table 4.14, all were statistically significant (at the five per cent confidence interval level). It is interesting to note the similarity in the correlation between the three practical components to the literacy and numeracy assessments.
Table 4.14 Literacy / Numeracy and ICT correlation coefficients Word Processing Email Spreadsheet Multiple Choice
Literacy 0.51 0.46 0.43 0.50
Numeracy 0.55 0.49 0.49 0.54
Tables 4.A2 to 4.A5 in the Appendix of Tables show the combined performance of respondents on the literacy and ICT tasks, and the numeracy and ICT tasks. The percentage of the sample in each combination is displayed. As illustrated in the tables there was a tendency for respondents who scored higher on the literacy assessment to also score higher on the ICT components. This was most marked in the email and multiple choice components. For numeracy, a similar pattern emerged. However, this is not to say respondents who had lower scores on either the literacy or numeracy assessments could not achieve high scores on the ICT components. For example 11 per cent of all respondents performed at Entry Level 2 or below on the numeracy component, but achieved at least Level 1 on the ICT multiple choice element. However, for the other ICT components those with poor numeracy rarely achieved above a Level1 score. 4.7.3 Correlations between ICT components The four ICT components measure different skill sets, and it is possible for people to have limited experience of one skill set and therefore perform at a low standard, but be capable of reaching a much higher standard on another skill set. Nevertheless, high correlations were found between all four components, with each ICT component correlating positively with each other. The correlation co-efficients are shown in Table 4.15; all were statistically significant (at the 5 per cent confidence interval level).
Table 4.15 ICT – correlation co-efficients WORD
PROCESSING EMAIL SPREADSHEET MULTIPLE
CHOICE
WORD PROCESSING 0.81 0.80 0.71
EMAIL 0.80 0.75 0.64
SPREADSHEET 0.80 0.75 0.60
MULTIPLE CHOICE 0.71 0.64 0.60
Tables 4.A6 to 4.A11 in the Appendix of tables display the combined performance of respondents on each combination of the ICT components.
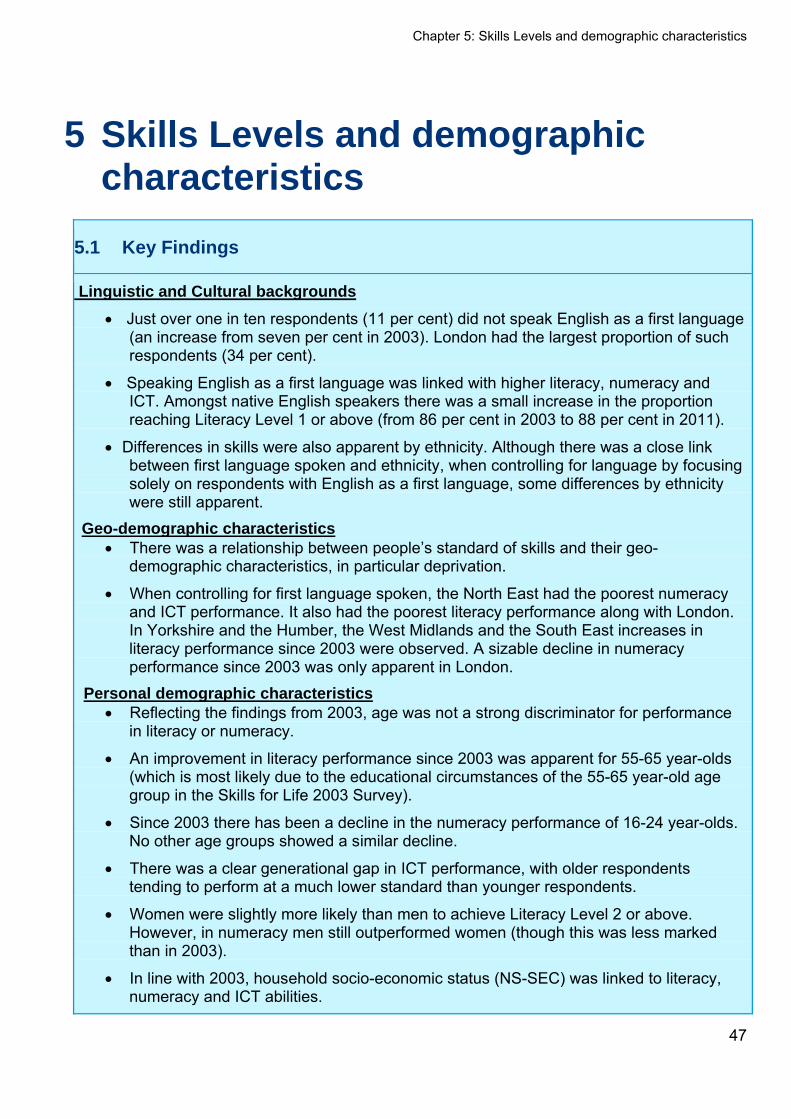
Chapter 5: Skills Levels and demographic characteristics
47
5 Skills Levels and demographic characteristics
5.1 Key Findings
Linguistic and Cultural backgrounds
Just over one in ten respondents (11 per cent) did not speak English as a first language (an increase from seven per cent in 2003). London had the largest proportion of such respondents (34 per cent).
Speaking English as a first language was linked with higher literacy, numeracy and ICT. Amongst native English speakers there was a small increase in the proportion reaching Literacy Level 1 or above (from 86 per cent in 2003 to 88 per cent in 2011).
Differences in skills were also apparent by ethnicity. Although there was a close link between first language spoken and ethnicity, when controlling for language by focusing solely on respondents with English as a first language, some differences by ethnicity were still apparent.
Geo-demographic characteristics There was a relationship between people’s standard of skills and their geo-
demographic characteristics, in particular deprivation.
When controlling for first language spoken, the North East had the poorest numeracy and ICT performance. It also had the poorest literacy performance along with London. In Yorkshire and the Humber, the West Midlands and the South East increases in literacy performance since 2003 were observed. A sizable decline in numeracy performance since 2003 was only apparent in London.
Personal demographic characteristics Reflecting the findings from 2003, age was not a strong discriminator for performance
in literacy or numeracy.
An improvement in literacy performance since 2003 was apparent for 55-65 year-olds (which is most likely due to the educational circumstances of the 55-65 year-old age group in the Skills for Life 2003 Survey).
Since 2003 there has been a decline in the numeracy performance of 16-24 year-olds. No other age groups showed a similar decline.
There was a clear generational gap in ICT performance, with older respondents tending to perform at a much lower standard than younger respondents.
Women were slightly more likely than men to achieve Literacy Level 2 or above. However, in numeracy men still outperformed women (though this was less marked than in 2003).
In line with 2003, household socio-economic status (NS-SEC) was linked to literacy, numeracy and ICT abilities.
Chapter 5: Skills Levels and demographic characteristics
48
Health was linked to abilities in literacy, numeracy and ICT, with performance in all assessments declining in line with falling ratings of health.
5.2 Introduction This chapter examines the associations between skills and a series of descriptive demographic characteristics. For literacy and numeracy, comparisons are also made to the Skills for Life 2003 Survey (SfL2003). The demographic characteristics examined can be broadly divided into the following three sub-groups:
linguistic and cultural background (collected in the background questionnaire in the following questions: ‘Ethnicid’, ‘Sesol’ to ‘Swksch’);
geo-demographic characteristics, including Region, socio-economic indicators and housing tenure (collected in the background questionnaire in questions ‘Qxtenu1’ to ‘Qxrent2’ and ‘Qwork’ to ‘HNEmplee’, and from the address information of interviewed respondents); and
personal characteristics, including sex, age and health (collected in the background questionnaire in the following questions: ’Sex to ‘Agebana’ and ‘Hqdis’ to ‘Hqlim’).52
5.3 Skills amongst respondents from different linguistic and cultural backgrounds
This section explores the relationship between language and ethnicity when assessing literacy, numeracy and ICT skills. 5.3.1 Language Just over one in ten (11 per cent) respondents reported that English was not their first language.53 This is an increase from 2003, where the equivalent figure was seven per cent. Half (50 per cent) of these respondents were from London, which remains unchanged compared with 2003 (47 per cent) (Table 5.1).
52 The Background questionnaire can be found in Annex 3. 53 It should be noted that the background questionnaire did not record immigration status and that speaking English as a first language can only be used as a rough proxy for this.
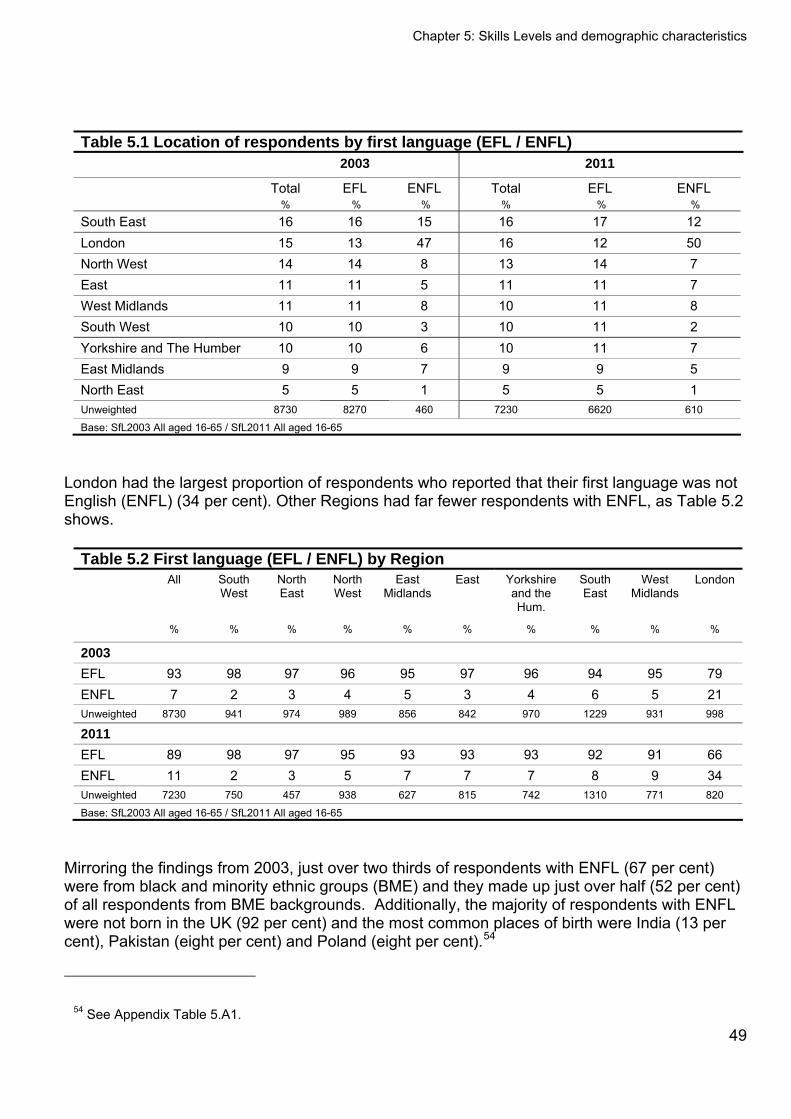
Chapter 5: Skills Levels and demographic characteristics
49
Table 5.1 Location of respondents by first language (EFL / ENFL) 2003 2011
Total EFL ENFL Total EFL ENFL % % % % % %
South East 16 16 15 16 17 12 London 15 13 47 16 12 50 North West 14 14 8 13 14 7 East 11 11 5 11 11 7 West Midlands 11 11 8 10 11 8 South West 10 10 3 10 11 2 Yorkshire and The Humber 10 10 6 10 11 7 East Midlands 9 9 7 9 9 5 North East 5 5 1 5 5 1 Unweighted 8730 8270 460 7230 6620 610
Base: SfL2003 All aged 16-65 / SfL2011 All aged 16-65
London had the largest proportion of respondents who reported that their first language was not English (ENFL) (34 per cent). Other Regions had far fewer respondents with ENFL, as Table 5.2 shows.
Table 5.2 First language (EFL / ENFL) by Region All South
West North East
North West
East Midlands
East Yorkshire and the Hum.
South East
West Midlands
London
% % % % % % % % % %
2003
EFL 93 98 97 96 95 97 96 94 95 79 ENFL 7 2 3 4 5 3 4 6 5 21 Unweighted 8730 941 974 989 856 842 970 1229 931 998
2011
EFL 89 98 97 95 93 93 93 92 91 66 ENFL 11 2 3 5 7 7 7 8 9 34 Unweighted 7230 750 457 938 627 815 742 1310 771 820
Base: SfL2003 All aged 16-65 / SfL2011 All aged 16-65
Mirroring the findings from 2003, just over two thirds of respondents with ENFL (67 per cent) were from black and minority ethnic groups (BME) and they made up just over half (52 per cent) of all respondents from BME backgrounds. Additionally, the majority of respondents with ENFL were not born in the UK (92 per cent) and the most common places of birth were India (13 per cent), Pakistan (eight per cent) and Poland (eight per cent).54
54 See Appendix Table 5.A1.

Chapter 5: Skills Levels and demographic characteristics
50
Table 5.3 displays first language spoken by age. Declines in the proportion of respondents with EFL since 2003 are evident amongst those aged 25-34 and 35-44.55 If first language status is used as a proxy for immigration, this would suggest that there has been more immigration amongst younger groups into England. Changes in first language spoken by age and generation are examined further in Section 5.5.1 of this chapter, and in the generational analysis in Chapter 6.
Table 5.3 First language (EFL / ENFL) by age All 16-19 20-24 25-34 35-44 45-54 55-65
% % % % % % %
2003
EFL 93 97 92 90 93 93 96 ENFL 7 3 8 10 7 7 4 Unweighted 8730 498 673 1925 2256 1679 1696
2011
EFL 89 91 89 83 87 92 95 ENFL 11 9 11 17 13 8 5 Unweighted 7230 386 513 1397 1616 1584 1731
Base: SfL2003 All aged 16-65 / SfL2011 All aged 16-65
Three quarters (74 per cent) of respondents with ENFL felt that they spoke English well enough to hold a conversation. This is broadly in line with the data from 2003 (67 per cent). Twenty seven per cent spoke English as their main language at home, and 61 per cent spoke English as their main language at work or college. Whilst there is no change since 2003 in the proportion who spoke English as their main language at home (31 per cent), this represents an increase in the use of English in the workplace (50 per cent in 2003). After English, the four most common languages spoken by respondents with ENFL were Punjabi (13 per cent), Hindi (12 per cent), and French and Urdu (10 per cent respectively). In 2003, the four most common languages were Punjabi (15 per cent), French (13 per cent), Urdu (12 per cent) and Gujarati (10 per cent)56. Examining respondents’ self assessment of their English skills, 37 per cent of respondents with ENFL reported that they were ‘very good’ at speaking English, and a further 31 per cent felt they were ‘fairly good’. These self assessments remain unchanged from 2003.57 Literacy and Numeracy
Reflecting the findings observed in 2003, respondents who reported English as their first language tended to perform at a higher level on both the literacy and numeracy assessments than respondents with ENFL. The importance of English as a first language is also highlighted in the regression analysis later (in Section 6.3), which shows not having English as a first language
55 Whilst the table shows declines in all other age groups also, these do not reach levels of statistical significance at the 5 per cent level. 56 See Appendix Table 5.A2. 57 See Appendix Table 5.A3.

Chapter 5: Skills Levels and demographic characteristics
51
is a predictor of ‘weak’ literacy and numeracy performance. As shown in Table 5.4 respondents whose first language was English were more likely to achieve Level 1 or above on the literacy assessment and Entry Level 3 or above on the numeracy assessment.
Table 5.4 Literacy and Numeracy Levels by first language (EFL / ENFL) LITERACY LEVELS NUMERACY LEVELS
All EFL ENFL All EFL ENFL
% % % % % %
Entry Level 1 or below 5 3 21 7 5 18 Entry Level 2 2 2 5 17 16 20 Entry Level 3 8 7 17 25 26 23 Level 1 28 29 27 29 30 25 Level 2 or above 57 60 31 22 23 14 (Literacy - Entry Level 3 or below) / Numeracy - (Entry Level 2 or below)
15 12 42 27 22 38
(Literacy - Level 1 or above) / (Numeracy - Entry Level 3 or above)
85 88 58 76 78 62
Unweighted 5824 5345 479 5823 5328 495
Base: SfL2011 All aged 16-65 with literacy scores/ SfL2011 All aged 16-65 with numeracy score
When focusing solely on respondents who spoke English as a first language (EFL), there has been a small increase in the proportion reaching Level 1 or above in literacy: in 2003 86 per cent reached this standard, rising to 88 per cent in 2011. Findings for numeracy mirror the findings for all respondents, with a small decrease in the proportion reaching Entry Level 3 or above since 2003 (decreasing from 80 per cent in 2003 to 78 per cent in 2011).58 Respondents with ENFL who claimed to have ‘very good’ spoken English tended to perform to a higher standard in literacy: 78 per cent were classified at Level 1 or above, compared to 58 per cent of all respondents with ENFL. Reflecting the pattern observed in 2003, their performance was similar to that achieved by respondents whose first language was English. Although they were still less likely to achieve Level 1 or above and more likely to achieve Entry Level 3 or below, there were no marked differences in performance at each individual Literacy Level (Table 5.5). For numeracy, as shown in Table 5.5, these respondents performed at a similar standard as those with EFL. In 2003, whilst these respondents outperformed all other respondents with ENFL, they still had weaker skills than respondents with EFL.
58 See Appendix Table 5.A4.
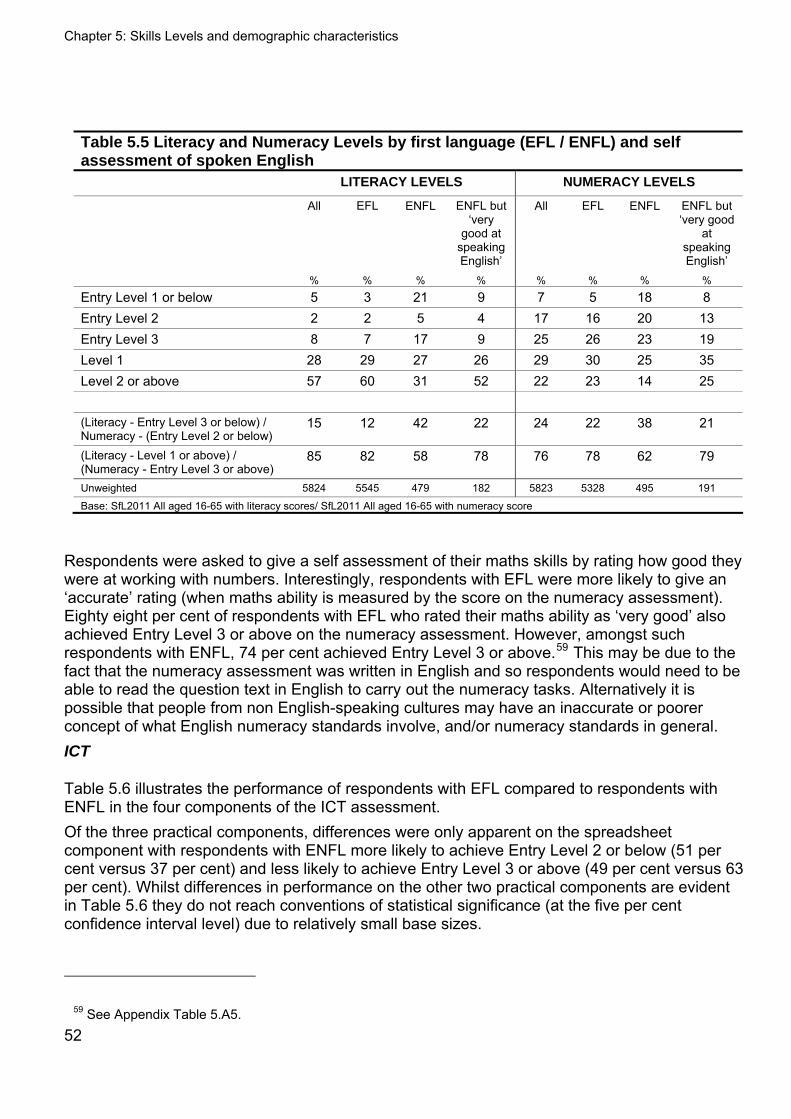
Chapter 5: Skills Levels and demographic characteristics
52
Table 5.5 Literacy and Numeracy Levels by first language (EFL / ENFL) and self assessment of spoken English LITERACY LEVELS NUMERACY LEVELS
All EFL ENFL ENFL but ‘very
good at speaking English’
All EFL ENFL ENFL but ‘very good
at speaking English’
% % % % % % % %
Entry Level 1 or below 5 3 21 9 7 5 18 8 Entry Level 2 2 2 5 4 17 16 20 13 Entry Level 3 8 7 17 9 25 26 23 19 Level 1 28 29 27 26 29 30 25 35 Level 2 or above 57 60 31 52 22 23 14 25 (Literacy - Entry Level 3 or below) / Numeracy - (Entry Level 2 or below)
15 12 42 22 24 22 38 21
(Literacy - Level 1 or above) / (Numeracy - Entry Level 3 or above)
85 82 58 78 76 78 62 79
Unweighted 5824 5545 479 182 5823 5328 495 191
Base: SfL2011 All aged 16-65 with literacy scores/ SfL2011 All aged 16-65 with numeracy score
Respondents were asked to give a self assessment of their maths skills by rating how good they were at working with numbers. Interestingly, respondents with EFL were more likely to give an ‘accurate’ rating (when maths ability is measured by the score on the numeracy assessment). Eighty eight per cent of respondents with EFL who rated their maths ability as ‘very good’ also achieved Entry Level 3 or above on the numeracy assessment. However, amongst such respondents with ENFL, 74 per cent achieved Entry Level 3 or above.59 This may be due to the fact that the numeracy assessment was written in English and so respondents would need to be able to read the question text in English to carry out the numeracy tasks. Alternatively it is possible that people from non English-speaking cultures may have an inaccurate or poorer concept of what English numeracy standards involve, and/or numeracy standards in general. ICT
Table 5.6 illustrates the performance of respondents with EFL compared to respondents with ENFL in the four components of the ICT assessment. Of the three practical components, differences were only apparent on the spreadsheet component with respondents with ENFL more likely to achieve Entry Level 2 or below (51 per cent versus 37 per cent) and less likely to achieve Entry Level 3 or above (49 per cent versus 63 per cent). Whilst differences in performance on the other two practical components are evident in Table 5.6 they do not reach conventions of statistical significance (at the five per cent confidence interval level) due to relatively small base sizes.
59 See Appendix Table 5.A5.
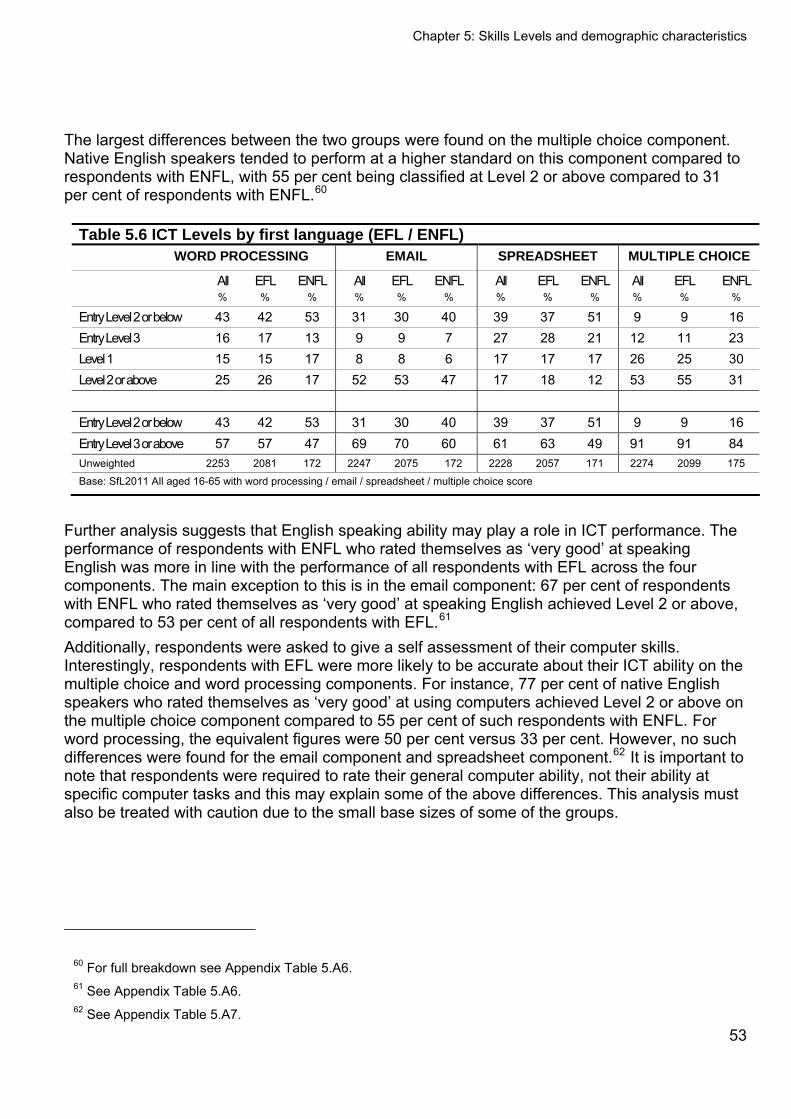
Chapter 5: Skills Levels and demographic characteristics
53
The largest differences between the two groups were found on the multiple choice component. Native English speakers tended to perform at a higher standard on this component compared to respondents with ENFL, with 55 per cent being classified at Level 2 or above compared to 31 per cent of respondents with ENFL.60
Table 5.6 ICT Levels by first language (EFL / ENFL) WORD PROCESSING EMAIL SPREADSHEET MULTIPLE CHOICE
All EFL ENFL All EFL ENFL All EFL ENFL All EFL ENFL % % % % % % % % % % % %
Entry Level 2 or below 43 42 53 31 30 40 39 37 51 9 9 16 Entry Level 3 16 17 13 9 9 7 27 28 21 12 11 23 Level 1 15 15 17 8 8 6 17 17 17 26 25 30 Level 2 or above 25 26 17 52 53 47 17 18 12 53 55 31
Entry Level 2 or below 43 42 53 31 30 40 39 37 51 9 9 16 Entry Level 3 or above 57 57 47 69 70 60 61 63 49 91 91 84 Unweighted 2253 2081 172 2247 2075 172 2228 2057 171 2274 2099 175
Base: SfL2011 All aged 16-65 with word processing / email / spreadsheet / multiple choice score
Further analysis suggests that English speaking ability may play a role in ICT performance. The performance of respondents with ENFL who rated themselves as ‘very good’ at speaking English was more in line with the performance of all respondents with EFL across the four components. The main exception to this is in the email component: 67 per cent of respondents with ENFL who rated themselves as ‘very good’ at speaking English achieved Level 2 or above, compared to 53 per cent of all respondents with EFL.61 Additionally, respondents were asked to give a self assessment of their computer skills. Interestingly, respondents with EFL were more likely to be accurate about their ICT ability on the multiple choice and word processing components. For instance, 77 per cent of native English speakers who rated themselves as ‘very good’ at using computers achieved Level 2 or above on the multiple choice component compared to 55 per cent of such respondents with ENFL. For word processing, the equivalent figures were 50 per cent versus 33 per cent. However, no such differences were found for the email component and spreadsheet component.62 It is important to note that respondents were required to rate their general computer ability, not their ability at specific computer tasks and this may explain some of the above differences. This analysis must also be treated with caution due to the small base sizes of some of the groups.
60 For full breakdown see Appendix Table 5.A6. 61 See Appendix Table 5.A6. 62 See Appendix Table 5.A7.
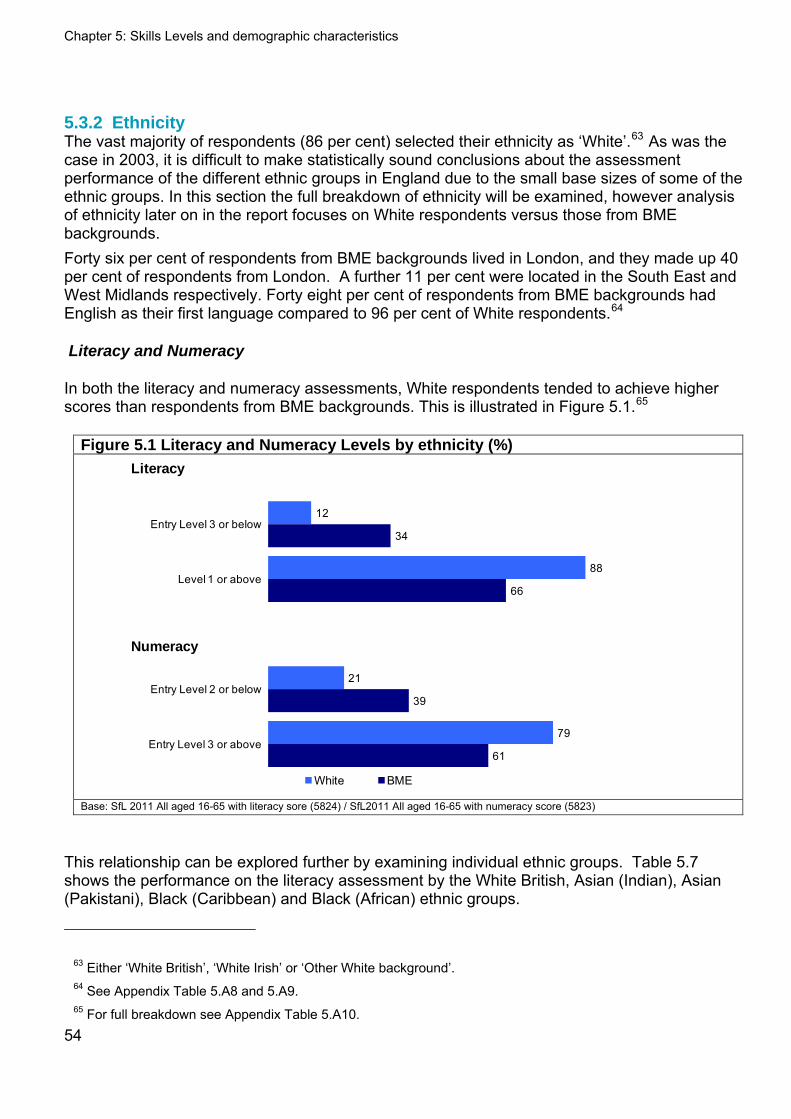
Chapter 5: Skills Levels and demographic characteristics
5.3.2 Ethnicity The vast majority of respondents (86 per cent) selected their ethnicity as ‘White’.63 As was the case in 2003, it is difficult to make statistically sound conclusions about the assessment performance of the different ethnic groups in England due to the small base sizes of some of the ethnic groups. In this section the full breakdown of ethnicity will be examined, however analysis of ethnicity later on in the report focuses on White respondents versus those from BME backgrounds. Forty six per cent of respondents from BME backgrounds lived in London, and they made up 40 per cent of respondents from London. A further 11 per cent were located in the South East and West Midlands respectively. Forty eight per cent of respondents from BME backgrounds had English as their first language compared to 96 per cent of White respondents.64
Literacy and Numeracy
In both the literacy and numeracy assessments, White respondents tended to achieve higher scores than respondents from BME backgrounds. This is illustrated in Figure 5.1.65
Figure 5.1 Literacy and Numeracy Levels by ethnicity (%)
12
88
21
79
34
66
39
61
Entry Level 3 or below
Level 1 or above
Entry Level 2 or below
Entry Level 3 or above
White BME
Literacy
Numeracy
Base: SfL 2011 All aged 16-65 with literacy sore (5824) / SfL2011 All aged 16-65 with numeracy score (5823)
This relationship can be explored further by examining individual ethnic groups. Table 5.7 shows the performance on the literacy assessment by the White British, Asian (Indian), Asian (Pakistani), Black (Caribbean) and Black (African) ethnic groups.
63 Either ‘White British’, ‘White Irish’ or ‘Other White background’. 64 See Appendix Table 5.A8 and 5.A9. 65 For full breakdown see Appendix Table 5.A10.
54
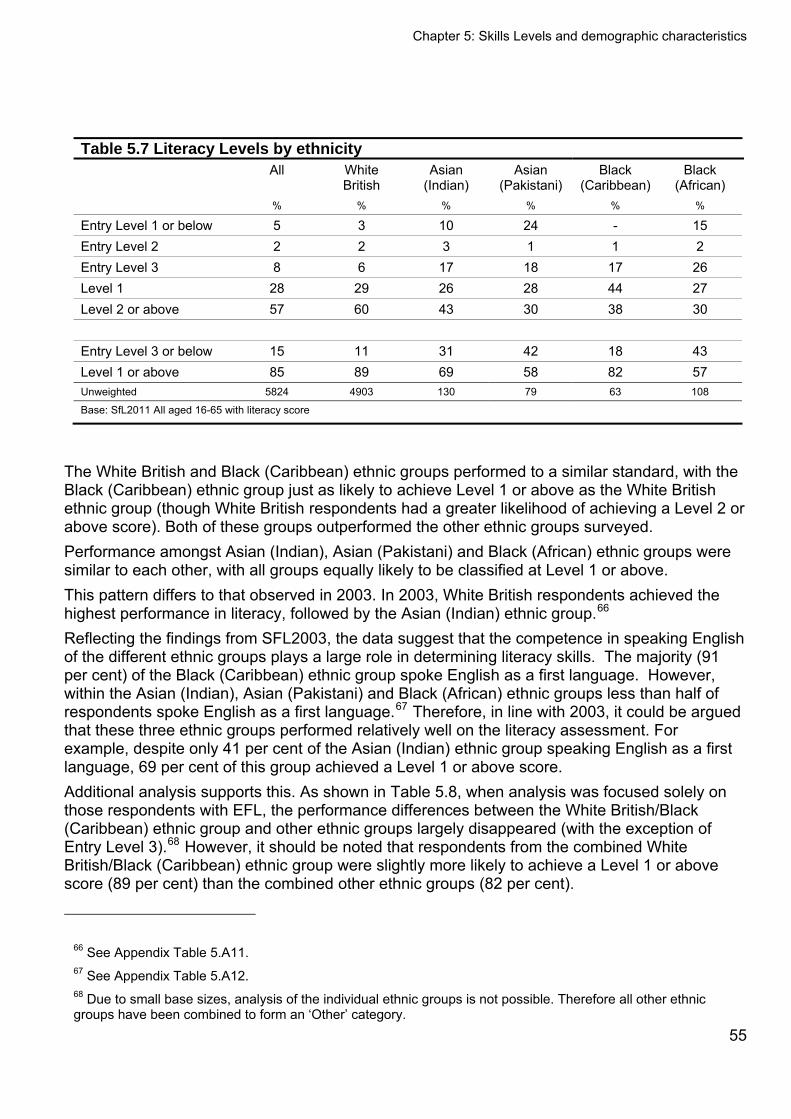
Chapter 5: Skills Levels and demographic characteristics
55
Table 5.7 Literacy Levels by ethnicity All White
British Asian
(Indian) Asian
(Pakistani) Black
(Caribbean) Black
(African) % % % % % %
Entry Level 1 or below 5 3 10 24 - 15 Entry Level 2 2 2 3 1 1 2 Entry Level 3 8 6 17 18 17 26 Level 1 28 29 26 28 44 27 Level 2 or above 57 60 43 30 38 30 Entry Level 3 or below 15 11 31 42 18 43 Level 1 or above 85 89 69 58 82 57 Unweighted 5824 4903 130 79 63 108
Base: SfL2011 All aged 16-65 with literacy score
The White British and Black (Caribbean) ethnic groups performed to a similar standard, with the Black (Caribbean) ethnic group just as likely to achieve Level 1 or above as the White British ethnic group (though White British respondents had a greater likelihood of achieving a Level 2 or above score). Both of these groups outperformed the other ethnic groups surveyed. Performance amongst Asian (Indian), Asian (Pakistani) and Black (African) ethnic groups were similar to each other, with all groups equally likely to be classified at Level 1 or above. This pattern differs to that observed in 2003. In 2003, White British respondents achieved the highest performance in literacy, followed by the Asian (Indian) ethnic group.66 Reflecting the findings from SFL2003, the data suggest that the competence in speaking English of the different ethnic groups plays a large role in determining literacy skills. The majority (91 per cent) of the Black (Caribbean) ethnic group spoke English as a first language. However, within the Asian (Indian), Asian (Pakistani) and Black (African) ethnic groups less than half of respondents spoke English as a first language.67 Therefore, in line with 2003, it could be argued that these three ethnic groups performed relatively well on the literacy assessment. For example, despite only 41 per cent of the Asian (Indian) ethnic group speaking English as a first language, 69 per cent of this group achieved a Level 1 or above score. Additional analysis supports this. As shown in Table 5.8, when analysis was focused solely on those respondents with EFL, the performance differences between the White British/Black (Caribbean) ethnic group and other ethnic groups largely disappeared (with the exception of Entry Level 3).68 However, it should be noted that respondents from the combined White British/Black (Caribbean) ethnic group were slightly more likely to achieve a Level 1 or above score (89 per cent) than the combined other ethnic groups (82 per cent).
66 See Appendix Table 5.A11. 67 See Appendix Table 5.A12. 68 Due to small base sizes, analysis of the individual ethnic groups is not possible. Therefore all other ethnic groups have been combined to form an ‘Other’ category.
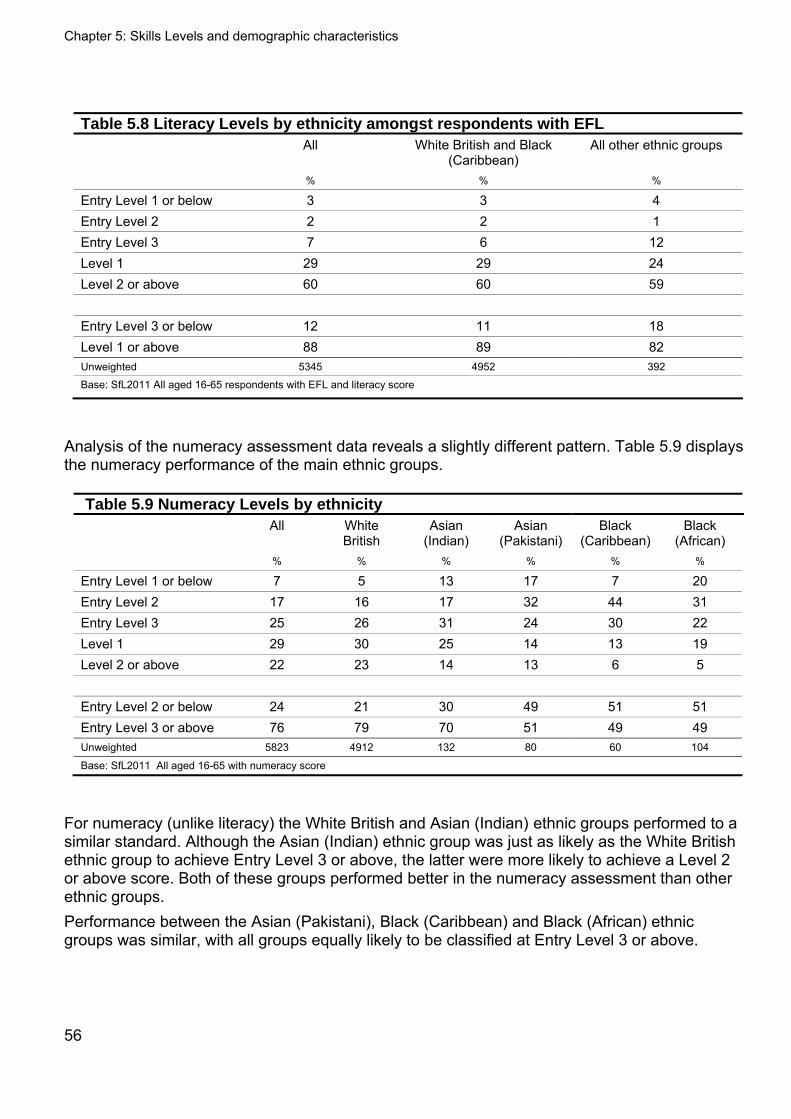
Chapter 5: Skills Levels and demographic characteristics
56
Table 5.8 Literacy Levels by ethnicity amongst respondents with EFL All White British and Black
(Caribbean) All other ethnic groups
% % %
Entry Level 1 or below 3 3 4 Entry Level 2 2 2 1 Entry Level 3 7 6 12 Level 1 29 29 24 Level 2 or above 60 60 59 Entry Level 3 or below 12 11 18 Level 1 or above 88 89 82 Unweighted 5345 4952 392
Base: SfL2011 All aged 16-65 respondents with EFL and literacy score
Analysis of the numeracy assessment data reveals a slightly different pattern. Table 5.9 displays the numeracy performance of the main ethnic groups.
Table 5.9 Numeracy Levels by ethnicity All White
British Asian
(Indian) Asian
(Pakistani) Black
(Caribbean) Black
(African) % % % % % %
Entry Level 1 or below 7 5 13 17 7 20 Entry Level 2 17 16 17 32 44 31 Entry Level 3 25 26 31 24 30 22 Level 1 29 30 25 14 13 19 Level 2 or above 22 23 14 13 6 5 Entry Level 2 or below 24 21 30 49 51 51 Entry Level 3 or above 76 79 70 51 49 49 Unweighted 5823 4912 132 80 60 104
Base: SfL2011 All aged 16-65 with numeracy score
For numeracy (unlike literacy) the White British and Asian (Indian) ethnic groups performed to a similar standard. Although the Asian (Indian) ethnic group was just as likely as the White British ethnic group to achieve Entry Level 3 or above, the latter were more likely to achieve a Level 2 or above score. Both of these groups performed better in the numeracy assessment than other ethnic groups. Performance between the Asian (Pakistani), Black (Caribbean) and Black (African) ethnic groups was similar, with all groups equally likely to be classified at Entry Level 3 or above.
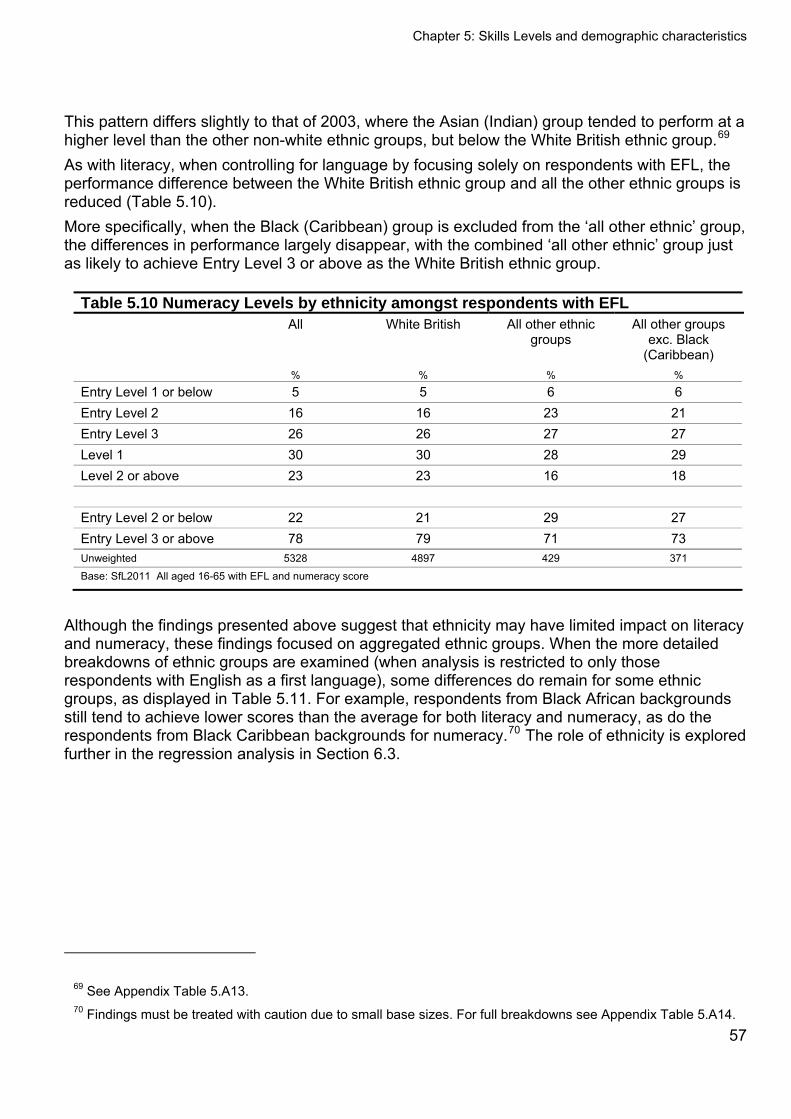
Chapter 5: Skills Levels and demographic characteristics
57
This pattern differs slightly to that of 2003, where the Asian (Indian) group tended to perform at a higher level than the other non-white ethnic groups, but below the White British ethnic group.69 As with literacy, when controlling for language by focusing solely on respondents with EFL, the performance difference between the White British ethnic group and all the other ethnic groups is reduced (Table 5.10). More specifically, when the Black (Caribbean) group is excluded from the ‘all other ethnic’ group, the differences in performance largely disappear, with the combined ‘all other ethnic’ group just as likely to achieve Entry Level 3 or above as the White British ethnic group.
Table 5.10 Numeracy Levels by ethnicity amongst respondents with EFL All White British All other ethnic
groups All other groups
exc. Black (Caribbean)
% % % %
Entry Level 1 or below 5 5 6 6 Entry Level 2 16 16 23 21 Entry Level 3 26 26 27 27 Level 1 30 30 28 29 Level 2 or above 23 23 16 18 Entry Level 2 or below 22 21 29 27 Entry Level 3 or above 78 79 71 73 Unweighted 5328 4897 429 371
Base: SfL2011 All aged 16-65 with EFL and numeracy score
Although the findings presented above suggest that ethnicity may have limited impact on literacy and numeracy, these findings focused on aggregated ethnic groups. When the more detailed breakdowns of ethnic groups are examined (when analysis is restricted to only those respondents with English as a first language), some differences do remain for some ethnic groups, as displayed in Table 5.11. For example, respondents from Black African backgrounds still tend to achieve lower scores than the average for both literacy and numeracy, as do the respondents from Black Caribbean backgrounds for numeracy.70 The role of ethnicity is explored further in the regression analysis in Section 6.3.
69 See Appendix Table 5.A13. 70 Findings must be treated with caution due to small base sizes. For full breakdowns see Appendix Table 5.A14.
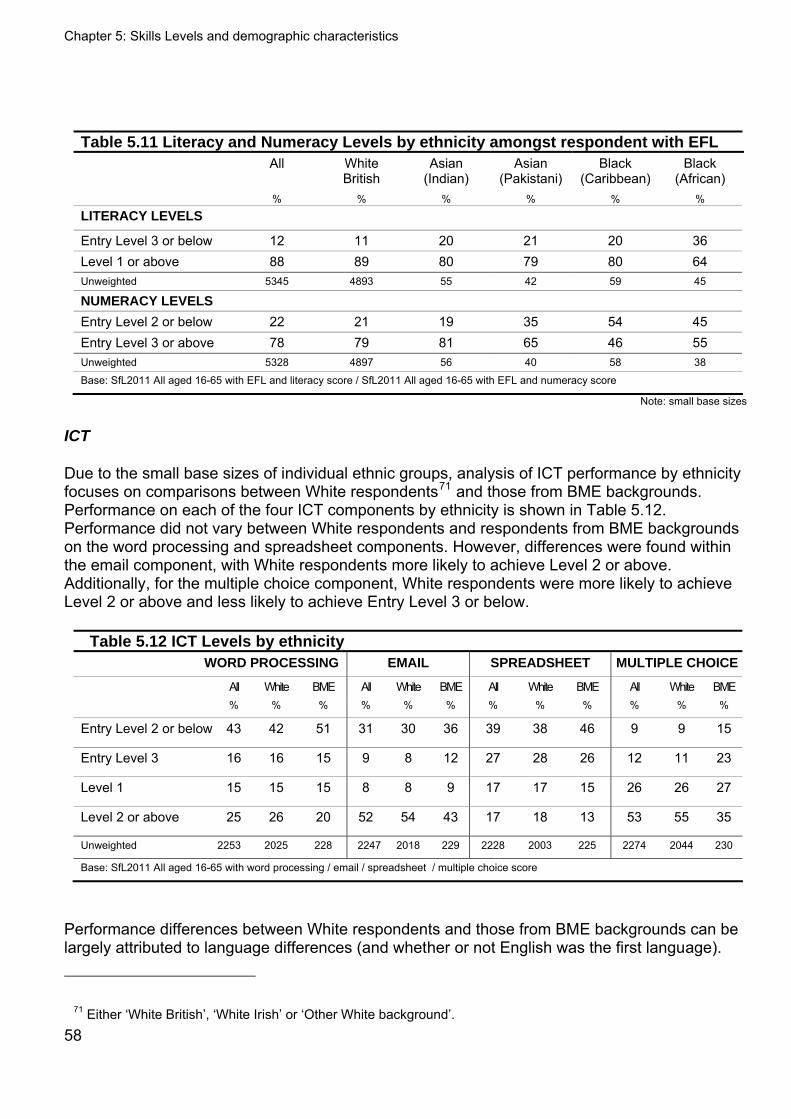
Chapter 5: Skills Levels and demographic characteristics
58
Table 5.11 Literacy and Numeracy Levels by ethnicity amongst respondent with EFL All White
British Asian
(Indian) Asian
(Pakistani) Black
(Caribbean) Black
(African) % % % % % %
LITERACY LEVELS
Entry Level 3 or below 12 11 20 21 20 36 Level 1 or above 88 89 80 79 80 64 Unweighted 5345 4893 55 42 59 45
NUMERACY LEVELS
Entry Level 2 or below 22 21 19 35 54 45 Entry Level 3 or above 78 79 81 65 46 55 Unweighted 5328 4897 56 40 58 38
Base: SfL2011 All aged 16-65 with EFL and literacy score / SfL2011 All aged 16-65 with EFL and numeracy score
Note: small base sizes
ICT
Due to the small base sizes of individual ethnic groups, analysis of ICT performance by ethnicity focuses on comparisons between White respondents71 and those from BME backgrounds. Performance on each of the four ICT components by ethnicity is shown in Table 5.12. Performance did not vary between White respondents and respondents from BME backgrounds on the word processing and spreadsheet components. However, differences were found within the email component, with White respondents more likely to achieve Level 2 or above. Additionally, for the multiple choice component, White respondents were more likely to achieve Level 2 or above and less likely to achieve Entry Level 3 or below.
Table 5.12 ICT Levels by ethnicity WORD PROCESSING EMAIL SPREADSHEET MULTIPLE CHOICE
All White BME All White BME All White BME All White BME % % % % % % % % % % % %
Entry Level 2 or below 43 42 51 31 30 36 39 38 46 9 9 15
Entry Level 3 16 16 15 9 8 12 27 28 26 12 11 23
Level 1 15 15 15 8 8 9 17 17 15 26 26 27
Level 2 or above 25 26 20 52 54 43 17 18 13 53 55 35
Unweighted 2253 2025 228 2247 2018 229 2228 2003 225 2274 2044 230
Base: SfL2011 All aged 16-65 with word processing / email / spreadsheet / multiple choice score
Performance differences between White respondents and those from BME backgrounds can be largely attributed to language differences (and whether or not English was the first language).
71 Either ‘White British’, ‘White Irish’ or ‘Other White background’.
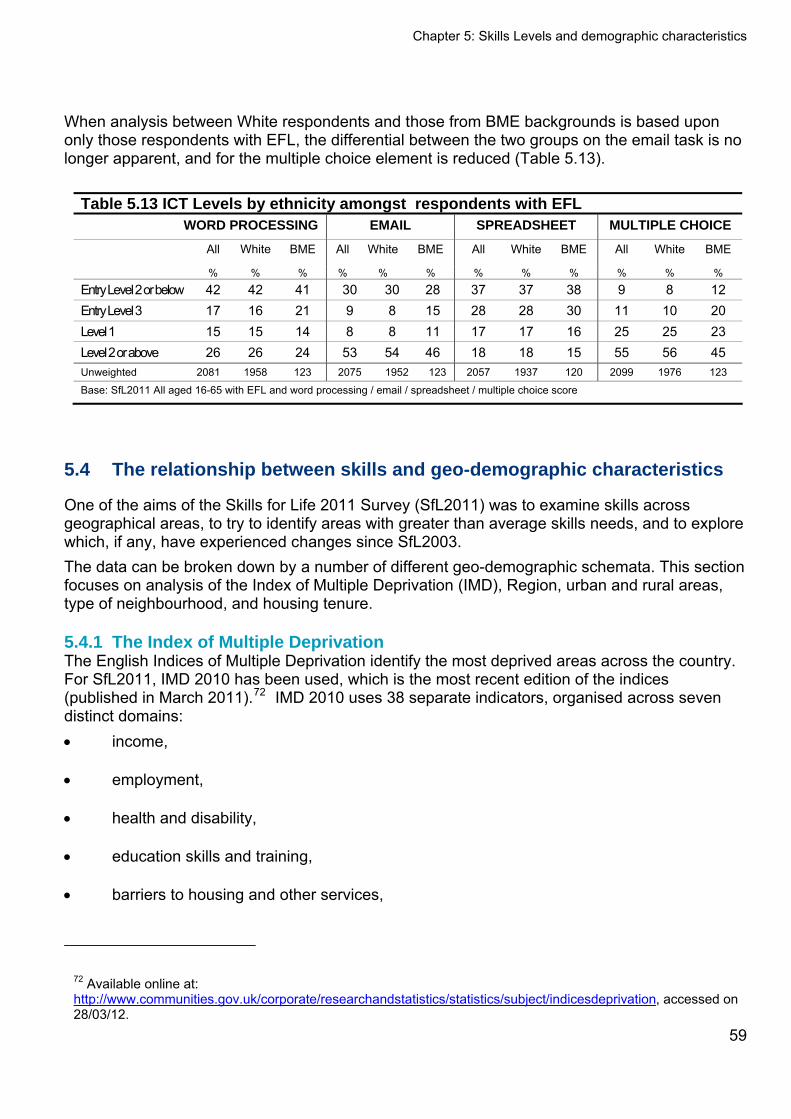
Chapter 5: Skills Levels and demographic characteristics
59
When analysis between White respondents and those from BME backgrounds is based upon only those respondents with EFL, the differential between the two groups on the email task is no longer apparent, and for the multiple choice element is reduced (Table 5.13).
Table 5.13 ICT Levels by ethnicity amongst respondents with EFL WORD PROCESSING EMAIL SPREADSHEET MULTIPLE CHOICE
All White BME All White BME All White BME All White BME
% % % % % % % % % % % %
Entry Level 2 or below 42 42 41 30 30 28 37 37 38 9 8 12 Entry Level 3 17 16 21 9 8 15 28 28 30 11 10 20 Level 1 15 15 14 8 8 11 17 17 16 25 25 23 Level 2 or above 26 26 24 53 54 46 18 18 15 55 56 45 Unweighted 2081 1958 123 2075 1952 123 2057 1937 120 2099 1976 123
Base: SfL2011 All aged 16-65 with EFL and word processing / email / spreadsheet / multiple choice score
5.4 The relationship between skills and geo-demographic characteristics
One of the aims of the Skills for Life 2011 Survey (SfL2011) was to examine skills across geographical areas, to try to identify areas with greater than average skills needs, and to explore which, if any, have experienced changes since SfL2003. The data can be broken down by a number of different geo-demographic schemata. This section focuses on analysis of the Index of Multiple Deprivation (IMD), Region, urban and rural areas, type of neighbourhood, and housing tenure.
5.4.1 The Index of Multiple Deprivation The English Indices of Multiple Deprivation identify the most deprived areas across the country. For SfL2011, IMD 2010 has been used, which is the most recent edition of the indices (published in March 2011).72 IMD 2010 uses 38 separate indicators, organised across seven distinct domains: income,
employment,
health and disability,
education skills and training,
barriers to housing and other services,
72 Available online at: http://www.communities.gov.uk/corporate/researchandstatistics/statistics/subject/indicesdeprivation, accessed on 28/03/12.
Chapter 5: Skills Levels and demographic characteristics
60
crime and
living environment.
These are combined using appropriate weights to create an IMD score for each Lower Layer Super Output Area (LSOA) in England. IMD 2010 can therefore be used to rank every LSOA in England according to its relative deprivation.73 IMD 2010 is a continuous measure of relative deprivation therefore there is no definitive point on the scale below which areas are considered to be deprived and above which they are not. In most cases, it is user defined by applying a cut-off value beyond which areas are deemed to be the most deprived. Many users of IMD 2010 focus on the most deprived 10 per cent (the most deprived decile) of LSOAs in England.74 IMD scores can be attributed to SfL2011 survey respondents, by examining the LSOA in which each survey respondent lives.
In SfL2003, the IMD 2000 was used. Therefore only limited comparisons between the two surveys have been made, and these must be treated with caution.75 In 2011, the IMD score started at 1 (least deprived) and peaked at 84 amongst Lower Layer Super Output Areas sampled in the SfL2011.76 The mean score was 22, but the median score was 17 with the 75th percentile falling at 31 so the scale had a natural skew towards its lower end. It should be noted that the scale is not strictly proportional. An area with an IMD value of 40 is not necessarily twice as deprived as one with an IMD value of 20. The cumulative IMD scores for SfL2003 and SfL2011 are shown in Figure 5.2.
73 Super Output Areas are a unit of geography used by Neighbourhood Statistics designed for small area statistics. There are two layers: Lower Layer Super Output Areas (LSOAs) and Middle Layer Super Output Areas (MSOAs). LSOAs were built using 2001 Census data from groups of Output Areas. Further details available online at: http://www.neighbourhood.statistics.gov.uk/dissemination/Info.do?page=aboutneighbourhood/geography/geography.htm, accessed on 28/03/12. 74 Communities and Local Government (2010) The English Indices of Deprivation 2010, available online at: http://www.communities.gov.uk/documents/statistics/pdf/1871208.pdf, accessed on 28/03/12. 75 IMD 2000 used 8,500 English wards as the basic geographical area of analysis, whilst the IMD 2010 was based on a finer level of detail - 32,482 English Lower Layer Super Output Areas (LSOAs). IMD 2000 was also based on six separate deprivation indices (income, employment, health, education, housing and services access), compared to the seven in IMD 2010 (listed above). 76 The IMD distribution in the survey sample is a near match for England as a whole. (This was also the case in the 2003 survey.) In the whole of England the maximum score is 87.8
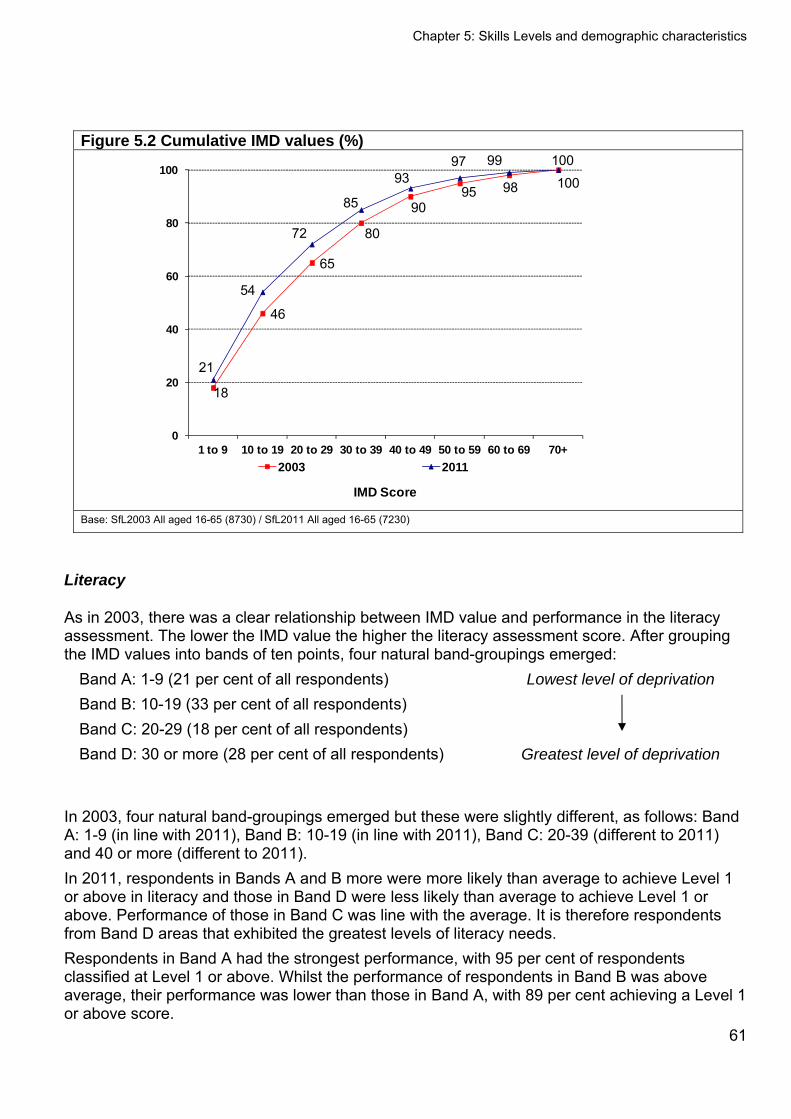
Chapter 5: Skills Levels and demographic characteristics
Figure 5.2 Cumulative IMD values (%)
18
46
65
80
9095 98
100
21
54
72
85
9397 99
100
0
20
40
60
80
100
1 to 9 10 to 19 20 to 29 30 to 39 40 to 49 50 to 59 60 to 69 70+
2003 2011
IMD Score Base: SfL2003 All aged 16-65 (8730) / SfL2011 All aged 16-65 (7230)
Literacy
As in 2003, there was a clear relationship between IMD value and performance in the literacy assessment. The lower the IMD value the higher the literacy assessment score. After grouping the IMD values into bands of ten points, four natural band-groupings emerged:
Band A: 1-9 (21 per cent of all respondents) Lowest level of deprivation Band B: 10-19 (33 per cent of all respondents) Band C: 20-29 (18 per cent of all respondents) Band D: 30 or more (28 per cent of all respondents) Greatest level of deprivation
In 2003, four natural band-groupings emerged but these were slightly different, as follows: Band A: 1-9 (in line with 2011), Band B: 10-19 (in line with 2011), Band C: 20-39 (different to 2011) and 40 or more (different to 2011). In 2011, respondents in Bands A and B more were more likely than average to achieve Level 1 or above in literacy and those in Band D were less likely than average to achieve Level 1 or above. Performance of those in Band C was line with the average. It is therefore respondents from Band D areas that exhibited the greatest levels of literacy needs. Respondents in Band A had the strongest performance, with 95 per cent of respondents classified at Level 1 or above. Whilst the performance of respondents in Band B was above average, their performance was lower than those in Band A, with 89 per cent achieving a Level 1 or above score.
61
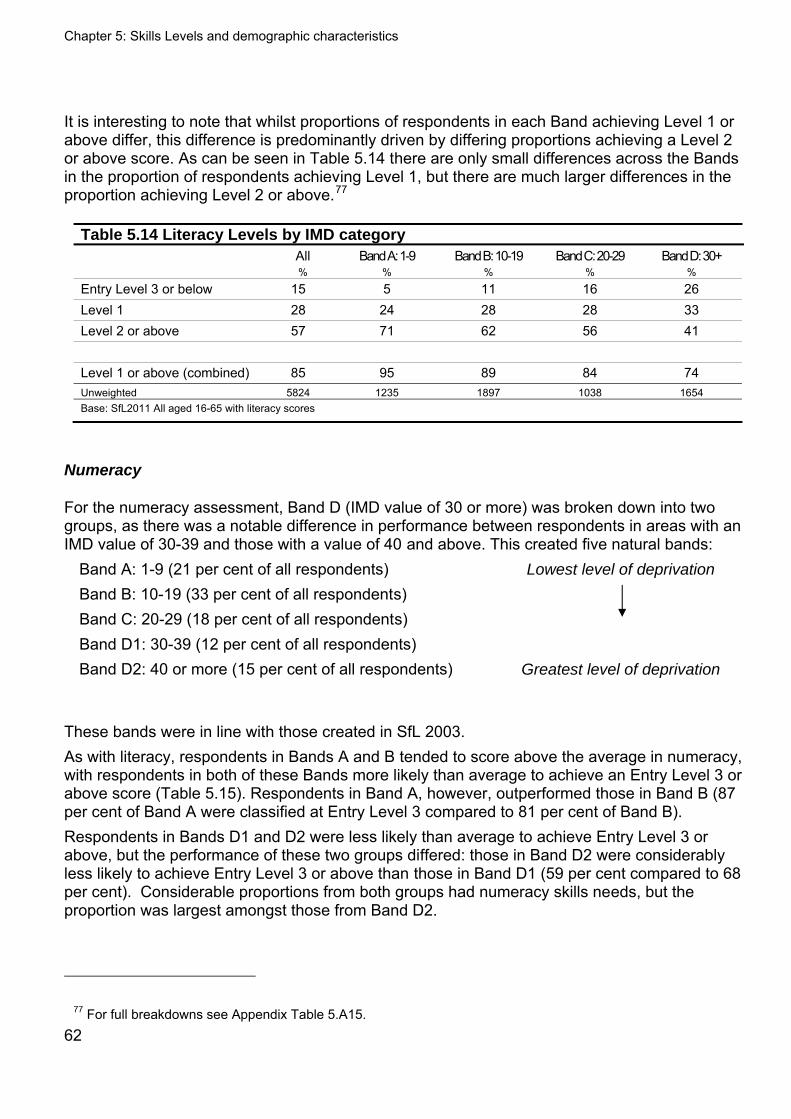
Chapter 5: Skills Levels and demographic characteristics
It is interesting to note that whilst proportions of respondents in each Band achieving Level 1 or above differ, this difference is predominantly driven by differing proportions achieving a Level 2 or above score. As can be seen in Table 5.14 there are only small differences across the Bands in the proportion of respondents achieving Level 1, but there are much larger differences in the proportion achieving Level 2 or above.77
Table 5.14 Literacy Levels by IMD category All Band A: 1-9 Band B: 10-19 Band C: 20-29 Band D: 30+ % % % % %
Entry Level 3 or below 15 5 11 16 26 Level 1 28 24 28 28 33 Level 2 or above 57 71 62 56 41 Level 1 or above (combined) 85 95 89 84 74 Unweighted 5824 1235 1897 1038 1654 Base: SfL2011 All aged 16-65 with literacy scores
Numeracy
For the numeracy assessment, Band D (IMD value of 30 or more) was broken down into two groups, as there was a notable difference in performance between respondents in areas with an IMD value of 30-39 and those with a value of 40 and above. This created five natural bands:
Band A: 1-9 (21 per cent of all respondents) Lowest level of deprivation Band B: 10-19 (33 per cent of all respondents) Band C: 20-29 (18 per cent of all respondents) Band D1: 30-39 (12 per cent of all respondents) Band D2: 40 or more (15 per cent of all respondents) Greatest level of deprivation
These bands were in line with those created in SfL 2003. As with literacy, respondents in Bands A and B tended to score above the average in numeracy, with respondents in both of these Bands more likely than average to achieve an Entry Level 3 or above score (Table 5.15). Respondents in Band A, however, outperformed those in Band B (87 per cent of Band A were classified at Entry Level 3 compared to 81 per cent of Band B). Respondents in Bands D1 and D2 were less likely than average to achieve Entry Level 3 or above, but the performance of these two groups differed: those in Band D2 were considerably less likely to achieve Entry Level 3 or above than those in Band D1 (59 per cent compared to 68 per cent). Considerable proportions from both groups had numeracy skills needs, but the proportion was largest amongst those from Band D2.
77 For full breakdowns see Appendix Table 5.A15. 62
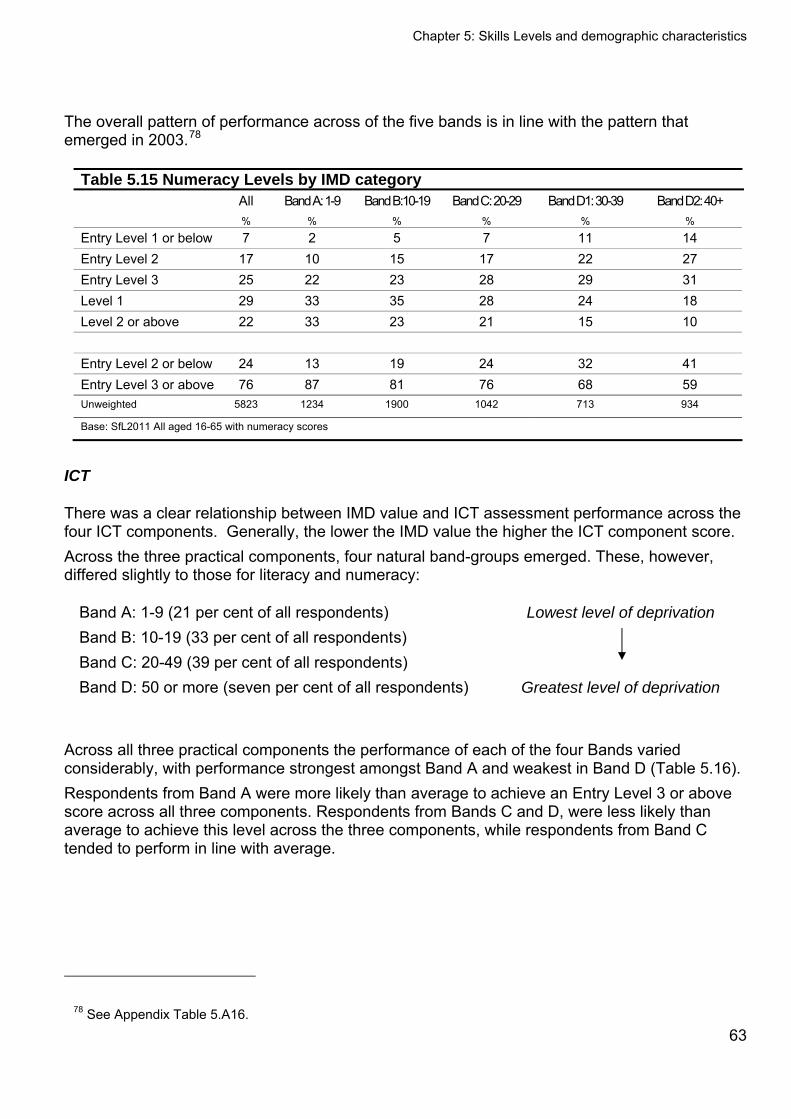
Chapter 5: Skills Levels and demographic characteristics
The overall pattern of performance across of the five bands is in line with the pattern that emerged in 2003.78
Table 5.15 Numeracy Levels by IMD category All Band A: 1-9 Band B:10-19 Band C: 20-29 Band D1: 30-39 Band D2: 40+ % % % % % %
Entry Level 1 or below 7 2 5 7 11 14 Entry Level 2 17 10 15 17 22 27 Entry Level 3 25 22 23 28 29 31 Level 1 29 33 35 28 24 18 Level 2 or above 22 33 23 21 15 10 Entry Level 2 or below 24 13 19 24 32 41 Entry Level 3 or above 76 87 81 76 68 59 Unweighted 5823 1234 1900 1042 713 934
Base: SfL2011 All aged 16-65 with numeracy scores
ICT
There was a clear relationship between IMD value and ICT assessment performance across the four ICT components. Generally, the lower the IMD value the higher the ICT component score. Across the three practical components, four natural band-groups emerged. These, however, differed slightly to those for literacy and numeracy:
Band A: 1-9 (21 per cent of all respondents) Lowest level of deprivation Band B: 10-19 (33 per cent of all respondents) Band C: 20-49 (39 per cent of all respondents) Band D: 50 or more (seven per cent of all respondents) Greatest level of deprivation
Across all three practical components the performance of each of the four Bands varied considerably, with performance strongest amongst Band A and weakest in Band D (Table 5.16). Respondents from Band A were more likely than average to achieve an Entry Level 3 or above score across all three components. Respondents from Bands C and D, were less likely than average to achieve this level across the three components, while respondents from Band C tended to perform in line with average.
78 See Appendix Table 5.A16. 63
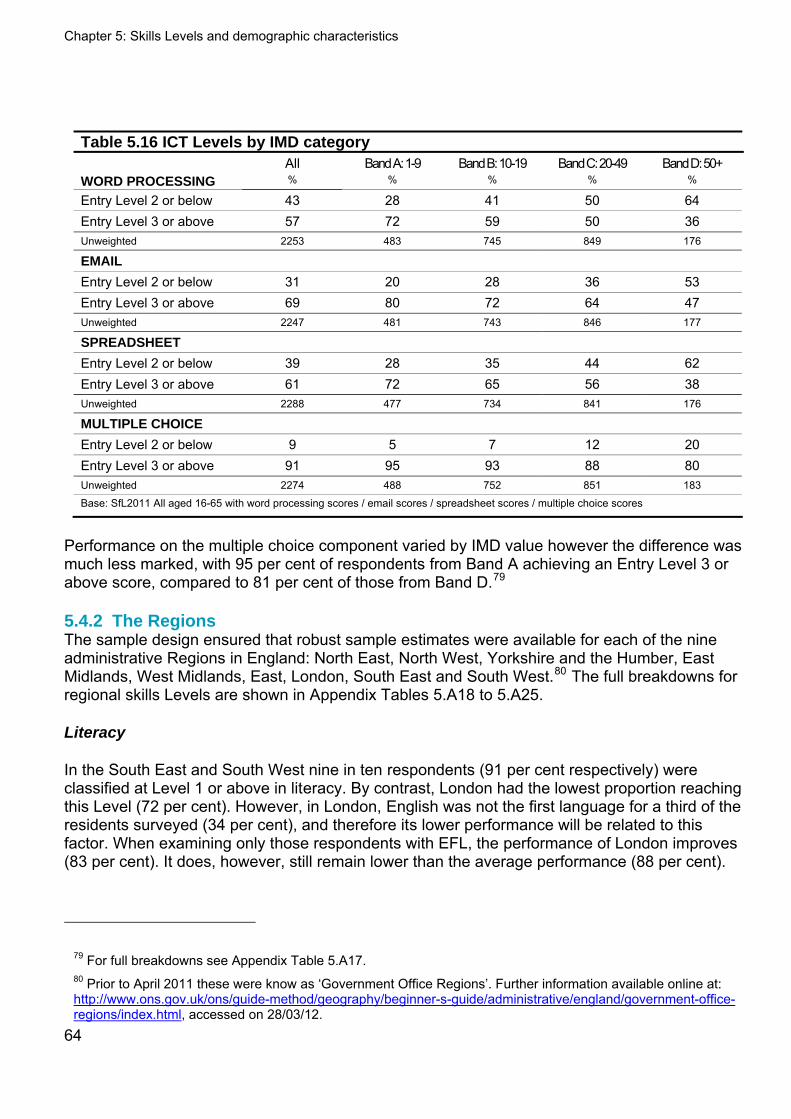
Chapter 5: Skills Levels and demographic characteristics
64
Table 5.16 ICT Levels by IMD category All Band A: 1-9 Band B: 10-19 Band C: 20-49 Band D: 50+ WORD PROCESSING % % % % %
Entry Level 2 or below 43 28 41 50 64 Entry Level 3 or above 57 72 59 50 36 Unweighted 2253 483 745 849 176
Entry Level 2 or below 31 20 28 36 53 Entry Level 3 or above 69 80 72 64 47 Unweighted 2247 481 743 846 177
SPREADSHEET
Entry Level 2 or below 39 28 35 44 62 Entry Level 3 or above 61 72 65 56 38 Unweighted 2288 477 734 841 176
MULTIPLE CHOICE
Entry Level 2 or below 9 5 7 12 20 Entry Level 3 or above 91 95 93 88 80 Unweighted 2274 488 752 851 183
Base: SfL2011 All aged 16-65 with word processing scores / email scores / spreadsheet scores / multiple choice scores
Performance on the multiple choice component varied by IMD value however the difference was much less marked, with 95 per cent of respondents from Band A achieving an Entry Level 3 or above score, compared to 81 per cent of those from Band D.79
5.4.2 The Regions The sample design ensured that robust sample estimates were available for each of the nine administrative Regions in England: North East, North West, Yorkshire and the Humber, East Midlands, West Midlands, East, London, South East and South West.80 The full breakdowns for regional skills Levels are shown in Appendix Tables 5.A18 to 5.A25.
Literacy
In the South East and South West nine in ten respondents (91 per cent respectively) were classified at Level 1 or above in literacy. By contrast, London had the lowest proportion reaching this Level (72 per cent). However, in London, English was not the first language for a third of the residents surveyed (34 per cent), and therefore its lower performance will be related to this factor. When examining only those respondents with EFL, the performance of London improves (83 per cent). It does, however, still remain lower than the average performance (88 per cent).
79 For full breakdowns see Appendix Table 5.A17. 80 Prior to April 2011 these were know as ‘Government Office Regions’. Further information available online at: http://www.ons.gov.uk/ons/guide-method/geography/beginner-s-guide/administrative/england/government-office-regions/index.html, accessed on 28/03/12.
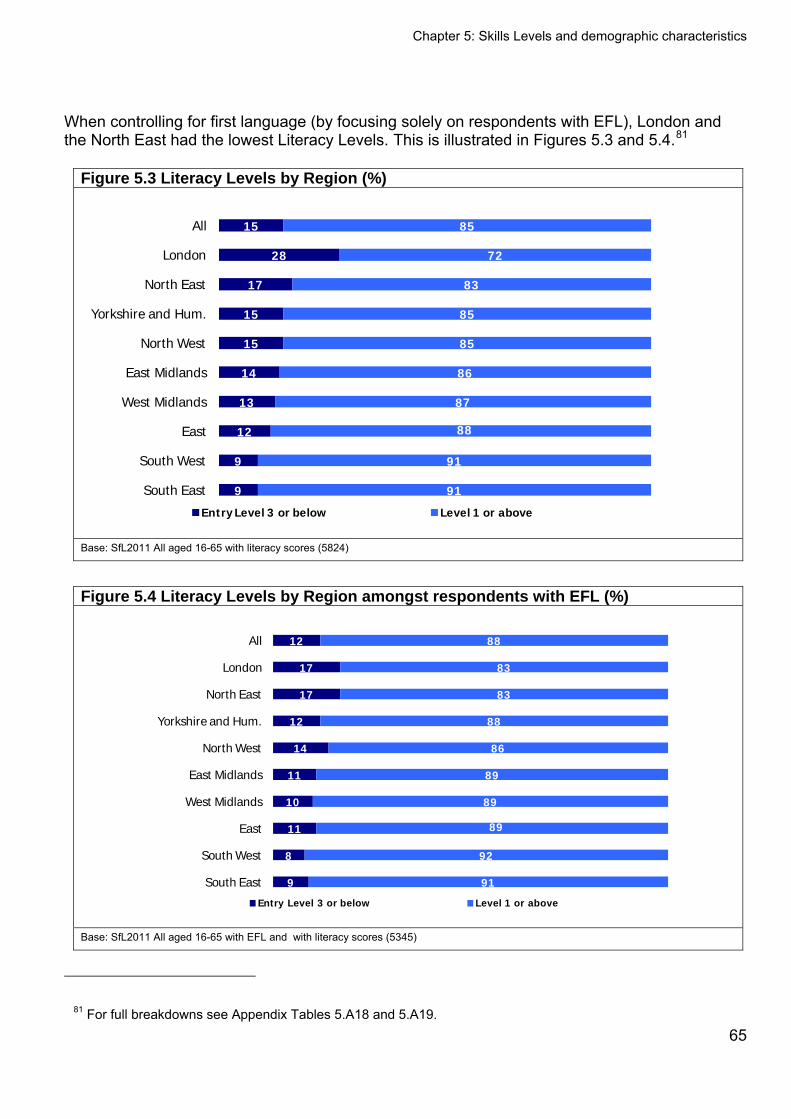
Chapter 5: Skills Levels and demographic characteristics
When controlling for first language (by focusing solely on respondents with EFL), London and the North East had the lowest Literacy Levels. This is illustrated in Figures 5.3 and 5.4.81
Figure 5.3 Literacy Levels by Region (%)
9
9
12
13
14
15
15
17
28
15
91
91
88
87
86
85
85
83
72
85
South East
South West
East
West Midlands
East Midlands
North West
Yorkshire and Hum.
North East
London
All
Entry Level 3 or below Level 1 or above
Base: SfL2011 All aged 16-65 with literacy scores (5824)
Figure 5.4 Literacy Levels by Region amongst respondents with EFL (%)
9
8
11
10
11
14
12
17
17
12
91
92
89
89
89
86
88
83
83
88
South East
South West
East
West Midlands
East Midlands
North West
Yorkshire and Hum.
North East
London
All
Entry Level 3 or below Level 1 or above
Base: SfL2011 All aged 16-65 with EFL and with literacy scores (5345)
81 For full breakdowns see Appendix Tables 5.A18 and 5.A19. 65
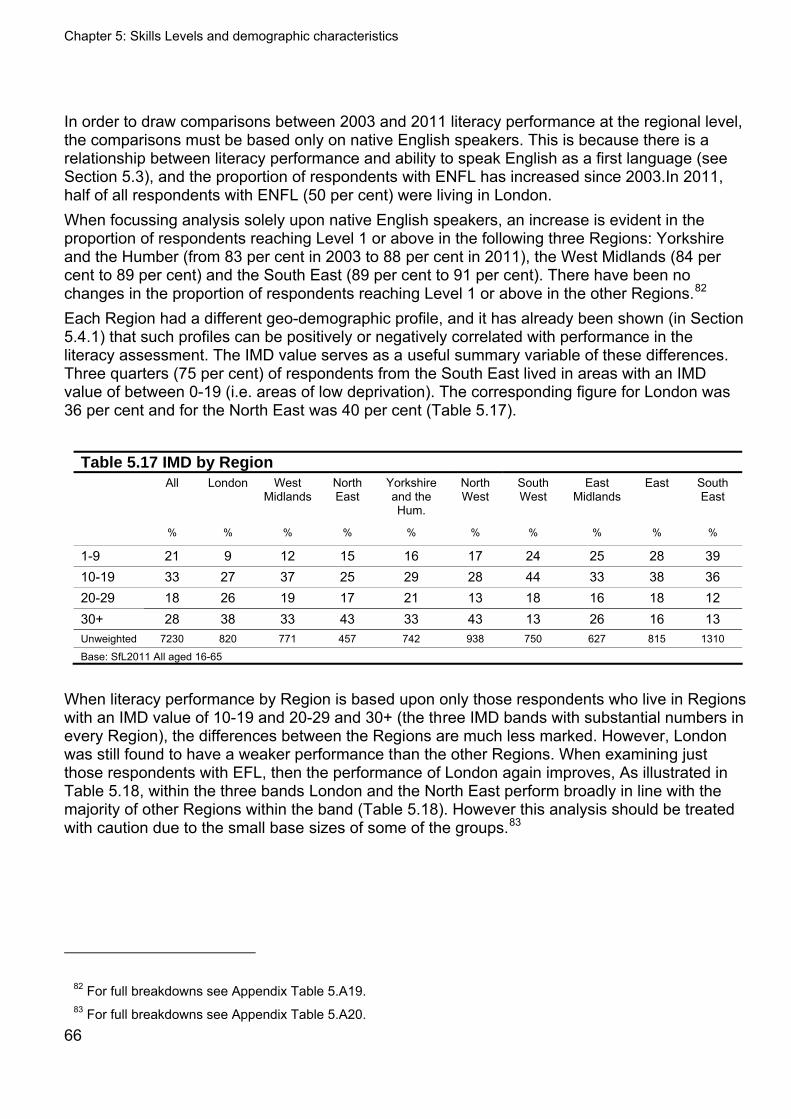
Chapter 5: Skills Levels and demographic characteristics
66
In order to draw comparisons between 2003 and 2011 literacy performance at the regional level, the comparisons must be based only on native English speakers. This is because there is a relationship between literacy performance and ability to speak English as a first language (see Section 5.3), and the proportion of respondents with ENFL has increased since 2003.In 2011, half of all respondents with ENFL (50 per cent) were living in London. When focussing analysis solely upon native English speakers, an increase is evident in the proportion of respondents reaching Level 1 or above in the following three Regions: Yorkshire and the Humber (from 83 per cent in 2003 to 88 per cent in 2011), the West Midlands (84 per cent to 89 per cent) and the South East (89 per cent to 91 per cent). There have been no changes in the proportion of respondents reaching Level 1 or above in the other Regions.82 Each Region had a different geo-demographic profile, and it has already been shown (in Section 5.4.1) that such profiles can be positively or negatively correlated with performance in the literacy assessment. The IMD value serves as a useful summary variable of these differences. Three quarters (75 per cent) of respondents from the South East lived in areas with an IMD value of between 0-19 (i.e. areas of low deprivation). The corresponding figure for London was 36 per cent and for the North East was 40 per cent (Table 5.17).
Table 5.17 IMD by Region All London West
Midlands North East
Yorkshire and the Hum.
North West
South West
East Midlands
East South East
% % % % % % % % % %
1-9 21 9 12 15 16 17 24 25 28 39 10-19 33 27 37 25 29 28 44 33 38 36 20-29 18 26 19 17 21 13 18 16 18 12 30+ 28 38 33 43 33 43 13 26 16 13 Unweighted 7230 820 771 457 742 938 750 627 815 1310
Base: SfL2011 All aged 16-65
When literacy performance by Region is based upon only those respondents who live in Regions with an IMD value of 10-19 and 20-29 and 30+ (the three IMD bands with substantial numbers in every Region), the differences between the Regions are much less marked. However, London was still found to have a weaker performance than the other Regions. When examining just those respondents with EFL, then the performance of London again improves, As illustrated in Table 5.18, within the three bands London and the North East perform broadly in line with the majority of other Regions within the band (Table 5.18). However this analysis should be treated with caution due to the small base sizes of some of the groups.83
82 For full breakdowns see Appendix Table 5.A19. 83 For full breakdowns see Appendix Table 5.A20.
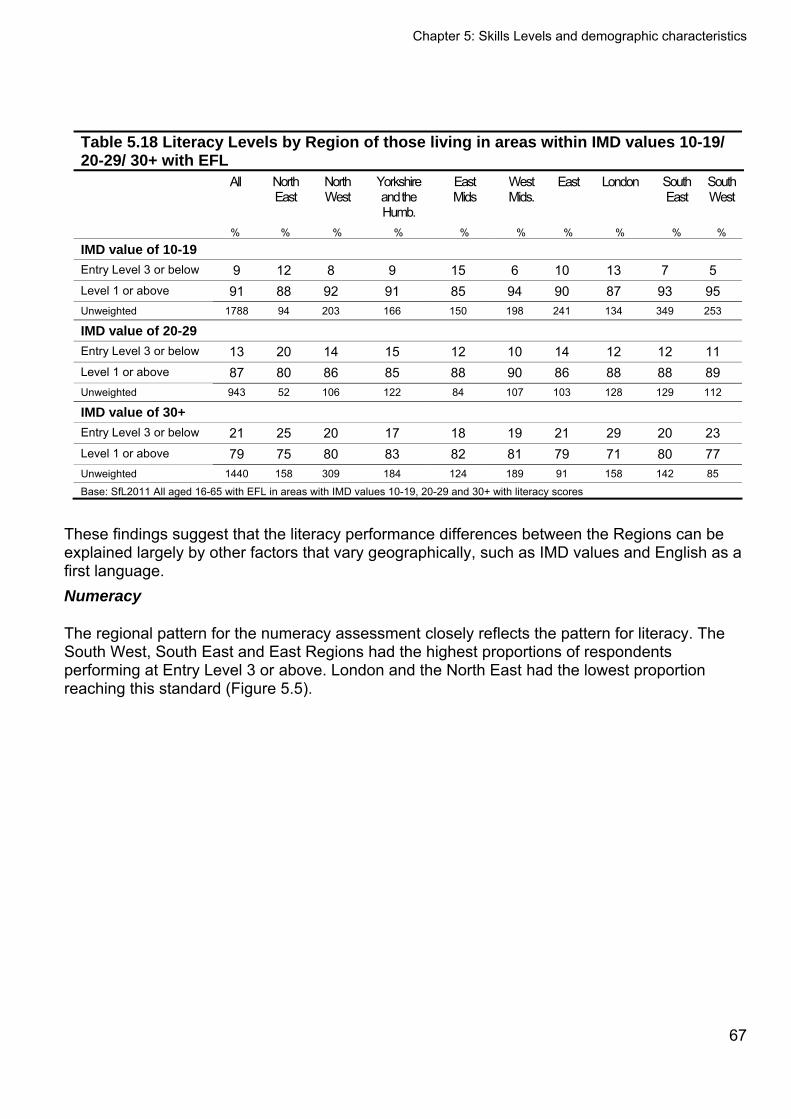
Chapter 5: Skills Levels and demographic characteristics
67
Table 5.18 Literacy Levels by Region of those living in areas within IMD values 10-19/ 20-29/ 30+ with EFL All North
East North West
Yorkshire and the Humb.
East Mids
West Mids.
East London South East
South West
% % % % % % % % % %
IMD value of 10-19 Entry Level 3 or below 9 12 8 9 15 6 10 13 7 5 Level 1 or above 91 88 92 91 85 94 90 87 93 95 Unweighted 1788 94 203 166 150 198 241 134 349 253
IMD value of 20-29 Entry Level 3 or below 13 20 14 15 12 10 14 12 12 11 Level 1 or above 87 80 86 85 88 90 86 88 88 89 Unweighted 943 52 106 122 84 107 103 128 129 112
IMD value of 30+ Entry Level 3 or below 21 25 20 17 18 19 21 29 20 23 Level 1 or above 79 75 80 83 82 81 79 71 80 77 Unweighted 1440 158 309 184 124 189 91 158 142 85
Base: SfL2011 All aged 16-65 with EFL in areas with IMD values 10-19, 20-29 and 30+ with literacy scores
These findings suggest that the literacy performance differences between the Regions can be explained largely by other factors that vary geographically, such as IMD values and English as a first language. Numeracy
The regional pattern for the numeracy assessment closely reflects the pattern for literacy. The South West, South East and East Regions had the highest proportions of respondents performing at Entry Level 3 or above. London and the North East had the lowest proportion reaching this standard (Figure 5.5).
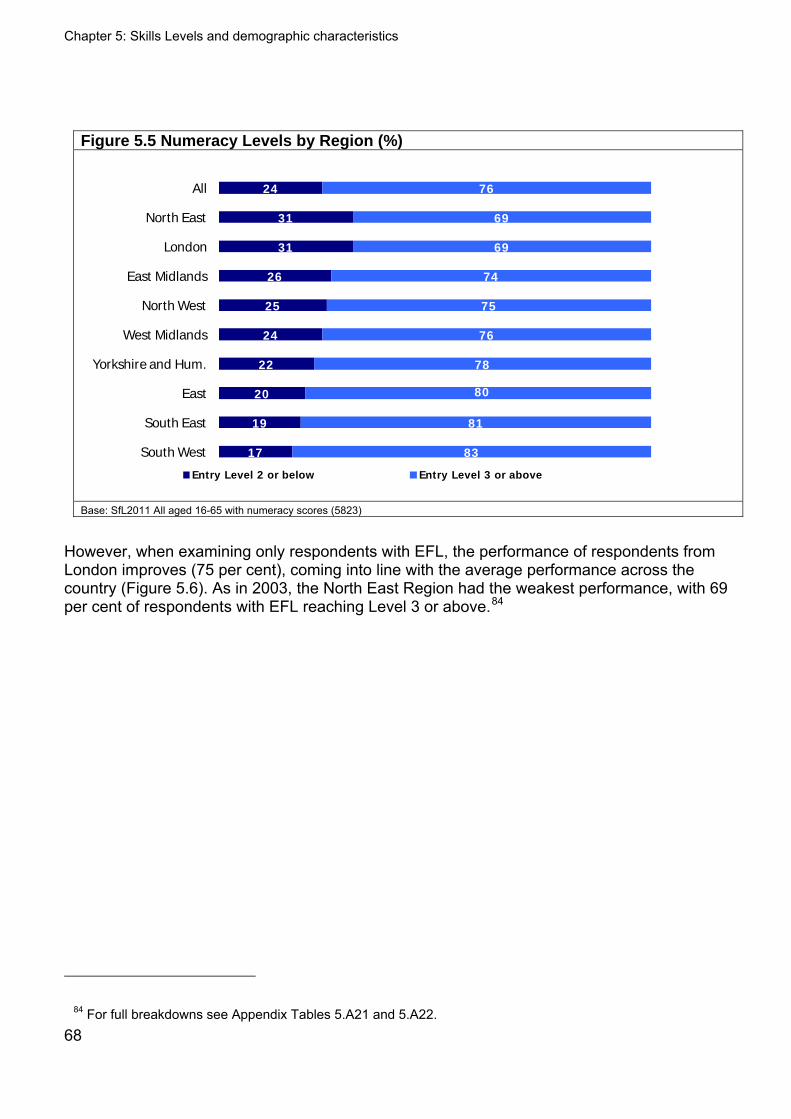
Chapter 5: Skills Levels and demographic characteristics
Figure 5.5 Numeracy Levels by Region (%)
17
19
20
22
24
25
26
31
31
24
83
81
80
78
76
75
74
69
69
76
South West
South East
East
Yorkshire and Hum.
West Midlands
North West
East Midlands
London
North East
All
Entry Level 2 or below Entry Level 3 or above
Base: SfL2011 All aged 16-65 with numeracy scores (5823)
However, when examining only respondents with EFL, the performance of respondents from London improves (75 per cent), coming into line with the average performance across the country (Figure 5.6). As in 2003, the North East Region had the weakest performance, with 69 per cent of respondents with EFL reaching Level 3 or above.84
84 For full breakdowns see Appendix Tables 5.A21 and 5.A22. 68
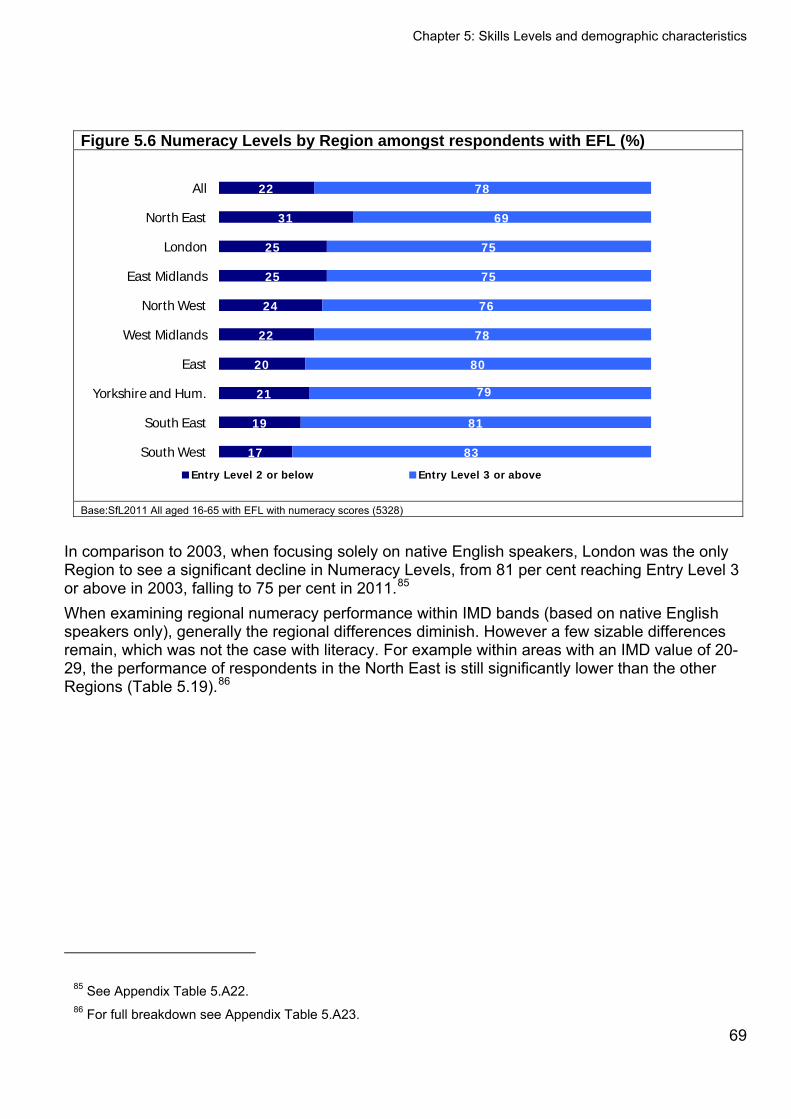
Chapter 5: Skills Levels and demographic characteristics
Figure 5.6 Numeracy Levels by Region amongst respondents with EFL (%)
17
19
21
20
22
24
25
25
31
22
83
81
79
80
78
76
75
75
69
78
South West
South East
Yorkshire and Hum.
East
West Midlands
North West
East Midlands
London
North East
All
Entry Level 2 or below Entry Level 3 or above
Base:SfL2011 All aged 16-65 with EFL with numeracy scores (5328)
In comparison to 2003, when focusing solely on native English speakers, London was the only Region to see a significant decline in Numeracy Levels, from 81 per cent reaching Entry Level 3 or above in 2003, falling to 75 per cent in 2011.85 When examining regional numeracy performance within IMD bands (based on native English speakers only), generally the regional differences diminish. However a few sizable differences remain, which was not the case with literacy. For example within areas with an IMD value of 20-29, the performance of respondents in the North East is still significantly lower than the other Regions (Table 5.19).86
85 See Appendix Table 5.A22. 86 For full breakdown see Appendix Table 5.A23.
69
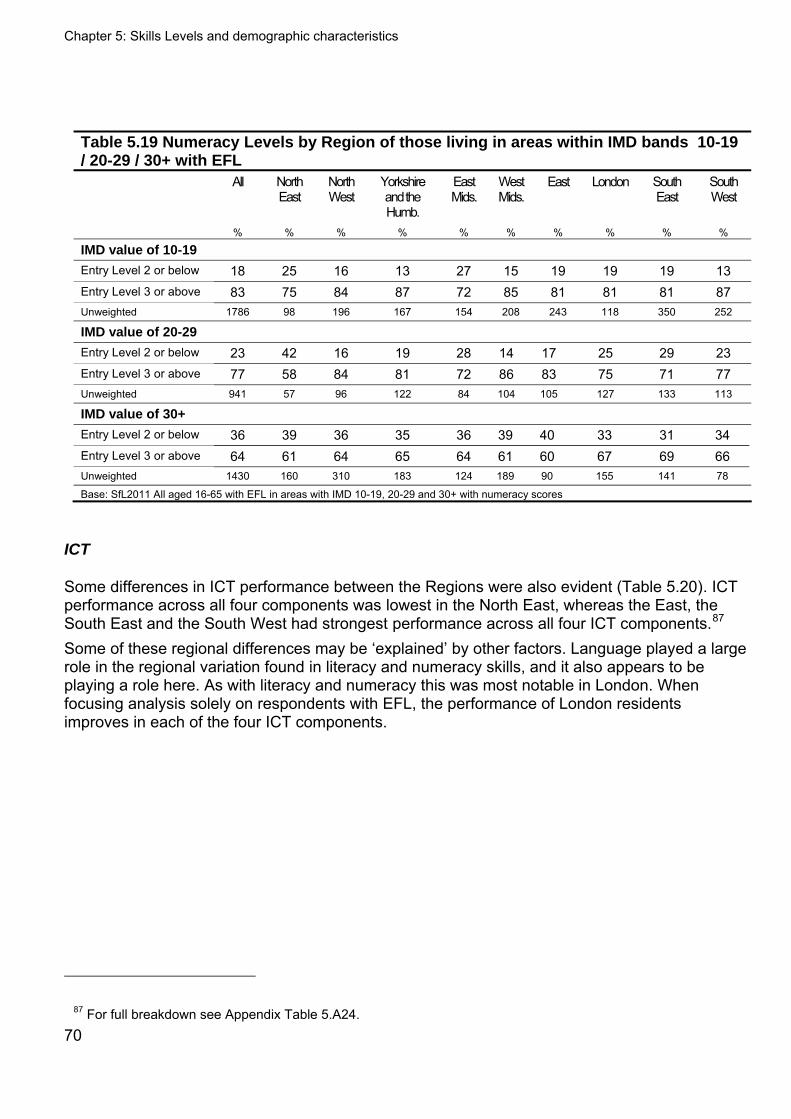
Chapter 5: Skills Levels and demographic characteristics
70
Table 5.19 Numeracy Levels by Region of those living in areas within IMD bands 10-19 / 20-29 / 30+ with EFL All North
East North West
Yorkshire and the Humb.
East Mids.
West Mids.
East London South East
South West
% % % % % % % % % %
IMD value of 10-19
Entry Level 2 or below 18 25 16 13 27 15 19 19 19 13 Entry Level 3 or above 83 75 84 87 72 85 81 81 81 87 Unweighted 1786 98 196 167 154 208 243 118 350 252
IMD value of 20-29
Entry Level 2 or below 23 42 16 19 28 14 17 25 29 23 Entry Level 3 or above 77 58 84 81 72 86 83 75 71 77 Unweighted 941 57 96 122 84 104 105 127 133 113
IMD value of 30+
Entry Level 2 or below 36 39 36 35 36 39 40 33 31 34 Entry Level 3 or above 64 61 64 65 64 61 60 67 69 66 Unweighted 1430 160 310 183 124 189 90 155 141 78
Base: SfL2011 All aged 16-65 with EFL in areas with IMD 10-19, 20-29 and 30+ with numeracy scores
ICT
Some differences in ICT performance between the Regions were also evident (Table 5.20). ICT performance across all four components was lowest in the North East, whereas the East, the South East and the South West had strongest performance across all four ICT components.87 Some of these regional differences may be ‘explained’ by other factors. Language played a large role in the regional variation found in literacy and numeracy skills, and it also appears to be playing a role here. As with literacy and numeracy this was most notable in London. When focusing analysis solely on respondents with EFL, the performance of London residents improves in each of the four ICT components.
87 For full breakdown see Appendix Table 5.A24.
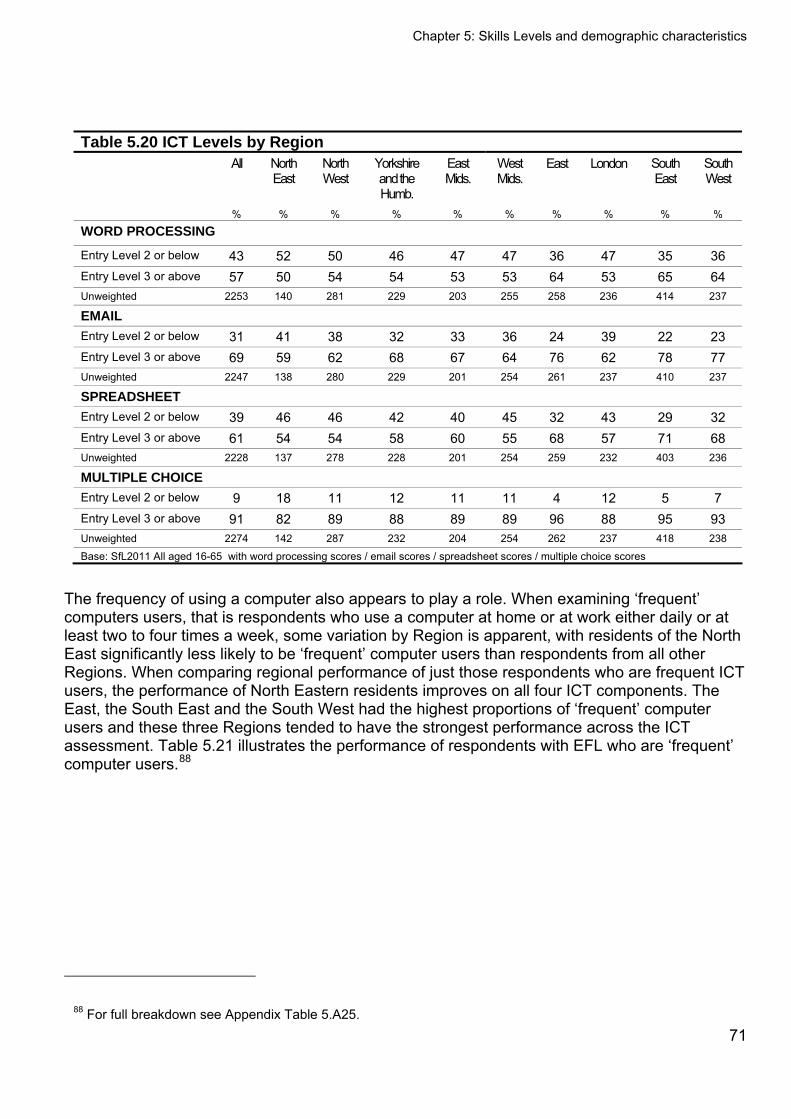
Chapter 5: Skills Levels and demographic characteristics
71
Table 5.20 ICT Levels by Region All North
East North West
Yorkshire and the Humb.
East Mids.
West Mids.
East London South East
South West
% % % % % % % % % %
WORD PROCESSING
Entry Level 2 or below 43 52 50 46 47 47 36 47 35 36 Entry Level 3 or above 57 50 54 54 53 53 64 53 65 64 Unweighted 2253 140 281 229 203 255 258 236 414 237
EMAIL Entry Level 2 or below 31 41 38 32 33 36 24 39 22 23 Entry Level 3 or above 69 59 62 68 67 64 76 62 78 77 Unweighted 2247 138 280 229 201 254 261 237 410 237
SPREADSHEET
Entry Level 2 or below 39 46 46 42 40 45 32 43 29 32 Entry Level 3 or above 61 54 54 58 60 55 68 57 71 68 Unweighted 2228 137 278 228 201 254 259 232 403 236
MULTIPLE CHOICE
Entry Level 2 or below 9 18 11 12 11 11 4 12 5 7 Entry Level 3 or above 91 82 89 88 89 89 96 88 95 93 Unweighted 2274 142 287 232 204 254 262 237 418 238
Base: SfL2011 All aged 16-65 with word processing scores / email scores / spreadsheet scores / multiple choice scores
The frequency of using a computer also appears to play a role. When examining ‘frequent’ computers users, that is respondents who use a computer at home or at work either daily or at least two to four times a week, some variation by Region is apparent, with residents of the North East significantly less likely to be ‘frequent’ computer users than respondents from all other Regions. When comparing regional performance of just those respondents who are frequent ICT users, the performance of North Eastern residents improves on all four ICT components. The East, the South East and the South West had the highest proportions of ‘frequent’ computer users and these three Regions tended to have the strongest performance across the ICT assessment. Table 5.21 illustrates the performance of respondents with EFL who are ‘frequent’ computer users.88
88 For full breakdown see Appendix Table 5.A25.
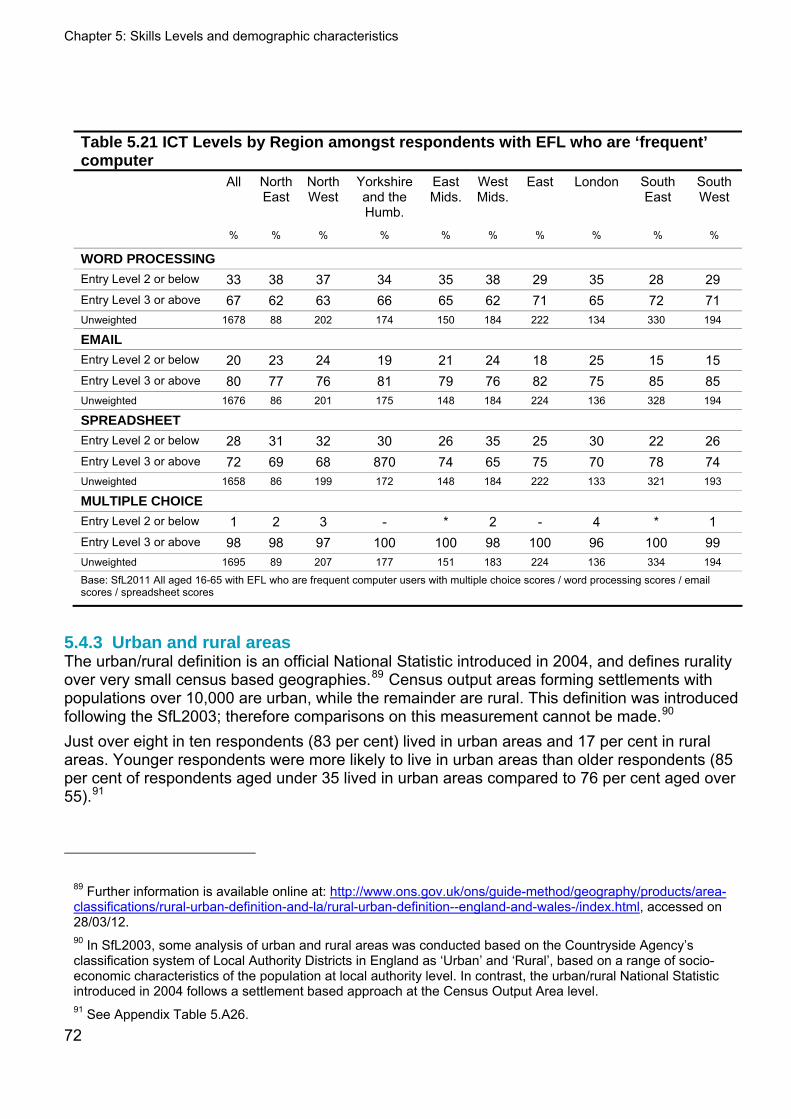
Chapter 5: Skills Levels and demographic characteristics
72
Table 5.21 ICT Levels by Region amongst respondents with EFL who are ‘frequent’ computer All North
East North West
Yorkshire and the Humb.
East Mids.
West Mids.
East London South East
South West
% % % % % % % % % %
WORD PROCESSING
Entry Level 2 or below 33 38 37 34 35 38 29 35 28 29 Entry Level 3 or above 67 62 63 66 65 62 71 65 72 71 Unweighted 1678 88 202 174 150 184 222 134 330 194
EMAIL Entry Level 2 or below 20 23 24 19 21 24 18 25 15 15 Entry Level 3 or above 80 77 76 81 79 76 82 75 85 85 Unweighted 1676 86 201 175 148 184 224 136 328 194
SPREADSHEET
Entry Level 2 or below 28 31 32 30 26 35 25 30 22 26 Entry Level 3 or above 72 69 68 870 74 65 75 70 78 74 Unweighted 1658 86 199 172 148 184 222 133 321 193
MULTIPLE CHOICE
Entry Level 2 or below 1 2 3 - * 2 - 4 * 1 Entry Level 3 or above 98 98 97 100 100 98 100 96 100 99 Unweighted 1695 89 207 177 151 183 224 136 334 194
Base: SfL2011 All aged 16-65 with EFL who are frequent computer users with multiple choice scores / word processing scores / email scores / spreadsheet scores
5.4.3 Urban and rural areas The urban/rural definition is an official National Statistic introduced in 2004, and defines rurality over very small census based geographies.89 Census output areas forming settlements with populations over 10,000 are urban, while the remainder are rural. This definition was introduced following the SfL2003; therefore comparisons on this measurement cannot be made.90 Just over eight in ten respondents (83 per cent) lived in urban areas and 17 per cent in rural areas. Younger respondents were more likely to live in urban areas than older respondents (85 per cent of respondents aged under 35 lived in urban areas compared to 76 per cent aged over 55).91
89 Further information is available online at: http://www.ons.gov.uk/ons/guide-method/geography/products/area-classifications/rural-urban-definition-and-la/rural-urban-definition--england-and-wales-/index.html, accessed on 28/03/12. 90 In SfL2003, some analysis of urban and rural areas was conducted based on the Countryside Agency’s classification system of Local Authority Districts in England as ‘Urban’ and ‘Rural’, based on a range of socio-economic characteristics of the population at local authority level. In contrast, the urban/rural National Statistic introduced in 2004 follows a settlement based approach at the Census Output Area level. 91 See Appendix Table 5.A26.
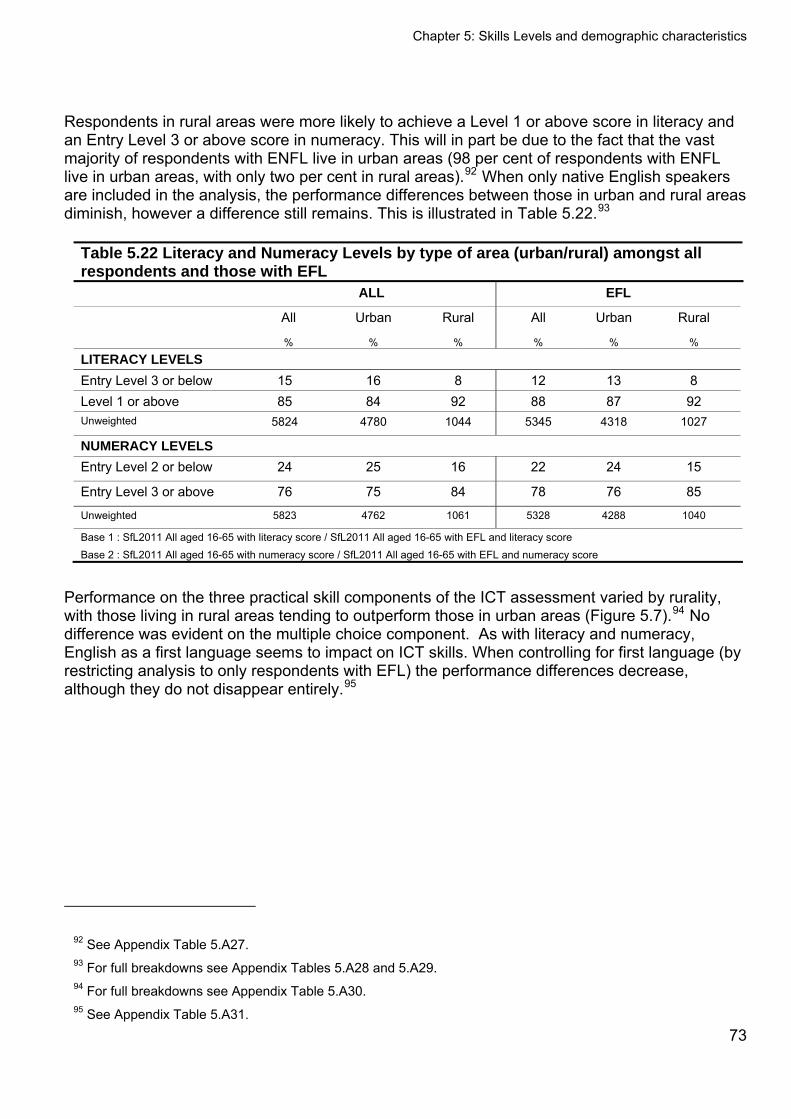
Chapter 5: Skills Levels and demographic characteristics
73
Respondents in rural areas were more likely to achieve a Level 1 or above score in literacy and an Entry Level 3 or above score in numeracy. This will in part be due to the fact that the vast majority of respondents with ENFL live in urban areas (98 per cent of respondents with ENFL live in urban areas, with only two per cent in rural areas).92 When only native English speakers are included in the analysis, the performance differences between those in urban and rural areas diminish, however a difference still remains. This is illustrated in Table 5.22.93
Table 5.22 Literacy and Numeracy Levels by type of area (urban/rural) amongst all respondents and those with EFL ALL EFL
All Urban Rural All Urban Rural
% % % % % %
LITERACY LEVELS Entry Level 3 or below 15 16 8 12 13 8 Level 1 or above 85 84 92 88 87 92 Unweighted 5824 4780 1044 5345 4318 1027
NUMERACY LEVELS Entry Level 2 or below 24 25 16 22 24 15
Entry Level 3 or above 76 75 84 78 76 85
Unweighted 5823 4762 1061 5328 4288 1040
Base 1 : SfL2011 All aged 16-65 with literacy score / SfL2011 All aged 16-65 with EFL and literacy score Base 2 : SfL2011 All aged 16-65 with numeracy score / SfL2011 All aged 16-65 with EFL and numeracy score
Performance on the three practical skill components of the ICT assessment varied by rurality, with those living in rural areas tending to outperform those in urban areas (Figure 5.7).94 No difference was evident on the multiple choice component. As with literacy and numeracy, English as a first language seems to impact on ICT skills. When controlling for first language (by restricting analysis to only respondents with EFL) the performance differences decrease, although they do not disappear entirely.95
92 See Appendix Table 5.A27. 93 For full breakdowns see Appendix Tables 5.A28 and 5.A29. 94 For full breakdowns see Appendix Table 5.A30. 95 See Appendix Table 5.A31.
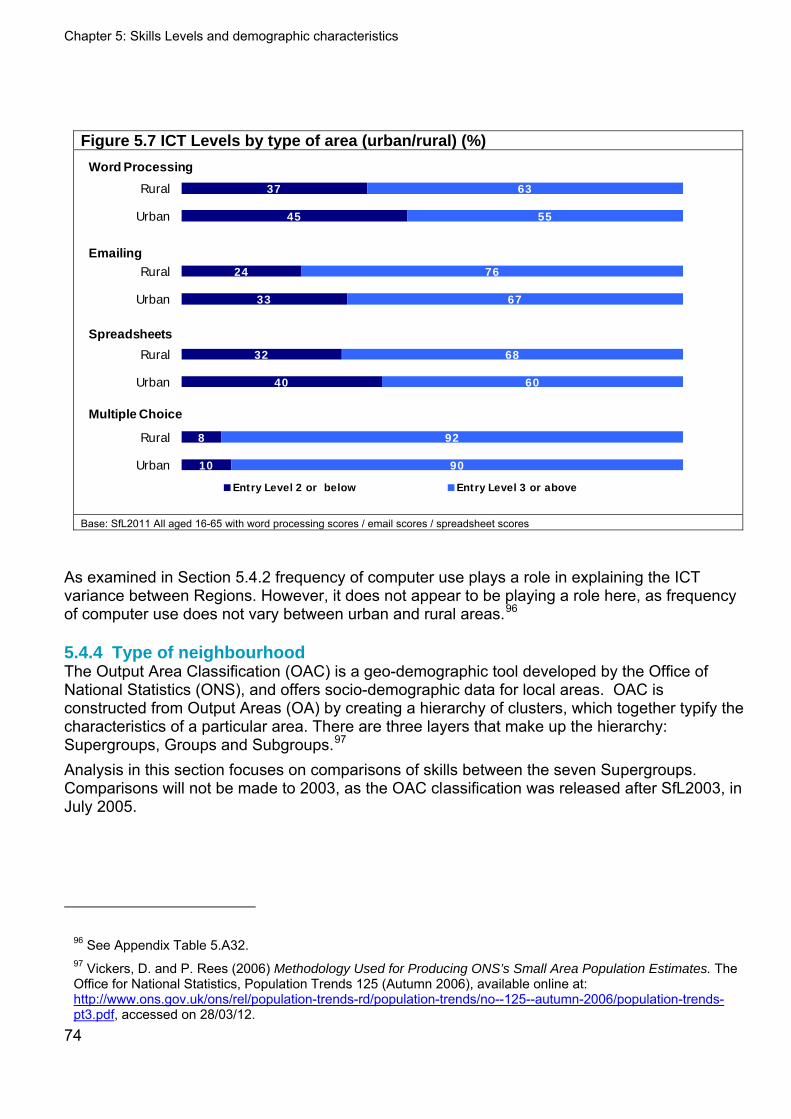
Chapter 5: Skills Levels and demographic characteristics
Figure 5.7 ICT Levels by type of area (urban/rural) (%)
10
8
40
32
33
24
45
37
90
92
60
68
67
76
55
63
Urban
Rural
Urban
Rural
Urban
Rural
Urban
Rural
Entry Level 2 or below Entry Level 3 or above
Word Processing
Emailing
Spreadsheets
Multiple Choice
Base: SfL2011 All aged 16-65 with word processing scores / email scores / spreadsheet scores
As examined in Section 5.4.2 frequency of computer use plays a role in explaining the ICT variance between Regions. However, it does not appear to be playing a role here, as frequency of computer use does not vary between urban and rural areas.96
5.4.4 Type of neighbourhood The Output Area Classification (OAC) is a geo-demographic tool developed by the Office of National Statistics (ONS), and offers socio-demographic data for local areas. OAC is constructed from Output Areas (OA) by creating a hierarchy of clusters, which together typify the characteristics of a particular area. There are three layers that make up the hierarchy: Supergroups, Groups and Subgroups.97 Analysis in this section focuses on comparisons of skills between the seven Supergroups. Comparisons will not be made to 2003, as the OAC classification was released after SfL2003, in July 2005.
96 See Appendix Table 5.A32. 97 Vickers, D. and P. Rees (2006) Methodology Used for Producing ONS’s Small Area Population Estimates. The Office for National Statistics, Population Trends 125 (Autumn 2006), available online at: http://www.ons.gov.uk/ons/rel/population-trends-rd/population-trends/no--125--autumn-2006/population-trends-pt3.pdf, accessed on 28/03/12.
74
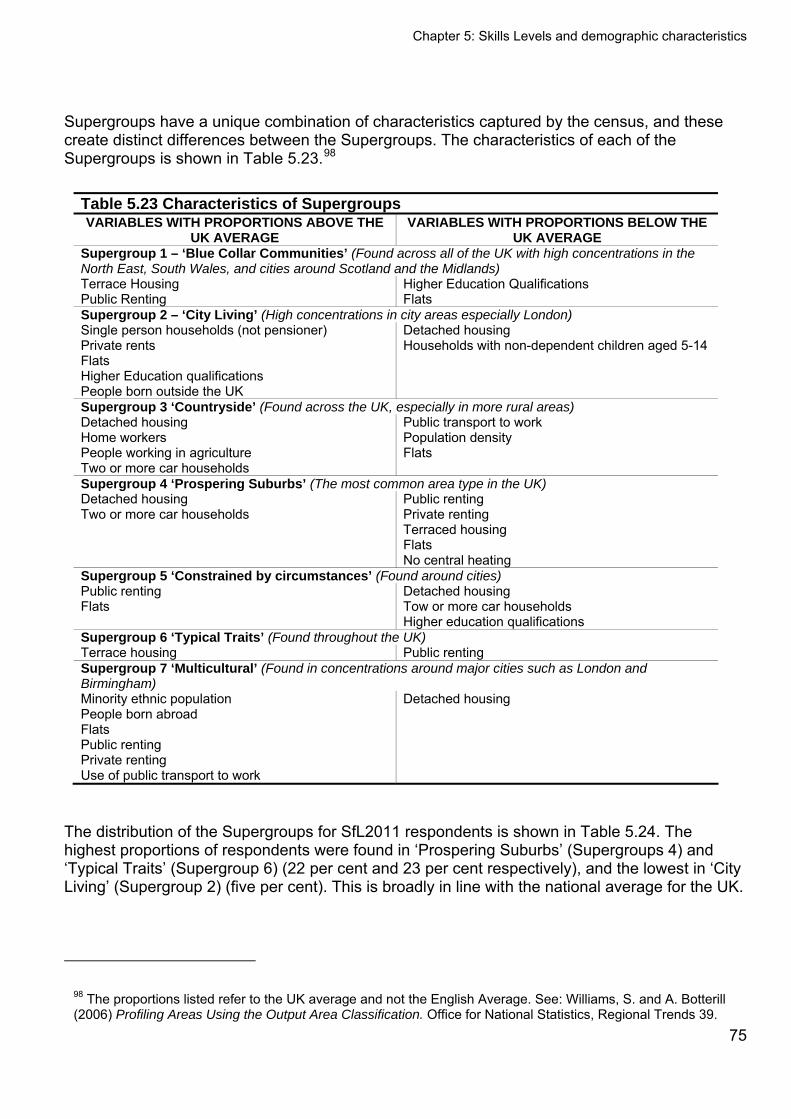
Chapter 5: Skills Levels and demographic characteristics
75
Supergroups have a unique combination of characteristics captured by the census, and these create distinct differences between the Supergroups. The characteristics of each of the Supergroups is shown in Table 5.23.98
Table 5.23 Characteristics of Supergroups VARIABLES WITH PROPORTIONS ABOVE THE
UK AVERAGE VARIABLES WITH PROPORTIONS BELOW THE
UK AVERAGE Supergroup 1 – ‘Blue Collar Communities’ (Found across all of the UK with high concentrations in the North East, South Wales, and cities around Scotland and the Midlands) Terrace Housing Public Renting
Higher Education Qualifications Flats
Supergroup 2 – ‘City Living’ (High concentrations in city areas especially London) Single person households (not pensioner) Private rents Flats Higher Education qualifications People born outside the UK
Detached housing Households with non-dependent children aged 5-14
Supergroup 3 ‘Countryside’ (Found across the UK, especially in more rural areas) Detached housing Home workers People working in agriculture Two or more car households
Public transport to work Population density Flats
Supergroup 4 ‘Prospering Suburbs’ (The most common area type in the UK) Detached housing Two or more car households
Public renting Private renting Terraced housing Flats No central heating
Supergroup 5 ‘Constrained by circumstances’ (Found around cities) Public renting Flats
Detached housing Tow or more car households Higher education qualifications
Supergroup 6 ‘Typical Traits’ (Found throughout the UK) Terrace housing Public renting Supergroup 7 ‘Multicultural’ (Found in concentrations around major cities such as London and Birmingham) Minority ethnic population People born abroad Flats Public renting Private renting Use of public transport to work
Detached housing
The distribution of the Supergroups for SfL2011 respondents is shown in Table 5.24. The highest proportions of respondents were found in ‘Prospering Suburbs’ (Supergroups 4) and ‘Typical Traits’ (Supergroup 6) (22 per cent and 23 per cent respectively), and the lowest in ‘City Living’ (Supergroup 2) (five per cent). This is broadly in line with the national average for the UK.
98 The proportions listed refer to the UK average and not the English Average. See: Williams, S. and A. Botterill (2006) Profiling Areas Using the Output Area Classification. Office for National Statistics, Regional Trends 39.
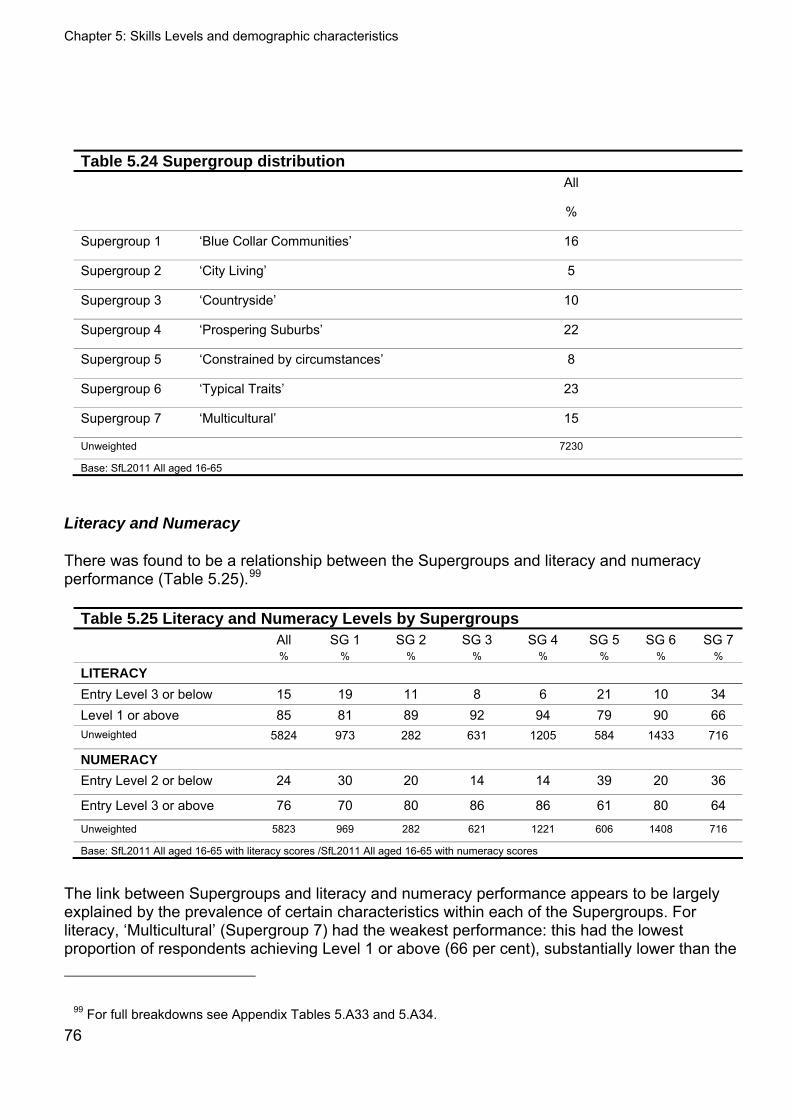
Chapter 5: Skills Levels and demographic characteristics
76
Table 5.24 Supergroup distribution All
%
Supergroup 1 ‘Blue Collar Communities’ 16
Supergroup 2 ‘City Living’ 5
Supergroup 3 ‘Countryside’ 10
Supergroup 4 ‘Prospering Suburbs’ 22
Supergroup 5 ‘Constrained by circumstances’ 8
Supergroup 6 ‘Typical Traits’ 23
Supergroup 7 ‘Multicultural’ 15
Unweighted 7230
Base: SfL2011 All aged 16-65
Literacy and Numeracy
There was found to be a relationship between the Supergroups and literacy and numeracy performance (Table 5.25).99
Table 5.25 Literacy and Numeracy Levels by Supergroups All SG 1 SG 2 SG 3 SG 4 SG 5 SG 6 SG 7 % % % % % % % %
LITERACY Entry Level 3 or below 15 19 11 8 6 21 10 34 Level 1 or above 85 81 89 92 94 79 90 66 Unweighted 5824 973 282 631 1205 584 1433 716
NUMERACY Entry Level 2 or below 24 30 20 14 14 39 20 36
Entry Level 3 or above 76 70 80 86 86 61 80 64
Unweighted 5823 969 282 621 1221 606 1408 716
Base: SfL2011 All aged 16-65 with literacy scores /SfL2011 All aged 16-65 with numeracy scores
The link between Supergroups and literacy and numeracy performance appears to be largely explained by the prevalence of certain characteristics within each of the Supergroups. For literacy, ‘Multicultural’ (Supergroup 7) had the weakest performance: this had the lowest proportion of respondents achieving Level 1 or above (66 per cent), substantially lower than the
99 For full breakdowns see Appendix Tables 5.A33 and 5.A34.
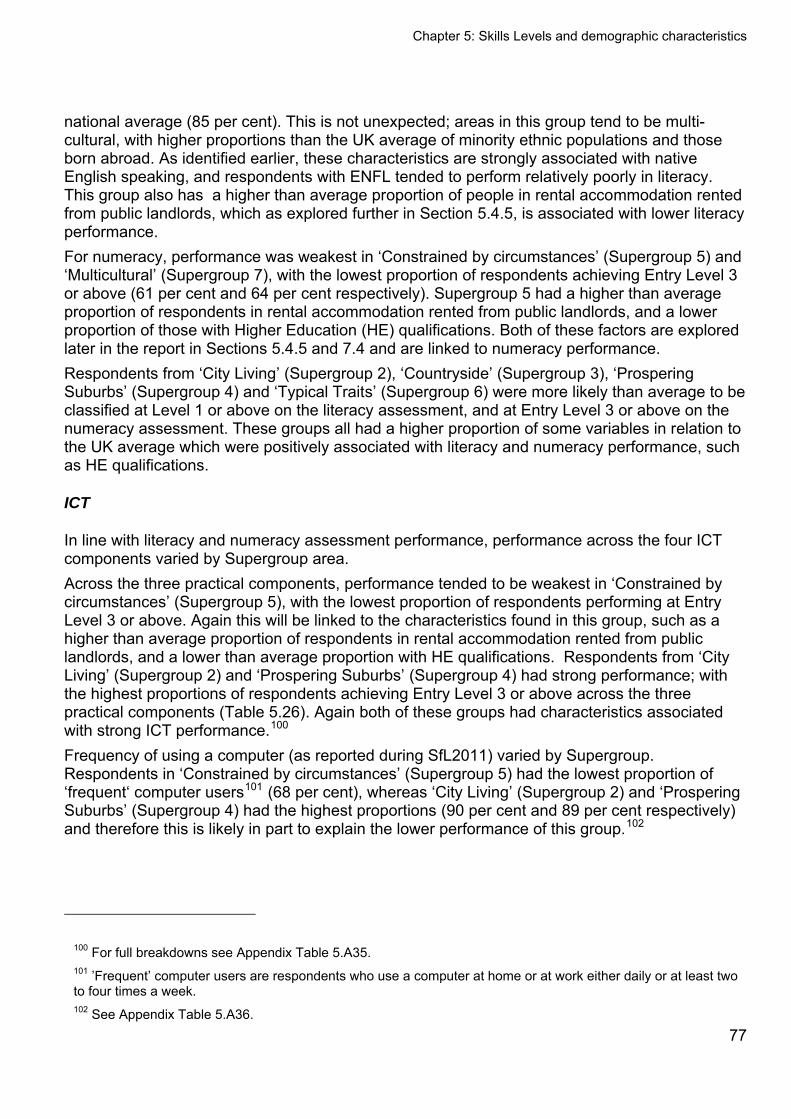
Chapter 5: Skills Levels and demographic characteristics
77
national average (85 per cent). This is not unexpected; areas in this group tend to be multi-cultural, with higher proportions than the UK average of minority ethnic populations and those born abroad. As identified earlier, these characteristics are strongly associated with native English speaking, and respondents with ENFL tended to perform relatively poorly in literacy. This group also has a higher than average proportion of people in rental accommodation rented from public landlords, which as explored further in Section 5.4.5, is associated with lower literacy performance. For numeracy, performance was weakest in ‘Constrained by circumstances’ (Supergroup 5) and ‘Multicultural’ (Supergroup 7), with the lowest proportion of respondents achieving Entry Level 3 or above (61 per cent and 64 per cent respectively). Supergroup 5 had a higher than average proportion of respondents in rental accommodation rented from public landlords, and a lower proportion of those with Higher Education (HE) qualifications. Both of these factors are explored later in the report in Sections 5.4.5 and 7.4 and are linked to numeracy performance. Respondents from ‘City Living’ (Supergroup 2), ‘Countryside’ (Supergroup 3), ‘Prospering Suburbs’ (Supergroup 4) and ‘Typical Traits’ (Supergroup 6) were more likely than average to be classified at Level 1 or above on the literacy assessment, and at Entry Level 3 or above on the numeracy assessment. These groups all had a higher proportion of some variables in relation to the UK average which were positively associated with literacy and numeracy performance, such as HE qualifications.
ICT
In line with literacy and numeracy assessment performance, performance across the four ICT components varied by Supergroup area. Across the three practical components, performance tended to be weakest in ‘Constrained by circumstances’ (Supergroup 5), with the lowest proportion of respondents performing at Entry Level 3 or above. Again this will be linked to the characteristics found in this group, such as a higher than average proportion of respondents in rental accommodation rented from public landlords, and a lower than average proportion with HE qualifications. Respondents from ‘City Living’ (Supergroup 2) and ‘Prospering Suburbs’ (Supergroup 4) had strong performance; with the highest proportions of respondents achieving Entry Level 3 or above across the three practical components (Table 5.26). Again both of these groups had characteristics associated with strong ICT performance.100 Frequency of using a computer (as reported during SfL2011) varied by Supergroup. Respondents in ‘Constrained by circumstances’ (Supergroup 5) had the lowest proportion of ‘frequent‘ computer users101 (68 per cent), whereas ‘City Living’ (Supergroup 2) and ‘Prospering Suburbs’ (Supergroup 4) had the highest proportions (90 per cent and 89 per cent respectively) and therefore this is likely in part to explain the lower performance of this group.102
100 For full breakdowns see Appendix Table 5.A35. 101 ’Frequent’ computer users are respondents who use a computer at home or at work either daily or at least two to four times a week. 102 See Appendix Table 5.A36.
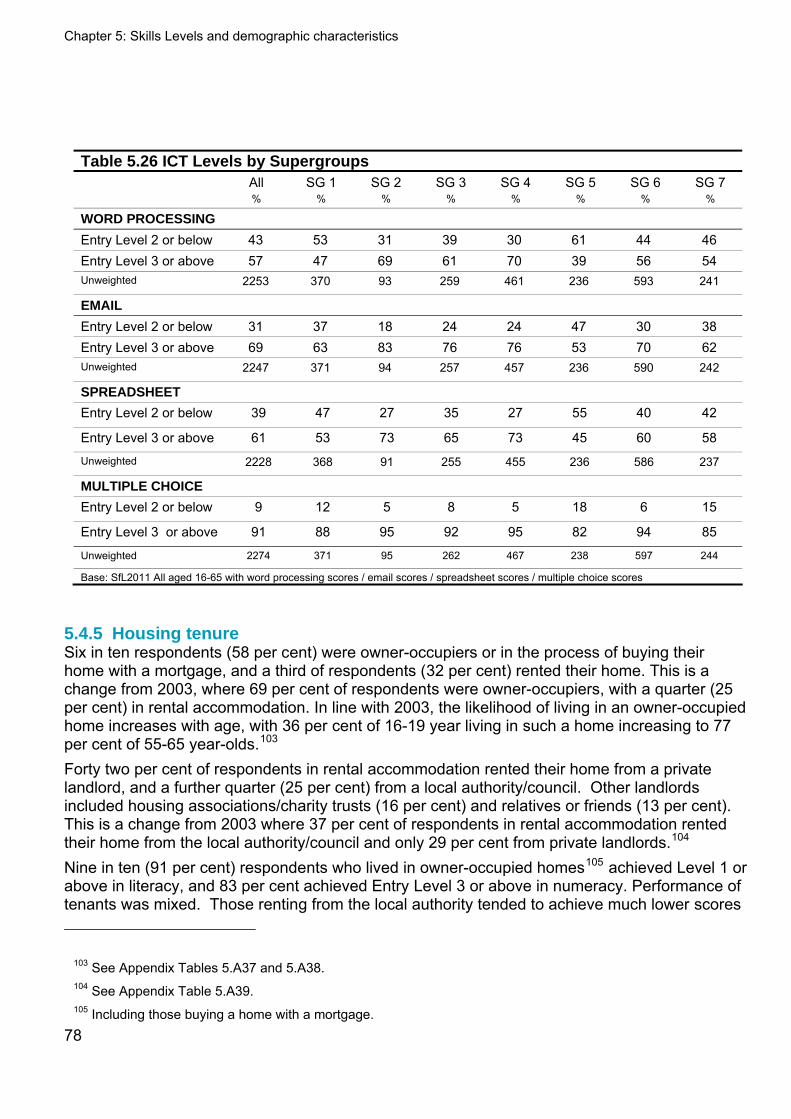
Chapter 5: Skills Levels and demographic characteristics
78
Table 5.26 ICT Levels by Supergroups All SG 1 SG 2 SG 3 SG 4 SG 5 SG 6 SG 7 % % % % % % % %
WORD PROCESSING
Entry Level 2 or below 43 53 31 39 30 61 44 46 Entry Level 3 or above 57 47 69 61 70 39 56 54 Unweighted 2253 370 93 259 461 236 593 241
Entry Level 2 or below 31 37 18 24 24 47 30 38 Entry Level 3 or above 69 63 83 76 76 53 70 62 Unweighted 2247 371 94 257 457 236 590 242
SPREADSHEET
Entry Level 2 or below 39 47 27 35 27 55 40 42
Entry Level 3 or above 61 53 73 65 73 45 60 58
Unweighted 2228 368 91 255 455 236 586 237
MULTIPLE CHOICE
Entry Level 2 or below 9 12 5 8 5 18 6 15
Entry Level 3 or above 91 88 95 92 95 82 94 85
Unweighted 2274 371 95 262 467 238 597 244
Base: SfL2011 All aged 16-65 with word processing scores / email scores / spreadsheet scores / multiple choice scores
5.4.5 Housing tenure Six in ten respondents (58 per cent) were owner-occupiers or in the process of buying their home with a mortgage, and a third of respondents (32 per cent) rented their home. This is a change from 2003, where 69 per cent of respondents were owner-occupiers, with a quarter (25 per cent) in rental accommodation. In line with 2003, the likelihood of living in an owner-occupied home increases with age, with 36 per cent of 16-19 year living in such a home increasing to 77 per cent of 55-65 year-olds.103 Forty two per cent of respondents in rental accommodation rented their home from a private landlord, and a further quarter (25 per cent) from a local authority/council. Other landlords included housing associations/charity trusts (16 per cent) and relatives or friends (13 per cent). This is a change from 2003 where 37 per cent of respondents in rental accommodation rented their home from the local authority/council and only 29 per cent from private landlords.104 Nine in ten (91 per cent) respondents who lived in owner-occupied homes105 achieved Level 1 or above in literacy, and 83 per cent achieved Entry Level 3 or above in numeracy. Performance of tenants was mixed. Those renting from the local authority tended to achieve much lower scores
103 See Appendix Tables 5.A37 and 5.A38. 104 See Appendix Table 5.A39. 105 Including those buying a home with a mortgage.
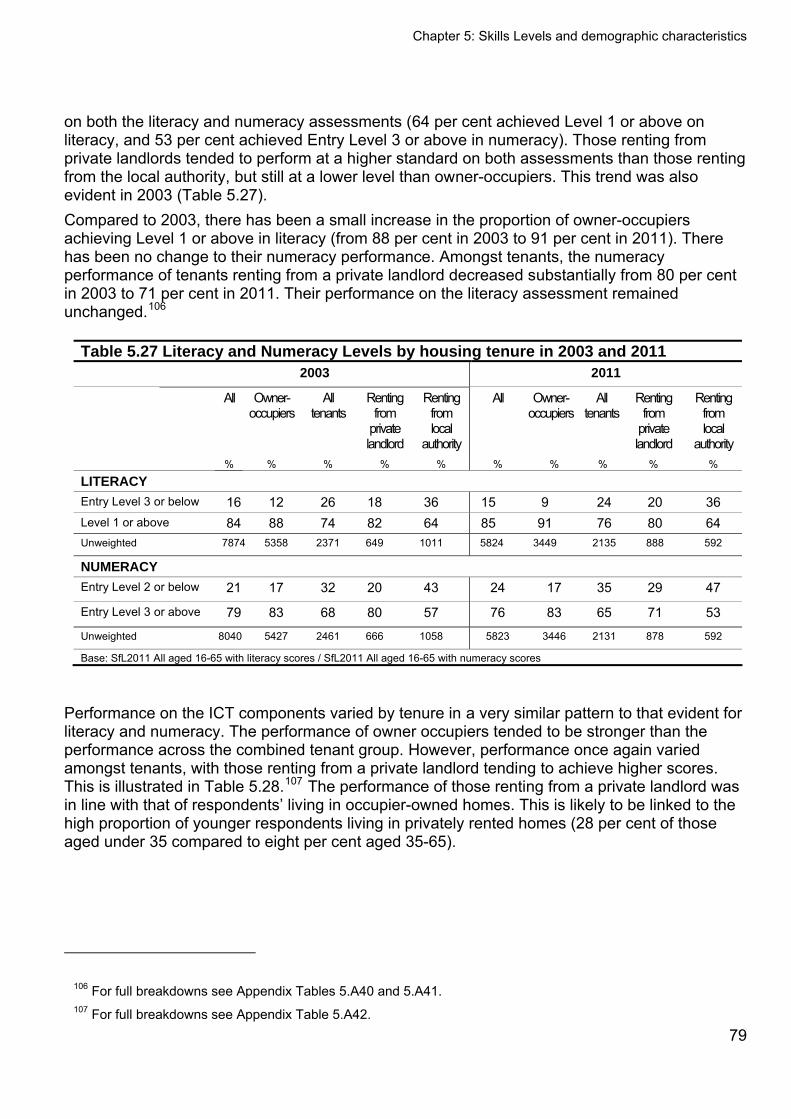
Chapter 5: Skills Levels and demographic characteristics
79
on both the literacy and numeracy assessments (64 per cent achieved Level 1 or above on literacy, and 53 per cent achieved Entry Level 3 or above in numeracy). Those renting from private landlords tended to perform at a higher standard on both assessments than those renting from the local authority, but still at a lower level than owner-occupiers. This trend was also evident in 2003 (Table 5.27). Compared to 2003, there has been a small increase in the proportion of owner-occupiers achieving Level 1 or above in literacy (from 88 per cent in 2003 to 91 per cent in 2011). There has been no change to their numeracy performance. Amongst tenants, the numeracy performance of tenants renting from a private landlord decreased substantially from 80 per cent in 2003 to 71 per cent in 2011. Their performance on the literacy assessment remained unchanged.106
Table 5.27 Literacy and Numeracy Levels by housing tenure in 2003 and 2011 2003 2011
All Owner-occupiers
All tenants
Renting from
private landlord
Renting from local
authority
All Owner-occupiers
All tenants
Renting from
private landlord
Renting from local
authority % % % % % % % % % %
LITERACY
Entry Level 3 or below 16 12 26 18 36 15 9 24 20 36 Level 1 or above 84 88 74 82 64 85 91 76 80 64 Unweighted 7874 5358 2371 649 1011 5824 3449 2135 888 592
NUMERACY
Entry Level 2 or below 21 17 32 20 43 24 17 35 29 47
Entry Level 3 or above 79 83 68 80 57 76 83 65 71 53
Unweighted 8040 5427 2461 666 1058 5823 3446 2131 878 592
Base: SfL2011 All aged 16-65 with literacy scores / SfL2011 All aged 16-65 with numeracy scores
Performance on the ICT components varied by tenure in a very similar pattern to that evident for literacy and numeracy. The performance of owner occupiers tended to be stronger than the performance across the combined tenant group. However, performance once again varied amongst tenants, with those renting from a private landlord tending to achieve higher scores. This is illustrated in Table 5.28.107 The performance of those renting from a private landlord was in line with that of respondents’ living in occupier-owned homes. This is likely to be linked to the high proportion of younger respondents living in privately rented homes (28 per cent of those aged under 35 compared to eight per cent aged 35-65).
106 For full breakdowns see Appendix Tables 5.A40 and 5.A41. 107 For full breakdowns see Appendix Table 5.A42.
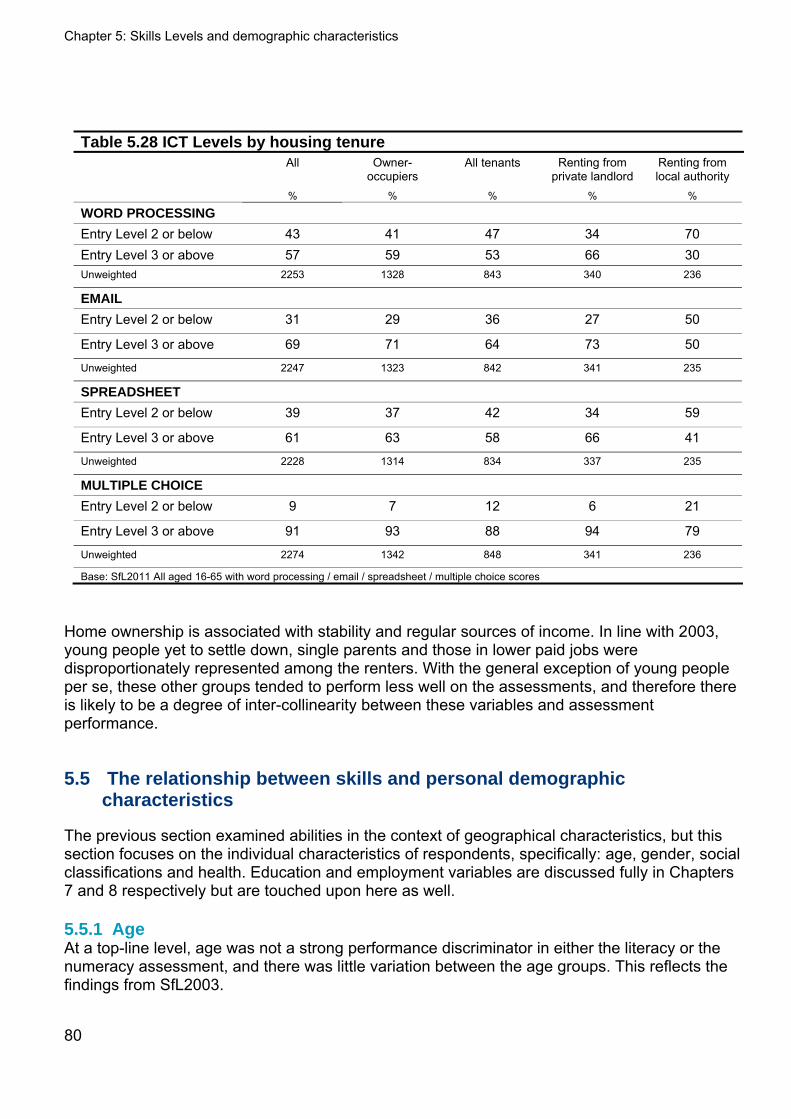
Chapter 5: Skills Levels and demographic characteristics
80
Table 5.28 ICT Levels by housing tenure All Owner-
occupiers All tenants Renting from
private landlord Renting from local authority
% % % % %
WORD PROCESSING
Entry Level 2 or below 43 41 47 34 70 Entry Level 3 or above 57 59 53 66 30 Unweighted 2253 1328 843 340 236
Entry Level 2 or below 31 29 36 27 50
Entry Level 3 or above 69 71 64 73 50
Unweighted 2247 1323 842 341 235
SPREADSHEET
Entry Level 2 or below 39 37 42 34 59
Entry Level 3 or above 61 63 58 66 41
Unweighted 2228 1314 834 337 235
MULTIPLE CHOICE
Entry Level 2 or below 9 7 12 6 21
Entry Level 3 or above 91 93 88 94 79
Unweighted 2274 1342 848 341 236
Base: SfL2011 All aged 16-65 with word processing / email / spreadsheet / multiple choice scores
Home ownership is associated with stability and regular sources of income. In line with 2003, young people yet to settle down, single parents and those in lower paid jobs were disproportionately represented among the renters. With the general exception of young people per se, these other groups tended to perform less well on the assessments, and therefore there is likely to be a degree of inter-collinearity between these variables and assessment performance.
5.5 The relationship between skills and personal demographic characteristics
The previous section examined abilities in the context of geographical characteristics, but this section focuses on the individual characteristics of respondents, specifically: age, gender, social classifications and health. Education and employment variables are discussed fully in Chapters 7 and 8 respectively but are touched upon here as well.
5.5.1 Age At a top-line level, age was not a strong performance discriminator in either the literacy or the numeracy assessment, and there was little variation between the age groups. This reflects the findings from SfL2003.
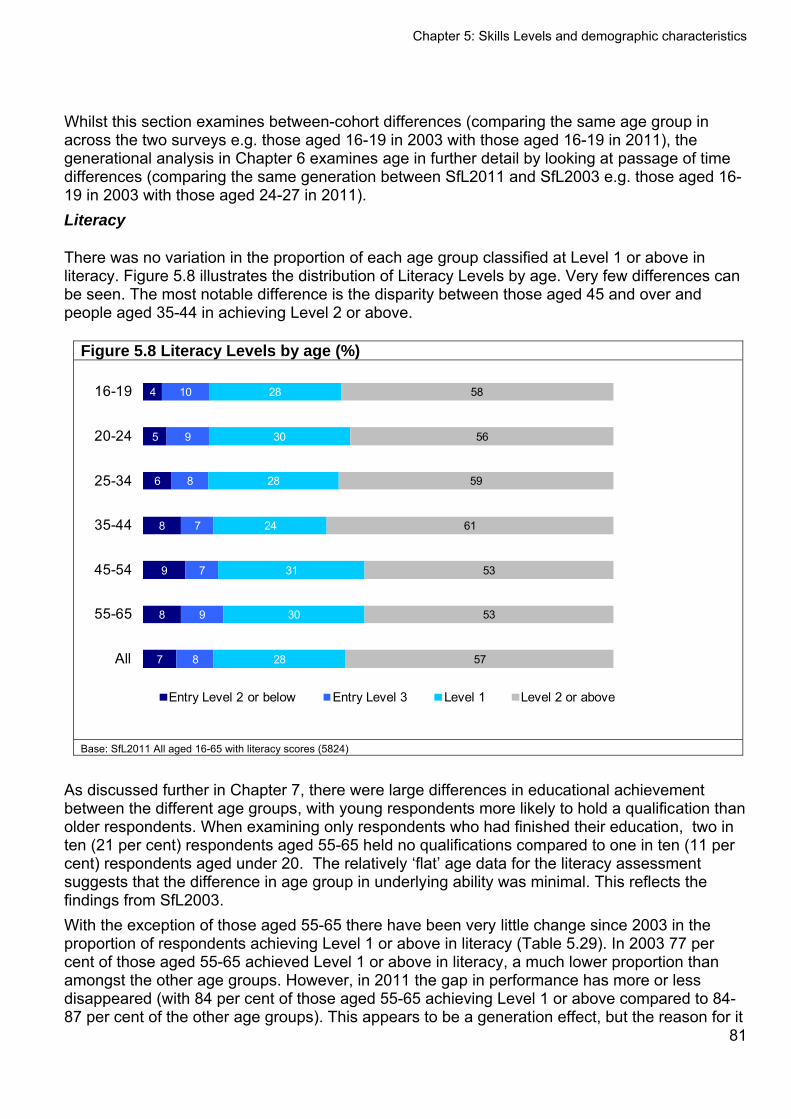
Chapter 5: Skills Levels and demographic characteristics
Whilst this section examines between-cohort differences (comparing the same age group in across the two surveys e.g. those aged 16-19 in 2003 with those aged 16-19 in 2011), the generational analysis in Chapter 6 examines age in further detail by looking at passage of time differences (comparing the same generation between SfL2011 and SfL2003 e.g. those aged 16-19 in 2003 with those aged 24-27 in 2011). Literacy
There was no variation in the proportion of each age group classified at Level 1 or above in literacy. Figure 5.8 illustrates the distribution of Literacy Levels by age. Very few differences can be seen. The most notable difference is the disparity between those aged 45 and over and people aged 35-44 in achieving Level 2 or above.
Figure 5.8 Literacy Levels by age (%)
7
8
9
8
6
5
4
8
9
7
7
8
9
10
28
30
31
24
28
30
28
57
53
53
61
59
56
58
All
55-65
45-54
35-44
25-34
20-24
16-19
Entry Level 2 or below Entry Level 3 Level 1 Level 2 or above
Base: SfL2011 All aged 16-65 with literacy scores (5824)
As discussed further in Chapter 7, there were large differences in educational achievement between the different age groups, with young respondents more likely to hold a qualification than older respondents. When examining only respondents who had finished their education, two in ten (21 per cent) respondents aged 55-65 held no qualifications compared to one in ten (11 per cent) respondents aged under 20. The relatively ‘flat’ age data for the literacy assessment suggests that the difference in age group in underlying ability was minimal. This reflects the findings from SfL2003.
81
With the exception of those aged 55-65 there have been very little change since 2003 in the proportion of respondents achieving Level 1 or above in literacy (Table 5.29). In 2003 77 per cent of those aged 55-65 achieved Level 1 or above in literacy, a much lower proportion than amongst the other age groups. However, in 2011 the gap in performance has more or less disappeared (with 84 per cent of those aged 55-65 achieving Level 1 or above compared to 84-87 per cent of the other age groups). This appears to be a generation effect, but the reason for it
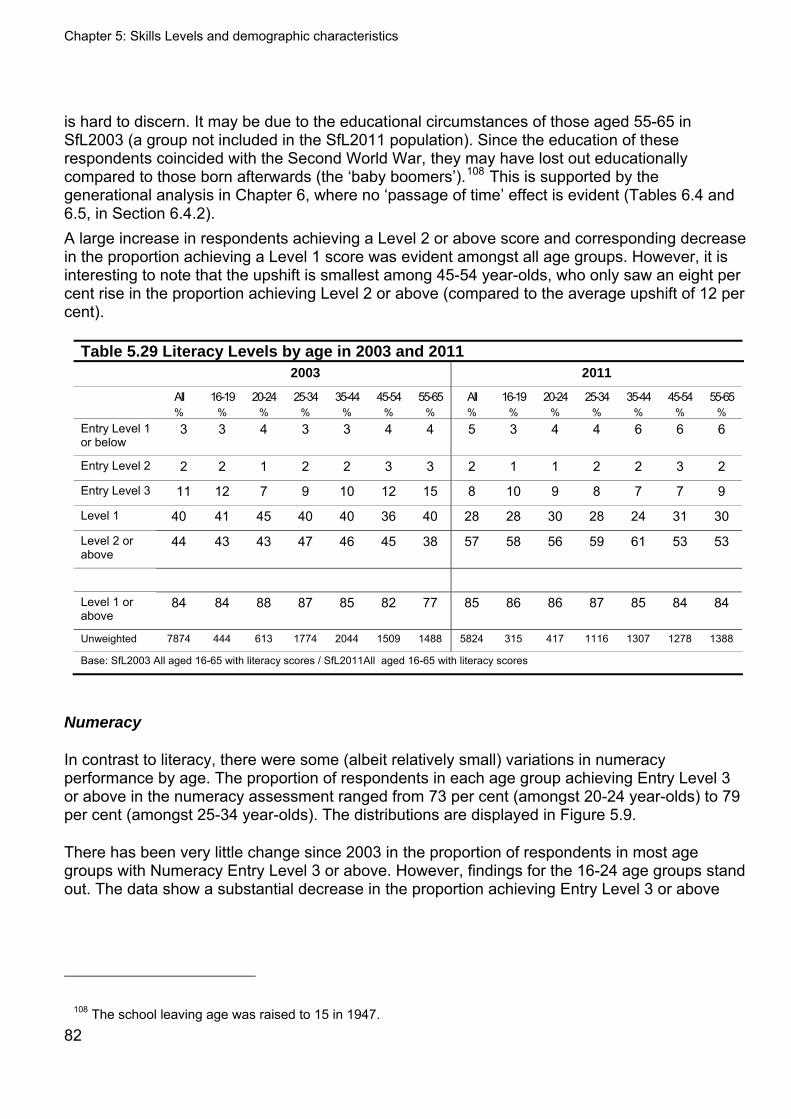
Chapter 5: Skills Levels and demographic characteristics
82
is hard to discern. It may be due to the educational circumstances of those aged 55-65 in SfL2003 (a group not included in the SfL2011 population). Since the education of these respondents coincided with the Second World War, they may have lost out educationally compared to those born afterwards (the ‘baby boomers’).108 This is supported by the generational analysis in Chapter 6, where no ‘passage of time’ effect is evident (Tables 6.4 and 6.5, in Section 6.4.2). A large increase in respondents achieving a Level 2 or above score and corresponding decrease in the proportion achieving a Level 1 score was evident amongst all age groups. However, it is interesting to note that the upshift is smallest among 45-54 year-olds, who only saw an eight per cent rise in the proportion achieving Level 2 or above (compared to the average upshift of 12 per cent).
Table 5.29 Literacy Levels by age in 2003 and 2011 2003 2011
All 16-19 20-24 25-34 35-44 45-54 55-65 All 16-19 20-24 25-34 35-44 45-54 55-65 % % % % % % % % % % % % % % Entry Level 1 or below
3 3 4 3 3 4 4 5 3 4 4 6 6 6
Entry Level 2 2 2 1 2 2 3 3 2 1 1 2 2 3 2
Entry Level 3 11 12 7 9 10 12 15 8 10 9 8 7 7 9
Level 1 40 41 45 40 40 36 40 28 28 30 28 24 31 30
Level 2 or above
44 43 43 47 46 45 38 57 58 56 59 61 53 53
Level 1 or above
84 84 88 87 85 82 77 85 86 86 87 85 84 84
Unweighted 7874 444 613 1774 2044 1509 1488 5824 315 417 1116 1307 1278 1388
Base: SfL2003 All aged 16-65 with literacy scores / SfL2011All aged 16-65 with literacy scores
Numeracy
In contrast to literacy, there were some (albeit relatively small) variations in numeracy performance by age. The proportion of respondents in each age group achieving Entry Level 3 or above in the numeracy assessment ranged from 73 per cent (amongst 20-24 year-olds) to 79 per cent (amongst 25-34 year-olds). The distributions are displayed in Figure 5.9.
There has been very little change since 2003 in the proportion of respondents in most age groups with Numeracy Entry Level 3 or above. However, findings for the 16-24 age groups stand out. The data show a substantial decrease in the proportion achieving Entry Level 3 or above
108 The school leaving age was raised to 15 in 1947.
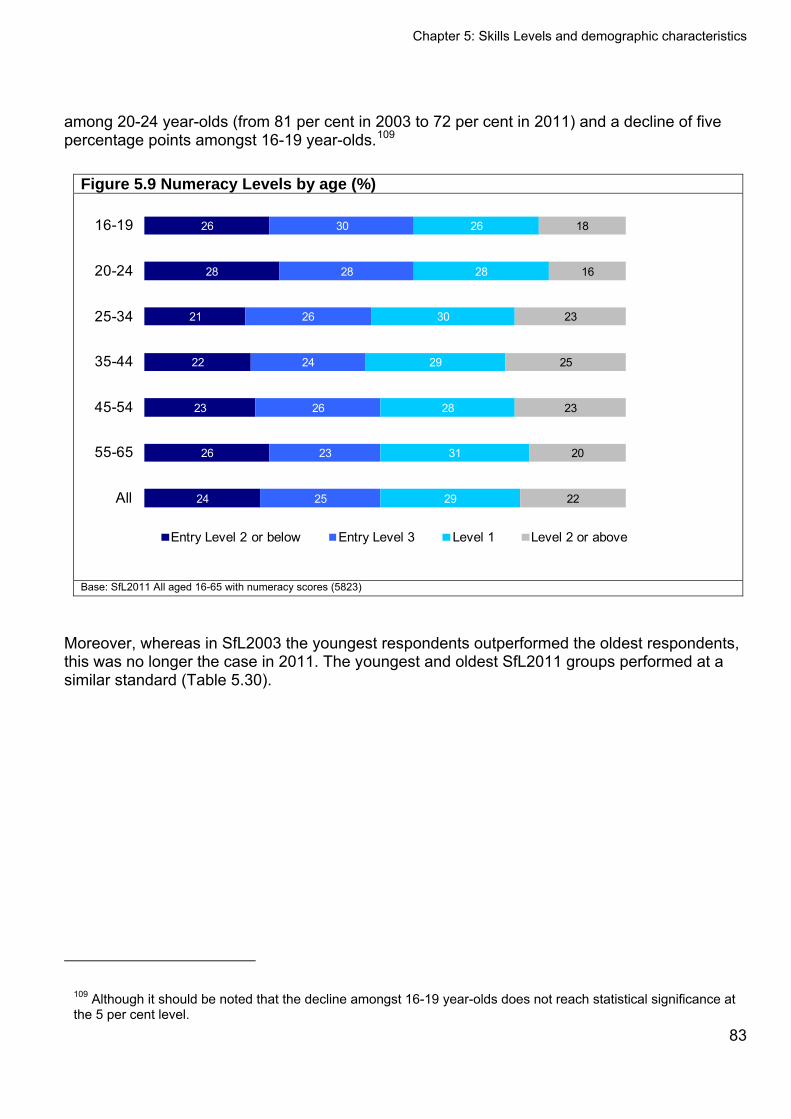
Chapter 5: Skills Levels and demographic characteristics
among 20-24 year-olds (from 81 per cent in 2003 to 72 per cent in 2011) and a decline of five percentage points amongst 16-19 year-olds.109
Figure 5.9 Numeracy Levels by age (%)
24
26
23
22
21
28
26
25
23
26
24
26
28
30
29
31
28
29
30
28
26
22
20
23
25
23
16
18
All
55-65
45-54
35-44
25-34
20-24
16-19
Entry Level 2 or below Entry Level 3 Level 1 Level 2 or above
Base: SfL2011 All aged 16-65 with numeracy scores (5823)
Moreover, whereas in SfL2003 the youngest respondents outperformed the oldest respondents, this was no longer the case in 2011. The youngest and oldest SfL2011 groups performed at a similar standard (Table 5.30).
109 Although it should be noted that the decline amongst 16-19 year-olds does not reach statistical significance at the 5 per cent level.
83
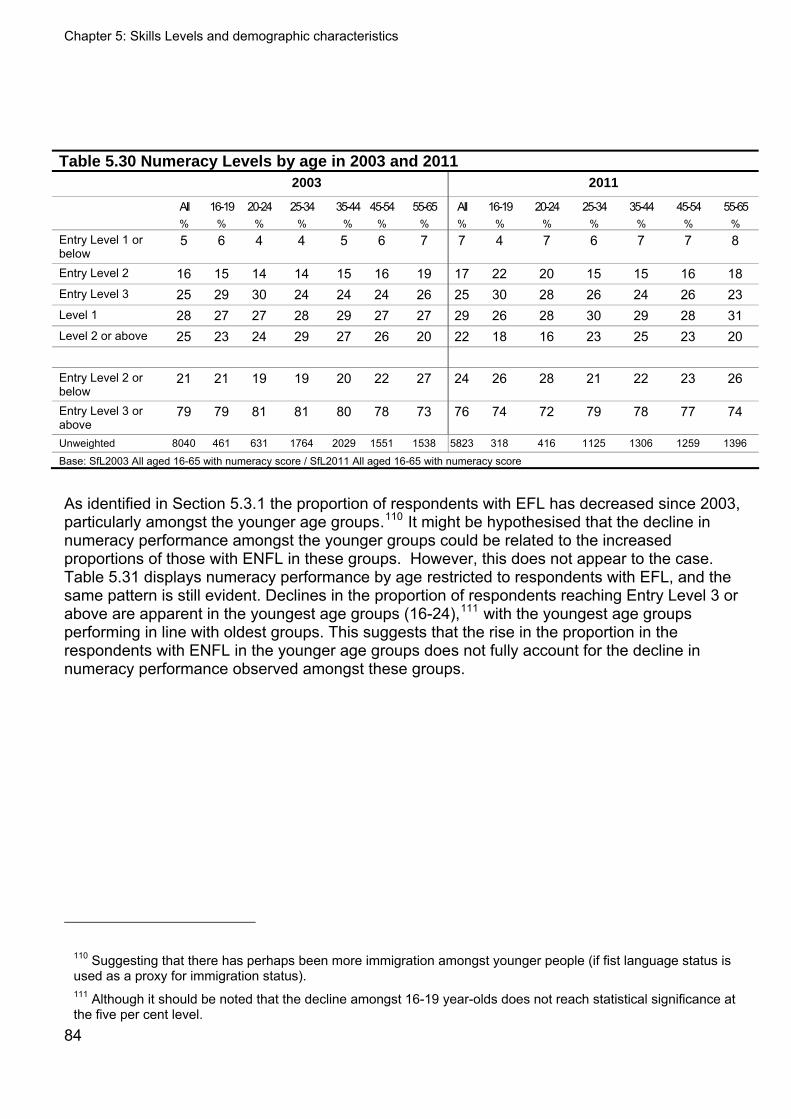
Chapter 5: Skills Levels and demographic characteristics
84
Table 5.30 Numeracy Levels by age in 2003 and 2011 2003 2011
All 16-19 20-24 25-34 35-44 45-54 55-65 All 16-19 20-24 25-34 35-44 45-54 55-65 % % % % % % % % % % % % % % Entry Level 1 or below
5 6 4 4 5 6 7 7 4 7 6 7 7 8
Entry Level 2 16 15 14 14 15 16 19 17 22 20 15 15 16 18 Entry Level 3 25 29 30 24 24 24 26 25 30 28 26 24 26 23 Level 1 28 27 27 28 29 27 27 29 26 28 30 29 28 31 Level 2 or above 25 23 24 29 27 26 20 22 18 16 23 25 23 20 Entry Level 2 or below
21 21 19 19 20 22 27 24 26 28 21 22 23 26
Entry Level 3 or above
79 79 81 81 80 78 73 76 74 72 79 78 77 74
Unweighted 8040 461 631 1764 2029 1551 1538 5823 318 416 1125 1306 1259 1396
Base: SfL2003 All aged 16-65 with numeracy score / SfL2011 All aged 16-65 with numeracy score
As identified in Section 5.3.1 the proportion of respondents with EFL has decreased since 2003, particularly amongst the younger age groups.110 It might be hypothesised that the decline in numeracy performance amongst the younger groups could be related to the increased proportions of those with ENFL in these groups. However, this does not appear to the case. Table 5.31 displays numeracy performance by age restricted to respondents with EFL, and the same pattern is still evident. Declines in the proportion of respondents reaching Entry Level 3 or above are apparent in the youngest age groups (16-24),111 with the youngest age groups performing in line with oldest groups. This suggests that the rise in the proportion in the respondents with ENFL in the younger age groups does not fully account for the decline in numeracy performance observed amongst these groups.
110 Suggesting that there has perhaps been more immigration amongst younger people (if fist language status is used as a proxy for immigration status). 111 Although it should be noted that the decline amongst 16-19 year-olds does not reach statistical significance at the five per cent level.
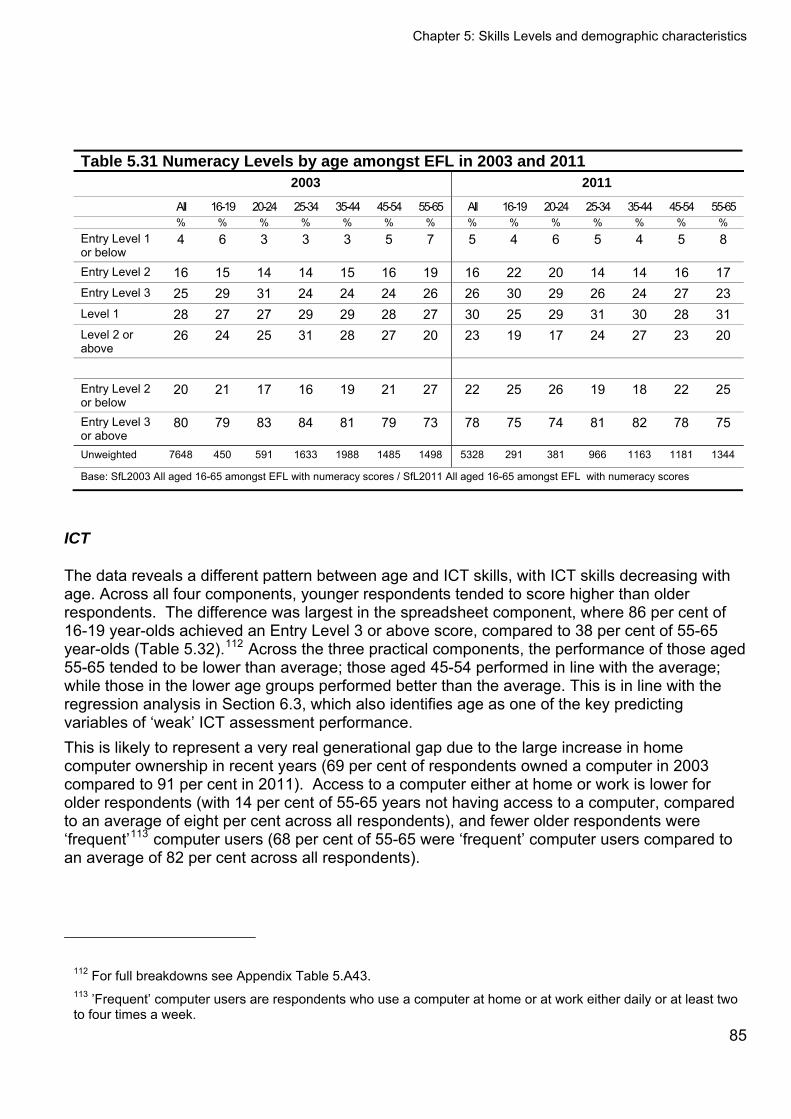
Chapter 5: Skills Levels and demographic characteristics
85
Table 5.31 Numeracy Levels by age amongst EFL in 2003 and 2011 2003 2011
All 16-19 20-24 25-34 35-44 45-54 55-65 All 16-19 20-24 25-34 35-44 45-54 55-65 % % % % % % % % % % % % % % Entry Level 1 or below
4 6 3 3 3 5 7 5 4 6 5 4 5 8
Entry Level 2 16 15 14 14 15 16 19 16 22 20 14 14 16 17 Entry Level 3 25 29 31 24 24 24 26 26 30 29 26 24 27 23 Level 1 28 27 27 29 29 28 27 30 25 29 31 30 28 31 Level 2 or above
26 24 25 31 28 27 20 23 19 17 24 27 23 20
Entry Level 2 or below
20 21 17 16 19 21 27 22 25 26 19 18 22 25
Entry Level 3 or above
80 79 83 84 81 79 73 78 75 74 81 82 78 75
Unweighted 7648 450 591 1633 1988 1485 1498 5328 291 381 966 1163 1181 1344
Base: SfL2003 All aged 16-65 amongst EFL with numeracy scores / SfL2011 All aged 16-65 amongst EFL with numeracy scores
ICT
The data reveals a different pattern between age and ICT skills, with ICT skills decreasing with age. Across all four components, younger respondents tended to score higher than older respondents. The difference was largest in the spreadsheet component, where 86 per cent of 16-19 year-olds achieved an Entry Level 3 or above score, compared to 38 per cent of 55-65 year-olds (Table 5.32).112 Across the three practical components, the performance of those aged 55-65 tended to be lower than average; those aged 45-54 performed in line with the average; while those in the lower age groups performed better than the average. This is in line with the regression analysis in Section 6.3, which also identifies age as one of the key predicting variables of ‘weak’ ICT assessment performance. This is likely to represent a very real generational gap due to the large increase in home computer ownership in recent years (69 per cent of respondents owned a computer in 2003 compared to 91 per cent in 2011). Access to a computer either at home or work is lower for older respondents (with 14 per cent of 55-65 years not having access to a computer, compared to an average of eight per cent across all respondents), and fewer older respondents were ‘frequent’113 computer users (68 per cent of 55-65 were ‘frequent’ computer users compared to an average of 82 per cent across all respondents).
112 For full breakdowns see Appendix Table 5.A43. 113 ’Frequent’ computer users are respondents who use a computer at home or at work either daily or at least two to four times a week.
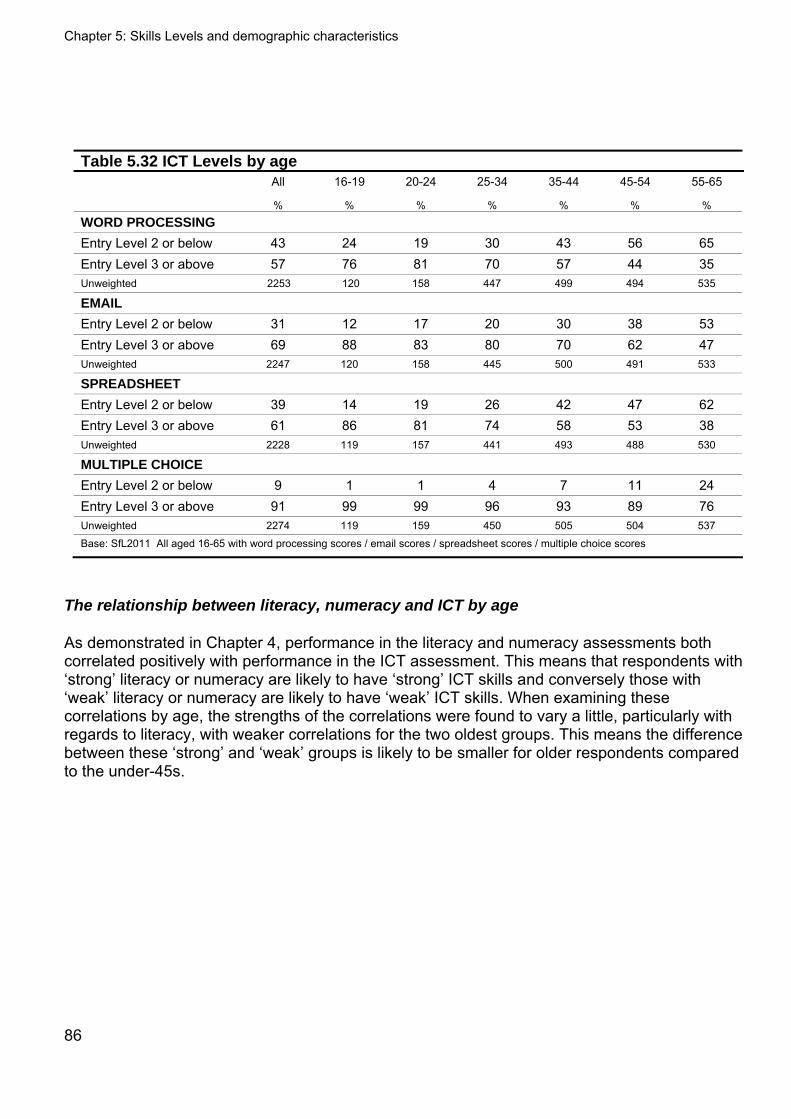
Chapter 5: Skills Levels and demographic characteristics
86
Table 5.32 ICT Levels by age All 16-19 20-24 25-34 35-44 45-54 55-65
% % % % % % %
WORD PROCESSING
Entry Level 2 or below 43 24 19 30 43 56 65 Entry Level 3 or above 57 76 81 70 57 44 35 Unweighted 2253 120 158 447 499 494 535
Entry Level 2 or below 31 12 17 20 30 38 53 Entry Level 3 or above 69 88 83 80 70 62 47 Unweighted 2247 120 158 445 500 491 533
SPREADSHEET
Entry Level 2 or below 39 14 19 26 42 47 62 Entry Level 3 or above 61 86 81 74 58 53 38 Unweighted 2228 119 157 441 493 488 530
MULTIPLE CHOICE
Entry Level 2 or below 9 1 1 4 7 11 24 Entry Level 3 or above 91 99 99 96 93 89 76 Unweighted 2274 119 159 450 505 504 537
Base: SfL2011 All aged 16-65 with word processing scores / email scores / spreadsheet scores / multiple choice scores
The relationship between literacy, numeracy and ICT by age
As demonstrated in Chapter 4, performance in the literacy and numeracy assessments both correlated positively with performance in the ICT assessment. This means that respondents with ‘strong’ literacy or numeracy are likely to have ‘strong’ ICT skills and conversely those with ‘weak’ literacy or numeracy are likely to have ‘weak’ ICT skills. When examining these correlations by age, the strengths of the correlations were found to vary a little, particularly with regards to literacy, with weaker correlations for the two oldest groups. This means the difference between these ‘strong’ and ‘weak’ groups is likely to be smaller for older respondents compared to the under-45s.
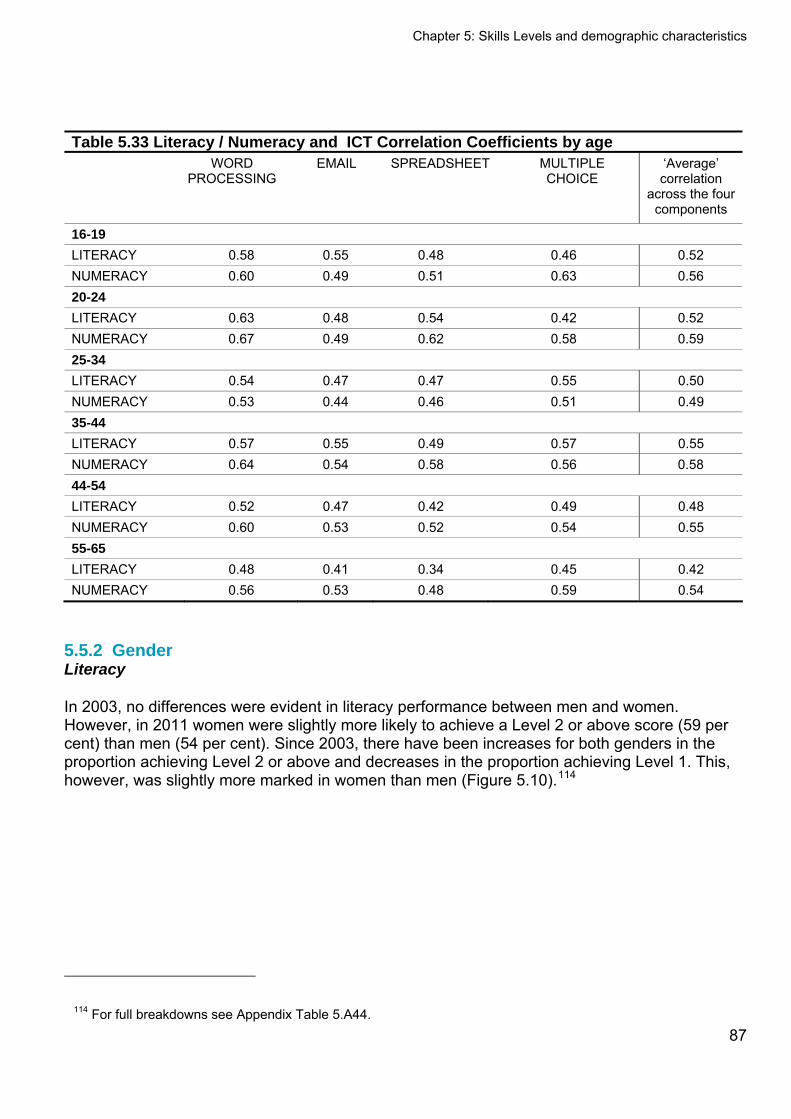
Chapter 5: Skills Levels and demographic characteristics
87
Table 5.33 Literacy / Numeracy and ICT Correlation Coefficients by age WORD
PROCESSING EMAIL SPREADSHEET MULTIPLE
CHOICE ‘Average’ correlation
across the four components
16-19 LITERACY 0.58 0.55 0.48 0.46 0.52 NUMERACY 0.60 0.49 0.51 0.63 0.56 20-24 LITERACY 0.63 0.48 0.54 0.42 0.52 NUMERACY 0.67 0.49 0.62 0.58 0.59 25-34 LITERACY 0.54 0.47 0.47 0.55 0.50 NUMERACY 0.53 0.44 0.46 0.51 0.49 35-44 LITERACY 0.57 0.55 0.49 0.57 0.55 NUMERACY 0.64 0.54 0.58 0.56 0.58 44-54 LITERACY 0.52 0.47 0.42 0.49 0.48 NUMERACY 0.60 0.53 0.52 0.54 0.55 55-65 LITERACY 0.48 0.41 0.34 0.45 0.42 NUMERACY 0.56 0.53 0.48 0.59 0.54
5.5.2 Gender Literacy
In 2003, no differences were evident in literacy performance between men and women. However, in 2011 women were slightly more likely to achieve a Level 2 or above score (59 per cent) than men (54 per cent). Since 2003, there have been increases for both genders in the proportion achieving Level 2 or above and decreases in the proportion achieving Level 1. This, however, was slightly more marked in women than men (Figure 5.10).114
114 For full breakdowns see Appendix Table 5.A44.
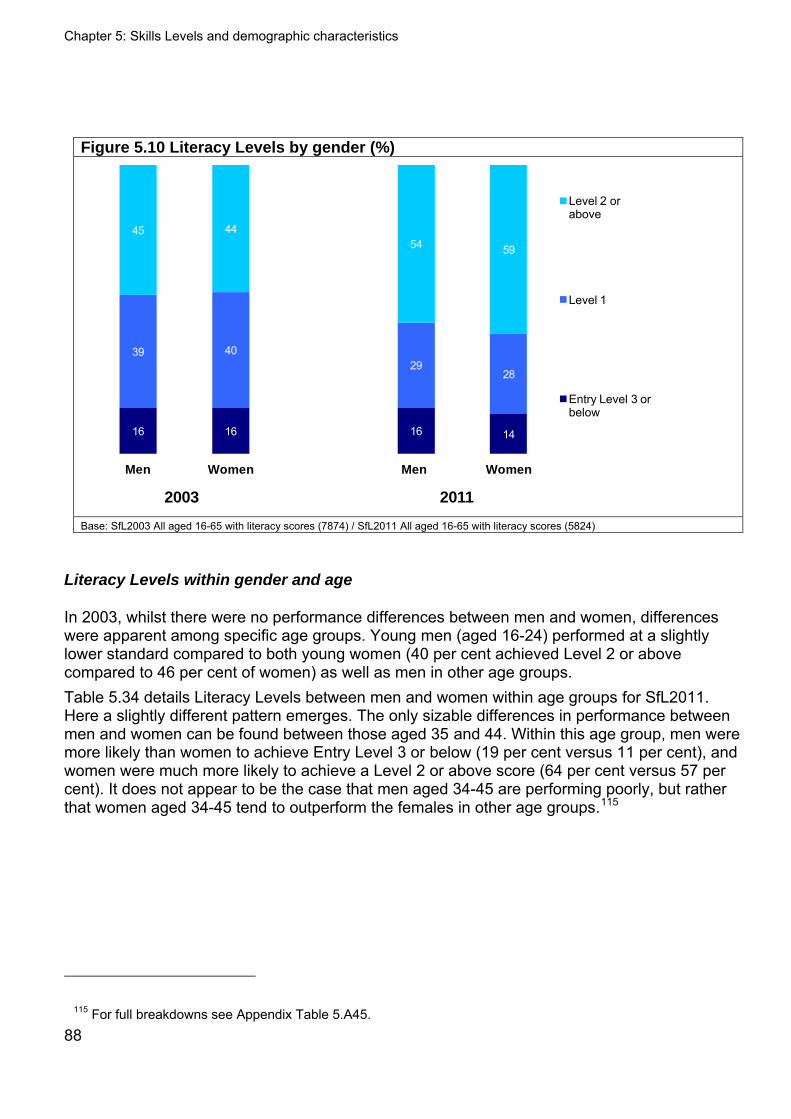
Chapter 5: Skills Levels and demographic characteristics
Figure 5.10 Literacy Levels by gender (%)
16 16 16 14
39 4029
28
45 4454 59
Men Women Men Women
Level 2 or above
Level 1
Entry Level 3 or below
2003 2011 Base: SfL2003 All aged 16-65 with literacy scores (7874) / SfL2011 All aged 16-65 with literacy scores (5824)
Literacy Levels within gender and age
In 2003, whilst there were no performance differences between men and women, differences were apparent among specific age groups. Young men (aged 16-24) performed at a slightly lower standard compared to both young women (40 per cent achieved Level 2 or above compared to 46 per cent of women) as well as men in other age groups. Table 5.34 details Literacy Levels between men and women within age groups for SfL2011. Here a slightly different pattern emerges. The only sizable differences in performance between men and women can be found between those aged 35 and 44. Within this age group, men were more likely than women to achieve Entry Level 3 or below (19 per cent versus 11 per cent), and women were much more likely to achieve a Level 2 or above score (64 per cent versus 57 per cent). It does not appear to be the case that men aged 34-45 are performing poorly, but rather that women aged 34-45 tend to outperform the females in other age groups.115
115 For full breakdowns see Appendix Table 5.A45. 88
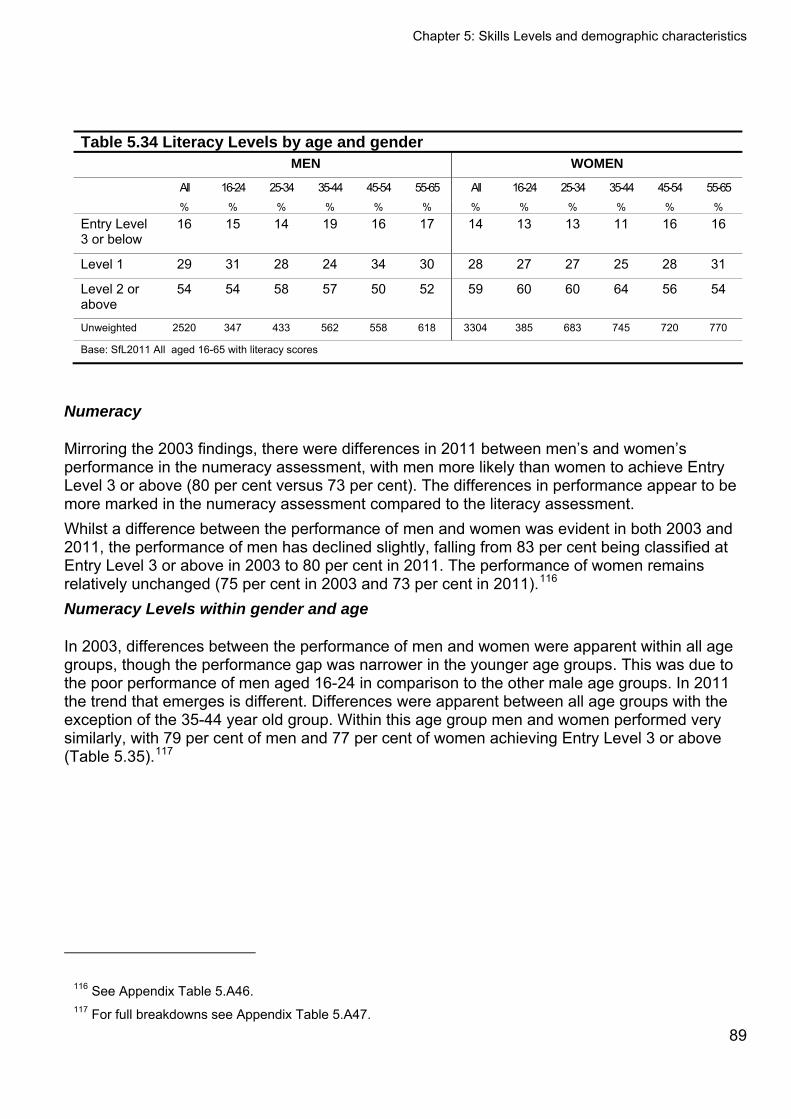
Chapter 5: Skills Levels and demographic characteristics
89
Table 5.34 Literacy Levels by age and gender MEN WOMEN
All 16-24 25-34 35-44 45-54 55-65 All 16-24 25-34 35-44 45-54 55-65 % % % % % % % % % % % %
Entry Level 3 or below
16 15 14 19 16 17 14 13 13 11 16 16
Level 1 29 31 28 24 34 30 28 27 27 25 28 31
Level 2 or above
54 54 58 57 50 52 59 60 60 64 56 54
Unweighted 2520 347 433 562 558 618 3304 385 683 745 720 770
Base: SfL2011 All aged 16-65 with literacy scores
Numeracy
Mirroring the 2003 findings, there were differences in 2011 between men’s and women’s performance in the numeracy assessment, with men more likely than women to achieve Entry Level 3 or above (80 per cent versus 73 per cent). The differences in performance appear to be more marked in the numeracy assessment compared to the literacy assessment. Whilst a difference between the performance of men and women was evident in both 2003 and 2011, the performance of men has declined slightly, falling from 83 per cent being classified at Entry Level 3 or above in 2003 to 80 per cent in 2011. The performance of women remains relatively unchanged (75 per cent in 2003 and 73 per cent in 2011).116 Numeracy Levels within gender and age
In 2003, differences between the performance of men and women were apparent within all age groups, though the performance gap was narrower in the younger age groups. This was due to the poor performance of men aged 16-24 in comparison to the other male age groups. In 2011 the trend that emerges is different. Differences were apparent between all age groups with the exception of the 35-44 year old group. Within this age group men and women performed very similarly, with 79 per cent of men and 77 per cent of women achieving Entry Level 3 or above (Table 5.35).117
116 See Appendix Table 5.A46. 117 For full breakdowns see Appendix Table 5.A47.
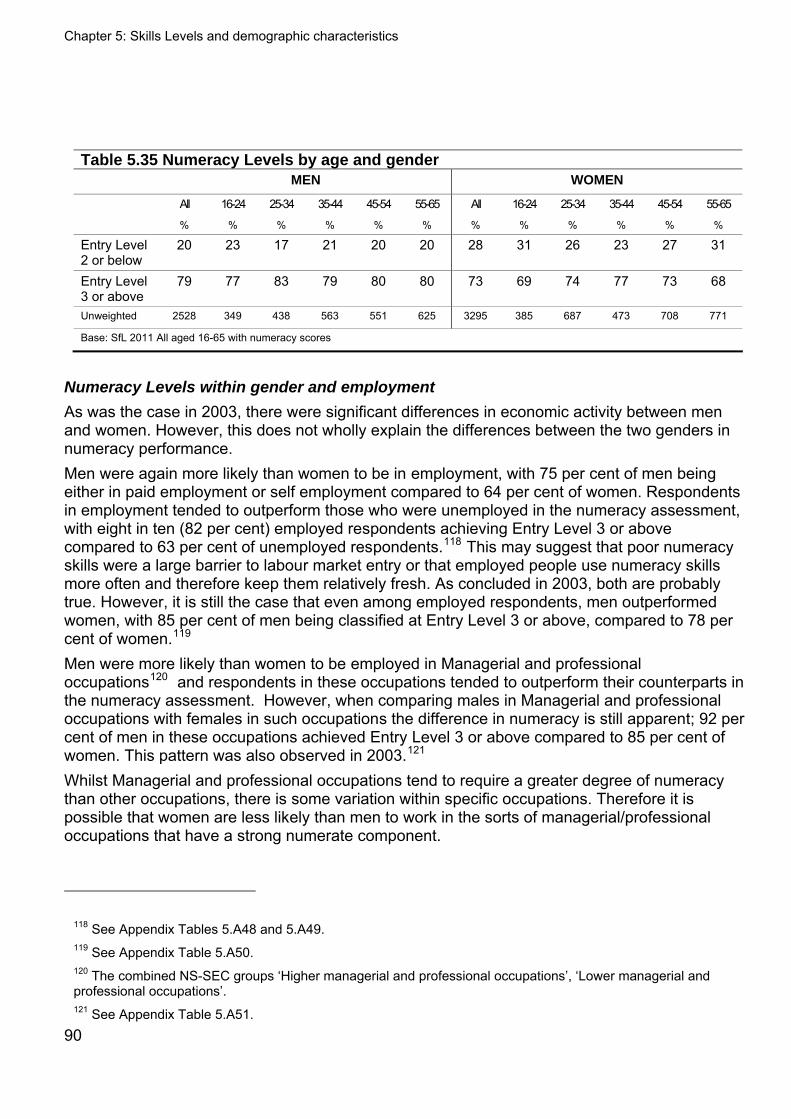
Chapter 5: Skills Levels and demographic characteristics
90
Table 5.35 Numeracy Levels by age and gender MEN WOMEN
All 16-24 25-34 35-44 45-54 55-65 All 16-24 25-34 35-44 45-54 55-65
% % % % % % % % % % % %
Entry Level 2 or below
20 23 17 21 20 20 28 31 26 23 27 31
Entry Level 3 or above
79 77 83 79 80 80 73 69 74 77 73 68
Unweighted 2528 349 438 563 551 625 3295 385 687 473 708 771
Base: SfL 2011 All aged 16-65 with numeracy scores
Numeracy Levels within gender and employment
As was the case in 2003, there were significant differences in economic activity between men and women. However, this does not wholly explain the differences between the two genders in numeracy performance. Men were again more likely than women to be in employment, with 75 per cent of men being either in paid employment or self employment compared to 64 per cent of women. Respondents in employment tended to outperform those who were unemployed in the numeracy assessment, with eight in ten (82 per cent) employed respondents achieving Entry Level 3 or above compared to 63 per cent of unemployed respondents.118 This may suggest that poor numeracy skills were a large barrier to labour market entry or that employed people use numeracy skills more often and therefore keep them relatively fresh. As concluded in 2003, both are probably true. However, it is still the case that even among employed respondents, men outperformed women, with 85 per cent of men being classified at Entry Level 3 or above, compared to 78 per cent of women.119 Men were more likely than women to be employed in Managerial and professional occupations120 and respondents in these occupations tended to outperform their counterparts in the numeracy assessment. However, when comparing males in Managerial and professional occupations with females in such occupations the difference in numeracy is still apparent; 92 per cent of men in these occupations achieved Entry Level 3 or above compared to 85 per cent of women. This pattern was also observed in 2003.121 Whilst Managerial and professional occupations tend to require a greater degree of numeracy than other occupations, there is some variation within specific occupations. Therefore it is possible that women are less likely than men to work in the sorts of managerial/professional occupations that have a strong numerate component.
118 See Appendix Tables 5.A48 and 5.A49. 119 See Appendix Table 5.A50. 120 The combined NS-SEC groups ‘Higher managerial and professional occupations’, ‘Lower managerial and professional occupations’. 121 See Appendix Table 5.A51.
Chapter 5: Skills Levels and demographic characteristics
91
Numeracy Levels within gender and qualification categories
Amongst respondents who had finished their education, women were slightly more likely than men to not hold any qualifications (12 per cent versus 10 per cent). As explored further in Chapter 7, respondents without any qualifications tended to score lower on the numeracy assessment than those who held qualifications. Therefore it is possible that the weaker performance of women could, in part, be due to a difference in qualifications held. It is interesting to note that the difference between men and women who held qualifications was only apparent in the oldest age group: those aged 55-65. This was also the case in 2003. In 2011, 25 per cent of women in this age group held no qualifications compared to 16 per cent of their male counterparts. Restricting analysis to just those respondents who held a pass grade A*-C in GCSE Maths (or equivalent) a difference in performance between men and women was still observed. Two fifths (40 per cent) of men achieved Level 2 or above, compared to 27 per cent of women. This suggests that differences in qualifications held cannot fully explain the differences between men’s and women’s performance in the numeracy assessment.122
ICT
There were very few differences in ICT performance between men and women. Across the three practical components, the only observed difference was on the spreadsheet component, with men more likely than women to achieve a Level 2 or above score (21 per cent versus 13 per cent). When asked about computer use both in the home and in the workplace, men were more likely than women to report using spreadsheets (51 per cent 42 per cent), so this is likely to account for this small difference. On the multiple choice component, a similar difference emerged with men more likely than women to achieve a Level 2 or above score (56 per cent compared to 49 per cent), and slightly less likely to achieve a Level 1 score (24 per cent versus 28 per cent).123 This is probably largely explained by the differences in employment between men and women. Men were more likely to be in employment (either paid employment or self employment), and those in employment tended to perform better on the multiple choice component. When focusing analysis solely on those in employment, the performance differences between men and women on the multiple choice component largely disappear.
122 See Appendix Table 5.A52. 123 See Appendix Table 5.A53.
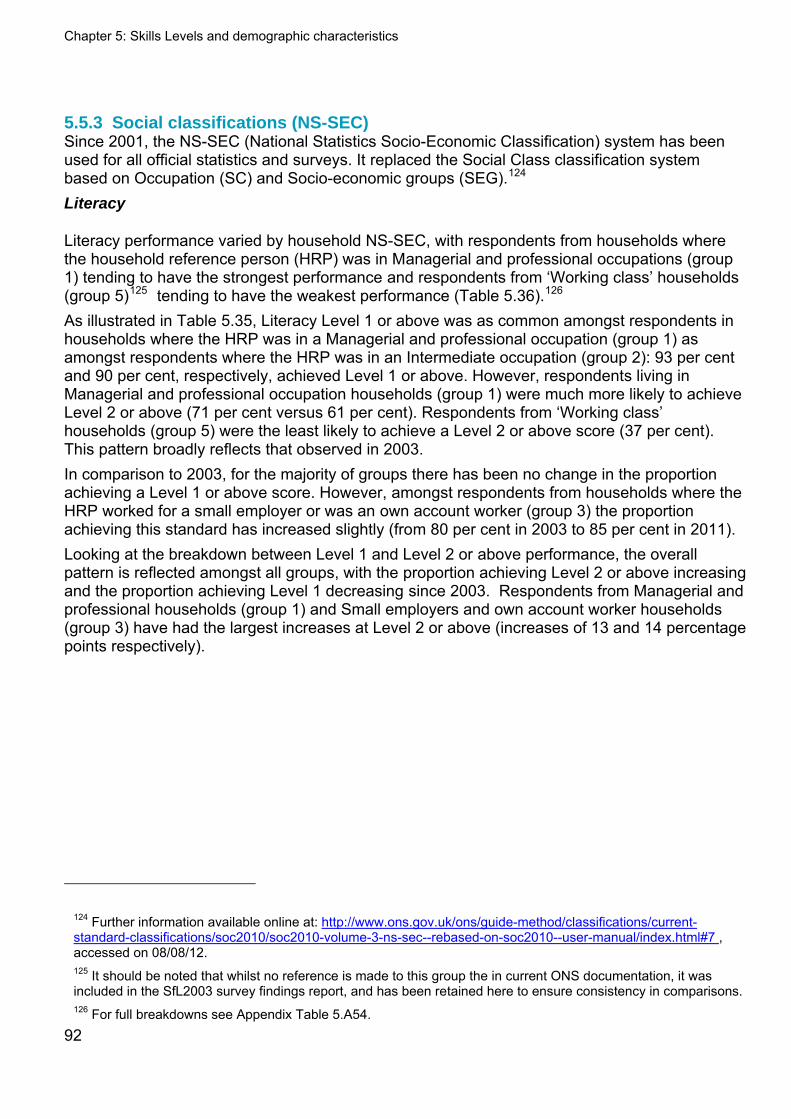
Chapter 5: Skills Levels and demographic characteristics
92
5.5.3 Social classifications (NS-SEC) Since 2001, the NS-SEC (National Statistics Socio-Economic Classification) system has been used for all official statistics and surveys. It replaced the Social Class classification system based on Occupation (SC) and Socio-economic groups (SEG).124 Literacy
Literacy performance varied by household NS-SEC, with respondents from households where the household reference person (HRP) was in Managerial and professional occupations (group 1) tending to have the strongest performance and respondents from ‘Working class’ households (group 5)125 tending to have the weakest performance (Table 5.36).126 As illustrated in Table 5.35, Literacy Level 1 or above was as common amongst respondents in households where the HRP was in a Managerial and professional occupation (group 1) as amongst respondents where the HRP was in an Intermediate occupation (group 2): 93 per cent and 90 per cent, respectively, achieved Level 1 or above. However, respondents living in Managerial and professional occupation households (group 1) were much more likely to achieve Level 2 or above (71 per cent versus 61 per cent). Respondents from ‘Working class’ households (group 5) were the least likely to achieve a Level 2 or above score (37 per cent). This pattern broadly reflects that observed in 2003. In comparison to 2003, for the majority of groups there has been no change in the proportion achieving a Level 1 or above score. However, amongst respondents from households where the HRP worked for a small employer or was an own account worker (group 3) the proportion achieving this standard has increased slightly (from 80 per cent in 2003 to 85 per cent in 2011). Looking at the breakdown between Level 1 and Level 2 or above performance, the overall pattern is reflected amongst all groups, with the proportion achieving Level 2 or above increasing and the proportion achieving Level 1 decreasing since 2003. Respondents from Managerial and professional households (group 1) and Small employers and own account worker households (group 3) have had the largest increases at Level 2 or above (increases of 13 and 14 percentage points respectively).
124 Further information available online at: http://www.ons.gov.uk/ons/guide-method/classifications/current-standard-classifications/soc2010/soc2010-volume-3-ns-sec--rebased-on-soc2010--user-manual/index.html#7 , accessed on 08/08/12. 125 It should be noted that whilst no reference is made to this group the in current ONS documentation, it was included in the SfL2003 survey findings report, and has been retained here to ensure consistency in comparisons. 126 For full breakdowns see Appendix Table 5.A54.
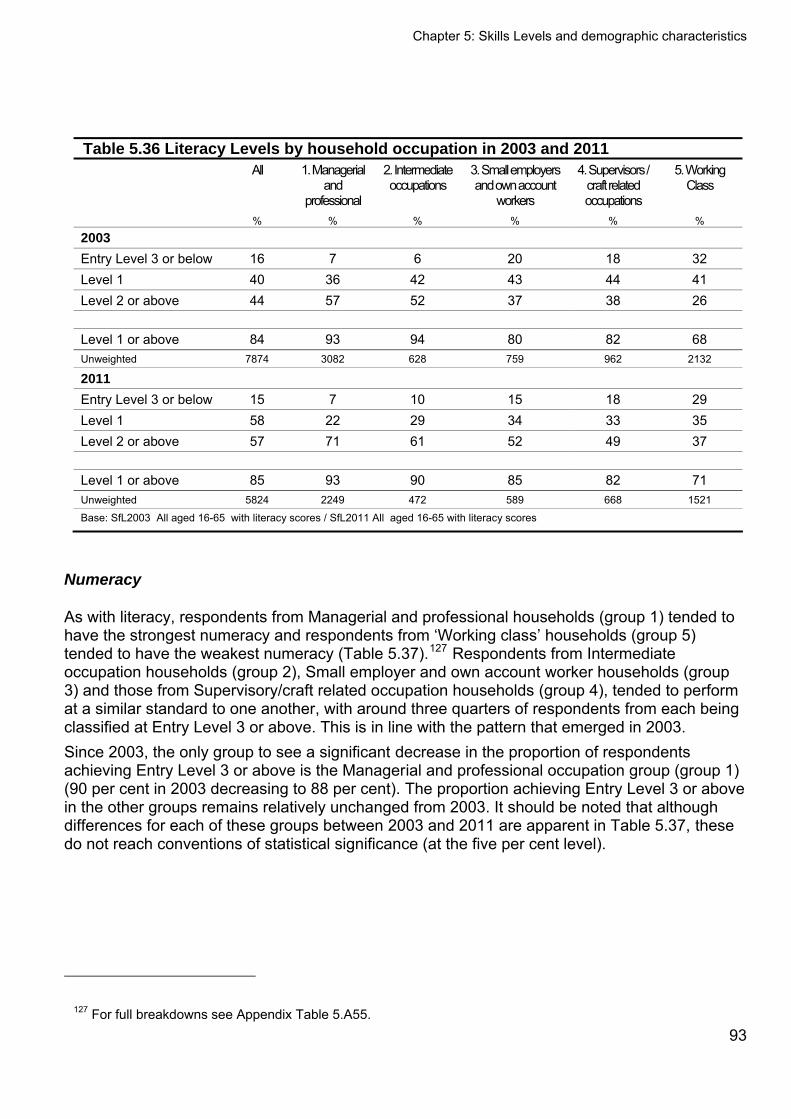
Chapter 5: Skills Levels and demographic characteristics
93
Table 5.36 Literacy Levels by household occupation in 2003 and 2011 All 1. Managerial
and professional
2. Intermediate occupations
3. Small employers and own account
workers
4. Supervisors / craft related occupations
5. Working Class
% % % % % %
2003
Entry Level 3 or below 16 7 6 20 18 32 Level 1 40 36 42 43 44 41 Level 2 or above 44 57 52 37 38 26
Level 1 or above 84 93 94 80 82 68 Unweighted 7874 3082 628 759 962 2132
2011
Entry Level 3 or below 15 7 10 15 18 29 Level 1 58 22 29 34 33 35 Level 2 or above 57 71 61 52 49 37
Level 1 or above 85 93 90 85 82 71 Unweighted 5824 2249 472 589 668 1521
Base: SfL2003 All aged 16-65 with literacy scores / SfL2011 All aged 16-65 with literacy scores
Numeracy
As with literacy, respondents from Managerial and professional households (group 1) tended to have the strongest numeracy and respondents from ‘Working class’ households (group 5) tended to have the weakest numeracy (Table 5.37).127 Respondents from Intermediate occupation households (group 2), Small employer and own account worker households (group 3) and those from Supervisory/craft related occupation households (group 4), tended to perform at a similar standard to one another, with around three quarters of respondents from each being classified at Entry Level 3 or above. This is in line with the pattern that emerged in 2003. Since 2003, the only group to see a significant decrease in the proportion of respondents achieving Entry Level 3 or above is the Managerial and professional occupation group (group 1) (90 per cent in 2003 decreasing to 88 per cent). The proportion achieving Entry Level 3 or above in the other groups remains relatively unchanged from 2003. It should be noted that although differences for each of these groups between 2003 and 2011 are apparent in Table 5.37, these do not reach conventions of statistical significance (at the five per cent level).
127 For full breakdowns see Appendix Table 5.A55.
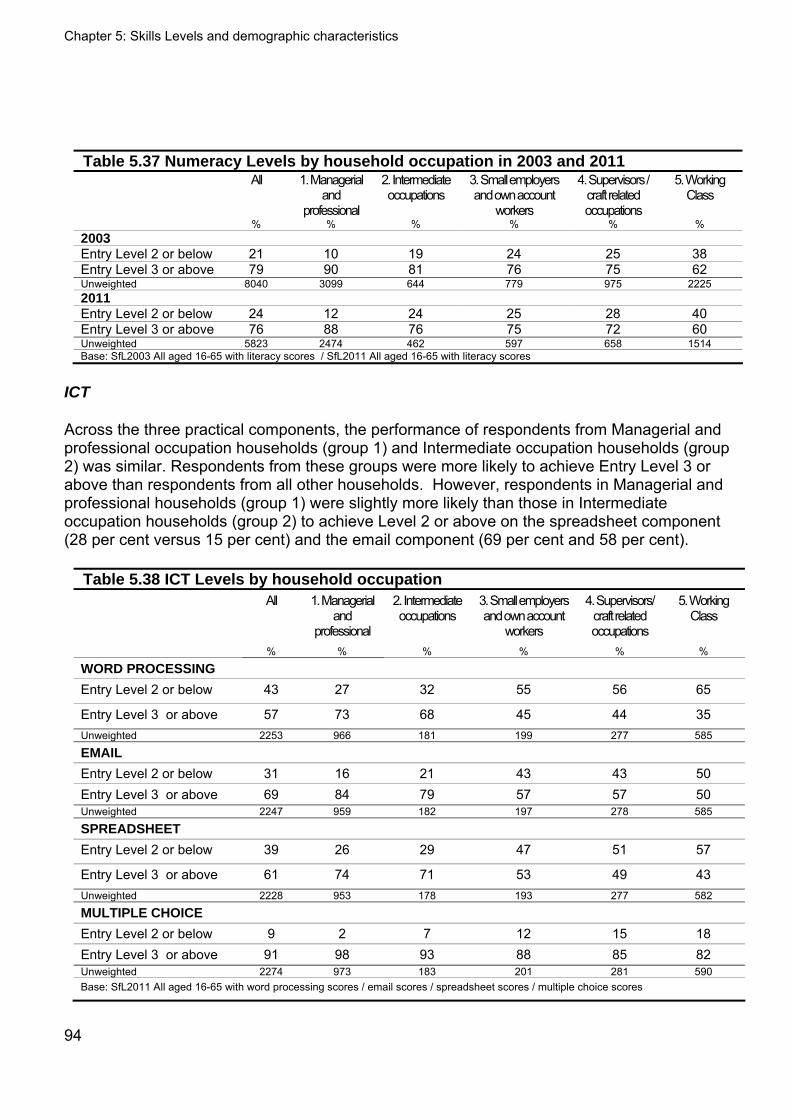
Chapter 5: Skills Levels and demographic characteristics
94
Table 5.37 Numeracy Levels by household occupation in 2003 and 2011 All 1. Managerial
and professional
2. Intermediate occupations
3. Small employers and own account
workers
4. Supervisors / craft related occupations
5. Working Class
% % % % % % 2003 Entry Level 2 or below 21 10 19 24 25 38 Entry Level 3 or above 79 90 81 76 75 62 Unweighted 8040 3099 644 779 975 2225 2011 Entry Level 2 or below 24 12 24 25 28 40 Entry Level 3 or above 76 88 76 75 72 60 Unweighted 5823 2474 462 597 658 1514 Base: SfL2003 All aged 16-65 with literacy scores / SfL2011 All aged 16-65 with literacy scores
ICT
Across the three practical components, the performance of respondents from Managerial and professional occupation households (group 1) and Intermediate occupation households (group 2) was similar. Respondents from these groups were more likely to achieve Entry Level 3 or above than respondents from all other households. However, respondents in Managerial and professional households (group 1) were slightly more likely than those in Intermediate occupation households (group 2) to achieve Level 2 or above on the spreadsheet component (28 per cent versus 15 per cent) and the email component (69 per cent and 58 per cent).
Table 5.38 ICT Levels by household occupation All 1. Managerial
and professional
2. Intermediate occupations
3. Small employers and own account
workers
4. Supervisors/ craft related occupations
5. Working Class
% % % % % %
WORD PROCESSING
Entry Level 2 or below 43 27 32 55 56 65
Entry Level 3 or above 57 73 68 45 44 35 Unweighted 2253 966 181 199 277 585
Entry Level 2 or below 31 16 21 43 43 50 Entry Level 3 or above 69 84 79 57 57 50 Unweighted 2247 959 182 197 278 585
SPREADSHEET
Entry Level 2 or below 39 26 29 47 51 57
Entry Level 3 or above 61 74 71 53 49 43 Unweighted 2228 953 178 193 277 582
MULTIPLE CHOICE
Entry Level 2 or below 9 2 7 12 15 18 Entry Level 3 or above 91 98 93 88 85 82 Unweighted 2274 973 183 201 281 590 Base: SfL2011 All aged 16-65 with word processing scores / email scores / spreadsheet scores / multiple choice scores
Chapter 5: Skills Levels and demographic characteristics
95
Respondents from Small employers and own account worker households (group 3) and Supervisors/craft related occupation households (group 4) had similar performance across the three practical components. Their performance was substantially weaker than the performance of respondents from either Managerial and professional occupation households, or Intermediate occupation households (groups 1 and 2). Respondents from ‘Working class’ households (group 5) had the weakest performance, with the lowest proportion of respondents achieving Entry Level 3 or above across the three practical components (Table 5.38).128 5.5.4 Health issues The majority of respondents described their health as ‘very good’ or ‘good’ (48 per cent rating it as ‘very good’ and 35 per cent as ‘good’). One in ten (11 per cent) described it as a ‘fair’, and five per cent as ‘poor’ or ‘very poor’. One in five (20 per cent) reported that they had a longstanding illness, disability or infirmity of some kind, including 13 per cent who felt it placed limits on their activities. These ratings remain unchanged from 2003.129 Unsurprisingly, poor health was more prevalent among older respondents. Only 72 per cent of 55-65 year-olds rated their health as ‘good’ or ‘very good’ (compared to the average of 84 per cent across all respondents), and 55-65 year-olds were the most likely to say that they had a longstanding illness, disability or infirmity of some kind (34 per cent, compared to 20 per cent of all respondents).130 Performance on the literacy and numeracy assessment varied by these health ratings. Nine in ten (89 per cent) respondents who rated their health as ‘very good’ were classified as Level 1 or above on the literacy assessment, falling to 65 per cent among respondents who rated their health as ‘very poor’ or ‘poor’. There were declines in performance between each step down the health scale, with the exception of ratings of ‘poor’ and ‘very poor’, where there were no differences in performance. Respondents who reported they had a longstanding illness, disability or infirmity were also less likely to score Level 1 or above (Table 5.38). This pattern broadly reflects the 2003 pattern. For numeracy, a similar pattern emerged (Table 5.39).131
128 For full breakdowns see Appendix Table 5.A56. 129 See Appendix Table 5.A57. 130 See Appendix Table 5.A58. 131 For full breakdowns see Appendix Tables 5.A59 and 5.A60.
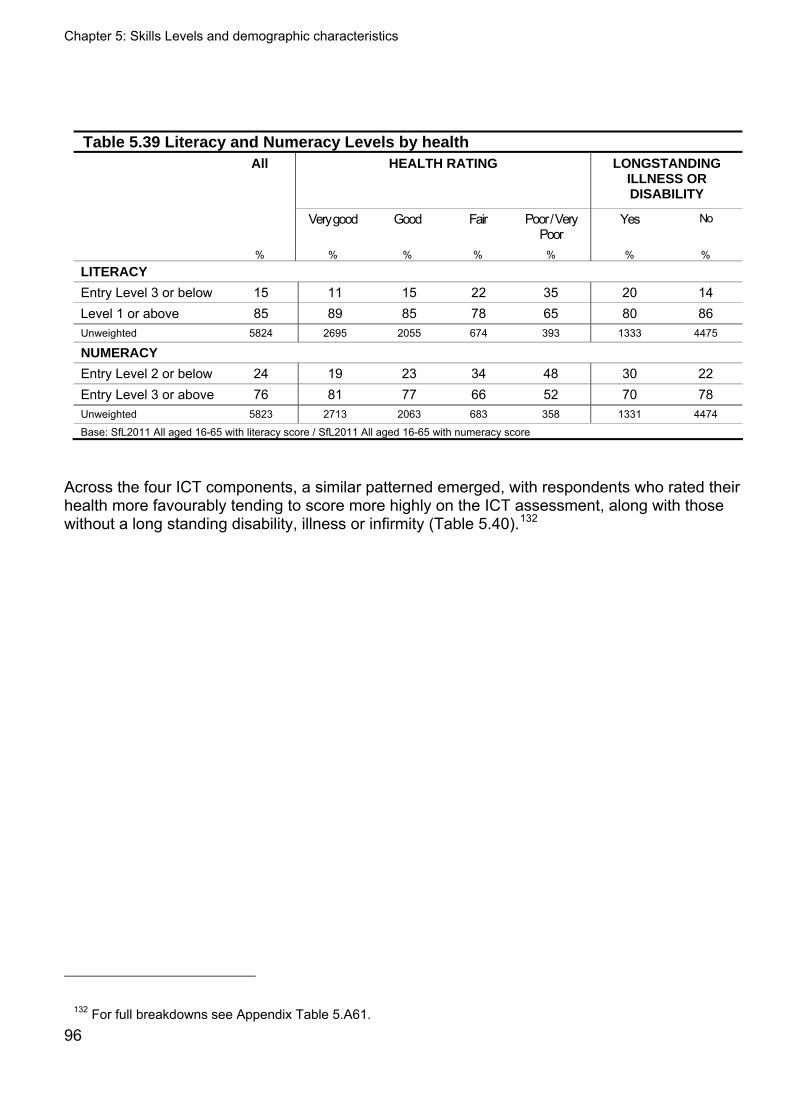
Chapter 5: Skills Levels and demographic characteristics
96
Table 5.39 Literacy and Numeracy Levels by health HEALTH RATING LONGSTANDING
ILLNESS OR DISABILITY
All
Very good Good Fair Poor / Very Poor
Yes No
% % % % % % %
LITERACY
Entry Level 3 or below 15 11 15 22 35 20 14 Level 1 or above 85 89 85 78 65 80 86 Unweighted 5824 2695 2055 674 393 1333 4475
NUMERACY
Entry Level 2 or below 24 19 23 34 48 30 22 Entry Level 3 or above 76 81 77 66 52 70 78 Unweighted 5823 2713 2063 683 358 1331 4474
Base: SfL2011 All aged 16-65 with literacy score / SfL2011 All aged 16-65 with numeracy score
Across the four ICT components, a similar patterned emerged, with respondents who rated their health more favourably tending to score more highly on the ICT assessment, along with those without a long standing disability, illness or infirmity (Table 5.40).132
132 For full breakdowns see Appendix Table 5.A61.
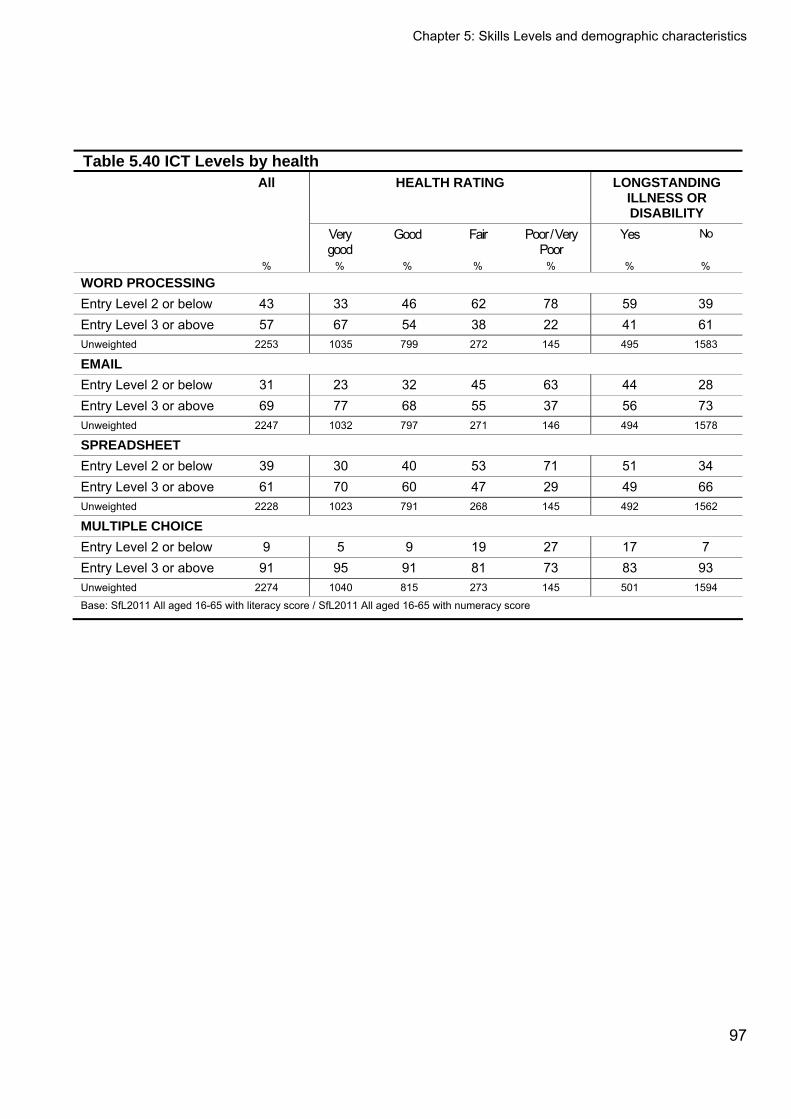
Chapter 5: Skills Levels and demographic characteristics
97
Table 5.40 ICT Levels by health HEALTH RATING LONGSTANDING
ILLNESS OR DISABILITY
All
Very good
Good Fair Poor / Very Poor
Yes No
% % % % % % %
WORD PROCESSING
Entry Level 2 or below 43 33 46 62 78 59 39 Entry Level 3 or above 57 67 54 38 22 41 61 Unweighted 2253 1035 799 272 145 495 1583
Entry Level 2 or below 31 23 32 45 63 44 28 Entry Level 3 or above 69 77 68 55 37 56 73 Unweighted 2247 1032 797 271 146 494 1578
SPREADSHEET
Entry Level 2 or below 39 30 40 53 71 51 34 Entry Level 3 or above 61 70 60 47 29 49 66 Unweighted 2228 1023 791 268 145 492 1562
MULTIPLE CHOICE
Entry Level 2 or below 9 5 9 19 27 17 7 Entry Level 3 or above 91 95 91 81 73 83 93 Unweighted 2274 1040 815 273 145 501 1594
Base: SfL2011 All aged 16-65 with literacy score / SfL2011 All aged 16-65 with numeracy score

Chapter 6: Understanding the relationship between skills and personal characteristics
98
6 Understanding the relationship between skills and personal characteristics
6.1 Key findings
Personal characteristics that predict133 ‘weak’ skills
From the regression analysis, many of the personal characteristics associated with weak assessment performance are common to all three domains (literacy, numeracy and ICT). These include: - English not being the first language of the respondent, especially amongst some
ethnic groups - Where neither parent stayed in education beyond the age of 16 - Where there is a (self-assessed) learning difficulty - When no educational qualifications are held - Working in certain industry sectors (although sample size limitations prevent
identification of those most closely associated with weak assessment performance) - Working in routine occupations (or the long-term unemployed)
In addition, there are a number of ‘domain-specific’ associations:
Infrequent or zero computer use appears to predict weak literacy and numeracy performance beyond that expected from educational and work status. However, computer use may have a circular, reinforcing quality, both promoting good literacy and numeracy and following from it as well.
Age operated differently in each domain, with a mild decline after the age of 45 for literacy, a gentle u-shaped distribution for numeracy (youngest and oldest age groups were weakest) and a strong linear relationship for ICT with each succeeding generation having stronger skills than the previous one.
Women tended to perform at a lower standard than men on the numeracy assessment, even when controlling for other factors. This replicates a finding from 2003.
The exact relationship between highest qualification and assessment performance varied somewhat between domains. For numeracy, Level 3 qualifications – or better still a degree – gave an advantage over lesser qualifications. For literacy and ICT, there was less of a linear relationship with little advantage conferred by qualifications above Level 2. However, holding no qualifications was a strong predictor of weak
133 Note that, in this context, predictive power demonstrates the strength of association rather than of causation.
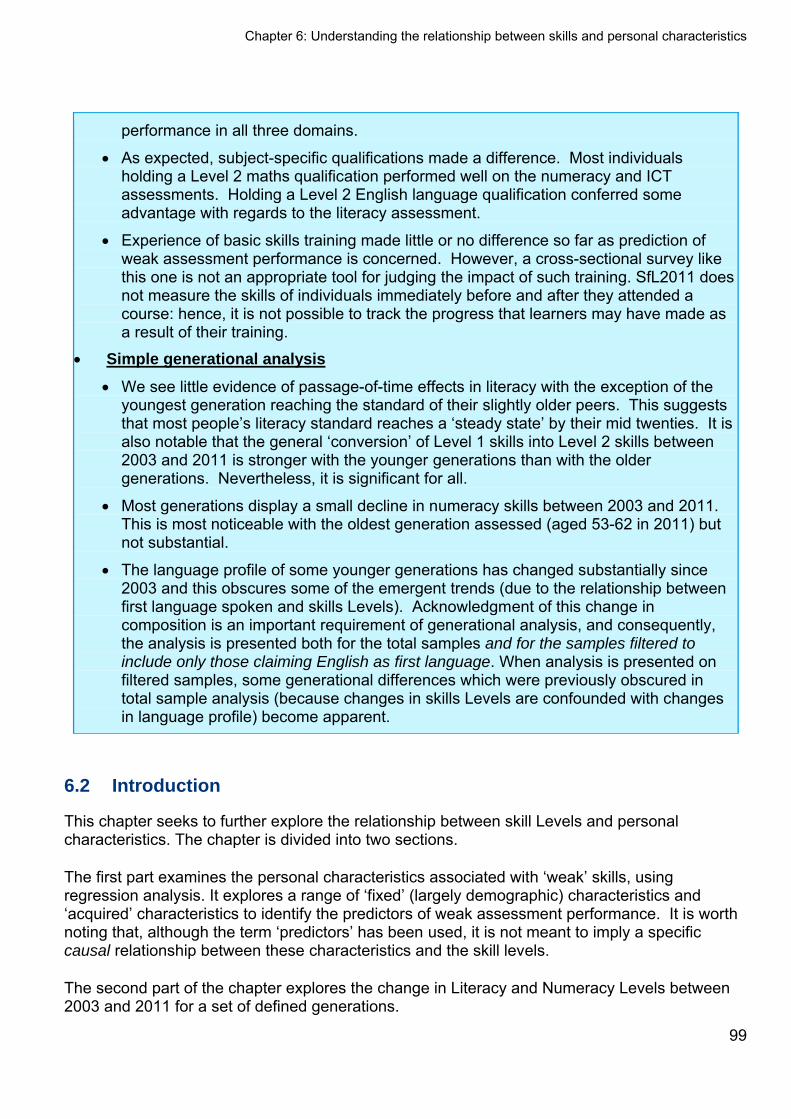
Chapter 6: Understanding the relationship between skills and personal characteristics
99
performance in all three domains.
As expected, subject-specific qualifications made a difference. Most individuals holding a Level 2 maths qualification performed well on the numeracy and ICT assessments. Holding a Level 2 English language qualification conferred some advantage with regards to the literacy assessment.
Experience of basic skills training made little or no difference so far as prediction of weak assessment performance is concerned. However, a cross-sectional survey like this one is not an appropriate tool for judging the impact of such training. SfL2011 does not measure the skills of individuals immediately before and after they attended a course: hence, it is not possible to track the progress that learners may have made as a result of their training.
Simple generational analysis
We see little evidence of passage-of-time effects in literacy with the exception of the youngest generation reaching the standard of their slightly older peers. This suggests that most people’s literacy standard reaches a ‘steady state’ by their mid twenties. It is also notable that the general ‘conversion’ of Level 1 skills into Level 2 skills between 2003 and 2011 is stronger with the younger generations than with the older generations. Nevertheless, it is significant for all.
Most generations display a small decline in numeracy skills between 2003 and 2011. This is most noticeable with the oldest generation assessed (aged 53-62 in 2011) but not substantial.
The language profile of some younger generations has changed substantially since 2003 and this obscures some of the emergent trends (due to the relationship between first language spoken and skills Levels). Acknowledgment of this change in composition is an important requirement of generational analysis, and consequently, the analysis is presented both for the total samples and for the samples filtered to include only those claiming English as first language. When analysis is presented on filtered samples, some generational differences which were previously obscured in total sample analysis (because changes in skills Levels are confounded with changes in language profile) become apparent.
6.2 Introduction
This chapter seeks to further explore the relationship between skill Levels and personal characteristics. The chapter is divided into two sections.
The first part examines the personal characteristics associated with ‘weak’ skills, using regression analysis. It explores a range of ‘fixed’ (largely demographic) characteristics and ‘acquired’ characteristics to identify the predictors of weak assessment performance. It is worth noting that, although the term ‘predictors’ has been used, it is not meant to imply a specific causal relationship between these characteristics and the skill levels.
The second part of the chapter explores the change in Literacy and Numeracy Levels between 2003 and 2011 for a set of defined generations.
Chapter 6: Understanding the relationship between skills and personal characteristics
100
6.3 Personal characteristics that predict ‘weak’ skills – results of regression analysis
6.3.1 Introduction In this section we present the results from a regression analysis which sought to identify the personal characteristics associated with weak assessment performance. For clarity, ‘weak assessment performance’ is defined in the following way:
Literacy: Below Level 1 Numeracy: Below Entry Level 3 ICT: Below Entry Level 3 in all three practical dimensions (word processing, spreadsheets
and email) The regression method has been used in preference to multiple bivariate tables because it produces a simpler model, including only those characteristics that have an independent association with skill Levels. In this way the natural correlations between personal characteristics are explicitly identified and handled. Some variables that appear to be strong predictors in the bivariate tables look much weaker in the regression tables, while others retain their strength.134 In each model, we have distinguished between two types of personal characteristics: those which are determined at birth or are long-term traits, termed ‘fixed’ characteristics, and those describing what the individual does or thinks which are termed ‘acquired’ characteristics and may be subject to change. Although fixed characteristics cannot be changed, their association with assessment performance is not immutable and may be subject to change over time both within and across generations. It is important to recognise that the models presented here are appropriate to England in 2011. Secondly, the association of fixed characteristics with assessment performance should not be interpreted as an inheritance for each individual when they are born. For example, it is highly unlikely that women are ‘naturally’ less numerate than men. The difference in skill Levels is much more likely to be due to (unmeasured) systematic variation in upbringing, social and cultural expectations (particularly with regard to the balance between work and family) and other life experiences. The same can be said of other associations between fixed characteristics and assessment performance. Nevertheless, the observed associations remain statistical facts and there is some value in breaking the regression models into two parts, one based on fixed characteristics only - effectively producing a base likelihood of weak assessment performance – and one in which acquired characteristics have been added. The purpose is to assess whether the strength – if not the direction – of associations differs depending on the base likelihood of weak assessment performance.
134 Two variables may ‘explain’ approximately the same variance in the dependent variable. If so, the model with the highest likelihood of producing the data is likely to include only one of them or include one of them as a strong predictor and the other as a lesser predictor, even though the separate predictive power of each variable is similar. This can lead to interpretative problems which is why most regression models do not include predictors that are highly correlated with other predictors in the model.
Chapter 6: Understanding the relationship between skills and personal characteristics
101
It should be noted that acquired characteristics are themselves partially determined by fixed characteristics. However they can also be influenced by the kinds of environmental factors that are within the purview of government policy. Ultimately, effective policy in these areas ought to reduce the influence of fixed characteristics for future generations. 6.3.2 The models The characteristics considered for the models are personal and do not include geographic indicators or household characteristics such as tenure, presence or otherwise of an internet connection, or the status of the head of household. Although these variables might have predictive power, they are not particularly informative about the kinds of people with weak skills. Table 6.1 describes the personal characteristics that were considered for each model. Broadly speaking, the acquired characteristics cover education, work, basic skills training, computer use135 and health. The ten ‘attitudes to learning’ variables were also considered but the two statements with the strongest associations ‘learning isn’t for people like me’ and ‘I didn’t get anything out of school’) are too closely related to educational attainment to be additionally informative. The models presented here are ‘main effects’ models despite the fact that the explanatory power of some models could be improved if two-way interaction terms were included.136 The deliberate omission of interaction terms from the presented models is not to say that these effects do not exist, rather that the evidence we have is insufficiently clear to warrant further complication of the model. To a great extent, this limitation is due to small sample sizes in many ‘interaction’ categories.
There is one exception to this general rule: the ethnic group and ‘first language’ variables have been combined together due to the naturally strong correlation between the two. This correlation makes the respective ‘strength of association’ measures somewhat unstable when the two variables are separate. Because first language status has a more obvious connection with English literacy, it would be a reasonable approach to omit the ethnic group term altogether. However, despite small sample sizes, it seems more likely than not that ethnic group has some independent influence. Model fit has been largely measured through two summary outputs: (a) Nagelkerke’s pseudo R2 measure of explanatory power, and (b) Hosmer and Lemeshow’s goodness-of-fit test (i.e. relative fit of the model across the range of modelled probabilities of weak assessment performance). To avoid inclusion of terms that significantly improve model fit in a statistical sense but not a substantive sense, terms have only been included if they increase the pseudo R2 value by 0.5 percentage points or more or increase it by less than this but improve relative fit.137
135 This was not included in the ICT model because it is too closely correlated with ICT assessment outcomes to be informative. 136 An interaction term would be necessary if, for example, the effect of parental education attainment on assessment performance varied significantly between men and women. 137 The weight of each variable in the model is determined by total change in the model’s ‘deviance difference’ if the variable is removed. The total R2 of the model is allocated to each variable using the same calculation. The ‘deviance difference’ is also called the ‘-2 log likelihood’ and is a method of comparing the fit of alternative models.
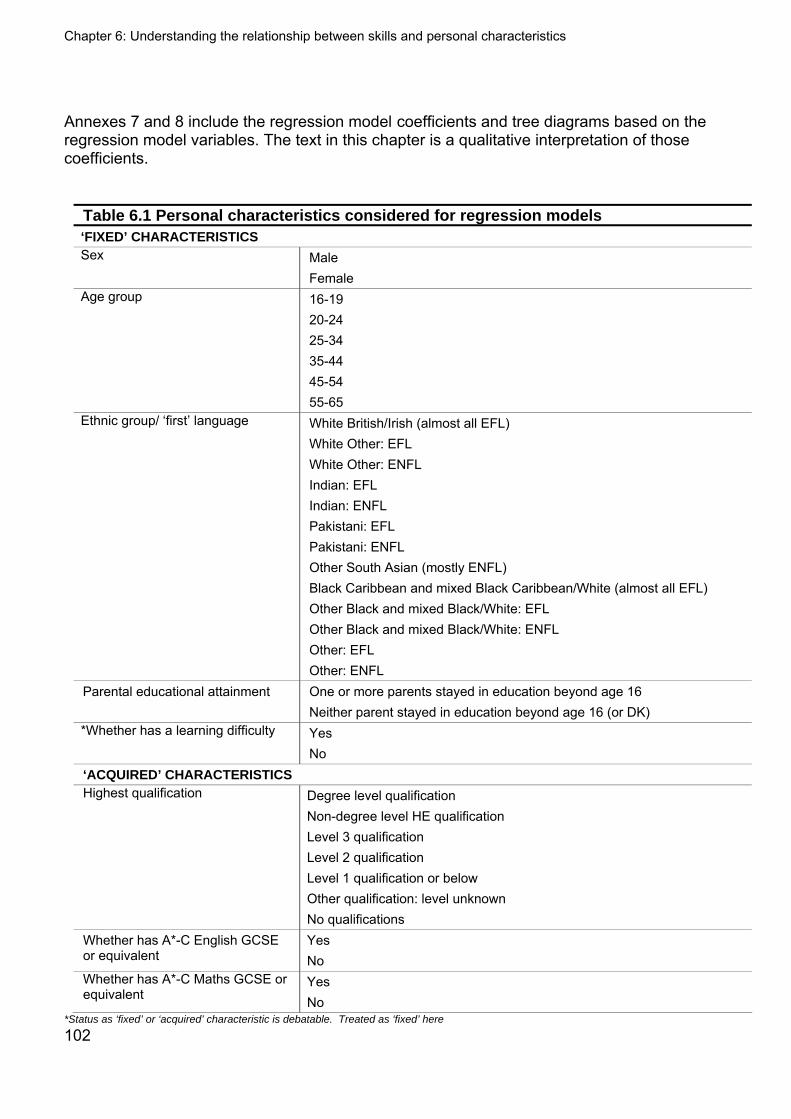
Chapter 6: Understanding the relationship between skills and personal characteristics
102
Annexes 7 and 8 include the regression model coefficients and tree diagrams based on the regression model variables. The text in this chapter is a qualitative interpretation of those coefficients.
Table 6.1 Personal characteristics considered for regression models ‘FIXED’ CHARACTERISTICS Sex Male
Female Age group 16-19
20-24 25-34 35-44 45-54 55-65
Ethnic group/ ‘first’ language White British/Irish (almost all EFL) White Other: EFL White Other: ENFL Indian: EFL Indian: ENFL Pakistani: EFL Pakistani: ENFL Other South Asian (mostly ENFL) Black Caribbean and mixed Black Caribbean/White (almost all EFL) Other Black and mixed Black/White: EFL Other Black and mixed Black/White: ENFL Other: EFL Other: ENFL
Parental educational attainment One or more parents stayed in education beyond age 16 Neither parent stayed in education beyond age 16 (or DK)
*Whether has a learning difficulty Yes No
‘ACQUIRED’ CHARACTERISTICS Highest qualification Degree level qualification
Non-degree level HE qualification Level 3 qualification Level 2 qualification Level 1 qualification or below Other qualification: level unknown No qualifications
Whether has A*-C English GCSE or equivalent
Yes No
Whether has A*-C Maths GCSE or equivalent
Yes No
*Status as ‘fixed’ or ‘acquired’ characteristic is debatable. Treated as ‘fixed’ here
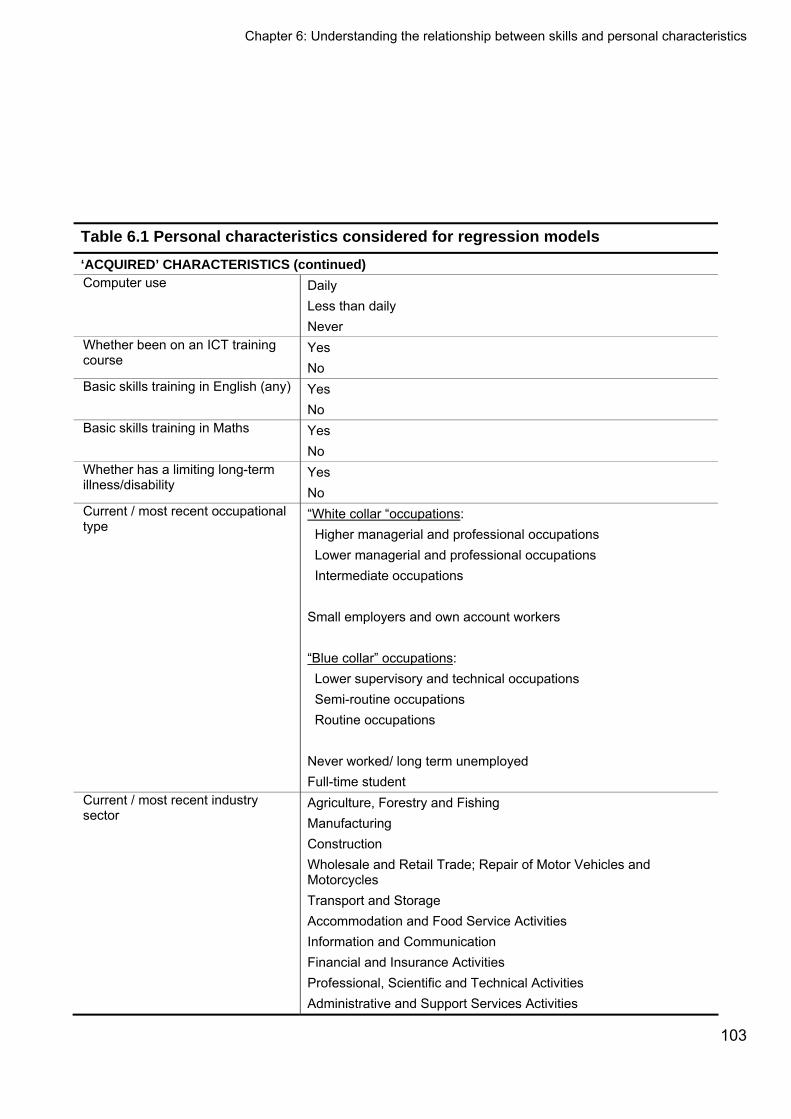
Chapter 6: Understanding the relationship between skills and personal characteristics
103
Table 6.1 Personal characteristics considered for regression models
‘ACQUIRED’ CHARACTERISTICS (continued) Computer use Daily
Less than daily Never
Whether been on an ICT training course
Yes No
Basic skills training in English (any) Yes No
Basic skills training in Maths Yes No
Whether has a limiting long-term illness/disability
Yes No
Current / most recent occupational type
“White collar “occupations: Higher managerial and professional occupations Lower managerial and professional occupations Intermediate occupations Small employers and own account workers “Blue collar” occupations: Lower supervisory and technical occupations Semi-routine occupations Routine occupations Never worked/ long term unemployed Full-time student
Current / most recent industry sector
Agriculture, Forestry and Fishing Manufacturing Construction Wholesale and Retail Trade; Repair of Motor Vehicles and Motorcycles Transport and Storage Accommodation and Food Service Activities Information and Communication Financial and Insurance Activities Professional, Scientific and Technical Activities Administrative and Support Services Activities
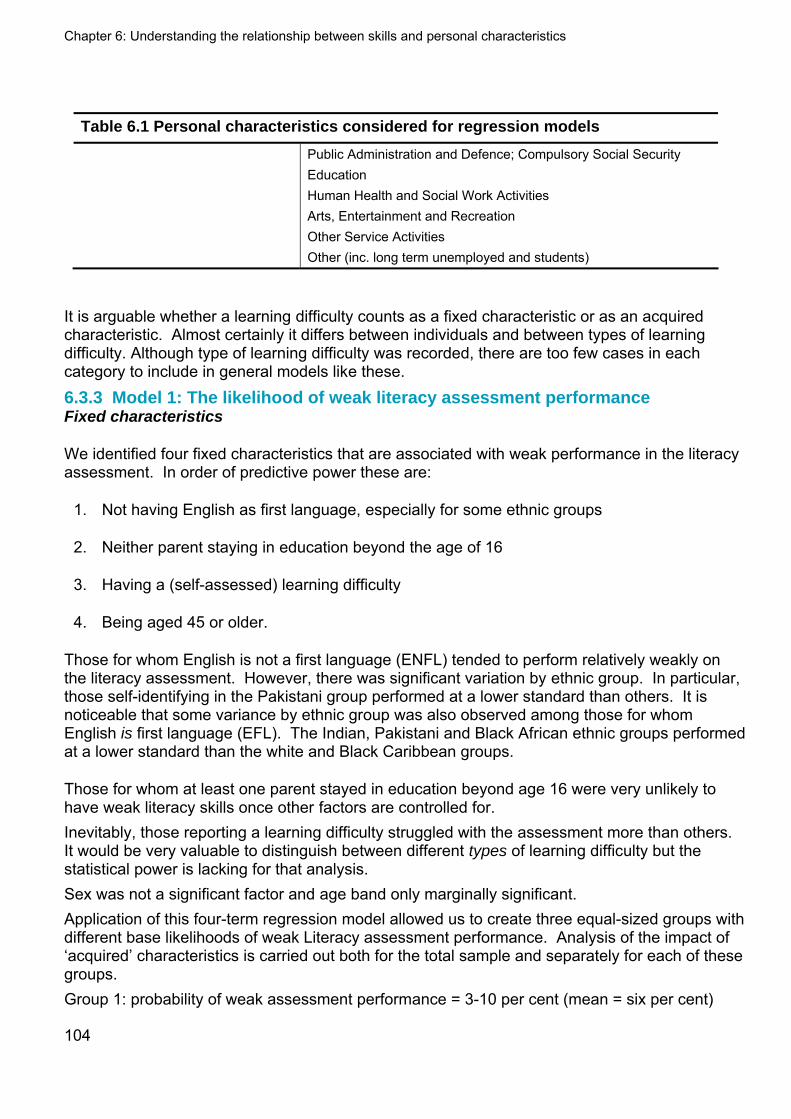
Chapter 6: Understanding the relationship between skills and personal characteristics
104
Table 6.1 Personal characteristics considered for regression models
Public Administration and Defence; Compulsory Social Security Education Human Health and Social Work Activities Arts, Entertainment and Recreation Other Service Activities Other (inc. long term unemployed and students)
It is arguable whether a learning difficulty counts as a fixed characteristic or as an acquired characteristic. Almost certainly it differs between individuals and between types of learning difficulty. Although type of learning difficulty was recorded, there are too few cases in each category to include in general models like these. 6.3.3 Model 1: The likelihood of weak literacy assessment performance Fixed characteristics
We identified four fixed characteristics that are associated with weak performance in the literacy assessment. In order of predictive power these are:
1. Not having English as first language, especially for some ethnic groups
2. Neither parent staying in education beyond the age of 16
3. Having a (self-assessed) learning difficulty
4. Being aged 45 or older.
Those for whom English is not a first language (ENFL) tended to perform relatively weakly on the literacy assessment. However, there was significant variation by ethnic group. In particular, those self-identifying in the Pakistani group performed at a lower standard than others. It is noticeable that some variance by ethnic group was also observed among those for whom English is first language (EFL). The Indian, Pakistani and Black African ethnic groups performed at a lower standard than the white and Black Caribbean groups.
Those for whom at least one parent stayed in education beyond age 16 were very unlikely to have weak literacy skills once other factors are controlled for. Inevitably, those reporting a learning difficulty struggled with the assessment more than others. It would be very valuable to distinguish between different types of learning difficulty but the statistical power is lacking for that analysis. Sex was not a significant factor and age band only marginally significant. Application of this four-term regression model allowed us to create three equal-sized groups with different base likelihoods of weak Literacy assessment performance. Analysis of the impact of ‘acquired’ characteristics is carried out both for the total sample and separately for each of these groups. Group 1: probability of weak assessment performance = 3-10 per cent (mean = six per cent)

Chapter 6: Understanding the relationship between skills and personal characteristics
105
Group 2: probability of weak assessment performance = 10-14 per cent (mean = 12 per cent) Group 3: probability of weak assessment performance = 14-89 per cent (mean = 26 per cent) Model fit (fixed characteristics only)
The total explanatory power was 17.1 per cent. This is allocated as follows: ethnic group/language (11.4 per cent), parental education (2.7 per cent), learning difficulty status (2.4 per cent), age-band (0.6 per cent). There are no obvious problems with model fit. Acquired characteristics
We identified six acquired characteristics that are associated with weak performance in the literacy assessment. In order of predictive power these are:
1. Working in some industry sectors (although cannot draw firm conclusions about which ones are most closely associated with weak assessment performance )
2. Infrequent or zero use of computers
3. Highest qualification is rated at Level 1 or below
4. No English GCSE/equivalent A*-C
5. Working in routine occupations (or long-term unemployed)
6. Never been on an ICT course
In terms of industry sector, even with a fairly large survey like the Skills for Life 2011 Survey (SfL2011), the sample size per industry sector is small so conclusions can only be tentative. Working in the Education and Public sector administrative sectors appears to lessen the odds of weak assessment performance but there are no other significant sector-level findings despite the strong influence of the variable as a whole. Those using computers every day tended to achieve a higher Literacy Level than others, and those with any experience of computers performed better than those who had never used a computer. These associations survive even when controlling for other factors suggesting that frequency of computer use is an important behavioural variable over and above education and work status. However, frequent computer use may be something that both promotes good literacy and follows from it (i.e. it has a circular, reinforcing quality). The association between highest qualification and literacy assessment performance is generally high but there is little difference between those with Level 2 qualifications and those with higher qualifications. Individuals with any of these qualifications were unlikely to perform weakly on the literacy assessment. The distinction between a highest qualification at Level 2 and a highest qualification at Level 1 is not particularly large but holding no qualifications (or an unclassifiable qualification) was strongly associated with weak performance.
As expected, holding a qualification relevant to literacy (a Level 2 English language qualification) is associated with better performance on the assessment, even controlling for general qualification level.
Chapter 6: Understanding the relationship between skills and personal characteristics
106
In terms of occupation, there appears to be a clear divide between what might be termed “white collar” and “blue collar” occupations, beyond that expected given educational level. This suggests that access to “white collar” work not only requires a good minimum standard of literacy but may also help individuals retain skills in a way that “blue collar” work does not. Within the “blue collar” group, those working in Routine occupations performed at a lower standard than those working in Semi-routine or Lower supervisory occupations. There was no such subgroup distinction within the “white collar” group. Basic skills training was not an influential factor and was excluded from the model. This counter-intuitive result may be explicable if the impact of such training is to bring students up to the average for their particular combination of personal characteristics. In this scenario, basic skills training does make a difference but its impact is hidden in a cross-sectional survey like this one. Ultimately, it requires longitudinal data or formal experimental data to tease out the truth. However, evidence of having undertaken an ICT training course was a positive indicator. ICT courses are somewhat different from basic skills courses because the attendees are not necessarily behind their statistical peers (those others with the same combination of personal characteristics). They may simply have greater motivation to improve their skills. Health status had no independent predictive power with regards to the literacy assessment.
Fixed and acquired characteristics model fit
Addition of these acquired variables nearly doubles the explanatory power of the model from 17.1 per cent to 35.6 per cent. In the full model, this is allocated as follows: ‘fixed’ characteristics (18.1 per cent), industry sector (3.7 per cent), computer use (3.4 per cent), highest qualification (3.3 per cent), whether has Level 2 English qualification (3.2 per cent), occupational category (2.9 per cent) and whether gone on an ICT course (1.0 per cent). Note that the allocation of explanatory power to the ‘fixed characteristics’ is slightly different once the acquired characteristics are added to the model. This is due to varied correlation between the acquired and fixed characteristics. There are no obvious problems with model fit. Differences between base groups
The higher the base likelihood of weak performance in the literacy assessment, the more important the acquired characteristics are. One way of looking at this is to compare the explanatory power of the full model for each of base groups 1, 2 and 3. This varies from 12 per cent for group 1 (the group with the lowest likelihood of weak assessment performance), to 25 per cent for group 2 and 42 per cent for group 3 (the group with the highest likelihood of weak assessment performance). The models for groups 1 and 2 can be minimised without losing significant explanatory power. For group 1, it is possible to base a model entirely on the education variables, suggesting that the work variables, while statistically significant in isolation, explain much the same variance as the education variables. In short, work status does not alter assessment performance expectations that are based solely upon knowledge of ‘fixed’ characteristics and educational level. For group 2, occupational category does have some additional predictive power (in the direction expected, although sample sizes are small for some categories) but industry sector is unimportant. Computer use is a strong predictor, something that was not the case for group 1.
Chapter 6: Understanding the relationship between skills and personal characteristics
107
Both work variables (occupational category and industry sector) form key and independent parts of the model for group 3 and, overall, have a slightly stronger influence than education. The directions of influence for both the work and education variables are more or less the same as for the total sample model but, interestingly, the influence of highest qualification is weaker for group 3 than it is for groups 1 and 2. Achievement of Level 2 or higher qualifications (as opposed to lower level qualifications) does not seem to make much difference for this group, although holding no qualifications at all remains associated with weak performance on the assessment. One crucial difference is in the influence of ‘fixed’ characteristics. Group 3 is highly varied in terms of the base likelihood of weak assessment performance, ranging from 14 per cent to 89 per cent. Given this range, it is not surprising that the ‘fixed’ characteristics retain their weight in the model.
6.3.4 Model 2: The likelihood of weak numeracy assessment performance Fixed characteristics
We identified five fixed characteristics that were associated with weak performance in the numeracy assessment. In order of predictive power these are:
1. Not having English as first language, especially for some ethnic groups
2. Having a (self-assessed) learning difficulty
3. Neither parent staying in education beyond the age of 16
4. Being female
5. Being aged 16 to 24 or 55 and older
Although this model has a number of similarities with the literacy model, there are some distinctive features. Firstly, language is less of a factor (although still sufficiently strong to be the lead predictor in the model) and secondly, some minority ethnic groups (e.g. Indian and the ‘White other’ and ‘other’ categories) perform at the same standard as the majority White British group once differences in first language status are controlled for. In the literacy model, all these groups were more likely to perform weakly on the assessment, even controlling for language status. Probably the most striking feature of the model is the inclusion of gender. Women were much more likely than men to be categorised below Entry Level 3 in the numeracy assessment. Another feature is the slightly u-shaped age effect in which both the oldest and youngest generations performed relatively weakly on the assessment. Application of this five-term regression model allowed us to create three groups with different base likelihoods of weak numeracy assessment performance: Group 1: 4-18 per cent (mean = 14 per cent)
Group 2: 18-26 per cent (mean = 22 per cent)
Group 3: 26-87 per cent (mean = 36 per cent)

Chapter 6: Understanding the relationship between skills and personal characteristics
108
Model fit (fixed characteristics only)
The total explanatory power was 11.9 per cent, lower than for the literacy model (17.1 per cent). This is allocated as follows: ethnic group/language (4.8 per cent), learning difficulty status (2.7 per cent), parental education (2.7 per cent), gender (1.1 per cent), age-band (0.6 per cent). There are no obvious problems with model fit. Acquired characteristics
We identified five acquired characteristics that were associated with weak performance in the numeracy assessment. In order of predictive power these are:
1. No Maths GCSE/equivalent A*-C
2. Highest qualification is rated at Level 2 or below
3. Infrequent or zero computer use
4. Working in particular industry sectors (although the patterning is unclear)
5. Working in lower supervisory or semi-routine and routine occupations (or long-term unemployed)
The association between highest qualification and numeracy is high. Holding any qualifications at all is a significant advantage over holding none and holding Level 3 qualifications and above is a significant advantage over holding lower qualifications. A degree is particularly valuable in this context. As expected, holding a qualification relevant to numeracy (a Level 2 maths qualification) is associated with better performance on the assessment, even controlling for general qualification level. In terms of work, there appears to be a moderate divide between “white collar” and “blue collar” occupations, just as there was with literacy. Working in routine occupations in particular is associated with weaker performance on the numeracy assessment, beyond that expected given educational level. However, while with literacy there was no strong distinction between “white collar” categories, here we find that those in the higher professional or managerial occupations score significantly better than those in other “white collar” work. This either suggests that senior “white collar” work helps individuals retain numeracy skills or that a high standard of numeracy is one of the keys to seniority. As with literacy, the sample size per industry sector is often small so specific conclusions - beyond the bland observation that industry sector seems to matter – are hard to find. Working in the ‘education’, ‘public sector administration’ and ‘finance’ sectors appears to lessen the odds of weak assessment performance. The first two were also associated with strong literacy skills but the addition of ‘finance’ makes intuitive sense. As with literacy, those using computers frequently tended to achieve a higher assessment score than others, controlling for educational and work status. Basic skills training in maths or numeracy was not an influential factor and was excluded from the model. This mirrors the literacy model and might be explained in the same way, namely that the impact of such training may be to bring students up to the average for their particular
Chapter 6: Understanding the relationship between skills and personal characteristics
109
combination of personal characteristics. However, it requires longitudinal data or formal experimental data to make any firm quantifying statements about the ‘impact’ of such training. Fixed and acquired characteristics model fit
Addition of these acquired variables nearly doubles the explanatory power of the model from 11.9 per cent to 29.5 per cent. In the full model, this is allocated as follows: ‘fixed’ characteristics (10.6 per cent), whether has Level 2 maths qualification (5.7 per cent), highest qualification (4.8 per cent), computer use (3.3 per cent), industry sector (2.8 per cent), and occupational category (2.3 per cent). There are no obvious problems with model fit. Differences between base groups
With literacy, we saw that the higher the likelihood of weak assessment performance in each base group, the more important the acquired characteristics are. However, there is much less variation with numeracy. The explanatory power of the final model varied only from 22 per cent to 29 per cent (group 1: 22 per cent; group 2: 22 per cent; group 3: 29 per cent; for literacy, the range was 12-42 per cent).
Only the education and computer use variables were significant for group 1 (those with the lowest likelihood of having weak numeracy). This is a close fit with what was observed for literacy, albeit with an extra penalty if the individual had never used a computer.
For groups 2 and 3 (with medium / high probability of having weak numeracy), the balance shifts so that education and work have more equal weight in terms of predictive power. It is also noticeable that, for group 2, holding a Level 2 maths qualification matters a lot more than overall highest qualification. For group 1, highest qualification carries more weight.
The importance of frequent computer use is also a distinctive feature of the group 2 model, with much stronger penalties associated with infrequent or zero use. The reason for this is unclear.
There was some indication that having a limiting disability or illness is an additional drawback for group 3 but the penalty associated with this was not strong.
Finally, basic skills training was not a significant factor for any group.
6.3.5 Model 3: The likelihood of weak ICT assessment performance Fixed characteristics
We identified four fixed characteristics that were associated with weak ICT assessment performance. In order of predictive power these are:
1. Being from an older generation, with a decline in ability for each ten year age band from age 35 upwards
2. Neither parent staying in education beyond the age of 16
3. Not having English as first language
4. Having a (self-assessed) learning difficulty
Chapter 6: Understanding the relationship between skills and personal characteristics
110
The most striking difference between the ICT model and the literacy and numeracy models is the dominant influence of age. It carries two thirds of the model’s explanatory power. Those aged between 16 and 34 year were much less likely than older individuals to perform weakly on the ICT assessment. Among older people, there was a clear distinction between those aged between 35 and 54 and those aged over 55 with the latter performing weakest of all. However, this is also clear from simple bivariate tables (see Section 5.5.1). What is interesting is that factors like parental education and language – strong in the other models – are only of secondary importance in the ICT model. The strongest digital divide is between age groups, rather than between different backgrounds. Another notable facet of the model is the minor nature of the debit associated with learning difficulty. While presenting a significant barrier to good literacy and numeracy, it seems to be less important when it comes to ICT. Gender was not a significant factor and nor was ethnic group, once language is controlled for. Interaction terms would not have improved the model but this may be due to a lack of statistical power, given that the sample size is less than half that allocated to the literacy and numeracy assessments. Because of the smaller sample size, we have chosen not to separately analyse groups with different base likelihoods of weak ICT assessment performance. Model fit (fixed characteristics only)
The total explanatory power was 18.1 per cent. This is allocated as follows: age-band (11.3 per cent), parental education (3.3 per cent), language status (2.2 per cent), learning difficulty status (1.3 per cent). There are no obvious problems with model fit. Acquired characteristics
We identified six acquired characteristics that were associated with weak ICT assessment performance. In order of predictive power these are:
1. No qualifications
2. Not gone on an ICT course
3. “Blue collar” occupations or long-term unemployed
4. Working in some industry sectors (although patterning is unclear)
5. No Maths GCSE/equivalent A*-C
6. Limiting long-term illness or disability
The association between highest qualification and ICT assessment performance is high. Holding any qualifications at all is a significant advantage over holding none and the ‘return’ associated with a degree level qualification is greater still. However, distinctions between sub-degree qualifications did not matter greatly. Holding a Level 2 maths qualification reduced the likelihood of weak ICT assessment performance, possibly because there are many areas of maths that require ICT skills to implement so the skills go hand in hand.
Chapter 6: Understanding the relationship between skills and personal characteristics
111
Evidence of having undertaken an ICT training course is also a positive indicator. ICT courses are somewhat different from basic skills courses because the attendees are not necessarily behind their statistical peers (those others with the same combination of personal characteristics). They may simply have greater motivation to improve their skills. In terms of occupational categories, there is the same “white collar”/”blue collar” distinction as there was with numeracy but without the particular advantage that went with Higher professional or managerial occupations and without the particular disadvantage that went with Routine occupations.
Industry sector is a significant factor in the model but there is sufficient uncertainty around the specific sector coefficients to obscure any patterning. The strongest sector is ‘information and communication’ which at least makes intuitive sense. Finally, there was some indication that having a limiting disability or illness is an additional drawback but the strength of this association was not statistically significant. Fixed and acquired characteristics model fit
The addition of these acquired variables nearly triples the explanatory power of the model from 18.1 per cent to 47.0 per cent. In the full model, this is allocated as follows: highest qualification (11.1 per cent), ‘fixed’ characteristics (9.9 per cent), whether gone on an ICT course (9.6 per cent), occupational category (6.3 per cent), industry sector (4.7 per cent), whether has a Level 2 maths qualification (4.4 per cent), whether has a limiting long-term illness or disability (0.9 per cent). There are no obvious problems with model fit.
6.4 Simple Generational Analysis
6.4.1 Introduction In Chapter 5, between cohort differences were examined, by comparing the performance of the same age group in each survey (e.g. those aged 16-19 in 2003 with those aged 16-19 in 2011. However, as the same literacy and numeracy assessments were used in both the Skills for Life 2003 survey (SfL2003) and SfL2011, this also allows us to compare assessment performance for the same generation separated by an eight year interval (a passage-of-time analysis), albeit with the important limitation that the survey respondents are not the same. Instead, we compare two samples drawn from the same generation but eight years apart. We have defined five generations that are covered in both surveys.138 Table 6.2 shows the generation definitions.
138 There is a sixth generation: those aged 55-57 in 2003 and 63-65 in 2011. However, this is too small a group to include in this analysis.
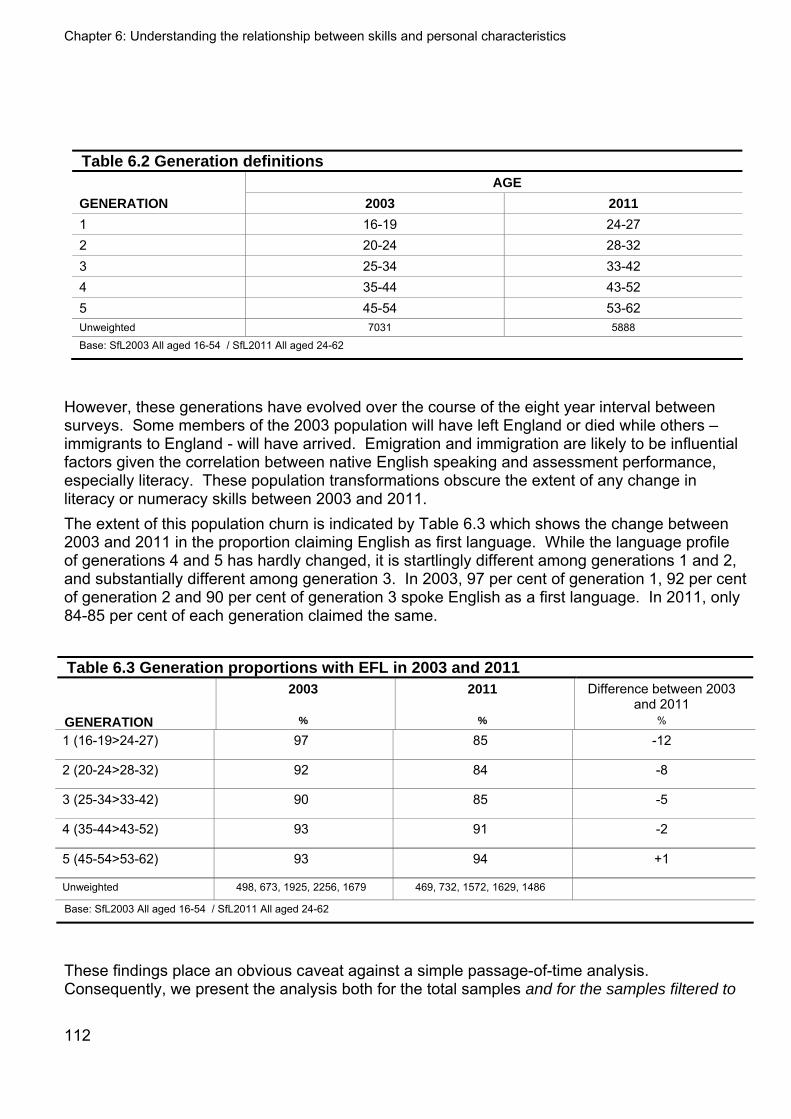
Chapter 6: Understanding the relationship between skills and personal characteristics
112
Table 6.2 Generation definitions AGE
GENERATION 2003 2011
1 16-19 24-27 2 20-24 28-32 3 25-34 33-42 4 35-44 43-52 5 45-54 53-62 Unweighted 7031 5888
Base: SfL2003 All aged 16-54 / SfL2011 All aged 24-62
However, these generations have evolved over the course of the eight year interval between surveys. Some members of the 2003 population will have left England or died while others – immigrants to England - will have arrived. Emigration and immigration are likely to be influential factors given the correlation between native English speaking and assessment performance, especially literacy. These population transformations obscure the extent of any change in literacy or numeracy skills between 2003 and 2011. The extent of this population churn is indicated by Table 6.3 which shows the change between 2003 and 2011 in the proportion claiming English as first language. While the language profile of generations 4 and 5 has hardly changed, it is startlingly different among generations 1 and 2, and substantially different among generation 3. In 2003, 97 per cent of generation 1, 92 per cent of generation 2 and 90 per cent of generation 3 spoke English as a first language. In 2011, only 84-85 per cent of each generation claimed the same.
Table 6.3 Generation proportions with EFL in 2003 and 2011 2003 2011 Difference between 2003
and 2011 GENERATION % % %
1 (16-19>24-27) 97 85 -12
2 (20-24>28-32) 92 84 -8
3 (25-34>33-42) 90 85 -5
4 (35-44>43-52) 93 91 -2
5 (45-54>53-62) 93 94 +1
Unweighted 498, 673, 1925, 2256, 1679 469, 732, 1572, 1629, 1486
Base: SfL2003 All aged 16-54 / SfL2011 All aged 24-62
These findings place an obvious caveat against a simple passage-of-time analysis. Consequently, we present the analysis both for the total samples and for the samples filtered to
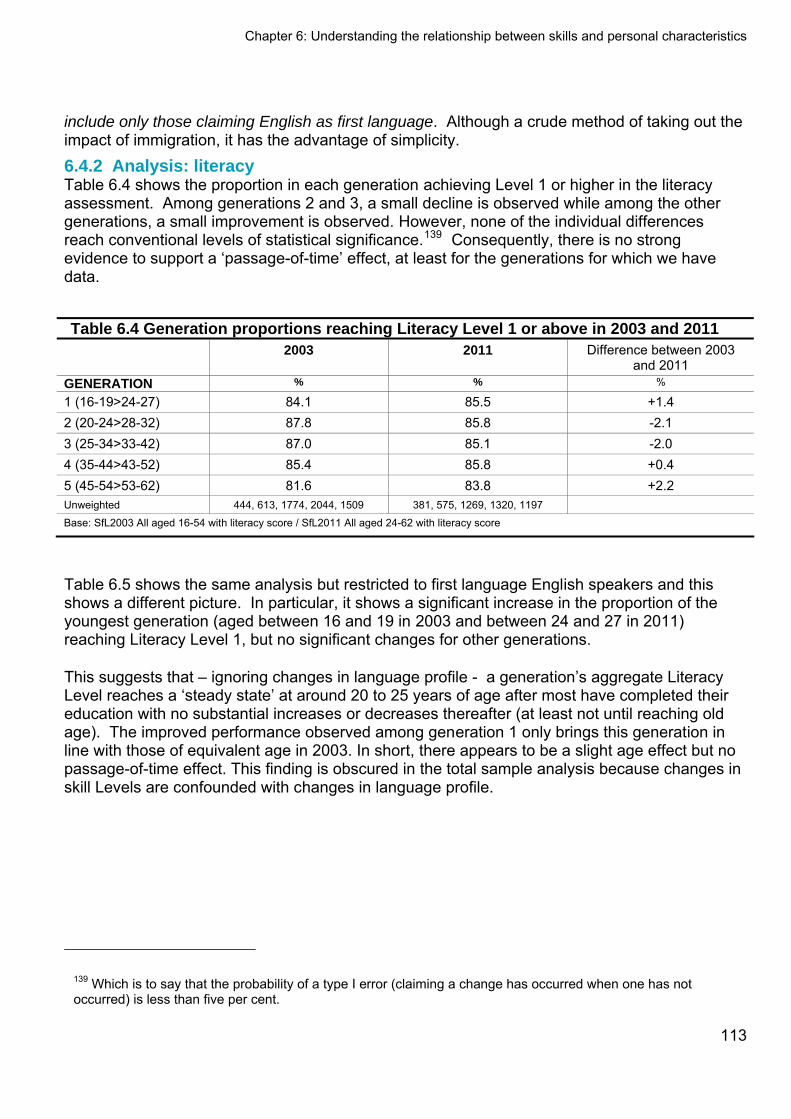
Chapter 6: Understanding the relationship between skills and personal characteristics
113
include only those claiming English as first language. Although a crude method of taking out the impact of immigration, it has the advantage of simplicity. 6.4.2 Analysis: literacy Table 6.4 shows the proportion in each generation achieving Level 1 or higher in the literacy assessment. Among generations 2 and 3, a small decline is observed while among the other generations, a small improvement is observed. However, none of the individual differences reach conventional levels of statistical significance.139 Consequently, there is no strong evidence to support a ‘passage-of-time’ effect, at least for the generations for which we have data.
Table 6.4 Generation proportions reaching Literacy Level 1 or above in 2003 and 2011 2003 2011 Difference between 2003
and 2011 GENERATION % % %
1 (16-19>24-27) 84.1 85.5 +1.4 2 (20-24>28-32) 87.8 85.8 -2.1 3 (25-34>33-42) 87.0 85.1 -2.0 4 (35-44>43-52) 85.4 85.8 +0.4 5 (45-54>53-62) 81.6 83.8 +2.2 Unweighted 444, 613, 1774, 2044, 1509 381, 575, 1269, 1320, 1197
Base: SfL2003 All aged 16-54 with literacy score / SfL2011 All aged 24-62 with literacy score
Table 6.5 shows the same analysis but restricted to first language English speakers and this shows a different picture. In particular, it shows a significant increase in the proportion of the youngest generation (aged between 16 and 19 in 2003 and between 24 and 27 in 2011) reaching Literacy Level 1, but no significant changes for other generations.
This suggests that – ignoring changes in language profile - a generation’s aggregate Literacy Level reaches a ‘steady state’ at around 20 to 25 years of age after most have completed their education with no substantial increases or decreases thereafter (at least not until reaching old age). The improved performance observed among generation 1 only brings this generation in line with those of equivalent age in 2003. In short, there appears to be a slight age effect but no passage-of-time effect. This finding is obscured in the total sample analysis because changes in skill Levels are confounded with changes in language profile.
139 Which is to say that the probability of a type I error (claiming a change has occurred when one has not occurred) is less than five per cent.
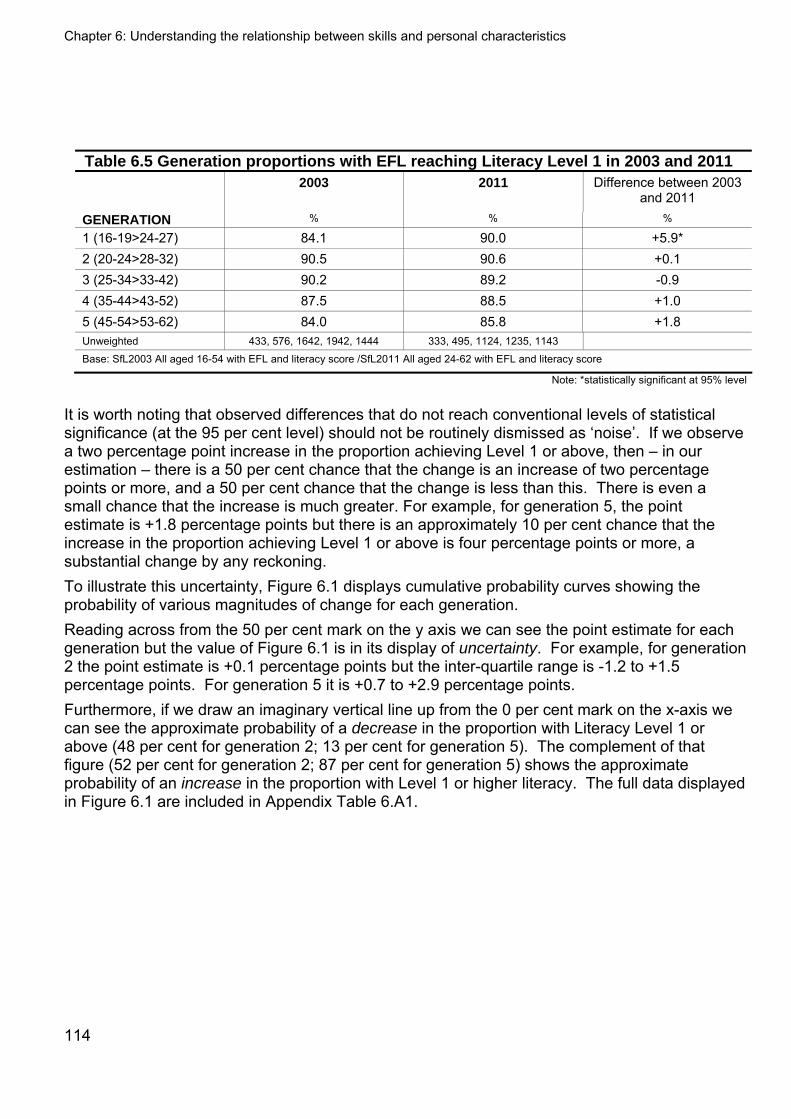
Chapter 6: Understanding the relationship between skills and personal characteristics
114
Table 6.5 Generation proportions with EFL reaching Literacy Level 1 in 2003 and 2011 2003 2011 Difference between 2003
and 2011 GENERATION % % %
1 (16-19>24-27) 84.1 90.0 +5.9* 2 (20-24>28-32) 90.5 90.6 +0.1 3 (25-34>33-42) 90.2 89.2 -0.9 4 (35-44>43-52) 87.5 88.5 +1.0 5 (45-54>53-62) 84.0 85.8 +1.8 Unweighted 433, 576, 1642, 1942, 1444 333, 495, 1124, 1235, 1143
Base: SfL2003 All aged 16-54 with EFL and literacy score /SfL2011 All aged 24-62 with EFL and literacy score
Note: *statistically significant at 95% level
It is worth noting that observed differences that do not reach conventional levels of statistical significance (at the 95 per cent level) should not be routinely dismissed as ‘noise’. If we observe a two percentage point increase in the proportion achieving Level 1 or above, then – in our estimation – there is a 50 per cent chance that the change is an increase of two percentage points or more, and a 50 per cent chance that the change is less than this. There is even a small chance that the increase is much greater. For example, for generation 5, the point estimate is +1.8 percentage points but there is an approximately 10 per cent chance that the increase in the proportion achieving Level 1 or above is four percentage points or more, a substantial change by any reckoning. To illustrate this uncertainty, Figure 6.1 displays cumulative probability curves showing the probability of various magnitudes of change for each generation. Reading across from the 50 per cent mark on the y axis we can see the point estimate for each generation but the value of Figure 6.1 is in its display of uncertainty. For example, for generation 2 the point estimate is +0.1 percentage points but the inter-quartile range is -1.2 to +1.5 percentage points. For generation 5 it is +0.7 to +2.9 percentage points. Furthermore, if we draw an imaginary vertical line up from the 0 per cent mark on the x-axis we can see the approximate probability of a decrease in the proportion with Literacy Level 1 or above (48 per cent for generation 2; 13 per cent for generation 5). The complement of that figure (52 per cent for generation 2; 87 per cent for generation 5) shows the approximate probability of an increase in the proportion with Level 1 or higher literacy. The full data displayed in Figure 6.1 are included in Appendix Table 6.A1.
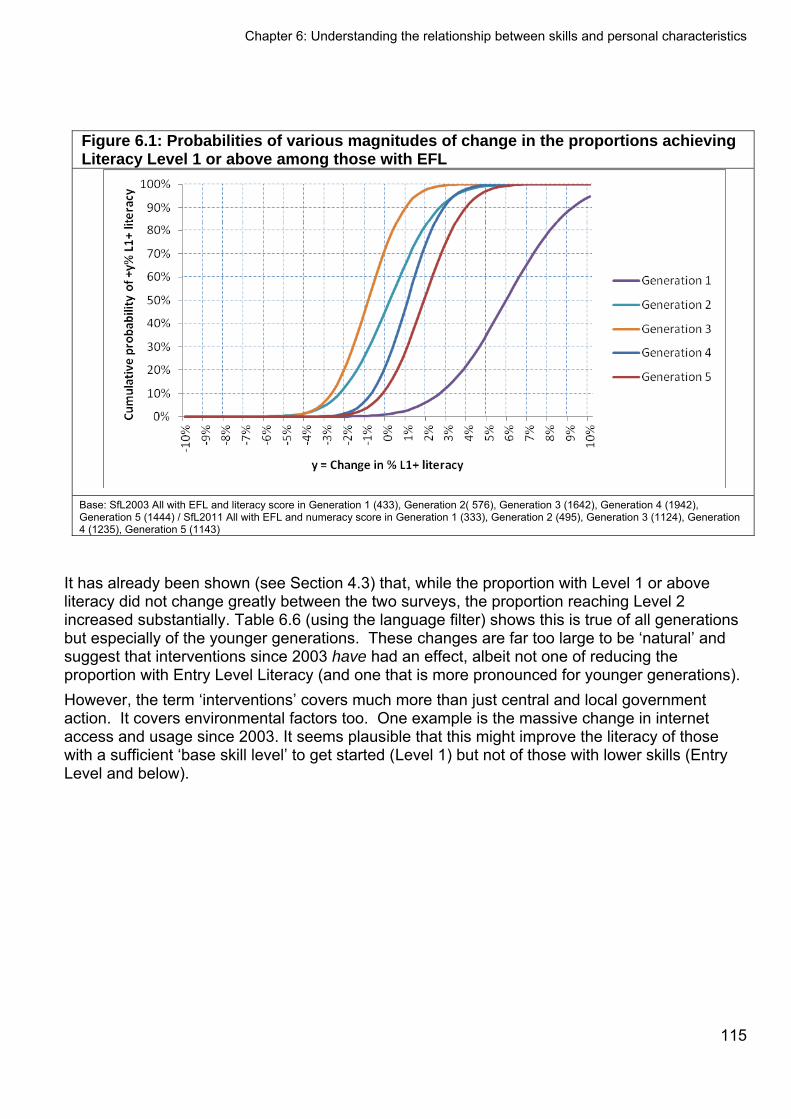
Chapter 6: Understanding the relationship between skills and personal characteristics
Figure 6.1: Probabilities of various magnitudes of change in the proportions achieving Literacy Level 1 or above among those with EFL
Base: SfL2003 All with EFL and literacy score in Generation 1 (433), Generation 2( 576), Generation 3 (1642), Generation 4 (1942), Generation 5 (1444) / SfL2011 All with EFL and numeracy score in Generation 1 (333), Generation 2 (495), Generation 3 (1124), Generation 4 (1235), Generation 5 (1143)
It has already been shown (see Section 4.3) that, while the proportion with Level 1 or above literacy did not change greatly between the two surveys, the proportion reaching Level 2 increased substantially. Table 6.6 (using the language filter) shows this is true of all generations but especially of the younger generations. These changes are far too large to be ‘natural’ and suggest that interventions since 2003 have had an effect, albeit not one of reducing the proportion with Entry Level Literacy (and one that is more pronounced for younger generations). However, the term ‘interventions’ covers much more than just central and local government action. It covers environmental factors too. One example is the massive change in internet access and usage since 2003. It seems plausible that this might improve the literacy of those with a sufficient ‘base skill level’ to get started (Level 1) but not of those with lower skills (Entry Level and below).
115
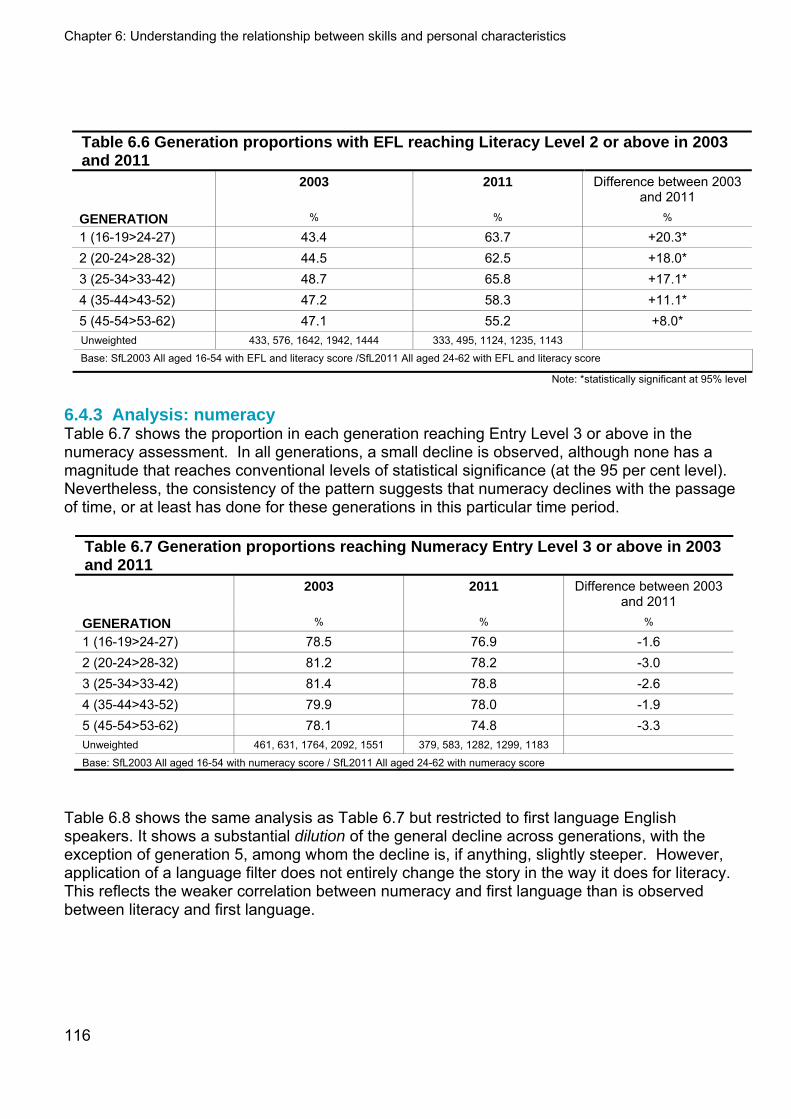
Chapter 6: Understanding the relationship between skills and personal characteristics
116
Table 6.6 Generation proportions with EFL reaching Literacy Level 2 or above in 2003 and 2011 2003 2011 Difference between 2003
and 2011 GENERATION % % %
1 (16-19>24-27) 43.4 63.7 +20.3* 2 (20-24>28-32) 44.5 62.5 +18.0* 3 (25-34>33-42) 48.7 65.8 +17.1* 4 (35-44>43-52) 47.2 58.3 +11.1* 5 (45-54>53-62) 47.1 55.2 +8.0* Unweighted 433, 576, 1642, 1942, 1444 333, 495, 1124, 1235, 1143
Base: SfL2003 All aged 16-54 with EFL and literacy score /SfL2011 All aged 24-62 with EFL and literacy score
Note: *statistically significant at 95% level
6.4.3 Analysis: numeracy Table 6.7 shows the proportion in each generation reaching Entry Level 3 or above in the numeracy assessment. In all generations, a small decline is observed, although none has a magnitude that reaches conventional levels of statistical significance (at the 95 per cent level). Nevertheless, the consistency of the pattern suggests that numeracy declines with the passage of time, or at least has done for these generations in this particular time period.
Table 6.7 Generation proportions reaching Numeracy Entry Level 3 or above in 2003 and 2011 2003 2011 Difference between 2003
and 2011 GENERATION % % %
1 (16-19>24-27) 78.5 76.9 -1.6 2 (20-24>28-32) 81.2 78.2 -3.0 3 (25-34>33-42) 81.4 78.8 -2.6 4 (35-44>43-52) 79.9 78.0 -1.9 5 (45-54>53-62) 78.1 74.8 -3.3 Unweighted 461, 631, 1764, 2092, 1551 379, 583, 1282, 1299, 1183
Base: SfL2003 All aged 16-54 with numeracy score / SfL2011 All aged 24-62 with numeracy score
Table 6.8 shows the same analysis as Table 6.7 but restricted to first language English speakers. It shows a substantial dilution of the general decline across generations, with the exception of generation 5, among whom the decline is, if anything, slightly steeper. However, application of a language filter does not entirely change the story in the way it does for literacy. This reflects the weaker correlation between numeracy and first language than is observed between literacy and first language.
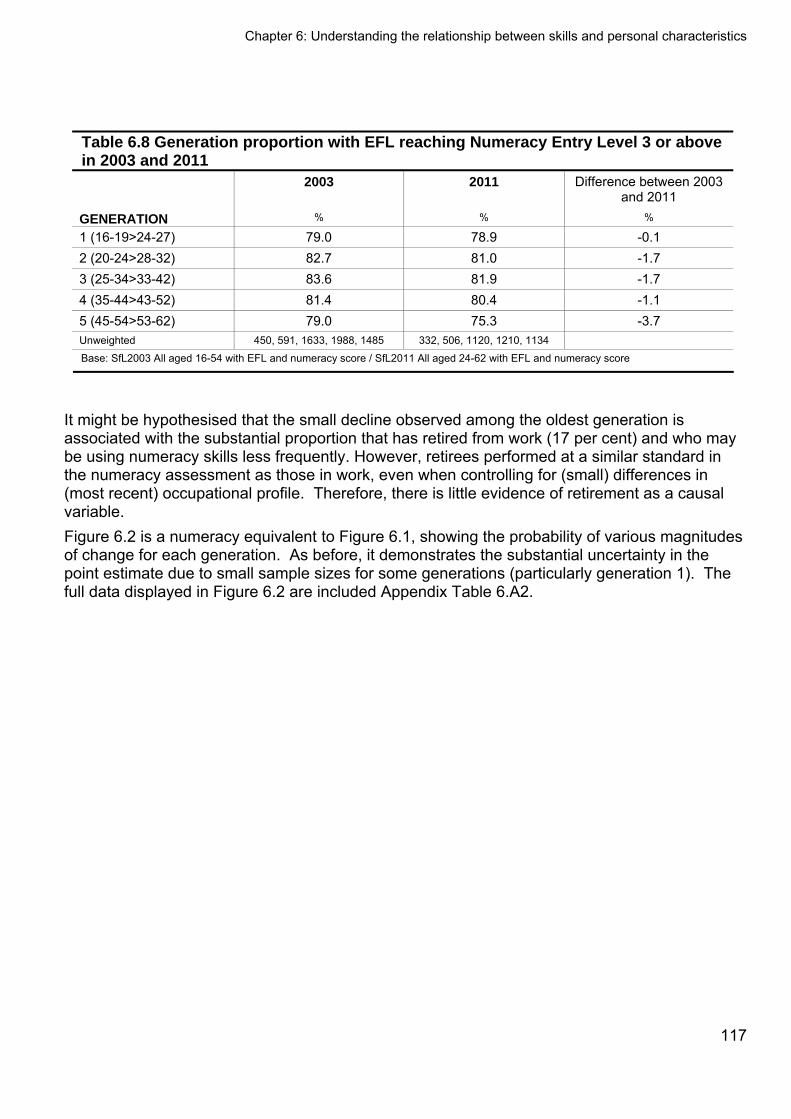
Chapter 6: Understanding the relationship between skills and personal characteristics
117
Table 6.8 Generation proportion with EFL reaching Numeracy Entry Level 3 or above in 2003 and 2011 2003 2011 Difference between 2003
and 2011 GENERATION % % %
1 (16-19>24-27) 79.0 78.9 -0.1 2 (20-24>28-32) 82.7 81.0 -1.7 3 (25-34>33-42) 83.6 81.9 -1.7 4 (35-44>43-52) 81.4 80.4 -1.1 5 (45-54>53-62) 79.0 75.3 -3.7 Unweighted 450, 591, 1633, 1988, 1485 332, 506, 1120, 1210, 1134
Base: SfL2003 All aged 16-54 with EFL and numeracy score / SfL2011 All aged 24-62 with EFL and numeracy score
It might be hypothesised that the small decline observed among the oldest generation is associated with the substantial proportion that has retired from work (17 per cent) and who may be using numeracy skills less frequently. However, retirees performed at a similar standard in the numeracy assessment as those in work, even when controlling for (small) differences in (most recent) occupational profile. Therefore, there is little evidence of retirement as a causal variable. Figure 6.2 is a numeracy equivalent to Figure 6.1, showing the probability of various magnitudes of change for each generation. As before, it demonstrates the substantial uncertainty in the point estimate due to small sample sizes for some generations (particularly generation 1). The full data displayed in Figure 6.2 are included Appendix Table 6.A2.
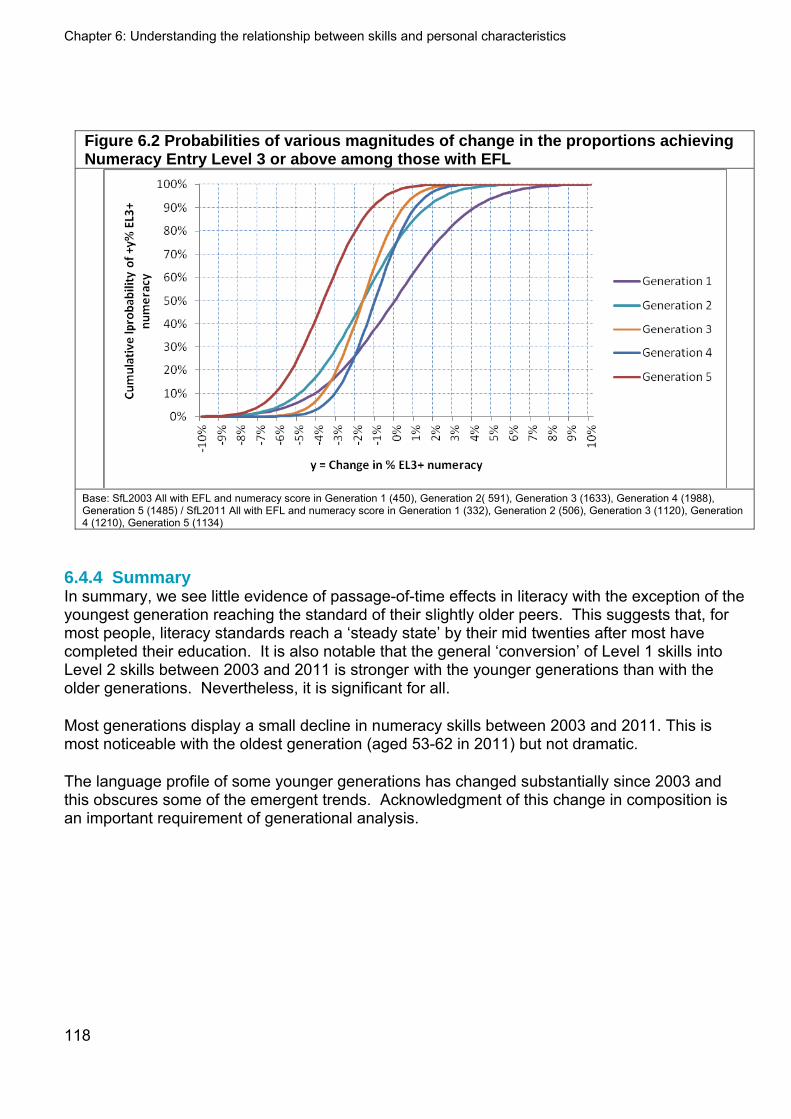
Chapter 6: Understanding the relationship between skills and personal characteristics
118
Figure 6.2 Probabilities of various magnitudes of change in the proportions achieving Numeracy Entry Level 3 or above among those with EFL
Base: SfL2003 All with EFL and numeracy score in Generation 1 (450), Generation 2( 591), Generation 3 (1633), Generation 4 (1988), Generation 5 (1485) / SfL2011 All with EFL and numeracy score in Generation 1 (332), Generation 2 (506), Generation 3 (1120), Generation 4 (1210), Generation 5 (1134)
6.4.4 Summary In summary, we see little evidence of passage-of-time effects in literacy with the exception of the youngest generation reaching the standard of their slightly older peers. This suggests that, for most people, literacy standards reach a ‘steady state’ by their mid twenties after most have completed their education. It is also notable that the general ‘conversion’ of Level 1 skills into Level 2 skills between 2003 and 2011 is stronger with the younger generations than with the older generations. Nevertheless, it is significant for all.
Most generations display a small decline in numeracy skills between 2003 and 2011. This is most noticeable with the oldest generation (aged 53-62 in 2011) but not dramatic.
The language profile of some younger generations has changed substantially since 2003 and this obscures some of the emergent trends. Acknowledgment of this change in composition is an important requirement of generational analysis.
Chapter 7: Education
119
7 Education
7.1 Key Findings
This chapter explores the relationship between formal education and basic skills.
Terminal education age has increased since 2003 with respondents tending to participate in education longer. Older respondents were still more likely to have left education earlier than younger respondents.
Terminal education age was linked to literacy, numeracy and ICT skills, with respondents with higher terminal education ages tending to score higher on the skills assessments.
For numeracy, a decline in the proportion achieving Entry Level 3 or below was only evident amongst respondents who left education between the ages of 15 to 21 (however, the majority of respondents completed their education between these ages).
More respondents held qualifications than in 2003, with only 11 per cent not holding any qualifications. In terms of the qualifications held, there has been an increase in the proportion possessing a degree level or above qualification from 19 per cent to 24 per cent. Possession of qualifications was linked to employment status and gender.
In line with 2003, generally the higher the qualification held, the more highly respondents tended to score on the literacy, numeracy and ICT assessments.
Respondents aged 16-24 whose highest qualification was at Level 3 had particularly strong literacy, when compared both against their older counterparts and against 16-24 year-olds who held a different highest qualification (both at lower and higher levels, i.e. Level 2 and below or Level 4 and above).
Highest qualifications were linked with employment and frequency of computer use. However, even when controlling for this, variation in ICT performance was still apparent suggesting that qualifications held do have an impact on ICT skills.
Unsurprisingly, possession of an English Language GCSE (or equivalent) at grade C or above was linked to stronger performance on the literacy assessment. Those who held a Maths GCSE (or equivalent) grade C or above qualification were more likely than others to perform well in the numeracy assessment.
Respondents’ education was found to play a larger role in relation to literacy, numeracy and ICT skills than parental education. However, parental education appeared to play a role in literacy and numeracy (but not ICT skills) in the presence of low or no qualifications.
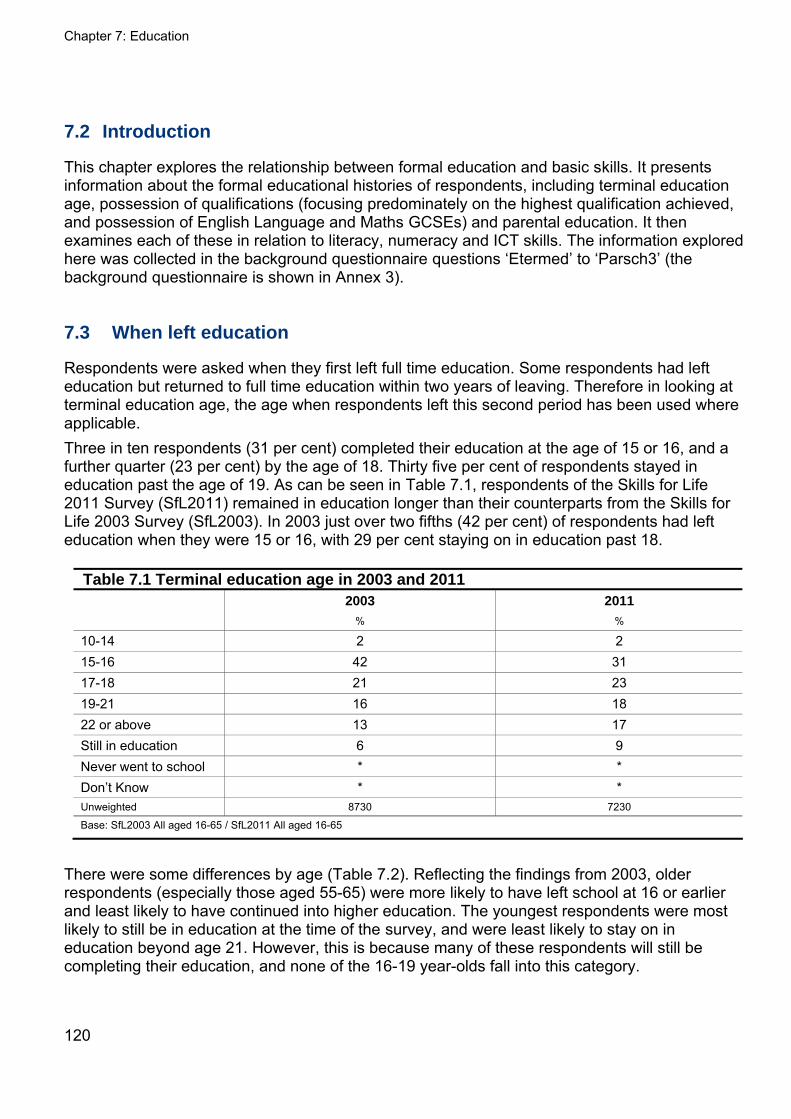
Chapter 7: Education
120
7.2 Introduction
This chapter explores the relationship between formal education and basic skills. It presents information about the formal educational histories of respondents, including terminal education age, possession of qualifications (focusing predominately on the highest qualification achieved, and possession of English Language and Maths GCSEs) and parental education. It then examines each of these in relation to literacy, numeracy and ICT skills. The information explored here was collected in the background questionnaire questions ‘Etermed’ to ‘Parsch3’ (the background questionnaire is shown in Annex 3).
7.3 When left education
Respondents were asked when they first left full time education. Some respondents had left education but returned to full time education within two years of leaving. Therefore in looking at terminal education age, the age when respondents left this second period has been used where applicable. Three in ten respondents (31 per cent) completed their education at the age of 15 or 16, and a further quarter (23 per cent) by the age of 18. Thirty five per cent of respondents stayed in education past the age of 19. As can be seen in Table 7.1, respondents of the Skills for Life 2011 Survey (SfL2011) remained in education longer than their counterparts from the Skills for Life 2003 Survey (SfL2003). In 2003 just over two fifths (42 per cent) of respondents had left education when they were 15 or 16, with 29 per cent staying on in education past 18.
Table 7.1 Terminal education age in 2003 and 2011 2003 2011
% %
10-14 2 2 15-16 42 31 17-18 21 23 19-21 16 18 22 or above 13 17 Still in education 6 9 Never went to school * * Don’t Know * * Unweighted 8730 7230
Base: SfL2003 All aged 16-65 / SfL2011 All aged 16-65
There were some differences by age (Table 7.2). Reflecting the findings from 2003, older respondents (especially those aged 55-65) were more likely to have left school at 16 or earlier and least likely to have continued into higher education. The youngest respondents were most likely to still be in education at the time of the survey, and were least likely to stay on in education beyond age 21. However, this is because many of these respondents will still be completing their education, and none of the 16-19 year-olds fall into this category.
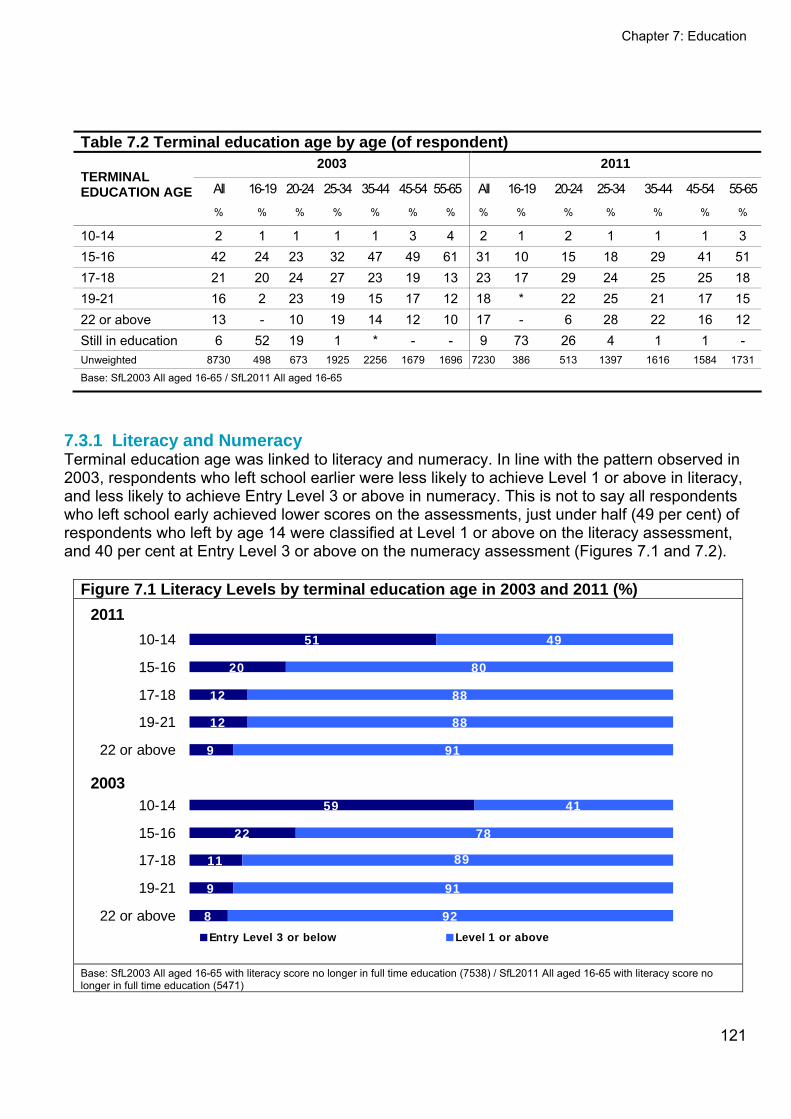
Chapter 7: Education
Table 7.2 Terminal education age by age (of respondent)
2003 2011
All 16-19 20-24 25-34 35-44 45-54 55-65 All 16-19 20-24 25-34 35-44 45-54 55-65 TERMINAL EDUCATION AGE
% % % % % % % % % % % % % %
10-14 2 1 1 1 1 3 4 2 1 2 1 1 1 3 15-16 42 24 23 32 47 49 61 31 10 15 18 29 41 51 17-18 21 20 24 27 23 19 13 23 17 29 24 25 25 18 19-21 16 2 23 19 15 17 12 18 * 22 25 21 17 15 22 or above 13 - 10 19 14 12 10 17 - 6 28 22 16 12 Still in education 6 52 19 1 * - - 9 73 26 4 1 1 - Unweighted 8730 498 673 1925 2256 1679 1696 7230 386 513 1397 1616 1584 1731
Base: SfL2003 All aged 16-65 / SfL2011 All aged 16-65
7.3.1 Literacy and Numeracy Terminal education age was linked to literacy and numeracy. In line with the pattern observed in 2003, respondents who left school earlier were less likely to achieve Level 1 or above in literacy, and less likely to achieve Entry Level 3 or above in numeracy. This is not to say all respondents who left school early achieved lower scores on the assessments, just under half (49 per cent) of respondents who left by age 14 were classified at Level 1 or above on the literacy assessment, and 40 per cent at Entry Level 3 or above on the numeracy assessment (Figures 7.1 and 7.2).
Figure 7.1 Literacy Levels by terminal education age in 2003 and 2011 (%)
8
9
11
22
59
9
12
12
20
51
92
91
89
78
41
91
88
88
80
49
22 or above
19-21
17-18
15-16
10-14
22 or above
19-21
17-18
15-16
10-14
Entry Level 3 or below Level 1 or above
2011
2003
Base: SfL2003 All aged 16-65 with literacy score no longer in full time education (7538) / SfL2011 All aged 16-65 with literacy score no longer in full time education (5471)
121
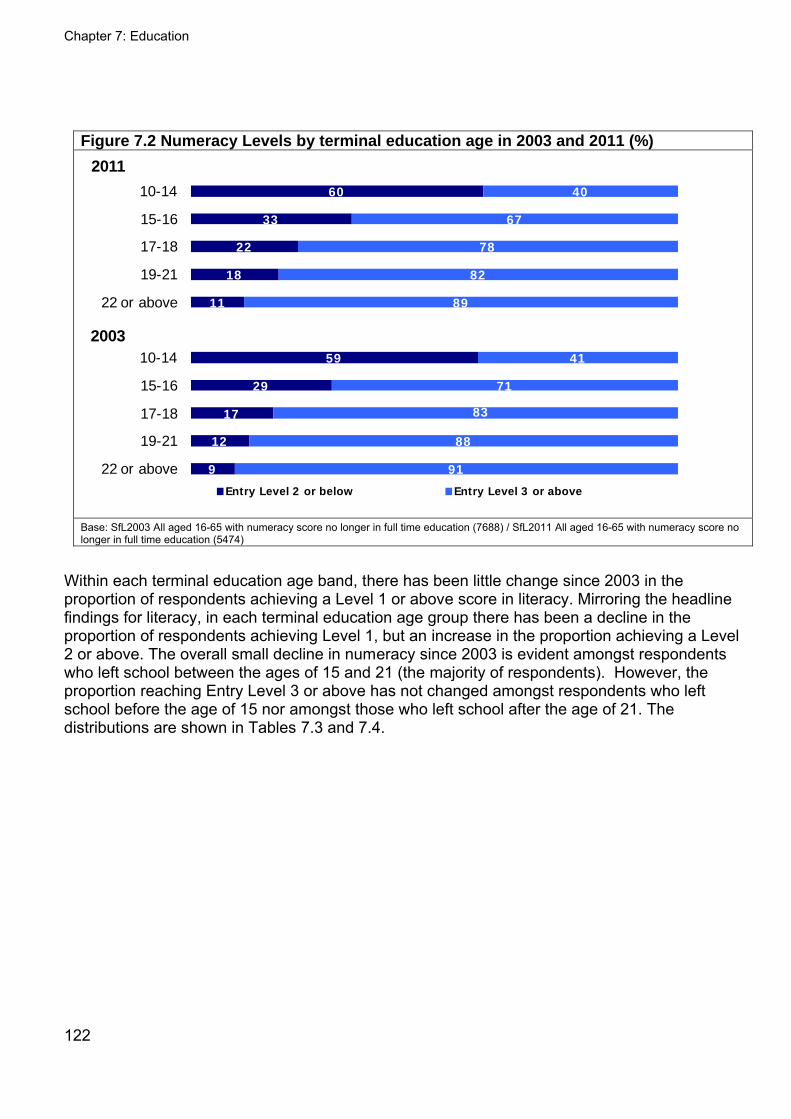
Chapter 7: Education
Figure 7.2 Numeracy Levels by terminal education age in 2003 and 2011 (%)
9
12
17
29
59
11
18
22
33
60
91
88
83
71
41
89
82
78
67
40
22 or above
19-21
17-18
15-16
10-14
22 or above
19-21
17-18
15-16
10-14
Entry Level 2 or below Entry Level 3 or above
2011
2003
Base: SfL2003 All aged 16-65 with numeracy score no longer in full time education (7688) / SfL2011 All aged 16-65 with numeracy score no longer in full time education (5474)
Within each terminal education age band, there has been little change since 2003 in the proportion of respondents achieving a Level 1 or above score in literacy. Mirroring the headline findings for literacy, in each terminal education age group there has been a decline in the proportion of respondents achieving Level 1, but an increase in the proportion achieving a Level 2 or above. The overall small decline in numeracy since 2003 is evident amongst respondents who left school between the ages of 15 and 21 (the majority of respondents). However, the proportion reaching Entry Level 3 or above has not changed amongst respondents who left school before the age of 15 nor amongst those who left school after the age of 21. The distributions are shown in Tables 7.3 and 7.4.
122
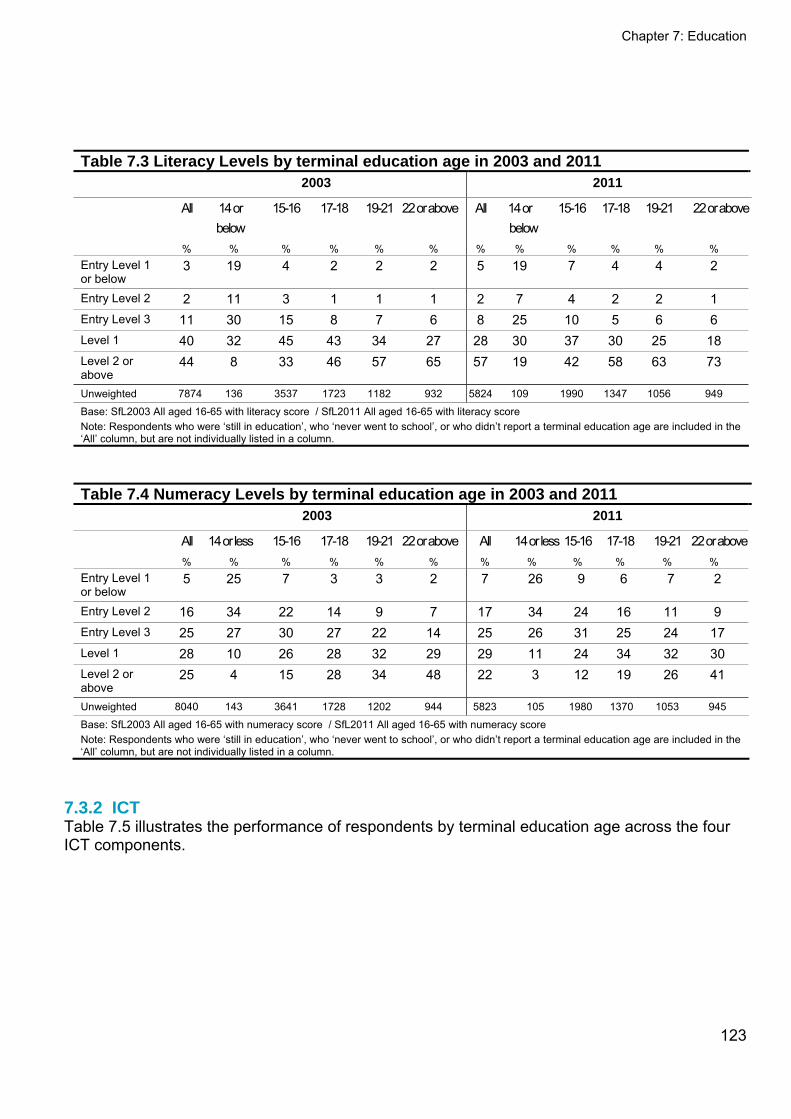
Chapter 7: Education
123
Table 7.3 Literacy Levels by terminal education age in 2003 and 2011 2003 2011
All 14 or below
15-16 17-18 19-21 22 or above All 14 or below
15-16 17-18 19-21 22 or above
% % % % % % % % % % % % Entry Level 1 or below
3 19 4 2 2 2 5 19 7 4 4 2
Entry Level 2 2 11 3 1 1 1 2 7 4 2 2 1 Entry Level 3 11 30 15 8 7 6 8 25 10 5 6 6 Level 1 40 32 45 43 34 27 28 30 37 30 25 18 Level 2 or above
44 8 33 46 57 65 57 19 42 58 63 73
Unweighted 7874 136 3537 1723 1182 932 5824 109 1990 1347 1056 949
Base: SfL2003 All aged 16-65 with literacy score / SfL2011 All aged 16-65 with literacy score Note: Respondents who were ‘still in education’, who ‘never went to school’, or who didn’t report a terminal education age are included in the ‘All’ column, but are not individually listed in a column.
Table 7.4 Numeracy Levels by terminal education age in 2003 and 2011 2003 2011
All 14 or less 15-16 17-18 19-21 22 or above All 14 or less 15-16 17-18 19-21 22 or above % % % % % % % % % % % % Entry Level 1 or below
5 25 7 3 3 2 7 26 9 6 7 2
Entry Level 2 16 34 22 14 9 7 17 34 24 16 11 9 Entry Level 3 25 27 30 27 22 14 25 26 31 25 24 17 Level 1 28 10 26 28 32 29 29 11 24 34 32 30 Level 2 or above
25 4 15 28 34 48 22 3 12 19 26 41
Unweighted 8040 143 3641 1728 1202 944 5823 105 1980 1370 1053 945
Base: SfL2003 All aged 16-65 with numeracy score / SfL2011 All aged 16-65 with numeracy score Note: Respondents who were ‘still in education’, who ‘never went to school’, or who didn’t report a terminal education age are included in the ‘All’ column, but are not individually listed in a column.
7.3.2 ICT Table 7.5 illustrates the performance of respondents by terminal education age across the four ICT components.
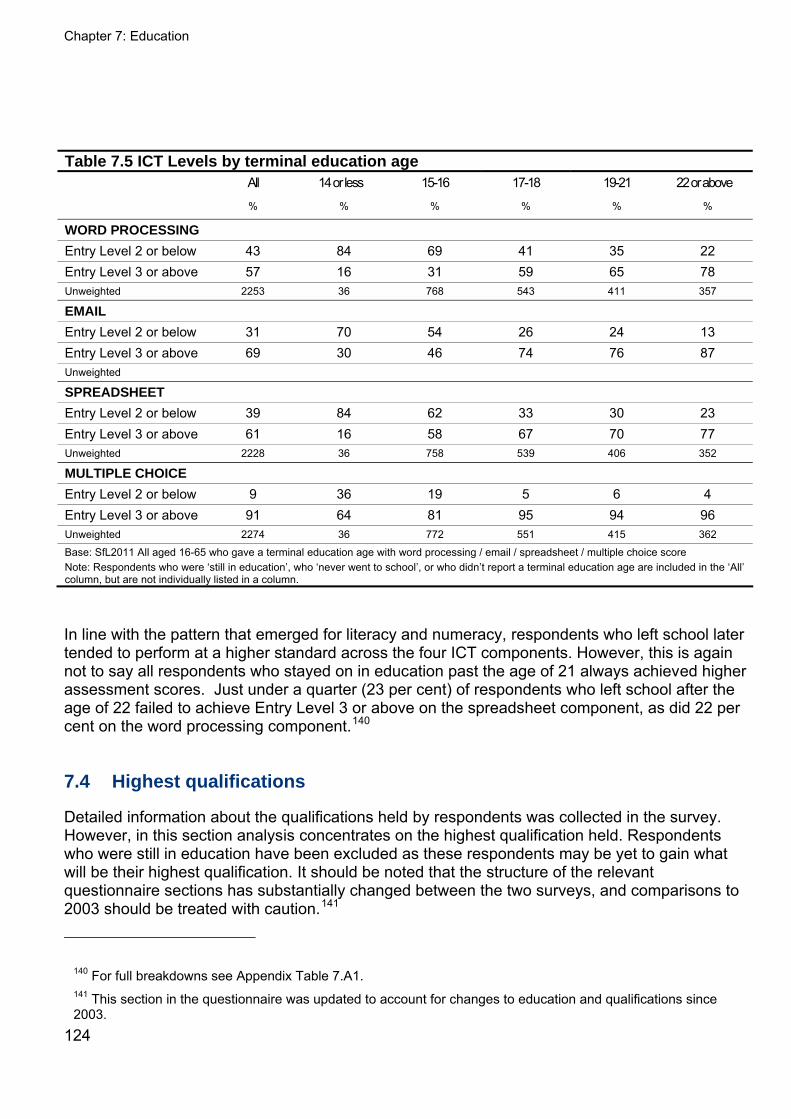
Chapter 7: Education
124
Table 7.5 ICT Levels by terminal education age All 14 or less 15-16 17-18 19-21 22 or above
% % % % % %
WORD PROCESSING
Entry Level 2 or below 43 84 69 41 35 22 Entry Level 3 or above 57 16 31 59 65 78 Unweighted 2253 36 768 543 411 357
Entry Level 2 or below 31 70 54 26 24 13 Entry Level 3 or above 69 30 46 74 76 87 Unweighted
SPREADSHEET
Entry Level 2 or below 39 84 62 33 30 23 Entry Level 3 or above 61 16 58 67 70 77 Unweighted 2228 36 758 539 406 352
MULTIPLE CHOICE Entry Level 2 or below 9 36 19 5 6 4 Entry Level 3 or above 91 64 81 95 94 96 Unweighted 2274 36 772 551 415 362
Base: SfL2011 All aged 16-65 who gave a terminal education age with word processing / email / spreadsheet / multiple choice score Note: Respondents who were ‘still in education’, who ‘never went to school’, or who didn’t report a terminal education age are included in the ‘All’ column, but are not individually listed in a column.
In line with the pattern that emerged for literacy and numeracy, respondents who left school later tended to perform at a higher standard across the four ICT components. However, this is again not to say all respondents who stayed on in education past the age of 21 always achieved higher assessment scores. Just under a quarter (23 per cent) of respondents who left school after the age of 22 failed to achieve Entry Level 3 or above on the spreadsheet component, as did 22 per cent on the word processing component.140
7.4 Highest qualifications
Detailed information about the qualifications held by respondents was collected in the survey. However, in this section analysis concentrates on the highest qualification held. Respondents who were still in education have been excluded as these respondents may be yet to gain what will be their highest qualification. It should be noted that the structure of the relevant questionnaire sections has substantially changed between the two surveys, and comparisons to 2003 should be treated with caution.141
140 For full breakdowns see Appendix Table 7.A1. 141 This section in the questionnaire was updated to account for changes to education and qualifications since 2003.
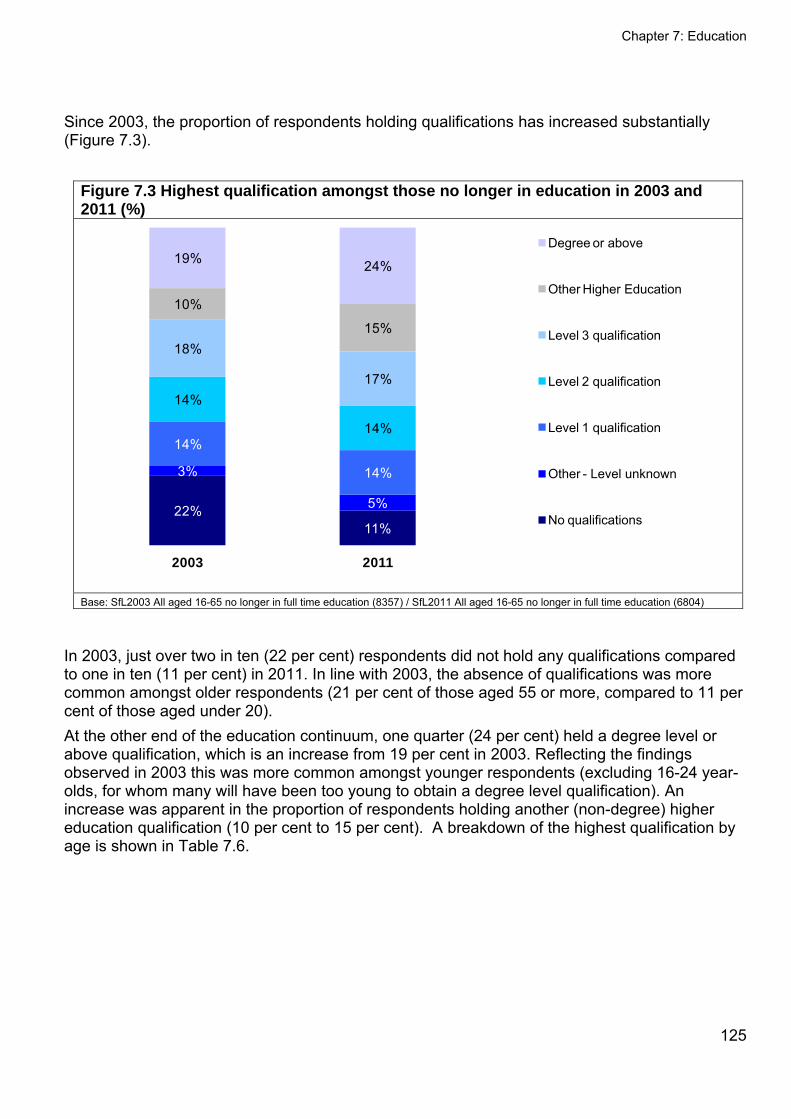
Chapter 7: Education
Since 2003, the proportion of respondents holding qualifications has increased substantially (Figure 7.3).
Figure 7.3 Highest qualification amongst those no longer in education in 2003 and 2011 (%)
22%11%
3%
5%
14%
14%
14%
14%
18%
17%
10%
15%
19% 24%
2003 2011
Degree or above
Other Higher Education
Level 3 qualification
Level 2 qualification
Level 1 qualification
Other - Level unknown
No qualifications
Base: SfL2003 All aged 16-65 no longer in full time education (8357) / SfL2011 All aged 16-65 no longer in full time education (6804)
In 2003, just over two in ten (22 per cent) respondents did not hold any qualifications compared to one in ten (11 per cent) in 2011. In line with 2003, the absence of qualifications was more common amongst older respondents (21 per cent of those aged 55 or more, compared to 11 per cent of those aged under 20). At the other end of the education continuum, one quarter (24 per cent) held a degree level or above qualification, which is an increase from 19 per cent in 2003. Reflecting the findings observed in 2003 this was more common amongst younger respondents (excluding 16-24 year-olds, for whom many will have been too young to obtain a degree level qualification). An increase was apparent in the proportion of respondents holding another (non-degree) higher education qualification (10 per cent to 15 per cent). A breakdown of the highest qualification by age is shown in Table 7.6.
125
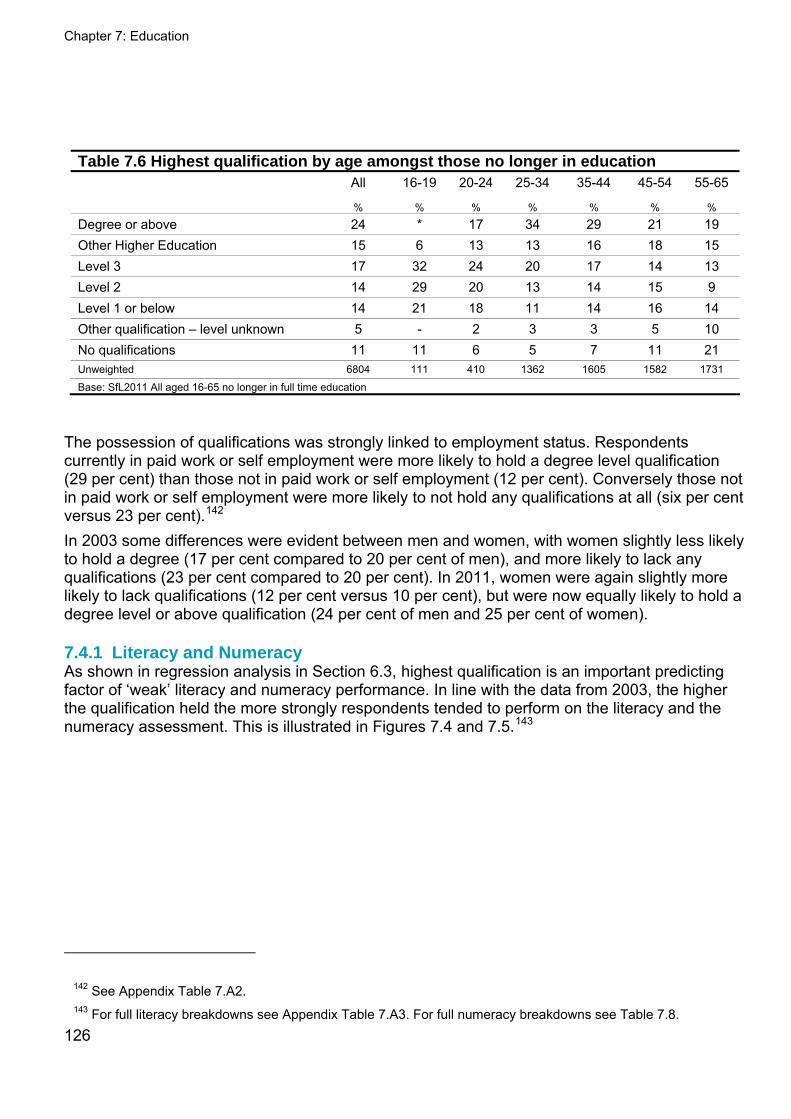
Chapter 7: Education
126
Table 7.6 Highest qualification by age amongst those no longer in education All 16-19 20-24 25-34 35-44 45-54 55-65
% % % % % % %
Degree or above 24 * 17 34 29 21 19 Other Higher Education 15 6 13 13 16 18 15 Level 3 17 32 24 20 17 14 13 Level 2 14 29 20 13 14 15 9 Level 1 or below 14 21 18 11 14 16 14 Other qualification – level unknown 5 - 2 3 3 5 10 No qualifications 11 11 6 5 7 11 21 Unweighted 6804 111 410 1362 1605 1582 1731
Base: SfL2011 All aged 16-65 no longer in full time education
The possession of qualifications was strongly linked to employment status. Respondents currently in paid work or self employment were more likely to hold a degree level qualification (29 per cent) than those not in paid work or self employment (12 per cent). Conversely those not in paid work or self employment were more likely to not hold any qualifications at all (six per cent versus 23 per cent).142 In 2003 some differences were evident between men and women, with women slightly less likely to hold a degree (17 per cent compared to 20 per cent of men), and more likely to lack any qualifications (23 per cent compared to 20 per cent). In 2011, women were again slightly more likely to lack qualifications (12 per cent versus 10 per cent), but were now equally likely to hold a degree level or above qualification (24 per cent of men and 25 per cent of women).
7.4.1 Literacy and Numeracy As shown in regression analysis in Section 6.3, highest qualification is an important predicting factor of ‘weak’ literacy and numeracy performance. In line with the data from 2003, the higher the qualification held the more strongly respondents tended to perform on the literacy and the numeracy assessment. This is illustrated in Figures 7.4 and 7.5.143
142 See Appendix Table 7.A2. 143 For full literacy breakdowns see Appendix Table 7.A3. For full numeracy breakdowns see Table 7.8.
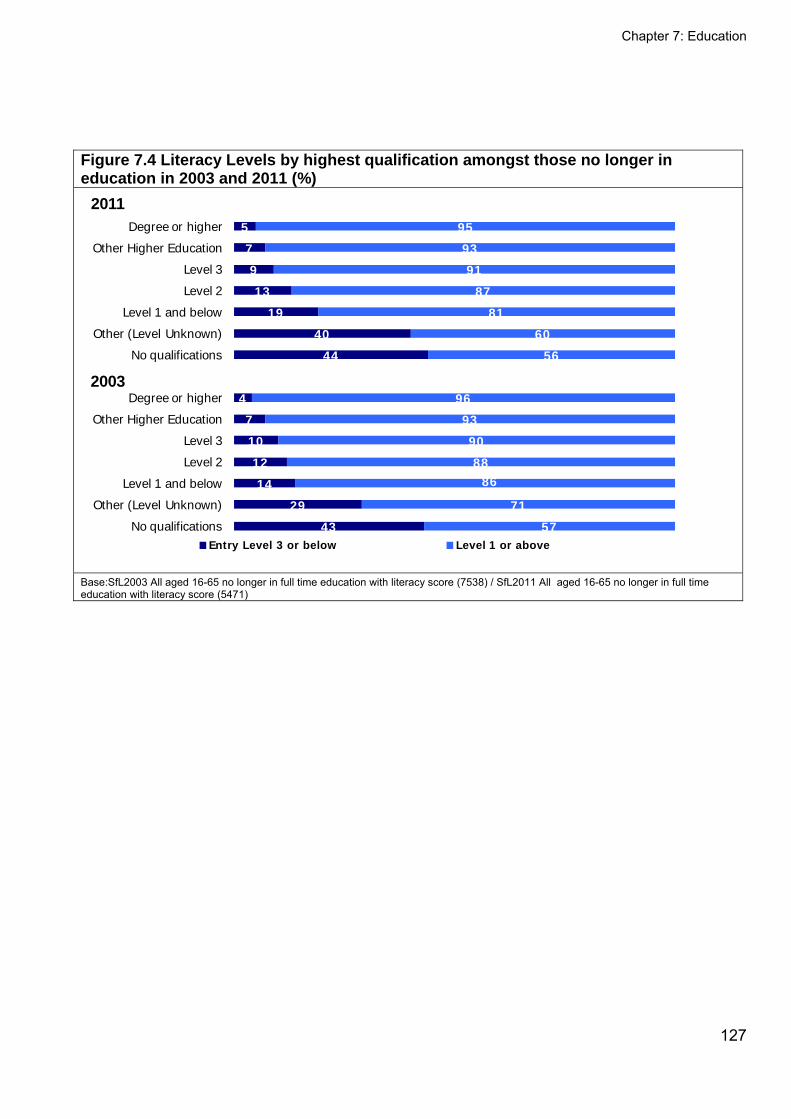
Chapter 7: Education
Figure 7.4 Literacy Levels by highest qualification amongst those no longer in education in 2003 and 2011 (%)
43
29
14
12
10
7
4
44
40
19
13
9
7
5
57
71
8688
90
93
96
56
60
81
87
91
93
95
No qualifications
Other (Level Unknown)
Level 1 and below
Level 2
Level 3
Other Higher Education
Degree or higher
No qualifications
Other (Level Unknown)
Level 1 and below
Level 2
Level 3
Other Higher Education
Degree or higher
Entry Level 3 or below Level 1 or above
2011
2003
Base:SfL2003 All aged 16-65 no longer in full time education with literacy score (7538) / SfL2011 All aged 16-65 no longer in full time education with literacy score (5471)
127
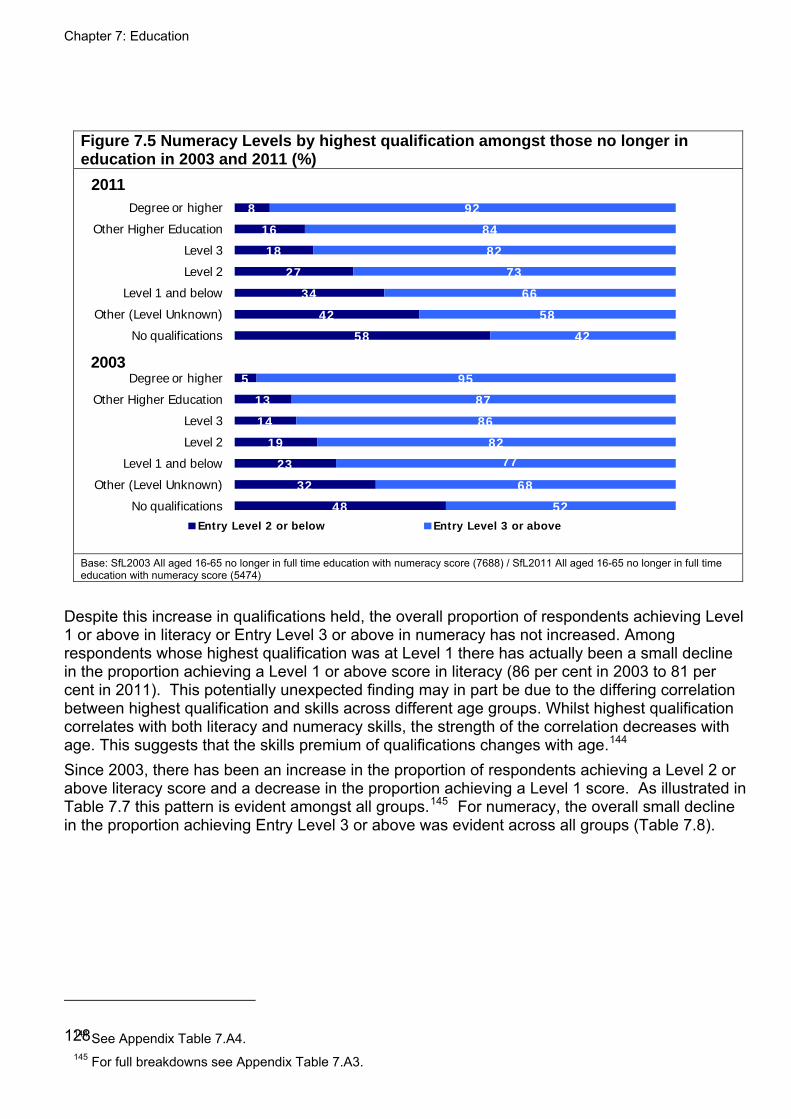
Chapter 7: Education
1
Figure 7.5 Numeracy Levels by highest qualification amongst those no longer in education in 2003 and 2011 (%)
48
32
23
19
14
13
5
58
42
34
27
18
16
8
52
68
7782
86
87
95
42
58
66
73
82
84
92
No qualifications
Other (Level Unknown)
Level 1 and below
Level 2
Level 3
Other Higher Education
Degree or higher
No qualifications
Other (Level Unknown)
Level 1 and below
Level 2
Level 3
Other Higher Education
Degree or higher
Entry Level 2 or below Entry Level 3 or above
2011
2003
Base: SfL2003 All aged 16-65 no longer in full time education with numeracy score (7688) / SfL2011 All aged 16-65 no longer in full time education with numeracy score (5474)
Despite this increase in qualifications held, the overall proportion of respondents achieving Level 1 or above in literacy or Entry Level 3 or above in numeracy has not increased. Among respondents whose highest qualification was at Level 1 there has actually been a small decline in the proportion achieving a Level 1 or above score in literacy (86 per cent in 2003 to 81 per cent in 2011). This potentially unexpected finding may in part be due to the differing correlation between highest qualification and skills across different age groups. Whilst highest qualification correlates with both literacy and numeracy skills, the strength of the correlation decreases with age. This suggests that the skills premium of qualifications changes with age.144 Since 2003, there has been an increase in the proportion of respondents achieving a Level 2 or above literacy score and a decrease in the proportion achieving a Level 1 score. As illustrated in Table 7.7 this pattern is evident amongst all groups.145 For numeracy, the overall small decline in the proportion achieving Entry Level 3 or above was evident across all groups (Table 7.8).
28 144 See Appendix Table 7.A4. 145 For full breakdowns see Appendix Table 7.A3.

Chapter 7: Education
Table 7.7 Literacy Levels by highest qualification amongst those no longer in education in 2003 and 2011 ALL DEGREE OR
HIGHER LEVEL QUALIFICATION
OTHER HE QUALIFICATION
LEVEL 3 QUALIFICATION
LEVEL 2 QUALIFICATION
LEVEL 1 QUALIFICATION
OTHER QUALIFICATION
(LEVEL UNKNOWN)
NO QUALIFICATION
2003 2011
2003 2011 2003 2011 2003 2011 2003 2011 2003 2011 2003 2011 2003 2011
% % % % % % % % % % % % % % % % Entry Level 3 or below
17 15 4 5 7 7 10 9 12 13 14 19 29 40 43 44
Level 1 40 29 26 16 38 29 43 30 44 38 50 39 42 33 40 34 Level 2 or above
44 56 70 79 55 64 48 61 44 49 36 42 28 27 17 22
Unweighted 7538 5471 1348 1328 847 817 1316 877 1055 722 1131 794 245 267 1596 666 Base:SfL2003 All aged 16-65 no longer in full time education with literacy score / SfL2011 All aged 16-65 no longer in full time education with literacy score
Table 7.8 Numeracy Levels by highest qualification amongst those no longer in education in 2003 and 2011 ALL DEGREE OR
HIGHER LEVEL QUALIFICATION
OTHER HE QUALIFICATION
LEVEL 3 QUALIFICATION
LEVEL 2 QUALIFICATION
LEVEL 1 QUALIFICATION
OTHER QUALIFICATION
(LEVEL UNKNOWN)
NO QUALIFICATION
2003 2011 2003 2011 2003 2011 2003 2011 2003 2011 2003 2011 2003 2011 2003 2011 % % % % % % % % % % % % % % % % Entry Level 1 or below
6 7 * 2 2 4 2 4 4 6 4 9 8 18 17 23
Entry Level 2 16 17 5 6 11 12 12 14 15 20 19 25 23 24 32 34 Entry Level 3 26 25 12 16 24 28 25 26 30 28 34 33 30 30 30 28 Level 1 27 29 30 35 33 33 32 33 30 29 27 25 28 21 17 11 Level 2 or above
25 22 52 41 31 24 29 23 22 16 16 8 11 7 5 4
Unweighted 7688 5474 1357 1316 844 800 1327 924 1072 724 1144 819 257 263 1687 628 Base: SfL2003 All aged 16-65 no longer in full time education with numeracy score / SfL2011 All aged 16-65 no longer in full time education with numeracy score
129
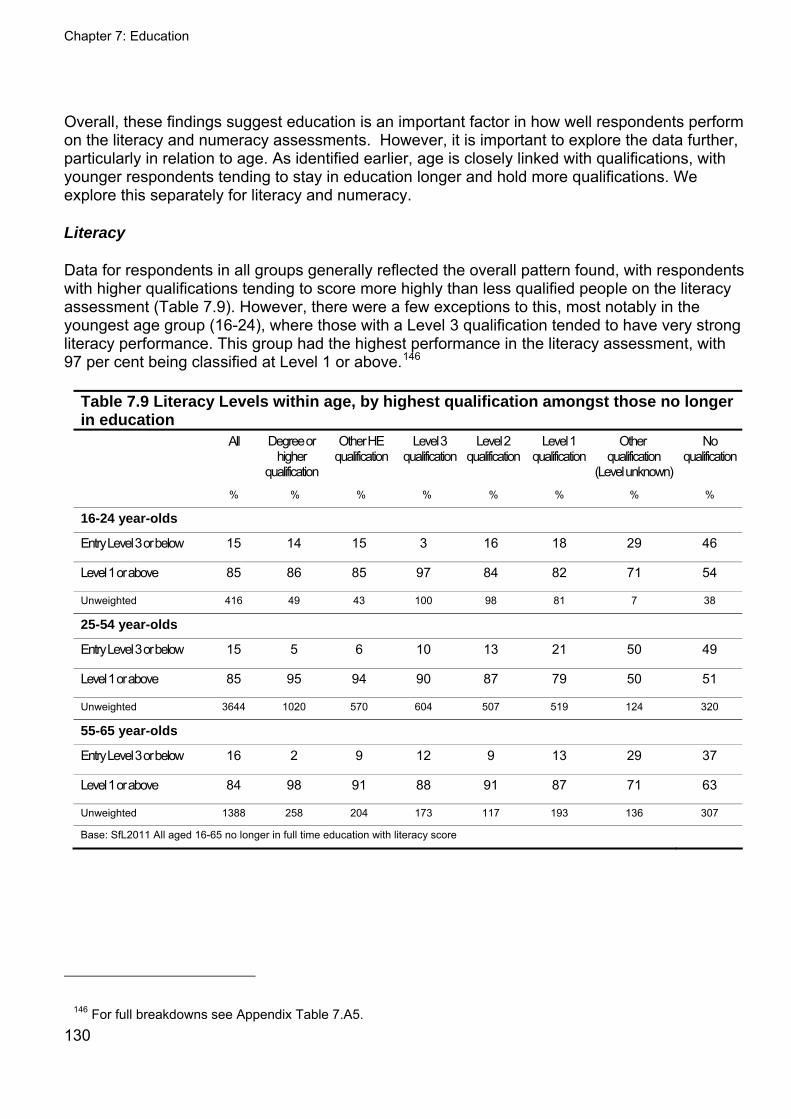
Chapter 7: Education
130
Overall, these findings suggest education is an important factor in how well respondents perform on the literacy and numeracy assessments. However, it is important to explore the data further, particularly in relation to age. As identified earlier, age is closely linked with qualifications, with younger respondents tending to stay in education longer and hold more qualifications. We explore this separately for literacy and numeracy.
Literacy
Data for respondents in all groups generally reflected the overall pattern found, with respondents with higher qualifications tending to score more highly than less qualified people on the literacy assessment (Table 7.9). However, there were a few exceptions to this, most notably in the youngest age group (16-24), where those with a Level 3 qualification tended to have very strong literacy performance. This group had the highest performance in the literacy assessment, with 97 per cent being classified at Level 1 or above.146
Table 7.9 Literacy Levels within age, by highest qualification amongst those no longer in education All Degree or
higher qualification
Other HE qualification
Level 3 qualification
Level 2 qualification
Level 1 qualification
Other qualification
(Level unknown)
No qualification
% % % % % % % %
16-24 year-olds
Entry Level 3 or below 15 14 15 3 16 18 29 46
Level 1 or above 85 86 85 97 84 82 71 54
Unweighted 416 49 43 100 98 81 7 38
25-54 year-olds
Entry Level 3 or below 15 5 6 10 13 21 50 49
Level 1 or above 85 95 94 90 87 79 50 51
Unweighted 3644 1020 570 604 507 519 124 320
55-65 year-olds
Entry Level 3 or below 16 2 9 12 9 13 29 37
Level 1 or above 84 98 91 88 91 87 71 63
Unweighted 1388 258 204 173 117 193 136 307
Base: SfL2011 All aged 16-65 no longer in full time education with literacy score
146 For full breakdowns see Appendix Table 7.A5.
Chapter 7: Education
131
Across all groups there were no differences by age in terms of achieving a Level 1 or above score.147 The only exception to this was amongst those whose highest qualification was at Level 3. In this group, respondents aged 16-24 were more likely than respondents aged 25-54 and 55-65 to achieve a Level 1 or above literacy score (Table 7.9). Both of these findings suggest that 16-24 year-olds who hold a Level 3 qualification have stronger literacy than either 16-24 year-olds who hold a different highest qualification (both at higher and lower levels), or their older counterparts who hold the same highest qualification. It is difficult to offer an explanation for this change, and the small base sizes of this group must be borne in mind when interpreting this finding. The majority of 16-24 year old group will have completed their Level 3 qualification relatively recently, and it may be that this recent tuition for these qualifications, in particular A Levels and AS Levels (which account for 74 per cent of the Level 3 qualifications of this group) may have aided the completion of the literacy assessment.
Numeracy
Similar to the literacy findings, across each of the three age groups (16-24 year-olds, 25-54 year-olds and 55-65 year-olds), respondents with higher qualifications generally performed better in the numeracy assessment, with such respondents more likely to achieve an Entry Level 3 or above score (Table 7.10). The main exception to this again seems to be amongst those in the youngest group (16-24), where respondents holding another HE (non-degree) qualification tended to perform less well. This finding should, however, be treated with caution due to the small base size of this group.148
147 Whilst differences are apparent between 16-24 year-olds and their older counterparts amongst those whose highest qualification is a ‘Degree or higher qualification’, or an ‘Other HE (non degree) qualification’, these are not statistically significant (at the five percent confidence level) due to the small base sizes. 148 For full breakdowns see Appendix Table 7.A6.
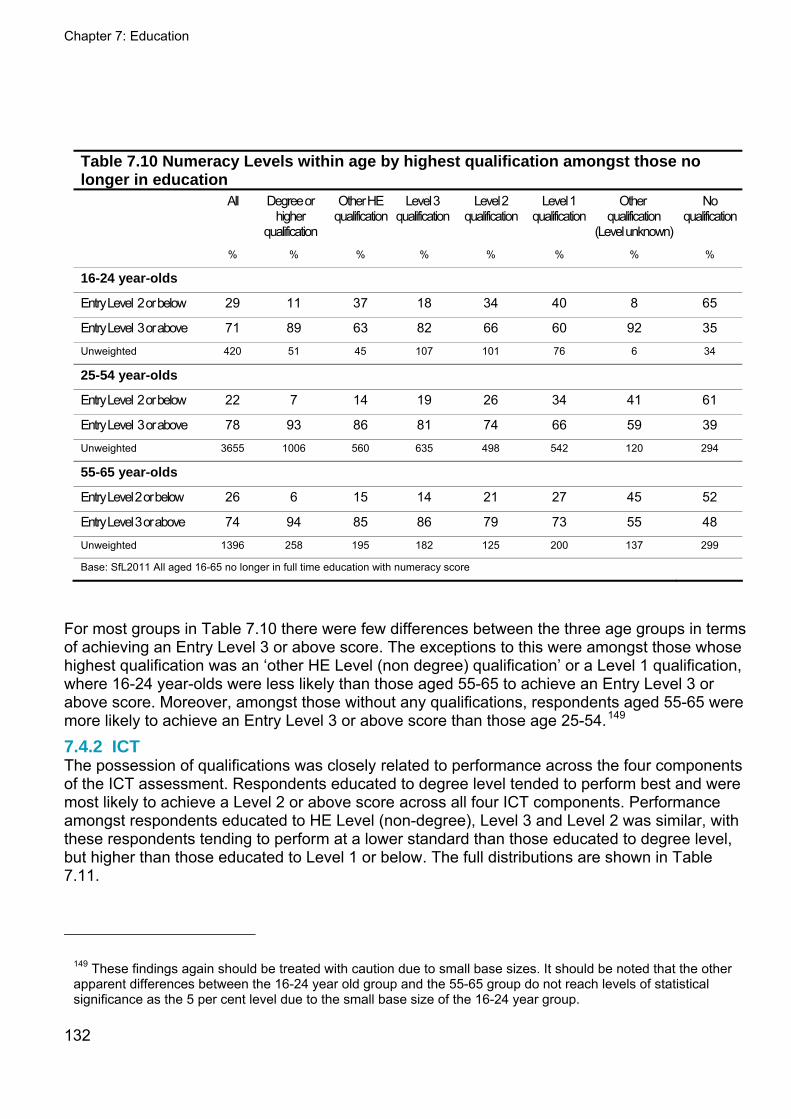
Chapter 7: Education
132
Table 7.10 Numeracy Levels within age by highest qualification amongst those no longer in education All Degree or
higher qualification
Other HE qualification
Level 3 qualification
Level 2 qualification
Level 1 qualification
Other qualification
(Level unknown)
No qualification
% % % % % % % %
16-24 year-olds
Entry Level 2 or below 29 11 37 18 34 40 8 65
Entry Level 3 or above 71 89 63 82 66 60 92 35
Unweighted 420 51 45 107 101 76 6 34
25-54 year-olds
Entry Level 2 or below 22 7 14 19 26 34 41 61
Entry Level 3 or above 78 93 86 81 74 66 59 39
Unweighted 3655 1006 560 635 498 542 120 294
55-65 year-olds
Entry Level 2 or below 26 6 15 14 21 27 45 52
Entry Level 3 or above 74 94 85 86 79 73 55 48
Unweighted 1396 258 195 182 125 200 137 299
Base: SfL2011 All aged 16-65 no longer in full time education with numeracy score
For most groups in Table 7.10 there were few differences between the three age groups in terms of achieving an Entry Level 3 or above score. The exceptions to this were amongst those whose highest qualification was an ‘other HE Level (non degree) qualification’ or a Level 1 qualification, where 16-24 year-olds were less likely than those aged 55-65 to achieve an Entry Level 3 or above score. Moreover, amongst those without any qualifications, respondents aged 55-65 were more likely to achieve an Entry Level 3 or above score than those age 25-54.149 7.4.2 ICT The possession of qualifications was closely related to performance across the four components of the ICT assessment. Respondents educated to degree level tended to perform best and were most likely to achieve a Level 2 or above score across all four ICT components. Performance amongst respondents educated to HE Level (non-degree), Level 3 and Level 2 was similar, with these respondents tending to perform at a lower standard than those educated to degree level, but higher than those educated to Level 1 or below. The full distributions are shown in Table 7.11.
149 These findings again should be treated with caution due to small base sizes. It should be noted that the other apparent differences between the 16-24 year old group and the 55-65 group do not reach levels of statistical significance as the 5 per cent level due to the small base size of the 16-24 year group.
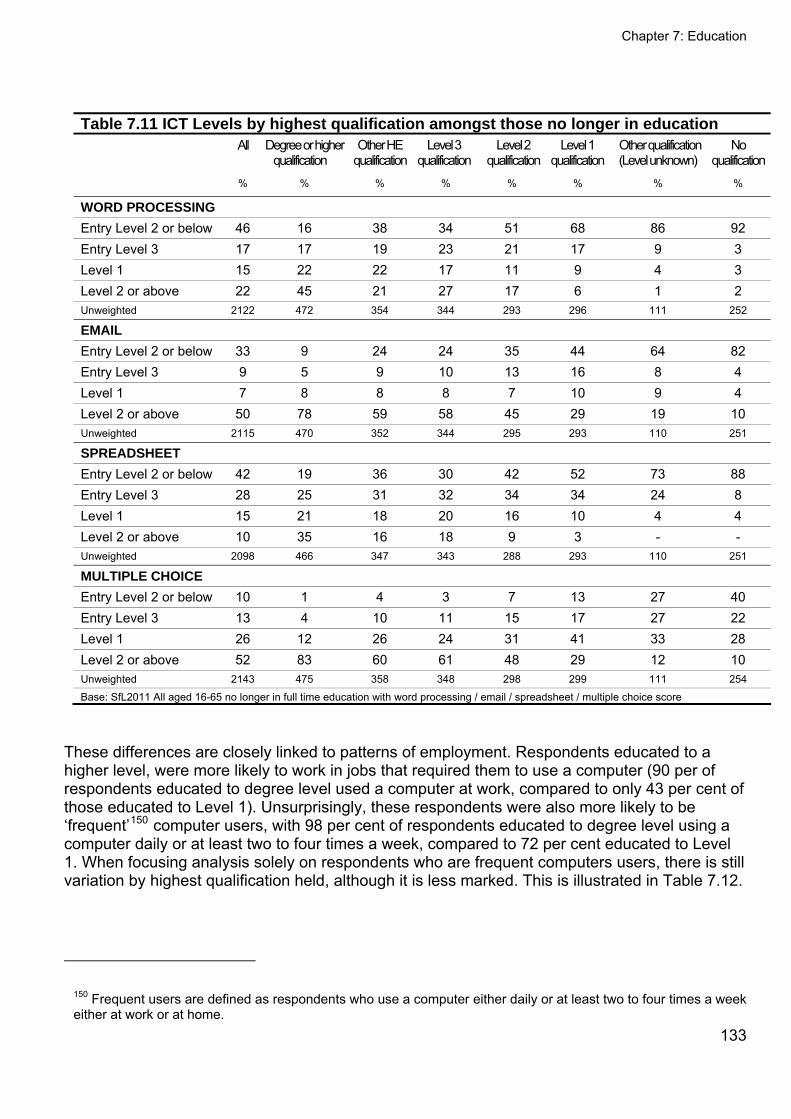
Chapter 7: Education
133
Table 7.11 ICT Levels by highest qualification amongst those no longer in education All Degree or higher
qualification Other HE
qualification Level 3
qualification Level 2
qualification Level 1
qualification Other qualification (Level unknown)
No qualification
% % % % % % % %
WORD PROCESSING
Entry Level 2 or below 46 16 38 34 51 68 86 92 Entry Level 3 17 17 19 23 21 17 9 3 Level 1 15 22 22 17 11 9 4 3 Level 2 or above 22 45 21 27 17 6 1 2 Unweighted 2122 472 354 344 293 296 111 252
Entry Level 2 or below 33 9 24 24 35 44 64 82 Entry Level 3 9 5 9 10 13 16 8 4 Level 1 7 8 8 8 7 10 9 4 Level 2 or above 50 78 59 58 45 29 19 10 Unweighted 2115 470 352 344 295 293 110 251
SPREADSHEET
Entry Level 2 or below 42 19 36 30 42 52 73 88 Entry Level 3 28 25 31 32 34 34 24 8 Level 1 15 21 18 20 16 10 4 4 Level 2 or above 10 35 16 18 9 3 - - Unweighted 2098 466 347 343 288 293 110 251
MULTIPLE CHOICE Entry Level 2 or below 10 1 4 3 7 13 27 40 Entry Level 3 13 4 10 11 15 17 27 22 Level 1 26 12 26 24 31 41 33 28 Level 2 or above 52 83 60 61 48 29 12 10 Unweighted 2143 475 358 348 298 299 111 254
Base: SfL2011 All aged 16-65 no longer in full time education with word processing / email / spreadsheet / multiple choice score
These differences are closely linked to patterns of employment. Respondents educated to a higher level, were more likely to work in jobs that required them to use a computer (90 per of respondents educated to degree level used a computer at work, compared to only 43 per cent of those educated to Level 1). Unsurprisingly, these respondents were also more likely to be ‘frequent’150 computer users, with 98 per cent of respondents educated to degree level using a computer daily or at least two to four times a week, compared to 72 per cent educated to Level 1. When focusing analysis solely on respondents who are frequent computers users, there is still variation by highest qualification held, although it is less marked. This is illustrated in Table 7.12.
150 Frequent users are defined as respondents who use a computer either daily or at least two to four times a week either at work or at home.
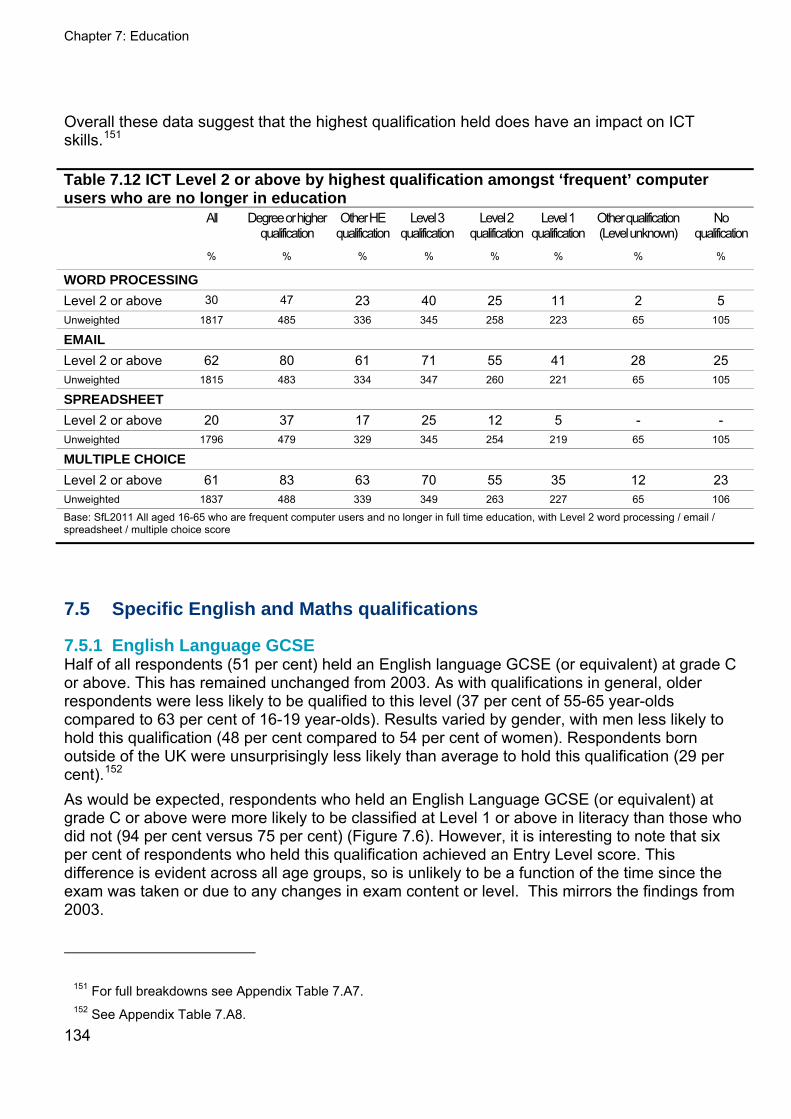
Chapter 7: Education
134
Overall these data suggest that the highest qualification held does have an impact on ICT skills.151
Table 7.12 ICT Level 2 or above by highest qualification amongst ‘frequent’ computer users who are no longer in education All Degree or higher
qualification Other HE
qualification Level 3
qualification Level 2
qualification Level 1
qualification Other qualification (Level unknown)
No qualification
% % % % % % % %
WORD PROCESSING
Level 2 or above 30 47 23 40 25 11 2 5 Unweighted 1817 485 336 345 258 223 65 105
Level 2 or above 62 80 61 71 55 41 28 25 Unweighted 1815 483 334 347 260 221 65 105
SPREADSHEET
Level 2 or above 20 37 17 25 12 5 - - Unweighted 1796 479 329 345 254 219 65 105
MULTIPLE CHOICE
Level 2 or above 61 83 63 70 55 35 12 23 Unweighted 1837 488 339 349 263 227 65 106
Base: SfL2011 All aged 16-65 who are frequent computer users and no longer in full time education, with Level 2 word processing / email / spreadsheet / multiple choice score
7.5 Specific English and Maths qualifications
7.5.1 English Language GCSE Half of all respondents (51 per cent) held an English language GCSE (or equivalent) at grade C or above. This has remained unchanged from 2003. As with qualifications in general, older respondents were less likely to be qualified to this level (37 per cent of 55-65 year-olds compared to 63 per cent of 16-19 year-olds). Results varied by gender, with men less likely to hold this qualification (48 per cent compared to 54 per cent of women). Respondents born outside of the UK were unsurprisingly less likely than average to hold this qualification (29 per cent).152 As would be expected, respondents who held an English Language GCSE (or equivalent) at grade C or above were more likely to be classified at Level 1 or above in literacy than those who did not (94 per cent versus 75 per cent) (Figure 7.6). However, it is interesting to note that six per cent of respondents who held this qualification achieved an Entry Level score. This difference is evident across all age groups, so is unlikely to be a function of the time since the exam was taken or due to any changes in exam content or level. This mirrors the findings from 2003.
151 For full breakdowns see Appendix Table 7.A7. 152 See Appendix Table 7.A8.
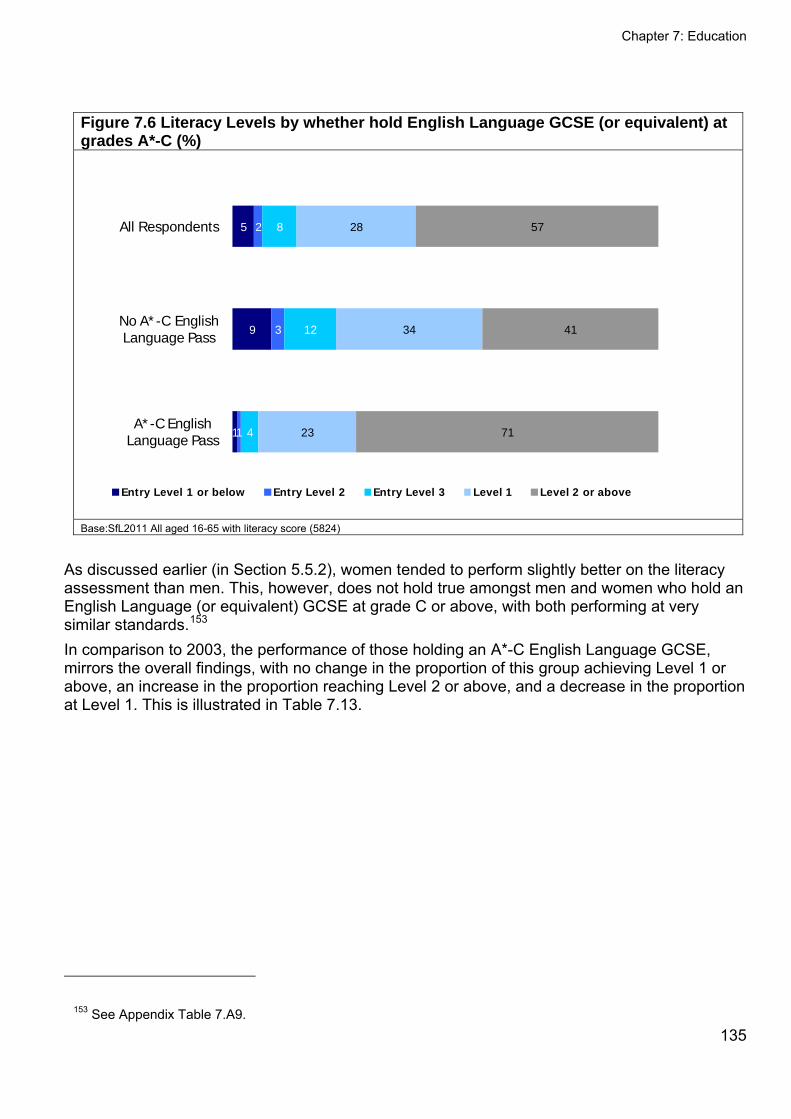
Chapter 7: Education
Figure 7.6 Literacy Levels by whether hold English Language GCSE (or equivalent) at grades A*-C (%)
1
9
5
1
3
2
4
12
8
23
34
28
71
41
57
A*-C English Language Pass
No A*-C English Language Pass
All Respondents
Entry Level 1 or below Entry Level 2 Entry Level 3 Level 1 Level 2 or above
Base:SfL2011 All aged 16-65 with literacy score (5824)
As discussed earlier (in Section 5.5.2), women tended to perform slightly better on the literacy assessment than men. This, however, does not hold true amongst men and women who hold an English Language (or equivalent) GCSE at grade C or above, with both performing at very similar standards.153 In comparison to 2003, the performance of those holding an A*-C English Language GCSE, mirrors the overall findings, with no change in the proportion of this group achieving Level 1 or above, an increase in the proportion reaching Level 2 or above, and a decrease in the proportion at Level 1. This is illustrated in Table 7.13.
153 See Appendix Table 7.A9. 135
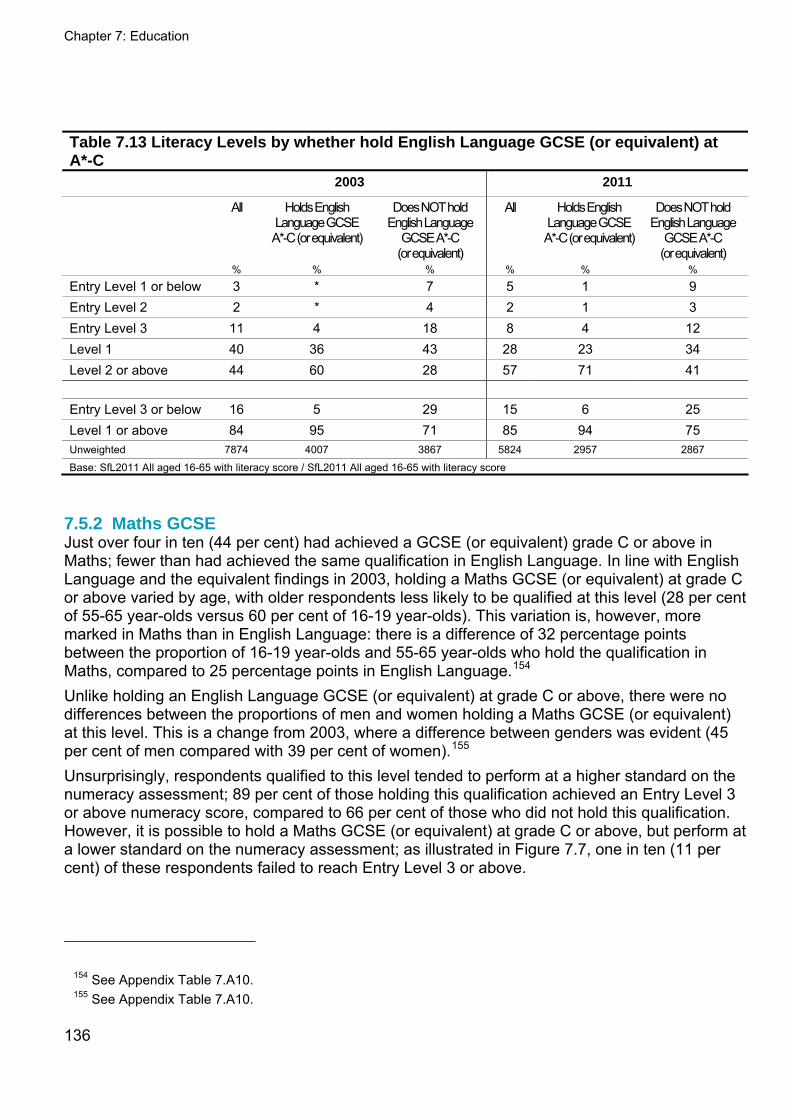
Chapter 7: Education
136
Table 7.13 Literacy Levels by whether hold English Language GCSE (or equivalent) at A*-C 2003 2011
All Holds English Language GCSE A*-C (or equivalent)
Does NOT hold English Language
GCSE A*-C (or equivalent)
All Holds English Language GCSE A*-C (or equivalent)
Does NOT hold English Language
GCSE A*-C (or equivalent)
% % % % % %
Entry Level 1 or below 3 * 7 5 1 9 Entry Level 2 2 * 4 2 1 3 Entry Level 3 11 4 18 8 4 12 Level 1 40 36 43 28 23 34 Level 2 or above 44 60 28 57 71 41
Entry Level 3 or below 16 5 29 15 6 25 Level 1 or above 84 95 71 85 94 75 Unweighted 7874 4007 3867 5824 2957 2867
Base: SfL2011 All aged 16-65 with literacy score / SfL2011 All aged 16-65 with literacy score
7.5.2 Maths GCSE Just over four in ten (44 per cent) had achieved a GCSE (or equivalent) grade C or above in Maths; fewer than had achieved the same qualification in English Language. In line with English Language and the equivalent findings in 2003, holding a Maths GCSE (or equivalent) at grade C or above varied by age, with older respondents less likely to be qualified at this level (28 per cent of 55-65 year-olds versus 60 per cent of 16-19 year-olds). This variation is, however, more marked in Maths than in English Language: there is a difference of 32 percentage points between the proportion of 16-19 year-olds and 55-65 year-olds who hold the qualification in Maths, compared to 25 percentage points in English Language.154 Unlike holding an English Language GCSE (or equivalent) at grade C or above, there were no differences between the proportions of men and women holding a Maths GCSE (or equivalent) at this level. This is a change from 2003, where a difference between genders was evident (45 per cent of men compared with 39 per cent of women).155 Unsurprisingly, respondents qualified to this level tended to perform at a higher standard on the numeracy assessment; 89 per cent of those holding this qualification achieved an Entry Level 3 or above numeracy score, compared to 66 per cent of those who did not hold this qualification. However, it is possible to hold a Maths GCSE (or equivalent) at grade C or above, but perform at a lower standard on the numeracy assessment; as illustrated in Figure 7.7, one in ten (11 per cent) of these respondents failed to reach Entry Level 3 or above.
154 See Appendix Table 7.A10. 155 See Appendix Table 7.A10.
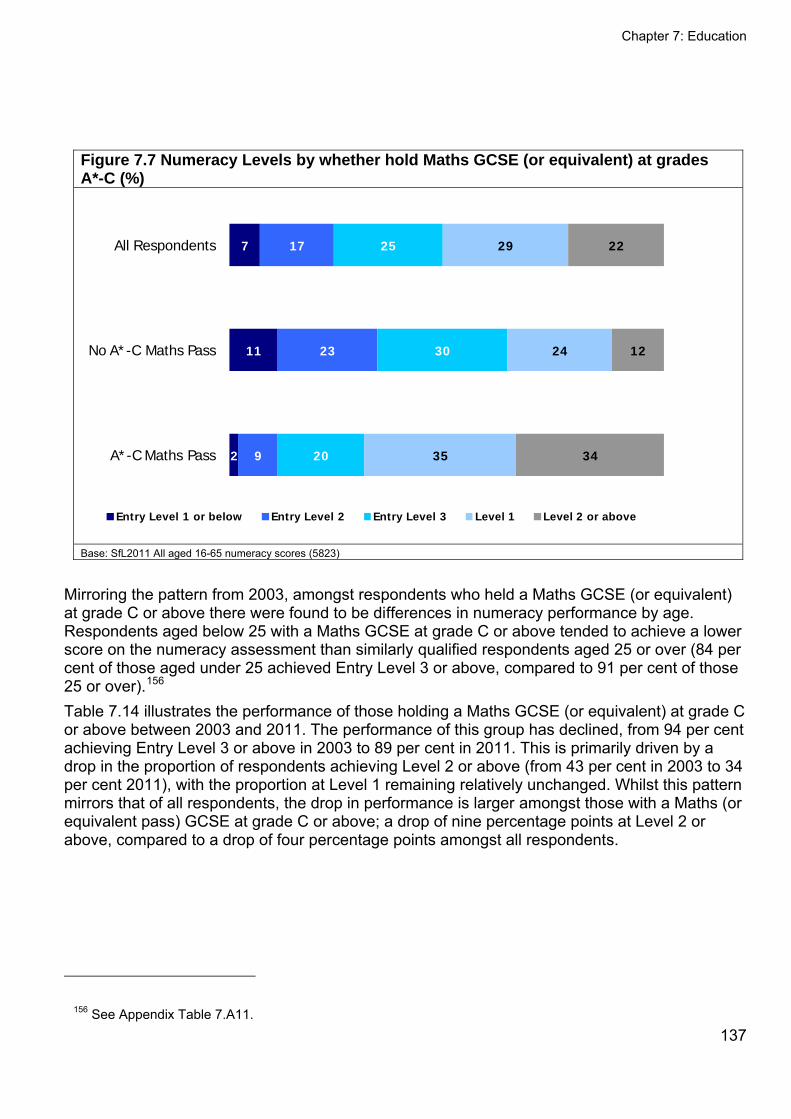
Chapter 7: Education
Figure 7.7 Numeracy Levels by whether hold Maths GCSE (or equivalent) at grades A*-C (%)
2
11
7
9
23
17
20
30
25
35
24
29
34
12
22
A*-C Maths Pass
No A*-C Maths Pass
All Respondents
Entry Level 1 or below Entry Level 2 Entry Level 3 Level 1 Level 2 or above
Base: SfL2011 All aged 16-65 numeracy scores (5823)
Mirroring the pattern from 2003, amongst respondents who held a Maths GCSE (or equivalent) at grade C or above there were found to be differences in numeracy performance by age. Respondents aged below 25 with a Maths GCSE at grade C or above tended to achieve a lower score on the numeracy assessment than similarly qualified respondents aged 25 or over (84 per cent of those aged under 25 achieved Entry Level 3 or above, compared to 91 per cent of those 25 or over).156 Table 7.14 illustrates the performance of those holding a Maths GCSE (or equivalent) at grade C or above between 2003 and 2011. The performance of this group has declined, from 94 per cent achieving Entry Level 3 or above in 2003 to 89 per cent in 2011. This is primarily driven by a drop in the proportion of respondents achieving Level 2 or above (from 43 per cent in 2003 to 34 per cent 2011), with the proportion at Level 1 remaining relatively unchanged. Whilst this pattern mirrors that of all respondents, the drop in performance is larger amongst those with a Maths (or equivalent pass) GCSE at grade C or above; a drop of nine percentage points at Level 2 or above, compared to a drop of four percentage points amongst all respondents.
156 See Appendix Table 7.A11. 137
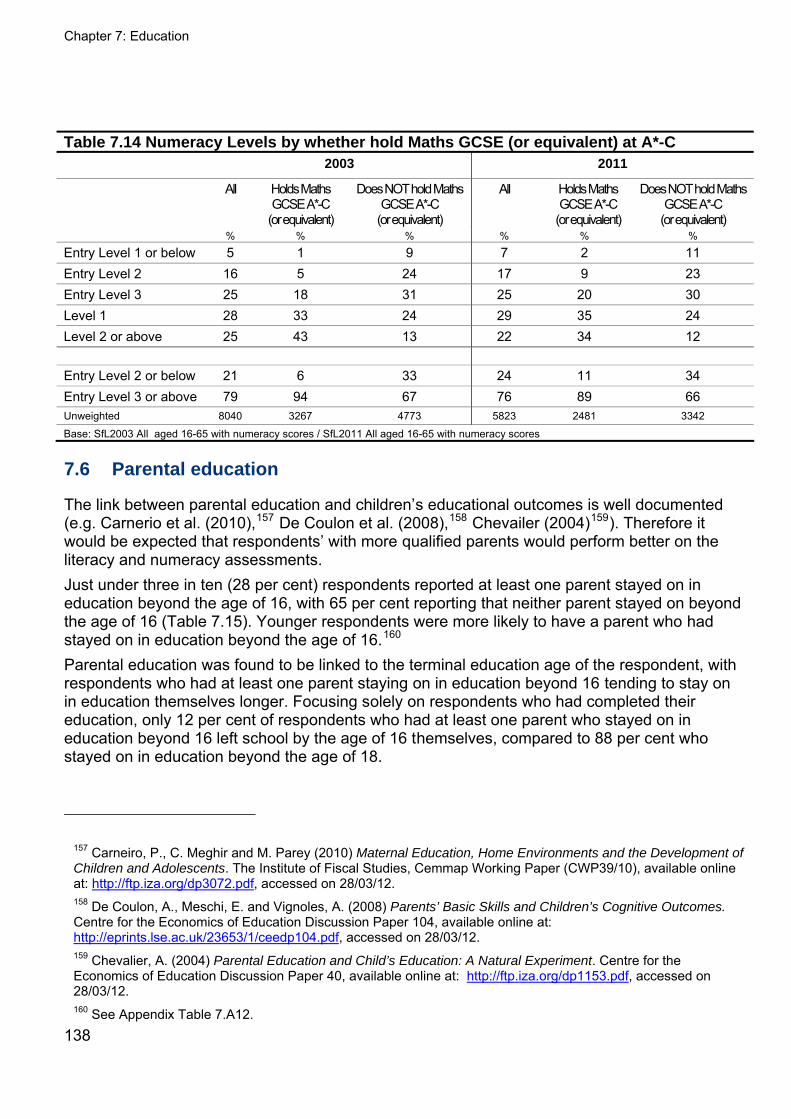
Chapter 7: Education
138
Table 7.14 Numeracy Levels by whether hold Maths GCSE (or equivalent) at A*-C 2003 2011
All Holds Maths GCSE A*-C
(or equivalent)
Does NOT hold Maths GCSE A*-C
(or equivalent)
All Holds Maths GCSE A*-C
(or equivalent)
Does NOT hold Maths GCSE A*-C
(or equivalent) % % % % % %
Entry Level 1 or below 5 1 9 7 2 11 Entry Level 2 16 5 24 17 9 23 Entry Level 3 25 18 31 25 20 30 Level 1 28 33 24 29 35 24 Level 2 or above 25 43 13 22 34 12
Entry Level 2 or below 21 6 33 24 11 34 Entry Level 3 or above 79 94 67 76 89 66 Unweighted 8040 3267 4773 5823 2481 3342
Base: SfL2003 All aged 16-65 with numeracy scores / SfL2011 All aged 16-65 with numeracy scores
7.6 Parental education
The link between parental education and children’s educational outcomes is well documented (e.g. Carnerio et al. (2010),157 De Coulon et al. (2008),158 Chevailer (2004)159). Therefore it would be expected that respondents’ with more qualified parents would perform better on the literacy and numeracy assessments. Just under three in ten (28 per cent) respondents reported at least one parent stayed on in education beyond the age of 16, with 65 per cent reporting that neither parent stayed on beyond the age of 16 (Table 7.15). Younger respondents were more likely to have a parent who had stayed on in education beyond the age of 16.160 Parental education was found to be linked to the terminal education age of the respondent, with respondents who had at least one parent staying on in education beyond 16 tending to stay on in education themselves longer. Focusing solely on respondents who had completed their education, only 12 per cent of respondents who had at least one parent who stayed on in education beyond 16 left school by the age of 16 themselves, compared to 88 per cent who stayed on in education beyond the age of 18.
157 Carneiro, P., C. Meghir and M. Parey (2010) Maternal Education, Home Environments and the Development of Children and Adolescents. The Institute of Fiscal Studies, Cemmap Working Paper (CWP39/10), available online at: http://ftp.iza.org/dp3072.pdf, accessed on 28/03/12. 158 De Coulon, A., Meschi, E. and Vignoles, A. (2008) Parents’ Basic Skills and Children’s Cognitive Outcomes. Centre for the Economics of Education Discussion Paper 104, available online at: http://eprints.lse.ac.uk/23653/1/ceedp104.pdf, accessed on 28/03/12. 159 Chevalier, A. (2004) Parental Education and Child’s Education: A Natural Experiment. Centre for the Economics of Education Discussion Paper 40, available online at: http://ftp.iza.org/dp1153.pdf, accessed on 28/03/12. 160 See Appendix Table 7.A12.
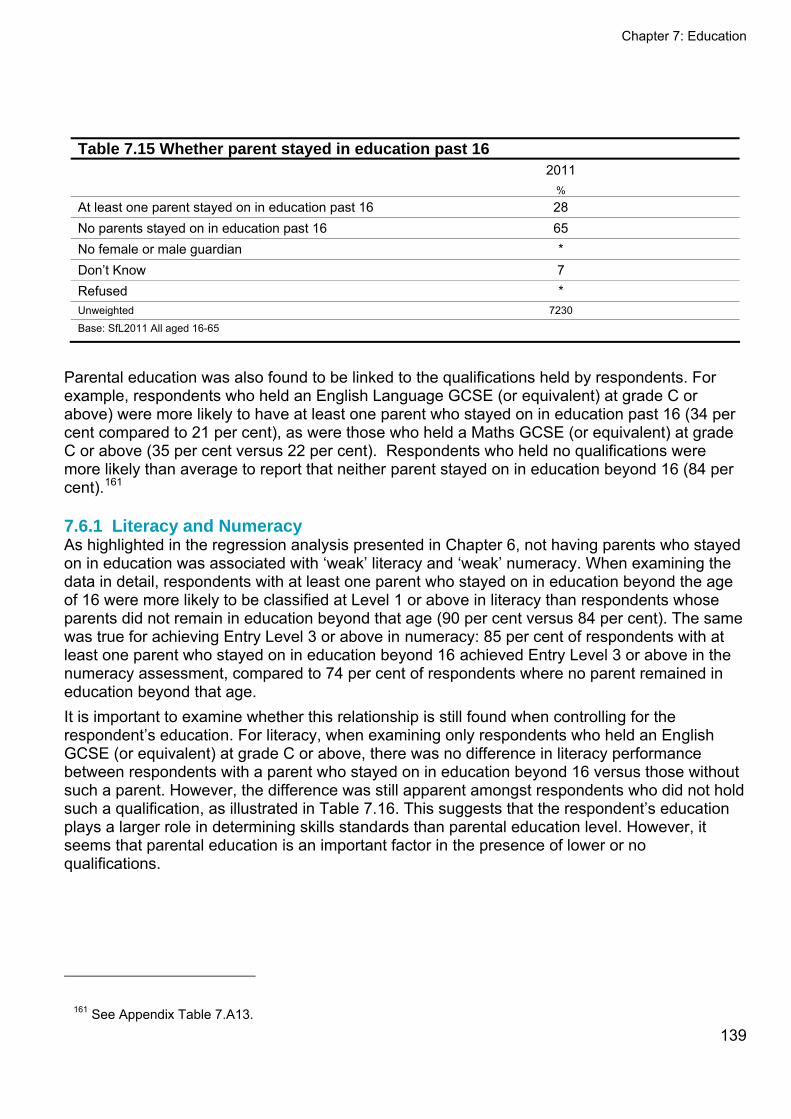
Chapter 7: Education
139
Table 7.15 Whether parent stayed in education past 16 2011 %
At least one parent stayed on in education past 16 28 No parents stayed on in education past 16 65 No female or male guardian * Don’t Know 7 Refused * Unweighted 7230
Base: SfL2011 All aged 16-65
Parental education was also found to be linked to the qualifications held by respondents. For example, respondents who held an English Language GCSE (or equivalent) at grade C or above) were more likely to have at least one parent who stayed on in education past 16 (34 per cent compared to 21 per cent), as were those who held a Maths GCSE (or equivalent) at grade C or above (35 per cent versus 22 per cent). Respondents who held no qualifications were more likely than average to report that neither parent stayed on in education beyond 16 (84 per cent).161
7.6.1 Literacy and Numeracy As highlighted in the regression analysis presented in Chapter 6, not having parents who stayed on in education was associated with ‘weak’ literacy and ‘weak’ numeracy. When examining the data in detail, respondents with at least one parent who stayed on in education beyond the age of 16 were more likely to be classified at Level 1 or above in literacy than respondents whose parents did not remain in education beyond that age (90 per cent versus 84 per cent). The same was true for achieving Entry Level 3 or above in numeracy: 85 per cent of respondents with at least one parent who stayed on in education beyond 16 achieved Entry Level 3 or above in the numeracy assessment, compared to 74 per cent of respondents where no parent remained in education beyond that age. It is important to examine whether this relationship is still found when controlling for the respondent’s education. For literacy, when examining only respondents who held an English GCSE (or equivalent) at grade C or above, there was no difference in literacy performance between respondents with a parent who stayed on in education beyond 16 versus those without such a parent. However, the difference was still apparent amongst respondents who did not hold such a qualification, as illustrated in Table 7.16. This suggests that the respondent’s education plays a larger role in determining skills standards than parental education level. However, it seems that parental education is an important factor in the presence of lower or no qualifications.
161 See Appendix Table 7.A13.

Chapter 7: Education
140
Table 7.16 Literacy Levels by parental education
ALL HAVE ENGLISH GCSE (OR EQUIVALENT) AT GRADE C
OR ABOVE
DO NOT HAVE AN ENGLISH GCSE (OR EQUIVALENT) AT
GRADE C OR ABOVE
All At least one parent
remained in education beyond 16
Neither parent remained in education beyond 16
At least one parent
remained in education beyond 16
Neither parent remained in education beyond 16
At least one parent
remained in education beyond 16
Neither parent remained in education beyond 16
% % % % % % %
Entry Level 3 or below 15 10 16 5 5 18 27 Level 1 or above 85 90 84 95 95 82 73 Unweighted 5824 1449 3983 913 1881 536 2102
Base: SfL2011 All aged 16-65 with literacy score
For numeracy the same pattern was evident when controlling for whether the respondent held a Maths GCSE (or equivalent) at grade C or above. The findings are shown in Table 7.17.162
Table 7.17 Numeracy Levels by parental education ALL HAVE MATHS GCSE (OR
EQUIVALENT) AT GRADE C OR ABOVE
DO NOT HAVE A MATHS GCSE (OR EQUIVALENT) AT
GRADE C OR ABOVE
All At least one parent
remained in education beyond 16
Neither parent remained in education beyond 16
At least one parent
remained in education beyond 16
Neither parent remained in education beyond 16
At least one parent
remained in education beyond 16
Neither parent remained in education beyond 16
% % % % % % %
Entry Level 2 or below 24 15 26 9 11 24 36 Entry Level 3 or above 76 85 74 91 89 76 64 Unweighted 5823 1459 3954 821 1529 638 2425
Base: SfL2011 All aged 16-65 with numeracy score
It is difficult to draw direct comparisons to SfL2003, as the questions around parental education are not consistent between the two surveys. However, broadly speaking a similar pattern was observed. 7.6.2 ICT For ICT, a consistent pattern to that regarding literacy and numeracy was evident, with respondents who had at least one parent who stayed on in education beyond the age of 16 tending to achieve higher scores on the ICT components. This is shown in Table 7.18.163
162 For full breakdowns see Appendix Tables 7.A14 and 7.A15. 163 See Appendix Tables 7.A16.
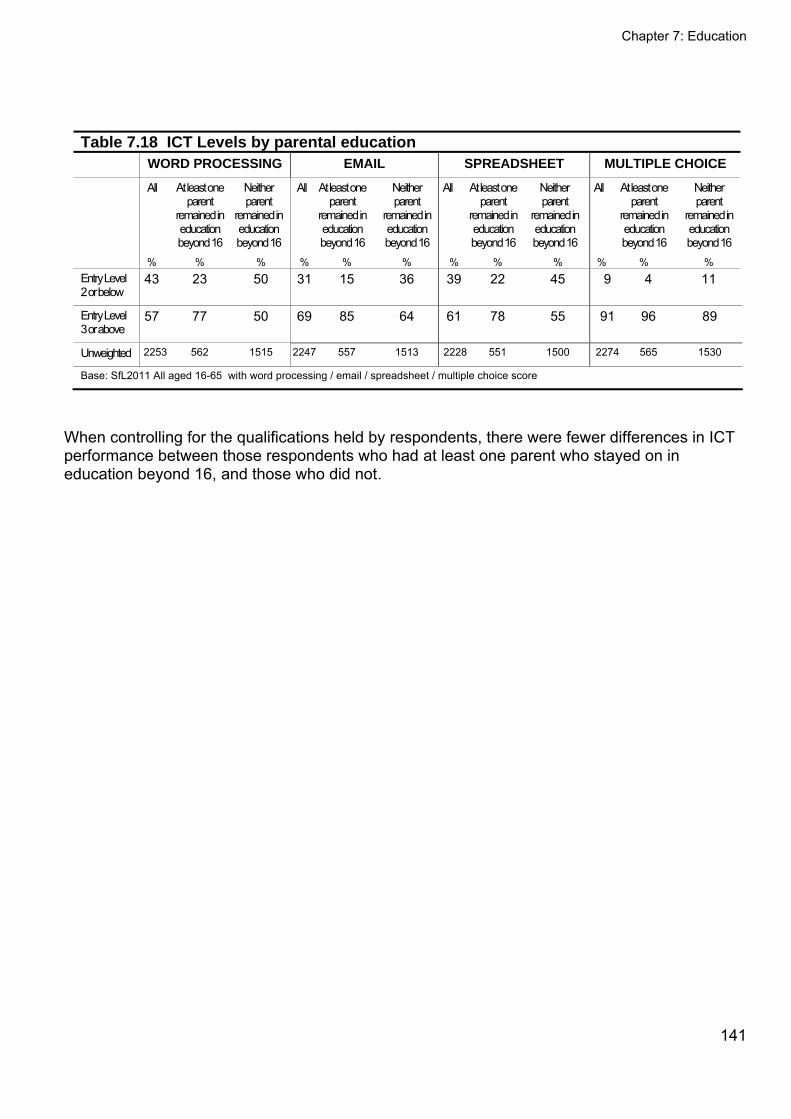
Chapter 7: Education
141
Table 7.18 ICT Levels by parental education WORD PROCESSING EMAIL SPREADSHEET MULTIPLE CHOICE
All At least one parent
remained in education beyond 16
Neither parent
remained in education beyond 16
All At least one parent
remained in education beyond 16
Neither parent
remained in education beyond 16
All At least one parent
remained in education beyond 16
Neither parent
remained in education beyond 16
All At least one parent
remained in education beyond 16
Neither parent
remained in education beyond 16
% % % % % % % % % % % % Entry Level 2 or below
43 23 50 31 15 36 39 22 45 9 4 11
Entry Level 3 or above
57 77 50 69 85 64 61 78 55 91 96 89
Unweighted 2253 562 1515 2247 557 1513 2228 551 1500 2274 565 1530
Base: SfL2011 All aged 16-65 with word processing / email / spreadsheet / multiple choice score
When controlling for the qualifications held by respondents, there were fewer differences in ICT performance between those respondents who had at least one parent who stayed on in education beyond 16, and those who did not.
Chapter 8: Literacy, numeracy and ICT skills in everyday life and work
142
8 Literacy, numeracy and ICT skills in everyday life and work
8.1 Key findings
Skills in everyday life
The population’s confidence in their literacy and numeracy has risen since 2003. Respondents who gave themselves a positive rating in these skills tended to score higher in the literacy and numeracy assessments.
Alongside this growth in confidence, 2011 saw a rise in the numbers achieving Level 2 or above in the literacy assessment. The population’s increased self-assurance in its maths skills, however, was not accompanied by any improvement in numeracy standards, but instead came about as a result of respondents misjudging or misrepresenting their true abilities in working with numbers (more so than their SfL2003 counterparts).
The proportion of 16-65 year-olds who read on a daily or near-daily basis has fallen since 2003, as has the proportion who own 25 books or more. Frequency of reading was linked to Literacy Levels, with those who read the most in their everyday lives achieving the highest scores and those who never read achieving the lowest. The same was true with regards to the frequency of writing (whether on paper, or using email or texts), while those who checked their bills and bank statements more often tended to perform better in the numeracy assessment.
More than half of the respondents who felt they had weaknesses in their reading (60 per cent) or writing (51 per cent), and two fifths of those who felt they had weak maths skills (42 per cent) believed that their shortcomings affected their job prospects. Across the population, it was more common to feel that poor writing abilities (rather than poor reading abilities) posed a hindrance to job prospects. Those with the very lowest skills were the most likely to feel their shortcomings had limited their opportunities.
Skills in work
Economically active respondents tended to have stronger literacy, numeracy and ICT skills than those who were economically inactive. In the literacy assessment, part-time workers performed just as well as full-time workers, while those in search of employment performed just as well as those who were not seeking jobs. In the numeracy assessment, however, there was a sharp divide between those in full time employment and the rest.
Occupation was linked to literacy, numeracy and ICT skills, with respondents in higher occupation categories generally achieving better scores in the three assessments. Since 2003 there has been an improvement in the standard of literacy across all occupations, with more people from every group achieving Level 2 or above, though those in Semi-routine occupations were also more likely than their 2003 counterparts to achieve Level 1 or above. Over the same period numeracy has declined amongst
Chapter 8: Literacy, numeracy and ICT skills in everyday life and work
143
people in managerial and professional occupations.
Industry sector also had an impact, with a tendency for those engaged in Education, Information and communication, and Public administration to possess higher than average literacy and numeracy skills. The same groups, along with those who worked in Finance and Professional, scientific and technical industries, had strong ICT skills.
In general, people with higher gross personal earnings had better literacy, numeracy and ICT skills.
As in 2003, receipt of working age benefits was associated with lower skill standards. This probably reflects the demographic and socio-economic characteristics of benefit recipients, who were commonly unemployed or disabled, or had finished their education before the age of 16.
8.2 Introduction
A person’s abilities in reading, writing, using numbers, and ICT potentially impacts on the activities they choose to carry out on a day-to-day basis, their employment options and their earning potential. This chapter examines respondents’ perceptions of their skills standards, as well as the relationship between their skills Levels - actual and perceived – and various aspects of their daily lives, both within and outside of work.
The Skills for Life 2011 Survey (SfL2011) asked respondents to evaluate their own abilities and the chapter begins by measuring their perceptions of their skills against their performance in the assessments in order to build a picture of the population’s levels of confidence and self-awareness of their skills. The chapter goes on to explore the extent to which respondents use literacy and numeracy in their everyday lives and view their weaknesses as potential barriers to job opportunities. It also assesses how people’s abilities relate to their work circumstances, level of earnings and dependence on benefits.
The data presented in this chapter is derived from questions bqread through to qnews; qwork through to hwhenlft; and qxben through to qxseearn2 in the Background Questionnaire, which can be found in Annex 3.
8.3 Self-assessment of everyday literacy and numeracy skills
In both 2003 and 2011, survey respondents were asked to rate their abilities in everyday reading, writing, maths and ICT. Respondents’ self-assessment of their ability to use computers is reported in Chapter 9. This section focuses on the self-assessment of literacy and numeracy.
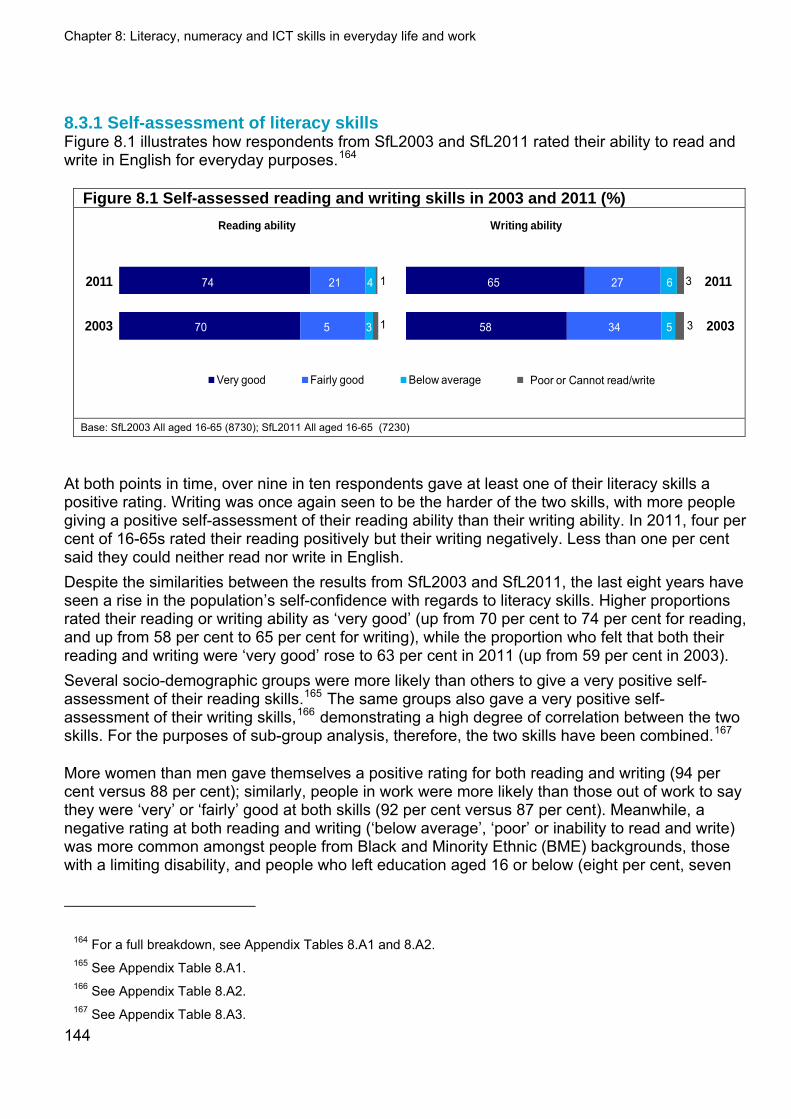
Chapter 8: Literacy, numeracy and ICT skills in everyday life and work
8.3.1 Self-assessment of literacy skills Figure 8.1 illustrates how respondents from SfL2003 and SfL2011 rated their ability to read and write in English for everyday purposes.164
Figure 8.1 Self-assessed reading and writing skills in 2003 and 2011 (%)
58
65
34
27
5
6
70
74
5
21
3
42011
2003
0%0%5%2Very good Fairly good Below average Poor
2011
2003
Reading ability Writing ability
1
1
3
3
Poor or Cannot read/write
Base: SfL2003 All aged 16-65 (8730); SfL2011 All aged 16-65 (7230)
At both points in time, over nine in ten respondents gave at least one of their literacy skills a positive rating. Writing was once again seen to be the harder of the two skills, with more people giving a positive self-assessment of their reading ability than their writing ability. In 2011, four per cent of 16-65s rated their reading positively but their writing negatively. Less than one per cent said they could neither read nor write in English. Despite the similarities between the results from SfL2003 and SfL2011, the last eight years have seen a rise in the population’s self-confidence with regards to literacy skills. Higher proportions rated their reading or writing ability as ‘very good’ (up from 70 per cent to 74 per cent for reading, and up from 58 per cent to 65 per cent for writing), while the proportion who felt that both their reading and writing were ‘very good’ rose to 63 per cent in 2011 (up from 59 per cent in 2003). Several socio-demographic groups were more likely than others to give a very positive self-assessment of their reading skills.165 The same groups also gave a very positive self-assessment of their writing skills,166 demonstrating a high degree of correlation between the two skills. For the purposes of sub-group analysis, therefore, the two skills have been combined.167
More women than men gave themselves a positive rating for both reading and writing (94 per cent versus 88 per cent); similarly, people in work were more likely than those out of work to say they were ‘very’ or ‘fairly’ good at both skills (92 per cent versus 87 per cent). Meanwhile, a negative rating at both reading and writing (‘below average’, ‘poor’ or inability to read and write) was more common amongst people from Black and Minority Ethnic (BME) backgrounds, those with a limiting disability, and people who left education aged 16 or below (eight per cent, seven
164 For a full breakdown, see Appendix Tables 8.A1 and 8.A2. 165 See Appendix Table 8.A1. 166 See Appendix Table 8.A2. 167 See Appendix Table 8.A3.
144
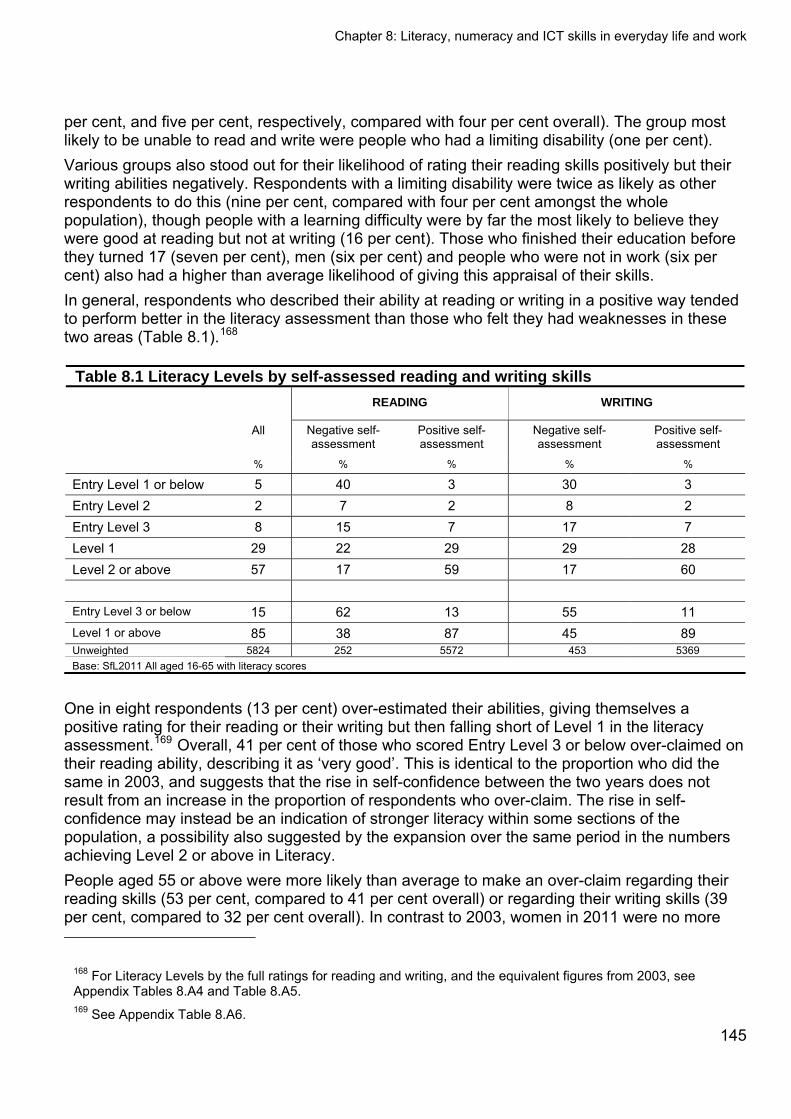
Chapter 8: Literacy, numeracy and ICT skills in everyday life and work
145
per cent, and five per cent, respectively, compared with four per cent overall). The group most likely to be unable to read and write were people who had a limiting disability (one per cent). Various groups also stood out for their likelihood of rating their reading skills positively but their writing abilities negatively. Respondents with a limiting disability were twice as likely as other respondents to do this (nine per cent, compared with four per cent amongst the whole population), though people with a learning difficulty were by far the most likely to believe they were good at reading but not at writing (16 per cent). Those who finished their education before they turned 17 (seven per cent), men (six per cent) and people who were not in work (six per cent) also had a higher than average likelihood of giving this appraisal of their skills. In general, respondents who described their ability at reading or writing in a positive way tended to perform better in the literacy assessment than those who felt they had weaknesses in these two areas (Table 8.1).168
Table 8.1 Literacy Levels by self-assessed reading and writing skills
READING WRITING
All Negative self-assessment
Positive self-assessment
Negative self-assessment
Positive self-assessment
% % % % %
Entry Level 1 or below 5 40 3 30 3 Entry Level 2 2 7 2 8 2 Entry Level 3 8 15 7 17 7 Level 1 29 22 29 29 28 Level 2 or above 57 17 59 17 60 Entry Level 3 or below 15 62 13 55 11 Level 1 or above 85 38 87 45 89 Unweighted 5824 252 5572 453 5369 Base: SfL2011 All aged 16-65 with literacy scores
One in eight respondents (13 per cent) over-estimated their abilities, giving themselves a positive rating for their reading or their writing but then falling short of Level 1 in the literacy assessment.169 Overall, 41 per cent of those who scored Entry Level 3 or below over-claimed on their reading ability, describing it as ‘very good’. This is identical to the proportion who did the same in 2003, and suggests that the rise in self-confidence between the two years does not result from an increase in the proportion of respondents who over-claim. The rise in self-confidence may instead be an indication of stronger literacy within some sections of the population, a possibility also suggested by the expansion over the same period in the numbers achieving Level 2 or above in Literacy. People aged 55 or above were more likely than average to make an over-claim regarding their reading skills (53 per cent, compared to 41 per cent overall) or regarding their writing skills (39 per cent, compared to 32 per cent overall). In contrast to 2003, women in 2011 were no more
168 For Literacy Levels by the full ratings for reading and writing, and the equivalent figures from 2003, see Appendix Tables 8.A4 and Table 8.A5. 169 See Appendix Table 8.A6.
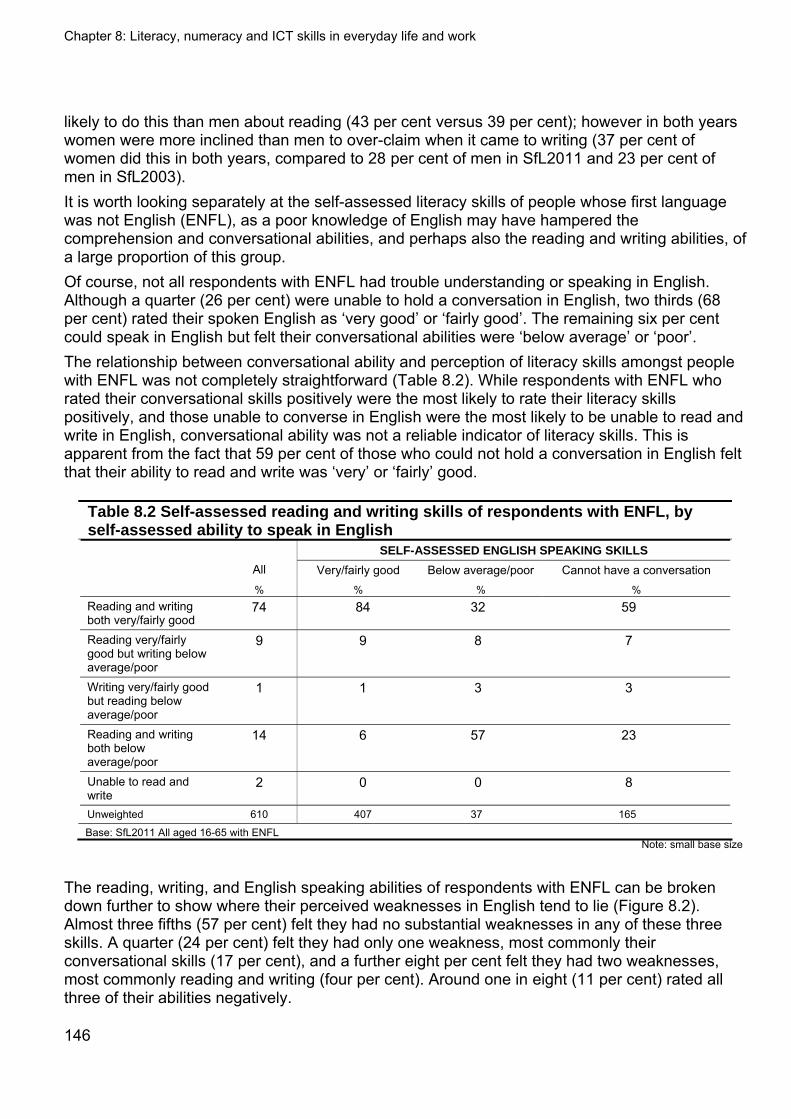
Chapter 8: Literacy, numeracy and ICT skills in everyday life and work
146
likely to do this than men about reading (43 per cent versus 39 per cent); however in both years women were more inclined than men to over-claim when it came to writing (37 per cent of women did this in both years, compared to 28 per cent of men in SfL2011 and 23 per cent of men in SfL2003). It is worth looking separately at the self-assessed literacy skills of people whose first language was not English (ENFL), as a poor knowledge of English may have hampered the comprehension and conversational abilities, and perhaps also the reading and writing abilities, of a large proportion of this group. Of course, not all respondents with ENFL had trouble understanding or speaking in English. Although a quarter (26 per cent) were unable to hold a conversation in English, two thirds (68 per cent) rated their spoken English as ‘very good’ or ‘fairly good’. The remaining six per cent could speak in English but felt their conversational abilities were ‘below average’ or ‘poor’. The relationship between conversational ability and perception of literacy skills amongst people with ENFL was not completely straightforward (Table 8.2). While respondents with ENFL who rated their conversational skills positively were the most likely to rate their literacy skills positively, and those unable to converse in English were the most likely to be unable to read and write in English, conversational ability was not a reliable indicator of literacy skills. This is apparent from the fact that 59 per cent of those who could not hold a conversation in English felt that their ability to read and write was ‘very’ or ‘fairly’ good.
Table 8.2 Self-assessed reading and writing skills of respondents with ENFL, by self-assessed ability to speak in English
SELF-ASSESSED ENGLISH SPEAKING SKILLS All Very/fairly good Below average/poor Cannot have a conversation
% % % % Reading and writing both very/fairly good
74 84 32 59
Reading very/fairly good but writing below average/poor
9 9 8 7
Writing very/fairly good but reading below average/poor
1 1 3 3
Reading and writing both below average/poor
14 6 57 23
Unable to read and write
2 0 0 8
Unweighted 610 407 37 165
Base: SfL2011 All aged 16-65 with ENFL Note: small base size
The reading, writing, and English speaking abilities of respondents with ENFL can be broken down further to show where their perceived weaknesses in English tend to lie (Figure 8.2). Almost three fifths (57 per cent) felt they had no substantial weaknesses in any of these three skills. A quarter (24 per cent) felt they had only one weakness, most commonly their conversational skills (17 per cent), and a further eight per cent felt they had two weaknesses, most commonly reading and writing (four per cent). Around one in eight (11 per cent) rated all three of their abilities negatively.
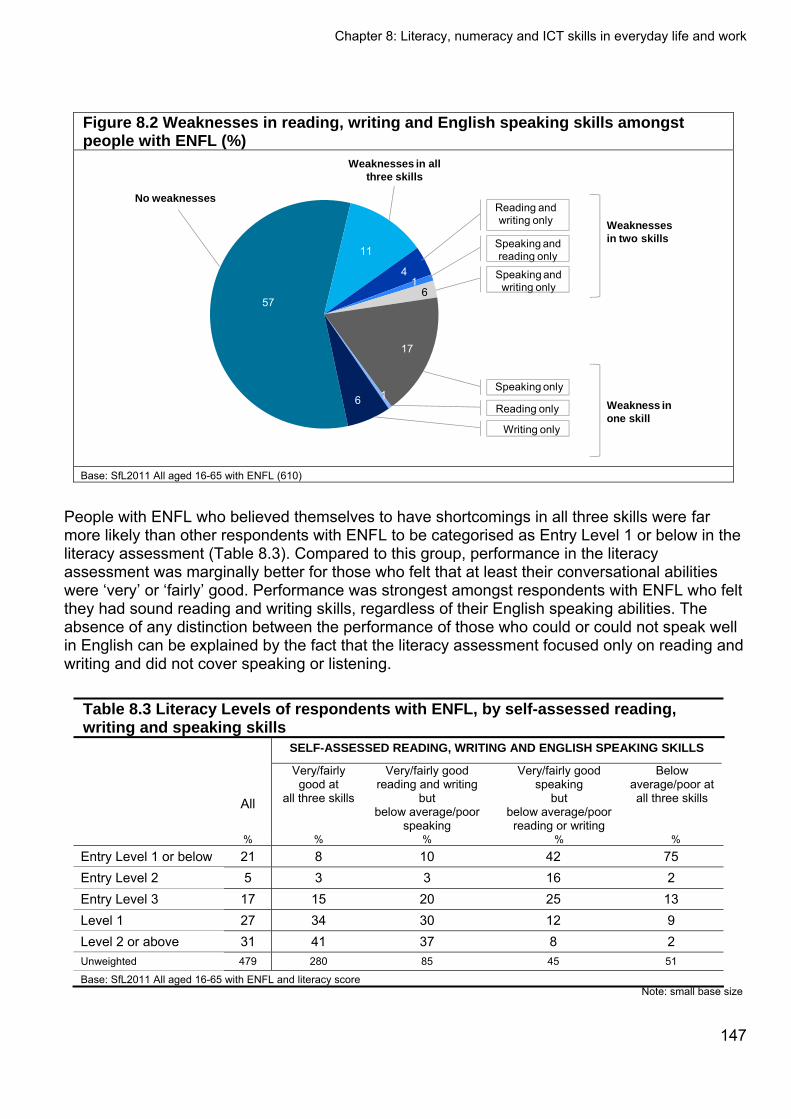
Chapter 8: Literacy, numeracy and ICT skills in everyday life and work
Figure 8.2 Weaknesses in reading, writing and English speaking skills amongst people with ENFL (%)
No weaknessesReading and writing only
Speaking and reading only
Speaking and writing only
Speaking only
Reading only
Writing only
62%4
57
11
6
Weaknesses in two skills
Weakness in one skill
1
1
17
Weaknesses in all three skills
Base: SfL2011 All aged 16-65 with ENFL (610)
People with ENFL who believed themselves to have shortcomings in all three skills were far more likely than other respondents with ENFL to be categorised as Entry Level 1 or below in the literacy assessment (Table 8.3). Compared to this group, performance in the literacy assessment was marginally better for those who felt that at least their conversational abilities were ‘very’ or ‘fairly’ good. Performance was strongest amongst respondents with ENFL who felt they had sound reading and writing skills, regardless of their English speaking abilities. The absence of any distinction between the performance of those who could or could not speak well in English can be explained by the fact that the literacy assessment focused only on reading and writing and did not cover speaking or listening.
Table 8.3 Literacy Levels of respondents with ENFL, by self-assessed reading, writing and speaking skills
SELF-ASSESSED READING, WRITING AND ENGLISH SPEAKING SKILLS
All
Very/fairly good at
all three skills
Very/fairly good reading and writing
but below average/poor
speaking
Very/fairly good speaking
but below average/poor reading or writing
Below
average/poor at all three skills
% % % % %
Entry Level 1 or below 21 8 10 42 75 Entry Level 2 5 3 3 16 2 Entry Level 3 17 15 20 25 13 Level 1 27 34 30 12 9 Level 2 or above 31 41 37 8 2 Unweighted 479 280 85 45 51
Base: SfL2011 All aged 16-65 with ENFL and literacy score Note: small base size
147
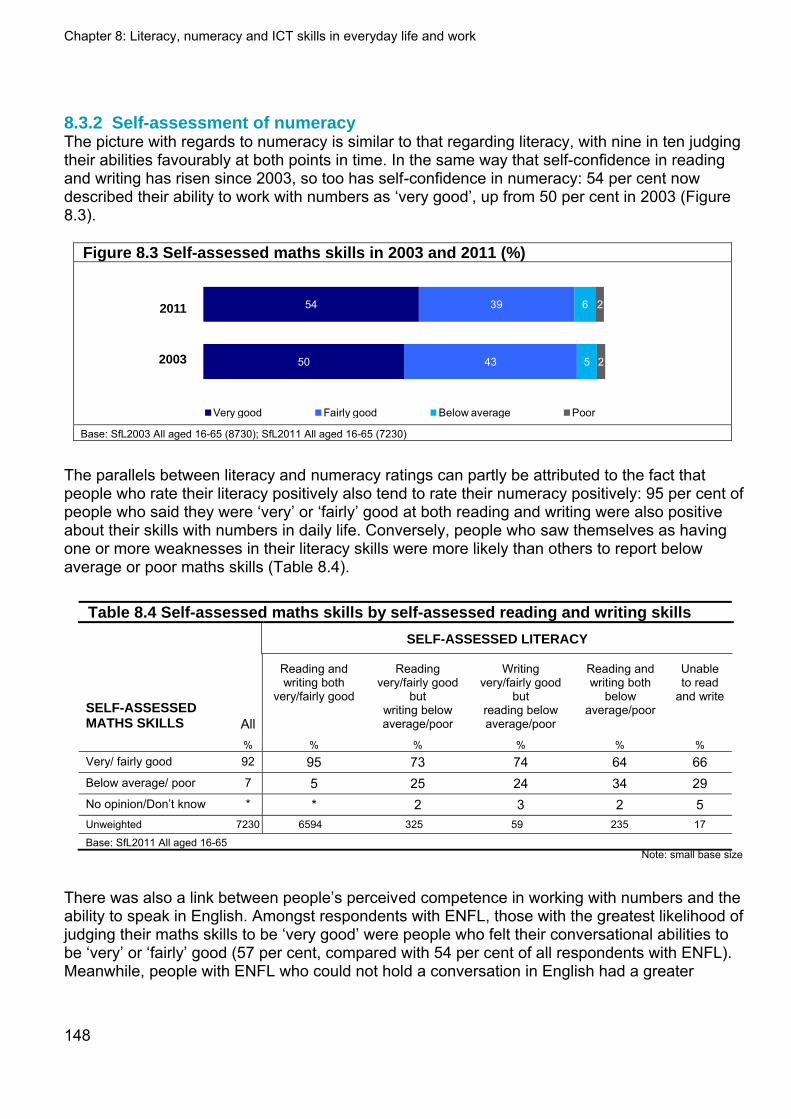
Chapter 8: Literacy, numeracy and ICT skills in everyday life and work
8.3.2 Self-assessment of numeracy The picture with regards to numeracy is similar to that regarding literacy, with nine in ten judging their abilities favourably at both points in time. In the same way that self-confidence in reading and writing has risen since 2003, so too has self-confidence in numeracy: 54 per cent now described their ability to work with numbers as ‘very good’, up from 50 per cent in 2003 (Figure 8.3).
Figure 8.3 Self-assessed maths skills in 2003 and 2011 (%)
50
54
43
39
5
6
2
2
Very good Fairly good Below average Poor
2011
2003
Base: SfL2003 All aged 16-65 (8730); SfL2011 All aged 16-65 (7230)
The parallels between literacy and numeracy ratings can partly be attributed to the fact that people who rate their literacy positively also tend to rate their numeracy positively: 95 per cent of people who said they were ‘very’ or ‘fairly’ good at both reading and writing were also positive about their skills with numbers in daily life. Conversely, people who saw themselves as having one or more weaknesses in their literacy skills were more likely than others to report below average or poor maths skills (Table 8.4).
Table 8.4 Self-assessed maths skills by self-assessed reading and writing skills
SELF-ASSESSED LITERACY
All
Reading and writing both
very/fairly good
Reading very/fairly good
but writing below average/poor
Writing very/fairly good
but reading below average/poor
Reading and writing both
below average/poor
Unable to read
and write
SELF-ASSESSED MATHS SKILLS
% % % % % % Very/ fairly good 92 95 73 74 64 66 Below average/ poor 7 5 25 24 34 29 No opinion/Don’t know * * 2 3 2 5 Unweighted 7230 6594 325 59 235 17
Base: SfL2011 All aged 16-65 Note: small base size
There was also a link between people’s perceived competence in working with numbers and the ability to speak in English. Amongst respondents with ENFL, those with the greatest likelihood of judging their maths skills to be ‘very good’ were people who felt their conversational abilities to be ‘very’ or ‘fairly’ good (57 per cent, compared with 54 per cent of all respondents with ENFL). Meanwhile, people with ENFL who could not hold a conversation in English had a greater
148
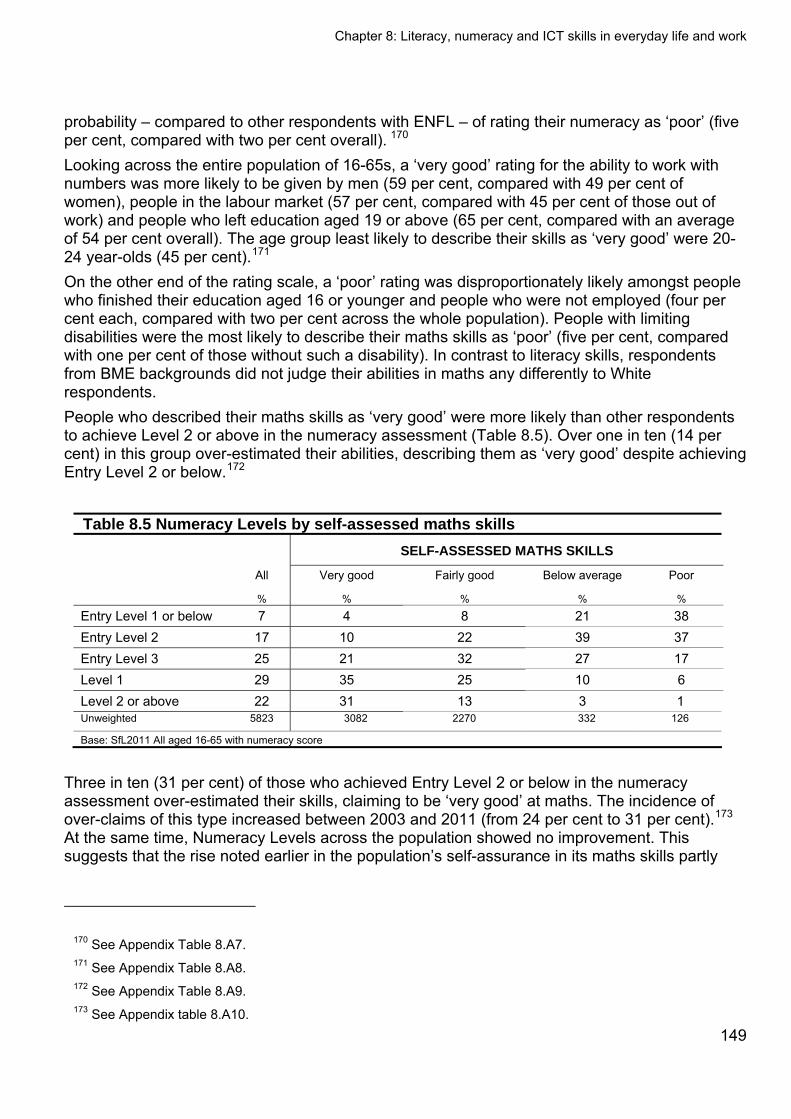
Chapter 8: Literacy, numeracy and ICT skills in everyday life and work
149
probability – compared to other respondents with ENFL – of rating their numeracy as ‘poor’ (five per cent, compared with two per cent overall). 170 Looking across the entire population of 16-65s, a ‘very good’ rating for the ability to work with numbers was more likely to be given by men (59 per cent, compared with 49 per cent of women), people in the labour market (57 per cent, compared with 45 per cent of those out of work) and people who left education aged 19 or above (65 per cent, compared with an average of 54 per cent overall). The age group least likely to describe their skills as ‘very good’ were 20-24 year-olds (45 per cent).171 On the other end of the rating scale, a ‘poor’ rating was disproportionately likely amongst people who finished their education aged 16 or younger and people who were not employed (four per cent each, compared with two per cent across the whole population). People with limiting disabilities were the most likely to describe their maths skills as ‘poor’ (five per cent, compared with one per cent of those without such a disability). In contrast to literacy skills, respondents from BME backgrounds did not judge their abilities in maths any differently to White respondents. People who described their maths skills as ‘very good’ were more likely than other respondents to achieve Level 2 or above in the numeracy assessment (Table 8.5). Over one in ten (14 per cent) in this group over-estimated their abilities, describing them as ‘very good’ despite achieving Entry Level 2 or below.172
Table 8.5 Numeracy Levels by self-assessed maths skills SELF-ASSESSED MATHS SKILLS
All Very good Fairly good Below average Poor
% % % % %
Entry Level 1 or below 7 4 8 21 38 Entry Level 2 17 10 22 39 37 Entry Level 3 25 21 32 27 17 Level 1 29 35 25 10 6 Level 2 or above 22 31 13 3 1 Unweighted 5823 3082 2270 332 126
Base: SfL2011 All aged 16-65 with numeracy score
Three in ten (31 per cent) of those who achieved Entry Level 2 or below in the numeracy assessment over-estimated their skills, claiming to be ‘very good’ at maths. The incidence of over-claims of this type increased between 2003 and 2011 (from 24 per cent to 31 per cent).173 At the same time, Numeracy Levels across the population showed no improvement. This suggests that the rise noted earlier in the population’s self-assurance in its maths skills partly
170 See Appendix Table 8.A7. 171 See Appendix Table 8.A8. 172 See Appendix Table 8.A9. 173 See Appendix table 8.A10.
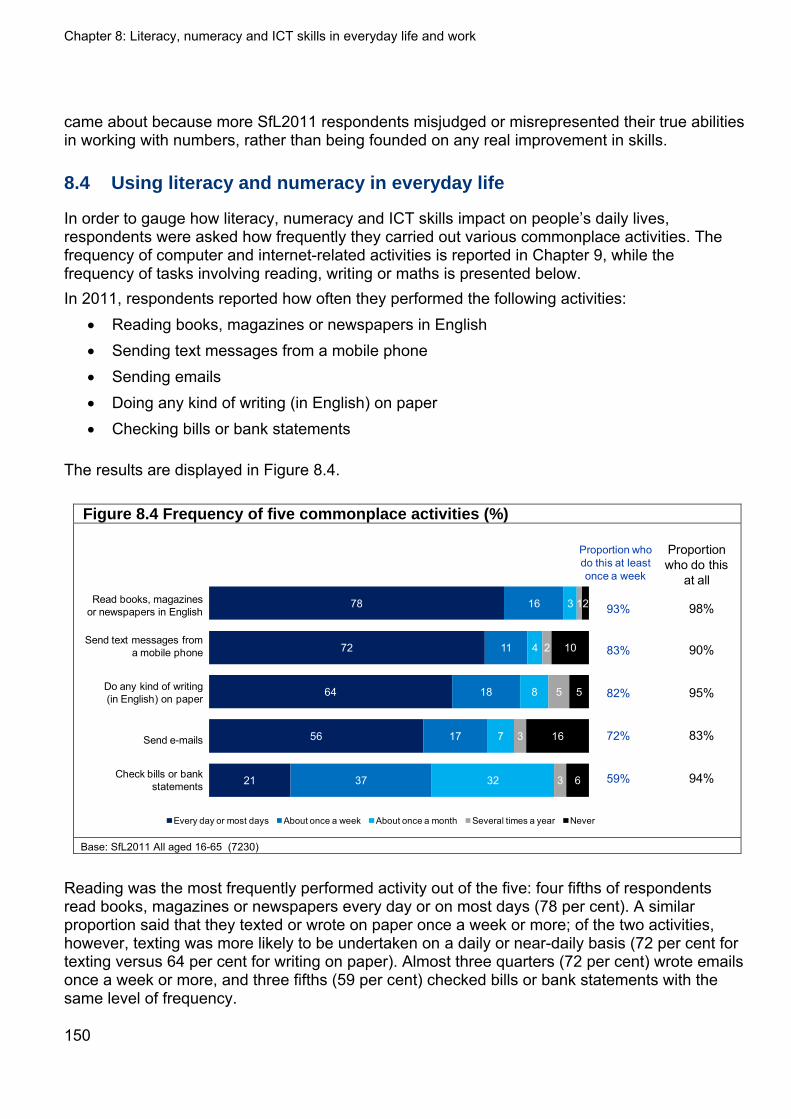
Chapter 8: Literacy, numeracy and ICT skills in everyday life and work
came about because more SfL2011 respondents misjudged or misrepresented their true abilities in working with numbers, rather than being founded on any real improvement in skills.
8.4 Using literacy and numeracy in everyday life
In order to gauge how literacy, numeracy and ICT skills impact on people’s daily lives, respondents were asked how frequently they carried out various commonplace activities. The frequency of computer and internet-related activities is reported in Chapter 9, while the frequency of tasks involving reading, writing or maths is presented below. In 2011, respondents reported how often they performed the following activities:
Reading books, magazines or newspapers in English Sending text messages from a mobile phone Sending emails Doing any kind of writing (in English) on paper Checking bills or bank statements
The results are displayed in Figure 8.4.
Figure 8.4 Frequency of five commonplace activities (%)
78
72
64
56
21
16
11
18
17
37
3
4
8
7
32
1
2
5
3
3
2
10
5
16
6
Every day or most days About once a week About once a month Several times a year Never
Proportion who do this
at all
98%
90%
95%
83%
94%
Read books, magazines or newspapers in English
Send text messages from a mobile phone
Do any kind of writing (in English) on paper
Send e-mails
Check bills or bank statements
Proportion who do this at least once a week
93%
83%
82%
72%
59%
Base: SfL2011 All aged 16-65 (7230)
Reading was the most frequently performed activity out of the five: four fifths of respondents read books, magazines or newspapers every day or on most days (78 per cent). A similar proportion said that they texted or wrote on paper once a week or more; of the two activities, however, texting was more likely to be undertaken on a daily or near-daily basis (72 per cent for texting versus 64 per cent for writing on paper). Almost three quarters (72 per cent) wrote emails once a week or more, and three fifths (59 per cent) checked bills or bank statements with the same level of frequency.
150
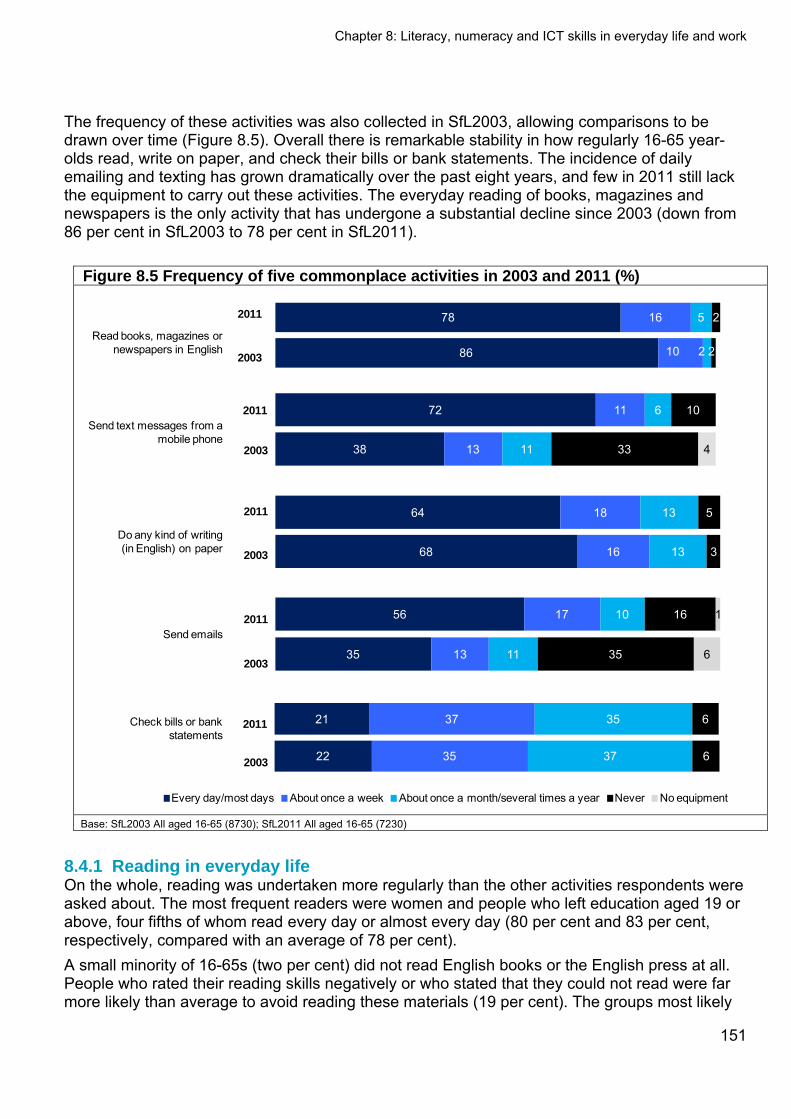
Chapter 8: Literacy, numeracy and ICT skills in everyday life and work
The frequency of these activities was also collected in SfL2003, allowing comparisons to be drawn over time (Figure 8.5). Overall there is remarkable stability in how regularly 16-65 year-olds read, write on paper, and check their bills or bank statements. The incidence of daily emailing and texting has grown dramatically over the past eight years, and few in 2011 still lack the equipment to carry out these activities. The everyday reading of books, magazines and newspapers is the only activity that has undergone a substantial decline since 2003 (down from 86 per cent in SfL2003 to 78 per cent in SfL2011).
Figure 8.5 Frequency of five commonplace activities in 2003 and 2011 (%)
2011
2003
2011
2003
2011
2003
Read books, magazines or newspapers in English
Send text messages from a mobile phone
Do any kind of writing (in English) on paper
Send emails
Check bills or bank statements
2011
2003
2011
2003
86
78
10
16
2
5
2
2
38
72
13
11
11
6
33
10
4
68
64
16
18
13
13
3
5
22
21
35
37
37
35
6
6
35
56
13
17
11
10
35
16
6
1
Every day/most days About once a week About once a month/several times a year Never No equipment
Base: SfL2003 All aged 16-65 (8730); SfL2011 All aged 16-65 (7230)
8.4.1 Reading in everyday life On the whole, reading was undertaken more regularly than the other activities respondents were asked about. The most frequent readers were women and people who left education aged 19 or above, four fifths of whom read every day or almost every day (80 per cent and 83 per cent, respectively, compared with an average of 78 per cent). A small minority of 16-65s (two per cent) did not read English books or the English press at all. People who rated their reading skills negatively or who stated that they could not read were far more likely than average to avoid reading these materials (19 per cent). The groups most likely
151
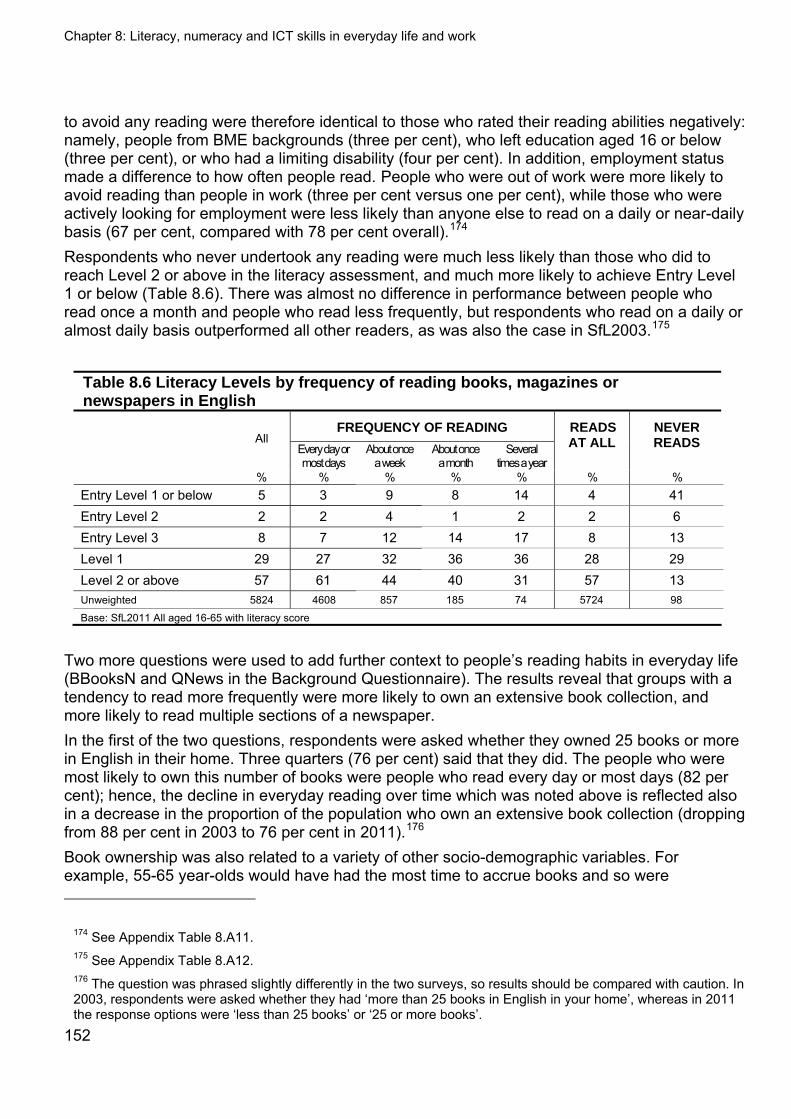
Chapter 8: Literacy, numeracy and ICT skills in everyday life and work
152
to avoid any reading were therefore identical to those who rated their reading abilities negatively: namely, people from BME backgrounds (three per cent), who left education aged 16 or below (three per cent), or who had a limiting disability (four per cent). In addition, employment status made a difference to how often people read. People who were out of work were more likely to avoid reading than people in work (three per cent versus one per cent), while those who were actively looking for employment were less likely than anyone else to read on a daily or near-daily basis (67 per cent, compared with 78 per cent overall).174 Respondents who never undertook any reading were much less likely than those who did to reach Level 2 or above in the literacy assessment, and much more likely to achieve Entry Level 1 or below (Table 8.6). There was almost no difference in performance between people who read once a month and people who read less frequently, but respondents who read on a daily or almost daily basis outperformed all other readers, as was also the case in SfL2003.175
Table 8.6 Literacy Levels by frequency of reading books, magazines or newspapers in English
FREQUENCY OF READING All
Every day or most days
About once a week
About once a month
Several times a year
READS AT ALL
NEVER READS
% % % % % % % Entry Level 1 or below 5 3 9 8 14 4 41 Entry Level 2 2 2 4 1 2 2 6 Entry Level 3 8 7 12 14 17 8 13 Level 1 29 27 32 36 36 28 29 Level 2 or above 57 61 44 40 31 57 13 Unweighted 5824 4608 857 185 74 5724 98
Base: SfL2011 All aged 16-65 with literacy score
Two more questions were used to add further context to people’s reading habits in everyday life (BBooksN and QNews in the Background Questionnaire). The results reveal that groups with a tendency to read more frequently were more likely to own an extensive book collection, and more likely to read multiple sections of a newspaper. In the first of the two questions, respondents were asked whether they owned 25 books or more in English in their home. Three quarters (76 per cent) said that they did. The people who were most likely to own this number of books were people who read every day or most days (82 per cent); hence, the decline in everyday reading over time which was noted above is reflected also in a decrease in the proportion of the population who own an extensive book collection (dropping from 88 per cent in 2003 to 76 per cent in 2011).176 Book ownership was also related to a variety of other socio-demographic variables. For example, 55-65 year-olds would have had the most time to accrue books and so were
174 See Appendix Table 8.A11. 175 See Appendix Table 8.A12. 176 The question was phrased slightly differently in the two surveys, so results should be compared with caution. In 2003, respondents were asked whether they had ‘more than 25 books in English in your home’, whereas in 2011 the response options were ‘less than 25 books’ or ‘25 or more books’.
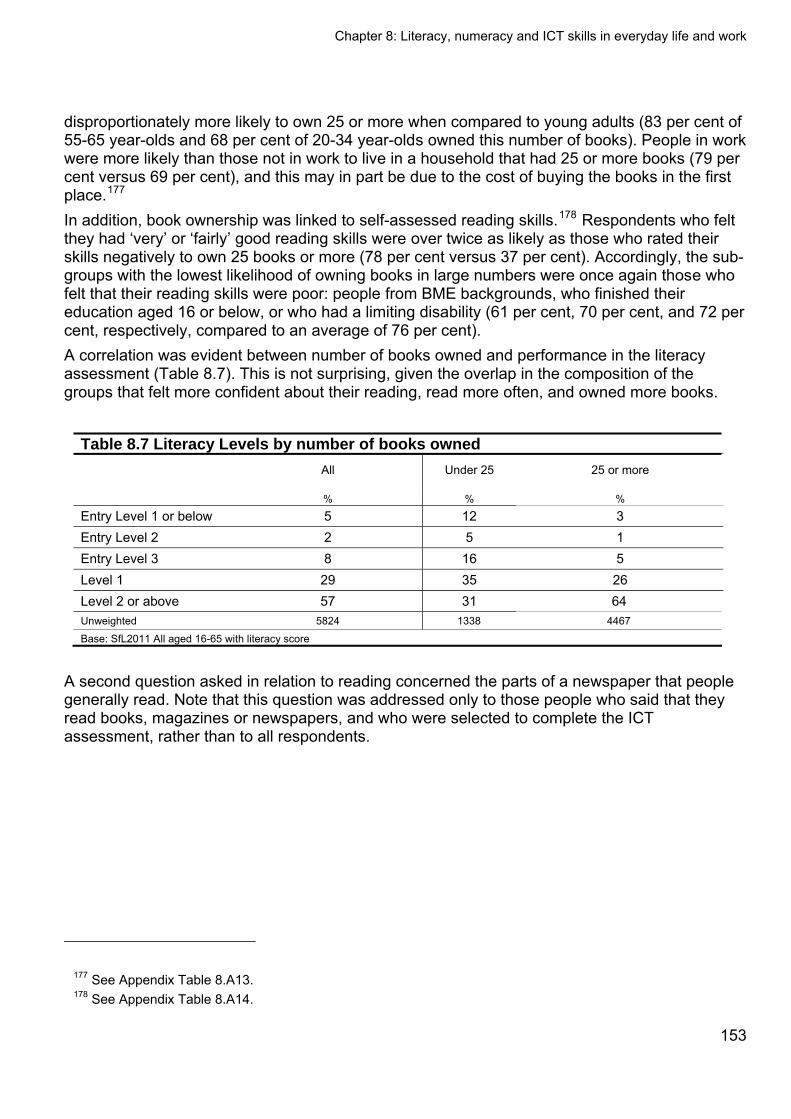
Chapter 8: Literacy, numeracy and ICT skills in everyday life and work
153
disproportionately more likely to own 25 or more when compared to young adults (83 per cent of 55-65 year-olds and 68 per cent of 20-34 year-olds owned this number of books). People in work were more likely than those not in work to live in a household that had 25 or more books (79 per cent versus 69 per cent), and this may in part be due to the cost of buying the books in the first place.177 In addition, book ownership was linked to self-assessed reading skills.178 Respondents who felt they had ‘very’ or ‘fairly’ good reading skills were over twice as likely as those who rated their skills negatively to own 25 books or more (78 per cent versus 37 per cent). Accordingly, the sub-groups with the lowest likelihood of owning books in large numbers were once again those who felt that their reading skills were poor: people from BME backgrounds, who finished their education aged 16 or below, or who had a limiting disability (61 per cent, 70 per cent, and 72 per cent, respectively, compared to an average of 76 per cent). A correlation was evident between number of books owned and performance in the literacy assessment (Table 8.7). This is not surprising, given the overlap in the composition of the groups that felt more confident about their reading, read more often, and owned more books.
Table 8.7 Literacy Levels by number of books owned
All Under 25 25 or more
% % %
Entry Level 1 or below 5 12 3 Entry Level 2 2 5 1 Entry Level 3 8 16 5 Level 1 29 35 26 Level 2 or above 57 31 64 Unweighted 5824 1338 4467
Base: SfL2011 All aged 16-65 with literacy score
A second question asked in relation to reading concerned the parts of a newspaper that people generally read. Note that this question was addressed only to those people who said that they read books, magazines or newspapers, and who were selected to complete the ICT assessment, rather than to all respondents.
177 See Appendix Table 8.A13. 178 See Appendix Table 8.A14.
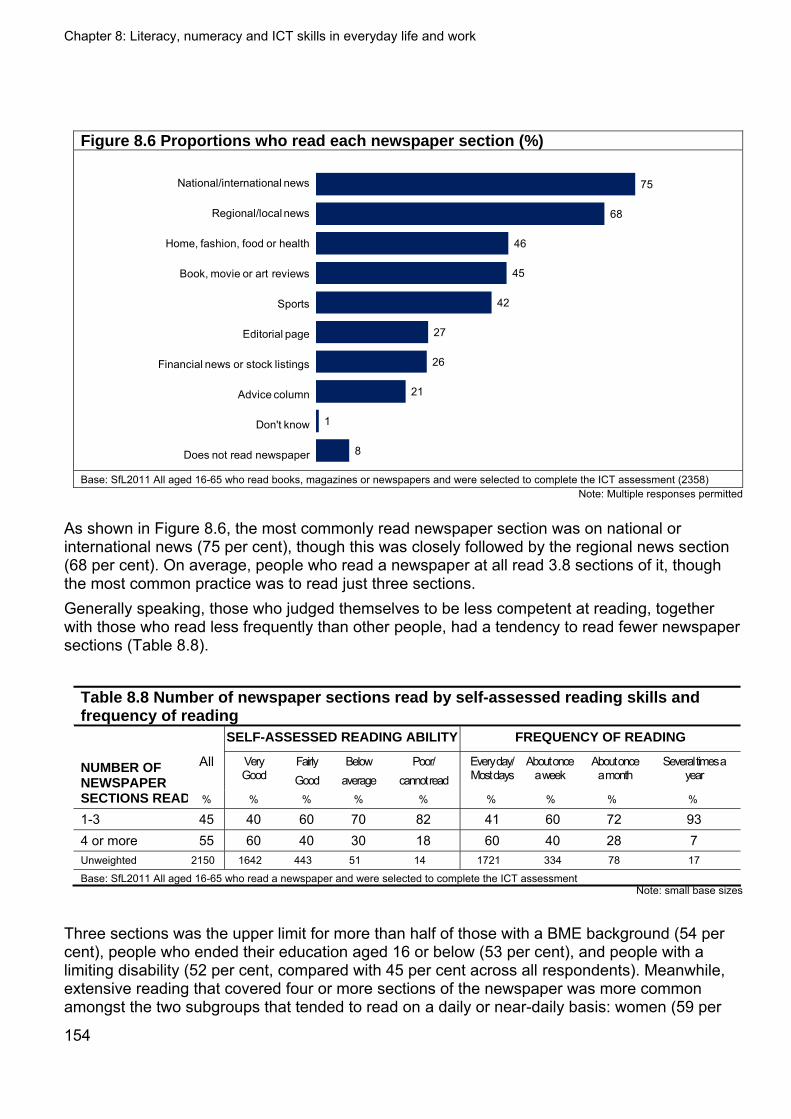
Chapter 8: Literacy, numeracy and ICT skills in everyday life and work
Figure 8.6 Proportions who read each newspaper section (%)
75
68
46
45
42
27
26
21
1
8
National/international news
Regional/local news
Home, fashion, food or health
Book, movie or art reviews
Sports
Editorial page
Financial news or stock listings
Advice column
Don't know
Does not read newspaper Base: SfL2011 All aged 16-65 who read books, magazines or newspapers and were selected to complete the ICT assessment (2358)
Note: Multiple responses permitted
As shown in Figure 8.6, the most commonly read newspaper section was on national or international news (75 per cent), though this was closely followed by the regional news section (68 per cent). On average, people who read a newspaper at all read 3.8 sections of it, though the most common practice was to read just three sections. Generally speaking, those who judged themselves to be less competent at reading, together with those who read less frequently than other people, had a tendency to read fewer newspaper sections (Table 8.8).
Table 8.8 Number of newspaper sections read by self-assessed reading skills and frequency of reading SELF-ASSESSED READING ABILITY FREQUENCY OF READING
All Very Good
Fairly Good
Below average
Poor/ cannot read
Every day/ Most days
About once a week
About once a month
Several times a year NUMBER OF
NEWSPAPER SECTIONS READ % % % % % % % % %
1-3 45 40 60 70 82 41 60 72 93 4 or more 55 60 40 30 18 60 40 28 7 Unweighted 2150 1642 443 51 14 1721 334 78 17
Base: SfL2011 All aged 16-65 who read a newspaper and were selected to complete the ICT assessment Note: small base sizes
Three sections was the upper limit for more than half of those with a BME background (54 per cent), people who ended their education aged 16 or below (53 per cent), and people with a limiting disability (52 per cent, compared with 45 per cent across all respondents). Meanwhile, extensive reading that covered four or more sections of the newspaper was more common amongst the two subgroups that tended to read on a daily or near-daily basis: women (59 per
154
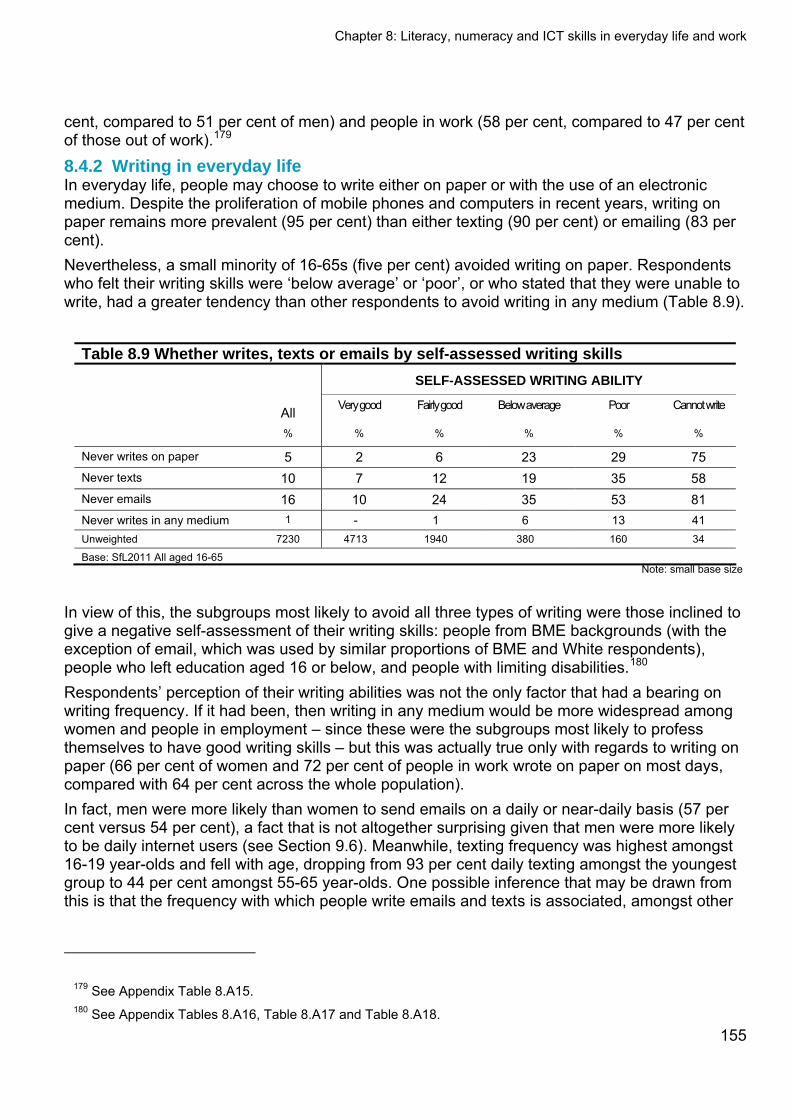
Chapter 8: Literacy, numeracy and ICT skills in everyday life and work
155
cent, compared to 51 per cent of men) and people in work (58 per cent, compared to 47 per cent of those out of work).179 8.4.2 Writing in everyday life In everyday life, people may choose to write either on paper or with the use of an electronic medium. Despite the proliferation of mobile phones and computers in recent years, writing on paper remains more prevalent (95 per cent) than either texting (90 per cent) or emailing (83 per cent). Nevertheless, a small minority of 16-65s (five per cent) avoided writing on paper. Respondents who felt their writing skills were ‘below average’ or ‘poor’, or who stated that they were unable to write, had a greater tendency than other respondents to avoid writing in any medium (Table 8.9).
Table 8.9 Whether writes, texts or emails by self-assessed writing skills
SELF-ASSESSED WRITING ABILITY
All Very good Fairly good Below average Poor Cannot write
% % % % % %
Never writes on paper 5 2 6 23 29 75 Never texts 10 7 12 19 35 58 Never emails 16 10 24 35 53 81 Never writes in any medium 1 - 1 6 13 41 Unweighted 7230 4713 1940 380 160 34
Base: SfL2011 All aged 16-65 Note: small base size
In view of this, the subgroups most likely to avoid all three types of writing were those inclined to give a negative self-assessment of their writing skills: people from BME backgrounds (with the exception of email, which was used by similar proportions of BME and White respondents), people who left education aged 16 or below, and people with limiting disabilities.180 Respondents’ perception of their writing abilities was not the only factor that had a bearing on writing frequency. If it had been, then writing in any medium would be more widespread among women and people in employment – since these were the subgroups most likely to profess themselves to have good writing skills – but this was actually true only with regards to writing on paper (66 per cent of women and 72 per cent of people in work wrote on paper on most days, compared with 64 per cent across the whole population). In fact, men were more likely than women to send emails on a daily or near-daily basis (57 per cent versus 54 per cent), a fact that is not altogether surprising given that men were more likely to be daily internet users (see Section 9.6). Meanwhile, texting frequency was highest amongst 16-19 year-olds and fell with age, dropping from 93 per cent daily texting amongst the youngest group to 44 per cent amongst 55-65 year-olds. One possible inference that may be drawn from this is that the frequency with which people write emails and texts is associated, amongst other
179 See Appendix Table 8.A15. 180 See Appendix Tables 8.A16, Table 8.A17 and Table 8.A18.
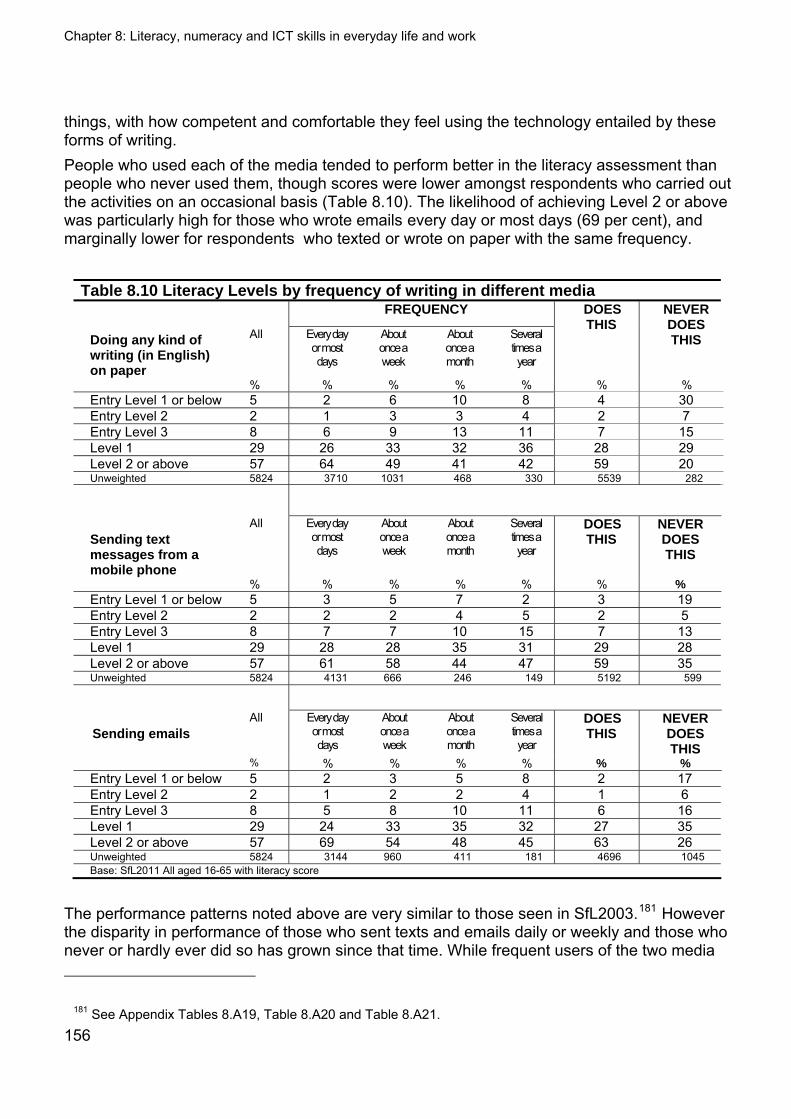
Chapter 8: Literacy, numeracy and ICT skills in everyday life and work
156
things, with how competent and comfortable they feel using the technology entailed by these forms of writing. People who used each of the media tended to perform better in the literacy assessment than people who never used them, though scores were lower amongst respondents who carried out the activities on an occasional basis (Table 8.10). The likelihood of achieving Level 2 or above was particularly high for those who wrote emails every day or most days (69 per cent), and marginally lower for respondents who texted or wrote on paper with the same frequency.
Table 8.10 Literacy Levels by frequency of writing in different media FREQUENCY
Doing any kind of writing (in English) on paper
All Every day or most days
About once a week
About once a month
Several times a year
DOES THIS
NEVER DOES THIS
% % % % % % % Entry Level 1 or below 5 2 6 10 8 4 30 Entry Level 2 2 1 3 3 4 2 7 Entry Level 3 8 6 9 13 11 7 15 Level 1 29 26 33 32 36 28 29 Level 2 or above 57 64 49 41 42 59 20 Unweighted 5824 3710 1031 468 330 5539 282
Sending text messages from a mobile phone
All Every day or most days
About once a week
About once a month
Several times a year
DOES THIS
NEVER DOES THIS
% % % % % % % Entry Level 1 or below 5 3 5 7 2 3 19 Entry Level 2 2 2 2 4 5 2 5 Entry Level 3 8 7 7 10 15 7 13 Level 1 29 28 28 35 31 29 28 Level 2 or above 57 61 58 44 47 59 35 Unweighted 5824 4131 666 246 149 5192 599
Sending emails
All Every day or most days
About once a week
About once a month
Several times a year
DOES THIS
NEVER DOES THIS
% % % % % % % Entry Level 1 or below 5 2 3 5 8 2 17 Entry Level 2 2 1 2 2 4 1 6 Entry Level 3 8 5 8 10 11 6 16 Level 1 29 24 33 35 32 27 35 Level 2 or above 57 69 54 48 45 63 26 Unweighted 5824 3144 960 411 181 4696 1045 Base: SfL2011 All aged 16-65 with literacy score
The performance patterns noted above are very similar to those seen in SfL2003.181 However the disparity in performance of those who sent texts and emails daily or weekly and those who never or hardly ever did so has grown since that time. While frequent users of the two media
181 See Appendix Tables 8.A19, Table 8.A20 and Table 8.A21.
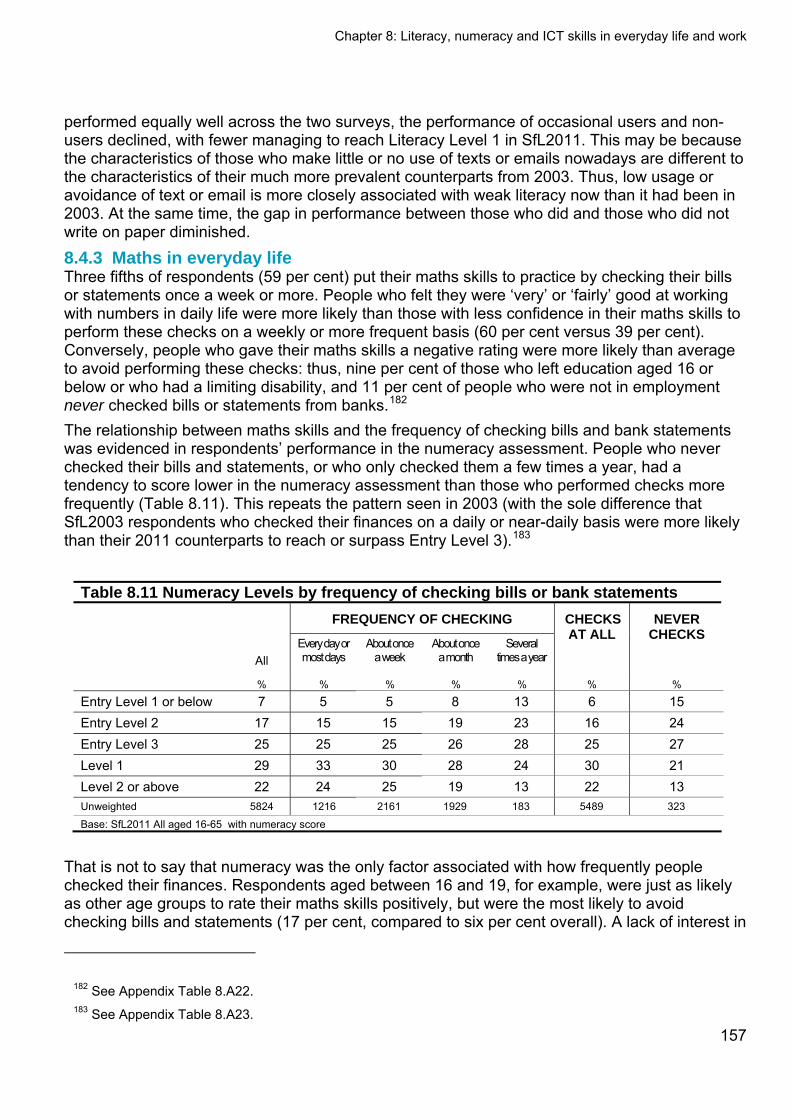
Chapter 8: Literacy, numeracy and ICT skills in everyday life and work
157
performed equally well across the two surveys, the performance of occasional users and non-users declined, with fewer managing to reach Literacy Level 1 in SfL2011. This may be because the characteristics of those who make little or no use of texts or emails nowadays are different to the characteristics of their much more prevalent counterparts from 2003. Thus, low usage or avoidance of text or email is more closely associated with weak literacy now than it had been in 2003. At the same time, the gap in performance between those who did and those who did not write on paper diminished. 8.4.3 Maths in everyday life Three fifths of respondents (59 per cent) put their maths skills to practice by checking their bills or statements once a week or more. People who felt they were ‘very’ or ‘fairly’ good at working with numbers in daily life were more likely than those with less confidence in their maths skills to perform these checks on a weekly or more frequent basis (60 per cent versus 39 per cent). Conversely, people who gave their maths skills a negative rating were more likely than average to avoid performing these checks: thus, nine per cent of those who left education aged 16 or below or who had a limiting disability, and 11 per cent of people who were not in employment never checked bills or statements from banks.182 The relationship between maths skills and the frequency of checking bills and bank statements was evidenced in respondents’ performance in the numeracy assessment. People who never checked their bills and statements, or who only checked them a few times a year, had a tendency to score lower in the numeracy assessment than those who performed checks more frequently (Table 8.11). This repeats the pattern seen in 2003 (with the sole difference that SfL2003 respondents who checked their finances on a daily or near-daily basis were more likely than their 2011 counterparts to reach or surpass Entry Level 3).183
Table 8.11 Numeracy Levels by frequency of checking bills or bank statements FREQUENCY OF CHECKING
All Every day or most days
About once a week
About once a month
Several times a year
CHECKS AT ALL
NEVER CHECKS
% % % % % % %
Entry Level 1 or below 7 5 5 8 13 6 15 Entry Level 2 17 15 15 19 23 16 24 Entry Level 3 25 25 25 26 28 25 27 Level 1 29 33 30 28 24 30 21 Level 2 or above 22 24 25 19 13 22 13 Unweighted 5824 1216 2161 1929 183 5489 323
Base: SfL2011 All aged 16-65 with numeracy score
That is not to say that numeracy was the only factor associated with how frequently people checked their finances. Respondents aged between 16 and 19, for example, were just as likely as other age groups to rate their maths skills positively, but were the most likely to avoid checking bills and statements (17 per cent, compared to six per cent overall). A lack of interest in
182 See Appendix Table 8.A22. 183 See Appendix Table 8.A23.
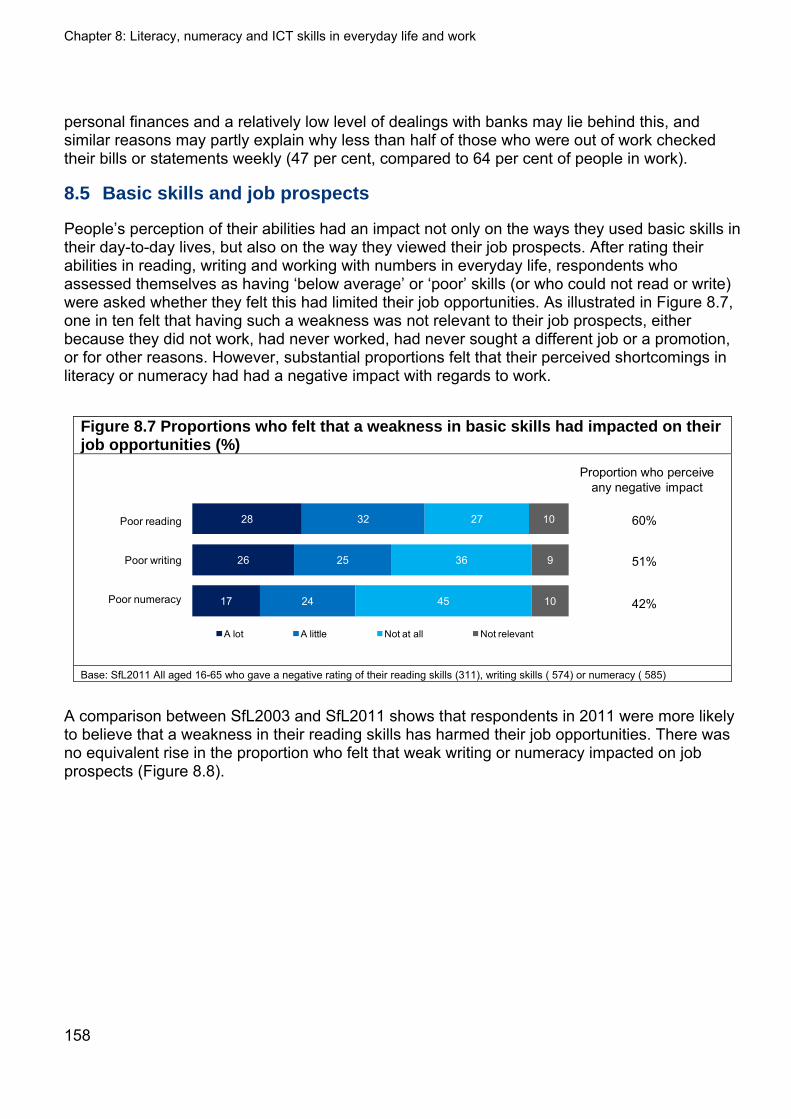
Chapter 8: Literacy, numeracy and ICT skills in everyday life and work
personal finances and a relatively low level of dealings with banks may lie behind this, and similar reasons may partly explain why less than half of those who were out of work checked their bills or statements weekly (47 per cent, compared to 64 per cent of people in work).
8.5 Basic skills and job prospects
People’s perception of their abilities had an impact not only on the ways they used basic skills in their day-to-day lives, but also on the way they viewed their job prospects. After rating their abilities in reading, writing and working with numbers in everyday life, respondents who assessed themselves as having ‘below average’ or ‘poor’ skills (or who could not read or write) were asked whether they felt this had limited their job opportunities. As illustrated in Figure 8.7, one in ten felt that having such a weakness was not relevant to their job prospects, either because they did not work, had never worked, had never sought a different job or a promotion, or for other reasons. However, substantial proportions felt that their perceived shortcomings in literacy or numeracy had had a negative impact with regards to work.
Figure 8.7 Proportions who felt that a weakness in basic skills had impacted on their job opportunities (%)
28
26
17
32
25
24
27
36
45
10
9
10
A lot A little Not at all Not relevant
Proportion who perceive any negative impact
60%
51%
42%
Poor reading
Poor writing
Poor numeracy
Base: SfL2011 All aged 16-65 who gave a negative rating of their reading skills (311), writing skills ( 574) or numeracy ( 585)
A comparison between SfL2003 and SfL2011 shows that respondents in 2011 were more likely to believe that a weakness in their reading skills has harmed their job opportunities. There was no equivalent rise in the proportion who felt that weak writing or numeracy impacted on job prospects (Figure 8.8).
158
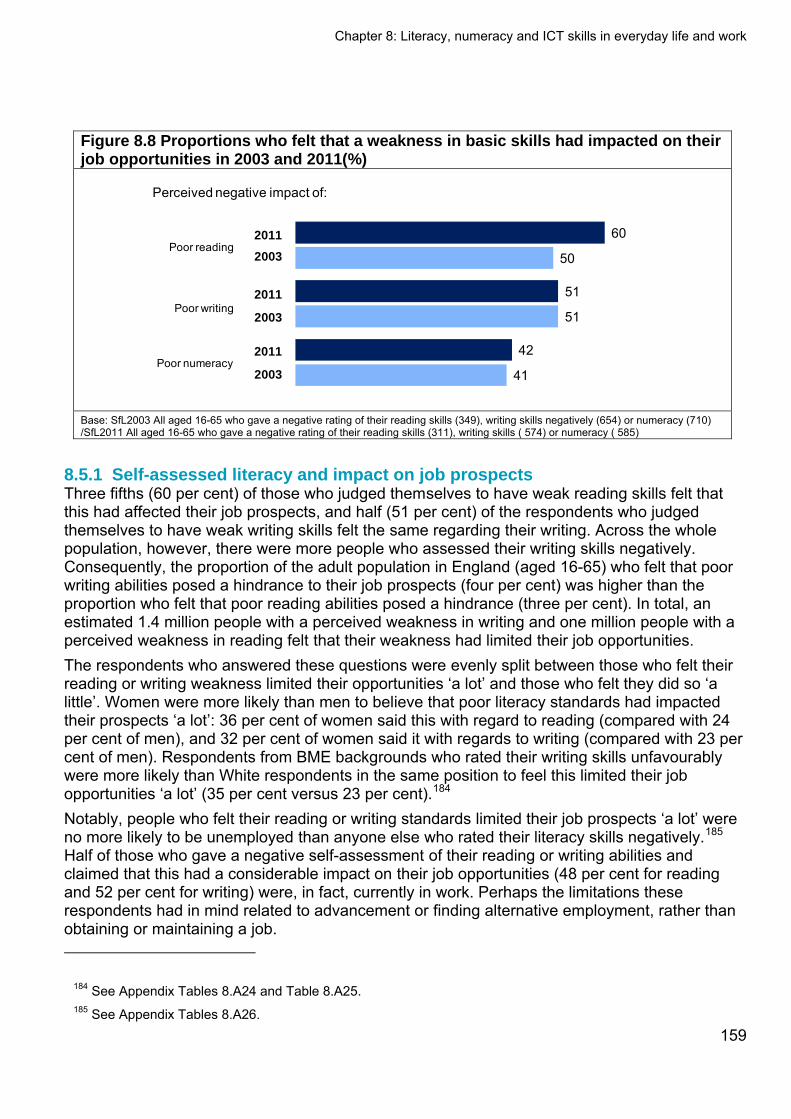
Chapter 8: Literacy, numeracy and ICT skills in everyday life and work
Figure 8.8 Proportions who felt that a weakness in basic skills had impacted on their job opportunities in 2003 and 2011(%)
41
51
50
42
51
602011
2003
2011
2003
2011
2003
Poor reading
Poor writing
Poor numeracy
Perceived negative impact of:
Base: SfL2003 All aged 16-65 who gave a negative rating of their reading skills (349), writing skills negatively (654) or numeracy (710) /SfL2011 All aged 16-65 who gave a negative rating of their reading skills (311), writing skills ( 574) or numeracy ( 585)
8.5.1 Self-assessed literacy and impact on job prospects Three fifths (60 per cent) of those who judged themselves to have weak reading skills felt that this had affected their job prospects, and half (51 per cent) of the respondents who judged themselves to have weak writing skills felt the same regarding their writing. Across the whole population, however, there were more people who assessed their writing skills negatively. Consequently, the proportion of the adult population in England (aged 16-65) who felt that poor writing abilities posed a hindrance to their job prospects (four per cent) was higher than the proportion who felt that poor reading abilities posed a hindrance (three per cent). In total, an estimated 1.4 million people with a perceived weakness in writing and one million people with a perceived weakness in reading felt that their weakness had limited their job opportunities. The respondents who answered these questions were evenly split between those who felt their reading or writing weakness limited their opportunities ‘a lot’ and those who felt they did so ‘a little’. Women were more likely than men to believe that poor literacy standards had impacted their prospects ‘a lot’: 36 per cent of women said this with regard to reading (compared with 24 per cent of men), and 32 per cent of women said it with regards to writing (compared with 23 per cent of men). Respondents from BME backgrounds who rated their writing skills unfavourably were more likely than White respondents in the same position to feel this limited their job opportunities ‘a lot’ (35 per cent versus 23 per cent).184 Notably, people who felt their reading or writing standards limited their job prospects ‘a lot’ were no more likely to be unemployed than anyone else who rated their literacy skills negatively.185 Half of those who gave a negative self-assessment of their reading or writing abilities and claimed that this had a considerable impact on their job opportunities (48 per cent for reading and 52 per cent for writing) were, in fact, currently in work. Perhaps the limitations these respondents had in mind related to advancement or finding alternative employment, rather than obtaining or maintaining a job.
184 See Appendix Tables 8.A24 and Table 8.A25. 185 See Appendix Tables 8.A26.
159
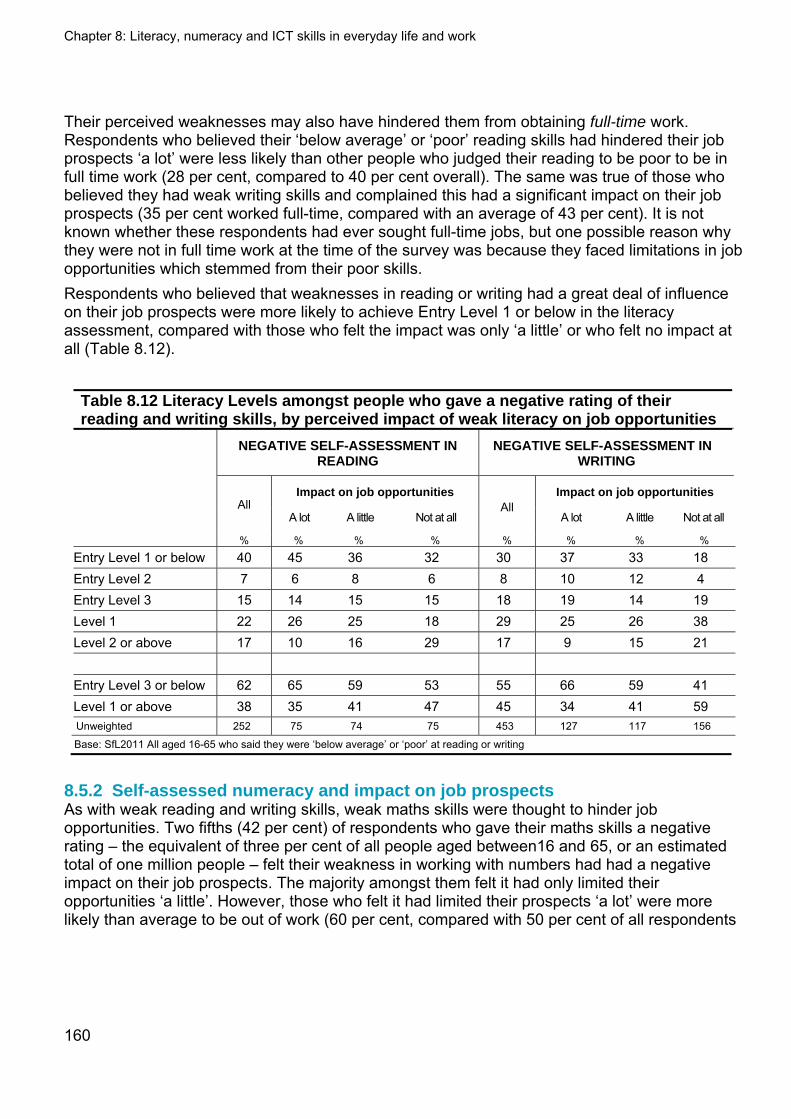
Chapter 8: Literacy, numeracy and ICT skills in everyday life and work
160
Their perceived weaknesses may also have hindered them from obtaining full-time work. Respondents who believed their ‘below average’ or ‘poor’ reading skills had hindered their job prospects ‘a lot’ were less likely than other people who judged their reading to be poor to be in full time work (28 per cent, compared to 40 per cent overall). The same was true of those who believed they had weak writing skills and complained this had a significant impact on their job prospects (35 per cent worked full-time, compared with an average of 43 per cent). It is not known whether these respondents had ever sought full-time jobs, but one possible reason why they were not in full time work at the time of the survey was because they faced limitations in job opportunities which stemmed from their poor skills. Respondents who believed that weaknesses in reading or writing had a great deal of influence on their job prospects were more likely to achieve Entry Level 1 or below in the literacy assessment, compared with those who felt the impact was only ‘a little’ or who felt no impact at all (Table 8.12).
Table 8.12 Literacy Levels amongst people who gave a negative rating of their reading and writing skills, by perceived impact of weak literacy on job opportunities
NEGATIVE SELF-ASSESSMENT IN READING
NEGATIVE SELF-ASSESSMENT IN WRITING
Impact on job opportunities Impact on job opportunities
All A lot A little Not at all
All A lot A little Not at all
% % % % % % % %
Entry Level 1 or below 40 45 36 32 30 37 33 18 Entry Level 2 7 6 8 6 8 10 12 4 Entry Level 3 15 14 15 15 18 19 14 19 Level 1 22 26 25 18 29 25 26 38 Level 2 or above 17 10 16 29 17 9 15 21 Entry Level 3 or below 62 65 59 53 55 66 59 41 Level 1 or above 38 35 41 47 45 34 41 59 Unweighted 252 75 74 75 453 127 117 156
Base: SfL2011 All aged 16-65 who said they were ‘below average’ or ‘poor’ at reading or writing
8.5.2 Self-assessed numeracy and impact on job prospects As with weak reading and writing skills, weak maths skills were thought to hinder job opportunities. Two fifths (42 per cent) of respondents who gave their maths skills a negative rating – the equivalent of three per cent of all people aged between16 and 65, or an estimated total of one million people – felt their weakness in working with numbers had had a negative impact on their job prospects. The majority amongst them felt it had only limited their opportunities ‘a little’. However, those who felt it had limited their prospects ‘a lot’ were more likely than average to be out of work (60 per cent, compared with 50 per cent of all respondents
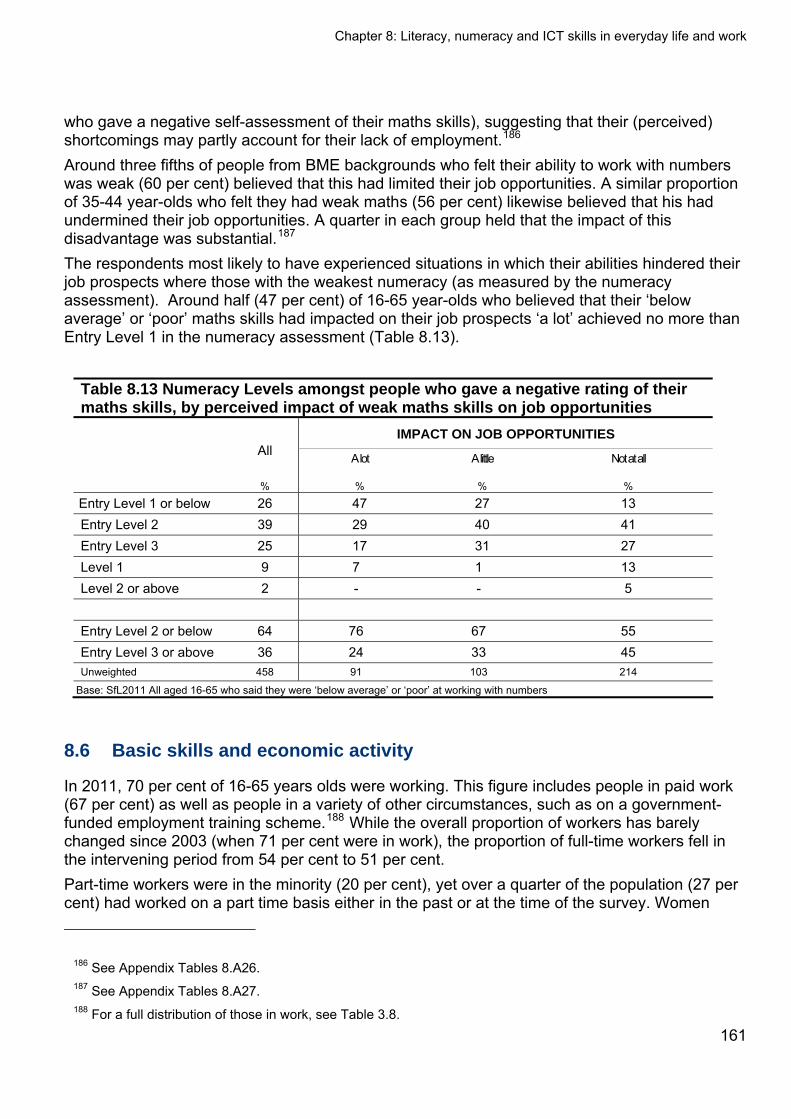
Chapter 8: Literacy, numeracy and ICT skills in everyday life and work
161
who gave a negative self-assessment of their maths skills), suggesting that their (perceived) shortcomings may partly account for their lack of employment.186 Around three fifths of people from BME backgrounds who felt their ability to work with numbers was weak (60 per cent) believed that this had limited their job opportunities. A similar proportion of 35-44 year-olds who felt they had weak maths (56 per cent) likewise believed that his had undermined their job opportunities. A quarter in each group held that the impact of this disadvantage was substantial.187 The respondents most likely to have experienced situations in which their abilities hindered their job prospects where those with the weakest numeracy (as measured by the numeracy assessment). Around half (47 per cent) of 16-65 year-olds who believed that their ‘below average’ or ‘poor’ maths skills had impacted on their job prospects ‘a lot’ achieved no more than Entry Level 1 in the numeracy assessment (Table 8.13).
Table 8.13 Numeracy Levels amongst people who gave a negative rating of their maths skills, by perceived impact of weak maths skills on job opportunities
IMPACT ON JOB OPPORTUNITIES All A lot A little Not at all
% % % %
Entry Level 1 or below 26 47 27 13 Entry Level 2 39 29 40 41 Entry Level 3 25 17 31 27 Level 1 9 7 1 13 Level 2 or above 2 - - 5 Entry Level 2 or below 64 76 67 55 Entry Level 3 or above 36 24 33 45 Unweighted 458 91 103 214
Base: SfL2011 All aged 16-65 who said they were ‘below average’ or ‘poor’ at working with numbers
8.6 Basic skills and economic activity
In 2011, 70 per cent of 16-65 years olds were working. This figure includes people in paid work (67 per cent) as well as people in a variety of other circumstances, such as on a government- funded employment training scheme.188 While the overall proportion of workers has barely changed since 2003 (when 71 per cent were in work), the proportion of full-time workers fell in the intervening period from 54 per cent to 51 per cent. Part-time workers were in the minority (20 per cent), yet over a quarter of the population (27 per cent) had worked on a part time basis either in the past or at the time of the survey. Women
186 See Appendix Tables 8.A26. 187 See Appendix Tables 8.A27. 188 For a full distribution of those in work, see Table 3.8.
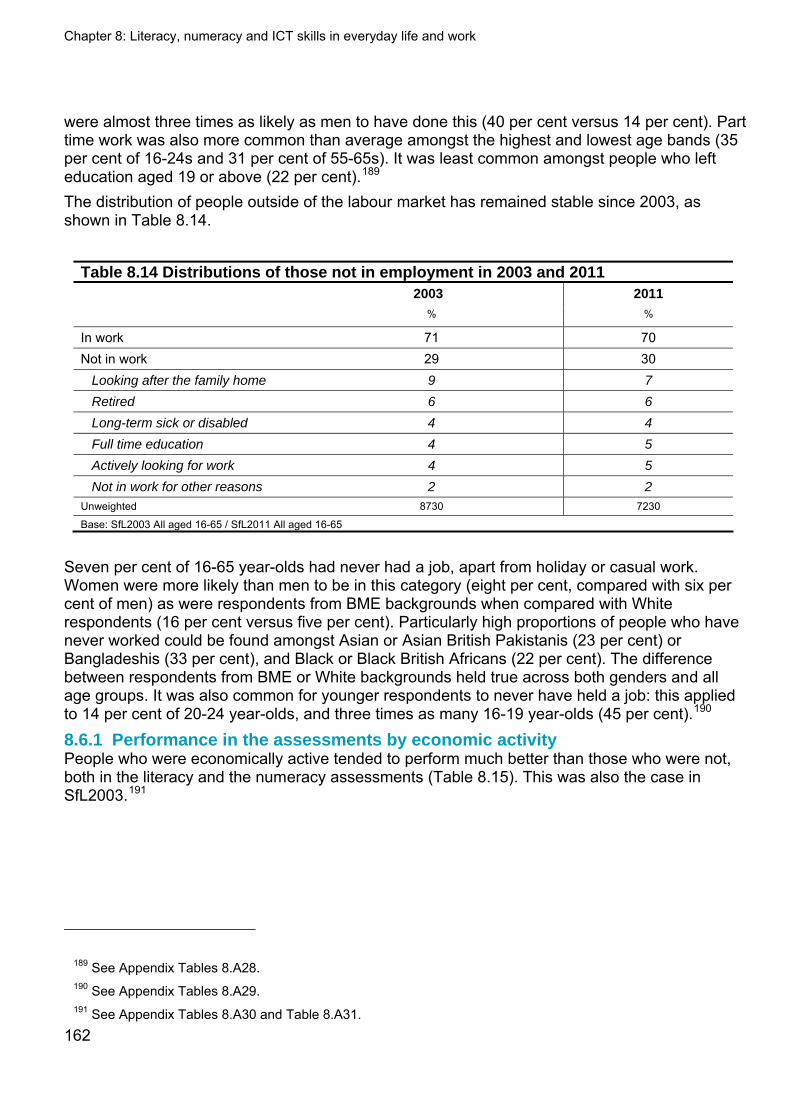
Chapter 8: Literacy, numeracy and ICT skills in everyday life and work
162
were almost three times as likely as men to have done this (40 per cent versus 14 per cent). Part time work was also more common than average amongst the highest and lowest age bands (35 per cent of 16-24s and 31 per cent of 55-65s). It was least common amongst people who left education aged 19 or above (22 per cent).189 The distribution of people outside of the labour market has remained stable since 2003, as shown in Table 8.14.
Table 8.14 Distributions of those not in employment in 2003 and 2011 2003 2011
% %
In work 71 70 Not in work 29 30 Looking after the family home 9 7
Retired 6 6
Long-term sick or disabled 4 4
Full time education 4 5
Actively looking for work 4 5
Not in work for other reasons 2 2
Unweighted 8730 7230
Base: SfL2003 All aged 16-65 / SfL2011 All aged 16-65
Seven per cent of 16-65 year-olds had never had a job, apart from holiday or casual work. Women were more likely than men to be in this category (eight per cent, compared with six per cent of men) as were respondents from BME backgrounds when compared with White respondents (16 per cent versus five per cent). Particularly high proportions of people who have never worked could be found amongst Asian or Asian British Pakistanis (23 per cent) or Bangladeshis (33 per cent), and Black or Black British Africans (22 per cent). The difference between respondents from BME or White backgrounds held true across both genders and all age groups. It was also common for younger respondents to never have held a job: this applied to 14 per cent of 20-24 year-olds, and three times as many 16-19 year-olds (45 per cent).190 8.6.1 Performance in the assessments by economic activity People who were economically active tended to perform much better than those who were not, both in the literacy and the numeracy assessments (Table 8.15). This was also the case in SfL2003.191
189 See Appendix Tables 8.A28. 190 See Appendix Tables 8.A29. 191 See Appendix Tables 8.A30 and Table 8.A31.
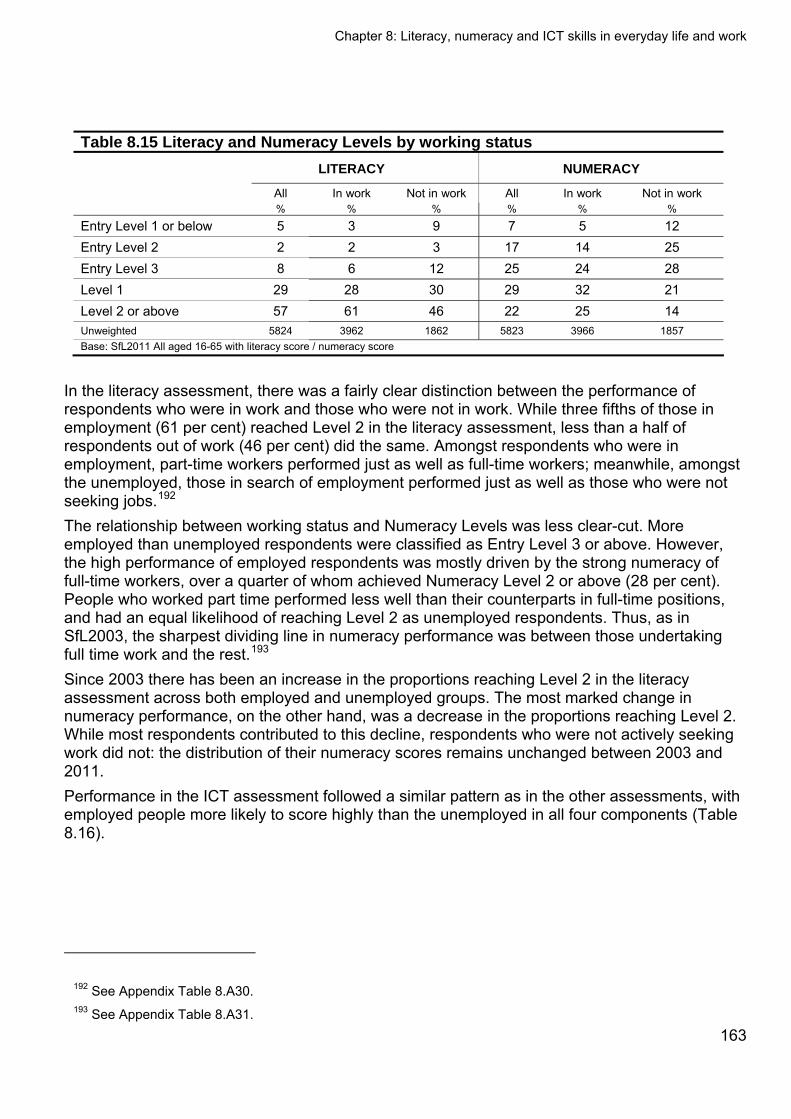
Chapter 8: Literacy, numeracy and ICT skills in everyday life and work
163
Table 8.15 Literacy and Numeracy Levels by working status
LITERACY NUMERACY
All In work Not in work All In work Not in work % % % % % %
Entry Level 1 or below 5 3 9 7 5 12 Entry Level 2 2 2 3 17 14 25 Entry Level 3 8 6 12 25 24 28 Level 1 29 28 30 29 32 21 Level 2 or above 57 61 46 22 25 14 Unweighted 5824 3962 1862 5823 3966 1857 Base: SfL2011 All aged 16-65 with literacy score / numeracy score
In the literacy assessment, there was a fairly clear distinction between the performance of respondents who were in work and those who were not in work. While three fifths of those in employment (61 per cent) reached Level 2 in the literacy assessment, less than a half of respondents out of work (46 per cent) did the same. Amongst respondents who were in employment, part-time workers performed just as well as full-time workers; meanwhile, amongst the unemployed, those in search of employment performed just as well as those who were not seeking jobs.192 The relationship between working status and Numeracy Levels was less clear-cut. More employed than unemployed respondents were classified as Entry Level 3 or above. However, the high performance of employed respondents was mostly driven by the strong numeracy of full-time workers, over a quarter of whom achieved Numeracy Level 2 or above (28 per cent). People who worked part time performed less well than their counterparts in full-time positions, and had an equal likelihood of reaching Level 2 as unemployed respondents. Thus, as in SfL2003, the sharpest dividing line in numeracy performance was between those undertaking full time work and the rest.193 Since 2003 there has been an increase in the proportions reaching Level 2 in the literacy assessment across both employed and unemployed groups. The most marked change in numeracy performance, on the other hand, was a decrease in the proportions reaching Level 2. While most respondents contributed to this decline, respondents who were not actively seeking work did not: the distribution of their numeracy scores remains unchanged between 2003 and 2011. Performance in the ICT assessment followed a similar pattern as in the other assessments, with employed people more likely to score highly than the unemployed in all four components (Table 8.16).
192 See Appendix Table 8.A30. 193 See Appendix Table 8.A31.
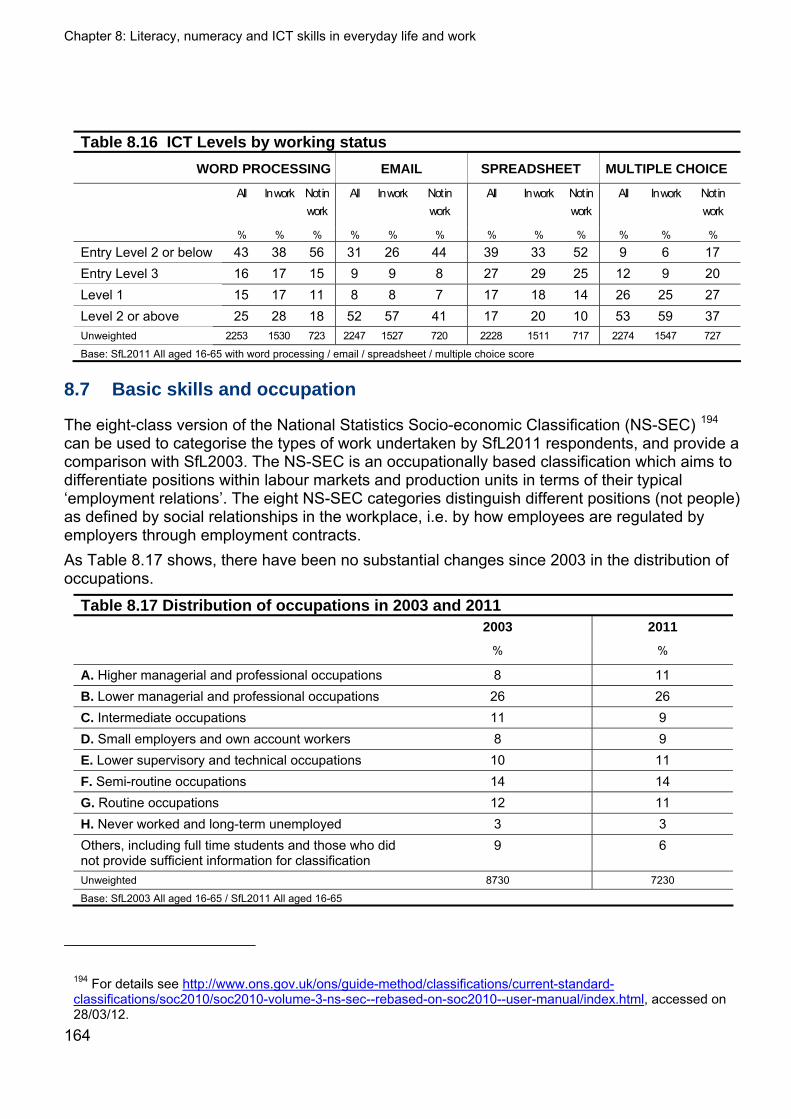
Chapter 8: Literacy, numeracy and ICT skills in everyday life and work
164
Table 8.16 ICT Levels by working status
WORD PROCESSING EMAIL SPREADSHEET MULTIPLE CHOICE
All
In work Not in work
All
In work
Not in work
All
In work
Not in work
All
In work
Not in work
% % % % % % % % % % % %
Entry Level 2 or below 43 38 56 31 26 44 39 33 52 9 6 17 Entry Level 3 16 17 15 9 9 8 27 29 25 12 9 20 Level 1 15 17 11 8 8 7 17 18 14 26 25 27 Level 2 or above 25 28 18 52 57 41 17 20 10 53 59 37 Unweighted 2253 1530 723 2247 1527 720 2228 1511 717 2274 1547 727
Base: SfL2011 All aged 16-65 with word processing / email / spreadsheet / multiple choice score
8.7 Basic skills and occupation
The eight-class version of the National Statistics Socio-economic Classification (NS-SEC) 194 can be used to categorise the types of work undertaken by SfL2011 respondents, and provide a comparison with SfL2003. The NS-SEC is an occupationally based classification which aims to differentiate positions within labour markets and production units in terms of their typical ‘employment relations’. The eight NS-SEC categories distinguish different positions (not people) as defined by social relationships in the workplace, i.e. by how employees are regulated by employers through employment contracts. As Table 8.17 shows, there have been no substantial changes since 2003 in the distribution of occupations.
Table 8.17 Distribution of occupations in 2003 and 2011 2003 2011
% %
A. Higher managerial and professional occupations 8 11 B. Lower managerial and professional occupations 26 26 C. Intermediate occupations 11 9 D. Small employers and own account workers 8 9 E. Lower supervisory and technical occupations 10 11 F. Semi-routine occupations 14 14 G. Routine occupations 12 11 H. Never worked and long-term unemployed 3 3 Others, including full time students and those who did not provide sufficient information for classification
9 6
Unweighted 8730 7230
Base: SfL2003 All aged 16-65 / SfL2011 All aged 16-65
194 For details see http://www.ons.gov.uk/ons/guide-method/classifications/current-standard-classifications/soc2010/soc2010-volume-3-ns-sec--rebased-on-soc2010--user-manual/index.html, accessed on 28/03/12.
Chapter 8: Literacy, numeracy and ICT skills in everyday life and work
165
In both years, a quarter of respondents (26 per cent) were in Lower managerial and professional occupations, and similar proportions were in Routine or Semi-routine occupations. A minority of around one in ten respondents were outside the labour market or unclassifiable (with the proportion from SfL2011 slightly lower than that from SfL2003), while the rest of the population was distributed fairly evenly across the remaining four NS-SEC classes. A closer look at respondents who were either currently employed or had been employed in the past reveals that gender and age have a bearing on the type of work people do. While men and women had an even chance of employment in Routine jobs (13 per cent and 12 per cent, respectively), more women than men had experience of Lower managerial, Intermediate and Semi-routine occupations, and more men than women had experience of the remaining types of job. Younger respondents were more likely to have worked in Intermediate, Semi-routine and Routine occupations, and older ones in professional occupations or as Small employers or own account workers.195 In addition, people who had a limiting disability were more likely than other respondents to have a Routine occupation (20 per cent, compared to 12 per cent overall) or a Semi-routine occupation (19 per cent, compared to 16 per cent overall), while respondents from BME backgrounds had a higher than average likelihood of being in Semi-routine occupations (19 per cent, compared with 15 per cent among White respondents). The work that people were in was also linked to the age they were when they finished their education. Those who continued their education past the age of 18 were more likely than others to be in managerial occupations; meanwhile, people who ceased their education when they were 16 or younger were more likely to be in every other type of occupation, with the exception of Intermediate occupations which were most likely to be staffed by people who left education aged 17 or 18. Finally, there was a link between respondents’ occupation and their perception of their abilities in reading and writing, working with numbers, and using computers (Table 8.18). People who rated their literacy positively were more likely than others to have worked in managerial or intermediate occupations, and less likely to be in alternative types of work. People who described their numeracy as ‘very good’ were the most likely to be in managerial or professional jobs; the same people were the least likely to be in Lower supervisory and technical, Semi-routine or Routine occupations. Similarly, people who felt they were ‘very good’ with computers had a higher likelihood of being in managerial positions, and a lower likelihood than anyone else of being in most other types of work. It should be pointed out that it is not necessarily the case that people’s employment equipped them to improve or view their skills positively; the direction of causation is unclear, and it is possible that high job status and a positive perception of skills are mutually reinforcing characteristics.
195 See Appendix Table 8.A32 for the occupations of people who have ever been in work, and Appendix Table 8.A33 for the occupations of people who are currently in work, broken down by demographics.

Chapter 8: Literacy, numeracy and ICT skills in everyday life and work
166
Table 8.18 Occupations amongst those who have ever been in work, by self- assessed abilities in literacy, numeracy and ICT
LITERACY SELF-
ASSESSMENT
NUMERACY SELF-
ASSESSMENT
ICT SELF-
ASSESSMENT
Negative (both skills)
Positive (both skills)
Negative
Positive
Negative
Positive
% % % % % %
A. Higher managerial and professional 5 13 4 13 3 15 B. Lower managerial and professional 8 31 14 30 19 32 C. Intermediate 6 11 10 10 7 12 D. Small employers and own account workers 11 9 8 10 15 8 E. Lower supervisory and technical 16 11 15 11 17 10 F. Semi-routine 25 15 23 15 21 14 G. Routine 30 11 26 11 18 9 Unweighted 193 6174 511 6202 1141 5057
Base: SfL2011 All aged 16-65 who have ever been in work and who gave a rating for their reading, writing, maths and ICT skills
8.7.1 Performance in the assessments by occupation The following analysis is based only on those people who were in employment at the time of the interview (70 per cent of all respondents). The Literacy Levels achieved by each occupational group are illustrated in Table 8.19.
Table 8.19 Literacy Levels amongst those who work, by occupation OCCUPATION A B C D E F G
All
Higher managerial
and professional
Lower managerial
and professional
Intermediate Small employers and own account
workers
Lower supervisory
and technical
Semi routine
Routine
% % % % % % % %
Entry Level 1 or below 3 2 1 1 5 7 4 7 Entry Level 2 2 * * * 3 2 4 4 Entry Level 3 6 3 4 6 4 8 9 13 Level 1 28 14 24 28 37 33 36 33 Level 2 or above 61 81 71 65 51 50 48 42 Entry Level 3 or below 11 5 5 7 12 17 16 24 Level 1 or above 89 95 95 93 88 83 84 76 Unweighted 3936 515 1229 424 388 426 588 366
Base: SfL2011 All aged 16-65 who work and have literacy score
Respondents in managerial and professional positions and Intermediate occupations were more likely than average to achieve a Level 1 or above score, with just over nine in ten respondents from each of categories A, B and C achieving this. However, within these three categories,
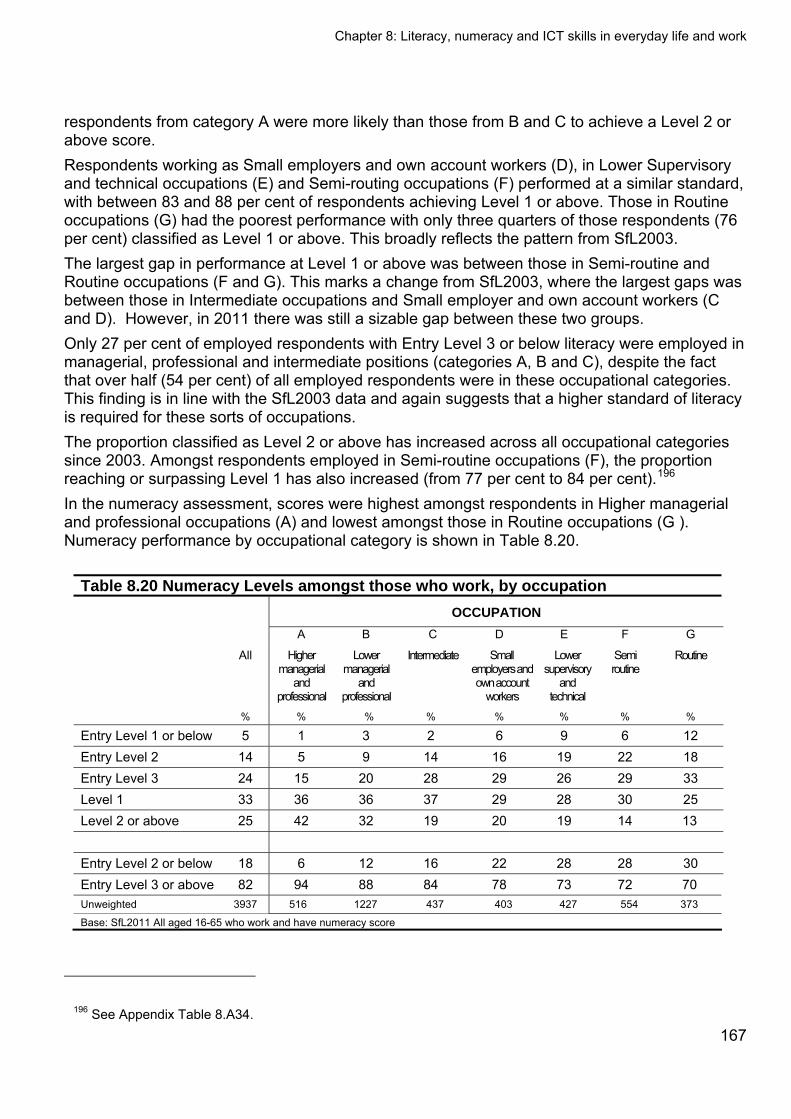
Chapter 8: Literacy, numeracy and ICT skills in everyday life and work
167
respondents from category A were more likely than those from B and C to achieve a Level 2 or above score. Respondents working as Small employers and own account workers (D), in Lower Supervisory and technical occupations (E) and Semi-routing occupations (F) performed at a similar standard, with between 83 and 88 per cent of respondents achieving Level 1 or above. Those in Routine occupations (G) had the poorest performance with only three quarters of those respondents (76 per cent) classified as Level 1 or above. This broadly reflects the pattern from SfL2003. The largest gap in performance at Level 1 or above was between those in Semi-routine and Routine occupations (F and G). This marks a change from SfL2003, where the largest gaps was between those in Intermediate occupations and Small employer and own account workers (C and D). However, in 2011 there was still a sizable gap between these two groups. Only 27 per cent of employed respondents with Entry Level 3 or below literacy were employed in managerial, professional and intermediate positions (categories A, B and C), despite the fact that over half (54 per cent) of all employed respondents were in these occupational categories. This finding is in line with the SfL2003 data and again suggests that a higher standard of literacy is required for these sorts of occupations. The proportion classified as Level 2 or above has increased across all occupational categories since 2003. Amongst respondents employed in Semi-routine occupations (F), the proportion reaching or surpassing Level 1 has also increased (from 77 per cent to 84 per cent).196 In the numeracy assessment, scores were highest amongst respondents in Higher managerial and professional occupations (A) and lowest amongst those in Routine occupations (G ). Numeracy performance by occupational category is shown in Table 8.20.
Table 8.20 Numeracy Levels amongst those who work, by occupation OCCUPATION A B C D E F G
All Higher managerial
and professional
Lower managerial
and professional
Intermediate Small employers and own account
workers
Lower supervisory
and technical
Semi routine
Routine
% % % % % % % %
Entry Level 1 or below 5 1 3 2 6 9 6 12 Entry Level 2 14 5 9 14 16 19 22 18 Entry Level 3 24 15 20 28 29 26 29 33 Level 1 33 36 36 37 29 28 30 25 Level 2 or above 25 42 32 19 20 19 14 13 Entry Level 2 or below 18 6 12 16 22 28 28 30 Entry Level 3 or above 82 94 88 84 78 73 72 70 Unweighted 3937 516 1227 437 403 427 554 373
Base: SfL2011 All aged 16-65 who work and have numeracy score
196 See Appendix Table 8.A34.
Chapter 8: Literacy, numeracy and ICT skills in everyday life and work
168
Respondents in Higher managerial and professional occupations (A) were the most likely to achieve Entry Level 3 or above (94 per cent). They also had the greatest likelihood of reaching Level 2 or above (42 per cent), followed by those from category B (32 per cent). The proportions of respondents achieving Level 2 or above in categories C to G were broadly consistent, although respondents in Routine occupations (G) were slightly less likely than those in Lower supervisory and technical occupations (E) to reach this standard. These findings suggest that numeracy is particularly important for respondents in managerial and professional occupations. Since 2003, there has been a reduction in the proportion of respondents who achieved Entry Level 3 or above in managerial and professional occupations (A and B). The reduction for category A was from 98 per cent 94 per cent, and for category B from 92 per cent to 88 per cent. The proportion reaching Entry Level 3 or above in the other five categories remains unchanged.197 Although people with better numeracy (and better literacy) were more likely to be found in higher occupation categories, this was not always true. As in 2003, there were sizable proportions of highly skilled respondents in occupations where lower basic skills might be expected, as well as some with weak numeracy working in occupations where one would expect higher requisite skills. Whilst a number of reasons might account for this, it could be due to educational achievement. Exam failure at 16 may restrict the career options of those with potentially higher skills, whereas people with weaker skills may sometimes achieve exam passes. Of those respondents who currently worked in Routine occupations (G) and achieved a Level 2 or above score on the numeracy assessment, a quarter (24 per cent) held a pass GCSE at grade C or above (or equivalent) in Maths. However, twice as many respondents (50 per cent) working in Higher managerial and professional occupations (A) who achieved this level held a Maths GCSE at grade C or above (or equivalent). The converse was also true; only 30 per cent of those working in Routine occupations who held a maths GCSE at grade C or above (or equivalent) achieved a Level 2 score, compared to 52 per cent in Higher managerial and professional qualifications. This may also suggest that people may lose their maths skills if they are employed in occupations which do not utilise them. Finally, a relationship was apparent between ICT performance and occupation (Table 8.21).
197 See Appendix Table 8.A35.
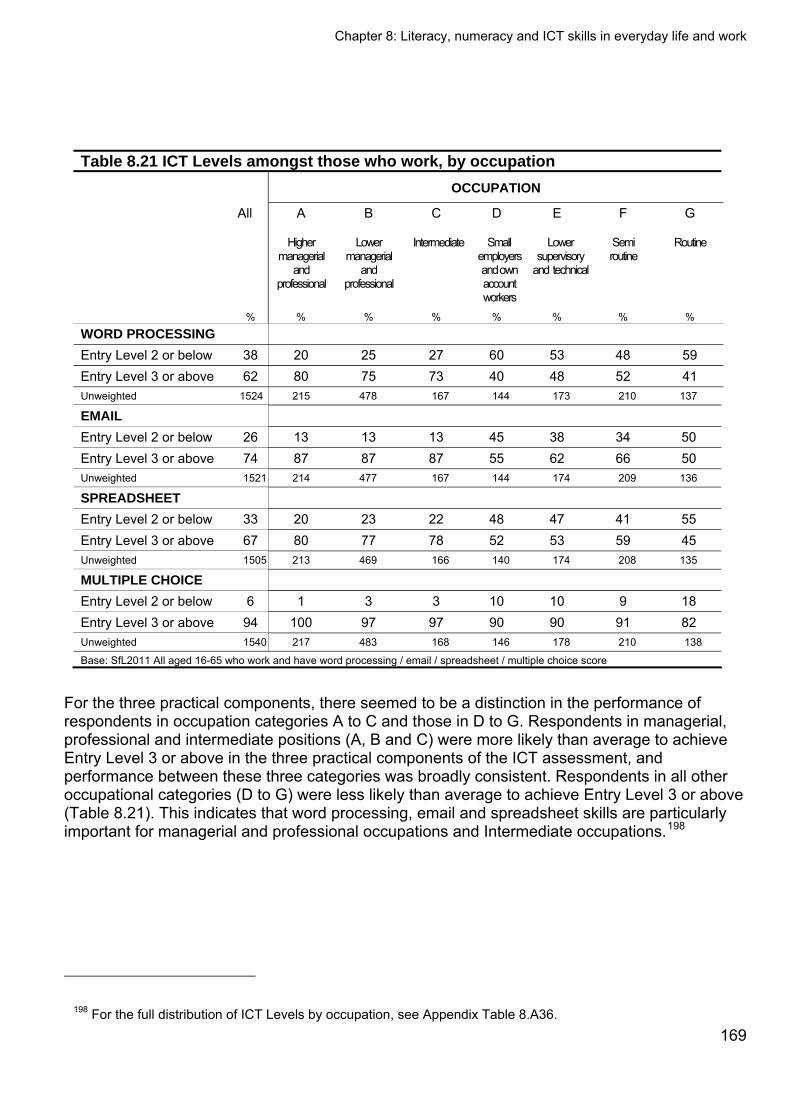
Chapter 8: Literacy, numeracy and ICT skills in everyday life and work
169
Table 8.21 ICT Levels amongst those who work, by occupation OCCUPATION
All A B C D E F G
Higher managerial
and professional
Lower managerial
and professional
Intermediate Small employers and own account workers
Lower supervisory
and technical
Semi routine
Routine
% % % % % % % %
WORD PROCESSING
Entry Level 2 or below 38 20 25 27 60 53 48 59 Entry Level 3 or above 62 80 75 73 40 48 52 41 Unweighted 1524 215 478 167 144 173 210 137
Entry Level 2 or below 26 13 13 13 45 38 34 50 Entry Level 3 or above 74 87 87 87 55 62 66 50 Unweighted 1521 214 477 167 144 174 209 136
SPREADSHEET
Entry Level 2 or below 33 20 23 22 48 47 41 55 Entry Level 3 or above 67 80 77 78 52 53 59 45 Unweighted 1505 213 469 166 140 174 208 135
MULTIPLE CHOICE
Entry Level 2 or below 6 1 3 3 10 10 9 18 Entry Level 3 or above 94 100 97 97 90 90 91 82 Unweighted 1540 217 483 168 146 178 210 138
Base: SfL2011 All aged 16-65 who work and have word processing / email / spreadsheet / multiple choice score
For the three practical components, there seemed to be a distinction in the performance of respondents in occupation categories A to C and those in D to G. Respondents in managerial, professional and intermediate positions (A, B and C) were more likely than average to achieve Entry Level 3 or above in the three practical components of the ICT assessment, and performance between these three categories was broadly consistent. Respondents in all other occupational categories (D to G) were less likely than average to achieve Entry Level 3 or above (Table 8.21). This indicates that word processing, email and spreadsheet skills are particularly important for managerial and professional occupations and Intermediate occupations.198
198 For the full distribution of ICT Levels by occupation, see Appendix Table 8.A36.
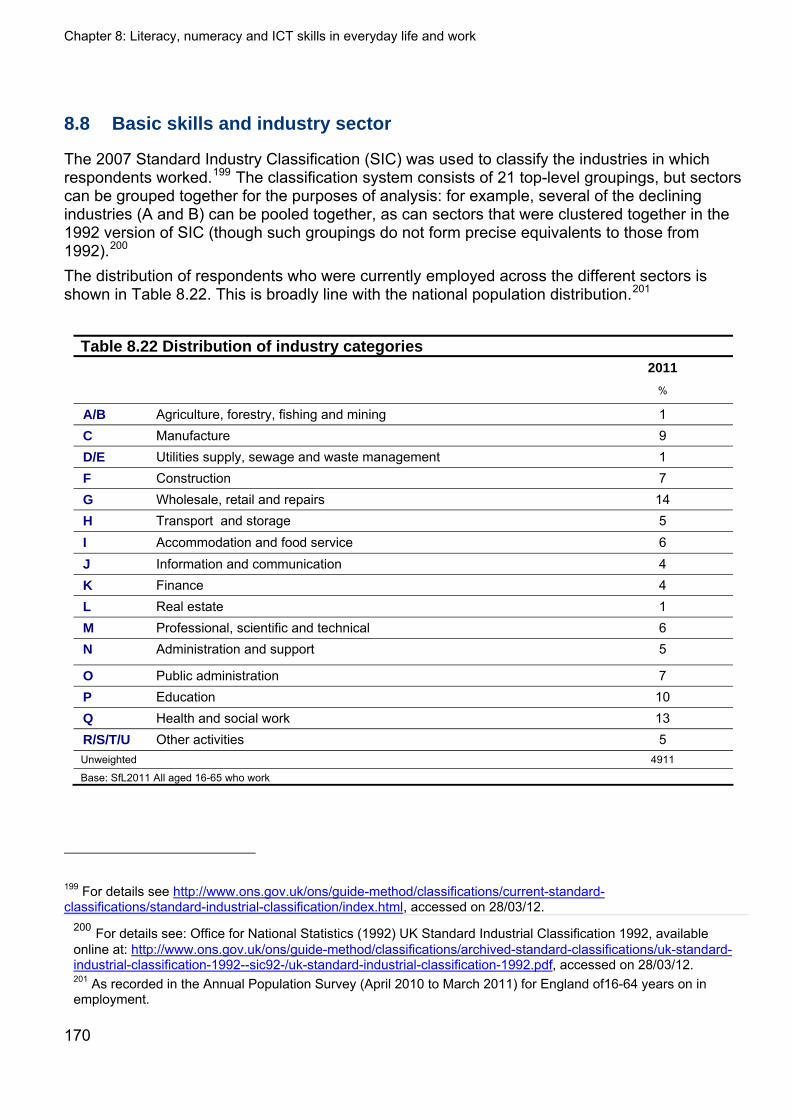
Chapter 8: Literacy, numeracy and ICT skills in everyday life and work
170
8.8 Basic skills and industry sector
The 2007 Standard Industry Classification (SIC) was used to classify the industries in which respondents worked.199 The classification system consists of 21 top-level groupings, but sectors can be grouped together for the purposes of analysis: for example, several of the declining industries (A and B) can be pooled together, as can sectors that were clustered together in the 1992 version of SIC (though such groupings do not form precise equivalents to those from 1992).200 The distribution of respondents who were currently employed across the different sectors is shown in Table 8.22. This is broadly line with the national population distribution.201
Table 8.22 Distribution of industry categories 2011
%
A/B Agriculture, forestry, fishing and mining 1 C Manufacture 9 D/E Utilities supply, sewage and waste management 1 F Construction 7 G Wholesale, retail and repairs 14 H Transport and storage 5 I Accommodation and food service 6 J Information and communication 4 K Finance 4 L Real estate 1 M Professional, scientific and technical 6 N Administration and support 5
O Public administration 7 P Education 10 Q Health and social work 13 R/S/T/U Other activities 5 Unweighted 4911
Base: SfL2011 All aged 16-65 who work
199 For details see http://www.ons.gov.uk/ons/guide-method/classifications/current-standard-classifications/standard-industrial-classification/index.html, accessed on 28/03/12.
200 For details see: Office for National Statistics (1992) UK Standard Industrial Classification 1992, available online at: http://www.ons.gov.uk/ons/guide-method/classifications/archived-standard-classifications/uk-standard-industrial-classification-1992--sic92-/uk-standard-industrial-classification-1992.pdf, accessed on 28/03/12. 201 As recorded in the Annual Population Survey (April 2010 to March 2011) for England of16-64 years on in employment.

Chapter 8: Literacy, numeracy and ICT skills in everyday life and work
171
As one might expect, men were more likely to be employed in some industries (such as Manufacture or Construction) and women in others (such as Education or Health and social work). There were also differences by ethnicity, with respondents from BME backgrounds more likely than White respondents to be working in Wholesale, retail and repairs, Accommodation and food services or Health and social work, but less likely to be involved in Manufacture, Construction or Education.202 Moreover, a relationship was apparent between respondents’ age and the industry they worked in. People under the age of 25 were more likely than older respondents to be involved in Wholesale, retail and repairs, or Accommodation and food service; at the same time, they were less likely than their older counterparts to be working in Manufacture, in Public administration, or in the Professional, scientific and technical sectors. Other industries attracted a disproportionately high number of people in a particular age range: for instance, 20-24 year-olds in the Construction industry, and 35-44 year-olds in the Information and communication industry. In addition, the likelihood of working in the Education sector rose with age (from three per cent amongst 16-19 year-olds, to 12 per cent amongst 55-65 year-olds). Direct comparisons cannot be drawn between the distribution of industry sectors in 2011 and 2003, since data from SfL2003 was classified according to the 1992 version of SIC in which groupings were differently defined. Broad comparisons between the two years reveal some changes over time, such as a decrease in the proportion of 16-65 year-olds engaged in Manufacture, and a slight increase in those employed in Education. 203 8.8.1 Performance in the assessments by industry sector There was substantial variation in performance in the literacy assessment between the SIC groups.204 Almost all respondents (98 per cent) who worked in Education achieved Level 1 or above, whilst only three quarters (76 per cent) of those who worked in Accommodation and food service performed at this standard (Table 8.23).205
202 See Appendix Table 8.A37. 203 See Appendix Table 8.A38.
204 The 2009 National Employer Skills Survey also found variation in reported literacy skills between SIC groups: Shury, J., M. Winterbotham, K. Oldfield, M. Spilsbury, and S. Constable (2010) National Employer Skills Survey for England 2009: Main Report. UK Commission for Employment and Skills Evidence Report 23, available online at: http://www.ukces.org.uk/assets/bispartners/ukces/docs/publications/evidence-report-23-ness-main-report-2009.pdf, accessed 28/03/12.
205 For the full distribution of Literacy Levels by industry, see Appendix Table 8.A39.
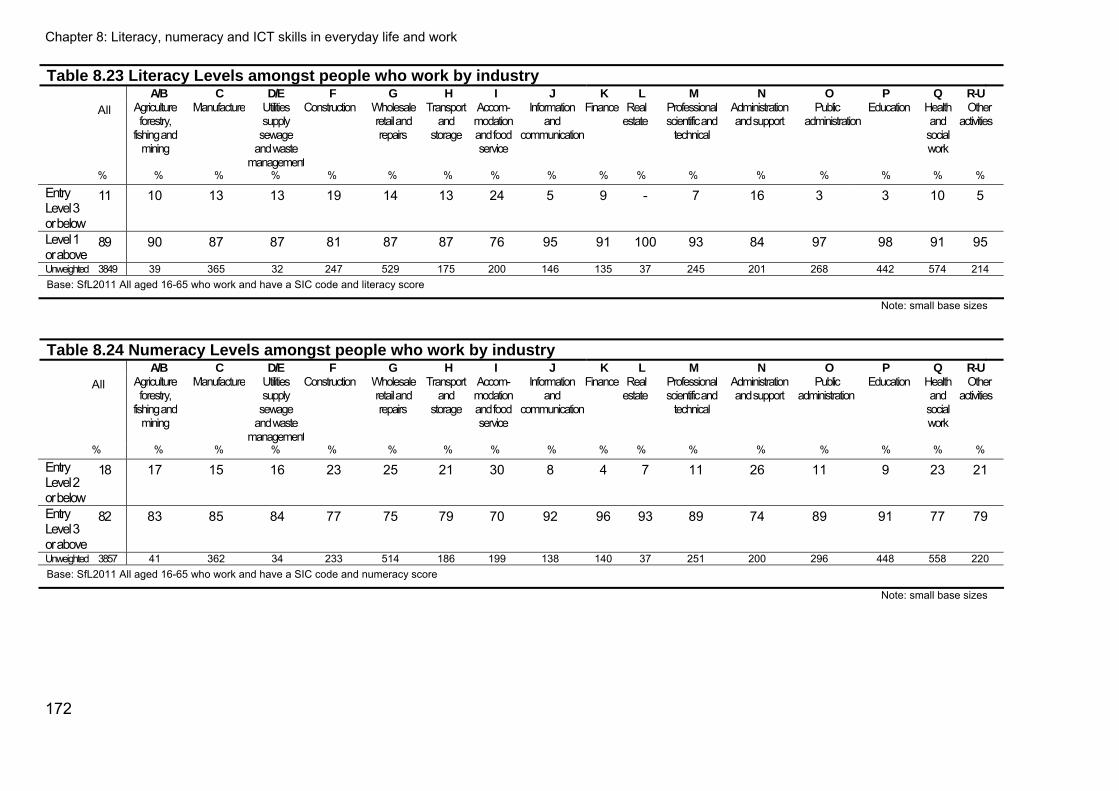
Chapter 8: Literacy, numeracy and ICT skills in everyday life and work
Table 8.23 Literacy Levels amongst people who work by industry A/B C D/E F G H I J K L M N O P Q R-U All Agriculture
forestry, fishing and
mining
Manufacture Utilities supply sewage
and waste management
Construction Wholesale retail and repairs
Transport and
storage
Accom- modation and food service
Information and
communication
Finance Real estate
Professional scientific and
technical
Administrationand support
Public administration
Education Health and social work
Other activities
% % % % % % % % % % % % % % % % %
Entry Level 3 or below
11 10 13 13 19 14 13 24 5 9 - 7 16 3 3 10 5
Level 1 or above
89 90 87 87 81 87 87 76 95 91 100 93 84 97 98 91 95
Unweighted 3849 39 365 32 247 529 175 200 146 135 37 245 201 268 442 574 214 Base: SfL2011 All aged 16-65 who work and have a SIC code and literacy score
Note: small base sizes
Note: small base sizes
Table 8.24 Numeracy Levels amongst people who work by industry A/B C D/E F G H I J K L M N O P Q R-U All Agriculture
forestry, fishing and
mining
Manufacture Utilities supply sewage
and waste management
Construction Wholesale retail and repairs
Transport and
storage
Accom- modation and food service
Information and
communication
Finance Real estate
Professional scientific and
technical
Administrationand support
Public administration
Education Health and social work
Other activities
% % % % % % % % % % % % % % % % %
Entry Level 2 or below
18 17 15 16 23 25 21 30 8 4 7 11 26 11 9 23 21
Entry Level 3 or above
82 83 85 84 77 75 79 70 92 96 93 89 74 89 91 77 79
Unweighted 3857 41 362 34 233 514 186 199 138 140 37 251 200 296 448 558 220 Base: SfL2011 All aged 16-65 who work and have a SIC code and numeracy score
172
Chapter 8: Literacy, numeracy and ICT skills in everyday life and work
Respondents working in the Education, Public administration, and Information and communication sectors, together with those engaged in Other activities (R/S/T/U), were more likely than average to achieve a Level 1 or above score. Respondents in the Construction and Accommodation and food service sectors were less likely than average to reach or surpass Level 1, with respondents from all other groups tending to perform in line with the average (89 per cent at Level 1 or above).206 There was also substantial variation in performance in the numeracy assessment between the SIC groupings (Table 8.24). The same industries which performed well in the literacy assessment – Education, Public administration, Professional, scientific and technical, and Information and communication – also tended to have above average numeracy (82 per cent at Entry Level 3 or above).207 In addition, almost all respondents (96 per cent) who worked in Finance achieved Entry Level 3 or above, while only seven in ten (70 per cent) who worked in Accommodation and food service reached this standard. Tables 8.25-8.28 display the ICT Levels of the SIC groups.208 Respondents working in five of the sectors (Information and communication, Finance, Professional, scientific and technical, Public administration, and Education) were more likely than average to achieve Entry Level 3 or above in the three practical elements of the ICT assessment. Conversely, people employed in Transport and storage and in Health and social work were more likely than the rest of the population to fall short of Entry Level 3 in the three practical components; the same applied to those in Construction and the Agriculture, forestry, fishing and mining industries with regards to all four components of the ICT assessment. A more surprising finding is that people who worked in Administration and support, who might be expected to have sound ICT skills, had a greater likelihood than the overall population of scoring Entry Level 2 or below in the word processing, email and multiple choice components.
173
206 The findings from the 2009 National Employer Skills Survey (NESS 2009) suggest that the three sectors where employers were most likely to report insufficient literacy skills amongst staff were: Transport, storage and communications; Health and social work; and Education (Shury et al. 2010, Table 5.15). Note that NESS 2009 classified industries according to the 2003 SIC classification, so that categories do not correspond precisely with those used in the present report. Respondents in these three industries, and particularly in Education, did not perform particularly poorly in the Skills for Life literacy assessment, suggesting that employers were not reporting weak skills per se but a mismatch between employees’ skills and the level of skill demanded by their job roles. This is also the case regarding Numeracy and ICT skills. For this reason, there is limited scope for comparison between NESS 2009 and SfL2011. 207 For the full distribution of Numeracy Levels by industry, see Appendix Table 8.A40.
208 For the full distribution of ICT Levels by industry, see Appendix Tables 8.A41to 8.A44.
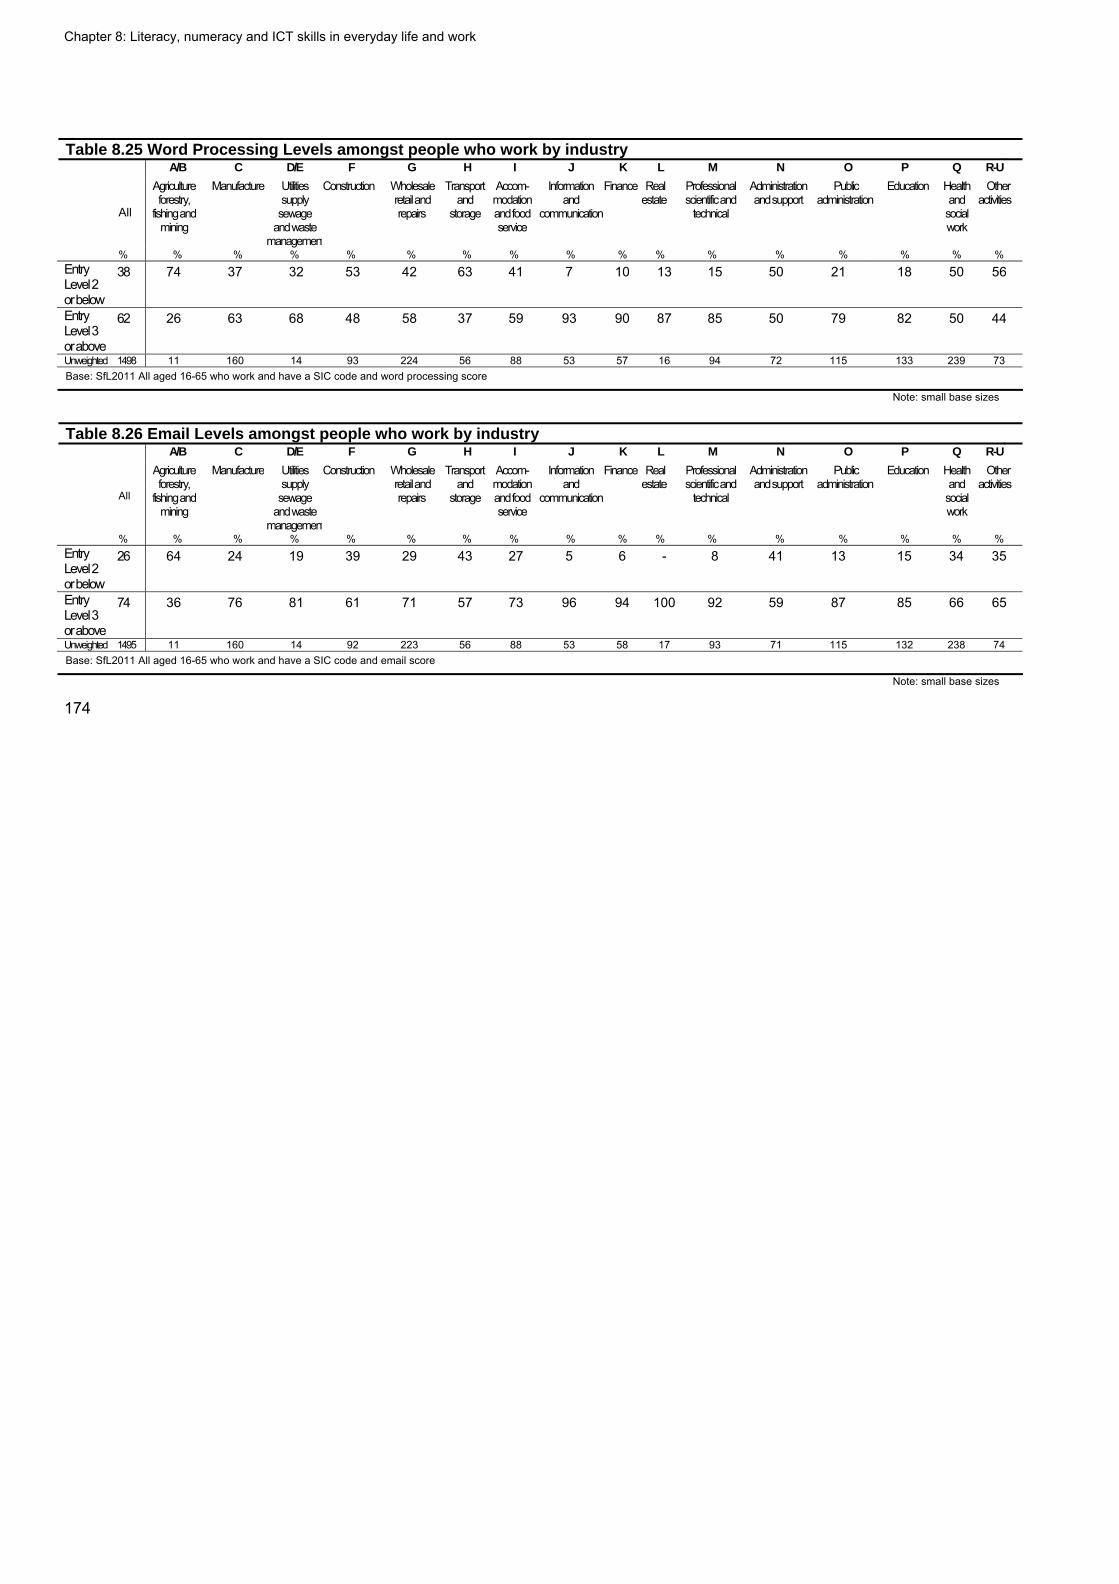
Chapter 8: Literacy, numeracy and ICT skills in everyday life and work
174
Table 8.25 Word Processing Levels amongst people who work by industry A/B C D/E F G H I J K L M N O P Q R-U
All
Agriculture forestry,
fishing and mining
Manufacture Utilities supply sewage
and waste management
Construction Wholesale retail and repairs
Transport and
storage
Accom- modationand food service
Information and
communication
Finance Real estate
Professional scientific and
technical
Administrationand support
Public administration
Education Health and social work
Other activities
% % % % % % % % % % % % % % % % % Entry Level 2 or below
38 74 37 32 53 42 63 41 7 10 13 15 50 21 18 50 56
Entry Level 3 or above
62 26 63 68 48 58 37 59 93 90 87 85 50 79 82 50 44
Unweighted 1498 11 160 14 93 224 56 88 53 57 16 94 72 115 133 239 73 Base: SfL2011 All aged 16-65 who work and have a SIC code and word processing score
Note: small base sizes
Table 8.26 Email Levels amongst people who work by industry A/B C D/E F G H I J K L M N O P Q R-U
All
Agriculture forestry,
fishing and mining
Manufacture Utilities supply sewage
and waste management
Construction Wholesale retail and repairs
Transport and
storage
Accom- modationand food service
Information and
communication
Finance Real estate
Professional scientific and
technical
Administrationand support
Public administration
Education Health and social work
Other activities
% % % % % % % % % % % % % % % % % Entry Level 2 or below
26 64 24 19 39 29 43 27 5 6 - 8 41 13 15 34 35
Entry Level 3 or above
74 36 76 81 61 71 57 73 96 94 100 92 59 87 85 66 65
Unweighted 1495 11 160 14 92 223 56 88 53 58 17 93 71 115 132 238 74 Base: SfL2011 All aged 16-65 who work and have a SIC code and email score
Note: small base sizes
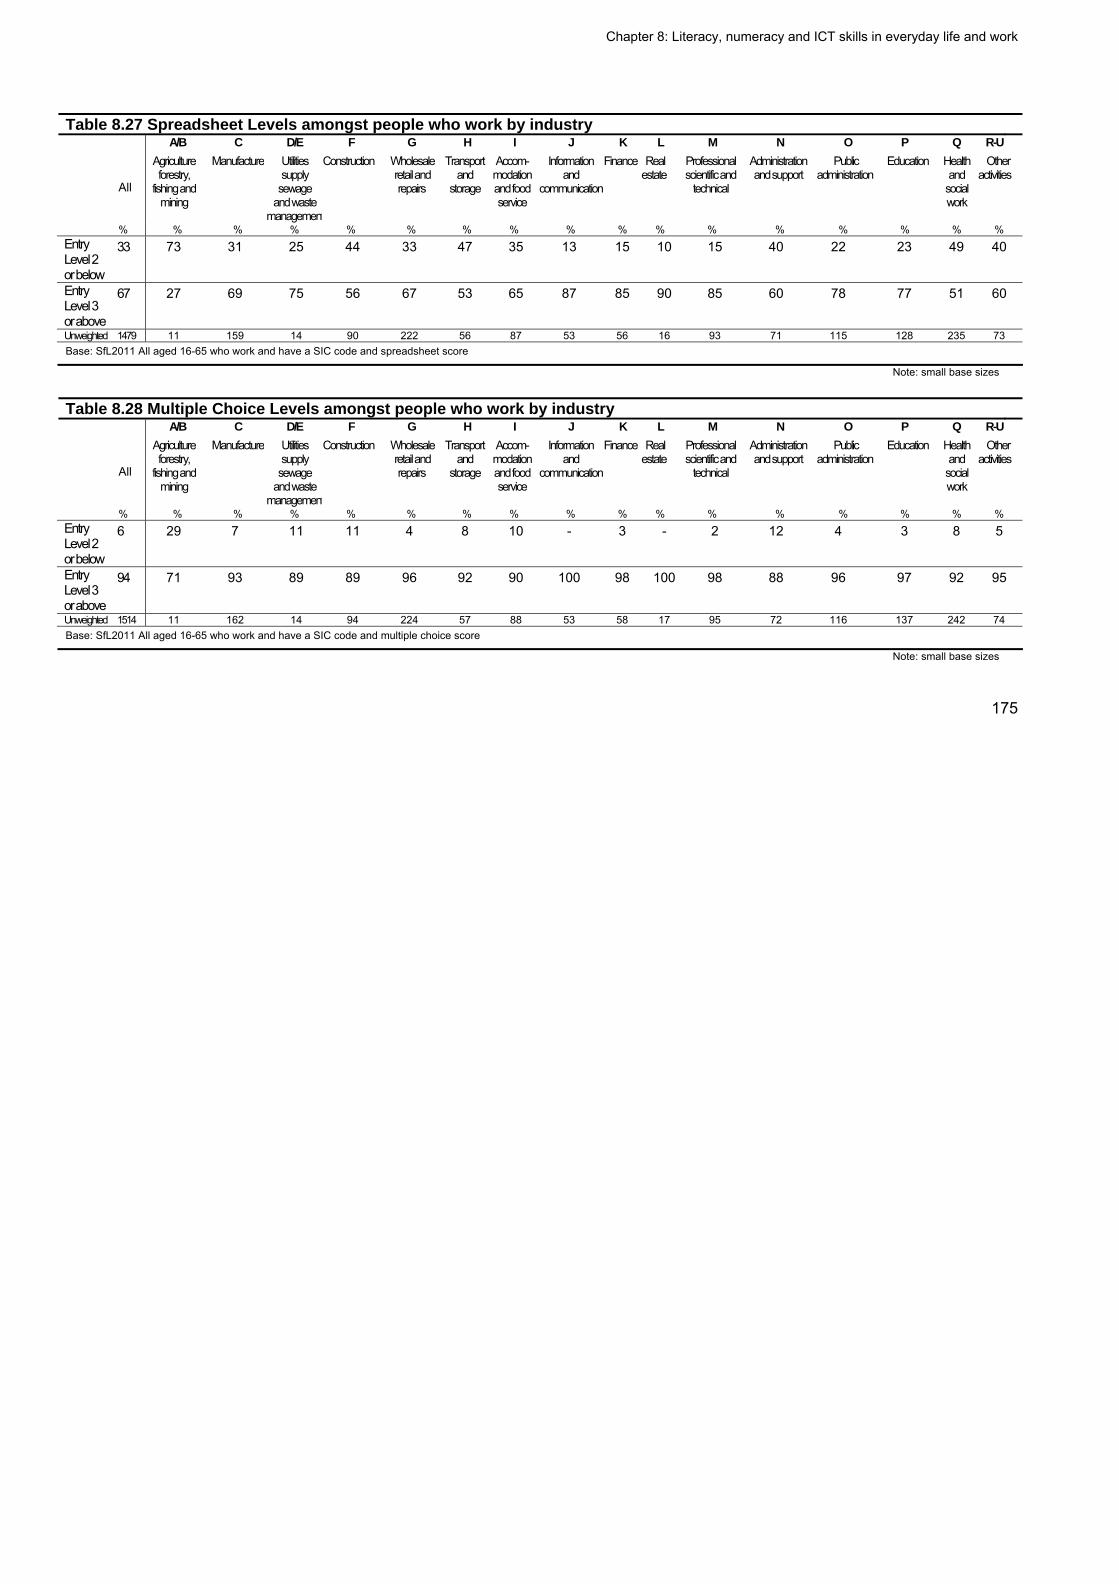
Chapter 8: Literacy, numeracy and ICT skills in everyday life and work
175
Table 8.27 Spreadsheet Levels amongst people who work by industry A/B C D/E F G H I J K L M N O P Q R-U
All
Agriculture forestry,
fishing and mining
Manufacture Utilities supply sewage
and waste management
Construction Wholesale retail and repairs
Transport and
storage
Accom- modationand food service
Information and
communication
Finance Real estate
Professional scientific and
technical
Administrationand support
Public administration
Education Health and social work
Other activities
% % % % % % % % % % % % % % % % % Entry Level 2 or below
33 73 31 25 44 33 47 35 13 15 10 15 40 22 23 49 40
Entry Level 3 or above
67 27 69 75 56 67 53 65 87 85 90 85 60 78 77 51 60
Unweighted 1479 11 159 14 90 222 56 87 53 56 16 93 71 115 128 235 73 Base: SfL2011 All aged 16-65 who work and have a SIC code and spreadsheet score
Note: small base sizes
Table 8.28 Multiple Choice Levels amongst people who work by industry A/B C D/E F G H I J K L M N O P Q R-U
All
Agriculture forestry,
fishing and mining
Manufacture Utilities supply sewage
and waste management
Construction Wholesale retail and repairs
Transport and
storage
Accom- modationand food service
Information and
communication
Finance Real estate
Professional scientific and
technical
Administrationand support
Public administration
Education Health and social work
Other activities
% % % % % % % % % % % % % % % % % Entry Level 2 or below
6 29 7 11 11 4 8 10 - 3 - 2 12 4 3 8 5
Entry Level 3 or above
94 71 93 89 89 96 92 90 100 98 100 98 88 96 97 92 95
Unweighted 1514 11 162 14 94 224 57 88 53 58 17 95 72 116 137 242 74 Base: SfL2011 All aged 16-65 who work and have a SIC code and multiple choice score
Note: small base sizes
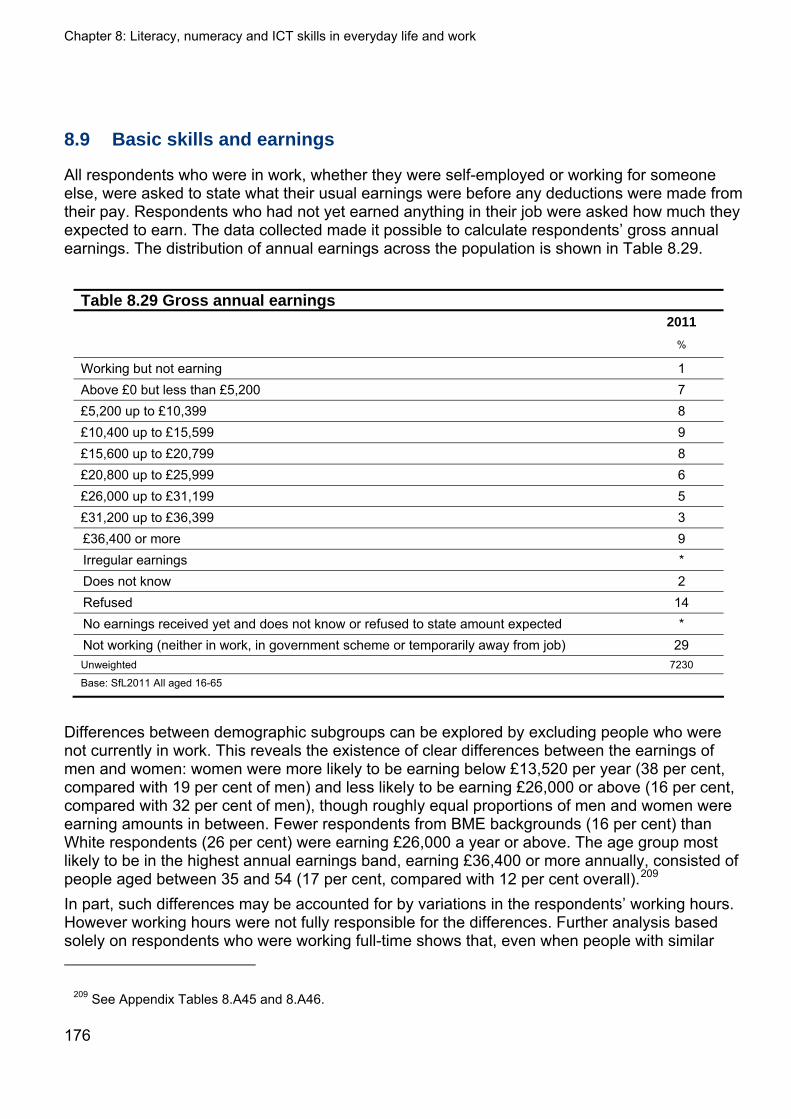
Chapter 8: Literacy, numeracy and ICT skills in everyday life and work
176
8.9 Basic skills and earnings
All respondents who were in work, whether they were self-employed or working for someone else, were asked to state what their usual earnings were before any deductions were made from their pay. Respondents who had not yet earned anything in their job were asked how much they expected to earn. The data collected made it possible to calculate respondents’ gross annual earnings. The distribution of annual earnings across the population is shown in Table 8.29.
Table 8.29 Gross annual earnings 2011
%
Working but not earning 1 Above £0 but less than £5,200 7 £5,200 up to £10,399 8 £10,400 up to £15,599 9 £15,600 up to £20,799 8 £20,800 up to £25,999 6 £26,000 up to £31,199 5 £31,200 up to £36,399 3 £36,400 or more 9 Irregular earnings * Does not know 2 Refused 14 No earnings received yet and does not know or refused to state amount expected * Not working (neither in work, in government scheme or temporarily away from job) 29 Unweighted 7230
Base: SfL2011 All aged 16-65
Differences between demographic subgroups can be explored by excluding people who were not currently in work. This reveals the existence of clear differences between the earnings of men and women: women were more likely to be earning below £13,520 per year (38 per cent, compared with 19 per cent of men) and less likely to be earning £26,000 or above (16 per cent, compared with 32 per cent of men), though roughly equal proportions of men and women were earning amounts in between. Fewer respondents from BME backgrounds (16 per cent) than White respondents (26 per cent) were earning £26,000 a year or above. The age group most likely to be in the highest annual earnings band, earning £36,400 or more annually, consisted of people aged between 35 and 54 (17 per cent, compared with 12 per cent overall).209 In part, such differences may be accounted for by variations in the respondents’ working hours. However working hours were not fully responsible for the differences. Further analysis based solely on respondents who were working full-time shows that, even when people with similar
209 See Appendix Tables 8.A45 and 8.A46.
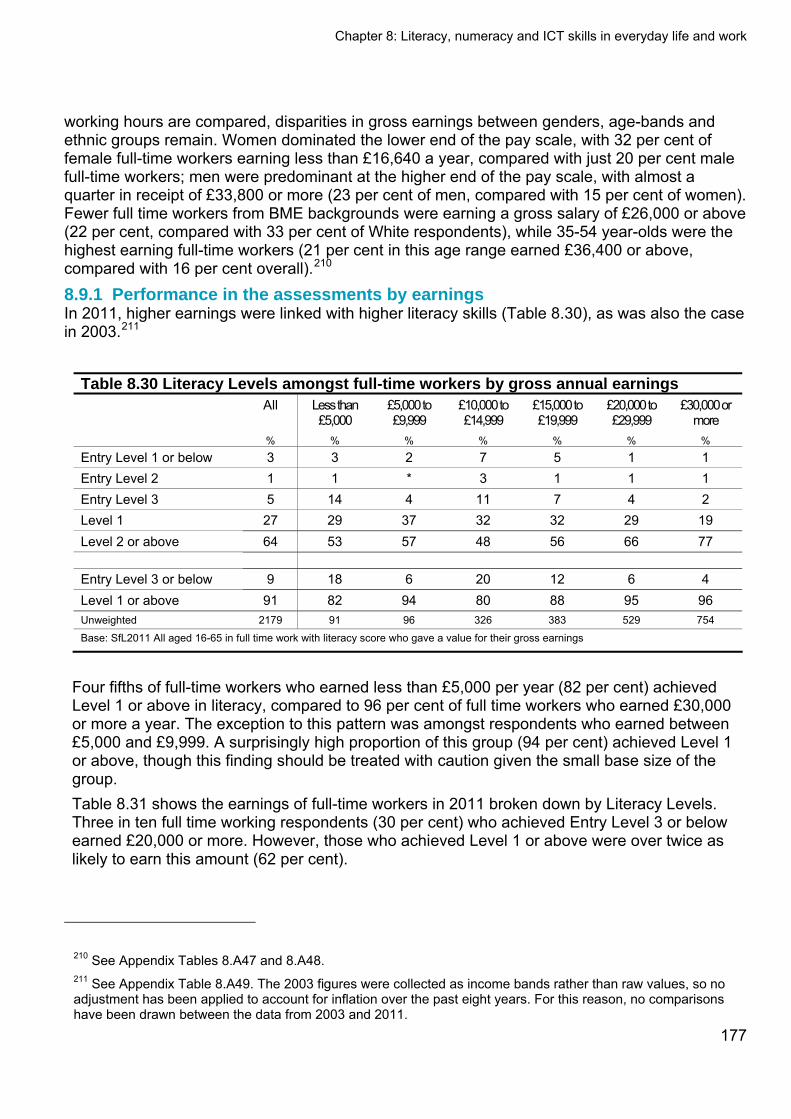
Chapter 8: Literacy, numeracy and ICT skills in everyday life and work
177
working hours are compared, disparities in gross earnings between genders, age-bands and ethnic groups remain. Women dominated the lower end of the pay scale, with 32 per cent of female full-time workers earning less than £16,640 a year, compared with just 20 per cent male full-time workers; men were predominant at the higher end of the pay scale, with almost a quarter in receipt of £33,800 or more (23 per cent of men, compared with 15 per cent of women). Fewer full time workers from BME backgrounds were earning a gross salary of £26,000 or above (22 per cent, compared with 33 per cent of White respondents), while 35-54 year-olds were the highest earning full-time workers (21 per cent in this age range earned £36,400 or above, compared with 16 per cent overall).210 8.9.1 Performance in the assessments by earnings In 2011, higher earnings were linked with higher literacy skills (Table 8.30), as was also the case in 2003.211
Table 8.30 Literacy Levels amongst full-time workers by gross annual earnings All Less than
£5,000 £5,000 to £9,999
£10,000 to £14,999
£15,000 to £19,999
£20,000 to £29,999
£30,000 or more
% % % % % % %
Entry Level 1 or below 3 3 2 7 5 1 1 Entry Level 2 1 1 * 3 1 1 1 Entry Level 3 5 14 4 11 7 4 2 Level 1 27 29 37 32 32 29 19 Level 2 or above 64 53 57 48 56 66 77
Entry Level 3 or below 9 18 6 20 12 6 4 Level 1 or above 91 82 94 80 88 95 96 Unweighted 2179 91 96 326 383 529 754
Base: SfL2011 All aged 16-65 in full time work with literacy score who gave a value for their gross earnings
Four fifths of full-time workers who earned less than £5,000 per year (82 per cent) achieved Level 1 or above in literacy, compared to 96 per cent of full time workers who earned £30,000 or more a year. The exception to this pattern was amongst respondents who earned between £5,000 and £9,999. A surprisingly high proportion of this group (94 per cent) achieved Level 1 or above, though this finding should be treated with caution given the small base size of the group. Table 8.31 shows the earnings of full-time workers in 2011 broken down by Literacy Levels. Three in ten full time working respondents (30 per cent) who achieved Entry Level 3 or below earned £20,000 or more. However, those who achieved Level 1 or above were over twice as likely to earn this amount (62 per cent).
210 See Appendix Tables 8.A47 and 8.A48. 211 See Appendix Table 8.A49. The 2003 figures were collected as income bands rather than raw values, so no adjustment has been applied to account for inflation over the past eight years. For this reason, no comparisons have been drawn between the data from 2003 and 2011.
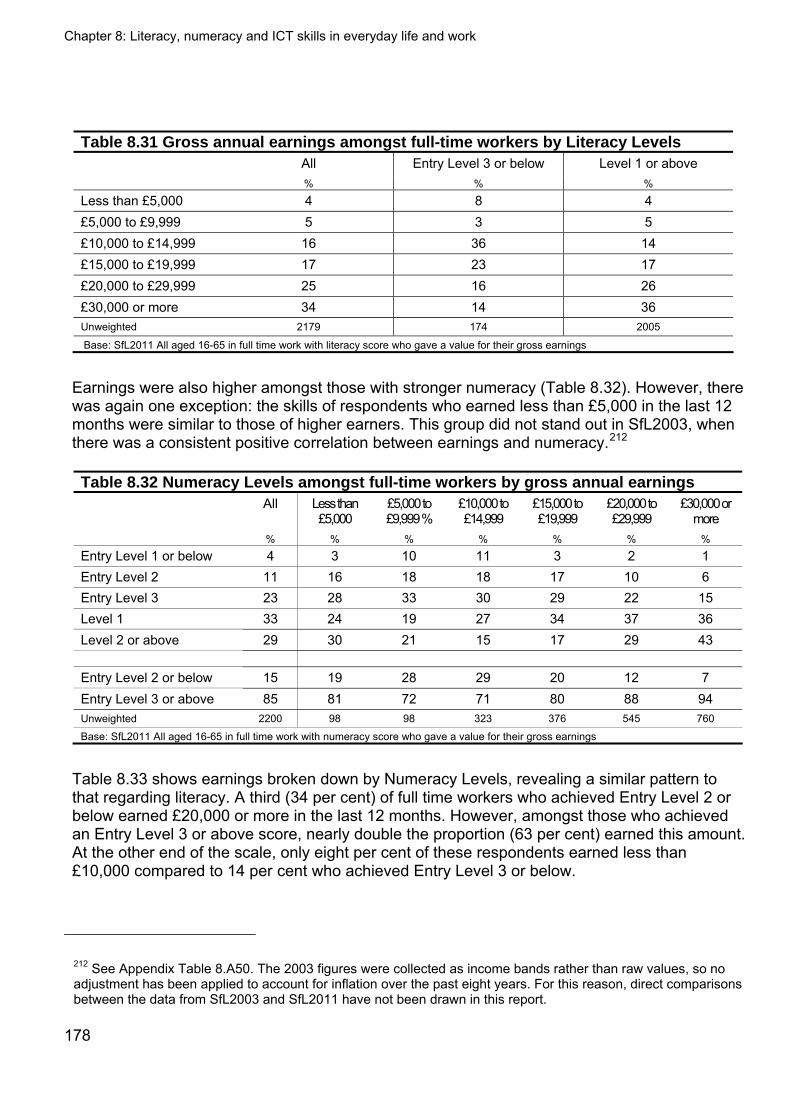
Chapter 8: Literacy, numeracy and ICT skills in everyday life and work
178
Table 8.31 Gross annual earnings amongst full-time workers by Literacy Levels All Entry Level 3 or below Level 1 or above % % %
Less than £5,000 4 8 4 £5,000 to £9,999 5 3 5 £10,000 to £14,999 16 36 14 £15,000 to £19,999 17 23 17 £20,000 to £29,999 25 16 26 £30,000 or more 34 14 36 Unweighted 2179 174 2005
Base: SfL2011 All aged 16-65 in full time work with literacy score who gave a value for their gross earnings
Earnings were also higher amongst those with stronger numeracy (Table 8.32). However, there was again one exception: the skills of respondents who earned less than £5,000 in the last 12 months were similar to those of higher earners. This group did not stand out in SfL2003, when there was a consistent positive correlation between earnings and numeracy.212
Table 8.32 Numeracy Levels amongst full-time workers by gross annual earnings All Less than
£5,000 £5,000 to £9,999 %
£10,000 to £14,999
£15,000 to £19,999
£20,000 to £29,999
£30,000 or more
% % % % % % %
Entry Level 1 or below 4 3 10 11 3 2 1 Entry Level 2 11 16 18 18 17 10 6 Entry Level 3 23 28 33 30 29 22 15 Level 1 33 24 19 27 34 37 36 Level 2 or above 29 30 21 15 17 29 43
Entry Level 2 or below 15 19 28 29 20 12 7 Entry Level 3 or above 85 81 72 71 80 88 94 Unweighted 2200 98 98 323 376 545 760
Base: SfL2011 All aged 16-65 in full time work with numeracy score who gave a value for their gross earnings
Table 8.33 shows earnings broken down by Numeracy Levels, revealing a similar pattern to that regarding literacy. A third (34 per cent) of full time workers who achieved Entry Level 2 or below earned £20,000 or more in the last 12 months. However, amongst those who achieved an Entry Level 3 or above score, nearly double the proportion (63 per cent) earned this amount. At the other end of the scale, only eight per cent of these respondents earned less than £10,000 compared to 14 per cent who achieved Entry Level 3 or below.
212 See Appendix Table 8.A50. The 2003 figures were collected as income bands rather than raw values, so no adjustment has been applied to account for inflation over the past eight years. For this reason, direct comparisons between the data from SfL2003 and SfL2011 have not been drawn in this report.
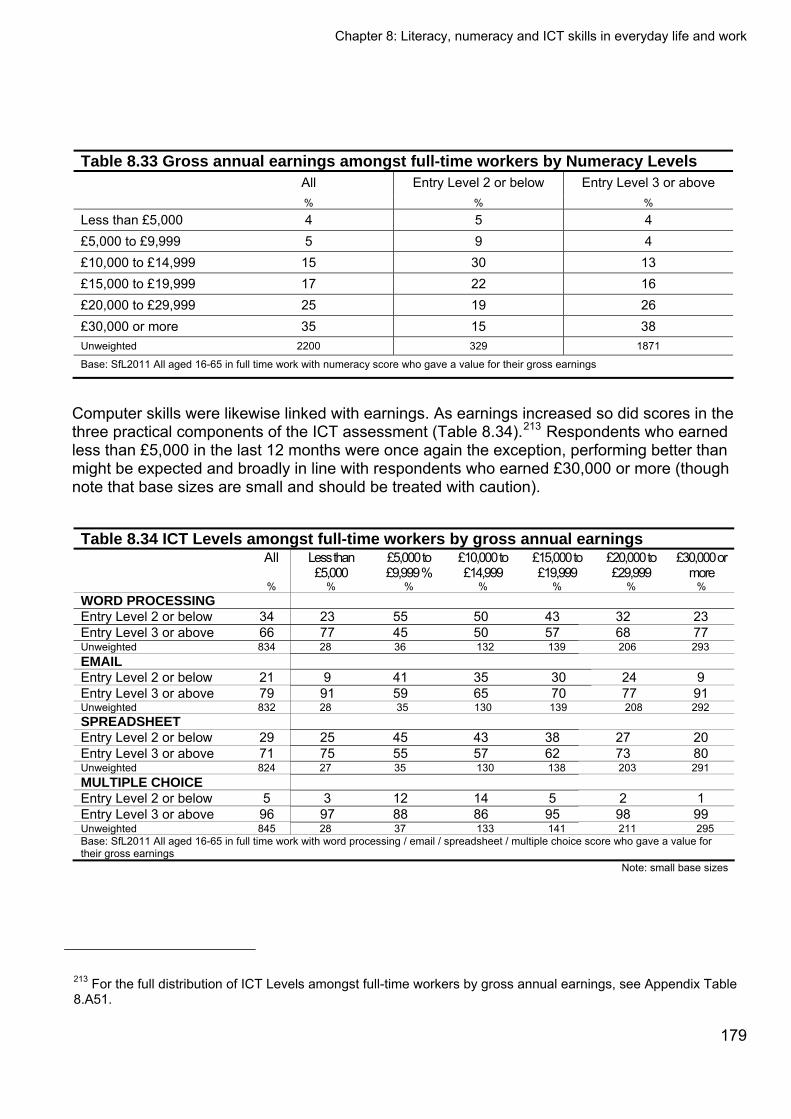
Chapter 8: Literacy, numeracy and ICT skills in everyday life and work
179
Table 8.33 Gross annual earnings amongst full-time workers by Numeracy Levels All Entry Level 2 or below Entry Level 3 or above % % %
Less than £5,000 4 5 4 £5,000 to £9,999 5 9 4 £10,000 to £14,999 15 30 13 £15,000 to £19,999 17 22 16 £20,000 to £29,999 25 19 26 £30,000 or more 35 15 38 Unweighted 2200 329 1871
Base: SfL2011 All aged 16-65 in full time work with numeracy score who gave a value for their gross earnings
Computer skills were likewise linked with earnings. As earnings increased so did scores in the three practical components of the ICT assessment (Table 8.34).213 Respondents who earned less than £5,000 in the last 12 months were once again the exception, performing better than might be expected and broadly in line with respondents who earned £30,000 or more (though note that base sizes are small and should be treated with caution).
Table 8.34 ICT Levels amongst full-time workers by gross annual earnings All Less than
£5,000 £5,000 to £9,999 %
£10,000 to £14,999
£15,000 to £19,999
£20,000 to £29,999
£30,000 or more
% % % % % % % WORD PROCESSING Entry Level 2 or below 34 23 55 50 43 32 23 Entry Level 3 or above 66 77 45 50 57 68 77 Unweighted 834 28 36 132 139 206 293 EMAIL Entry Level 2 or below 21 9 41 35 30 24 9 Entry Level 3 or above 79 91 59 65 70 77 91 Unweighted 832 28 35 130 139 208 292 SPREADSHEET Entry Level 2 or below 29 25 45 43 38 27 20 Entry Level 3 or above 71 75 55 57 62 73 80 Unweighted 824 27 35 130 138 203 291 MULTIPLE CHOICE Entry Level 2 or below 5 3 12 14 5 2 1 Entry Level 3 or above 96 97 88 86 95 98 99 Unweighted 845 28 37 133 141 211 295 Base: SfL2011 All aged 16-65 in full time work with word processing / email / spreadsheet / multiple choice score who gave a value for their gross earnings
Note: small base sizes
213 For the full distribution of ICT Levels amongst full-time workers by gross annual earnings, see Appendix Table 8.A51.

Chapter 8: Literacy, numeracy and ICT skills in everyday life and work
180
8.10 Basic skills and benefits
Two fifths of 16-65 year-olds (42 per cent) were in receipt of one or more benefits. More than a quarter were in receipt of Child Benefit (28 per cent) and a fifth received Tax Credits (21 per cent). The full breakdown of the types of benefits received is shown in Table 8.35.
Table 8.35 Distribution of benefits received
2011
%
Child Benefit 28 Tax Credits (Working Tax credit or Child Tax Credit) 21
With child care element to help pay for childcare expenses 4 Housing or Council tax Benefit 8
Housing Benefit 7 Council tax Benefit 7
Sickness or Disability Benefits 5 Disability Living Allowance 3 Incapacity Benefit 3 Employment and Support Allowance 1 Severe Disablement Allowance 1 Invalid Care Allowance * Industrial Injury Disablement Benefit * Statutory Sick pay * Attendance Allowance *
Income Support (not as an unemployed person) 4 Lone Parent 2 Sick person 2 Any other form or premium of income support 1 Pensioner *
State Pension 4 Retirement or Old Person’s Pension 4 Widowed Parents’ Allowance * Bereavement Allowance or Widow’s Pensions * War Disablement Pension or War Widows Pensions including any related allowances *
Unemployment related benefits or National Insurance Credits 3 Jobseekers Allowance 3
- Contributory JobSeekers Allowance 1 - Income based Jobseekers Allowance 1
National Insurance Credits * Family related benefits 2
Guardian’s Allowance * Maternity Allowance * Statutory Maternity Pay *
Other 2
Don’t know * Refused * Unweighted 7230
Base: SfL2011 All aged 16-65
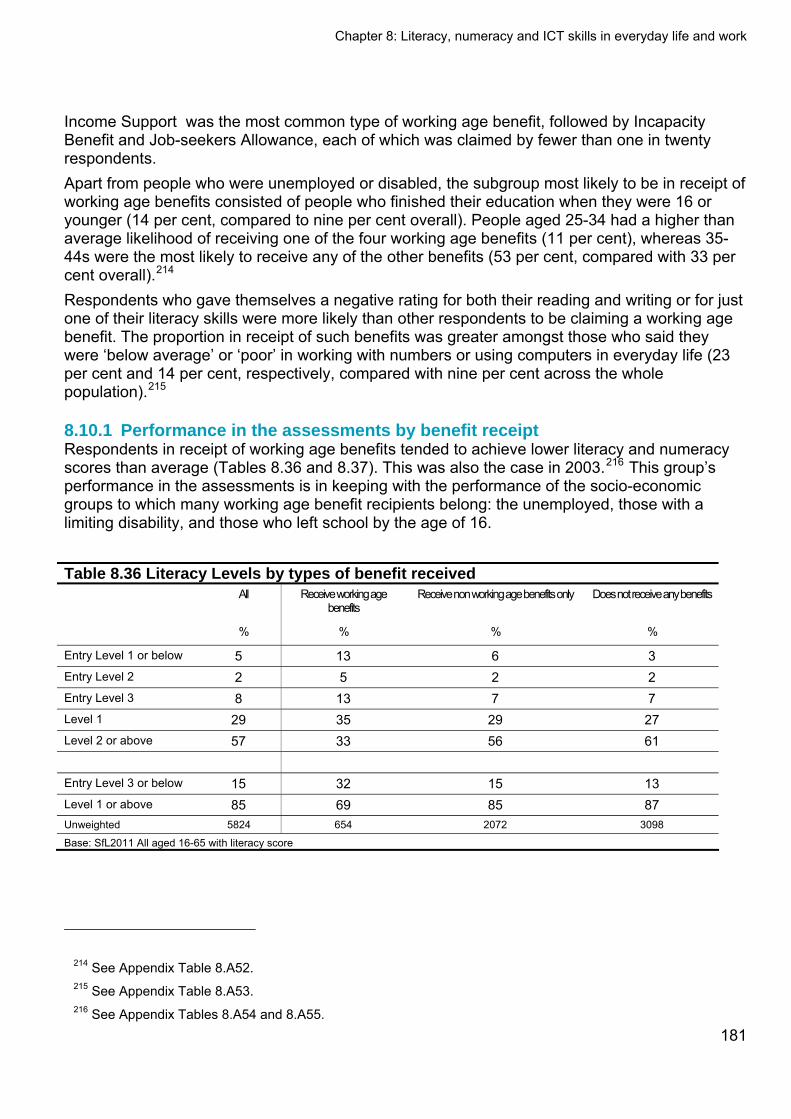
Chapter 8: Literacy, numeracy and ICT skills in everyday life and work
Income Support was the most common type of working age benefit, followed by Incapacity Benefit and Job-seekers Allowance, each of which was claimed by fewer than one in twenty respondents. Apart from people who were unemployed or disabled, the subgroup most likely to be in receipt of working age benefits consisted of people who finished their education when they were 16 or younger (14 per cent, compared to nine per cent overall). People aged 25-34 had a higher than average likelihood of receiving one of the four working age benefits (11 per cent), whereas 35-44s were the most likely to receive any of the other benefits (53 per cent, compared with 33 per cent overall).214 Respondents who gave themselves a negative rating for both their reading and writing or for just one of their literacy skills were more likely than other respondents to be claiming a working age benefit. The proportion in receipt of such benefits was greater amongst those who said they were ‘below average’ or ‘poor’ in working with numbers or using computers in everyday life (23 per cent and 14 per cent, respectively, compared with nine per cent across the whole population).215
8.10.1 Performance in the assessments by benefit receipt Respondents in receipt of working age benefits tended to achieve lower literacy and numeracy scores than average (Tables 8.36 and 8.37). This was also the case in 2003.216 This group’s performance in the assessments is in keeping with the performance of the socio-economic groups to which many working age benefit recipients belong: the unemployed, those with a limiting disability, and those who left school by the age of 16.
Table 8.36 Literacy Levels by types of benefit received All Receive working age
benefits Receive non working age benefits only Does not receive any benefits
% % % %
Entry Level 1 or below 5 13 6 3 Entry Level 2 2 5 2 2 Entry Level 3 8 13 7 7 Level 1 29 35 29 27 Level 2 or above 57 33 56 61 Entry Level 3 or below 15 32 15 13 Level 1 or above 85 69 85 87 Unweighted 5824 654 2072 3098
Base: SfL2011 All aged 16-65 with literacy score
181
214 See Appendix Table 8.A52. 215 See Appendix Table 8.A53. 216 See Appendix Tables 8.A54 and 8.A55.
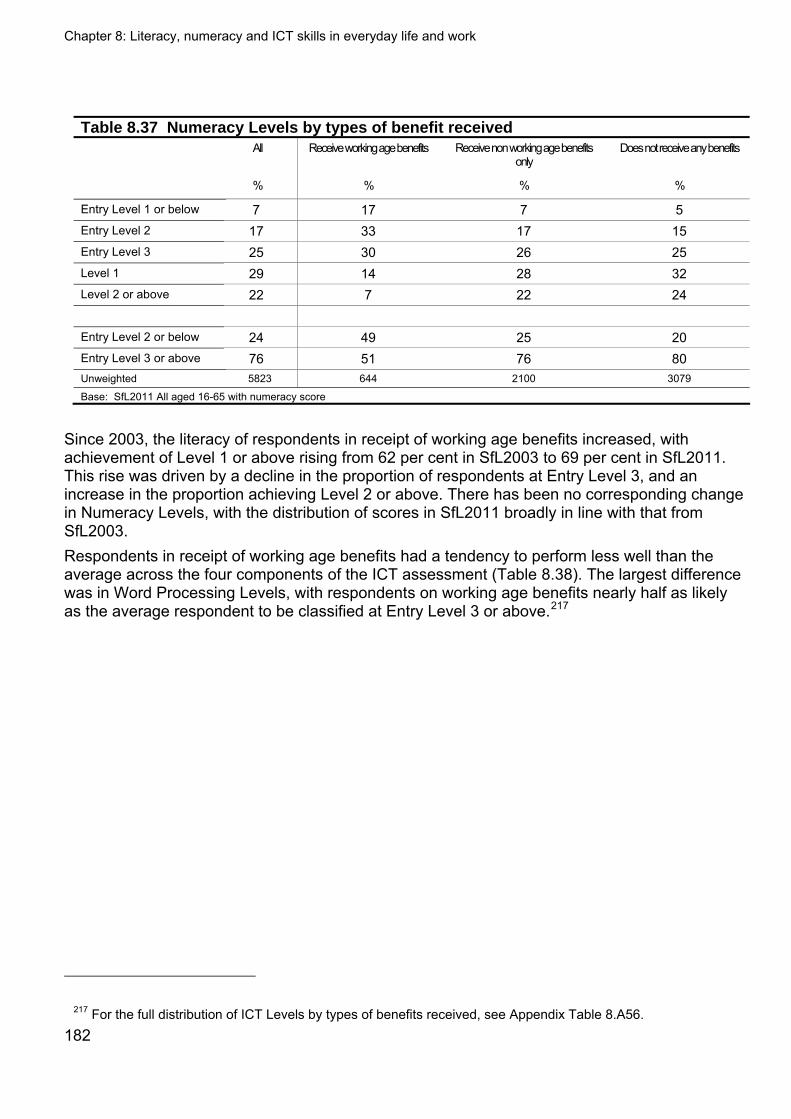
Chapter 8: Literacy, numeracy and ICT skills in everyday life and work
Table 8.37 Numeracy Levels by types of benefit received All Receive working age benefits Receive non working age benefits
only Does not receive any benefits
% % % %
Entry Level 1 or below 7 17 7 5 Entry Level 2 17 33 17 15 Entry Level 3 25 30 26 25 Level 1 29 14 28 32 Level 2 or above 22 7 22 24 Entry Level 2 or below 24 49 25 20 Entry Level 3 or above 76 51 76 80 Unweighted 5823 644 2100 3079
Base: SfL2011 All aged 16-65 with numeracy score
Since 2003, the literacy of respondents in receipt of working age benefits increased, with achievement of Level 1 or above rising from 62 per cent in SfL2003 to 69 per cent in SfL2011. This rise was driven by a decline in the proportion of respondents at Entry Level 3, and an increase in the proportion achieving Level 2 or above. There has been no corresponding change in Numeracy Levels, with the distribution of scores in SfL2011 broadly in line with that from SfL2003. Respondents in receipt of working age benefits had a tendency to perform less well than the average across the four components of the ICT assessment (Table 8.38). The largest difference was in Word Processing Levels, with respondents on working age benefits nearly half as likely as the average respondent to be classified at Entry Level 3 or above.217
182
217 For the full distribution of ICT Levels by types of benefits received, see Appendix Table 8.A56.
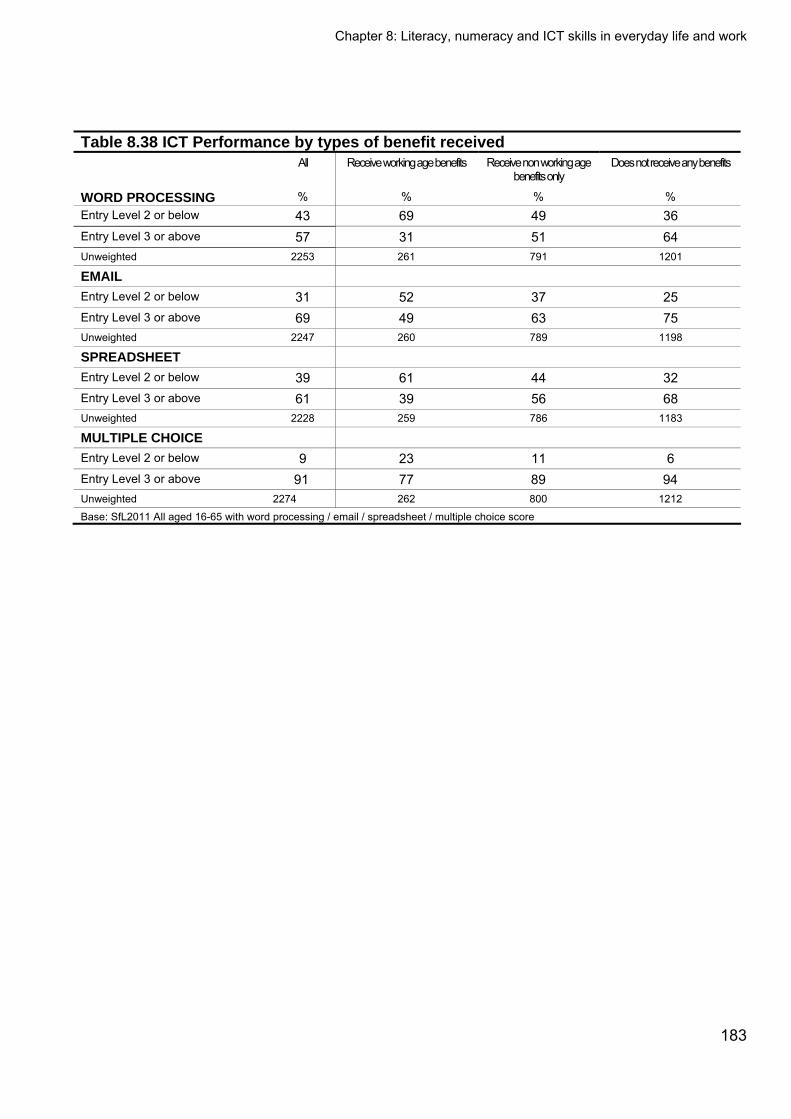
Chapter 8: Literacy, numeracy and ICT skills in everyday life and work
183
Table 8.38 ICT Performance by types of benefit received
All Receive working age benefits Receive non working age benefits only
Does not receive any benefits
WORD PROCESSING % % % % Entry Level 2 or below 43 69 49 36 Entry Level 3 or above 57 31 51 64 Unweighted 2253 261 791 1201
Entry Level 2 or below 31 52 37 25 Entry Level 3 or above 69 49 63 75 Unweighted 2247 260 789 1198
SPREADSHEET
Entry Level 2 or below 39 61 44 32 Entry Level 3 or above 61 39 56 68 Unweighted 2228 259 786 1183
MULTIPLE CHOICE
Entry Level 2 or below 9 23 11 6 Entry Level 3 or above 91 77 89 94 Unweighted 2274 262 800 1212
Base: SfL2011 All aged 16-65 with word processing / email / spreadsheet / multiple choice score
Chapter 9: Computer use
184
9 Computer use 9.1 Key Findings
This chapter explores ICT skills and levels of computer and internet usage.
Computer access has risen dramatically since 2003, with over nine in ten respondents (93 per cent) having access to a computer either at home or at work in 2011, compared with seven in ten (71 per cent) in 2003. In 2011, eight per cent of respondents lacked access to a computer in both their home and their workplace, but proportions were much higher amongst people who had a limiting disability, 55-65 year-olds and people who were out of work.
Those who lacked computer access performed considerably less well in the ICT assessment than respondents who had ready access to a computer at home or their workplace. Scores in the literacy and numeracy assessments were also lower for respondents who lacked computer access.
Almost three quarters (73 per cent) used a computer daily, while six per cent had never used a computer. The past eight years have seen a striking increase in the frequency of computer usage, with weekly and daily users rising from 51 per cent to 82 per cent amongst 16-65 year-olds.
Frequency of computer use was an effective predictor of ICT performance. Respondents who used a computer at least once a week were at least five times more likely than those who used a computer less often to achieve Level 2 or above in the three practical components of the ICT assessment.
The most common activities carried out (at home and in the workplace) were searching the internet and emailing. The frequency of both activities has risen since 2003, as has the use of computers for education, while the incidence of professional and special-interest pursuits has declined.
Respondents who carried out a greater number of computer tasks had a tendency to perform better in the four components of the ICT assessment; moreover, users of email, word processing and spreadsheet applications were more likely than non-users to achieve high scores across all four components.
Nine out of ten respondents (90 per cent) had internet access in their home. The absence of a home internet connection was associated with older respondents.
Internet access was linked to performance in the ICT, literacy and numeracy assessments. People who did not have internet in their homes but had access to a computer (either at home or in their workplace) were outperformed in all three assessments by respondents who had a home internet connection.
Daily internet use was associated with strong performance in the ICT assessment, while people who carried out a wider range of online activities tended to score higher than those who carried out fewer activities.
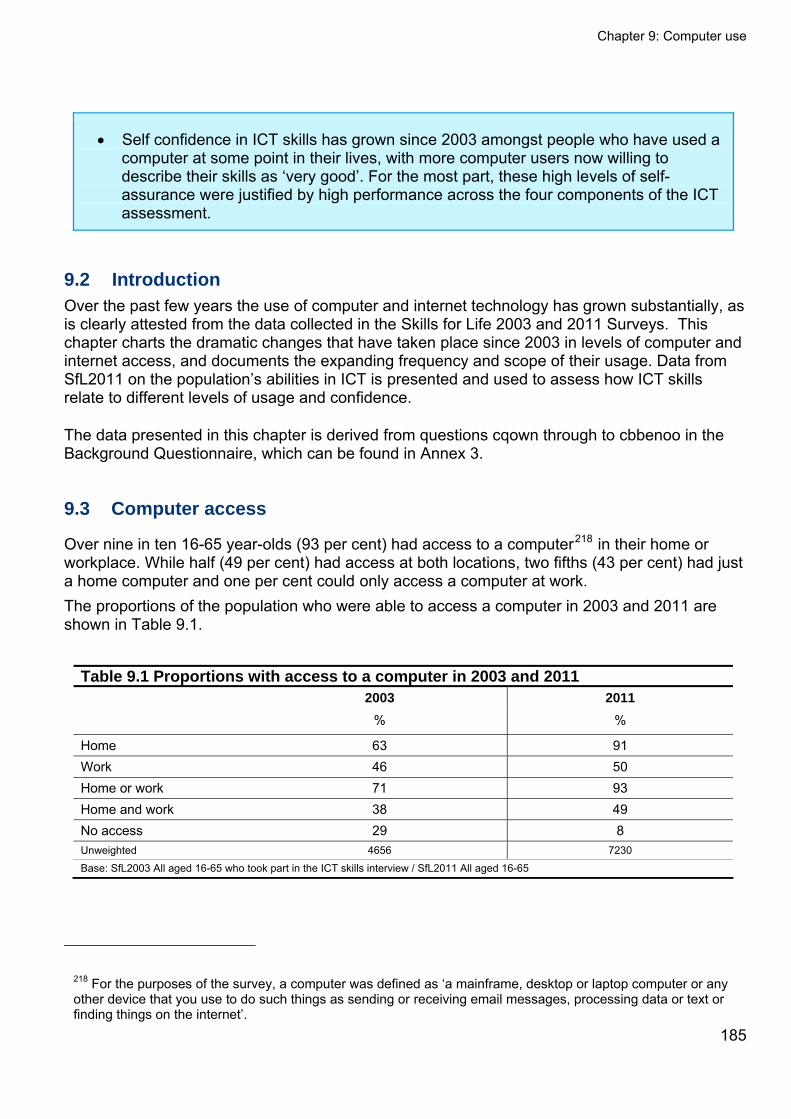
Chapter 9: Computer use
185
Self confidence in ICT skills has grown since 2003 amongst people who have used a computer at some point in their lives, with more computer users now willing to describe their skills as ‘very good’. For the most part, these high levels of self-assurance were justified by high performance across the four components of the ICT assessment.
9.2 Introduction Over the past few years the use of computer and internet technology has grown substantially, as is clearly attested from the data collected in the Skills for Life 2003 and 2011 Surveys. This chapter charts the dramatic changes that have taken place since 2003 in levels of computer and internet access, and documents the expanding frequency and scope of their usage. Data from SfL2011 on the population’s abilities in ICT is presented and used to assess how ICT skills relate to different levels of usage and confidence.
The data presented in this chapter is derived from questions cqown through to cbbenoo in the Background Questionnaire, which can be found in Annex 3.
9.3 Computer access
Over nine in ten 16-65 year-olds (93 per cent) had access to a computer218 in their home or workplace. While half (49 per cent) had access at both locations, two fifths (43 per cent) had just a home computer and one per cent could only access a computer at work. The proportions of the population who were able to access a computer in 2003 and 2011 are shown in Table 9.1.
Table 9.1 Proportions with access to a computer in 2003 and 2011 2003 2011
% %
Home 63 91 Work 46 50 Home or work 71 93 Home and work 38 49 No access 29 8 Unweighted 4656 7230
Base: SfL2003 All aged 16-65 who took part in the ICT skills interview / SfL2011 All aged 16-65
218 For the purposes of the survey, a computer was defined as ‘a mainframe, desktop or laptop computer or any other device that you use to do such things as sending or receiving email messages, processing data or text or finding things on the internet’.
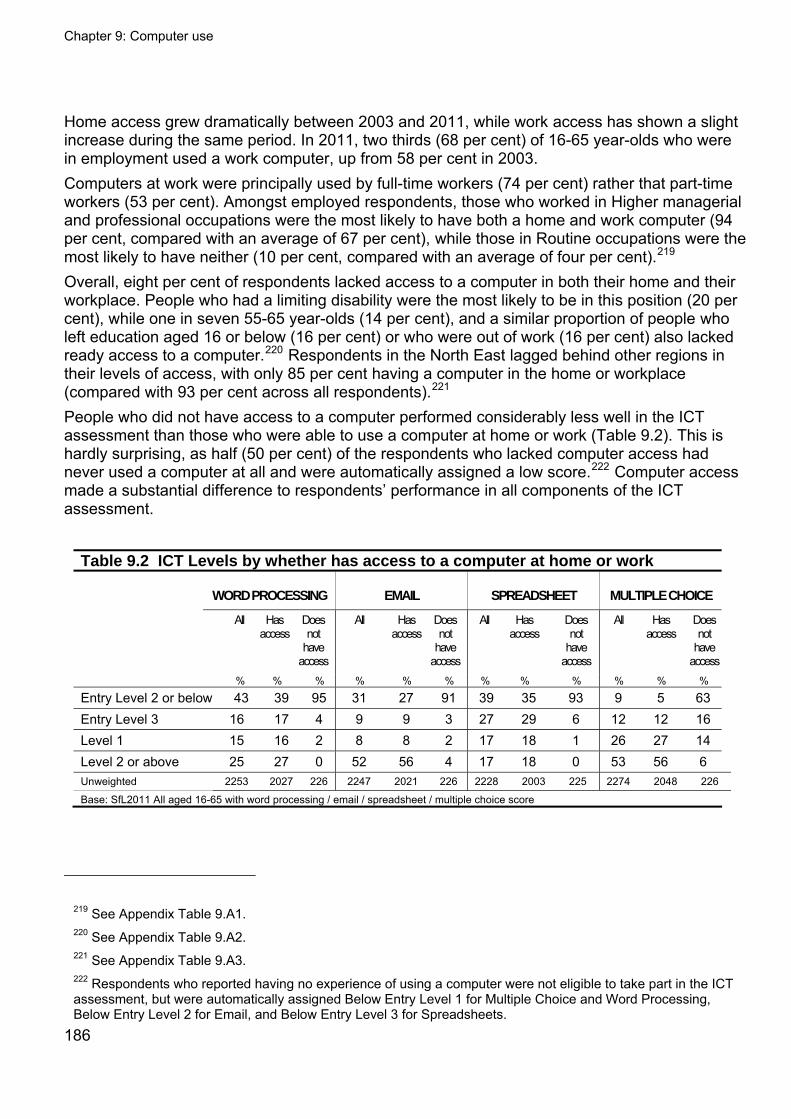
Chapter 9: Computer use
186
Home access grew dramatically between 2003 and 2011, while work access has shown a slight increase during the same period. In 2011, two thirds (68 per cent) of 16-65 year-olds who were in employment used a work computer, up from 58 per cent in 2003. Computers at work were principally used by full-time workers (74 per cent) rather that part-time workers (53 per cent). Amongst employed respondents, those who worked in Higher managerial and professional occupations were the most likely to have both a home and work computer (94 per cent, compared with an average of 67 per cent), while those in Routine occupations were the most likely to have neither (10 per cent, compared with an average of four per cent).219 Overall, eight per cent of respondents lacked access to a computer in both their home and their workplace. People who had a limiting disability were the most likely to be in this position (20 per cent), while one in seven 55-65 year-olds (14 per cent), and a similar proportion of people who left education aged 16 or below (16 per cent) or who were out of work (16 per cent) also lacked ready access to a computer.220 Respondents in the North East lagged behind other regions in their levels of access, with only 85 per cent having a computer in the home or workplace (compared with 93 per cent across all respondents).221 People who did not have access to a computer performed considerably less well in the ICT assessment than those who were able to use a computer at home or work (Table 9.2). This is hardly surprising, as half (50 per cent) of the respondents who lacked computer access had never used a computer at all and were automatically assigned a low score.222 Computer access made a substantial difference to respondents’ performance in all components of the ICT assessment.
Table 9.2 ICT Levels by whether has access to a computer at home or work
WORD PROCESSING EMAIL SPREADSHEET MULTIPLE CHOICE
All Has access
Does not
have access
All Has access
Does not
have access
All Has access
Does not
have access
All
Has access
Does not
have access
% % % % % % % % % % % %
Entry Level 2 or below 43 39 95 31 27 91 39 35 93 9 5 63 Entry Level 3 16 17 4 9 9 3 27 29 6 12 12 16 Level 1 15 16 2 8 8 2 17 18 1 26 27 14 Level 2 or above 25 27 0 52 56 4 17 18 0 53 56 6 Unweighted 2253 2027 226 2247 2021 226 2228 2003 225 2274 2048 226
Base: SfL2011 All aged 16-65 with word processing / email / spreadsheet / multiple choice score
219 See Appendix Table 9.A1. 220 See Appendix Table 9.A2. 221 See Appendix Table 9.A3. 222 Respondents who reported having no experience of using a computer were not eligible to take part in the ICT assessment, but were automatically assigned Below Entry Level 1 for Multiple Choice and Word Processing, Below Entry Level 2 for Email, and Below Entry Level 3 for Spreadsheets.
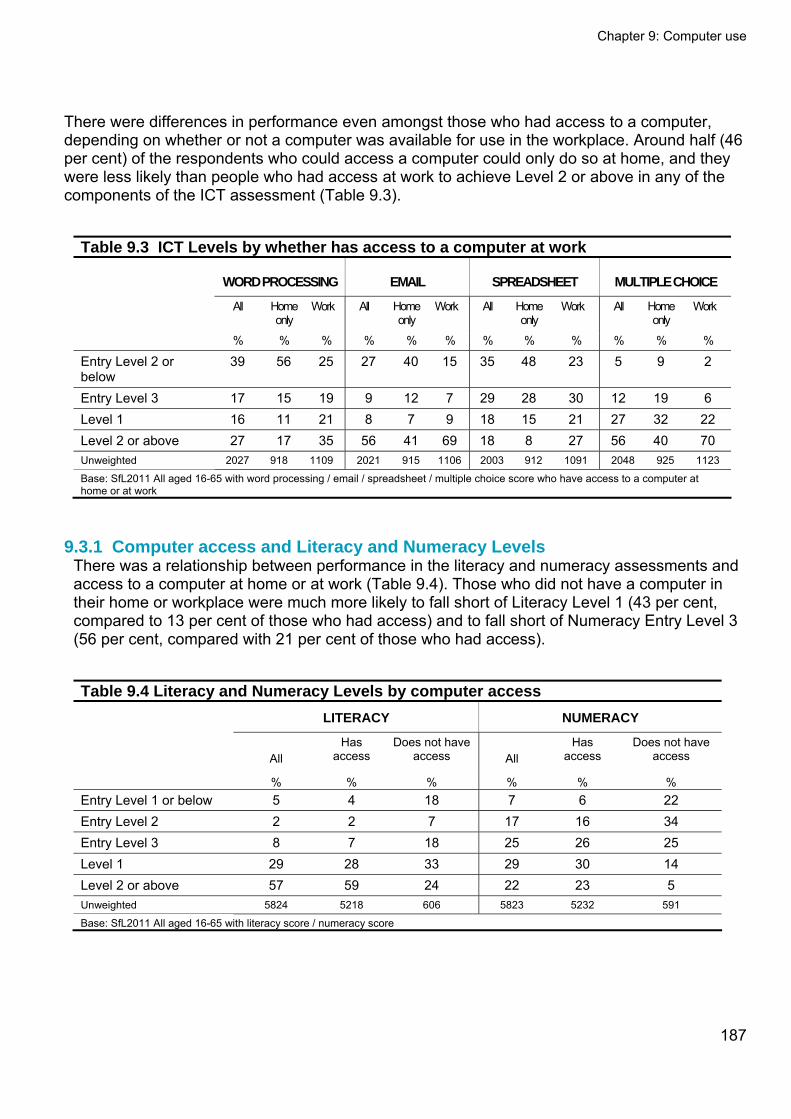
Chapter 9: Computer use
187
There were differences in performance even amongst those who had access to a computer, depending on whether or not a computer was available for use in the workplace. Around half (46 per cent) of the respondents who could access a computer could only do so at home, and they were less likely than people who had access at work to achieve Level 2 or above in any of the components of the ICT assessment (Table 9.3).
Table 9.3 ICT Levels by whether has access to a computer at work
WORD PROCESSING EMAIL SPREADSHEET MULTIPLE CHOICE
All Home only
Work All Home only
Work All Home only
Work All Home only
Work
% % % % % % % % % % % %
Entry Level 2 or below
39 56 25 27 40 15 35 48 23 5 9 2
Entry Level 3 17 15 19 9 12 7 29 28 30 12 19 6 Level 1 16 11 21 8 7 9 18 15 21 27 32 22 Level 2 or above 27 17 35 56 41 69 18 8 27 56 40 70 Unweighted 2027 918 1109 2021 915 1106 2003 912 1091 2048 925 1123
Base: SfL2011 All aged 16-65 with word processing / email / spreadsheet / multiple choice score who have access to a computer at home or at work
9.3.1 Computer access and Literacy and Numeracy Levels There was a relationship between performance in the literacy and numeracy assessments and access to a computer at home or at work (Table 9.4). Those who did not have a computer in their home or workplace were much more likely to fall short of Literacy Level 1 (43 per cent, compared to 13 per cent of those who had access) and to fall short of Numeracy Entry Level 3 (56 per cent, compared with 21 per cent of those who had access).
Table 9.4 Literacy and Numeracy Levels by computer access
LITERACY NUMERACY
All
Has access
Does not have access
All
Has access
Does not have access
% % % % % % Entry Level 1 or below 5 4 18 7 6 22 Entry Level 2 2 2 7 17 16 34 Entry Level 3 8 7 18 25 26 25 Level 1 29 28 33 29 30 14 Level 2 or above 57 59 24 22 23 5 Unweighted 5824 5218 606 5823 5232 591
Base: SfL2011 All aged 16-65 with literacy score / numeracy score

Chapter 9: Computer use
9.4 Frequency of computer use
The frequency of computer usage in 2011 is shown in Figure 9.1.
Figure 9.1 Frequency of computer usage (%)
73
Uses less than daily
Used weekly in the past or outside of
home or the workplace
Used irregularly in the past or outside
the home or workplace
Has never used a computer
3
3
15
6
Uses daily
Base: SfL2011 All aged 16-65 (7230)
Almost three quarters of 16-65 year-olds made daily use of a computer (73 per cent). This equates to four fifths (79 per cent) of those who had access to a computer in their home or workplace. Daily usage of a home computer was reported by three fifths of all SfL2011 respondents (61 per cent), while daily usage of a work computer was reported by only two fifths (43 per cent). This reverses the pattern seen in 2003, when daily usage was more common amongst people who had access at work (37 per cent of SfL2003 respondents used a work computer daily, but only 25 per cent used a home computer daily). One out of every eight people (12 per cent) did not use a home or work computer at all. Included amongst them was a minority (five per cent) who avoided using a computer despite having access to one in their home. Six per cent of respondents had never used a computer, while a further six per cent only used a computer outside the home or workplace, or had only ever used one in the past. The latter group was evenly split between weekly users (three per cent) and those who used a computer on a less frequent basis (three per cent). Over the past eight years there has been a striking increase in the frequency of computer usage, and in the proportion of 16-65 year-olds who use computers (Table 9.5). Frequent users increased markedly, while those who used a computer just once or less than once a week decreased. During the same period, the proportions who have never used a computer, and those who used computers exclusively outside the home or workplace or had only ever used a computer in the past, more than halved.
188
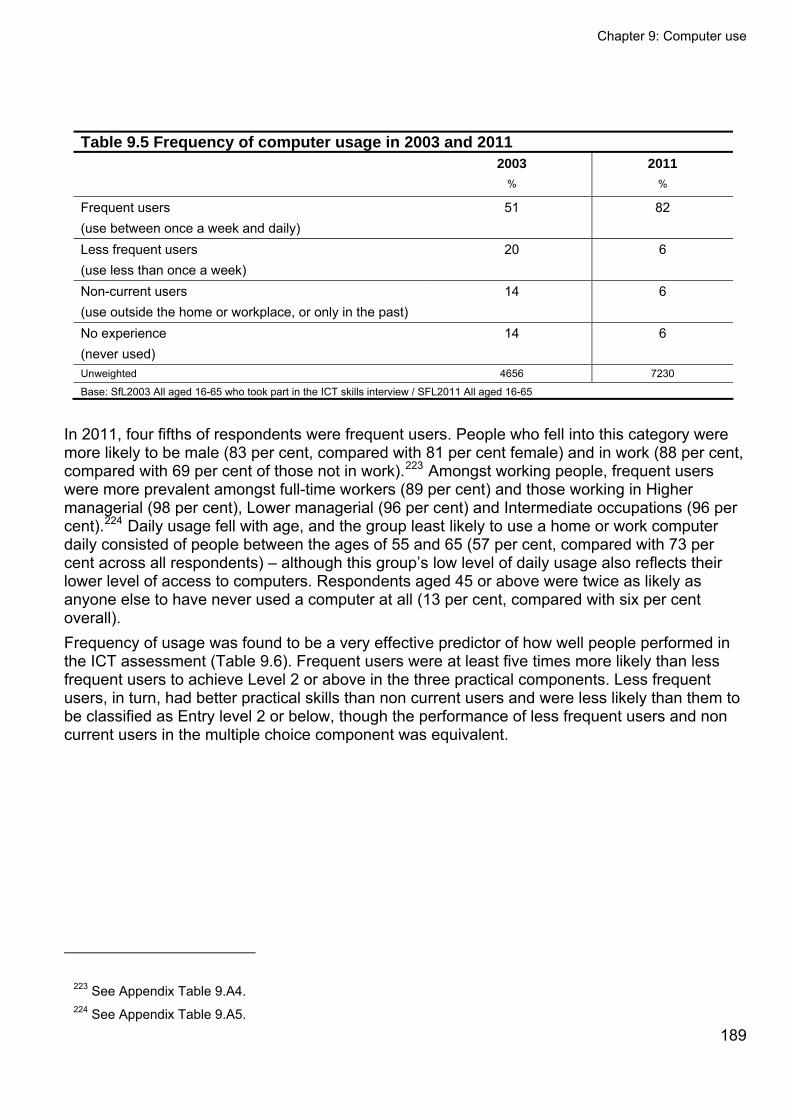
Chapter 9: Computer use
189
Table 9.5 Frequency of computer usage in 2003 and 2011 2003 2011
% %
Frequent users (use between once a week and daily)
51 82
Less frequent users (use less than once a week)
20 6
Non-current users (use outside the home or workplace, or only in the past)
14 6
No experience (never used)
14 6
Unweighted 4656 7230
Base: SfL2003 All aged 16-65 who took part in the ICT skills interview / SFL2011 All aged 16-65
In 2011, four fifths of respondents were frequent users. People who fell into this category were more likely to be male (83 per cent, compared with 81 per cent female) and in work (88 per cent, compared with 69 per cent of those not in work).223 Amongst working people, frequent users were more prevalent amongst full-time workers (89 per cent) and those working in Higher managerial (98 per cent), Lower managerial (96 per cent) and Intermediate occupations (96 per cent).224 Daily usage fell with age, and the group least likely to use a home or work computer daily consisted of people between the ages of 55 and 65 (57 per cent, compared with 73 per cent across all respondents) – although this group’s low level of daily usage also reflects their lower level of access to computers. Respondents aged 45 or above were twice as likely as anyone else to have never used a computer at all (13 per cent, compared with six per cent overall). Frequency of usage was found to be a very effective predictor of how well people performed in the ICT assessment (Table 9.6). Frequent users were at least five times more likely than less frequent users to achieve Level 2 or above in the three practical components. Less frequent users, in turn, had better practical skills than non current users and were less likely than them to be classified as Entry level 2 or below, though the performance of less frequent users and non current users in the multiple choice component was equivalent.
223 See Appendix Table 9.A4. 224 See Appendix Table 9.A5.
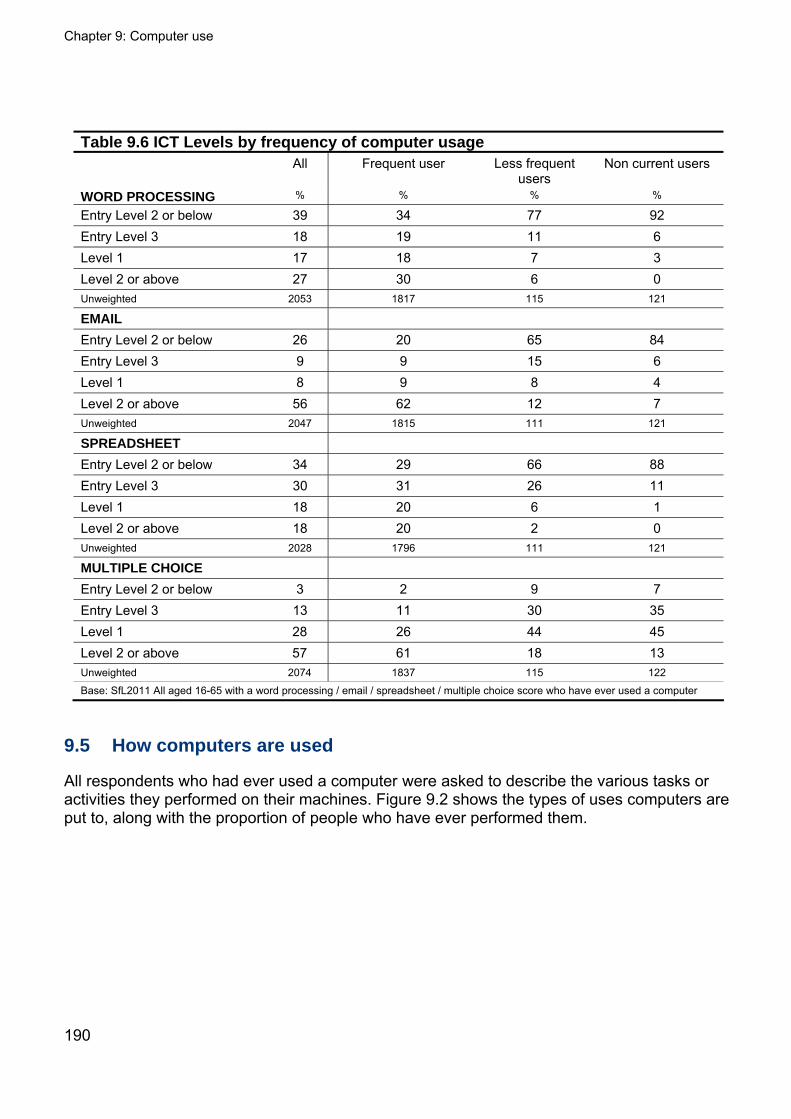
Chapter 9: Computer use
190
Table 9.6 ICT Levels by frequency of computer usage All Frequent user Less frequent
users Non current users
WORD PROCESSING % % % %
Entry Level 2 or below 39 34 77 92 Entry Level 3 18 19 11 6 Level 1 17 18 7 3 Level 2 or above 27 30 6 0 Unweighted 2053 1817 115 121
Entry Level 2 or below 26 20 65 84 Entry Level 3 9 9 15 6 Level 1 8 9 8 4 Level 2 or above 56 62 12 7 Unweighted 2047 1815 111 121
SPREADSHEET
Entry Level 2 or below 34 29 66 88 Entry Level 3 30 31 26 11 Level 1 18 20 6 1 Level 2 or above 18 20 2 0 Unweighted 2028 1796 111 121
MULTIPLE CHOICE
Entry Level 2 or below 3 2 9 7 Entry Level 3 13 11 30 35 Level 1 28 26 44 45 Level 2 or above 57 61 18 13 Unweighted 2074 1837 115 122
Base: SfL2011 All aged 16-65 with a word processing / email / spreadsheet / multiple choice score who have ever used a computer
9.5 How computers are used
All respondents who had ever used a computer were asked to describe the various tasks or activities they performed on their machines. Figure 9.2 shows the types of uses computers are put to, along with the proportion of people who have ever performed them.
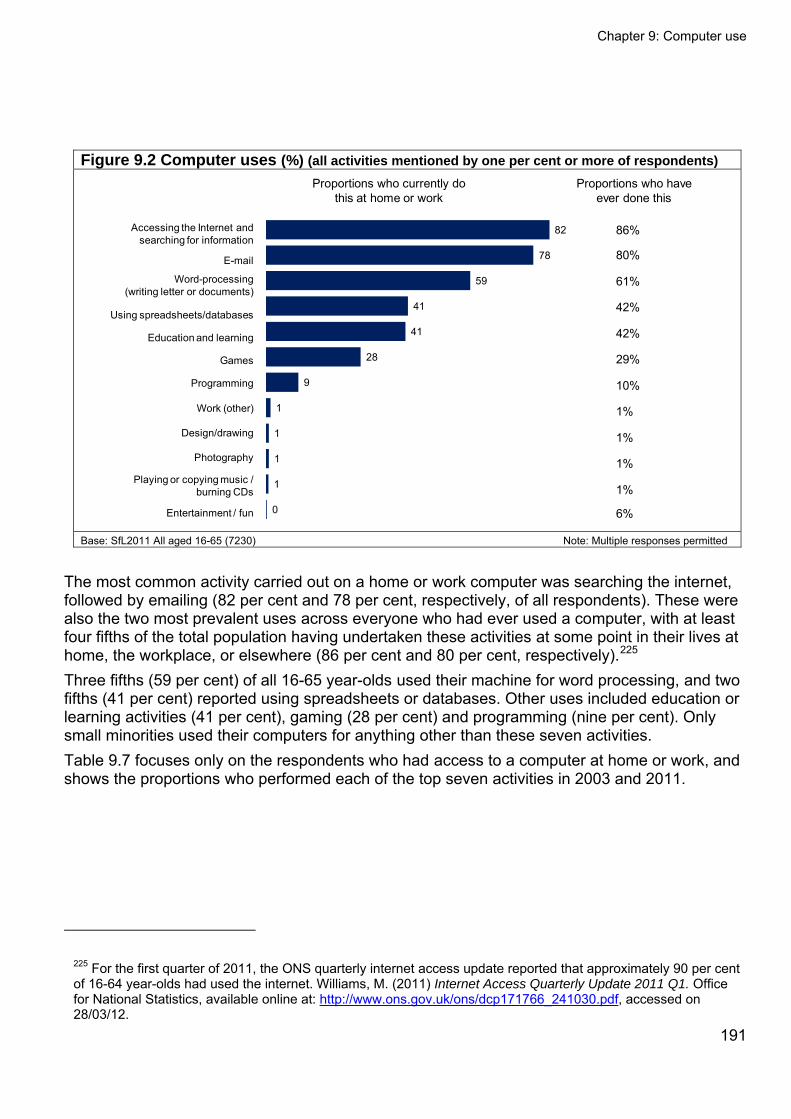
Chapter 9: Computer use
Figure 9.2 Computer uses (%) (all activities mentioned by one per cent or more of respondents)
82
78
59
41
41
28
9
1
1
1
1
0
Accessing the Internet and searching for information
Word-processing (writing letter or documents)
Using spreadsheets/databases
Education and learning
Games
Programming
Work (other)
Design/drawing
Photography
Playing or copying music / burning CDs
Entertainment / fun
Proportions who have ever done this
86%
80%
61%
42%
42%
29%
10%
1%
1%
1%
1%
6%
Proportions who currently do this at home or work
Base: SfL2011 All aged 16-65 (7230) Note: Multiple responses permitted
The most common activity carried out on a home or work computer was searching the internet, followed by emailing (82 per cent and 78 per cent, respectively, of all respondents). These were also the two most prevalent uses across everyone who had ever used a computer, with at least four fifths of the total population having undertaken these activities at some point in their lives at home, the workplace, or elsewhere (86 per cent and 80 per cent, respectively).225 Three fifths (59 per cent) of all 16-65 year-olds used their machine for word processing, and two fifths (41 per cent) reported using spreadsheets or databases. Other uses included education or learning activities (41 per cent), gaming (28 per cent) and programming (nine per cent). Only small minorities used their computers for anything other than these seven activities. Table 9.7 focuses only on the respondents who had access to a computer at home or work, and shows the proportions who performed each of the top seven activities in 2003 and 2011.
225 For the first quarter of 2011, the ONS quarterly internet access update reported that approximately 90 per cent of 16-64 year-olds had used the internet. Williams, M. (2011) Internet Access Quarterly Update 2011 Q1. Office for National Statistics, available online at: http://www.ons.gov.uk/ons/dcp171766_241030.pdf, accessed on 28/03/12.
191
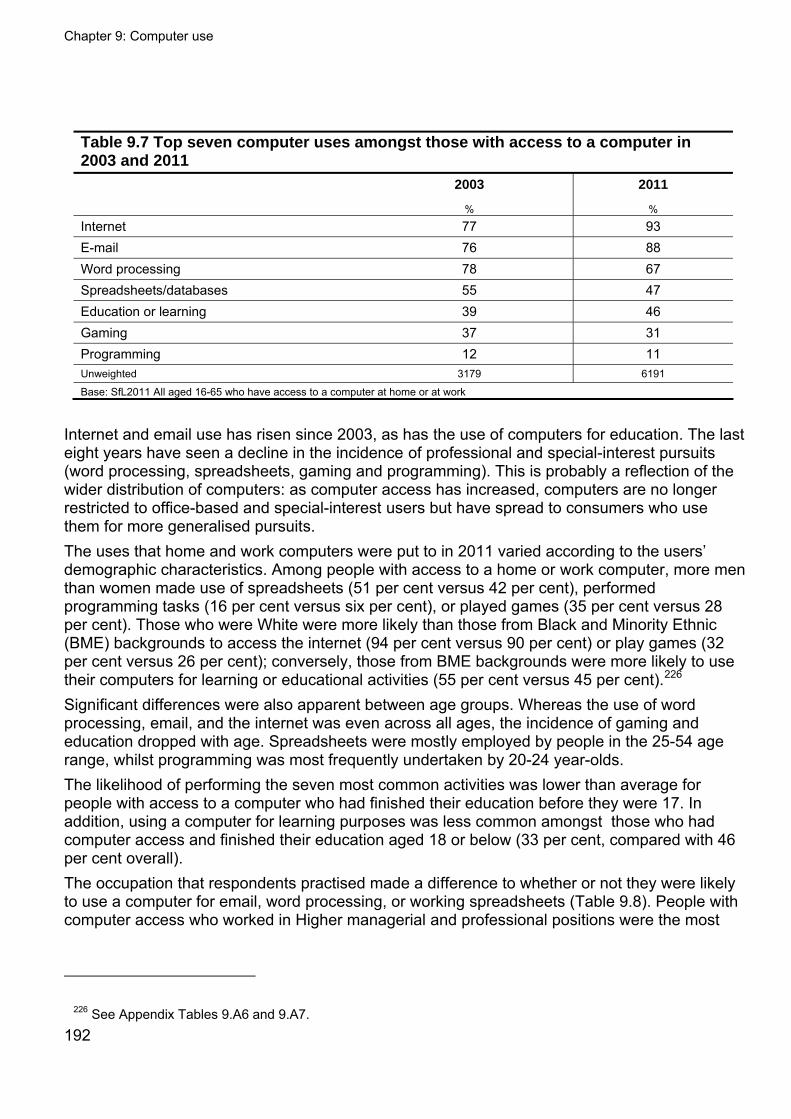
Chapter 9: Computer use
192
Table 9.7 Top seven computer uses amongst those with access to a computer in 2003 and 2011
2003 2011
% %
Internet 77 93 E-mail 76 88 Word processing 78 67 Spreadsheets/databases 55 47 Education or learning 39 46 Gaming 37 31 Programming 12 11 Unweighted 3179 6191
Base: SfL2011 All aged 16-65 who have access to a computer at home or at work
Internet and email use has risen since 2003, as has the use of computers for education. The last eight years have seen a decline in the incidence of professional and special-interest pursuits (word processing, spreadsheets, gaming and programming). This is probably a reflection of the wider distribution of computers: as computer access has increased, computers are no longer restricted to office-based and special-interest users but have spread to consumers who use them for more generalised pursuits. The uses that home and work computers were put to in 2011 varied according to the users’ demographic characteristics. Among people with access to a home or work computer, more men than women made use of spreadsheets (51 per cent versus 42 per cent), performed programming tasks (16 per cent versus six per cent), or played games (35 per cent versus 28 per cent). Those who were White were more likely than those from Black and Minority Ethnic (BME) backgrounds to access the internet (94 per cent versus 90 per cent) or play games (32 per cent versus 26 per cent); conversely, those from BME backgrounds were more likely to use their computers for learning or educational activities (55 per cent versus 45 per cent).226 Significant differences were also apparent between age groups. Whereas the use of word processing, email, and the internet was even across all ages, the incidence of gaming and education dropped with age. Spreadsheets were mostly employed by people in the 25-54 age range, whilst programming was most frequently undertaken by 20-24 year-olds. The likelihood of performing the seven most common activities was lower than average for people with access to a computer who had finished their education before they were 17. In addition, using a computer for learning purposes was less common amongst those who had computer access and finished their education aged 18 or below (33 per cent, compared with 46 per cent overall). The occupation that respondents practised made a difference to whether or not they were likely to use a computer for email, word processing, or working spreadsheets (Table 9.8). People with computer access who worked in Higher managerial and professional positions were the most
226 See Appendix Tables 9.A6 and 9.A7.
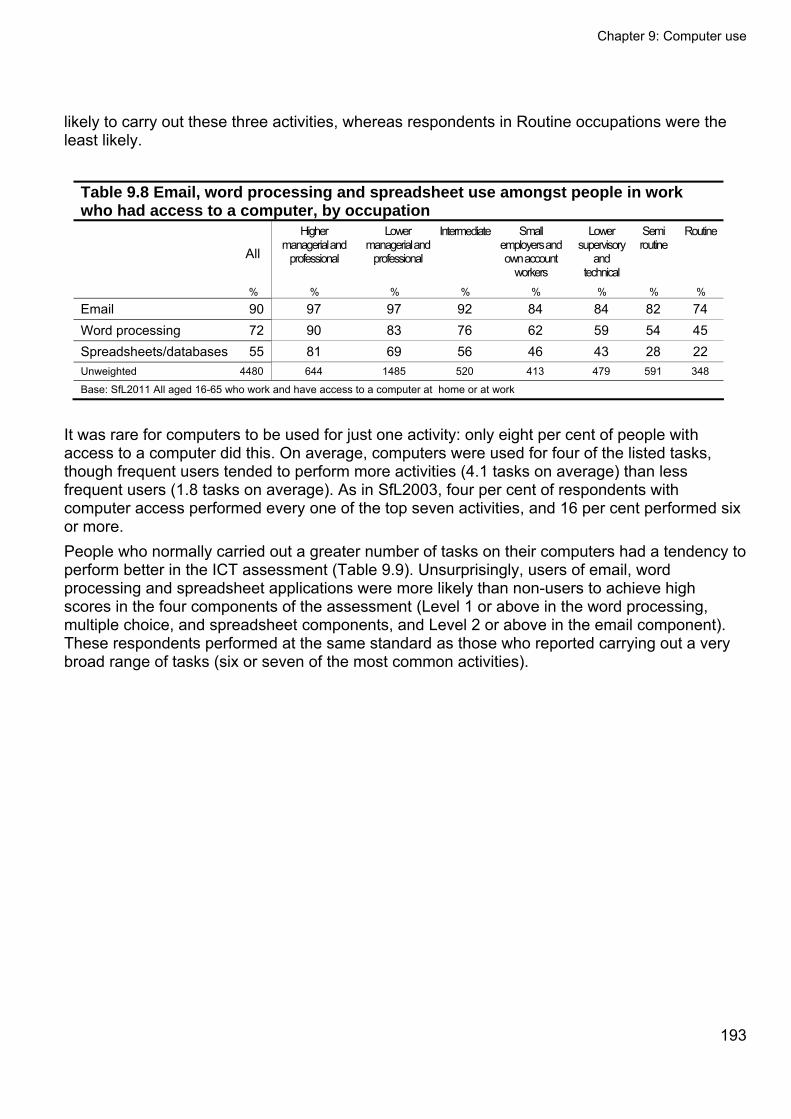
Chapter 9: Computer use
193
likely to carry out these three activities, whereas respondents in Routine occupations were the least likely.
Table 9.8 Email, word processing and spreadsheet use amongst people in work who had access to a computer, by occupation
All
Higher managerial and
professional
Lower managerial and
professional
Intermediate
Small
employers and own account
workers
Lower supervisory
and technical
Semi routine
Routine
% % % % % % % %
Email 90 97 97 92 84 84 82 74 Word processing 72 90 83 76 62 59 54 45 Spreadsheets/databases 55 81 69 56 46 43 28 22 Unweighted 4480 644 1485 520 413 479 591 348
Base: SfL2011 All aged 16-65 who work and have access to a computer at home or at work
It was rare for computers to be used for just one activity: only eight per cent of people with access to a computer did this. On average, computers were used for four of the listed tasks, though frequent users tended to perform more activities (4.1 tasks on average) than less frequent users (1.8 tasks on average). As in SfL2003, four per cent of respondents with computer access performed every one of the top seven activities, and 16 per cent performed six or more. People who normally carried out a greater number of tasks on their computers had a tendency to perform better in the ICT assessment (Table 9.9). Unsurprisingly, users of email, word processing and spreadsheet applications were more likely than non-users to achieve high scores in the four components of the assessment (Level 1 or above in the word processing, multiple choice, and spreadsheet components, and Level 2 or above in the email component). These respondents performed at the same standard as those who reported carrying out a very broad range of tasks (six or seven of the most common activities).
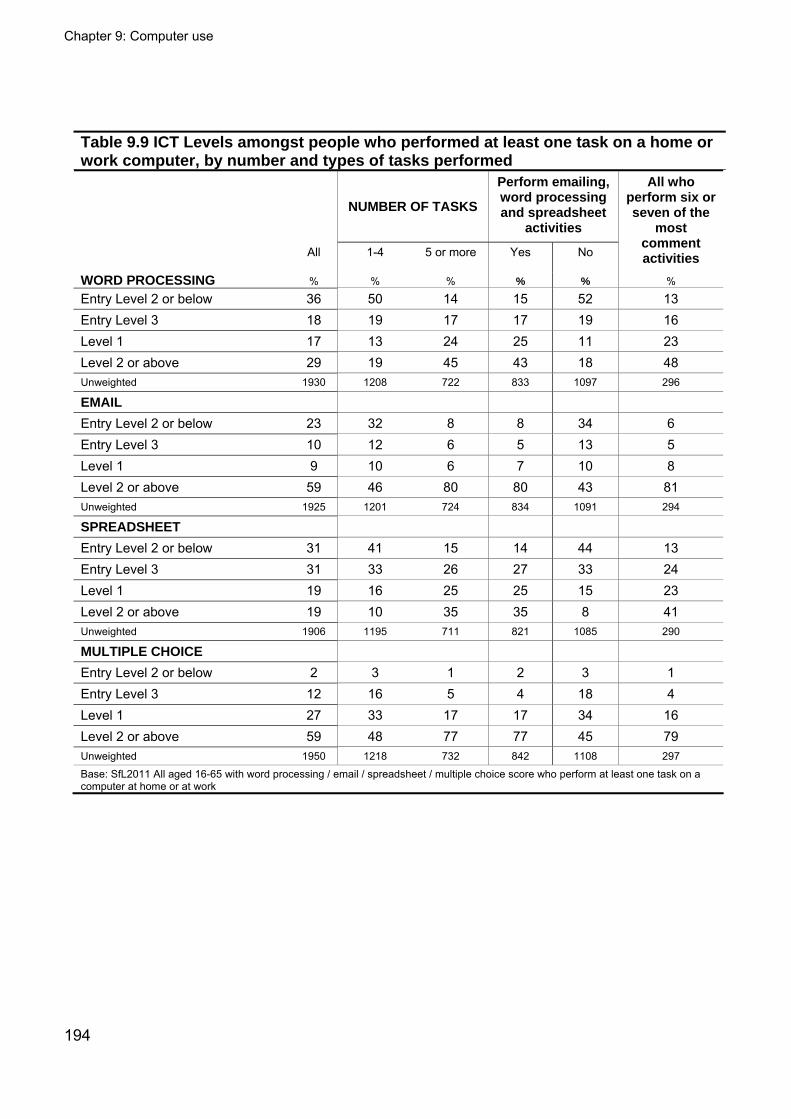
Chapter 9: Computer use
194
Table 9.9 ICT Levels amongst people who performed at least one task on a home or work computer, by number and types of tasks performed
NUMBER OF TASKS
Perform emailing, word processing and spreadsheet
activities
All 1-4 5 or more Yes No
All who perform six or seven of the
most comment activities
WORD PROCESSING % % % % % %
Entry Level 2 or below 36 50 14 15 52 13 Entry Level 3 18 19 17 17 19 16 Level 1 17 13 24 25 11 23 Level 2 or above 29 19 45 43 18 48 Unweighted 1930 1208 722 833 1097 296
Entry Level 2 or below 23 32 8 8 34 6 Entry Level 3 10 12 6 5 13 5 Level 1 9 10 6 7 10 8 Level 2 or above 59 46 80 80 43 81 Unweighted 1925 1201 724 834 1091 294
SPREADSHEET
Entry Level 2 or below 31 41 15 14 44 13 Entry Level 3 31 33 26 27 33 24 Level 1 19 16 25 25 15 23 Level 2 or above 19 10 35 35 8 41 Unweighted 1906 1195 711 821 1085 290
MULTIPLE CHOICE
Entry Level 2 or below 2 3 1 2 3 1 Entry Level 3 12 16 5 4 18 4 Level 1 27 33 17 17 34 16 Level 2 or above 59 48 77 77 45 79 Unweighted 1950 1218 732 842 1108 297
Base: SfL2011 All aged 16-65 with word processing / email / spreadsheet / multiple choice score who perform at least one task on a computer at home or at work
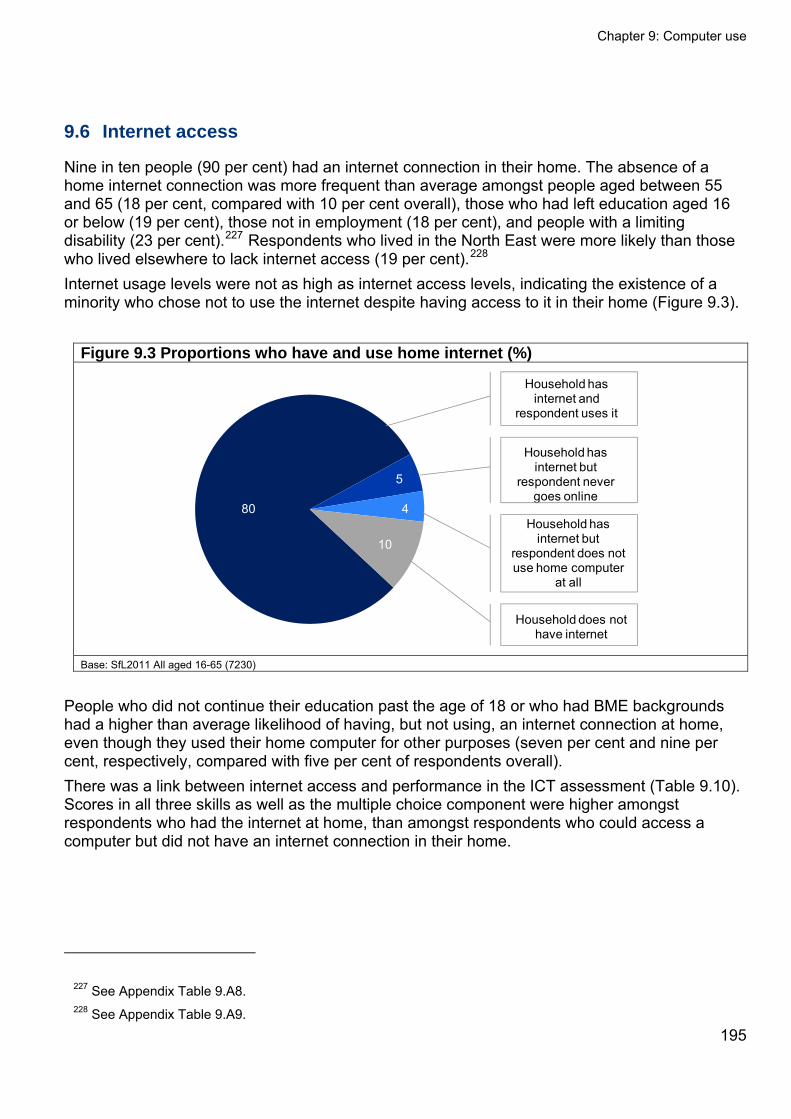
Chapter 9: Computer use
9.6 Internet access
Nine in ten people (90 per cent) had an internet connection in their home. The absence of a home internet connection was more frequent than average amongst people aged between 55 and 65 (18 per cent, compared with 10 per cent overall), those who had left education aged 16 or below (19 per cent), those not in employment (18 per cent), and people with a limiting disability (23 per cent).227 Respondents who lived in the North East were more likely than those who lived elsewhere to lack internet access (19 per cent).228 Internet usage levels were not as high as internet access levels, indicating the existence of a minority who chose not to use the internet despite having access to it in their home (Figure 9.3).
Figure 9.3 Proportions who have and use home internet (%)
Household has internet and
respondent uses it
Household has internet but
respondent never goes online
Household has internet but
respondent does not use home computer
at all
Household does not have internet
4
10
5
80
Base: SfL2011 All aged 16-65 (7230)
People who did not continue their education past the age of 18 or who had BME backgrounds had a higher than average likelihood of having, but not using, an internet connection at home, even though they used their home computer for other purposes (seven per cent and nine per cent, respectively, compared with five per cent of respondents overall). There was a link between internet access and performance in the ICT assessment (Table 9.10). Scores in all three skills as well as the multiple choice component were higher amongst respondents who had the internet at home, than amongst respondents who could access a computer but did not have an internet connection in their home.
227 See Appendix Table 9.A8. 228 See Appendix Table 9.A9.
195
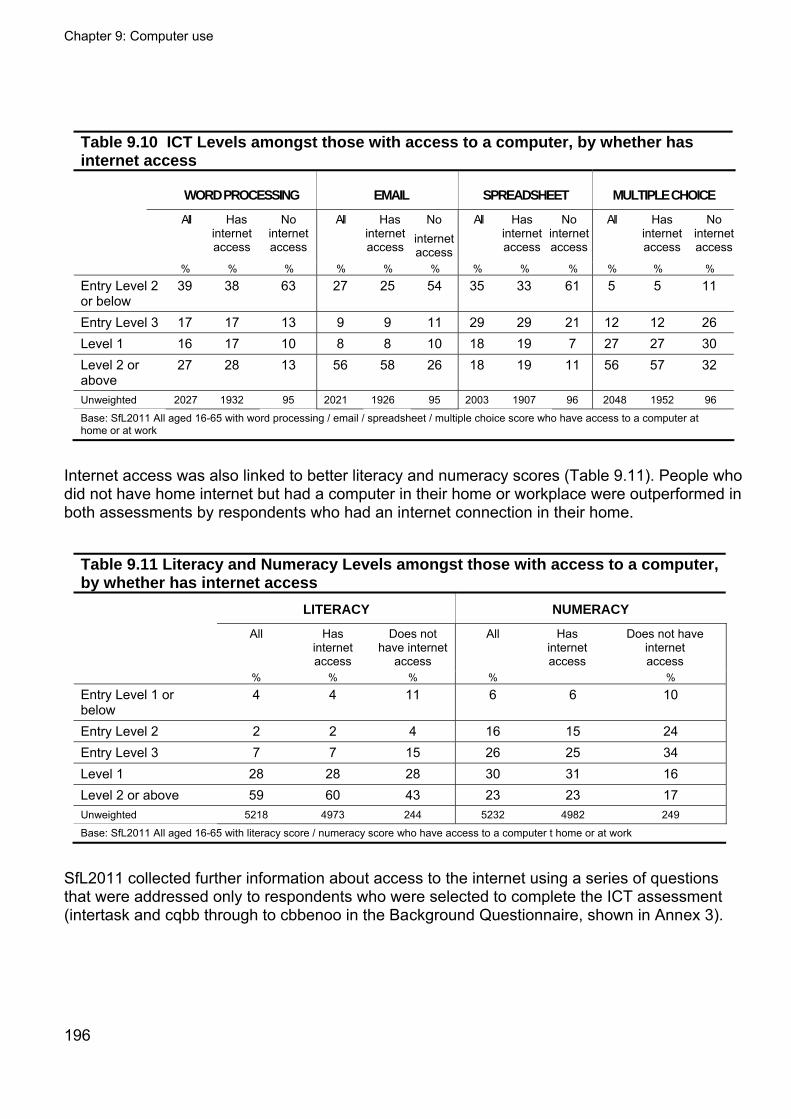
Chapter 9: Computer use
196
Table 9.10 ICT Levels amongst those with access to a computer, by whether has internet access
WORD PROCESSING EMAIL SPREADSHEET MULTIPLE CHOICE
All Has internet access
No internet access
All Has internet access
No internet access
All Has internet access
No internet access
All Has internet access
No internetaccess
% % % % % % % % % % % %
Entry Level 2 or below
39 38 63 27 25 54 35 33 61 5 5 11
Entry Level 3 17 17 13 9 9 11 29 29 21 12 12 26 Level 1 16 17 10 8 8 10 18 19 7 27 27 30 Level 2 or above
27 28 13 56 58 26 18 19 11 56 57 32
Unweighted 2027 1932 95 2021 1926 95 2003 1907 96 2048 1952 96
Base: SfL2011 All aged 16-65 with word processing / email / spreadsheet / multiple choice score who have access to a computer at home or at work
Internet access was also linked to better literacy and numeracy scores (Table 9.11). People who did not have home internet but had a computer in their home or workplace were outperformed in both assessments by respondents who had an internet connection in their home.
Table 9.11 Literacy and Numeracy Levels amongst those with access to a computer, by whether has internet access
LITERACY NUMERACY
All Has internet access
Does not have internet
access
All Has internet access
Does not have internet access
% % % % %
Entry Level 1 or below
4 4 11 6 6 10
Entry Level 2 2 2 4 16 15 24 Entry Level 3 7 7 15 26 25 34 Level 1 28 28 28 30 31 16 Level 2 or above 59 60 43 23 23 17 Unweighted 5218 4973 244 5232 4982 249
Base: SfL2011 All aged 16-65 with literacy score / numeracy score who have access to a computer t home or at work
SfL2011 collected further information about access to the internet using a series of questions that were addressed only to respondents who were selected to complete the ICT assessment (intertask and cqbb through to cbbenoo in the Background Questionnaire, shown in Annex 3).
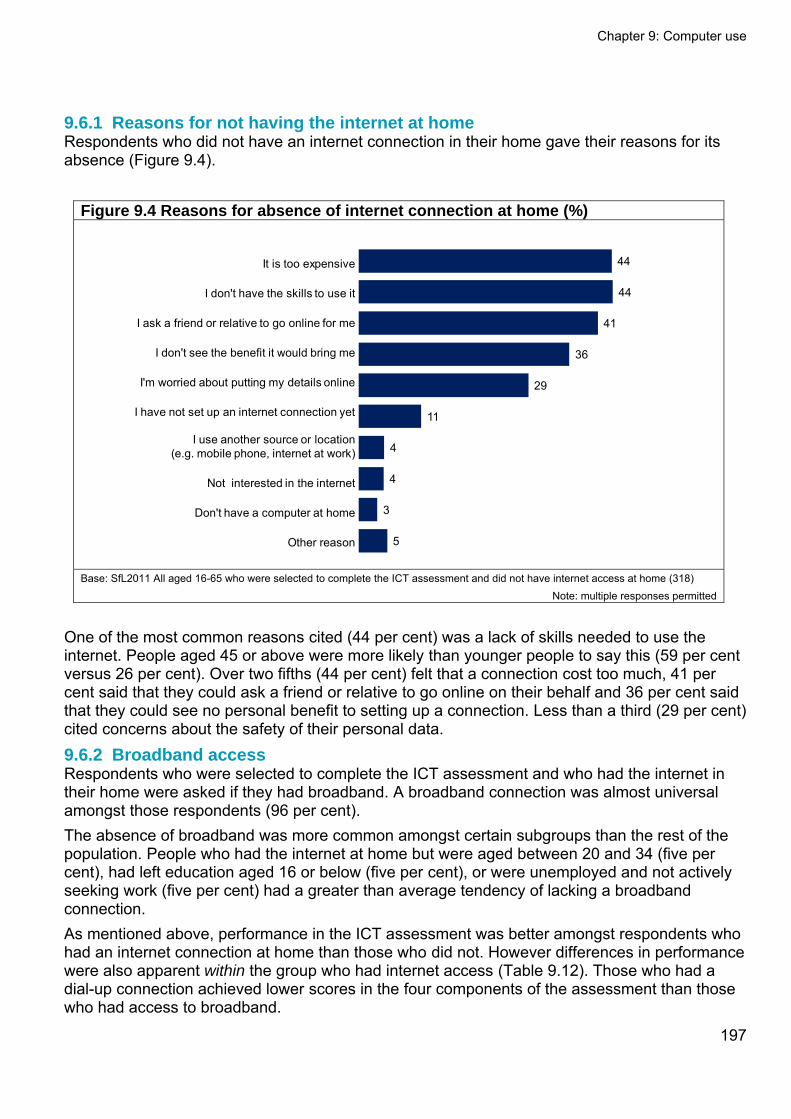
Chapter 9: Computer use
9.6.1 Reasons for not having the internet at home Respondents who did not have an internet connection in their home gave their reasons for its absence (Figure 9.4).
Figure 9.4 Reasons for absence of internet connection at home (%)
44
44
41
36
29
11
4
4
3
5
It is too expensive
I don't have the skills to use it
I ask a friend or relative to go online for me
I don't see the benefit it would bring me
I'm worried about putting my details online
I have not set up an internet connection yet
I use another source or location (e.g. mobile phone, internet at work)
Not interested in the internet
Don't have a computer at home
Other reason
Base: SfL2011 All aged 16-65 who were selected to complete the ICT assessment and did not have internet access at home (318) Note: multiple responses permitted
One of the most common reasons cited (44 per cent) was a lack of skills needed to use the internet. People aged 45 or above were more likely than younger people to say this (59 per cent versus 26 per cent). Over two fifths (44 per cent) felt that a connection cost too much, 41 per cent said that they could ask a friend or relative to go online on their behalf and 36 per cent said that they could see no personal benefit to setting up a connection. Less than a third (29 per cent) cited concerns about the safety of their personal data. 9.6.2 Broadband access Respondents who were selected to complete the ICT assessment and who had the internet in their home were asked if they had broadband. A broadband connection was almost universal amongst those respondents (96 per cent). The absence of broadband was more common amongst certain subgroups than the rest of the population. People who had the internet at home but were aged between 20 and 34 (five per cent), had left education aged 16 or below (five per cent), or were unemployed and not actively seeking work (five per cent) had a greater than average tendency of lacking a broadband connection. As mentioned above, performance in the ICT assessment was better amongst respondents who had an internet connection at home than those who did not. However differences in performance were also apparent within the group who had internet access (Table 9.12). Those who had a dial-up connection achieved lower scores in the four components of the assessment than those who had access to broadband.
197
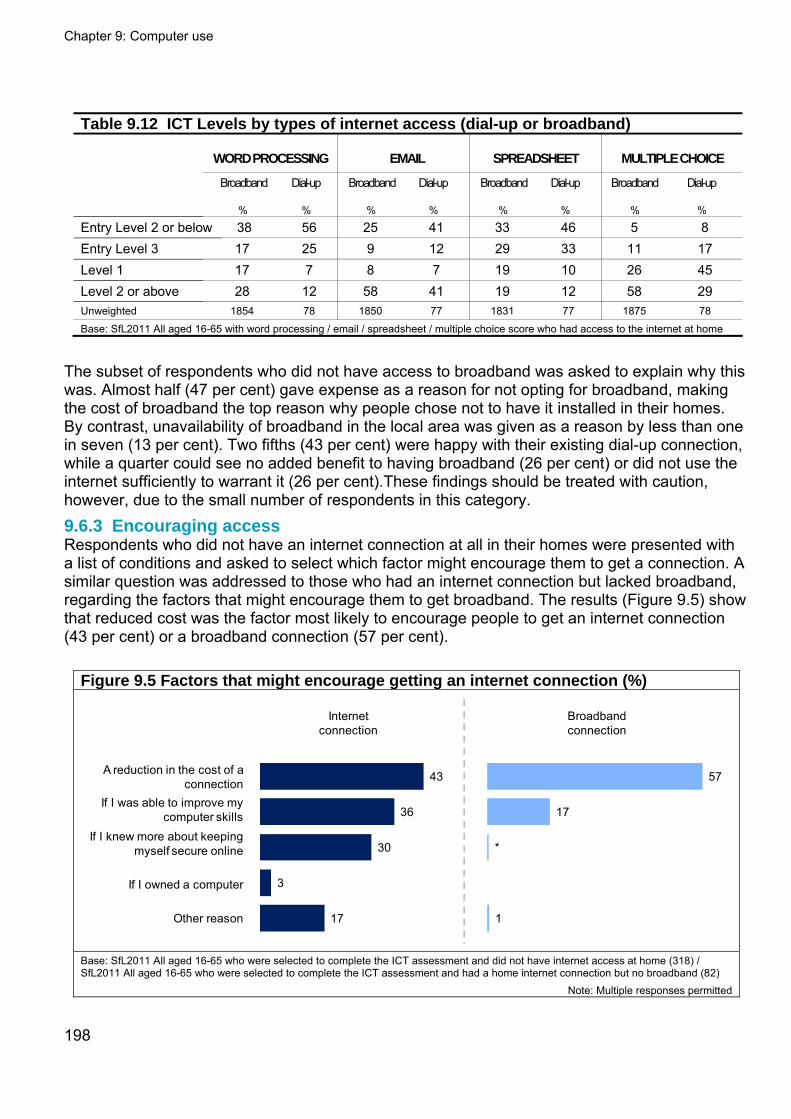
Chapter 9: Computer use
Table 9.12 ICT Levels by types of internet access (dial-up or broadband)
WORD PROCESSING EMAIL SPREADSHEET MULTIPLE CHOICE
Broadband Dial-up Broadband Dial-up Broadband Dial-up Broadband Dial-up
% % % % % % % %
Entry Level 2 or below 38 56 25 41 33 46 5 8 Entry Level 3 17 25 9 12 29 33 11 17 Level 1 17 7 8 7 19 10 26 45 Level 2 or above 28 12 58 41 19 12 58 29 Unweighted 1854 78 1850 77 1831 77 1875 78
Base: SfL2011 All aged 16-65 with word processing / email / spreadsheet / multiple choice score who had access to the internet at home
The subset of respondents who did not have access to broadband was asked to explain why this was. Almost half (47 per cent) gave expense as a reason for not opting for broadband, making the cost of broadband the top reason why people chose not to have it installed in their homes. By contrast, unavailability of broadband in the local area was given as a reason by less than one in seven (13 per cent). Two fifths (43 per cent) were happy with their existing dial-up connection, while a quarter could see no added benefit to having broadband (26 per cent) or did not use the internet sufficiently to warrant it (26 per cent).These findings should be treated with caution, however, due to the small number of respondents in this category. 9.6.3 Encouraging access Respondents who did not have an internet connection at all in their homes were presented with a list of conditions and asked to select which factor might encourage them to get a connection. A similar question was addressed to those who had an internet connection but lacked broadband, regarding the factors that might encourage them to get broadband. The results (Figure 9.5) show that reduced cost was the factor most likely to encourage people to get an internet connection (43 per cent) or a broadband connection (57 per cent).
Figure 9.5 Factors that might encourage getting an internet connection (%)
43
36
30
3
17
A reduction in the cost of a connection
If I was able to improve my computer skills
If I knew more about keeping myself secure online
If I owned a computer
Other reason
57
17
*
1
Internet connection
Broadband connection
Base: SfL2011 All aged 16-65 who were selected to complete the ICT assessment and did not have internet access at home (318) / SfL2011 All aged 16-65 who were selected to complete the ICT assessment and had a home internet connection but no broadband (82)
Note: Multiple responses permitted
198
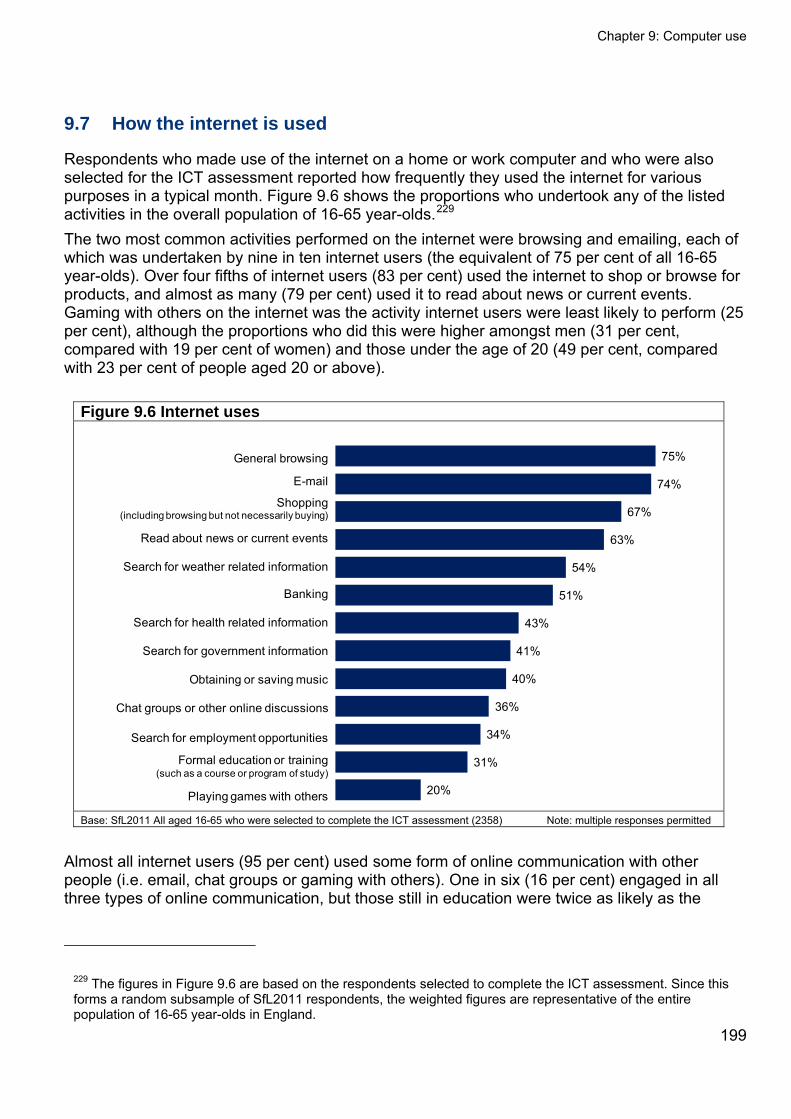
Chapter 9: Computer use
9.7 How the internet is used
Respondents who made use of the internet on a home or work computer and who were also selected for the ICT assessment reported how frequently they used the internet for various purposes in a typical month. Figure 9.6 shows the proportions who undertook any of the listed activities in the overall population of 16-65 year-olds.229 The two most common activities performed on the internet were browsing and emailing, each of which was undertaken by nine in ten internet users (the equivalent of 75 per cent of all 16-65 year-olds). Over four fifths of internet users (83 per cent) used the internet to shop or browse for products, and almost as many (79 per cent) used it to read about news or current events. Gaming with others on the internet was the activity internet users were least likely to perform (25 per cent), although the proportions who did this were higher amongst men (31 per cent, compared with 19 per cent of women) and those under the age of 20 (49 per cent, compared with 23 per cent of people aged 20 or above).
Figure 9.6 Internet uses
75%
74%
67%
63%
54%
51%
43%
41%
40%
36%
34%
31%
20%
General browsing
Shopping (including browsing but not necessarily buying)
Read about news or current events
Search for weather related information
Banking
Search for health related information
Search for government information
Obtaining or saving music
Chat groups or other online discussions
Search for employment opportunities
Formal education or training (such as a course or program of study)
Playing games with others Base: SfL2011 All aged 16-65 who were selected to complete the ICT assessment (2358) Note: multiple responses permitted
Almost all internet users (95 per cent) used some form of online communication with other people (i.e. email, chat groups or gaming with others). One in six (16 per cent) engaged in all three types of online communication, but those still in education were twice as likely as the
229 The figures in Figure 9.6 are based on the respondents selected to complete the ICT assessment. Since this forms a random subsample of SfL2011 respondents, the weighted figures are representative of the entire population of 16-65 year-olds in England.
199
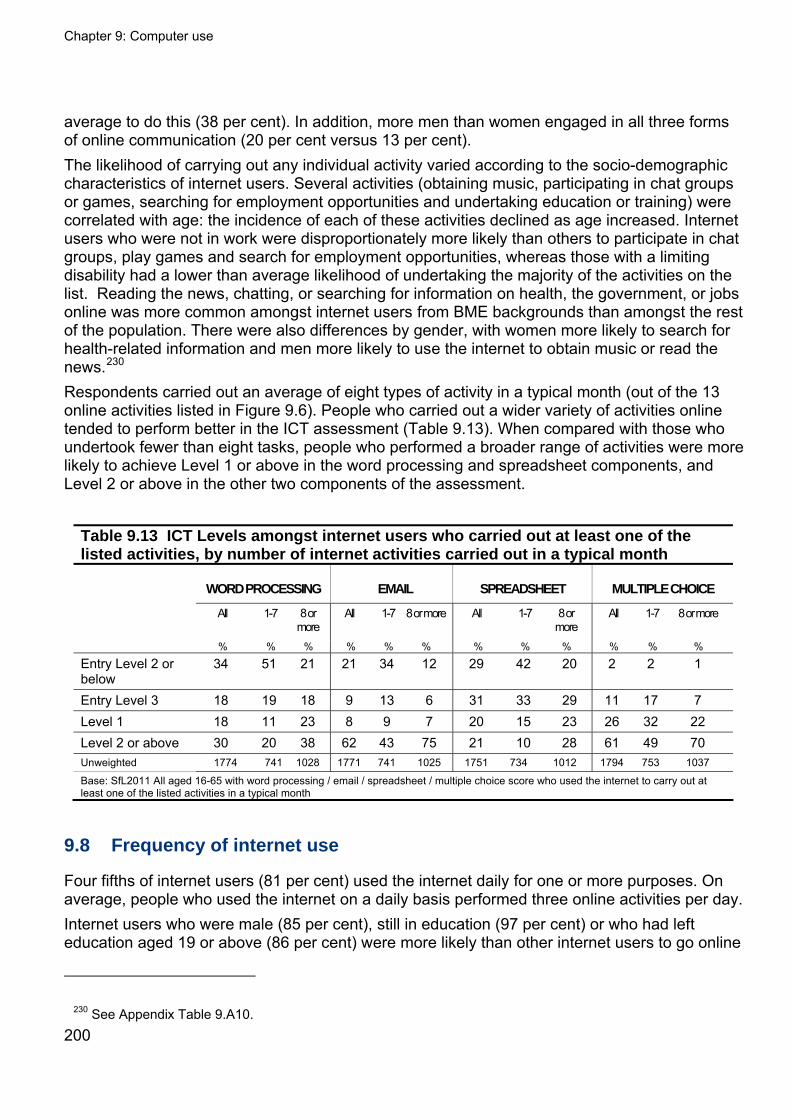
Chapter 9: Computer use
200
average to do this (38 per cent). In addition, more men than women engaged in all three forms of online communication (20 per cent versus 13 per cent). The likelihood of carrying out any individual activity varied according to the socio-demographic characteristics of internet users. Several activities (obtaining music, participating in chat groups or games, searching for employment opportunities and undertaking education or training) were correlated with age: the incidence of each of these activities declined as age increased. Internet users who were not in work were disproportionately more likely than others to participate in chat groups, play games and search for employment opportunities, whereas those with a limiting disability had a lower than average likelihood of undertaking the majority of the activities on the list. Reading the news, chatting, or searching for information on health, the government, or jobs online was more common amongst internet users from BME backgrounds than amongst the rest of the population. There were also differences by gender, with women more likely to search for health-related information and men more likely to use the internet to obtain music or read the news.230 Respondents carried out an average of eight types of activity in a typical month (out of the 13 online activities listed in Figure 9.6). People who carried out a wider variety of activities online tended to perform better in the ICT assessment (Table 9.13). When compared with those who undertook fewer than eight tasks, people who performed a broader range of activities were more likely to achieve Level 1 or above in the word processing and spreadsheet components, and Level 2 or above in the other two components of the assessment.
Table 9.13 ICT Levels amongst internet users who carried out at least one of the listed activities, by number of internet activities carried out in a typical month
WORD PROCESSING EMAIL SPREADSHEET MULTIPLE CHOICE
All 1-7 8 or more
All 1-7 8 or more All 1-7 8 or more
All 1-7 8 or more
% % % % % % % % % % % %
Entry Level 2 or below
34 51 21 21 34 12 29 42 20 2 2 1
Entry Level 3 18 19 18 9 13 6 31 33 29 11 17 7 Level 1 18 11 23 8 9 7 20 15 23 26 32 22 Level 2 or above 30 20 38 62 43 75 21 10 28 61 49 70 Unweighted 1774 741 1028 1771 741 1025 1751 734 1012 1794 753 1037
Base: SfL2011 All aged 16-65 with word processing / email / spreadsheet / multiple choice score who used the internet to carry out at least one of the listed activities in a typical month
9.8 Frequency of internet use
Four fifths of internet users (81 per cent) used the internet daily for one or more purposes. On average, people who used the internet on a daily basis performed three online activities per day. Internet users who were male (85 per cent), still in education (97 per cent) or who had left education aged 19 or above (86 per cent) were more likely than other internet users to go online
230 See Appendix Table 9.A10.
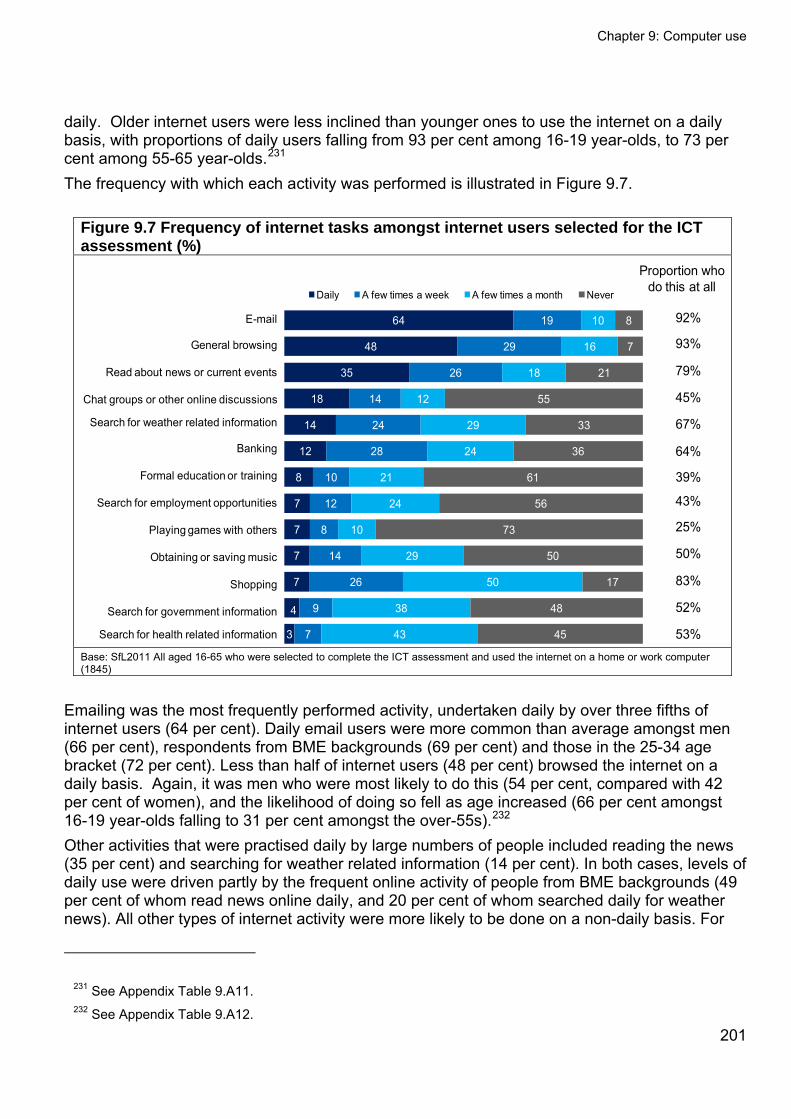
Chapter 9: Computer use
daily. Older internet users were less inclined than younger ones to use the internet on a daily basis, with proportions of daily users falling from 93 per cent among 16-19 year-olds, to 73 per cent among 55-65 year-olds.231 The frequency with which each activity was performed is illustrated in Figure 9.7.
Figure 9.7 Frequency of internet tasks amongst internet users selected for the ICT assessment (%)
64
48
35
18
14
12
8
7
7
7
7
4
3
19
29
26
14
24
28
10
12
8
14
26
9
7
10
16
18
12
29
24
21
24
10
29
50
38
43
8
7
21
55
33
36
61
56
73
50
17
48
45
Daily A few times a week A few times a month Never
General browsing
Read about news or current events
Chat groups or other online discussions
Search for weather related information
Banking
Formal education or training
Search for employment opportunities
Playing games with others
Obtaining or saving music
Shopping
Search for government information
Search for health related information
92%
93%
79%
45%
67%
64%
39%
43%
25%
50%
83%
52%
53%
Proportion who do this at all
Base: SfL2011 All aged 16-65 who were selected to complete the ICT assessment and used the internet on a home or work computer (1845)
Emailing was the most frequently performed activity, undertaken daily by over three fifths of internet users (64 per cent). Daily email users were more common than average amongst men (66 per cent), respondents from BME backgrounds (69 per cent) and those in the 25-34 age bracket (72 per cent). Less than half of internet users (48 per cent) browsed the internet on a daily basis. Again, it was men who were most likely to do this (54 per cent, compared with 42 per cent of women), and the likelihood of doing so fell as age increased (66 per cent amongst 16-19 year-olds falling to 31 per cent amongst the over-55s).232 Other activities that were practised daily by large numbers of people included reading the news (35 per cent) and searching for weather related information (14 per cent). In both cases, levels of daily use were driven partly by the frequent online activity of people from BME backgrounds (49 per cent of whom read news online daily, and 20 per cent of whom searched daily for weather news). All other types of internet activity were more likely to be done on a non-daily basis. For
231 See Appendix Table 9.A11. 232 See Appendix Table 9.A12.
201

Chapter 9: Computer use
202
example, searching for information online about health or the government were more than three times as likely to be undertaken a few times a month, as they were to be done on a daily or weekly basis. People who used the internet daily demonstrated higher skills in the ICT assessment than respondents who used the internet less often (Table 9.14). The discrepancy between the two groups was particularly evident in their performance in the email and multiple choice components of the assessment, where most daily users achieved Level 2 or above but less than a third of non-daily users did the same. The majority of non-daily users were in fact unable to reach beyond Entry Level 3 in the three practical components, and only a third achieved Level 2 or above in the multiple choice assessment (34 per cent, compared with 68 per cent of daily users).
Table 9.14 ICT Levels amongst internet users who carried out at least one of the listed activities, by daily internet usage
WORD PROCESSING EMAIL SPREADSHEET MULTIPLE CHOICE All Daily
user Non-daily user
All
Daily user
Non-daily user
All
Daily user
Non-daily user
All Daily user
Non-daily user
% % % % % % % % % % % % Entry Level 2 or below 34 25 68 21 15 48 29 22 58 2 1 3 Entry Level 3 18 19 15 9 8 15 31 31 28 11 9 20 Level 1 18 20 8 8 8 10 20 22 9 26 22 44 Level 2 or above 30 35 9 62 70 28 21 24 5 61 68 34 Unweighted 1774 1406 368 1771 1408 363 1751 1390 361 1794 1421 373 Base: SfL2011 All aged 16-65 with word processing / email / spreadsheet / multiple choice score who used the internet to carry out at least one of the listed activities in a typical month
As one might expect, daily email users outperformed non-daily email users in the email assessment; the latter, in turn, were more likely to achieve high scores compared to internet users who never made use of email (Table 9.15). The same pattern of performance was repeated in the three remaining components of the assessment, suggesting that email usage is an effective predictor of performance in the ICT assessment.
Table 9.15 ICT Levels amongst internet users who carried out at least one of the listed activities, by frequency of email usage
WORD PROCESSING EMAIL SPREADSHEET MULTIPLE CHOICE
Daily user
Non-daily user
Non user
Daily user
Non-daily user
Non user
Daily user
Non-daily user
Non user
Daily user
Non-daily user
Non user
% % % % % % % % % % % %
Entry Level 2 or below 20 50 85 11 28 81 19 40 76 1 2 6 Entry Level 3 19 20 8 5 18 8 30 34 19 6 18 27 Level 1 22 11 3 8 10 2 23 17 4 20 35 48 Level 2 or above 39 18 4 76 43 10 28 9 1 73 45 19 Unweighted 1118 541 115 1121 539 111 1106 533 112 1134 543 117
Base: SfL2011 All aged 16-65 with word processing / email / spreadsheet / multiple choice score who used the internet to carry out at least one of the listed activities in a typical month
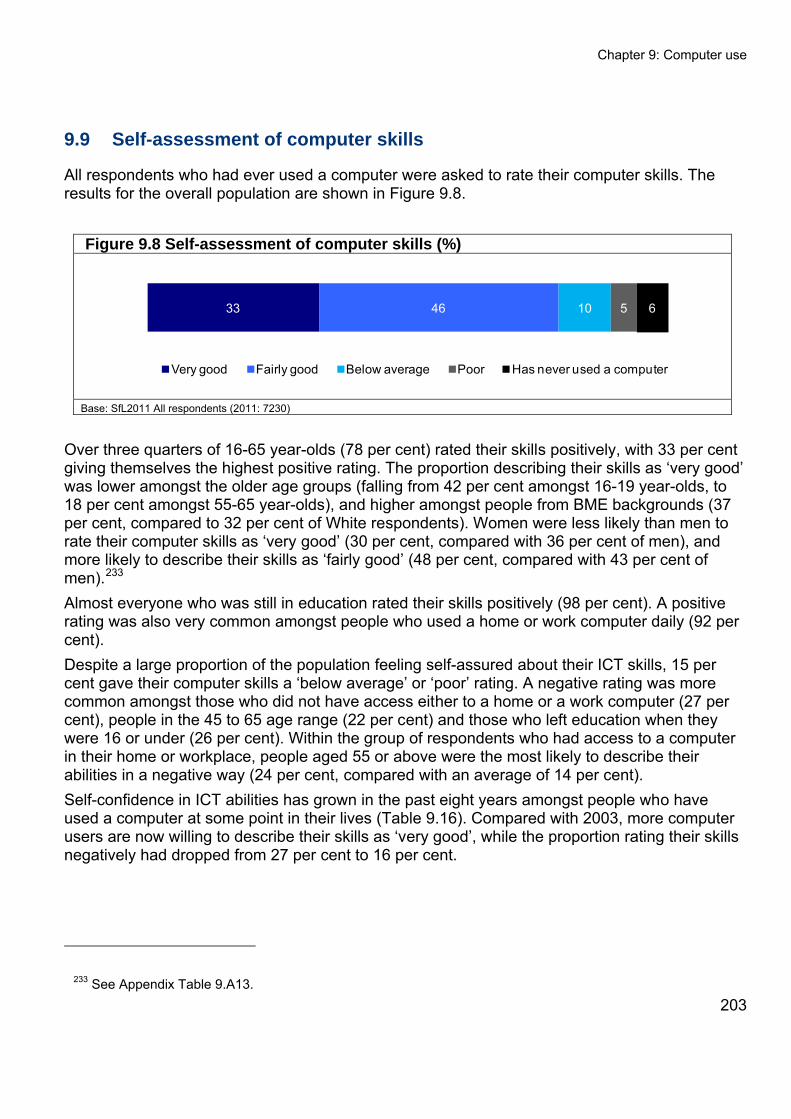
Chapter 9: Computer use
9.9 Self-assessment of computer skills
All respondents who had ever used a computer were asked to rate their computer skills. The results for the overall population are shown in Figure 9.8.
Figure 9.8 Self-assessment of computer skills (%)
33 46 10 5 6
Very good Fairly good Below average Poor Has never used a computer
Base: SfL2011 All respondents (2011: 7230)
Over three quarters of 16-65 year-olds (78 per cent) rated their skills positively, with 33 per cent giving themselves the highest positive rating. The proportion describing their skills as ‘very good’ was lower amongst the older age groups (falling from 42 per cent amongst 16-19 year-olds, to 18 per cent amongst 55-65 year-olds), and higher amongst people from BME backgrounds (37 per cent, compared to 32 per cent of White respondents). Women were less likely than men to rate their computer skills as ‘very good’ (30 per cent, compared with 36 per cent of men), and more likely to describe their skills as ‘fairly good’ (48 per cent, compared with 43 per cent of men).233 Almost everyone who was still in education rated their skills positively (98 per cent). A positive rating was also very common amongst people who used a home or work computer daily (92 per cent). Despite a large proportion of the population feeling self-assured about their ICT skills, 15 per cent gave their computer skills a ‘below average’ or ‘poor’ rating. A negative rating was more common amongst those who did not have access either to a home or a work computer (27 per cent), people in the 45 to 65 age range (22 per cent) and those who left education when they were 16 or under (26 per cent). Within the group of respondents who had access to a computer in their home or workplace, people aged 55 or above were the most likely to describe their abilities in a negative way (24 per cent, compared with an average of 14 per cent). Self-confidence in ICT abilities has grown in the past eight years amongst people who have used a computer at some point in their lives (Table 9.16). Compared with 2003, more computer users are now willing to describe their skills as ‘very good’, while the proportion rating their skills negatively had dropped from 27 per cent to 16 per cent.
233 See Appendix Table 9.A13. 203
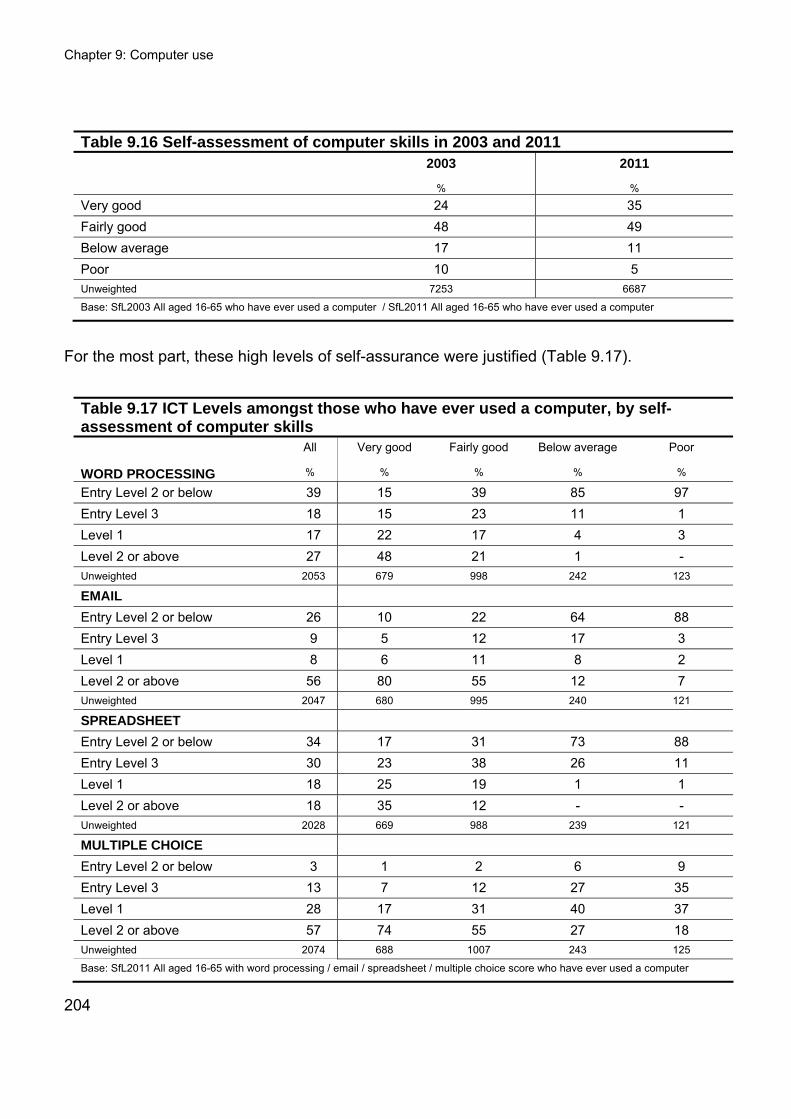
Chapter 9: Computer use
204
Table 9.16 Self-assessment of computer skills in 2003 and 2011 2003 2011
% %
Very good 24 35 Fairly good 48 49 Below average 17 11 Poor 10 5 Unweighted 7253 6687
Base: SfL2003 All aged 16-65 who have ever used a computer / SfL2011 All aged 16-65 who have ever used a computer
For the most part, these high levels of self-assurance were justified (Table 9.17).
Table 9.17 ICT Levels amongst those who have ever used a computer, by self-assessment of computer skills
All Very good Fairly good Below average Poor
WORD PROCESSING % % % % %
Entry Level 2 or below 39 15 39 85 97 Entry Level 3 18 15 23 11 1 Level 1 17 22 17 4 3 Level 2 or above 27 48 21 1 - Unweighted 2053 679 998 242 123
Entry Level 2 or below 26 10 22 64 88 Entry Level 3 9 5 12 17 3 Level 1 8 6 11 8 2 Level 2 or above 56 80 55 12 7 Unweighted 2047 680 995 240 121
SPREADSHEET
Entry Level 2 or below 34 17 31 73 88 Entry Level 3 30 23 38 26 11 Level 1 18 25 19 1 1 Level 2 or above 18 35 12 - - Unweighted 2028 669 988 239 121
MULTIPLE CHOICE
Entry Level 2 or below 3 1 2 6 9 Entry Level 3 13 7 12 27 35 Level 1 28 17 31 40 37 Level 2 or above 57 74 55 27 18 Unweighted 2074 688 1007 243 125
Base: SfL2011 All aged 16-65 with word processing / email / spreadsheet / multiple choice score who have ever used a computer

Chapter 9: Computer use
205
Most of the respondents who described their skills as ‘very good’ achieved Level 2 or above in the email and multiple choice components, and Level 1 or above in the word processing and spreadsheet components of the assessment. Respondents who gave their skills lower ratings did not perform as well, with those describing their skills as ‘poor’ achieving the lowest scores, indicating that the majority of respondents have a reasonably good understanding of their ability to work with computers. Nevertheless, over one in ten of those who claimed to be ‘very good’ at using computers over-estimated their skills, achieving no more than Entry Level 2 in the three practical components of the ICT assessment. The under-estimation of abilities was less common, especially with regards to word processing and spreadsheet skills: almost none of the people who described their skills negatively managed to exceed Level 1 in these two components of the assessment.
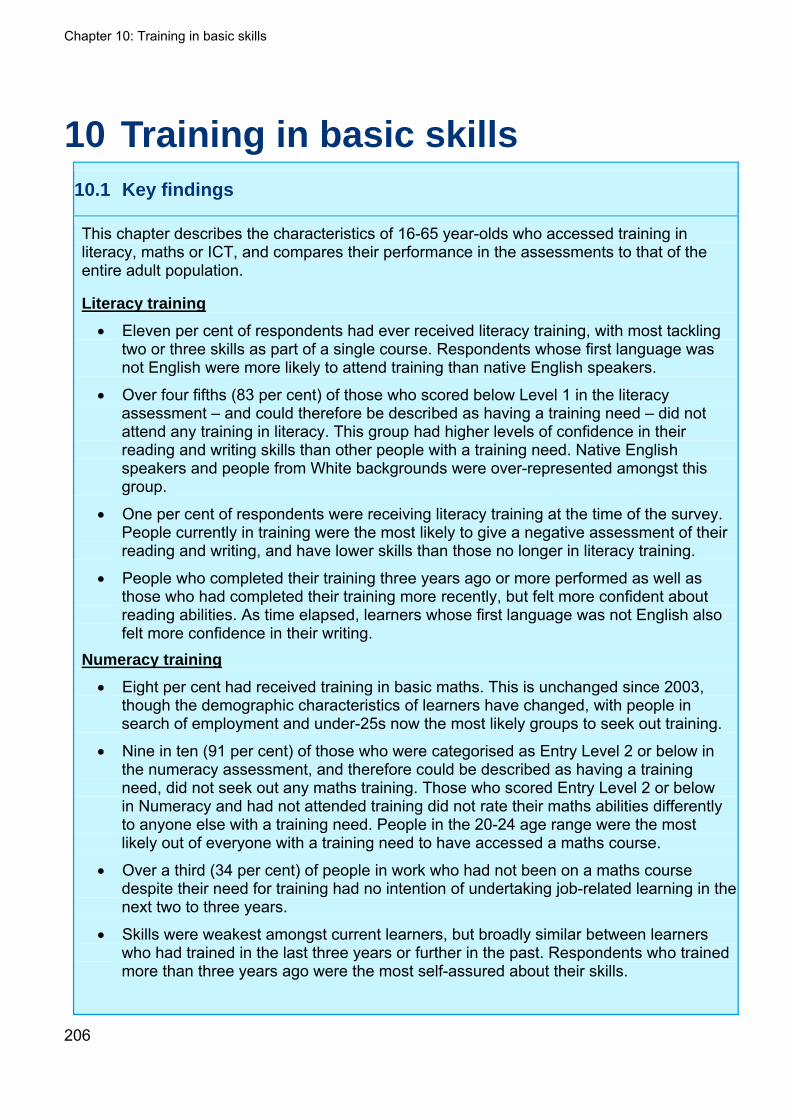
Chapter 10: Training in basic skills
206
10 Training in basic skills 10.1 Key findings
This chapter describes the characteristics of 16-65 year-olds who accessed training in literacy, maths or ICT, and compares their performance in the assessments to that of the entire adult population.
Literacy training
Eleven per cent of respondents had ever received literacy training, with most tackling two or three skills as part of a single course. Respondents whose first language was not English were more likely to attend training than native English speakers.
Over four fifths (83 per cent) of those who scored below Level 1 in the literacy assessment – and could therefore be described as having a training need – did not attend any training in literacy. This group had higher levels of confidence in their reading and writing skills than other people with a training need. Native English speakers and people from White backgrounds were over-represented amongst this group.
One per cent of respondents were receiving literacy training at the time of the survey. People currently in training were the most likely to give a negative assessment of their reading and writing, and have lower skills than those no longer in literacy training.
People who completed their training three years ago or more performed as well as those who had completed their training more recently, but felt more confident about reading abilities. As time elapsed, learners whose first language was not English also felt more confidence in their writing.
Numeracy training
Eight per cent had received training in basic maths. This is unchanged since 2003, though the demographic characteristics of learners have changed, with people in search of employment and under-25s now the most likely groups to seek out training.
Nine in ten (91 per cent) of those who were categorised as Entry Level 2 or below in the numeracy assessment, and therefore could be described as having a training need, did not seek out any maths training. Those who scored Entry Level 2 or below in Numeracy and had not attended training did not rate their maths abilities differently to anyone else with a training need. People in the 20-24 age range were the most likely out of everyone with a training need to have accessed a maths course.
Over a third (34 per cent) of people in work who had not been on a maths course despite their need for training had no intention of undertaking job-related learning in the next two to three years.
Skills were weakest amongst current learners, but broadly similar between learners who had trained in the last three years or further in the past. Respondents who trained more than three years ago were the most self-assured about their skills.
Chapter 10: Training in basic skills
207
ICT training
More than half of respondents (54 per cent) received training in computer skills outside of school, mostly in an academic setting, work, or an adult education centre. The incidence of training was higher than average amongst women and under-25s, and low amongst those who finished their education before they were 17.
On average, three quarters (74 per cent) of the respondents who scored or were assigned Entry Level 2 or below in all the practical components of the ICT assessment – and could therefore be described as having a training need – did not access any ICT courses. This group had lower confidence than other people with a training need.
Compared with the overall population, people with ICT training had a higher likelihood of reaching or surpassing Level 2 in all four components of the assessment. Respondents who attended a computer course were more confident in their skills than people who had never undertaken an ICT course. Current learners were just as likely as past learners to score highly in the various components of the test, suggesting that ICT skills tend to be picked up quite rapidly. There was no evidence of a loss of confidence in ICT skills after learners completed their course.
10.2 Introduction
This chapter defines the population who reported receiving training in basic literacy, numeracy or ICT, and examines their confidence and basic skills at the time of the Skills for Life 2011 Survey (SfL2011). It describes the characteristics of people who are currently receiving or have previously undertaken training, and identifies whether training courses are being accessed by those who need them the most.
The data presented in this chapter is derived from questions teng through to tminc, and titcour through to titwhe in the Background Questionnaire, which can be found in Annex 3.
It should be noted that the data collected in 2011 does not permit any inferences to be drawn with regards to the impact of training. SfL2011 does not measure the skills of individuals immediately before and after they attended a course: hence, it is not possible to track the progress that learners may have made as a result of their training. Moreover, little is known about the nature of the training received: no record was made of the number of courses attended, their level, whether they were government-funded, attended on a mandatory or voluntary basis, or whether the training took place in the UK. It is also not possible to tell whether respondents completed the training they reported receiving.
An important point to bear in mind throughout this chapter is that the receipt of basic skills training was, in itself, not significant in predicting skills standards once other more general factors – such as first language, educational achievement, or economic activity – were accounted for (see Chapter 6). That is not to say that attending a course made no difference to learners’ skills: indeed, the fact that learners performed no worse than anyone else in the same
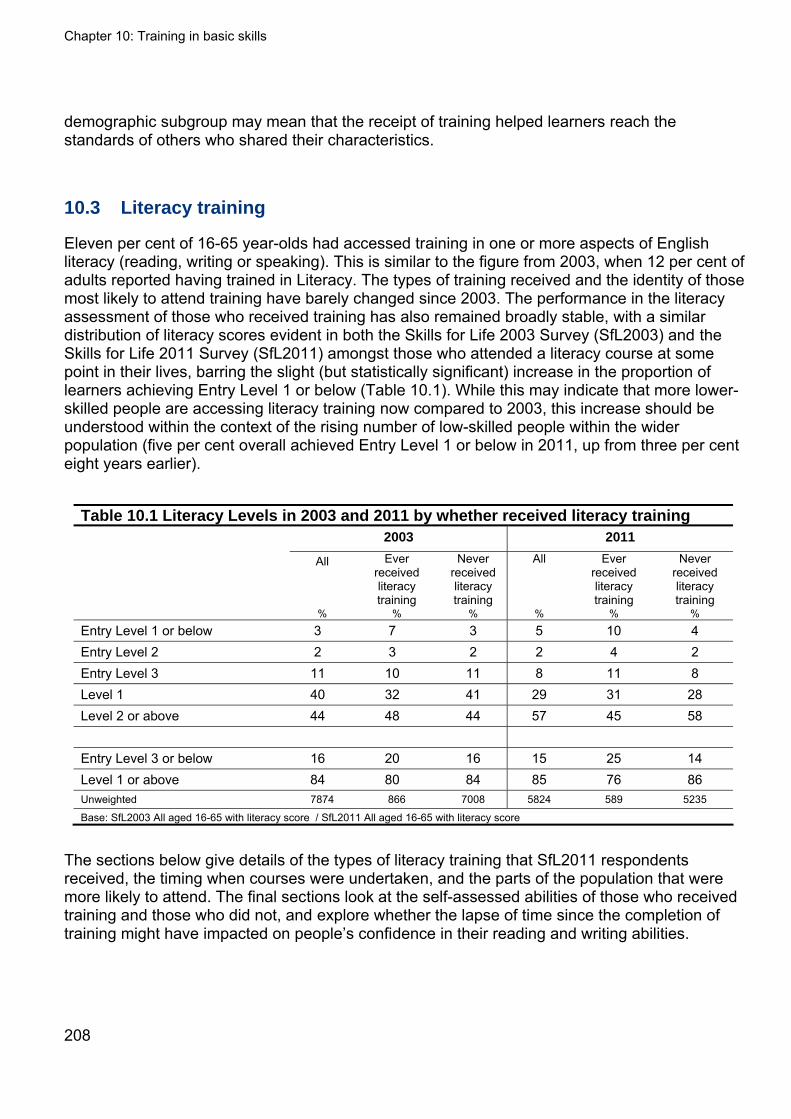
Chapter 10: Training in basic skills
208
demographic subgroup may mean that the receipt of training helped learners reach the standards of others who shared their characteristics.
10.3 Literacy training
Eleven per cent of 16-65 year-olds had accessed training in one or more aspects of English literacy (reading, writing or speaking). This is similar to the figure from 2003, when 12 per cent of adults reported having trained in Literacy. The types of training received and the identity of those most likely to attend training have barely changed since 2003. The performance in the literacy assessment of those who received training has also remained broadly stable, with a similar distribution of literacy scores evident in both the Skills for Life 2003 Survey (SfL2003) and the Skills for Life 2011 Survey (SfL2011) amongst those who attended a literacy course at some point in their lives, barring the slight (but statistically significant) increase in the proportion of learners achieving Entry Level 1 or below (Table 10.1). While this may indicate that more lower-skilled people are accessing literacy training now compared to 2003, this increase should be understood within the context of the rising number of low-skilled people within the wider population (five per cent overall achieved Entry Level 1 or below in 2011, up from three per cent eight years earlier).
Table 10.1 Literacy Levels in 2003 and 2011 by whether received literacy training 2003 2011
All Ever received literacy training
Never received literacy training
All
Ever received literacy training
Never received literacy training
% % % % % %
Entry Level 1 or below 3 7 3 5 10 4 Entry Level 2 2 3 2 2 4 2 Entry Level 3 11 10 11 8 11 8 Level 1 40 32 41 29 31 28 Level 2 or above 44 48 44 57 45 58 Entry Level 3 or below 16 20 16 15 25 14 Level 1 or above 84 80 84 85 76 86 Unweighted 7874 866 7008 5824 589 5235
Base: SfL2003 All aged 16-65 with literacy score / SfL2011 All aged 16-65 with literacy score
The sections below give details of the types of literacy training that SfL2011 respondents received, the timing when courses were undertaken, and the parts of the population that were more likely to attend. The final sections look at the self-assessed abilities of those who received training and those who did not, and explore whether the lapse of time since the completion of training might have impacted on people’s confidence in their reading and writing abilities.
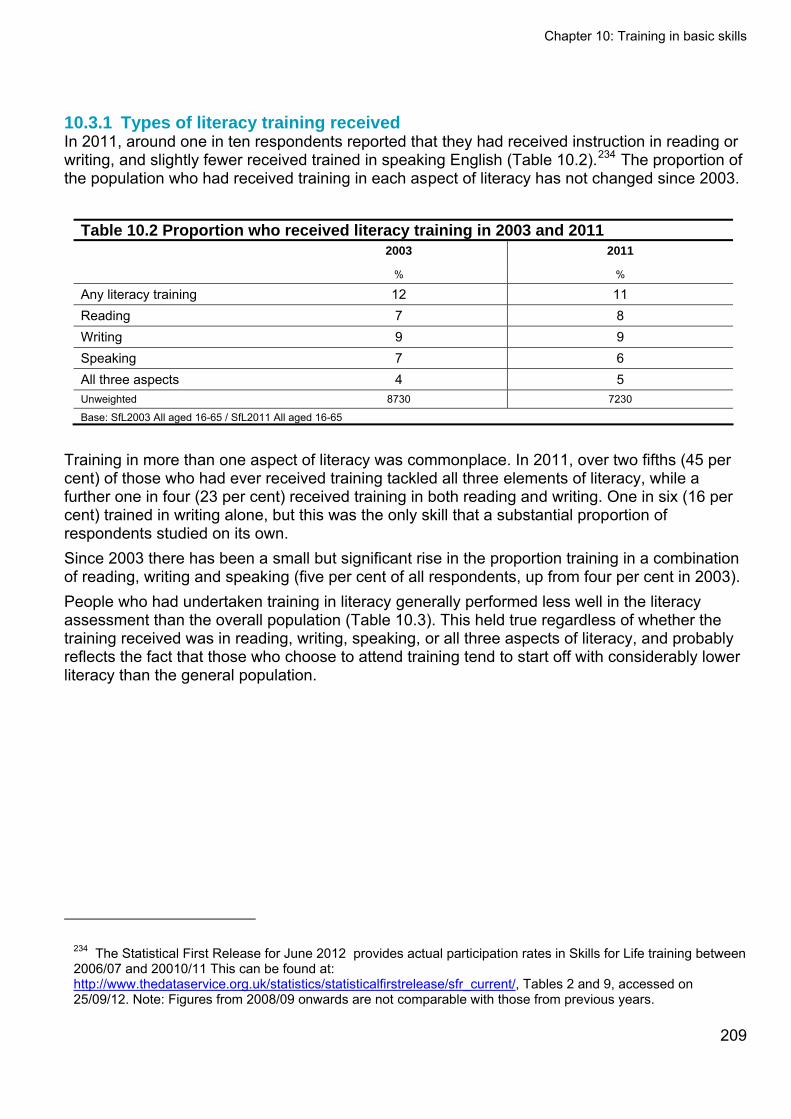
Chapter 10: Training in basic skills
209
10.3.1 Types of literacy training received In 2011, around one in ten respondents reported that they had received instruction in reading or writing, and slightly fewer received trained in speaking English (Table 10.2).234 The proportion of the population who had received training in each aspect of literacy has not changed since 2003.
Table 10.2 Proportion who received literacy training in 2003 and 2011 2003 2011
% %
Any literacy training 12 11 Reading 7 8 Writing 9 9 Speaking 7 6 All three aspects 4 5 Unweighted 8730 7230
Base: SfL2003 All aged 16-65 / SfL2011 All aged 16-65
Training in more than one aspect of literacy was commonplace. In 2011, over two fifths (45 per cent) of those who had ever received training tackled all three elements of literacy, while a further one in four (23 per cent) received training in both reading and writing. One in six (16 per cent) trained in writing alone, but this was the only skill that a substantial proportion of respondents studied on its own. Since 2003 there has been a small but significant rise in the proportion training in a combination of reading, writing and speaking (five per cent of all respondents, up from four per cent in 2003). People who had undertaken training in literacy generally performed less well in the literacy assessment than the overall population (Table 10.3). This held true regardless of whether the training received was in reading, writing, speaking, or all three aspects of literacy, and probably reflects the fact that those who choose to attend training tend to start off with considerably lower literacy than the general population.
234 The Statistical First Release for June 2012 provides actual participation rates in Skills for Life training between 2006/07 and 20010/11 This can be found at: http://www.thedataservice.org.uk/statistics/statisticalfirstrelease/sfr_current/, Tables 2 and 9, accessed on 25/09/12. Note: Figures from 2008/09 onwards are not comparable with those from previous years.

Chapter 10: Training in basic skills
Table 10.3 Literacy Levels by types of literacy training received TYPE OF LITERACY TRAINING RECEIVED
All All aspects Reading Writing Speaking
ANY LITERACY TRAINING
NO LITERACY TRAINING
% % % % % % %
Entry Level 1 or below 5 16 12 11 14 10 4 Entry Level 2 2 4 5 4 4 4 2 Entry Level 3 8 14 13 11 12 11 8 Level 1 29 27 30 30 27 31 28 Level 2 or above 57 40 40 45 43 45 58 Entry Level 3 or below 15 34 30 26 30 25 14 Level 1 or above 85 67 70 75 71 76 86 Unweighted 5824 250 420 512 315 589 5235
Base: SfL2011 All aged 16-65 with literacy score
10.3.2 Timing of literacy training One per cent of those interviewed were receiving training in English literacy around the time of the interview. Three per cent were recent learners who had received training within the last three years but were no longer doing so, while seven per cent had started their course(s) more than three years ago. Current learners tended not to train in one skill alone: the majority (59 per cent) were receiving training in all three aspects of literacy (reading, writing and speaking). Amongst current learners, training in multiple literacy skills was frequently undertaken as part of a single course: this was the case for three quarters (73 per cent) of those training to improve more than one aspect of their literacy. Combination courses were similarly the most common choice amongst past learners who were trying to improve more than one literacy skill (82 per cent) Despite the tendency to address multiple skills, there was a greater focus on the improvement of writing skills amongst both current and past learners (Figure 10.1).
210
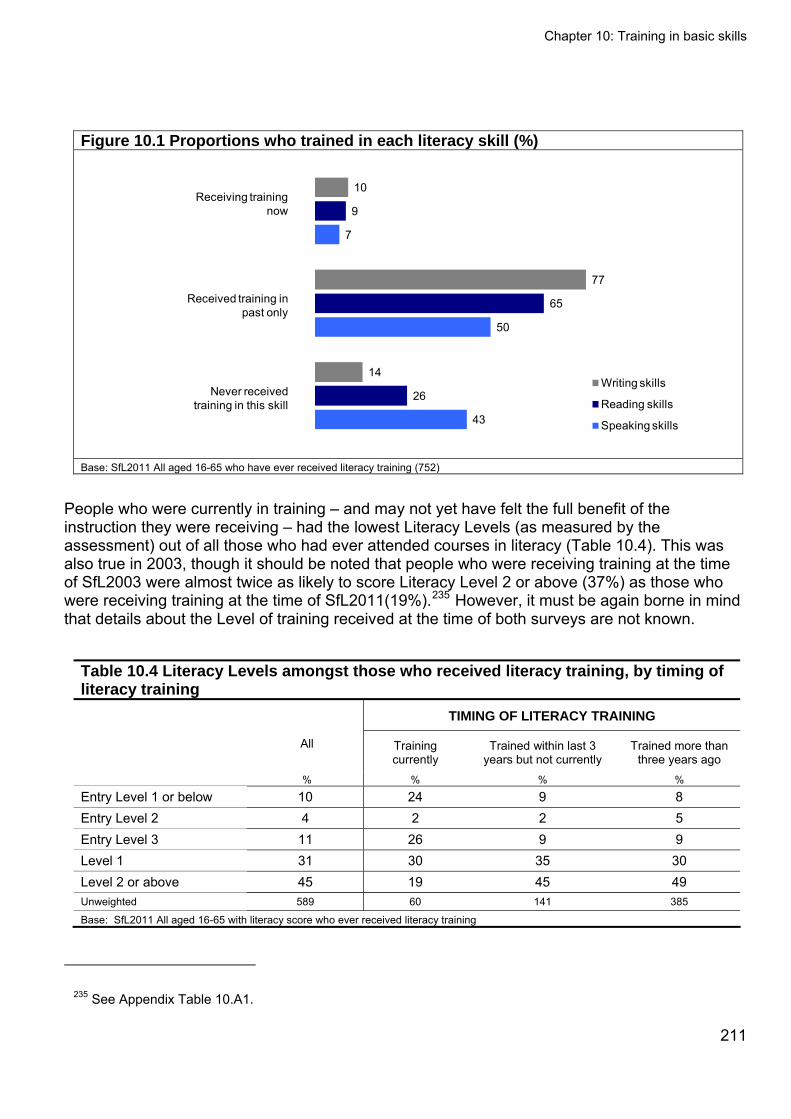
Chapter 10: Training in basic skills
Figure 10.1 Proportions who trained in each literacy skill (%)
43
50
7
26
65
9
14
77
10
Writing skills
Reading skills
Speaking skills
Receiving training now
Received training in past only
Never received training in this skill
Base: SfL2011 All aged 16-65 who have ever received literacy training (752)
People who were currently in training – and may not yet have felt the full benefit of the instruction they were receiving – had the lowest Literacy Levels (as measured by the assessment) out of all those who had ever attended courses in literacy (Table 10.4). This was also true in 2003, though it should be noted that people who were receiving training at the time of SfL2003 were almost twice as likely to score Literacy Level 2 or above (37%) as those who were receiving training at the time of SfL2011(19%).235 However, it must be again borne in mind that details about the Level of training received at the time of both surveys are not known.
Table 10.4 Literacy Levels amongst those who received literacy training, by timing of literacy training
TIMING OF LITERACY TRAINING
All Training currently
Trained within last 3 years but not currently
Trained more than three years ago
% % % %
Entry Level 1 or below 10 24 9 8 Entry Level 2 4 2 2 5 Entry Level 3 11 26 9 9 Level 1 31 30 35 30 Level 2 or above 45 19 45 49 Unweighted 589 60 141 385
Base: SfL2011 All aged 16-65 with literacy score who ever received literacy training
235 See Appendix Table 10.A1.
211
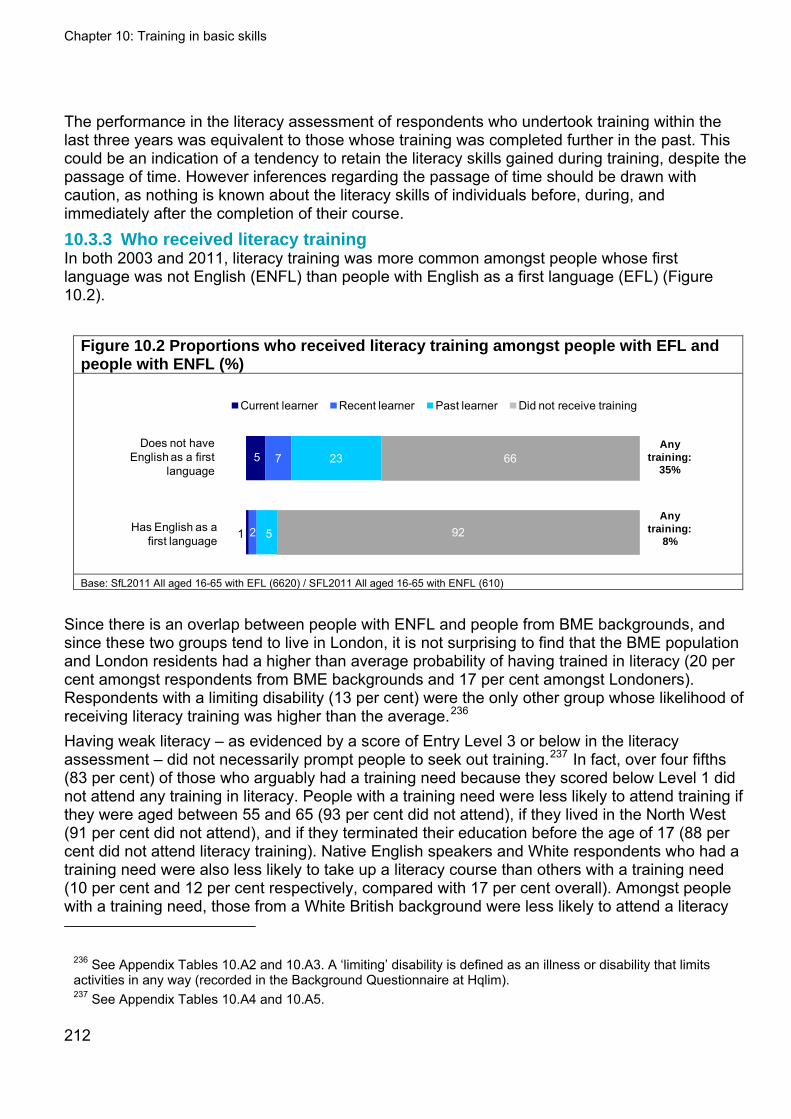
Chapter 10: Training in basic skills
The performance in the literacy assessment of respondents who undertook training within the last three years was equivalent to those whose training was completed further in the past. This could be an indication of a tendency to retain the literacy skills gained during training, despite the passage of time. However inferences regarding the passage of time should be drawn with caution, as nothing is known about the literacy skills of individuals before, during, and immediately after the completion of their course. 10.3.3 Who received literacy training In both 2003 and 2011, literacy training was more common amongst people whose first language was not English (ENFL) than people with English as a first language (EFL) (Figure 10.2).
Figure 10.2 Proportions who received literacy training amongst people with EFL and people with ENFL (%)
5
1
7
2
23
5
66
92
Current learner Recent learner Past learner Did not receive training
Any training:
8%
Any training:
35%
Has English as a first language
Does not have English as a first
language
Base: SfL2011 All aged 16-65 with EFL (6620) / SFL2011 All aged 16-65 with ENFL (610)
Since there is an overlap between people with ENFL and people from BME backgrounds, and since these two groups tend to live in London, it is not surprising to find that the BME population and London residents had a higher than average probability of having trained in literacy (20 per cent amongst respondents from BME backgrounds and 17 per cent amongst Londoners). Respondents with a limiting disability (13 per cent) were the only other group whose likelihood of receiving literacy training was higher than the average.236 Having weak literacy – as evidenced by a score of Entry Level 3 or below in the literacy assessment – did not necessarily prompt people to seek out training.237 In fact, over four fifths (83 per cent) of those who arguably had a training need because they scored below Level 1 did not attend any training in literacy. People with a training need were less likely to attend training if they were aged between 55 and 65 (93 per cent did not attend), if they lived in the North West (91 per cent did not attend), and if they terminated their education before the age of 17 (88 per cent did not attend literacy training). Native English speakers and White respondents who had a training need were also less likely to take up a literacy course than others with a training need (10 per cent and 12 per cent respectively, compared with 17 per cent overall). Amongst people with a training need, those from a White British background were less likely to attend a literacy
236 See Appendix Tables 10.A2 and 10.A3. A ‘limiting’ disability is defined as an illness or disability that limits activities in any way (recorded in the Background Questionnaire at Hqlim). 237 See Appendix Tables 10.A4 and 10.A5.
212
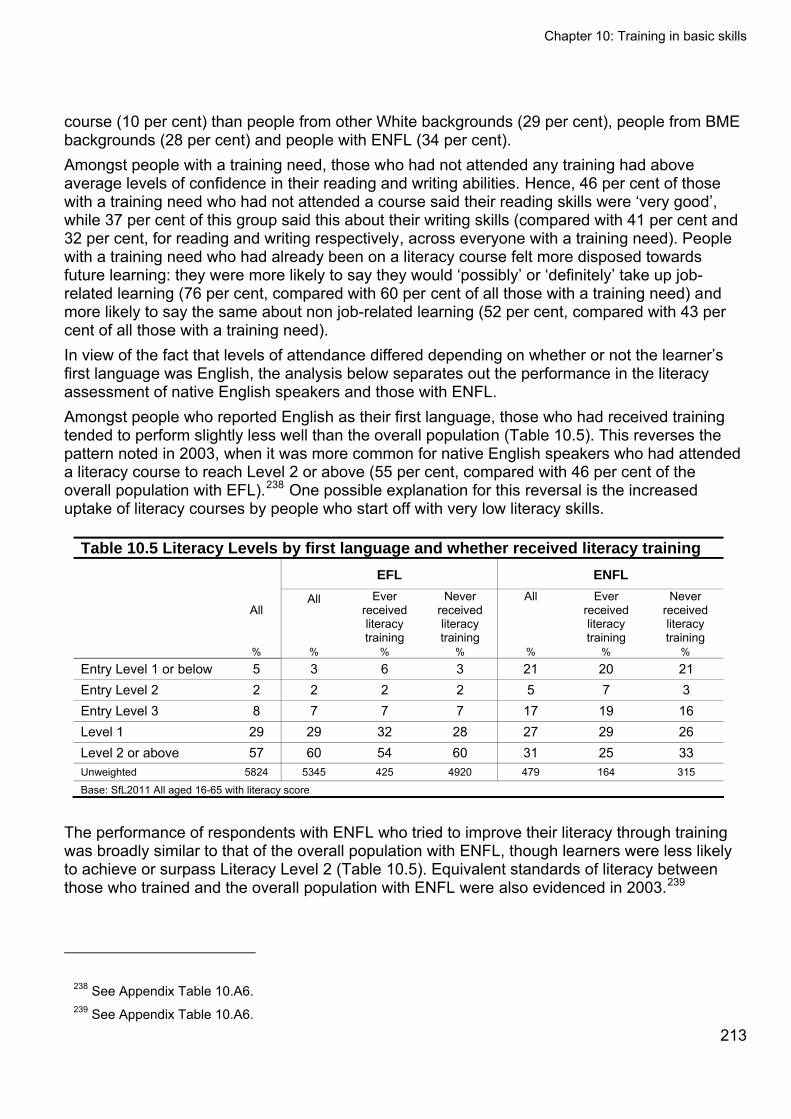
Chapter 10: Training in basic skills
213
course (10 per cent) than people from other White backgrounds (29 per cent), people from BME backgrounds (28 per cent) and people with ENFL (34 per cent). Amongst people with a training need, those who had not attended any training had above average levels of confidence in their reading and writing abilities. Hence, 46 per cent of those with a training need who had not attended a course said their reading skills were ‘very good’, while 37 per cent of this group said this about their writing skills (compared with 41 per cent and 32 per cent, for reading and writing respectively, across everyone with a training need). People with a training need who had already been on a literacy course felt more disposed towards future learning: they were more likely to say they would ‘possibly’ or ‘definitely’ take up job-related learning (76 per cent, compared with 60 per cent of all those with a training need) and more likely to say the same about non job-related learning (52 per cent, compared with 43 per cent of all those with a training need). In view of the fact that levels of attendance differed depending on whether or not the learner’s first language was English, the analysis below separates out the performance in the literacy assessment of native English speakers and those with ENFL. Amongst people who reported English as their first language, those who had received training tended to perform slightly less well than the overall population (Table 10.5). This reverses the pattern noted in 2003, when it was more common for native English speakers who had attended a literacy course to reach Level 2 or above (55 per cent, compared with 46 per cent of the overall population with EFL).238 One possible explanation for this reversal is the increased uptake of literacy courses by people who start off with very low literacy skills.
Table 10.5 Literacy Levels by first language and whether received literacy training EFL ENFL
All
All Ever received literacy training
Never received literacy training
All Ever received literacy training
Never received literacy training
% % % % % % %
Entry Level 1 or below 5 3 6 3 21 20 21 Entry Level 2 2 2 2 2 5 7 3 Entry Level 3 8 7 7 7 17 19 16 Level 1 29 29 32 28 27 29 26 Level 2 or above 57 60 54 60 31 25 33 Unweighted 5824 5345 425 4920 479 164 315
Base: SfL2011 All aged 16-65 with literacy score
The performance of respondents with ENFL who tried to improve their literacy through training was broadly similar to that of the overall population with ENFL, though learners were less likely to achieve or surpass Literacy Level 2 (Table 10.5). Equivalent standards of literacy between those who trained and the overall population with ENFL were also evidenced in 2003.239
238 See Appendix Table 10.A6. 239 See Appendix Table 10.A6.

Chapter 10: Training in basic skills
10.3.4 Self-assessed abilities and the need for literacy training Respondents who had never undertaken literacy training were more likely than those who had taken a course to rate their reading and writing skills as 'very good' (Figure 10.3). This was equally true amongst people with English as a first language and those whose first language was not English, and reflects the findings from 2003.240
Figure 10.3 Self-assessed reading and writing skills by whether received literacy training (%)
67
44
76
51
26
38
20
32
5
13
3
14
3
6
1
3
Very good Fairly good Below average Poor Cannot
Reading ability
Writing ability
Attended reading course
Did not attend reading course
Attended writing course
Did not attend writing course
Poor or Cannot read/write
Base: SfL2011 All aged 16-65 who received training in reading (537) / who did not receive training in reading (6693) / who received training in writing (645) / who did not receive training in writing (6585)
A mere three per cent of respondents with EFL rated their reading and writing skills negatively, saying they were 'below average', 'poor' or that they could not read or write.241 Respondents with EFL who had attended a course at some point in their lives had a higher than average likelihood of giving their skills a negative rating.242 Moreover, the likelihood of a negative rating differed amongst EFL who had experienced training depending on when their most recent course was completed, with current learners having the lowest opinion of their skills.243 The fact that current learners with EFL were more likely than those who had never attended training to give a negative assessment of their skills (20 per cent versus three per cent for reading; 22 per cent versus six per cent for writing) indicates that people with EFL only seek out literacy training if they feel their skills need improvement. The self-confidence of those who did not feel the need for improvement was partly justified, as they generally performed better in the
240 See Appendix Tables 10.A7 and 10.A8 for a comparison between 2003 and 2011. Appendix Tables 10.A9 and 10.A10 break this data down further by first language. 241 See Appendix Table 8.A3. 242 See Appendix Tables 10.A9 and 10.A10. 243 See Appendix Tables 10.A11 and 10.A12.
214
Chapter 10: Training in basic skills
215
literacy test than those who attended a course (see Table 10.5 above). However, some cases of self-confidence were clearly misconceived: ten per cent of people with EFL who gave themselves a positive rating for both reading and writing arguably had a training need (evidenced by a score of Entry Level 3 or below). As pointed out in Section 10.3.3, nine in ten respondents with EFL who had a training need failed to seek out training. A negative self-assessment was more than four times as common amongst people with ENFL (14 per cent) as amongst native English speakers (three per cent).244 Respondents who had never attended any literacy training were the most likely out of all those with ENFL to describe their skills as 'very good' (53 per cent for reading; 45 per cent for writing);245 they also had the most confidence in their spoken English (42 per cent rated their speaking as 'very good', compared with 37 per cent of all respondents with ENFL).246 It is therefore likely that the majority of those with ENFL who chose not to undertake training based their decision on the belief that they had no need to improve their literacy. Amongst respondents with ENFL who did not attend training, three per cent said they could not read English at all.247 While this indicates the existence in 2011 of a minority who do not engage in basic learning despite the severity of their need, the proportion is substantially lower than in 2003 (eight per cent). This may be due to a higher take-up of literacy courses in recent years by those who need them.248 Over the last eight years, the confidence levels of learners with ENFL have remained stable, whilst those of learners with EFL have fallen.249 In 2011, three fifths (59 per cent) of the population with EFL who received training in reading judged their reading abilities to be ‘very good’, down from 69 per cent in 2003. Similarly, the proportion of people with EFL who had trained in writing and gave themselves a ‘very good’ rating for their writing ability decreased (from 60 per cent in 2003 to 51 per cent in 2011).
During the period that saw the self-assurance of learners with EFL fall, the self-assurance of people with EFL who did not have any experience of training rose. This rise was in line with the rise in confidence evidenced in the broader population (see Section 8.3).
244 See Appendix Table 8.A3. 245 See Appendix Tables 10.A9 and 10.A10. 246 See Appendix Table 10.A13. 247 Respondents who could not read English were able to participate in SfL2011. Interviewers read out questions from the background questionnaire to respondents who declared that they were unable to read in English, and this group was not routed to the literacy assessment but was automatically assigned Literacy Entry Level 1. 248According to the FE and Skills Statistical First Release (June 2012), participating in Skills for Life training by people with very low skills (Entry Level Literacy) appeared to decline between 2006/07 and 2009/10, but rose in 2010/11 (though it should be noted that the trend is indicative only, as figures before and after 2008/09 are not directly comparable). See Table 9, on,http://www.thedataservice.org.uk/statistics/statisticalfirstrelease/sfr_current/, accessed on 25/09/12. 249 See Appendix Tables 10.A9 and 10.A10.
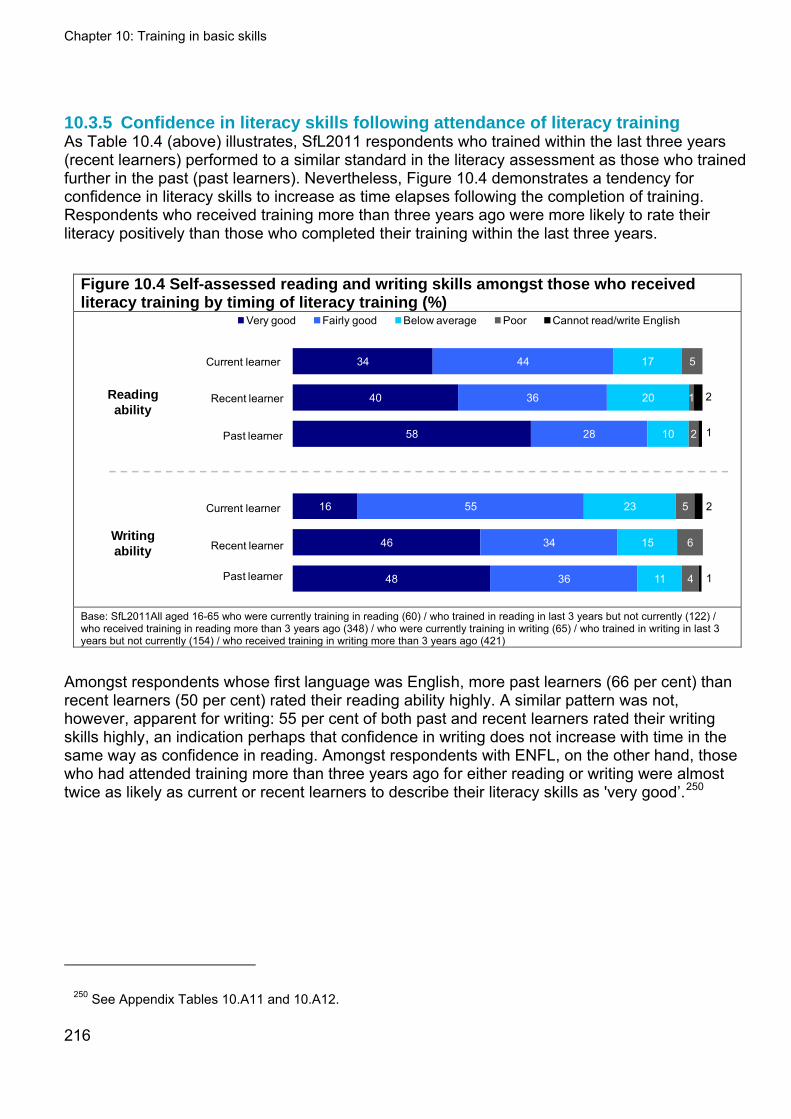
Chapter 10: Training in basic skills
10.3.5 Confidence in literacy skills following attendance of literacy training As Table 10.4 (above) illustrates, SfL2011 respondents who trained within the last three years (recent learners) performed to a similar standard in the literacy assessment as those who trained further in the past (past learners). Nevertheless, Figure 10.4 demonstrates a tendency for confidence in literacy skills to increase as time elapses following the completion of training. Respondents who received training more than three years ago were more likely to rate their literacy positively than those who completed their training within the last three years.
Figure 10.4 Self-assessed reading and writing skills amongst those who received literacy training by timing of literacy training (%)
34
40
58
16
46
48
44
36
28
55
34
36
17
20
10
23
15
11
5
1
2
5
6
4
2
1
2
1
Very good Fairly good Below average Poor Cannot read/write English
Writing ability
Reading ability
Current learner
Recent learner
Past learner
Current learner
Recent learner
Past learner
Base: SfL2011All aged 16-65 who were currently training in reading (60) / who trained in reading in last 3 years but not currently (122) / who received training in reading more than 3 years ago (348) / who were currently training in writing (65) / who trained in writing in last 3 years but not currently (154) / who received training in writing more than 3 years ago (421)
Amongst respondents whose first language was English, more past learners (66 per cent) than recent learners (50 per cent) rated their reading ability highly. A similar pattern was not, however, apparent for writing: 55 per cent of both past and recent learners rated their writing skills highly, an indication perhaps that confidence in writing does not increase with time in the same way as confidence in reading. Amongst respondents with ENFL, on the other hand, those who had attended training more than three years ago for either reading or writing were almost twice as likely as current or recent learners to describe their literacy skills as 'very good’.250
250 See Appendix Tables 10.A11 and 10.A12.
216
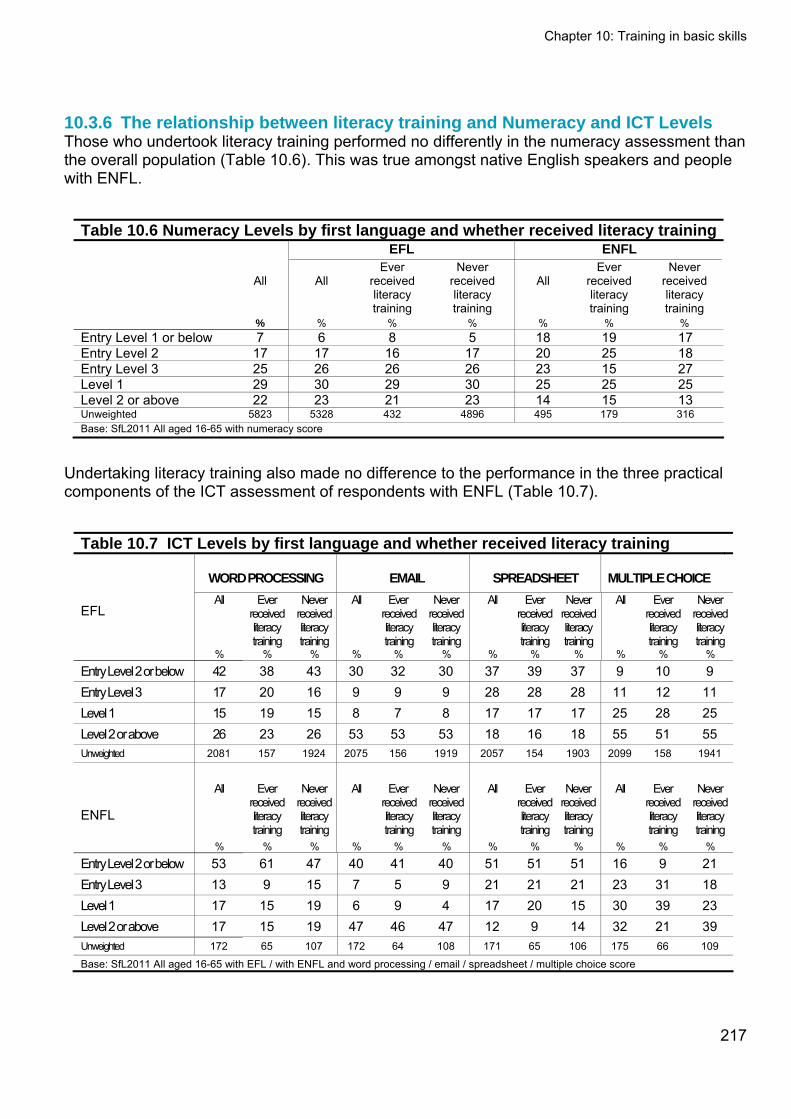
Chapter 10: Training in basic skills
217
10.3.6 The relationship between literacy training and Numeracy and ICT Levels Those who undertook literacy training performed no differently in the numeracy assessment than the overall population (Table 10.6). This was true amongst native English speakers and people with ENFL.
Table 10.6 Numeracy Levels by first language and whether received literacy training EFL ENFL
All
All
Ever received literacy training
Never received literacy training
All
Ever received literacy training
Never received literacy training
% % % % % % % Entry Level 1 or below 7 6 8 5 18 19 17 Entry Level 2 17 17 16 17 20 25 18 Entry Level 3 25 26 26 26 23 15 27 Level 1 29 30 29 30 25 25 25 Level 2 or above 22 23 21 23 14 15 13 Unweighted 5823 5328 432 4896 495 179 316 Base: SfL2011 All aged 16-65 with numeracy score
Undertaking literacy training also made no difference to the performance in the three practical components of the ICT assessment of respondents with ENFL (Table 10.7).
Table 10.7 ICT Levels by first language and whether received literacy training
WORD PROCESSING EMAIL SPREADSHEET MULTIPLE CHOICE
EFL All Ever
received literacy training
Never received literacy training
All Ever received literacy training
Never received literacy training
All Ever received literacy training
Never received literacy training
All Ever received literacy training
Never received literacy training
% % % % % % % % % % % %
Entry Level 2 or below 42 38 43 30 32 30 37 39 37 9 10 9 Entry Level 3 17 20 16 9 9 9 28 28 28 11 12 11 Level 1 15 19 15 8 7 8 17 17 17 25 28 25 Level 2 or above 26 23 26 53 53 53 18 16 18 55 51 55 Unweighted 2081 157 1924 2075 156 1919 2057 154 1903 2099 158 1941
ENFL
All Ever received literacy training
Never received literacy training
All Ever received literacy training
Never received literacy training
All Ever received literacy training
Never received literacy training
All Ever received literacy training
Never received literacy training
% % % % % % % % % % % %
Entry Level 2 or below 53 61 47 40 41 40 51 51 51 16 9 21 Entry Level 3 13 9 15 7 5 9 21 21 21 23 31 18 Level 1 17 15 19 6 9 4 17 20 15 30 39 23 Level 2 or above 17 15 19 47 46 47 12 9 14 32 21 39 Unweighted 172 65 107 172 64 108 171 65 106 175 66 109
Base: SfL2011 All aged 16-65 with EFL / with ENFL and word processing / email / spreadsheet / multiple choice score

Chapter 10: Training in basic skills
218
No significant differences were apparent in the distribution of scores for people with ENFL who trained in literacy and the overall population with ENFL (though it should be noted that base sizes are small). In the multiple choice component of the assessment, however, there was a notable difference between those who had attended a literacy course and the overall population: people who had received training were more likely to exceed Entry Level 2, perhaps because the training helped respondents understand the multiple-choice questions, which were written in English.
10.4 Numeracy training
Numeracy training was slightly less common that literacy training in 2011. Overall, eight per cent of 16-65 year-olds received training in basic maths or number skills at some point in their lives outside of school (compared with 11 per cent who received literacy training). The proportion is unchanged since 2003. One notable change that has taken place in the intervening period is the decline in numeracy skills amongst those who received training, with the proportion achieving Entry Level 3 or above falling from 81 per cent in 2003 to 72 per cent in 2011 (Table 10.8). Such comparisons should be treated with caution, however, as there are significant differences in the demographic profile of SfL2003 and SfL2011 learners.
Table 10.8 Numeracy Levels in 2003 and 2011 by whether received numeracy training 2003 2011
All Ever received
numeracy training
Never received
numeracy training
All Ever received
numeracy training
Never received
numeracy training
% % % % % %
Entry Level 1 or below 6 5 6 7 6 7 Entry Level 2 16 15 16 17 22 17 Entry Level 3 26 24 26 25 30 25 Level 1 28 30 28 29 24 29 Level 2 or above 26 27 25 22 18 22
Entry Level 2 or below 21 20 22 24 28 23 Entry Level 3 or above 79 81 79 76 72 77 Unweighted 8040 666 7355 5823 486 5337
Base: SfL2003 All aged 16-65 with numeracy score / SFL2011 All aged 16-65 with numeracy score
In order to explore this decline, the analysis below begins by discussing when training was undertaken and outlining the performance in the numeracy assessment of current and past learners. It then identifies which groups had a greater than average tendency of attending a numeracy course in 2011 (compared to 2003) and the performance of various groups, and discusses the self-assessed abilities of people who chose to take a course. 10.4.1 Timing of numeracy training Less than one per cent of 16-65 year-olds were currently receiving training in basic maths or number skills. Two per cent had trained within the last three years but were no longer in training, and a further five per cent had received training more than three years ago.
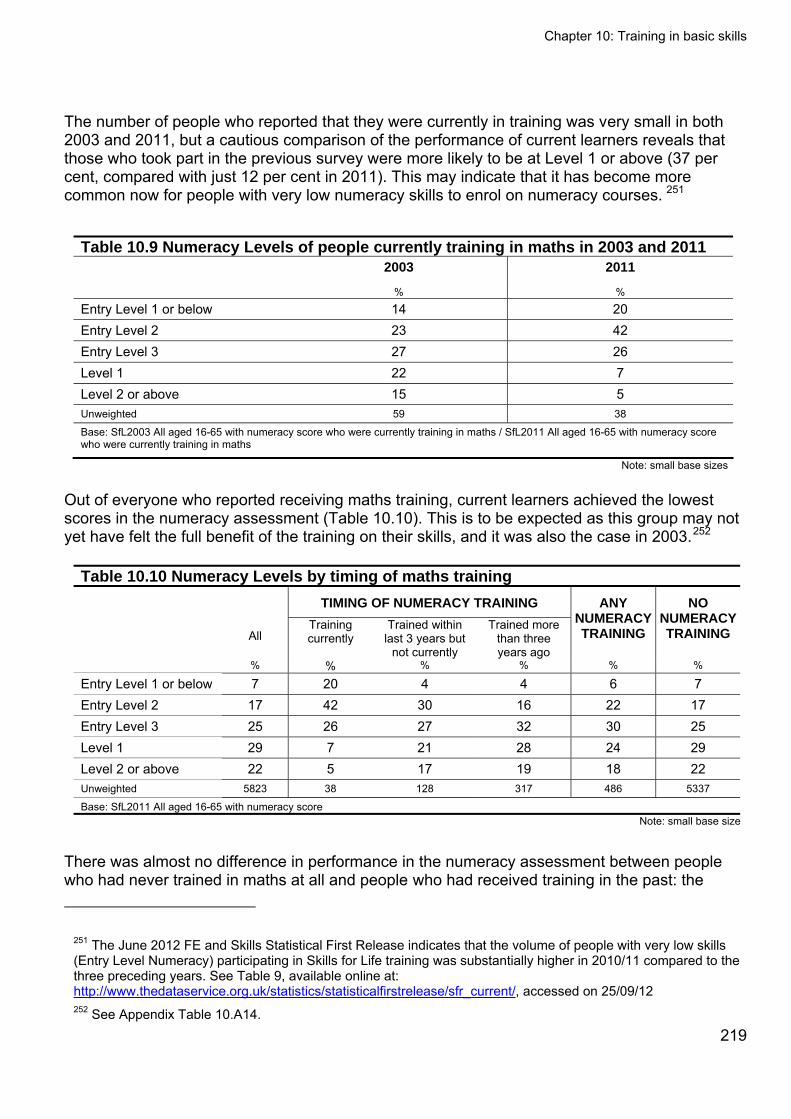
Chapter 10: Training in basic skills
The number of people who reported that they were currently in training was very small in both 2003 and 2011, but a cautious comparison of the performance of current learners reveals that those who took part in the previous survey were more likely to be at Level 1 or above (37 per cent, compared with just 12 per cent in 2011). This may indicate that it has become more common now for people with very low numeracy skills to enrol on numeracy courses. 251
Table 10.9 Numeracy Levels of people currently training in maths in 2003 and 2011 2003 2011
% %
Entry Level 1 or below 14 20 Entry Level 2 23 42 Entry Level 3 27 26 Level 1 22 7 Level 2 or above 15 5 Unweighted 59 38
Base: SfL2003 All aged 16-65 with numeracy score who were currently training in maths / SfL2011 All aged 16-65 with numeracy score who were currently training in maths
Note: small base sizes
Out of everyone who reported receiving maths training, current learners achieved the lowest scores in the numeracy assessment (Table 10.10). This is to be expected as this group may not yet have felt the full benefit of the training on their skills, and it was also the case in 2003.252
Table 10.10 Numeracy Levels by timing of maths training
TIMING OF NUMERACY TRAINING
All Training currently
Trained within last 3 years but
not currently
Trained more than three years ago
ANY NUMERACY TRAINING
NO NUMERACY TRAINING
% % % % % %
Entry Level 1 or below 7 20 4 4 6 7 Entry Level 2 17 42 30 16 22 17 Entry Level 3 25 26 27 32 30 25 Level 1 29 7 21 28 24 29 Level 2 or above 22 5 17 19 18 22 Unweighted 5823 38 128 317 486 5337
Base: SfL2011 All aged 16-65 with numeracy score Note: small base size
There was almost no difference in performance in the numeracy assessment between people who had never trained in maths at all and people who had received training in the past: the
251 The June 2012 FE and Skills Statistical First Release indicates that the volume of people with very low skills (Entry Level Numeracy) participating in Skills for Life training was substantially higher in 2010/11 compared to the three preceding years. See Table 9, available online at: http://www.thedataservice.org.uk/statistics/statisticalfirstrelease/sfr_current/, accessed on 25/09/12 252 See Appendix Table 10.A14.
219
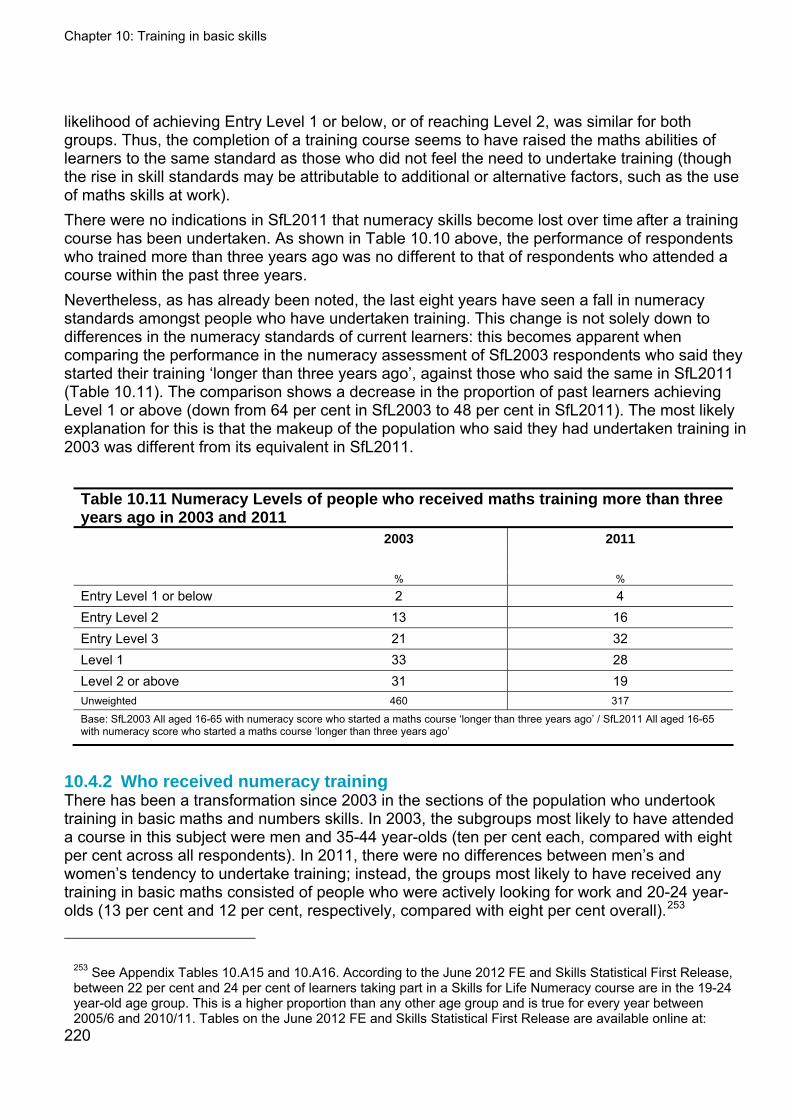
Chapter 10: Training in basic skills
220
likelihood of achieving Entry Level 1 or below, or of reaching Level 2, was similar for both groups. Thus, the completion of a training course seems to have raised the maths abilities of learners to the same standard as those who did not feel the need to undertake training (though the rise in skill standards may be attributable to additional or alternative factors, such as the use of maths skills at work). There were no indications in SfL2011 that numeracy skills become lost over time after a training course has been undertaken. As shown in Table 10.10 above, the performance of respondents who trained more than three years ago was no different to that of respondents who attended a course within the past three years. Nevertheless, as has already been noted, the last eight years have seen a fall in numeracy standards amongst people who have undertaken training. This change is not solely down to differences in the numeracy standards of current learners: this becomes apparent when comparing the performance in the numeracy assessment of SfL2003 respondents who said they started their training ‘longer than three years ago’, against those who said the same in SfL2011 (Table 10.11). The comparison shows a decrease in the proportion of past learners achieving Level 1 or above (down from 64 per cent in SfL2003 to 48 per cent in SfL2011). The most likely explanation for this is that the makeup of the population who said they had undertaken training in 2003 was different from its equivalent in SfL2011.
Table 10.11 Numeracy Levels of people who received maths training more than three years ago in 2003 and 2011
2003 2011
% %
Entry Level 1 or below 2 4 Entry Level 2 13 16 Entry Level 3 21 32 Level 1 33 28 Level 2 or above 31 19 Unweighted 460 317
Base: SfL2003 All aged 16-65 with numeracy score who started a maths course ‘longer than three years ago’ / SfL2011 All aged 16-65 with numeracy score who started a maths course ‘longer than three years ago’
10.4.2 Who received numeracy training There has been a transformation since 2003 in the sections of the population who undertook training in basic maths and numbers skills. In 2003, the subgroups most likely to have attended a course in this subject were men and 35-44 year-olds (ten per cent each, compared with eight per cent across all respondents). In 2011, there were no differences between men’s and women’s tendency to undertake training; instead, the groups most likely to have received any training in basic maths consisted of people who were actively looking for work and 20-24 year-olds (13 per cent and 12 per cent, respectively, compared with eight per cent overall).253
253 See Appendix Tables 10.A15 and 10.A16. According to the June 2012 FE and Skills Statistical First Release, between 22 per cent and 24 per cent of learners taking part in a Skills for Life Numeracy course are in the 19-24 year-old age group. This is a higher proportion than any other age group and is true for every year between 2005/6 and 2010/11. Tables on the June 2012 FE and Skills Statistical First Release are available online at:
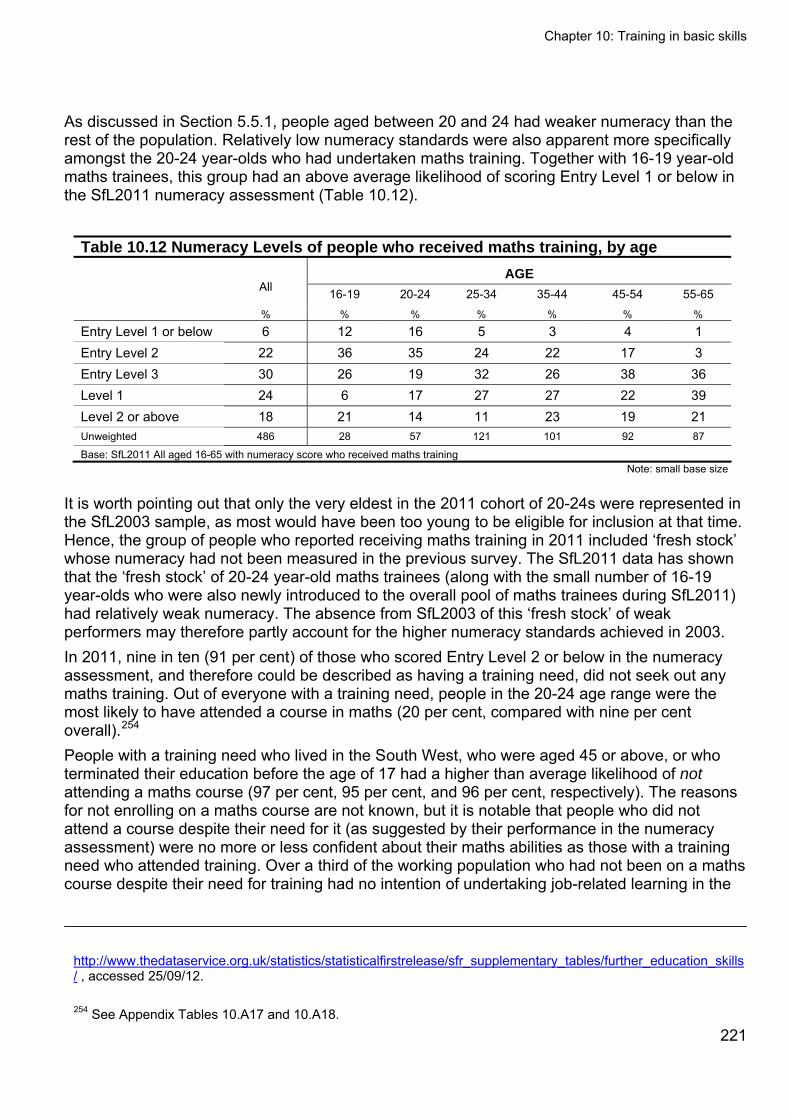
Chapter 10: Training in basic skills
221
As discussed in Section 5.5.1, people aged between 20 and 24 had weaker numeracy than the rest of the population. Relatively low numeracy standards were also apparent more specifically amongst the 20-24 year-olds who had undertaken maths training. Together with 16-19 year-old maths trainees, this group had an above average likelihood of scoring Entry Level 1 or below in the SfL2011 numeracy assessment (Table 10.12).
Table 10.12 Numeracy Levels of people who received maths training, by age
AGE All 16-19 20-24 25-34 35-44 45-54 55-65
% % % % % % %
Entry Level 1 or below 6 12 16 5 3 4 1 Entry Level 2 22 36 35 24 22 17 3 Entry Level 3 30 26 19 32 26 38 36 Level 1 24 6 17 27 27 22 39 Level 2 or above 18 21 14 11 23 19 21 Unweighted 486 28 57 121 101 92 87
Base: SfL2011 All aged 16-65 with numeracy score who received maths training Note: small base size
It is worth pointing out that only the very eldest in the 2011 cohort of 20-24s were represented in the SfL2003 sample, as most would have been too young to be eligible for inclusion at that time. Hence, the group of people who reported receiving maths training in 2011 included ‘fresh stock’ whose numeracy had not been measured in the previous survey. The SfL2011 data has shown that the ‘fresh stock’ of 20-24 year-old maths trainees (along with the small number of 16-19 year-olds who were also newly introduced to the overall pool of maths trainees during SfL2011) had relatively weak numeracy. The absence from SfL2003 of this ‘fresh stock’ of weak performers may therefore partly account for the higher numeracy standards achieved in 2003. In 2011, nine in ten (91 per cent) of those who scored Entry Level 2 or below in the numeracy assessment, and therefore could be described as having a training need, did not seek out any maths training. Out of everyone with a training need, people in the 20-24 age range were the most likely to have attended a course in maths (20 per cent, compared with nine per cent overall).254 People with a training need who lived in the South West, who were aged 45 or above, or who terminated their education before the age of 17 had a higher than average likelihood of not attending a maths course (97 per cent, 95 per cent, and 96 per cent, respectively). The reasons for not enrolling on a maths course are not known, but it is notable that people who did not attend a course despite their need for it (as suggested by their performance in the numeracy assessment) were no more or less confident about their maths abilities as those with a training need who attended training. Over a third of the working population who had not been on a maths course despite their need for training had no intention of undertaking job-related learning in the
http://www.thedataservice.org.uk/statistics/statisticalfirstrelease/sfr_supplementary_tables/further_education_skills/ , accessed 25/09/12.
254 See Appendix Tables 10.A17 and 10.A18.
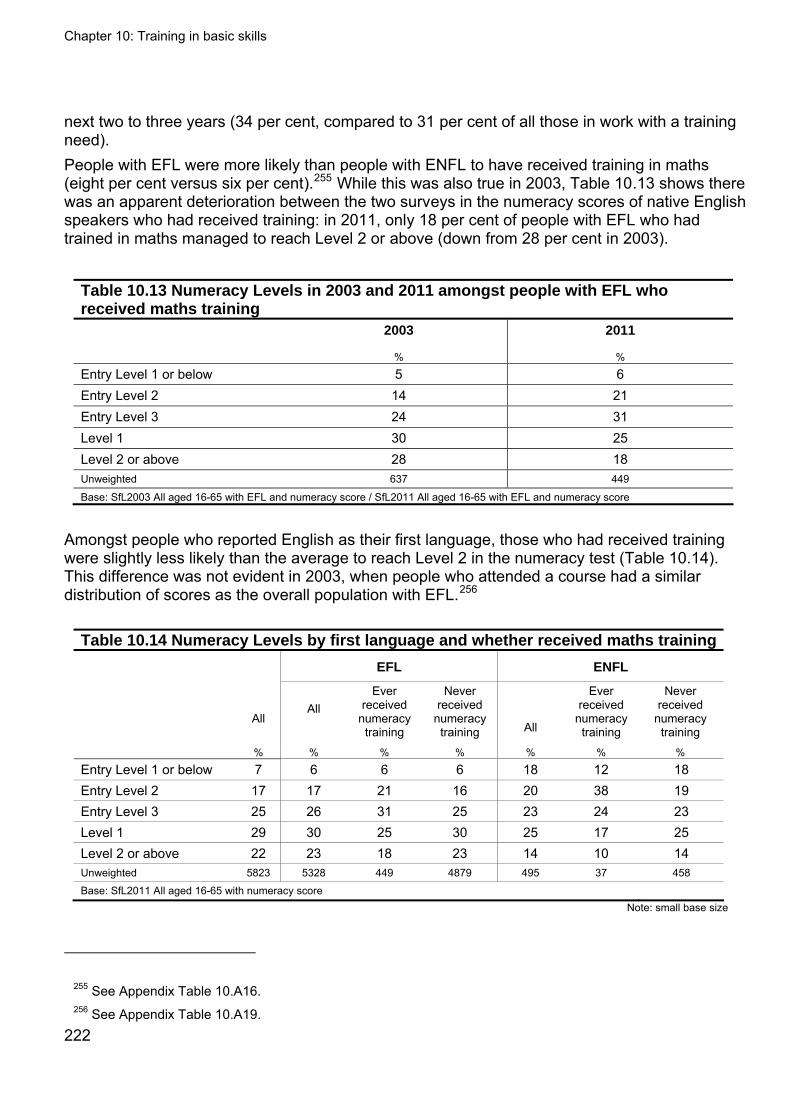
Chapter 10: Training in basic skills
222
next two to three years (34 per cent, compared to 31 per cent of all those in work with a training need). People with EFL were more likely than people with ENFL to have received training in maths (eight per cent versus six per cent).255 While this was also true in 2003, Table 10.13 shows there was an apparent deterioration between the two surveys in the numeracy scores of native English speakers who had received training: in 2011, only 18 per cent of people with EFL who had trained in maths managed to reach Level 2 or above (down from 28 per cent in 2003).
Table 10.13 Numeracy Levels in 2003 and 2011 amongst people with EFL who received maths training 2003 2011
% %
Entry Level 1 or below 5 6 Entry Level 2 14 21 Entry Level 3 24 31 Level 1 30 25 Level 2 or above 28 18 Unweighted 637 449
Base: SfL2003 All aged 16-65 with EFL and numeracy score / SfL2011 All aged 16-65 with EFL and numeracy score
Amongst people who reported English as their first language, those who had received training were slightly less likely than the average to reach Level 2 in the numeracy test (Table 10.14). This difference was not evident in 2003, when people who attended a course had a similar distribution of scores as the overall population with EFL.256
Table 10.14 Numeracy Levels by first language and whether received maths training EFL ENFL
All
All Ever
received numeracy training
Never received
numeracy training
All
Ever received
numeracy training
Never received
numeracy training
% % % % % % %
Entry Level 1 or below 7 6 6 6 18 12 18 Entry Level 2 17 17 21 16 20 38 19 Entry Level 3 25 26 31 25 23 24 23 Level 1 29 30 25 30 25 17 25 Level 2 or above 22 23 18 23 14 10 14 Unweighted 5823 5328 449 4879 495 37 458
Base: SfL2011 All aged 16-65 with numeracy score Note: small base size
255 See Appendix Table 10.A16. 256 See Appendix Table 10.A19.
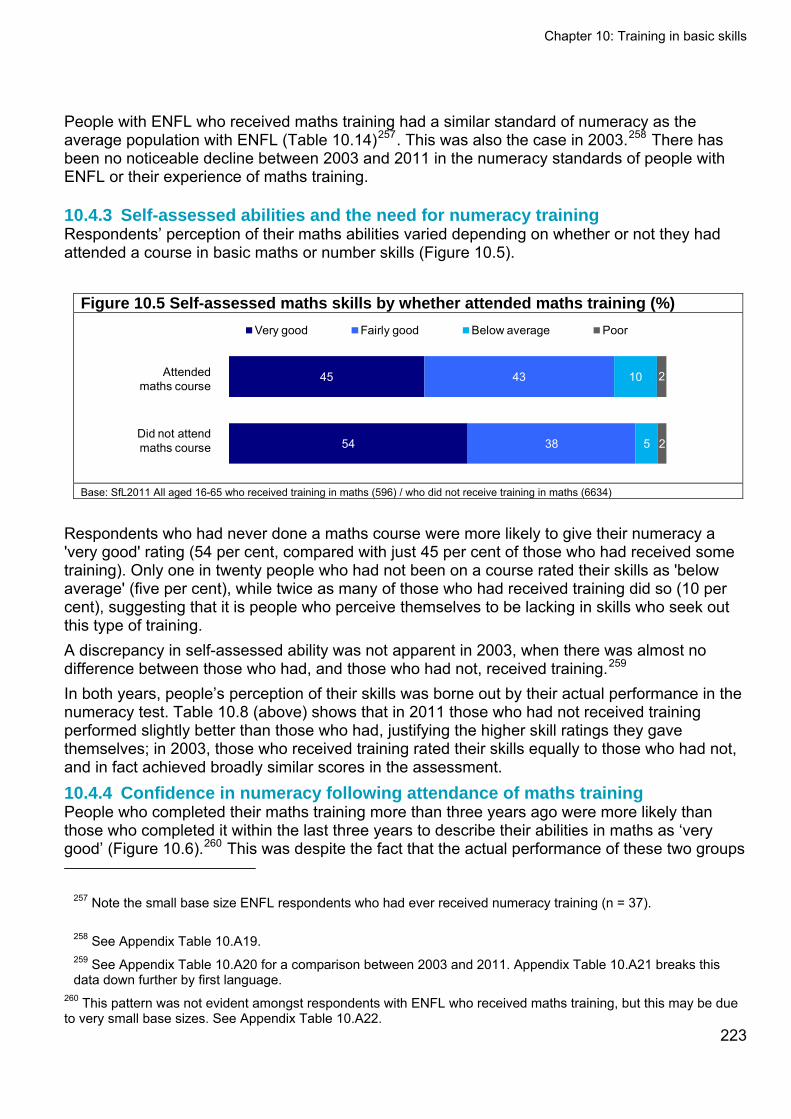
Chapter 10: Training in basic skills
People with ENFL who received maths training had a similar standard of numeracy as the average population with ENFL (Table 10.14)257. This was also the case in 2003.258 There has been no noticeable decline between 2003 and 2011 in the numeracy standards of people with ENFL or their experience of maths training.
10.4.3 Self-assessed abilities and the need for numeracy training Respondents’ perception of their maths abilities varied depending on whether or not they had attended a course in basic maths or number skills (Figure 10.5).
Figure 10.5 Self-assessed maths skills by whether attended maths training (%)
54
45
38
43
5
10
2
2
Very good Fairly good Below average Poor
Attended maths course
Did not attend maths course
Base: SfL2011 All aged 16-65 who received training in maths (596) / who did not receive training in maths (6634)
Respondents who had never done a maths course were more likely to give their numeracy a 'very good' rating (54 per cent, compared with just 45 per cent of those who had received some training). Only one in twenty people who had not been on a course rated their skills as 'below average' (five per cent), while twice as many of those who had received training did so (10 per cent), suggesting that it is people who perceive themselves to be lacking in skills who seek out this type of training. A discrepancy in self-assessed ability was not apparent in 2003, when there was almost no difference between those who had, and those who had not, received training.259 In both years, people’s perception of their skills was borne out by their actual performance in the numeracy test. Table 10.8 (above) shows that in 2011 those who had not received training performed slightly better than those who had, justifying the higher skill ratings they gave themselves; in 2003, those who received training rated their skills equally to those who had not, and in fact achieved broadly similar scores in the assessment. 10.4.4 Confidence in numeracy following attendance of maths training People who completed their maths training more than three years ago were more likely than those who completed it within the last three years to describe their abilities in maths as ‘very good’ (Figure 10.6).260 This was despite the fact that the actual performance of these two groups
257 Note the small base size ENFL respondents who had ever received numeracy training (n = 37).
258 See Appendix Table 10.A19. 259 See Appendix Table 10.A20 for a comparison between 2003 and 2011. Appendix Table 10.A21 breaks this data down further by first language.
223
260 This pattern was not evident amongst respondents with ENFL who received maths training, but this may be due to very small base sizes. See Appendix Table 10.A22.
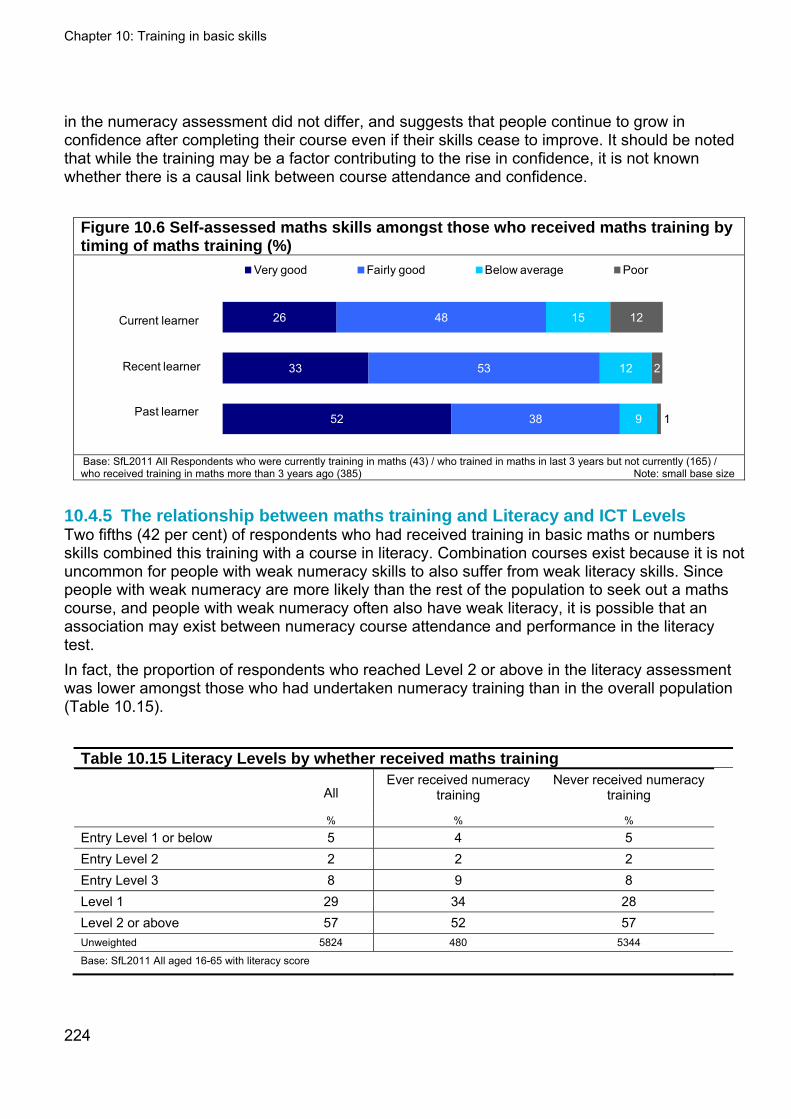
Chapter 10: Training in basic skills
in the numeracy assessment did not differ, and suggests that people continue to grow in confidence after completing their course even if their skills cease to improve. It should be noted that while the training may be a factor contributing to the rise in confidence, it is not known whether there is a causal link between course attendance and confidence.
Figure 10.6 Self-assessed maths skills amongst those who received maths training by timing of maths training (%)
26
33
52
48
53
38
15
12
9
12
2
1
Very good Fairly good Below average Poor
Current learner
Recent learner
Past learner
Base: SfL2011 All Respondents who were currently training in maths (43) / who trained in maths in last 3 years but not currently (165) / who received training in maths more than 3 years ago (385) Note: small base size
10.4.5 The relationship between maths training and Literacy and ICT Levels Two fifths (42 per cent) of respondents who had received training in basic maths or numbers skills combined this training with a course in literacy. Combination courses exist because it is not uncommon for people with weak numeracy skills to also suffer from weak literacy skills. Since people with weak numeracy are more likely than the rest of the population to seek out a maths course, and people with weak numeracy often also have weak literacy, it is possible that an association may exist between numeracy course attendance and performance in the literacy test. In fact, the proportion of respondents who reached Level 2 or above in the literacy assessment was lower amongst those who had undertaken numeracy training than in the overall population (Table 10.15).
Table 10.15 Literacy Levels by whether received maths training
All
Ever received numeracy training
Never received numeracy training
% % %
Entry Level 1 or below 5 4 5 Entry Level 2 2 2 2 Entry Level 3 8 9 8 Level 1 29 34 28 Level 2 or above 57 52 57 Unweighted 5824 480 5344
Base: SfL2011 All aged 16-65 with literacy score
224
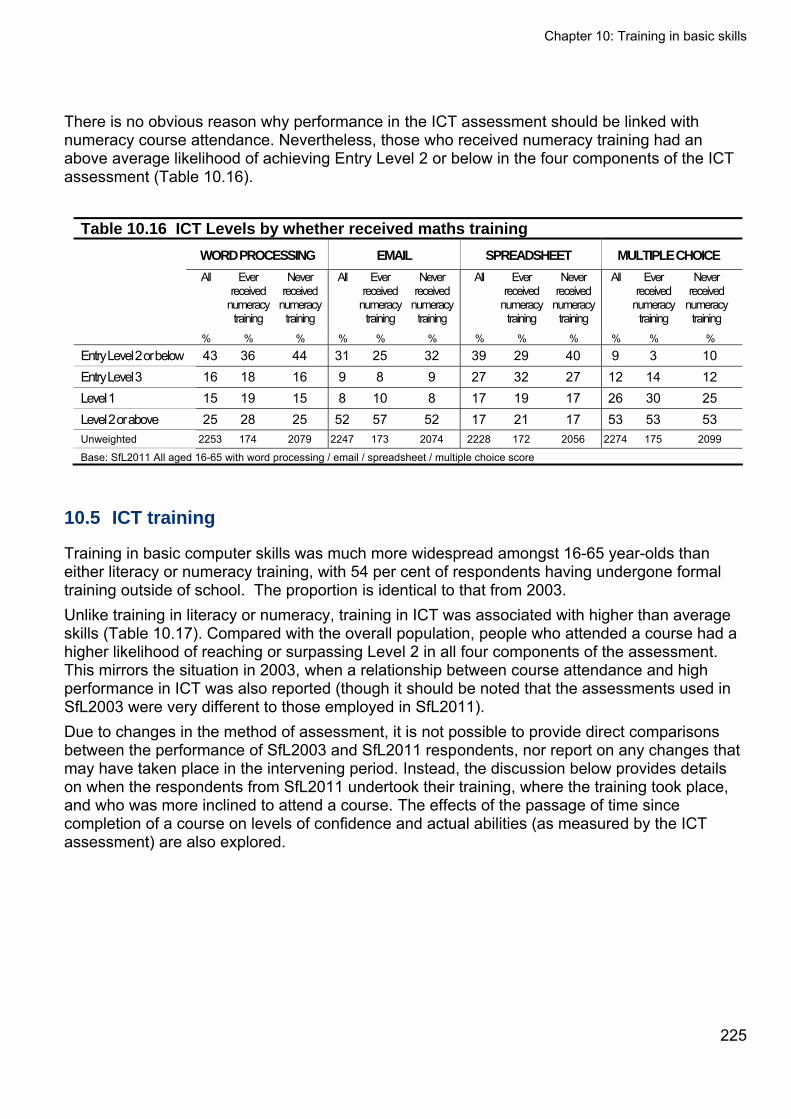
Chapter 10: Training in basic skills
225
There is no obvious reason why performance in the ICT assessment should be linked with numeracy course attendance. Nevertheless, those who received numeracy training had an above average likelihood of achieving Entry Level 2 or below in the four components of the ICT assessment (Table 10.16).
Table 10.16 ICT Levels by whether received maths training
WORD PROCESSING EMAIL SPREADSHEET MULTIPLE CHOICE
All Ever received
numeracy training
Never received
numeracy training
All Ever received
numeracy training
Never received
numeracy training
All Ever received
numeracy training
Never received
numeracy training
All Ever received
numeracy training
Never received
numeracy training
% % % % % % % % % % % %
Entry Level 2 or below 43 36 44 31 25 32 39 29 40 9 3 10 Entry Level 3 16 18 16 9 8 9 27 32 27 12 14 12 Level 1 15 19 15 8 10 8 17 19 17 26 30 25 Level 2 or above 25 28 25 52 57 52 17 21 17 53 53 53 Unweighted 2253 174 2079 2247 173 2074 2228 172 2056 2274 175 2099
Base: SfL2011 All aged 16-65 with word processing / email / spreadsheet / multiple choice score
10.5 ICT training
Training in basic computer skills was much more widespread amongst 16-65 year-olds than either literacy or numeracy training, with 54 per cent of respondents having undergone formal training outside of school. The proportion is identical to that from 2003. Unlike training in literacy or numeracy, training in ICT was associated with higher than average skills (Table 10.17). Compared with the overall population, people who attended a course had a higher likelihood of reaching or surpassing Level 2 in all four components of the assessment. This mirrors the situation in 2003, when a relationship between course attendance and high performance in ICT was also reported (though it should be noted that the assessments used in SfL2003 were very different to those employed in SfL2011). Due to changes in the method of assessment, it is not possible to provide direct comparisons between the performance of SfL2003 and SfL2011 respondents, nor report on any changes that may have taken place in the intervening period. Instead, the discussion below provides details on when the respondents from SfL2011 undertook their training, where the training took place, and who was more inclined to attend a course. The effects of the passage of time since completion of a course on levels of confidence and actual abilities (as measured by the ICT assessment) are also explored.
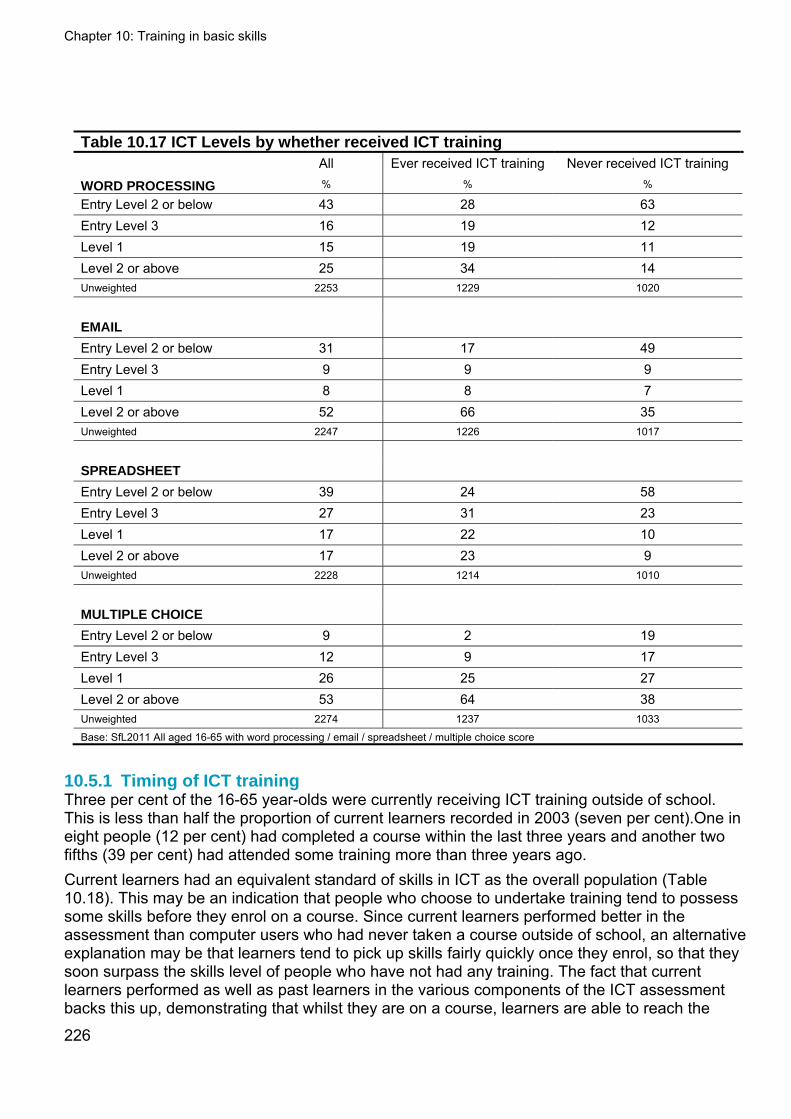
Chapter 10: Training in basic skills
226
Table 10.17 ICT Levels by whether received ICT training All Ever received ICT training Never received ICT training
WORD PROCESSING % % %
Entry Level 2 or below 43 28 63 Entry Level 3 16 19 12 Level 1 15 19 11 Level 2 or above 25 34 14 Unweighted 2253 1229 1020
Entry Level 2 or below 31 17 49 Entry Level 3 9 9 9 Level 1 8 8 7 Level 2 or above 52 66 35 Unweighted 2247 1226 1017
SPREADSHEET
Entry Level 2 or below 39 24 58 Entry Level 3 27 31 23 Level 1 17 22 10 Level 2 or above 17 23 9 Unweighted 2228 1214 1010
MULTIPLE CHOICE
Entry Level 2 or below 9 2 19 Entry Level 3 12 9 17 Level 1 26 25 27 Level 2 or above 53 64 38 Unweighted 2274 1237 1033
Base: SfL2011 All aged 16-65 with word processing / email / spreadsheet / multiple choice score
10.5.1 Timing of ICT training Three per cent of the 16-65 year-olds were currently receiving ICT training outside of school. This is less than half the proportion of current learners recorded in 2003 (seven per cent).One in eight people (12 per cent) had completed a course within the last three years and another two fifths (39 per cent) had attended some training more than three years ago. Current learners had an equivalent standard of skills in ICT as the overall population (Table 10.18). This may be an indication that people who choose to undertake training tend to possess some skills before they enrol on a course. Since current learners performed better in the assessment than computer users who had never taken a course outside of school, an alternative explanation may be that learners tend to pick up skills fairly quickly once they enrol, so that they soon surpass the skills level of people who have not had any training. The fact that current learners performed as well as past learners in the various components of the ICT assessment backs this up, demonstrating that whilst they are on a course, learners are able to reach the
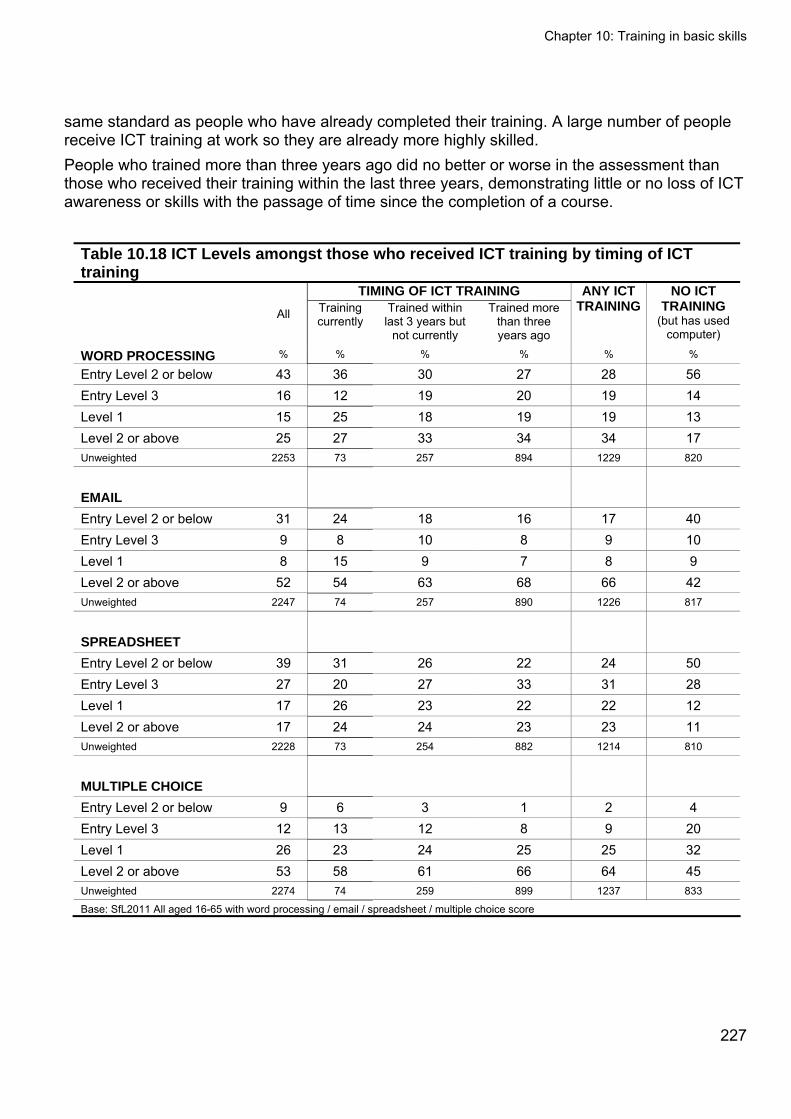
Chapter 10: Training in basic skills
same standard as people who have already completed their training. A large number of people receive ICT training at work so they are already more highly skilled. People who trained more than three years ago did no better or worse in the assessment than those who received their training within the last three years, demonstrating little or no loss of ICT awareness or skills with the passage of time since the completion of a course.
Table 10.18 ICT Levels amongst those who received ICT training by timing of ICT training
TIMING OF ICT TRAINING
All Training currently
Trained within last 3 years but
not currently
Trained more than three years ago
ANY ICT TRAINING
NO ICT TRAINING
(but has used computer)
WORD PROCESSING % % % % % %
Entry Level 2 or below 43 36 30 27 28 56 Entry Level 3 16 12 19 20 19 14 Level 1 15 25 18 19 19 13 Level 2 or above 25 27 33 34 34 17 Unweighted 2253 73 257 894 1229 820
Entry Level 2 or below 31 24 18 16 17 40 Entry Level 3 9 8 10 8 9 10 Level 1 8 15 9 7 8 9 Level 2 or above 52 54 63 68 66 42 Unweighted 2247 74 257 890 1226 817
SPREADSHEET
Entry Level 2 or below 39 31 26 22 24 50 Entry Level 3 27 20 27 33 31 28 Level 1 17 26 23 22 22 12 Level 2 or above 17 24 24 23 23 11 Unweighted 2228 73 254 882 1214 810
MULTIPLE CHOICE
Entry Level 2 or below 9 6 3 1 2 4 Entry Level 3 12 13 12 8 9 20 Level 1 26 23 24 25 25 32 Level 2 or above 53 58 61 66 64 45 Unweighted 2274 74 259 899 1237 833
Base: SfL2011 All aged 16-65 with word processing / email / spreadsheet / multiple choice score
227
Chapter 10: Training in basic skills
228
10.5.2 Who received ICT training To get a better idea of the sections of the population who were more likely to attend ICT training, the calculations below exclude people who had never used a computer. This latter group was heavily composed of over-45s and people who were not in work: 83 per cent of people with no computer experience were in this age range, and 52 per cent were unemployed. Among people who had used a computer at some point in their lives, women and those still in education had an above average tendency to undertake ICT training (63 per cent and 73 per cent, respectively, compared to 58 per cent overall). In addition, training was common among 20-24 year-olds (64 per cent), and even more so among 16-19 year-olds (76 per cent). These were precisely the same groups which had a higher than average tendency to report undertaking training in 2003. The group which was least likely to attend a course in ICT despite having used a computer at some point consisted of people who had terminated their education before the age of 17 (54 per cent of this group has never undertaken ICT training, compared with 42 per cent overall).261 The incidence of ICT training was also linked to computer access. Training was relatively uncommon amongst people who did not have a computer at home, or who did not have a computer at work (only 46 per cent in each group had taken a course in basic computer skills, compared to 58 per cent across all computer users). As well as considering the subgroups who were most likely to seek out training, it is worthwhile identifying any subgroups who had a training need and yet chose not to attend an ICT course. Over a quarter of the entire population of 16-65 year-olds (27 per cent) achieved or were assigned Entry Level 2 or below in all three practical components of the ICT assessment and could therefore be described as having a training need. On average, three quarters (74 per cent) of those with a training need did not attend a course on ICT, but a lack of training was particularly common amongst people with a training need who lived in the East Midlands, those who were not in work, who left education before the age of 17 or who had a limiting disability (87 per cent, 79 per cent, 80 per cent, and 80 per cent, respectively).262 Lower-than-average confidence was a characteristic of people with a training need who chose not to train: only five per cent described their ICT skills as ‘very good’, compared with eight per cent of everyone who had a training need. Moreover, this group was most inclined to say that they had no intention to undertake future learning (51 per cent had no intentions regarding job-related learning and 59 per cent had no intentions regarding non job-related learning, compared to 46 per cent and 54 per cent, respectively, across all those with a training need).
261 See Appendix Tables 10.A23 and 10.A24. 262 See Appendix Tables 10.A25 and 10.A26.
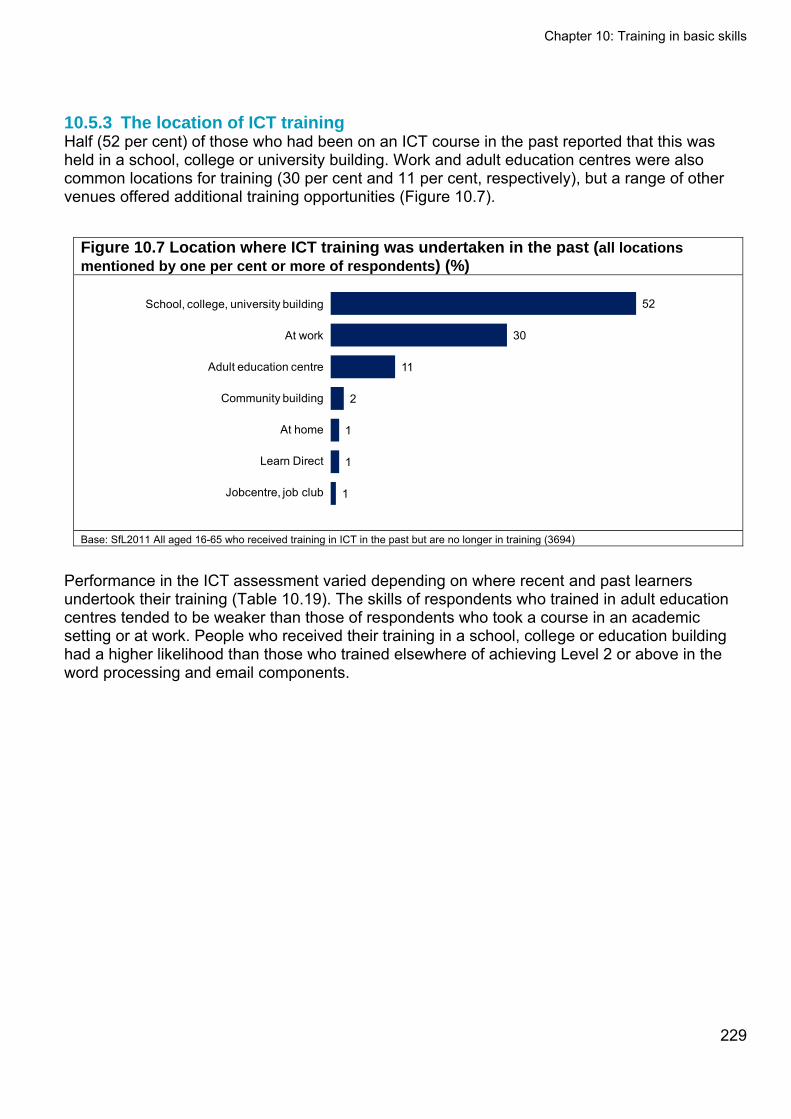
Chapter 10: Training in basic skills
10.5.3 The location of ICT training Half (52 per cent) of those who had been on an ICT course in the past reported that this was held in a school, college or university building. Work and adult education centres were also common locations for training (30 per cent and 11 per cent, respectively), but a range of other venues offered additional training opportunities (Figure 10.7).
Figure 10.7 Location where ICT training was undertaken in the past (all locations mentioned by one per cent or more of respondents) (%)
52
30
11
2
1
1
1
School, college, university building
At work
Adult education centre
Community building
At home
Learn Direct
Jobcentre, job club
Base: SfL2011 All aged 16-65 who received training in ICT in the past but are no longer in training (3694)
Performance in the ICT assessment varied depending on where recent and past learners undertook their training (Table 10.19). The skills of respondents who trained in adult education centres tended to be weaker than those of respondents who took a course in an academic setting or at work. People who received their training in a school, college or education building had a higher likelihood than those who trained elsewhere of achieving Level 2 or above in the word processing and email components.
229
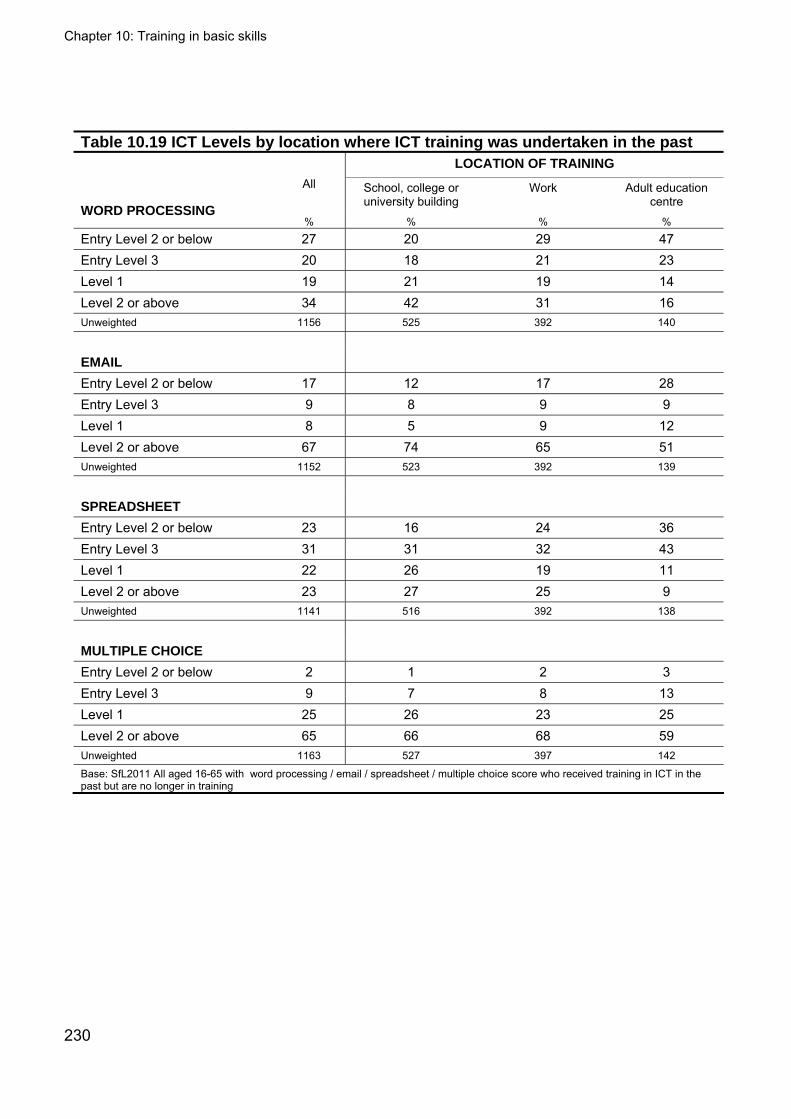
Chapter 10: Training in basic skills
230
Table 10.19 ICT Levels by location where ICT training was undertaken in the past
LOCATION OF TRAINING
All School, college or university building
Work Adult education centre
WORD PROCESSING % % % %
Entry Level 2 or below 27 20 29 47 Entry Level 3 20 18 21 23 Level 1 19 21 19 14 Level 2 or above 34 42 31 16 Unweighted 1156 525 392 140
Entry Level 2 or below 17 12 17 28 Entry Level 3 9 8 9 9 Level 1 8 5 9 12 Level 2 or above 67 74 65 51 Unweighted 1152 523 392 139
SPREADSHEET
Entry Level 2 or below 23 16 24 36 Entry Level 3 31 31 32 43 Level 1 22 26 19 11 Level 2 or above 23 27 25 9 Unweighted 1141 516 392 138
MULTIPLE CHOICE
Entry Level 2 or below 2 1 2 3 Entry Level 3 9 7 8 13 Level 1 25 26 23 25 Level 2 or above 65 66 68 59 Unweighted 1163 527 397 142
Base: SfL2011 All aged 16-65 with word processing / email / spreadsheet / multiple choice score who received training in ICT in the past but are no longer in training
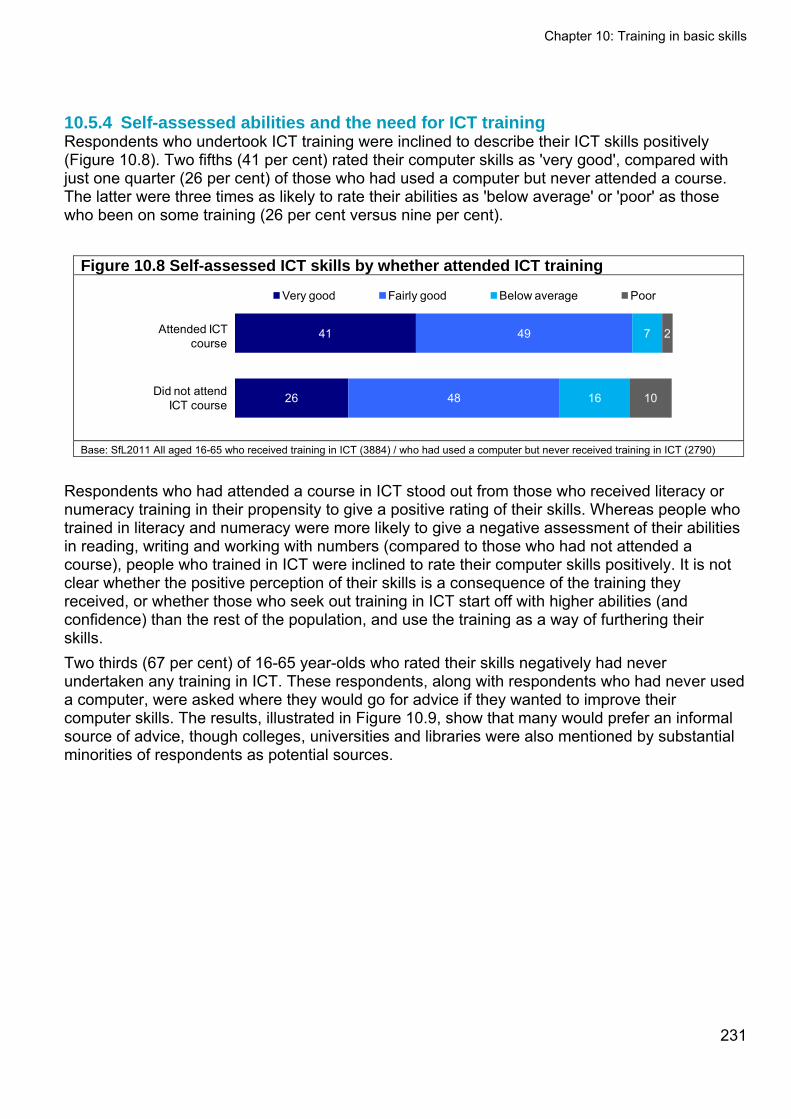
Chapter 10: Training in basic skills
10.5.4 Self-assessed abilities and the need for ICT training Respondents who undertook ICT training were inclined to describe their ICT skills positively (Figure 10.8). Two fifths (41 per cent) rated their computer skills as 'very good', compared with just one quarter (26 per cent) of those who had used a computer but never attended a course. The latter were three times as likely to rate their abilities as 'below average' or 'poor' as those who been on some training (26 per cent versus nine per cent).
Figure 10.8 Self-assessed ICT skills by whether attended ICT training
26
41
48
49
16
7
10
2
Very good Fairly good Below average Poor
Attended ICT course
Did not attend ICT course
Base: SfL2011 All aged 16-65 who received training in ICT (3884) / who had used a computer but never received training in ICT (2790)
Respondents who had attended a course in ICT stood out from those who received literacy or numeracy training in their propensity to give a positive rating of their skills. Whereas people who trained in literacy and numeracy were more likely to give a negative assessment of their abilities in reading, writing and working with numbers (compared to those who had not attended a course), people who trained in ICT were inclined to rate their computer skills positively. It is not clear whether the positive perception of their skills is a consequence of the training they received, or whether those who seek out training in ICT start off with higher abilities (and confidence) than the rest of the population, and use the training as a way of furthering their skills. Two thirds (67 per cent) of 16-65 year-olds who rated their skills negatively had never undertaken any training in ICT. These respondents, along with respondents who had never used a computer, were asked where they would go for advice if they wanted to improve their computer skills. The results, illustrated in Figure 10.9, show that many would prefer an informal source of advice, though colleges, universities and libraries were also mentioned by substantial minorities of respondents as potential sources.
231
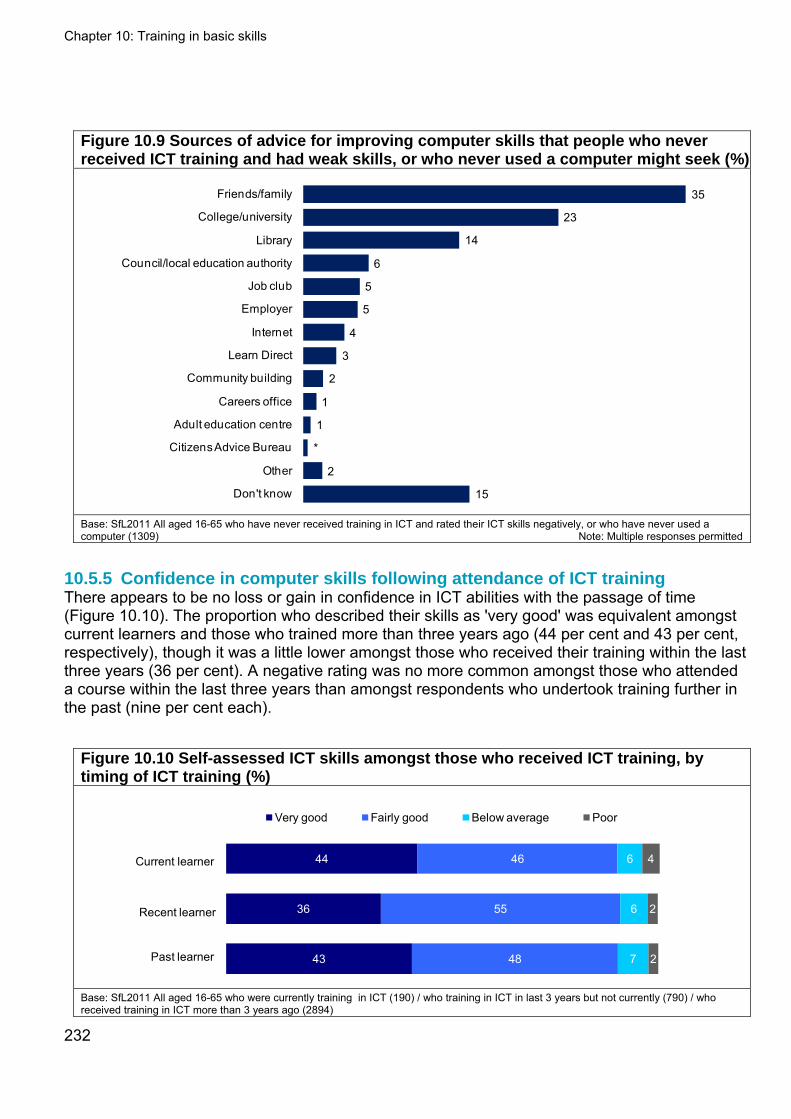
Chapter 10: Training in basic skills
Figure 10.9 Sources of advice for improving computer skills that people who never received ICT training and had weak skills, or who never used a computer might seek (%)
35
23
14
6
5
5
4
3
2
1
1
*
2
15
Friends/family
College/university
Library
Council/local education authority
Job club
Employer
Internet
Learn Direct
Community building
Careers office
Adult education centre
Citizens Advice Bureau
Other
Don't know Base: SfL2011 All aged 16-65 who have never received training in ICT and rated their ICT skills negatively, or who have never used a computer (1309) Note: Multiple responses permitted
10.5.5 Confidence in computer skills following attendance of ICT training There appears to be no loss or gain in confidence in ICT abilities with the passage of time (Figure 10.10). The proportion who described their skills as 'very good' was equivalent amongst current learners and those who trained more than three years ago (44 per cent and 43 per cent, respectively), though it was a little lower amongst those who received their training within the last three years (36 per cent). A negative rating was no more common amongst those who attended a course within the last three years than amongst respondents who undertook training further in the past (nine per cent each).
Figure 10.10 Self-assessed ICT skills amongst those who received ICT training, by timing of ICT training (%)
44
36
43
46
55
48
6
6
7
4
2
2
Very good Fairly good Below average Poor
Current learner
Recent learner
Past learner
Base: SfL2011 All aged 16-65 who were currently training in ICT (190) / who training in ICT in last 3 years but not currently (790) / who received training in ICT more than 3 years ago (2894)
232
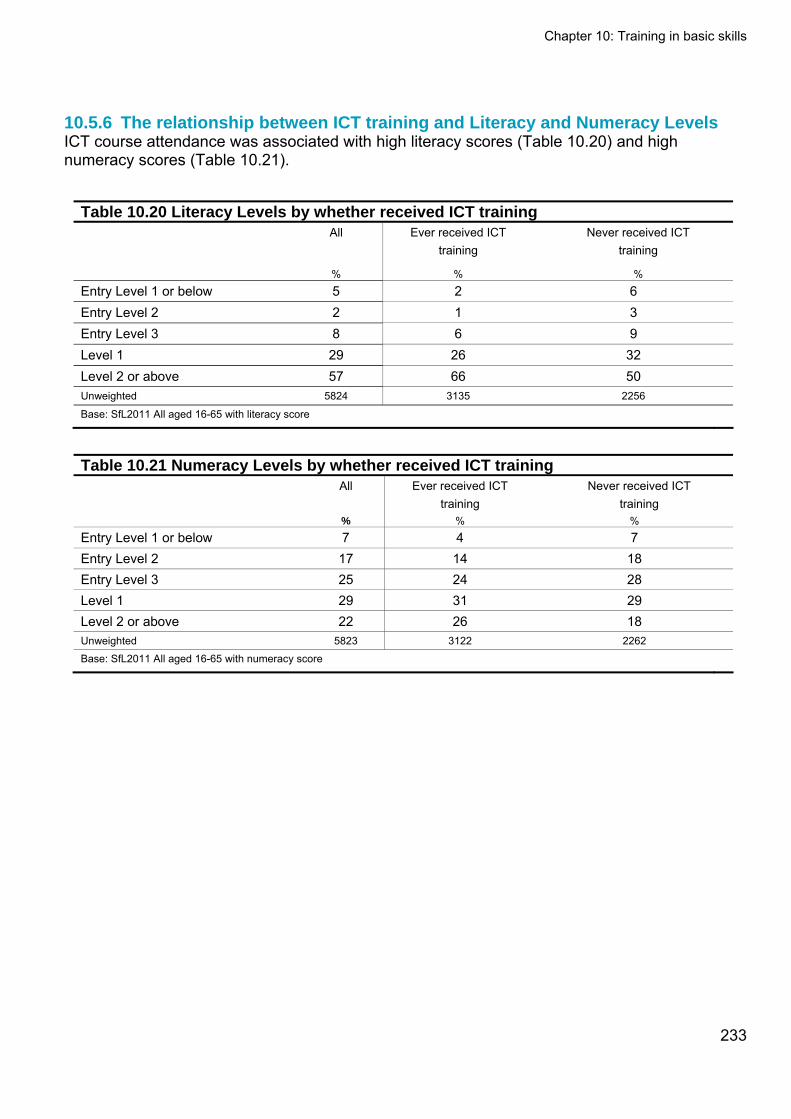
Chapter 10: Training in basic skills
233
10.5.6 The relationship between ICT training and Literacy and Numeracy Levels ICT course attendance was associated with high literacy scores (Table 10.20) and high numeracy scores (Table 10.21).
Table 10.20 Literacy Levels by whether received ICT training
All Ever received ICT
training
Never received ICT training
% % %
Entry Level 1 or below 5 2 6 Entry Level 2 2 1 3 Entry Level 3 8 6 9 Level 1 29 26 32 Level 2 or above 57 66 50 Unweighted 5824 3135 2256
Base: SfL2011 All aged 16-65 with literacy score
Table 10.21 Numeracy Levels by whether received ICT training
All Ever received ICT training
Never received ICT training
% % %
Entry Level 1 or below 7 4 7 Entry Level 2 17 14 18 Entry Level 3 25 24 28 Level 1 29 31 29 Level 2 or above 22 26 18 Unweighted 5823 3122 2262
Base: SfL2011 All aged 16-65 with numeracy score
Chapter 11: Attitudes towards learning
234
11 Attitudes towards learning 11.1 Key Findings
This chapter describes the relationship between respondents’ basic skills and their attitudes towards learning and education, as well as their intentions regarding learning. Personal enjoyment and confidence in learning
More than four fifths of 16-65 year-olds had a positive outlook towards learning. People who were out of work or who had a limiting disability were more likely than average to have a negative outlook.
Respondents with a negative outlook tended to have weaker literacy, numeracy and ICT skills.
Views on education received thus far
Three quarters of respondents felt that their school years were useful. A positive perception of the usefulness of school was linked to higher basic skills.
Respondents who felt strongly that their school years had not been useful were the most likely to feel they should have continued their education to a higher level.
People who wished they had continued with their education were more likely than those who did not to fall short of Level 1 in the literacy assessment and Entry Level 3 in the numeracy assessment.
The practical value of education and qualifications
The majority of respondents placed practical (and financial) value on qualifications, learning and education, with respondents from BME backgrounds disproportionately more likely to agree with all three of the statements used to measure these attitudes. However, performance in the skills assessments correlated with only one of the three statements: ‘I see paying for my education as an investment’. Respondents who agreed with this tended to perform better than those who did not.
Learning as a continuous process
There was almost universal agreement that learning should be an ongoing process of personal and professional development.
Respondents who agreed that ‘learning is something you should do throughout your life’ tended to score higher on the skills assessments than those who did not agree. However, there was little difference in the basic skill standards of those who believed that improvement was necessary to succeed at work compared with those who disagreed with this notion.
Future Intentions towards learning
Seventeen per cent of respondents were not considering undertaking any learning in the next two to three years. Those who were least inclined to do so had the greatest room for improvement as they tended to achieve lower scores on the assessments.
Chapter 11: Attitudes towards learning
235
The most common explanation for wanting to undertake future learning was for personal development. A range of barriers to future learning were cited including time constraints, the cost of training and a lack of opportunities in the local area.
11.2 Introduction
Respondents’ scores in the literacy, numeracy and ICT assessments can be attributed to a host of factors, including their level of education, any additional training they may have received, and the extent to which their skills were maintained and extended through regular practice. Alongside these experiences, however, lie a variety of attitudes which can predispose respondents to either continue building on their skills through their adult lives, or to cease developing them past a certain stage.
The Skills for Life 2011 Survey collected attitudinal data on a range of topics which could potentially have impacted on people’s performance in the assessments. This includes information on people’s outlook towards learning, their views regarding their personal educational experiences, and the importance they attach to learning and qualifications. Chapter 11 presents the population’s views on these topics and their intentions regarding learning in the coming two to three years, and matches these against the Levels they achieved in the assessments. The data is derived from questions att through to fbarrin the Background Questionnaire, which can be found in Annex 3.
It should be noted that an individual’s attitudes, beliefs, viewpoints and opinions do not necessarily contribute to their abilities in a direct way. There may be instances where a set of beliefs has constrained a person’s abilities, and others where a belief or opinion was adopted as a way of rationalising or justifying weak skills. In both cases, we would expect attitudes and skills to reinforce one another, obscuring the direction of causality. A further possibility may be that neither acted as a trigger for the other, but that a person’s circumstances or experiences may have shaped both their attitudes on the subjects mentioned above and the strength of their basic skills. All possibilities should be borne in mind when interpreting the correlations in this chapter.
11.3 Attitudes towards learning
In order to explore the population’s attitudes towards the acquisition of skills, respondents were asked to what extent they agreed with ten statements. The statements were borrowed from a number of existing surveys and added to the SfL2011 questionnaire during the development stage of the survey.263,264, 265,266,267,268 Their purpose was to probe into respondents’ personal
263 Snape, E., E. Tanner, R. Sinclair, J. Michaelson and S. Finsch (2006) National Adult Learning Survey (NALS) 2005, Department for Education and Skills: Research Report 815, available online at: https://www.education.gov.uk/publications/eOrderingDownload/RR815.pdf, accessed on 28/03/12. 264 Levesley T, J. Regan, and J. Hillage (2009) Train to Gain Learner Evaluation Report from Wave 4 Research. Learning and Skills Council report, available online at: http://readingroom.lsc.gov.uk/lsc/National/nat-ttg_learner_eval_report_from_wave4_research-re-june2009-v1-1.pdf, accessed on 28/03/12. 265 Tyers, C and A. Sinclair (2005) Intermediate impacts of Advice and Guidance, Department for Education and Skills: Research Report 638, available online at https://www.education.gov.uk/publications/eOrderingDownload/RR638.pdf, accessed on 28/03/12
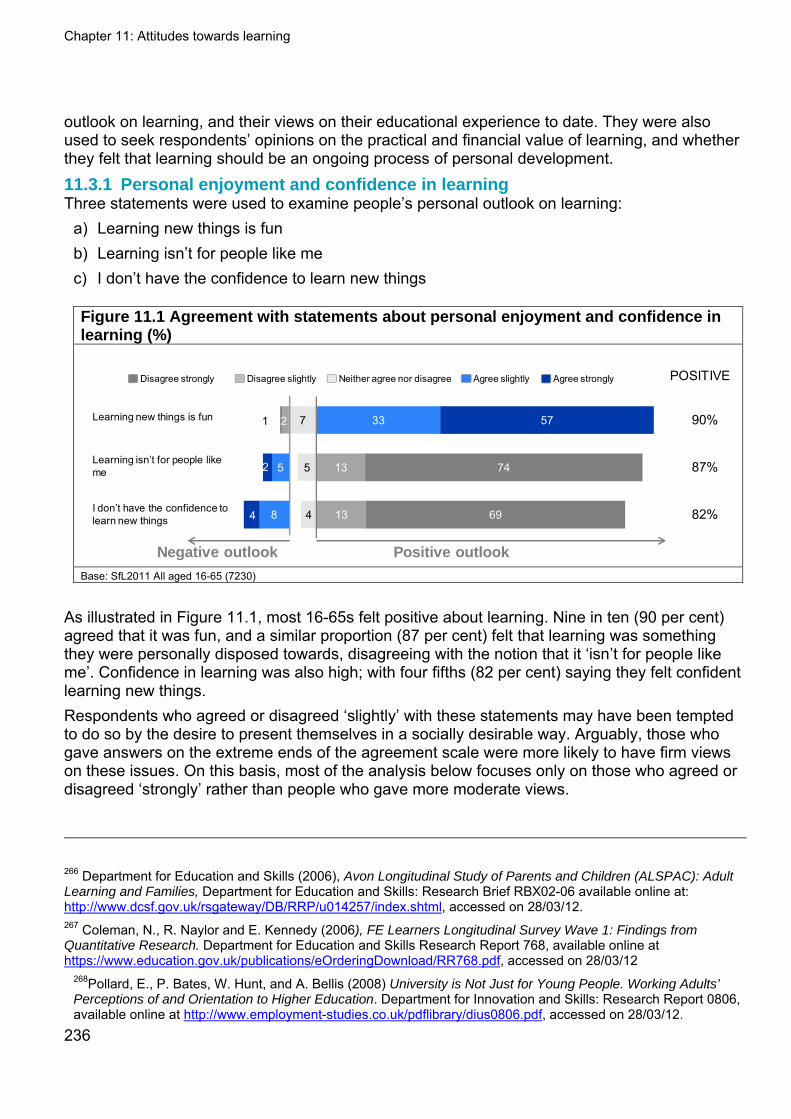
Chapter 11: Attitudes towards learning
outlook on learning, and their views on their educational experience to date. They were also used to seek respondents’ opinions on the practical and financial value of learning, and whether they felt that learning should be an ongoing process of personal development. 11.3.1 Personal enjoyment and confidence in learning Three statements were used to examine people’s personal outlook on learning:
a) Learning new things is fun b) Learning isn’t for people like me c) I don’t have the confidence to learn new things
Figure 11.1 Agreement with statements about personal enjoyment and confidence in learning (%)
7
5
4
2
5
8
1
2
4
33
13
13
57
74
69
Agree slightly Agree stronglyNeither agree nor disagreeDisagree slightlyDisagree strongly
Learning new things is fun
Learning isn’t for people like me
I don’t have the confidence to learn new things
Positive outlookNegative outlook
POSITIVE
90%
87%
82%
Base: SfL2011 All aged 16-65 (7230)
As illustrated in Figure 11.1, most 16-65s felt positive about learning. Nine in ten (90 per cent) agreed that it was fun, and a similar proportion (87 per cent) felt that learning was something they were personally disposed towards, disagreeing with the notion that it ‘isn’t for people like me’. Confidence in learning was also high; with four fifths (82 per cent) saying they felt confident learning new things. Respondents who agreed or disagreed ‘slightly’ with these statements may have been tempted to do so by the desire to present themselves in a socially desirable way. Arguably, those who gave answers on the extreme ends of the agreement scale were more likely to have firm views on these issues. On this basis, most of the analysis below focuses only on those who agreed or disagreed ‘strongly’ rather than people who gave more moderate views.
266 Department for Education and Skills (2006), Avon Longitudinal Study of Parents and Children (ALSPAC): Adult Learning and Families, Department for Education and Skills: Research Brief RBX02-06 available online at: http://www.dcsf.gov.uk/rsgateway/DB/RRP/u014257/index.shtml, accessed on 28/03/12. 267 Coleman, N., R. Naylor and E. Kennedy (2006), FE Learners Longitudinal Survey Wave 1: Findings from Quantitative Research. Department for Education and Skills Research Report 768, available online at https://www.education.gov.uk/publications/eOrderingDownload/RR768.pdf, accessed on 28/03/12
268Pollard, E., P. Bates, W. Hunt, and A. Bellis (2008) University is Not Just for Young People. Working Adults’ Perceptions of and Orientation to Higher Education. Department for Innovation and Skills: Research Report 0806, available online at http://www.employment-studies.co.uk/pdflibrary/dius0806.pdf, accessed on 28/03/12.
236
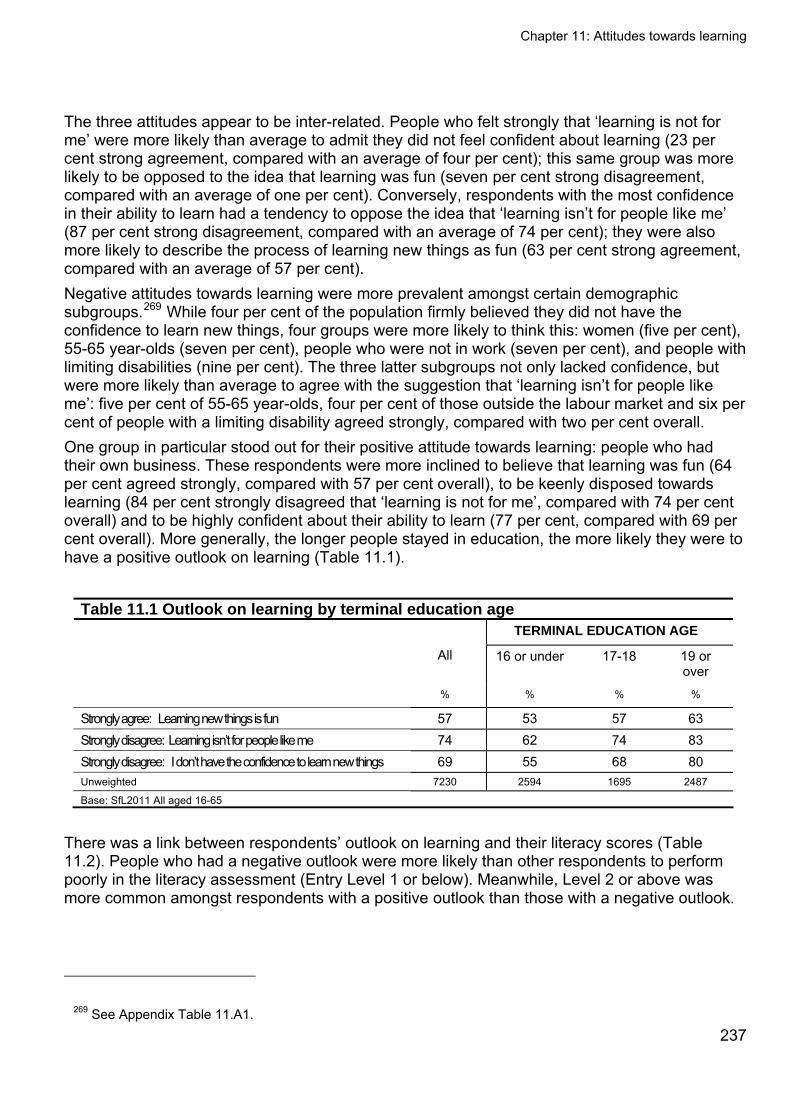
Chapter 11: Attitudes towards learning
237
The three attitudes appear to be inter-related. People who felt strongly that ‘learning is not for me’ were more likely than average to admit they did not feel confident about learning (23 per cent strong agreement, compared with an average of four per cent); this same group was more likely to be opposed to the idea that learning was fun (seven per cent strong disagreement, compared with an average of one per cent). Conversely, respondents with the most confidence in their ability to learn had a tendency to oppose the idea that ‘learning isn’t for people like me’ (87 per cent strong disagreement, compared with an average of 74 per cent); they were also more likely to describe the process of learning new things as fun (63 per cent strong agreement, compared with an average of 57 per cent). Negative attitudes towards learning were more prevalent amongst certain demographic subgroups.269 While four per cent of the population firmly believed they did not have the confidence to learn new things, four groups were more likely to think this: women (five per cent), 55-65 year-olds (seven per cent), people who were not in work (seven per cent), and people with limiting disabilities (nine per cent). The three latter subgroups not only lacked confidence, but were more likely than average to agree with the suggestion that ‘learning isn’t for people like me’: five per cent of 55-65 year-olds, four per cent of those outside the labour market and six per cent of people with a limiting disability agreed strongly, compared with two per cent overall. One group in particular stood out for their positive attitude towards learning: people who had their own business. These respondents were more inclined to believe that learning was fun (64 per cent agreed strongly, compared with 57 per cent overall), to be keenly disposed towards learning (84 per cent strongly disagreed that ‘learning is not for me’, compared with 74 per cent overall) and to be highly confident about their ability to learn (77 per cent, compared with 69 per cent overall). More generally, the longer people stayed in education, the more likely they were to have a positive outlook on learning (Table 11.1).
Table 11.1 Outlook on learning by terminal education age TERMINAL EDUCATION AGE
All 16 or under 17-18 19 or over
% % % %
Strongly agree: Learning new things is fun 57 53 57 63 Strongly disagree: Learning isn’t for people like me 74 62 74 83 Strongly disagree: I don’t have the confidence to learn new things 69 55 68 80 Unweighted 7230 2594 1695 2487
Base: SfL2011 All aged 16-65
There was a link between respondents’ outlook on learning and their literacy scores (Table 11.2). People who had a negative outlook were more likely than other respondents to perform poorly in the literacy assessment (Entry Level 1 or below). Meanwhile, Level 2 or above was more common amongst respondents with a positive outlook than those with a negative outlook.
269 See Appendix Table 11.A1.
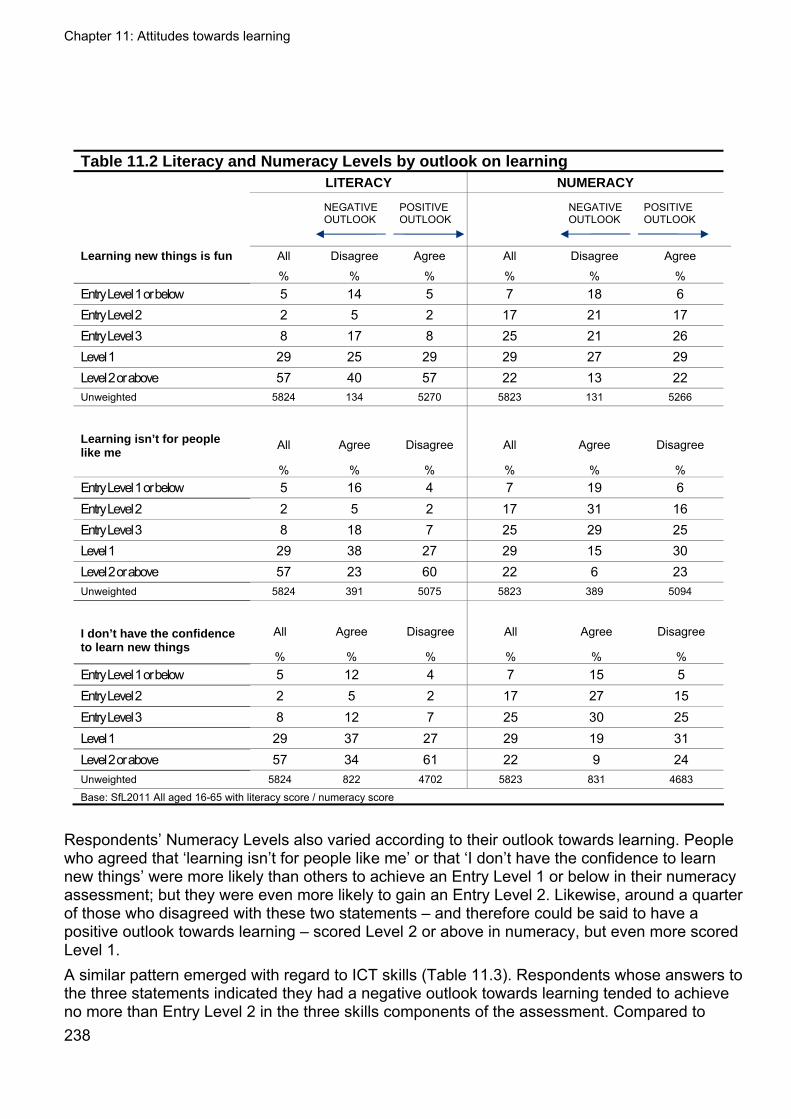
Chapter 11: Attitudes towards learning
Table 11.2 Literacy and Numeracy Levels by outlook on learning LITERACY NUMERACY NEGATIVE
OUTLOOK POSITIVE OUTLOOK
NEGATIVE OUTLOOK
POSITIVE OUTLOOK
All Disagree Agree All Disagree Agree Learning new things is fun
% % % % % % Entry Level 1 or below 5 14 5 7 18 6 Entry Level 2 2 5 2 17 21 17 Entry Level 3 8 17 8 25 21 26 Level 1 29 25 29 29 27 29 Level 2 or above 57 40 57 22 13 22 Unweighted 5824 134 5270 5823 131 5266
All Agree Disagree All Agree Disagree
Learning isn’t for people like me
% % % % % % Entry Level 1 or below 5 16 4 7 19 6 Entry Level 2 2 5 2 17 31 16 Entry Level 3 8 18 7 25 29 25 Level 1 29 38 27 29 15 30 Level 2 or above 57 23 60 22 6 23 Unweighted 5824 391 5075 5823 389 5094
All Agree Disagree All Agree Disagree
I don’t have the confidence to learn new things
% % % % % % Entry Level 1 or below 5 12 4 7 15 5 Entry Level 2 2 5 2 17 27 15 Entry Level 3 8 12 7 25 30 25 Level 1 29 37 27 29 19 31 Level 2 or above 57 34 61 22 9 24 Unweighted 5824 822 4702 5823 831 4683
Base: SfL2011 All aged 16-65 with literacy score / numeracy score
Respondents’ Numeracy Levels also varied according to their outlook towards learning. People who agreed that ‘learning isn’t for people like me’ or that ‘I don’t have the confidence to learn new things’ were more likely than others to achieve an Entry Level 1 or below in their numeracy assessment; but they were even more likely to gain an Entry Level 2. Likewise, around a quarter of those who disagreed with these two statements – and therefore could be said to have a positive outlook towards learning – scored Level 2 or above in numeracy, but even more scored Level 1. A similar pattern emerged with regard to ICT skills (Table 11.3). Respondents whose answers to the three statements indicated they had a negative outlook towards learning tended to achieve no more than Entry Level 2 in the three skills components of the assessment. Compared to 238
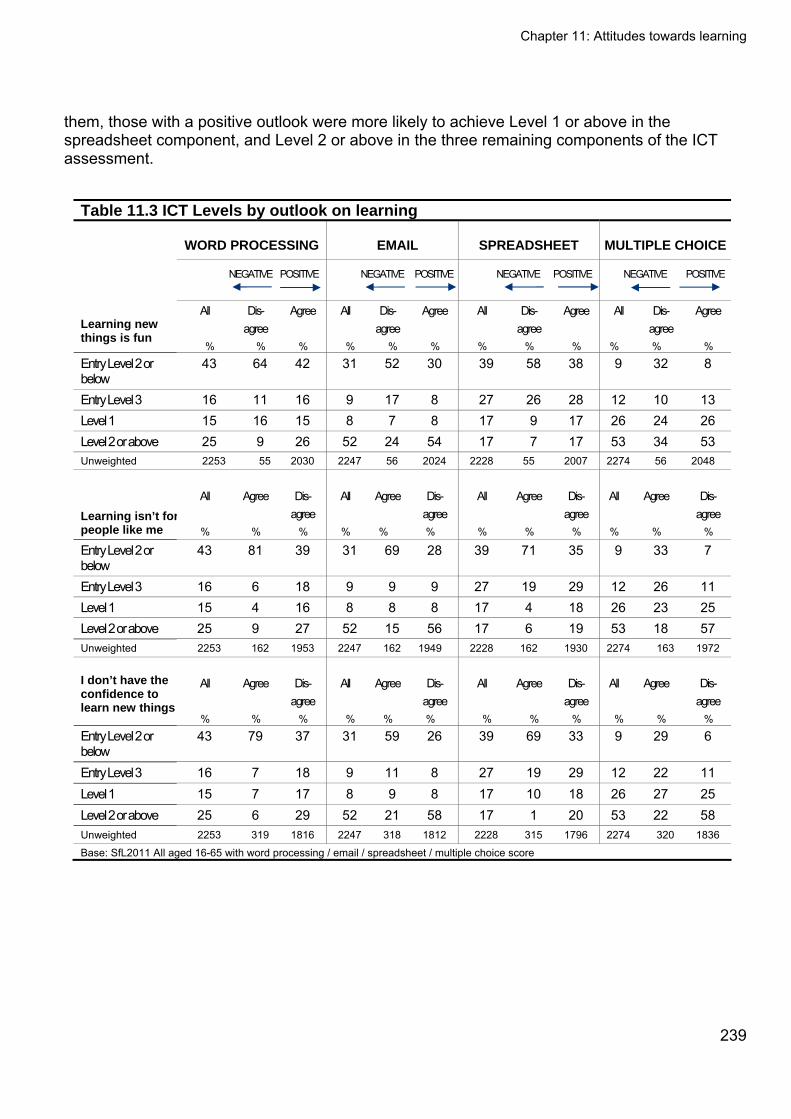
Chapter 11: Attitudes towards learning
them, those with a positive outlook were more likely to achieve Level 1 or above in the spreadsheet component, and Level 2 or above in the three remaining components of the ICT assessment.
Table 11.3 ICT Levels by outlook on learning
WORD PROCESSING EMAIL SPREADSHEET MULTIPLE CHOICE
NEGATIVE POSITIVE NEGATIVE POSITIVE NEGATIVE POSITIVE NEGATIVE POSITIVE
All
Dis-agree
Agree All Dis-agree
Agree All Dis-agree
Agree All Dis-agree
Agree Learning new things is fun
% % % % % % % % % % % %
Entry Level 2 or below
43 64 42 31 52 30 39 58 38 9 32 8
Entry Level 3 16 11 16 9 17 8 27 26 28 12 10 13 Level 1 15 16 15 8 7 8 17 9 17 26 24 26 Level 2 or above 25 9 26 52 24 54 17 7 17 53 34 53 Unweighted 2253 55 2030 2247 56 2024 2228 55 2007 2274 56 2048
All
Agree
Dis-
agree
All
Agree
Dis-
agree
All
Agree
Dis-
agree
All
Agree
Dis-
agree
Learning isn’t forpeople like me % % % % % % % % % % % %
Entry Level 2 or below
43 81 39 31 69 28 39 71 35 9 33 7
Entry Level 3 16 6 18 9 9 9 27 19 29 12 26 11 Level 1 15 4 16 8 8 8 17 4 18 26 23 25 Level 2 or above 25 9 27 52 15 56 17 6 19 53 18 57 Unweighted 2253 162 1953 2247 162 1949 2228 162 1930 2274 163 1972
All
Agree
Dis-
agree
All
Agree
Dis-
agree
All
Agree
Dis-
agree
All
Agree
Dis-
agree
I don’t have the confidence to learn new things
% % % % % % % % % % % %
Entry Level 2 or below
43 79 37 31 59 26 39 69 33 9 29 6
Entry Level 3 16 7 18 9 11 8 27 19 29 12 22 11 Level 1 15 7 17 8 9 8 17 10 18 26 27 25 Level 2 or above 25 6 29 52 21 58 17 1 20 53 22 58 Unweighted 2253 319 1816 2247 318 1812 2228 315 1796 2274 320 1836
Base: SfL2011 All aged 16-65 with word processing / email / spreadsheet / multiple choice score
239
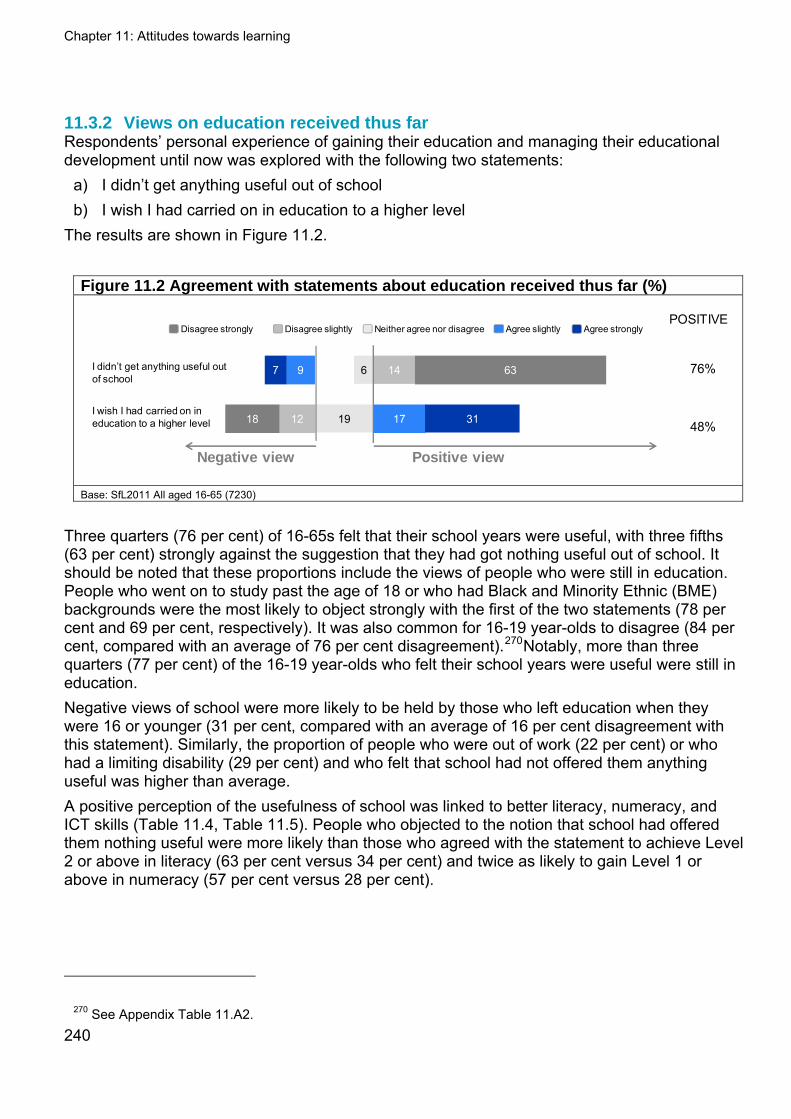
Chapter 11: Attitudes towards learning
11.3.2 Views on education received thus far Respondents’ personal experience of gaining their education and managing their educational development until now was explored with the following two statements:
a) I didn’t get anything useful out of school b) I wish I had carried on in education to a higher level
The results are shown in Figure 11.2.
Figure 11.2 Agreement with statements about education received thus far (%)
6
19
9
12
7
18
14
17
63
31
I didn’t get anything useful out of school
I wish I had carried on in education to a higher level
Positive viewNegative view
POSITIVE
76%
48%
Agree slightly Agree stronglyNeither agree nor disagreeDisagree slightlyDisagree strongly
Base: SfL2011 All aged 16-65 (7230)
Three quarters (76 per cent) of 16-65s felt that their school years were useful, with three fifths (63 per cent) strongly against the suggestion that they had got nothing useful out of school. It should be noted that these proportions include the views of people who were still in education. People who went on to study past the age of 18 or who had Black and Minority Ethnic (BME) backgrounds were the most likely to object strongly with the first of the two statements (78 per cent and 69 per cent, respectively). It was also common for 16-19 year-olds to disagree (84 per cent, compared with an average of 76 per cent disagreement).270Notably, more than three quarters (77 per cent) of the 16-19 year-olds who felt their school years were useful were still in education. Negative views of school were more likely to be held by those who left education when they were 16 or younger (31 per cent, compared with an average of 16 per cent disagreement with this statement). Similarly, the proportion of people who were out of work (22 per cent) or who had a limiting disability (29 per cent) and who felt that school had not offered them anything useful was higher than average. A positive perception of the usefulness of school was linked to better literacy, numeracy, and ICT skills (Table 11.4, Table 11.5). People who objected to the notion that school had offered them nothing useful were more likely than those who agreed with the statement to achieve Level 2 or above in literacy (63 per cent versus 34 per cent) and twice as likely to gain Level 1 or above in numeracy (57 per cent versus 28 per cent).
270 See Appendix Table 11.A2. 240
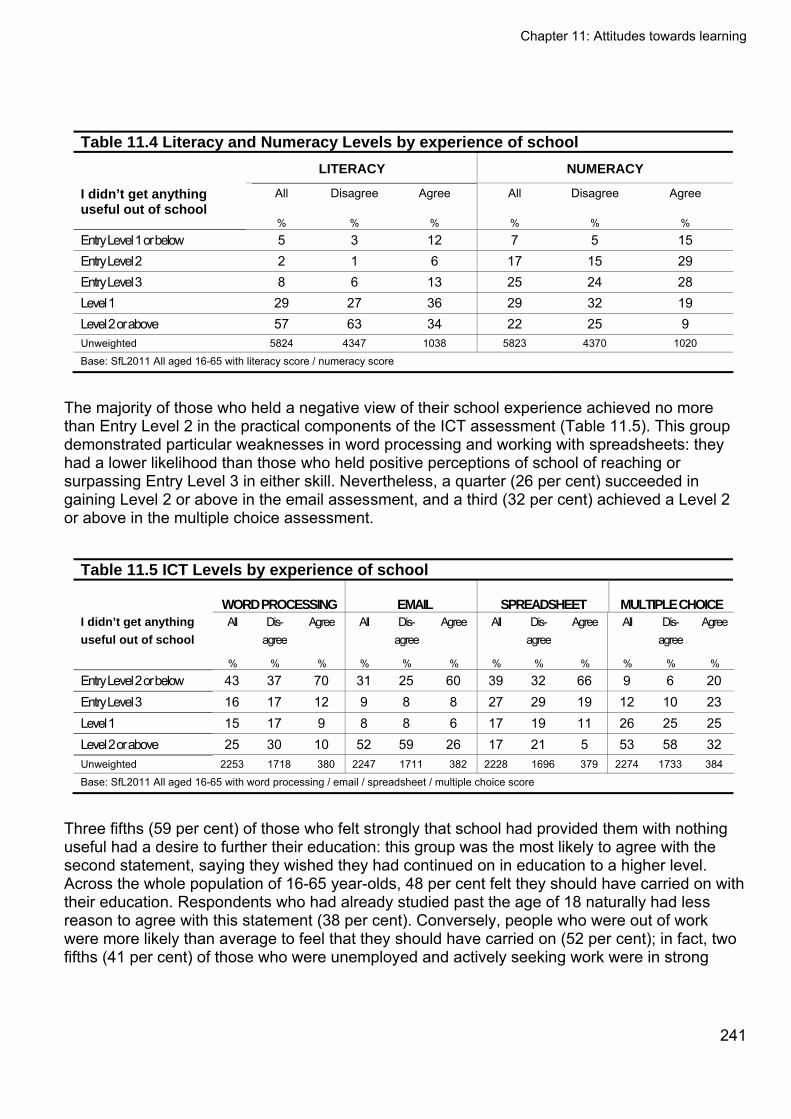
Chapter 11: Attitudes towards learning
241
Table 11.4 Literacy and Numeracy Levels by experience of school LITERACY NUMERACY
I didn’t get anything useful out of school
All Disagree Agree All Disagree Agree
% % % % % %
Entry Level 1 or below 5 3 12 7 5 15 Entry Level 2 2 1 6 17 15 29 Entry Level 3 8 6 13 25 24 28 Level 1 29 27 36 29 32 19 Level 2 or above 57 63 34 22 25 9 Unweighted 5824 4347 1038 5823 4370 1020
Base: SfL2011 All aged 16-65 with literacy score / numeracy score
The majority of those who held a negative view of their school experience achieved no more than Entry Level 2 in the practical components of the ICT assessment (Table 11.5). This group demonstrated particular weaknesses in word processing and working with spreadsheets: they had a lower likelihood than those who held positive perceptions of school of reaching or surpassing Entry Level 3 in either skill. Nevertheless, a quarter (26 per cent) succeeded in gaining Level 2 or above in the email assessment, and a third (32 per cent) achieved a Level 2 or above in the multiple choice assessment.
Table 11.5 ICT Levels by experience of school
WORD PROCESSING EMAIL SPREADSHEET MULTIPLE CHOICE
I didn’t get anything
useful out of school
All Dis-agree
Agree All Dis-agree
Agree All Dis-agree
Agree All Dis-agree
Agree
% % % % % % % % % % % %
Entry Level 2 or below 43 37 70 31 25 60 39 32 66 9 6 20 Entry Level 3 16 17 12 9 8 8 27 29 19 12 10 23 Level 1 15 17 9 8 8 6 17 19 11 26 25 25 Level 2 or above 25 30 10 52 59 26 17 21 5 53 58 32 Unweighted 2253 1718 380 2247 1711 382 2228 1696 379 2274 1733 384
Base: SfL2011 All aged 16-65 with word processing / email / spreadsheet / multiple choice score
Three fifths (59 per cent) of those who felt strongly that school had provided them with nothing useful had a desire to further their education: this group was the most likely to agree with the second statement, saying they wished they had continued on in education to a higher level. Across the whole population of 16-65 year-olds, 48 per cent felt they should have carried on with their education. Respondents who had already studied past the age of 18 naturally had less reason to agree with this statement (38 per cent). Conversely, people who were out of work were more likely than average to feel that they should have carried on (52 per cent); in fact, two fifths (41 per cent) of those who were unemployed and actively seeking work were in strong
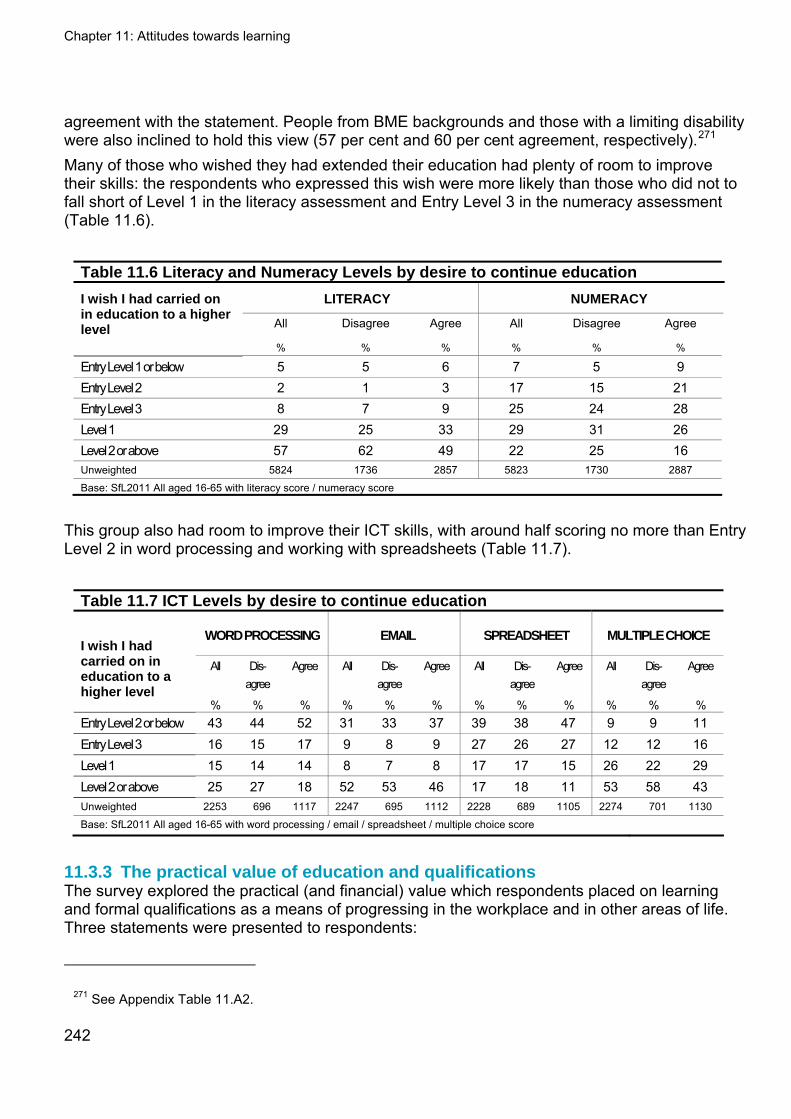
Chapter 11: Attitudes towards learning
242
agreement with the statement. People from BME backgrounds and those with a limiting disability were also inclined to hold this view (57 per cent and 60 per cent agreement, respectively).271 Many of those who wished they had extended their education had plenty of room to improve their skills: the respondents who expressed this wish were more likely than those who did not to fall short of Level 1 in the literacy assessment and Entry Level 3 in the numeracy assessment (Table 11.6).
Table 11.6 Literacy and Numeracy Levels by desire to continue education
LITERACY NUMERACY
All Disagree Agree All Disagree Agree
I wish I had carried on in education to a higher level
% % % % % %
Entry Level 1 or below 5 5 6 7 5 9 Entry Level 2 2 1 3 17 15 21 Entry Level 3 8 7 9 25 24 28 Level 1 29 25 33 29 31 26 Level 2 or above 57 62 49 22 25 16 Unweighted 5824 1736 2857 5823 1730 2887
Base: SfL2011 All aged 16-65 with literacy score / numeracy score
This group also had room to improve their ICT skills, with around half scoring no more than Entry Level 2 in word processing and working with spreadsheets (Table 11.7).
Table 11.7 ICT Levels by desire to continue education
WORD PROCESSING EMAIL SPREADSHEET MULTIPLE CHOICE
All Dis-agree
Agree All Dis-agree
Agree All Dis-agree
Agree All Dis-agree
Agree I wish I had carried on in education to a higher level
% % % % % % % % % % % % Entry Level 2 or below 43 44 52 31 33 37 39 38 47 9 9 11 Entry Level 3 16 15 17 9 8 9 27 26 27 12 12 16 Level 1 15 14 14 8 7 8 17 17 15 26 22 29 Level 2 or above 25 27 18 52 53 46 17 18 11 53 58 43 Unweighted 2253 696 1117 2247 695 1112 2228 689 1105 2274 701 1130
Base: SfL2011 All aged 16-65 with word processing / email / spreadsheet / multiple choice score
11.3.3 The practical value of education and qualifications The survey explored the practical (and financial) value which respondents placed on learning and formal qualifications as a means of progressing in the workplace and in other areas of life. Three statements were presented to respondents:
271 See Appendix Table 11.A2.
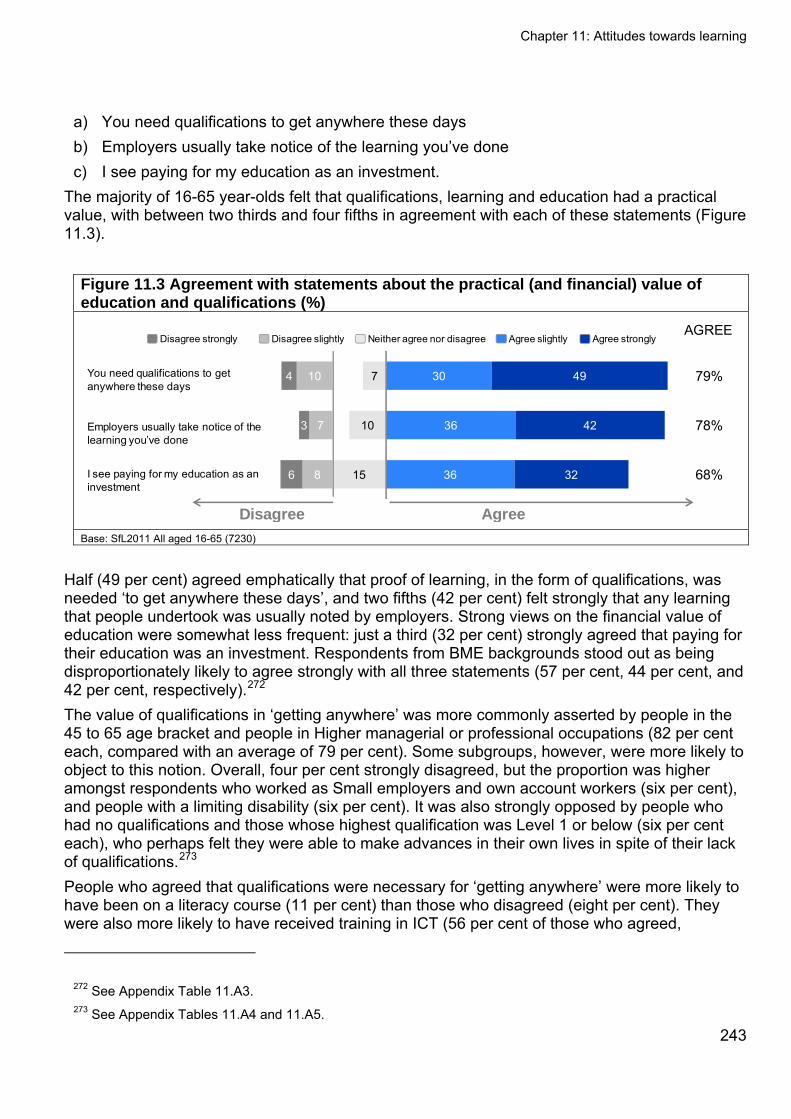
Chapter 11: Attitudes towards learning
a) You need qualifications to get anywhere these days b) Employers usually take notice of the learning you’ve done c) I see paying for my education as an investment.
The majority of 16-65 year-olds felt that qualifications, learning and education had a practical value, with between two thirds and four fifths in agreement with each of these statements (Figure 11.3).
Figure 11.3 Agreement with statements about the practical (and financial) value of education and qualifications (%)
7
10
15
10
7
8
4
3
6
30
36
36
49
42
32
You need qualifications to get anywhere these days
Employers usually take notice of the learning you’ve done
I see paying for my education as an investment
AgreeDisagree
AGREE
79%
78%
68%
Agree slightly Agree stronglyNeither agree nor disagreeDisagree slightlyDisagree strongly
Base: SfL2011 All aged 16-65 (7230)
Half (49 per cent) agreed emphatically that proof of learning, in the form of qualifications, was needed ‘to get anywhere these days’, and two fifths (42 per cent) felt strongly that any learning that people undertook was usually noted by employers. Strong views on the financial value of education were somewhat less frequent: just a third (32 per cent) strongly agreed that paying for their education was an investment. Respondents from BME backgrounds stood out as being disproportionately likely to agree strongly with all three statements (57 per cent, 44 per cent, and 42 per cent, respectively).272 The value of qualifications in ‘getting anywhere’ was more commonly asserted by people in the 45 to 65 age bracket and people in Higher managerial or professional occupations (82 per cent each, compared with an average of 79 per cent). Some subgroups, however, were more likely to object to this notion. Overall, four per cent strongly disagreed, but the proportion was higher amongst respondents who worked as Small employers and own account workers (six per cent), and people with a limiting disability (six per cent). It was also strongly opposed by people who had no qualifications and those whose highest qualification was Level 1 or below (six per cent each), who perhaps felt they were able to make advances in their own lives in spite of their lack of qualifications.273 People who agreed that qualifications were necessary for ‘getting anywhere’ were more likely to have been on a literacy course (11 per cent) than those who disagreed (eight per cent). They were also more likely to have received training in ICT (56 per cent of those who agreed,
272 See Appendix Table 11.A3. 273 See Appendix Tables 11.A4 and 11.A5.
243
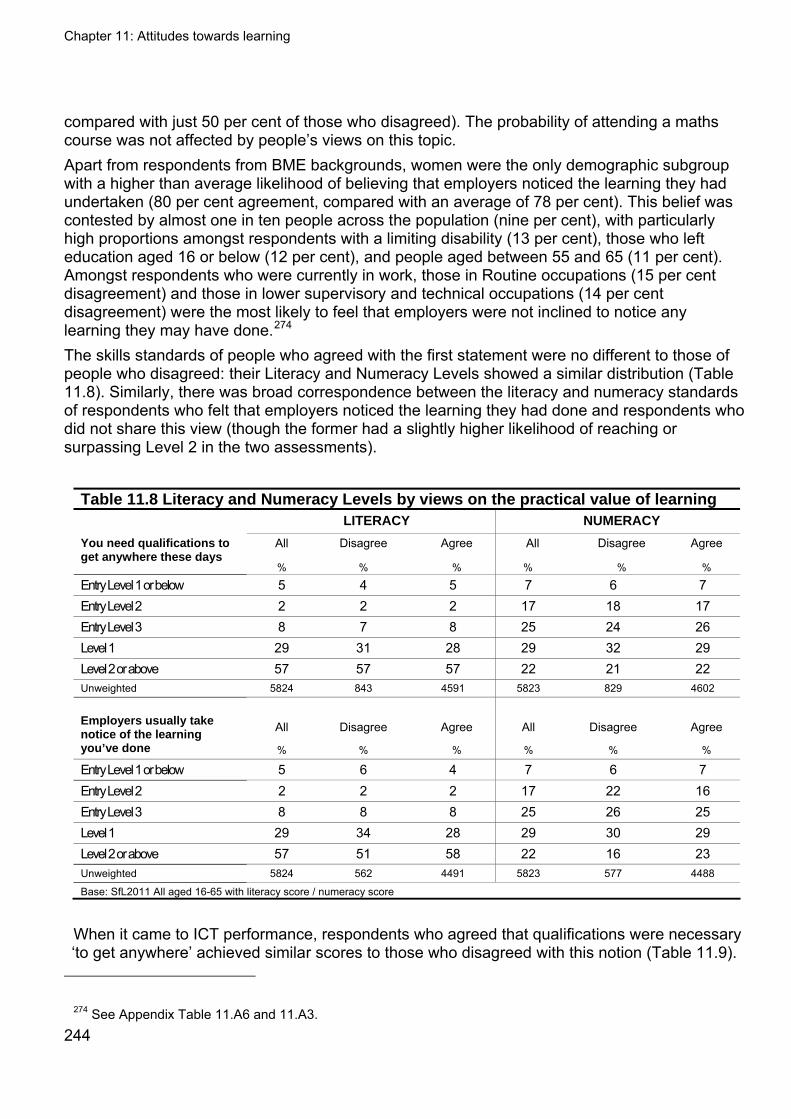
Chapter 11: Attitudes towards learning
compared with just 50 per cent of those who disagreed). The probability of attending a maths course was not affected by people’s views on this topic. Apart from respondents from BME backgrounds, women were the only demographic subgroup with a higher than average likelihood of believing that employers noticed the learning they had undertaken (80 per cent agreement, compared with an average of 78 per cent). This belief was contested by almost one in ten people across the population (nine per cent), with particularly high proportions amongst respondents with a limiting disability (13 per cent), those who left education aged 16 or below (12 per cent), and people aged between 55 and 65 (11 per cent). Amongst respondents who were currently in work, those in Routine occupations (15 per cent disagreement) and those in lower supervisory and technical occupations (14 per cent disagreement) were the most likely to feel that employers were not inclined to notice any learning they may have done.274 The skills standards of people who agreed with the first statement were no different to those of people who disagreed: their Literacy and Numeracy Levels showed a similar distribution (Table 11.8). Similarly, there was broad correspondence between the literacy and numeracy standards of respondents who felt that employers noticed the learning they had done and respondents who did not share this view (though the former had a slightly higher likelihood of reaching or surpassing Level 2 in the two assessments).
Table 11.8 Literacy and Numeracy Levels by views on the practical value of learning LITERACY NUMERACY
All Disagree Agree All Disagree Agree You need qualifications to get anywhere these days
% % % % % %
Entry Level 1 or below 5 4 5 7 6 7 Entry Level 2 2 2 2 17 18 17 Entry Level 3 8 7 8 25 24 26 Level 1 29 31 28 29 32 29 Level 2 or above 57 57 57 22 21 22 Unweighted 5824 843 4591 5823 829 4602
All Disagree Agree All Disagree Agree Employers usually take
notice of the learning you’ve done % % % % % %
Entry Level 1 or below 5 6 4 7 6 7 Entry Level 2 2 2 2 17 22 16 Entry Level 3 8 8 8 25 26 25 Level 1 29 34 28 29 30 29 Level 2 or above 57 51 58 22 16 23 Unweighted 5824 562 4491 5823 577 4488
Base: SfL2011 All aged 16-65 with literacy score / numeracy score
When it came to ICT performance, respondents who agreed that qualifications were necessary ‘to get anywhere’ achieved similar scores to those who disagreed with this notion (Table 11.9).
244
274 See Appendix Table 11.A6 and 11.A3.

Chapter 11: Attitudes towards learning
245
However, there were differences in ICT skills between people who felt that employers took notice of any learning they had done, and those who felt they did not take notice. The two groups performed alike in the spreadsheet and multiple choice components of the assessment, but those who felt their employers were indifferent to any learning they achieved were more likely to fall short of Entry Level 3 in word processing and email.
Table 11.9 ICT Levels by views on the practical value of learning WORD PROCESSING EMAIL SPREADSHEET MULTIPLE CHOICE
All Dis-agree
Agree
All Dis-agree
Agree
All Dis-agree
Agree
All Dis-agree
Agree
You need qualifications to get anywhere these days
% % % % % % % % % % % %
Entry Level 2 or below 43 45 43 31 31 31 39 36 40 9 10 9 Entry Level 3 16 17 16 9 10 8 27 29 27 12 15 12 Level 1 15 14 16 8 7 8 17 18 17 26 25 27 Level 2 or above 25 23 26 52 53 52 17 17 17 53 50 53 Unweighted 2253 333 1778 2247 334 1773 2228 330 1759 2274 339 1793
All Dis-agree
Agree
All Dis-agree
Agree
All Dis-agree
Agree
All Dis-agree
Agree
Employers usually take notice of the learning you’ve done
% % % % % % % % % % % %
Entry Level 2 or below 43 50 42 31 40 29 39 44 38 9 8 9 Entry Level 3 16 20 16 9 12 8 27 27 27 12 15 12 Level 1 15 12 16 8 7 8 17 15 17 26 28 26 Level 2 or above 25 19 26 52 41 55 17 14 18 53 49 53 Unweighted 2253 216 1764 2247 218 1758 2228 214 1744 2274 220 1779
Base: SfL2011 All aged 16-65 with word processing / email / spreadsheet / multiple choice score
Respondents were more ambivalent regarding the third statement than either of the two previous ones. Fifteen per cent neither agreed nor disagreed that paying for their education was a worthwhile investment. People who finished their education when they were 18 or younger were more likely to give this answer (17 per cent), possibly because few in this group had personal experience of having to invest financially in their own education. Generally speaking, people who had stayed in education for longer were more inclined to view education as something worth paying for (Table 11.10). People with BME backgrounds were also more likely than average to recognise the potential of education as a worthwhile investment (76 per cent agreement, compared with 68 per cent overall).
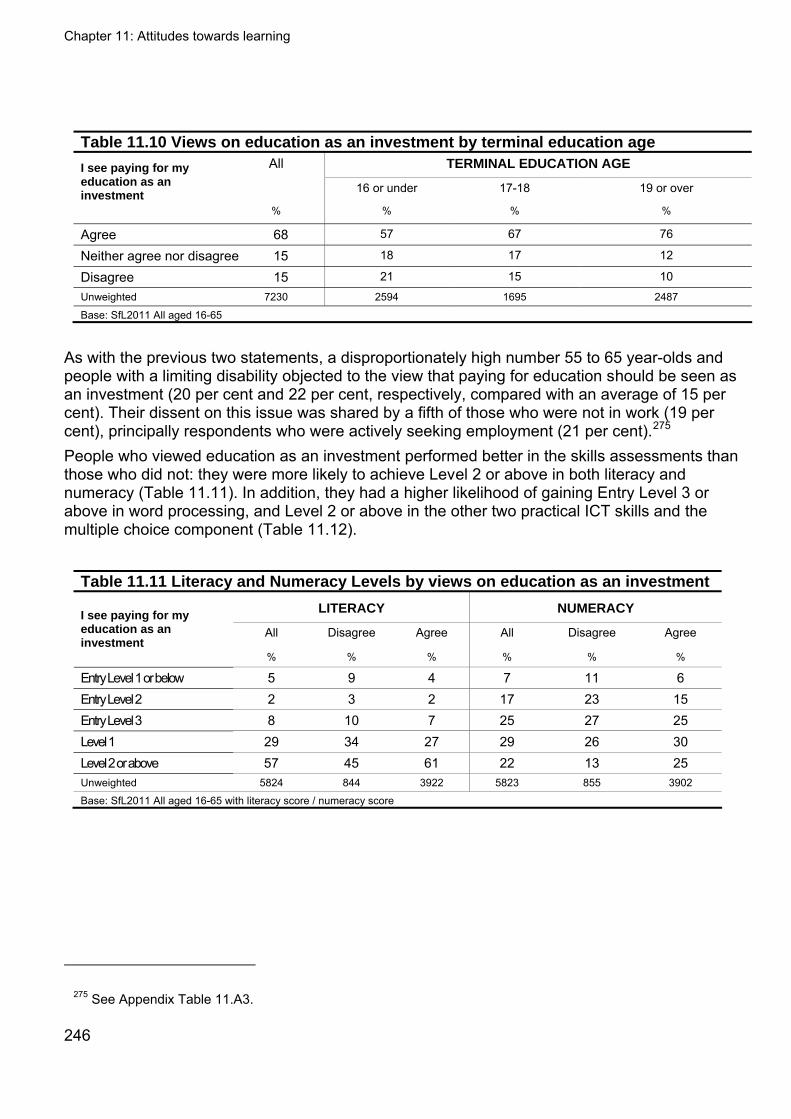
Chapter 11: Attitudes towards learning
246
Table 11.10 Views on education as an investment by terminal education age
TERMINAL EDUCATION AGE All
16 or under 17-18 19 or over
I see paying for my education as an investment
% % % %
Agree 68 57 67 76
Neither agree nor disagree 15 18 17 12
Disagree 15 21 15 10
Unweighted 7230 2594 1695 2487
Base: SfL2011 All aged 16-65
As with the previous two statements, a disproportionately high number 55 to 65 year-olds and people with a limiting disability objected to the view that paying for education should be seen as an investment (20 per cent and 22 per cent, respectively, compared with an average of 15 per cent). Their dissent on this issue was shared by a fifth of those who were not in work (19 per cent), principally respondents who were actively seeking employment (21 per cent).275 People who viewed education as an investment performed better in the skills assessments than those who did not: they were more likely to achieve Level 2 or above in both literacy and numeracy (Table 11.11). In addition, they had a higher likelihood of gaining Entry Level 3 or above in word processing, and Level 2 or above in the other two practical ICT skills and the multiple choice component (Table 11.12).
Table 11.11 Literacy and Numeracy Levels by views on education as an investment
LITERACY NUMERACY
All Disagree Agree All Disagree Agree I see paying for my education as an investment
% % % % % %
Entry Level 1 or below 5 9 4 7 11 6 Entry Level 2 2 3 2 17 23 15 Entry Level 3 8 10 7 25 27 25 Level 1 29 34 27 29 26 30 Level 2 or above 57 45 61 22 13 25 Unweighted 5824 844 3922 5823 855 3902
Base: SfL2011 All aged 16-65 with literacy score / numeracy score
275 See Appendix Table 11.A3.
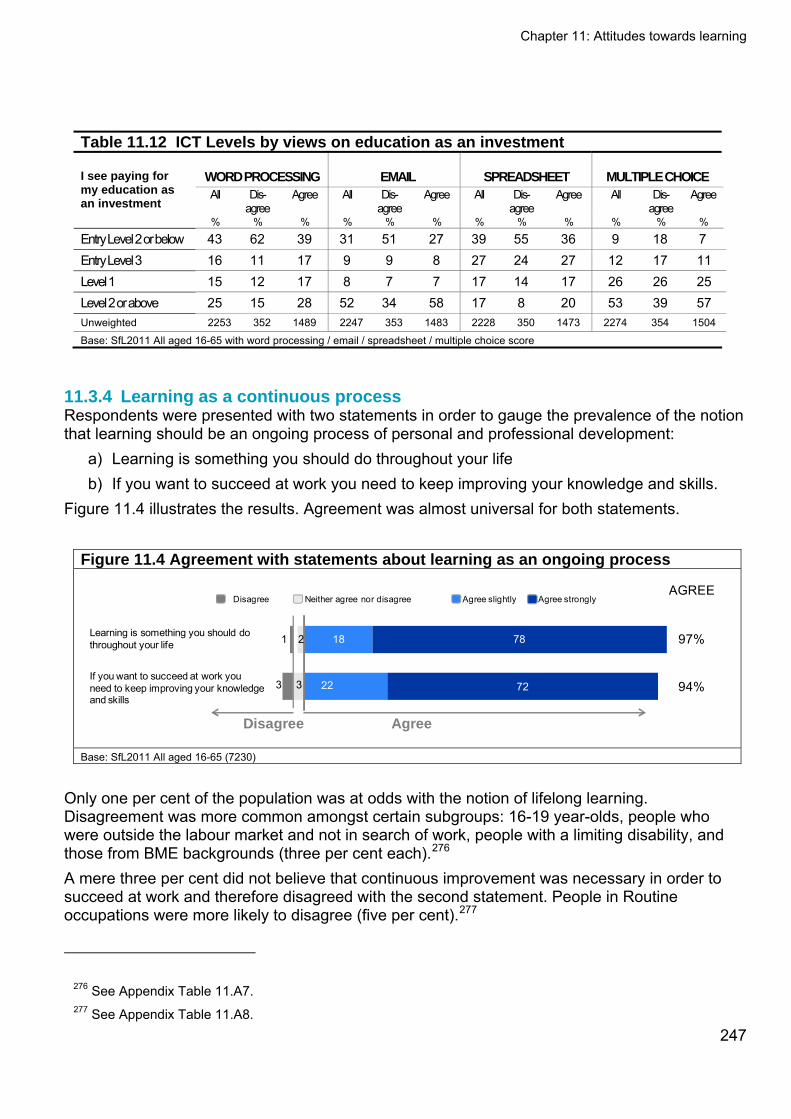
Chapter 11: Attitudes towards learning
Table 11.12 ICT Levels by views on education as an investment
WORD PROCESSING EMAIL SPREADSHEET MULTIPLE CHOICE All Dis-
agree Agree
All Dis-
agree Agree
All Dis-
agree Agree
All Dis-
agree Agree
I see paying for my education as an investment
% % % % % % % % % % % %
Entry Level 2 or below 43 62 39 31 51 27 39 55 36 9 18 7 Entry Level 3 16 11 17 9 9 8 27 24 27 12 17 11 Level 1 15 12 17 8 7 7 17 14 17 26 26 25 Level 2 or above 25 15 28 52 34 58 17 8 20 53 39 57 Unweighted 2253 352 1489 2247 353 1483 2228 350 1473 2274 354 1504
Base: SfL2011 All aged 16-65 with word processing / email / spreadsheet / multiple choice score
11.3.4 Learning as a continuous process Respondents were presented with two statements in order to gauge the prevalence of the notion that learning should be an ongoing process of personal and professional development:
a) Learning is something you should do throughout your life b) If you want to succeed at work you need to keep improving your knowledge and skills.
Figure 11.4 illustrates the results. Agreement was almost universal for both statements.
Figure 11.4 Agreement with statements about learning as an ongoing process
2
3
1
3
18
22
78
72
Learning is something you should do throughout your life
If you want to succeed at work you need to keep improving your knowledge and skills
AgreeDisagree
AGREE
97%
94%
Agree slightly Agree stronglyNeither agree nor disagreeDisagree
Base: SfL2011 All aged 16-65 (7230)
Only one per cent of the population was at odds with the notion of lifelong learning. Disagreement was more common amongst certain subgroups: 16-19 year-olds, people who were outside the labour market and not in search of work, people with a limiting disability, and those from BME backgrounds (three per cent each).276 A mere three per cent did not believe that continuous improvement was necessary in order to succeed at work and therefore disagreed with the second statement. People in Routine occupations were more likely to disagree (five per cent).277
276 See Appendix Table 11.A7. 277 See Appendix Table 11.A8.
247
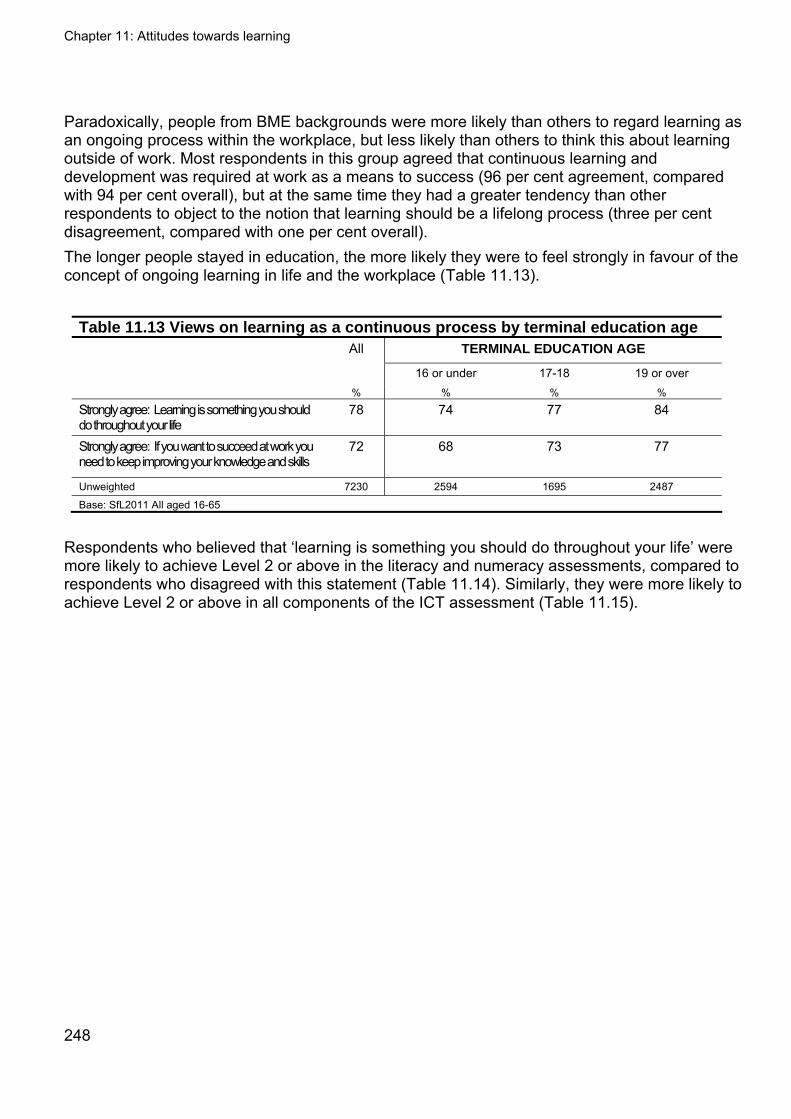
Chapter 11: Attitudes towards learning
248
Paradoxically, people from BME backgrounds were more likely than others to regard learning as an ongoing process within the workplace, but less likely than others to think this about learning outside of work. Most respondents in this group agreed that continuous learning and development was required at work as a means to success (96 per cent agreement, compared with 94 per cent overall), but at the same time they had a greater tendency than other respondents to object to the notion that learning should be a lifelong process (three per cent disagreement, compared with one per cent overall). The longer people stayed in education, the more likely they were to feel strongly in favour of the concept of ongoing learning in life and the workplace (Table 11.13).
Table 11.13 Views on learning as a continuous process by terminal education age TERMINAL EDUCATION AGE All
16 or under 17-18 19 or over % % % %
Strongly agree: Learning is something you should do throughout your life
78 74 77 84
Strongly agree: If you want to succeed at work you need to keep improving your knowledge and skills
72 68 73 77
Unweighted 7230 2594 1695 2487
Base: SfL2011 All aged 16-65
Respondents who believed that ‘learning is something you should do throughout your life’ were more likely to achieve Level 2 or above in the literacy and numeracy assessments, compared to respondents who disagreed with this statement (Table 11.14). Similarly, they were more likely to achieve Level 2 or above in all components of the ICT assessment (Table 11.15).
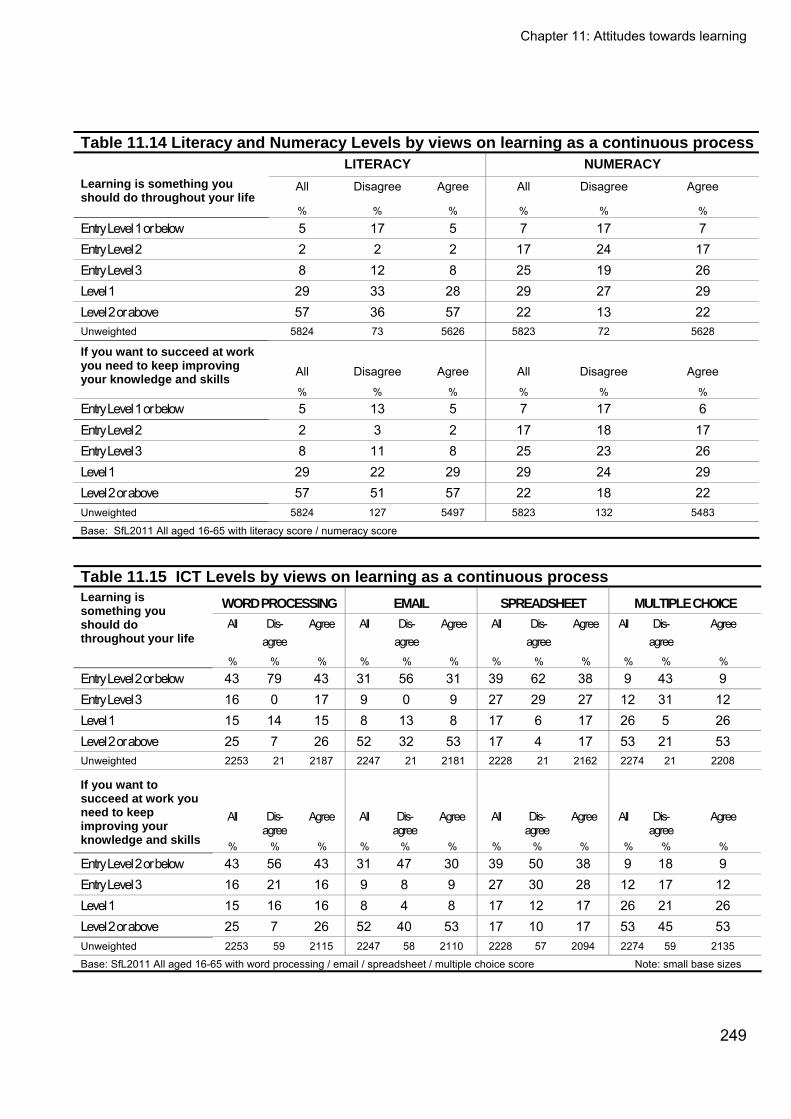
Chapter 11: Attitudes towards learning
Table 11.14 Literacy and Numeracy Levels by views on learning as a continuous process LITERACY NUMERACY
All Disagree Agree All Disagree Agree Learning is something you should do throughout your life
% % % % % %
Entry Level 1 or below 5 17 5 7 17 7 Entry Level 2 2 2 2 17 24 17 Entry Level 3 8 12 8 25 19 26 Level 1 29 33 28 29 27 29 Level 2 or above 57 36 57 22 13 22 Unweighted 5824 73 5626 5823 72 5628
All Disagree Agree All Disagree Agree If you want to succeed at work you need to keep improving your knowledge and skills
% % % % % %
Entry Level 1 or below 5 13 5 7 17 6 Entry Level 2 2 3 2 17 18 17 Entry Level 3 8 11 8 25 23 26 Level 1 29 22 29 29 24 29 Level 2 or above 57 51 57 22 18 22 Unweighted 5824 127 5497 5823 132 5483
Base: SfL2011 All aged 16-65 with literacy score / numeracy score
Table 11.15 ICT Levels by views on learning as a continuous process
WORD PROCESSING EMAIL SPREADSHEET MULTIPLE CHOICE Learning is something you should do throughout your life
All Dis-agree
Agree All Dis-agree
Agree All Dis-agree
Agree All Dis-agree
Agree
% % % % % % % % % % % %
Entry Level 2 or below 43 79 43 31 56 31 39 62 38 9 43 9 Entry Level 3 16 0 17 9 0 9 27 29 27 12 31 12 Level 1 15 14 15 8 13 8 17 6 17 26 5 26 Level 2 or above 25 7 26 52 32 53 17 4 17 53 21 53 Unweighted 2253 21 2187 2247 21 2181 2228 21 2162 2274 21 2208
All Dis-agree
Agree All Dis-agree
Agree All Dis-agree
Agree All Dis-agree
Agree
If you want to succeed at work you need to keep improving your knowledge and skills % % % % % % % % % % % %
Entry Level 2 or below 43 56 43 31 47 30 39 50 38 9 18 9 Entry Level 3 16 21 16 9 8 9 27 30 28 12 17 12 Level 1 15 16 16 8 4 8 17 12 17 26 21 26 Level 2 or above 25 7 26 52 40 53 17 10 17 53 45 53 Unweighted 2253 59 2115 2247 58 2110 2228 57 2094 2274 59 2135
Base: SfL2011 All aged 16-65 with word processing / email / spreadsheet / multiple choice score Note: small base sizes
249
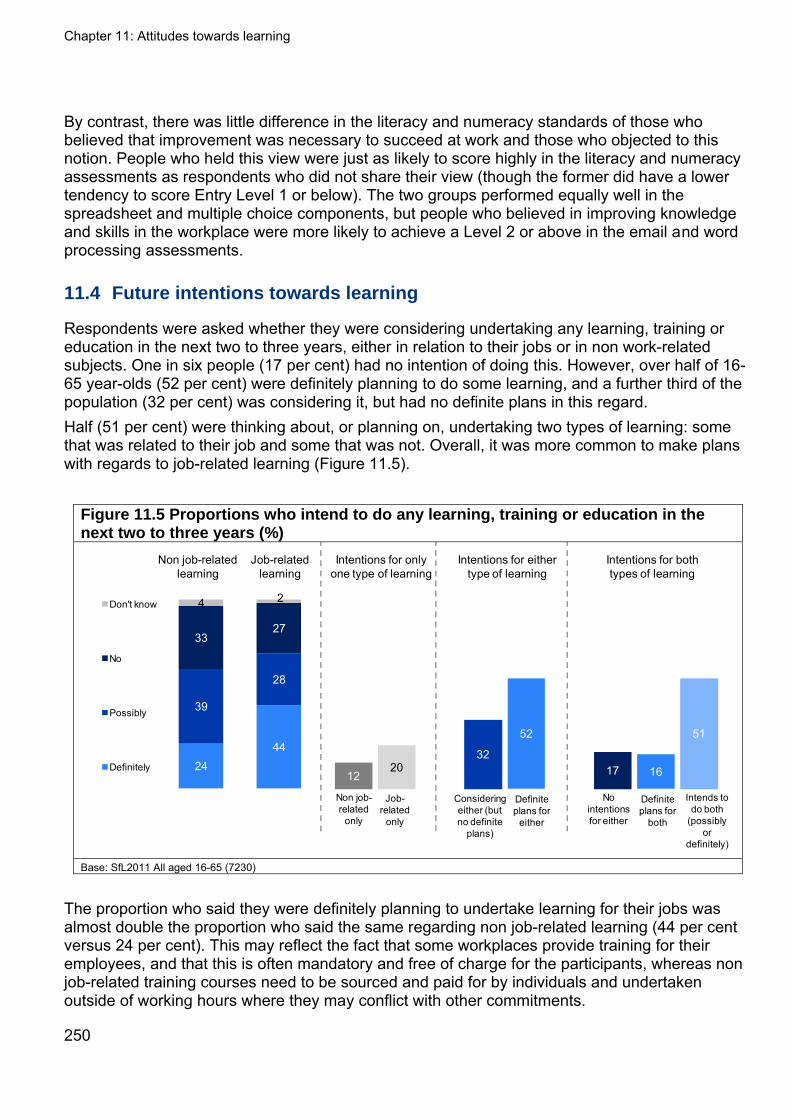
Chapter 11: Attitudes towards learning
By contrast, there was little difference in the literacy and numeracy standards of those who believed that improvement was necessary to succeed at work and those who objected to this notion. People who held this view were just as likely to score highly in the literacy and numeracy assessments as respondents who did not share their view (though the former did have a lower tendency to score Entry Level 1 or below). The two groups performed equally well in the spreadsheet and multiple choice components, but people who believed in improving knowledge and skills in the workplace were more likely to achieve a Level 2 or above in the email and word processing assessments.
11.4 Future intentions towards learning
Respondents were asked whether they were considering undertaking any learning, training or education in the next two to three years, either in relation to their jobs or in non work-related subjects. One in six people (17 per cent) had no intention of doing this. However, over half of 16-65 year-olds (52 per cent) were definitely planning to do some learning, and a further third of the population (32 per cent) was considering it, but had no definite plans in this regard. Half (51 per cent) were thinking about, or planning on, undertaking two types of learning: some that was related to their job and some that was not. Overall, it was more common to make plans with regards to job-related learning (Figure 11.5).
Figure 11.5 Proportions who intend to do any learning, training or education in the next two to three years (%)
4424
28
39
2733
24Don't know
No
Possibly
Definitely
Job-related learning
Non job-related learning
51
1617
52
3220
12
No intentions for either
Considering either (but no definite
plans)
Intends to do both
(possibly or
definitely)
Definite plans for
either
Intentions for only one type of learning
Intentions for both types of learning
Non job-related
only
Job-related
only
Intentions for either type of learning
Definite plans for
both
Base: SfL2011 All aged 16-65 (7230)
The proportion who said they were definitely planning to undertake learning for their jobs was almost double the proportion who said the same regarding non job-related learning (44 per cent versus 24 per cent). This may reflect the fact that some workplaces provide training for their employees, and that this is often mandatory and free of charge for the participants, whereas non job-related training courses need to be sourced and paid for by individuals and undertaken outside of working hours where they may conflict with other commitments.
250

Chapter 11: Attitudes towards learning
251
Many of those who strongly supported the idea that ‘Learning is something you should do throughout your life’ translated this attitude into a definite plan to undertake learning. They were more likely than others to be planning on taking courses or training related to their job (47 per cent, compared with an average of 44 per cent who said they would ‘definitely’ do some job-related learning) and more likely to want to undertake learning unrelated to work (26 per cent, compared with an average of 24 per cent who said they would ‘definitely’ do some non job-related learning). Similarly, almost half of those who were strongly in agreement with the statement ‘If you want to succeed at work you need to keep improving your knowledge and skills’ had definite plans to do courses or training related to their job (49 per cent, compared with an average of 44 per cent). People who remained in education longer were not only more likely to agree with the two statements regarding ongoing learning (see Section 11.3.4), but also to have definite plans for their own future learning (Table 11.16).
Table 11.16 Proportions with definite plans for future learning by terminal education age
TERMINAL EDUCATION AGE All 16 or under 17-18 19 or over
% % % %
Job-related learning 44 30 45 52 Non job-related learning 24 19 24 26 Unweighted 7230 2594 1695 2487
Base: SfL2011 All aged 16-65
Respondents in search of work arguably have the most to gain by equipping themselves with job-related skills, as these skills could help them secure employment. It is not surprising to find that people in search of work were therefore the most inclined to say that they definitely wanted to undertake job-related training (55 per cent, compared with an average of 44 per cent agreement). On the other hand, people in certain types of employment were more likely than other respondents to have no intentions regarding job-related learning in the future: this was true of Small employers and own account workers, and people in Routine or Intermediate occupations (37 per cent, 32 per cent, and 27 per cent, respectively, compared with an average of 23 per cent disagreement amongst respondents in work).278 One group stood out as being particularly unlikely to have any plans to undertake training or courses: respondents aged 55 to 65. Two thirds of this group had no intention of doing any training in association with their job (64 per cent, compared with an average of 27 per cent who said they had no plans). Moreover, two fifths of 55- 65 year-olds had no plans for future learning in other subjects (42 per cent, compared with an average of 33 per cent who said they had no plans). This age group’s tendency to have a negative outlook on learning (see Section 11.3.1) might partly account for their propensity to avoid making plans for future learning. Respondents who had a limiting disability were likewise indifferent towards the prospect of future learning,
278 See Appendix Table 11.A9.
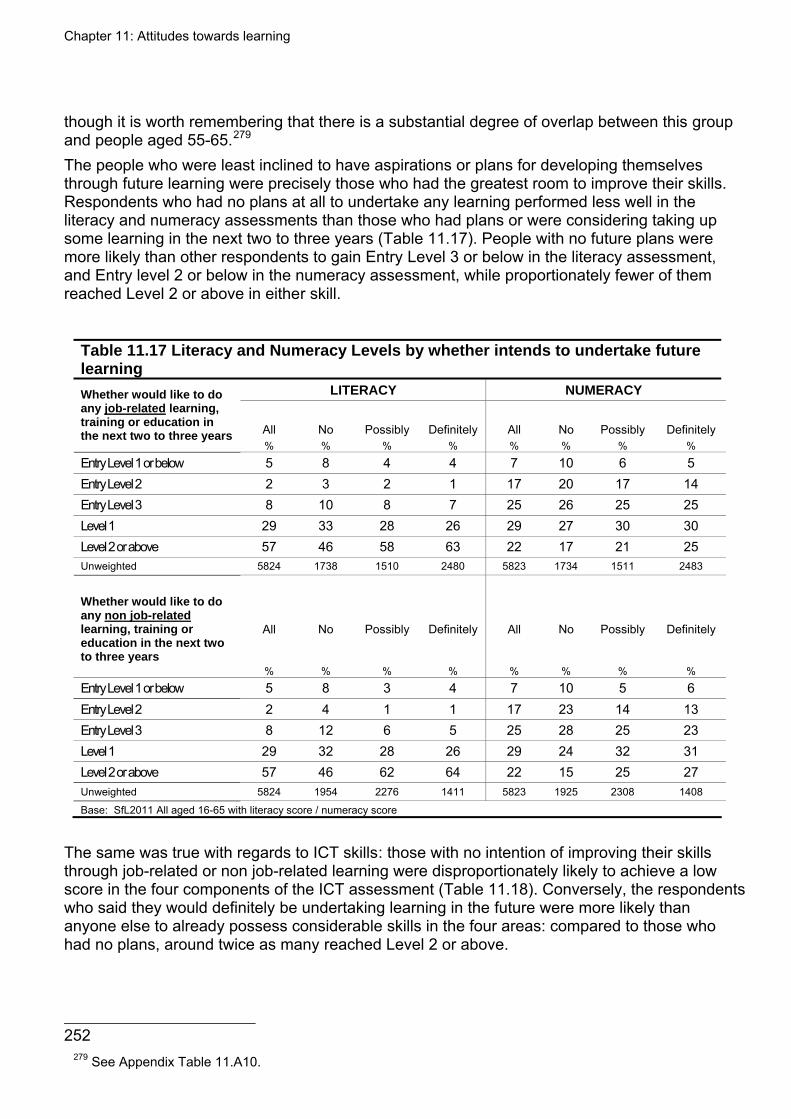
Chapter 11: Attitudes towards learning
252
though it is worth remembering that there is a substantial degree of overlap between this group and people aged 55-65.279 The people who were least inclined to have aspirations or plans for developing themselves through future learning were precisely those who had the greatest room to improve their skills. Respondents who had no plans at all to undertake any learning performed less well in the literacy and numeracy assessments than those who had plans or were considering taking up some learning in the next two to three years (Table 11.17). People with no future plans were more likely than other respondents to gain Entry Level 3 or below in the literacy assessment, and Entry level 2 or below in the numeracy assessment, while proportionately fewer of them reached Level 2 or above in either skill.
Table 11.17 Literacy and Numeracy Levels by whether intends to undertake future learning
LITERACY NUMERACY
All
No
Possibly
Definitely
All
No
Possibly
Definitely
Whether would like to do any job-related learning, training or education in the next two to three years
% % % % % % % %
Entry Level 1 or below 5 8 4 4 7 10 6 5 Entry Level 2 2 3 2 1 17 20 17 14 Entry Level 3 8 10 8 7 25 26 25 25 Level 1 29 33 28 26 29 27 30 30 Level 2 or above 57 46 58 63 22 17 21 25 Unweighted 5824 1738 1510 2480 5823 1734 1511 2483
All
No
Possibly
Definitely
All
No
Possibly
Definitely
Whether would like to do any non job-related learning, training or education in the next two to three years
% % % % % % % %
Entry Level 1 or below 5 8 3 4 7 10 5 6 Entry Level 2 2 4 1 1 17 23 14 13 Entry Level 3 8 12 6 5 25 28 25 23 Level 1 29 32 28 26 29 24 32 31 Level 2 or above 57 46 62 64 22 15 25 27 Unweighted 5824 1954 2276 1411 5823 1925 2308 1408
Base: SfL2011 All aged 16-65 with literacy score / numeracy score
The same was true with regards to ICT skills: those with no intention of improving their skills through job-related or non job-related learning were disproportionately likely to achieve a low score in the four components of the ICT assessment (Table 11.18). Conversely, the respondents who said they would definitely be undertaking learning in the future were more likely than anyone else to already possess considerable skills in the four areas: compared to those who had no plans, around twice as many reached Level 2 or above.
279 See Appendix Table 11.A10.
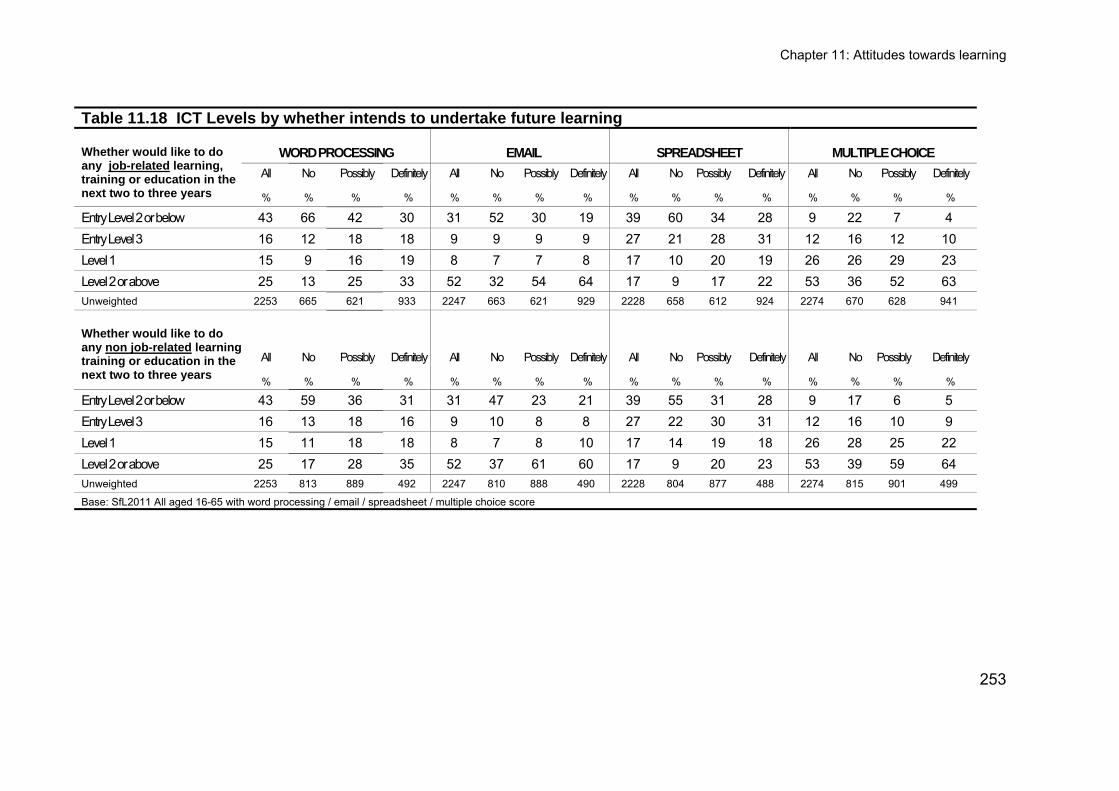
Chapter 11: Attitudes towards learning
253
Table 11.18 ICT Levels by whether intends to undertake future learning
WORD PROCESSING EMAIL SPREADSHEET MULTIPLE CHOICE
All No Possibly Definitely All No Possibly Definitely All No Possibly Definitely All No Possibly Definitely
Whether would like to do any job-related learning, training or education in the next two to three years % % % % % % % % % % % % % % % %
Entry Level 2 or below 43 66 42 30 31 52 30 19 39 60 34 28 9 22 7 4 Entry Level 3 16 12 18 18 9 9 9 9 27 21 28 31 12 16 12 10 Level 1 15 9 16 19 8 7 7 8 17 10 20 19 26 26 29 23 Level 2 or above 25 13 25 33 52 32 54 64 17 9 17 22 53 36 52 63 Unweighted 2253 665 621 933 2247 663 621 929 2228 658 612 924 2274 670 628 941
All No Possibly Definitely All No Possibly Definitely All No Possibly Definitely All No Possibly Definitely
Whether would like to do any non job-related learningtraining or education in the next two to three years % % % % % % % % % % % % % % % %
Entry Level 2 or below 43 59 36 31 31 47 23 21 39 55 31 28 9 17 6 5 Entry Level 3 16 13 18 16 9 10 8 8 27 22 30 31 12 16 10 9 Level 1 15 11 18 18 8 7 8 10 17 14 19 18 26 28 25 22 Level 2 or above 25 17 28 35 52 37 61 60 17 9 20 23 53 39 59 64 Unweighted 2253 813 889 492 2247 810 888 490 2228 804 877 488 2274 815 901 499
Base: SfL2011 All aged 16-65 with word processing / email / spreadsheet / multiple choice score
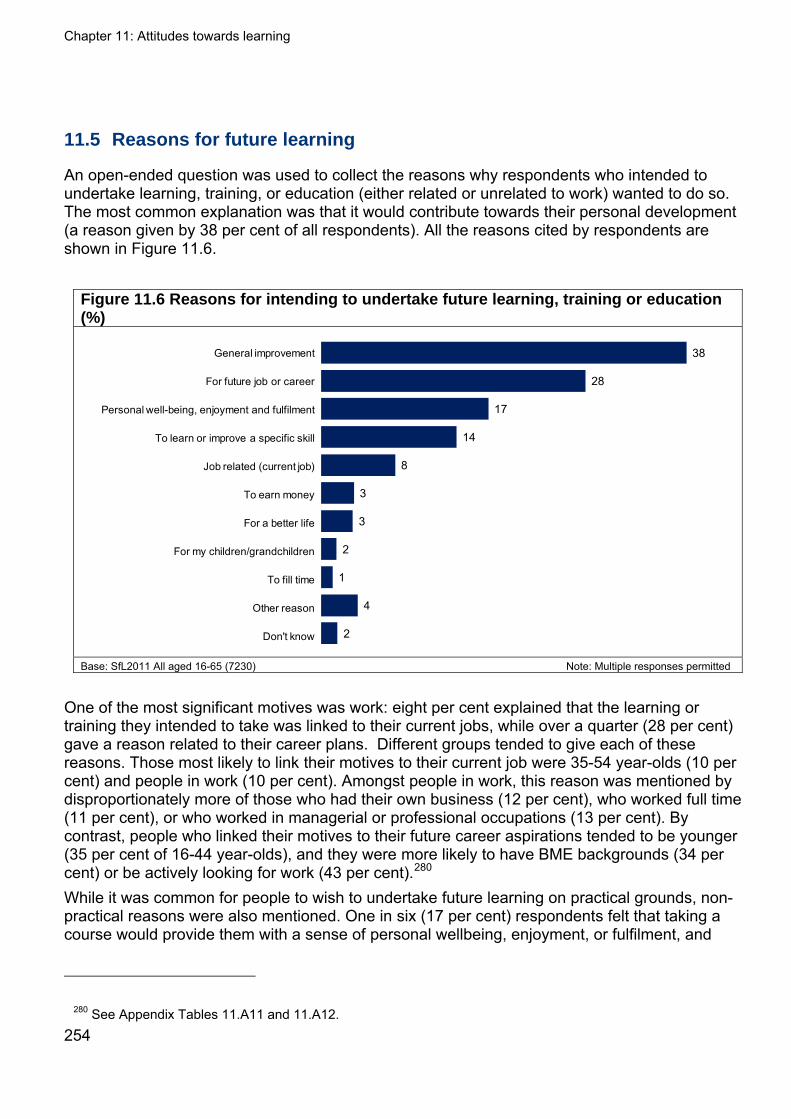
Chapter 11: Attitudes towards learning
11.5 Reasons for future learning
An open-ended question was used to collect the reasons why respondents who intended to undertake learning, training, or education (either related or unrelated to work) wanted to do so. The most common explanation was that it would contribute towards their personal development (a reason given by 38 per cent of all respondents). All the reasons cited by respondents are shown in Figure 11.6.
Figure 11.6 Reasons for intending to undertake future learning, training or education (%)
38
28
17
14
8
3
3
2
1
4
2
General improvement
For future job or career
Personal well-being, enjoyment and fulfilment
To learn or improve a specific skill
Job related (current job)
To earn money
For a better life
For my children/grandchildren
To fill time
Other reason
Don't know Base: SfL2011 All aged 16-65 (7230) Note: Multiple responses permitted
One of the most significant motives was work: eight per cent explained that the learning or training they intended to take was linked to their current jobs, while over a quarter (28 per cent) gave a reason related to their career plans. Different groups tended to give each of these reasons. Those most likely to link their motives to their current job were 35-54 year-olds (10 per cent) and people in work (10 per cent). Amongst people in work, this reason was mentioned by disproportionately more of those who had their own business (12 per cent), who worked full time (11 per cent), or who worked in managerial or professional occupations (13 per cent). By contrast, people who linked their motives to their future career aspirations tended to be younger (35 per cent of 16-44 year-olds), and they were more likely to have BME backgrounds (34 per cent) or be actively looking for work (43 per cent).280 While it was common for people to wish to undertake future learning on practical grounds, non-practical reasons were also mentioned. One in six (17 per cent) respondents felt that taking a course would provide them with a sense of personal wellbeing, enjoyment, or fulfilment, and
280 See Appendix Tables 11.A11 and 11.A12. 254
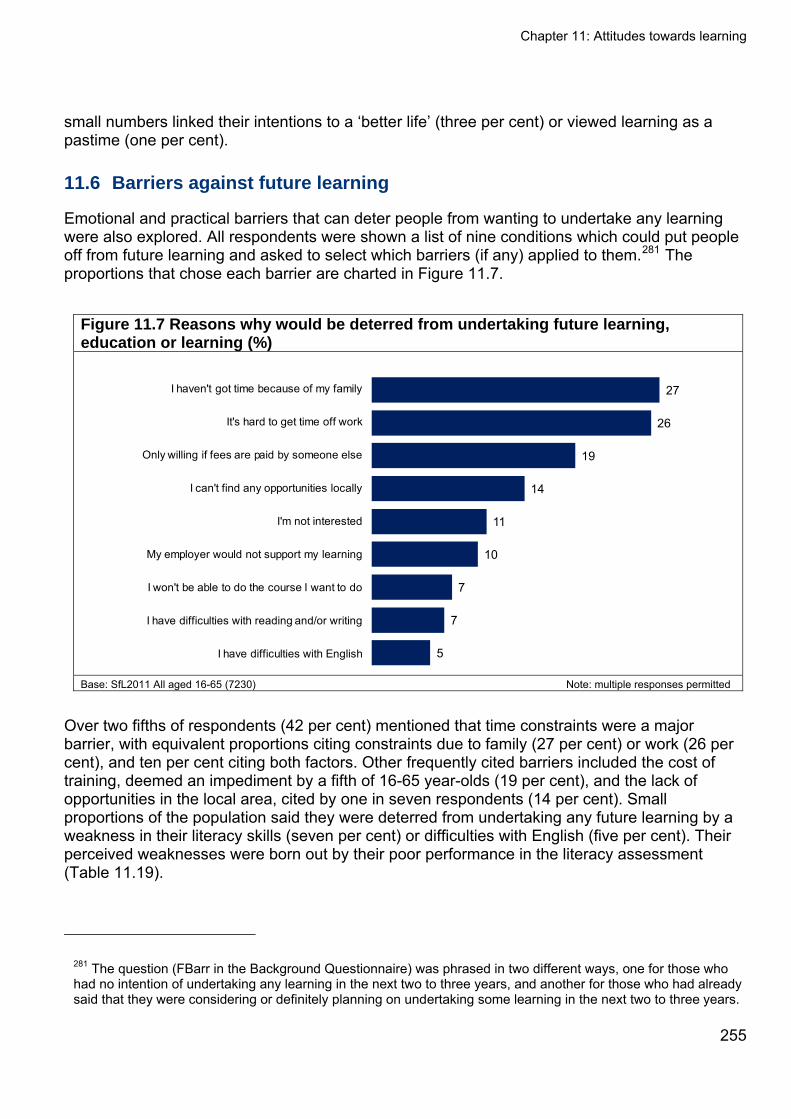
Chapter 11: Attitudes towards learning
small numbers linked their intentions to a ‘better life’ (three per cent) or viewed learning as a pastime (one per cent).
11.6 Barriers against future learning
Emotional and practical barriers that can deter people from wanting to undertake any learning were also explored. All respondents were shown a list of nine conditions which could put people off from future learning and asked to select which barriers (if any) applied to them.281 The proportions that chose each barrier are charted in Figure 11.7.
Figure 11.7 Reasons why would be deterred from undertaking future learning, education or learning (%)
27
26
19
14
11
10
7
7
5
I haven't got time because of my family
It's hard to get time off work
Only willing if fees are paid by someone else
I can't find any opportunities locally
I'm not interested
My employer would not support my learning
I won't be able to do the course I want to do
I have difficulties with reading and/or writing
I have difficulties with English
Base: SfL2011 All aged 16-65 (7230) Note: multiple responses permitted
Over two fifths of respondents (42 per cent) mentioned that time constraints were a major barrier, with equivalent proportions citing constraints due to family (27 per cent) or work (26 per cent), and ten per cent citing both factors. Other frequently cited barriers included the cost of training, deemed an impediment by a fifth of 16-65 year-olds (19 per cent), and the lack of opportunities in the local area, cited by one in seven respondents (14 per cent). Small proportions of the population said they were deterred from undertaking any future learning by a weakness in their literacy skills (seven per cent) or difficulties with English (five per cent). Their perceived weaknesses were born out by their poor performance in the literacy assessment (Table 11.19).
281 The question (FBarr in the Background Questionnaire) was phrased in two different ways, one for those who had no intention of undertaking any learning in the next two to three years, and another for those who had already said that they were considering or definitely planning on undertaking some learning in the next two to three years.
255
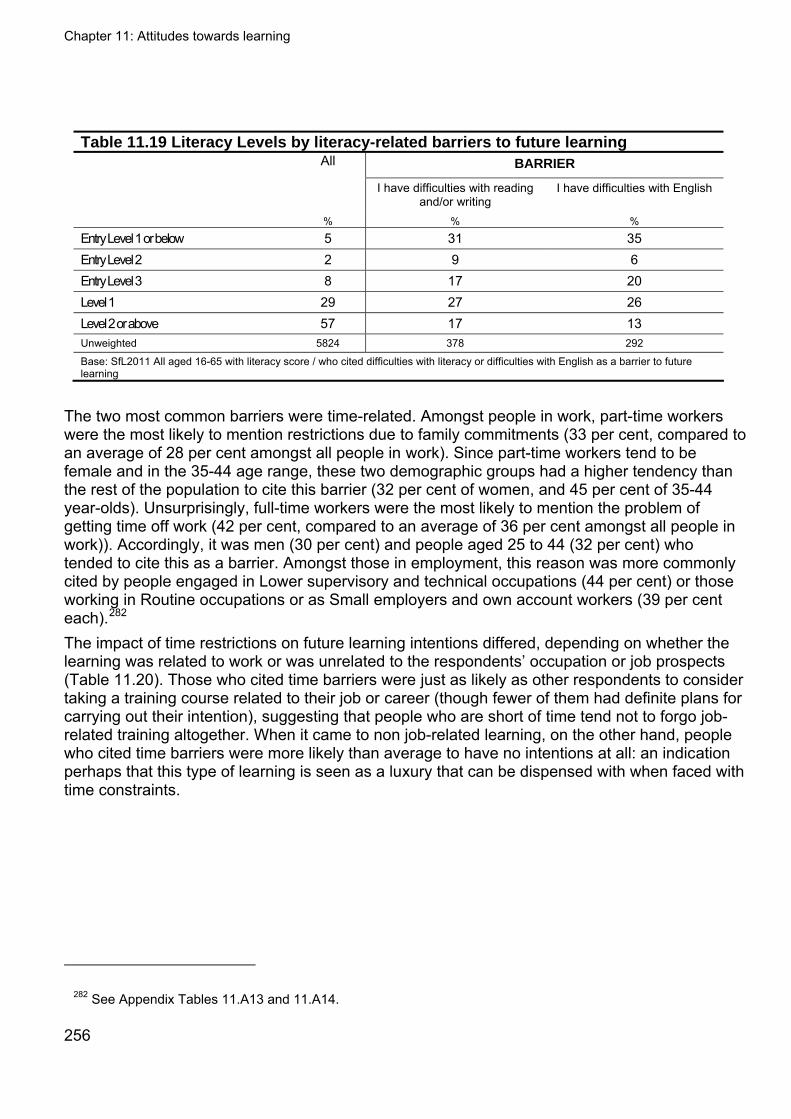
Chapter 11: Attitudes towards learning
256
Table 11.19 Literacy Levels by literacy-related barriers to future learning
BARRIER All
I have difficulties with reading and/or writing
I have difficulties with English
% % %
Entry Level 1 or below 5 31 35 Entry Level 2 2 9 6 Entry Level 3 8 17 20 Level 1 29 27 26 Level 2 or above 57 17 13 Unweighted 5824 378 292
Base: SfL2011 All aged 16-65 with literacy score / who cited difficulties with literacy or difficulties with English as a barrier to future learning
The two most common barriers were time-related. Amongst people in work, part-time workers were the most likely to mention restrictions due to family commitments (33 per cent, compared to an average of 28 per cent amongst all people in work). Since part-time workers tend to be female and in the 35-44 age range, these two demographic groups had a higher tendency than the rest of the population to cite this barrier (32 per cent of women, and 45 per cent of 35-44 year-olds). Unsurprisingly, full-time workers were the most likely to mention the problem of getting time off work (42 per cent, compared to an average of 36 per cent amongst all people in work)). Accordingly, it was men (30 per cent) and people aged 25 to 44 (32 per cent) who tended to cite this as a barrier. Amongst those in employment, this reason was more commonly cited by people engaged in Lower supervisory and technical occupations (44 per cent) or those working in Routine occupations or as Small employers and own account workers (39 per cent each).282 The impact of time restrictions on future learning intentions differed, depending on whether the learning was related to work or was unrelated to the respondents’ occupation or job prospects (Table 11.20). Those who cited time barriers were just as likely as other respondents to consider taking a training course related to their job or career (though fewer of them had definite plans for carrying out their intention), suggesting that people who are short of time tend not to forgo job-related training altogether. When it came to non job-related learning, on the other hand, people who cited time barriers were more likely than average to have no intentions at all: an indication perhaps that this type of learning is seen as a luxury that can be dispensed with when faced with time constraints.
282 See Appendix Tables 11.A13 and 11.A14.
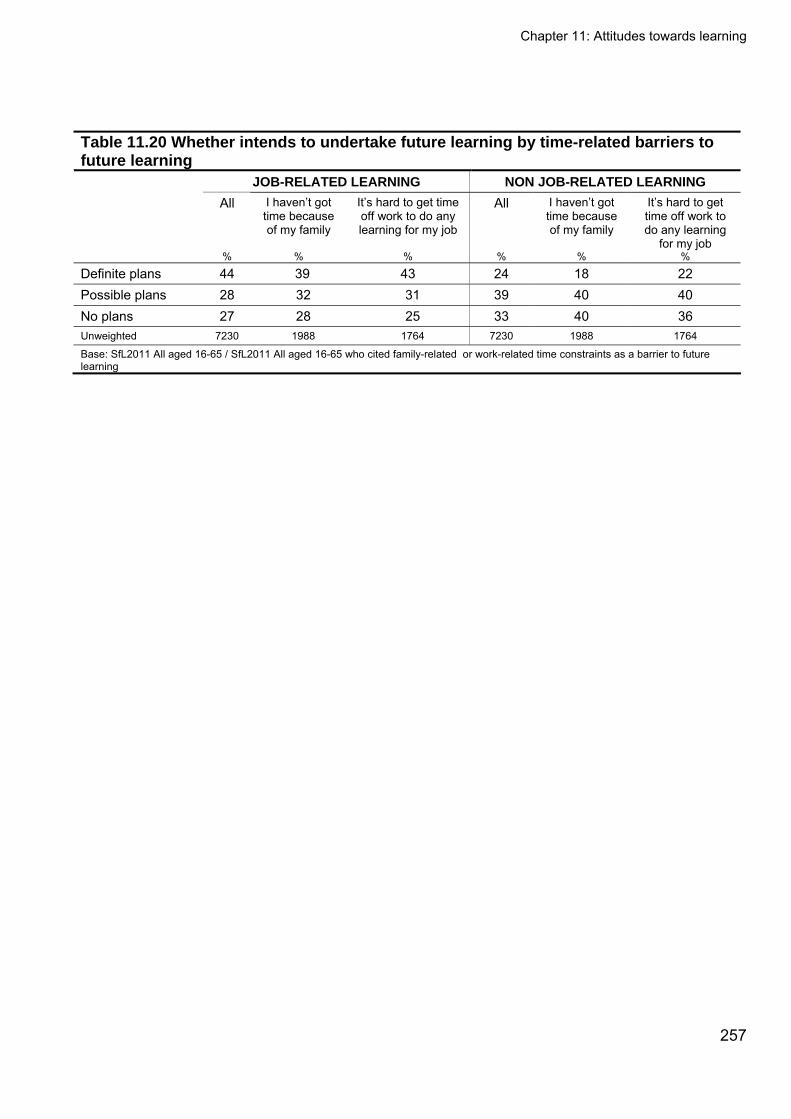
Chapter 11: Attitudes towards learning
257
Table 11.20 Whether intends to undertake future learning by time-related barriers to future learning
JOB-RELATED LEARNING NON JOB-RELATED LEARNING
All I haven’t got time because of my family
It’s hard to get time off work to do any learning for my job
All I haven’t got time because of my family
It’s hard to get time off work to do any learning
for my job % % % % % %
Definite plans 44 39 43 24 18 22 Possible plans 28 32 31 39 40 40 No plans 27 28 25 33 40 36 Unweighted 7230 1988 1764 7230 1988 1764
Base: SfL2011 All aged 16-65 / SfL2011 All aged 16-65 who cited family-related or work-related time constraints as a barrier to future learning
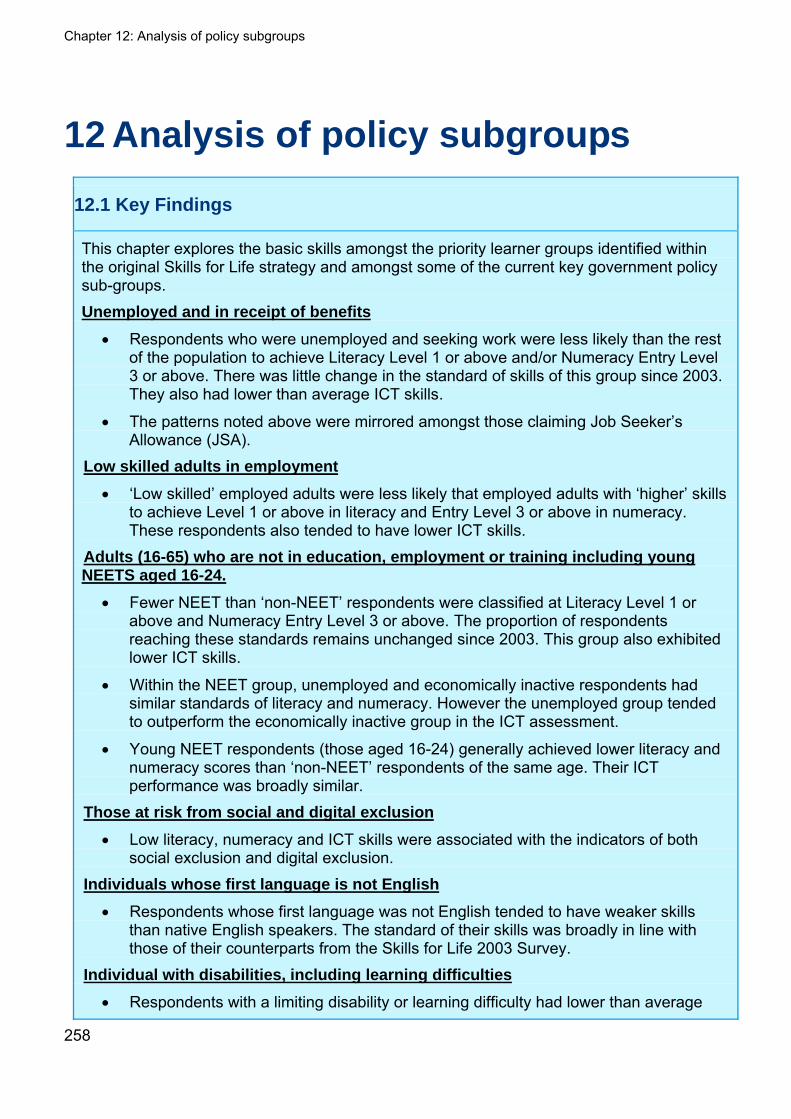
Chapter 12: Analysis of policy subgroups
258
12 Analysis of policy subgroups
12.1 Key Findings
This chapter explores the basic skills amongst the priority learner groups identified within the original Skills for Life strategy and amongst some of the current key government policy sub-groups. Unemployed and in receipt of benefits
Respondents who were unemployed and seeking work were less likely than the rest of the population to achieve Literacy Level 1 or above and/or Numeracy Entry Level 3 or above. There was little change in the standard of skills of this group since 2003. They also had lower than average ICT skills.
The patterns noted above were mirrored amongst those claiming Job Seeker’s Allowance (JSA).
Low skilled adults in employment
‘Low skilled’ employed adults were less likely that employed adults with ‘higher’ skills to achieve Level 1 or above in literacy and Entry Level 3 or above in numeracy. These respondents also tended to have lower ICT skills.
Adults (16-65) who are not in education, employment or training including young NEETS aged 16-24.
Fewer NEET than ‘non-NEET’ respondents were classified at Literacy Level 1 or above and Numeracy Entry Level 3 or above. The proportion of respondents reaching these standards remains unchanged since 2003. This group also exhibited lower ICT skills.
Within the NEET group, unemployed and economically inactive respondents had similar standards of literacy and numeracy. However the unemployed group tended to outperform the economically inactive group in the ICT assessment.
Young NEET respondents (those aged 16-24) generally achieved lower literacy and numeracy scores than ‘non-NEET’ respondents of the same age. Their ICT performance was broadly similar.
Those at risk from social and digital exclusion
Low literacy, numeracy and ICT skills were associated with the indicators of both social exclusion and digital exclusion.
Individuals whose first language is not English
Respondents whose first language was not English tended to have weaker skills than native English speakers. The standard of their skills was broadly in line with those of their counterparts from the Skills for Life 2003 Survey.
Individual with disabilities, including learning difficulties
Respondents with a limiting disability or learning difficulty had lower than average
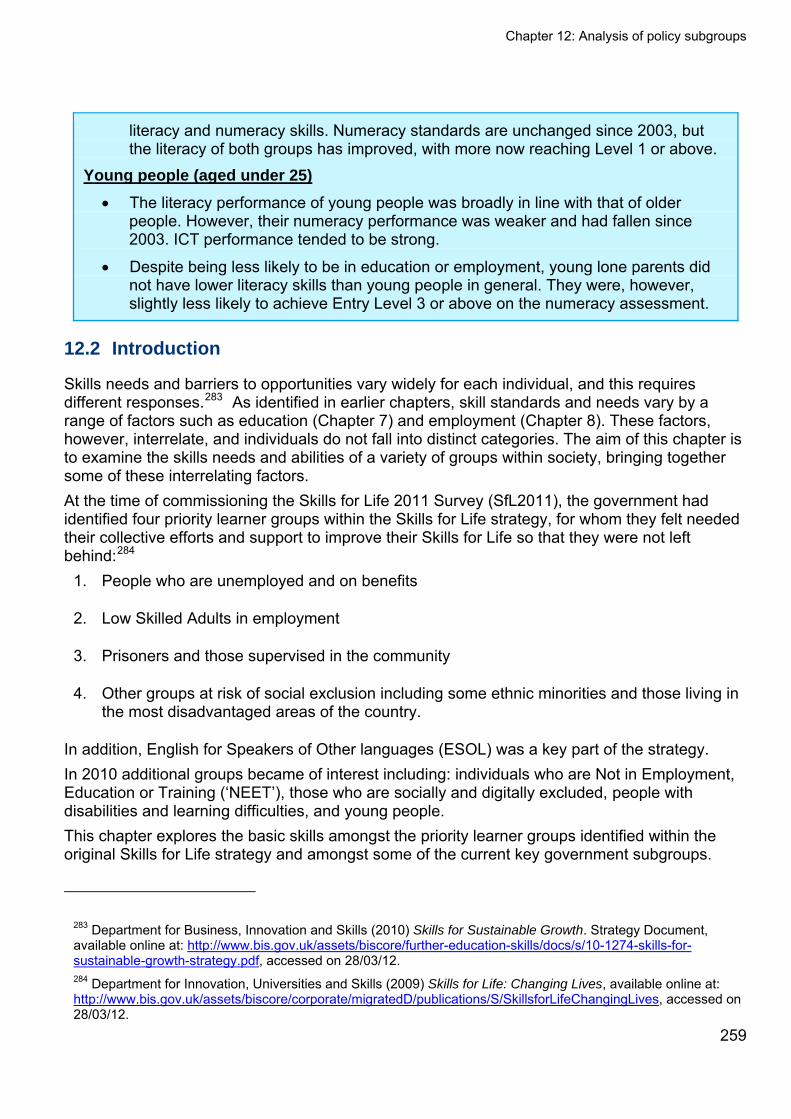
Chapter 12: Analysis of policy subgroups
259
literacy and numeracy skills. Numeracy standards are unchanged since 2003, but the literacy of both groups has improved, with more now reaching Level 1 or above.
Young people (aged under 25)
The literacy performance of young people was broadly in line with that of older people. However, their numeracy performance was weaker and had fallen since 2003. ICT performance tended to be strong.
Despite being less likely to be in education or employment, young lone parents did not have lower literacy skills than young people in general. They were, however, slightly less likely to achieve Entry Level 3 or above on the numeracy assessment.
12.2 Introduction
Skills needs and barriers to opportunities vary widely for each individual, and this requires different responses.283 As identified in earlier chapters, skill standards and needs vary by a range of factors such as education (Chapter 7) and employment (Chapter 8). These factors, however, interrelate, and individuals do not fall into distinct categories. The aim of this chapter is to examine the skills needs and abilities of a variety of groups within society, bringing together some of these interrelating factors. At the time of commissioning the Skills for Life 2011 Survey (SfL2011), the government had identified four priority learner groups within the Skills for Life strategy, for whom they felt needed their collective efforts and support to improve their Skills for Life so that they were not left behind:284
1. People who are unemployed and on benefits
2. Low Skilled Adults in employment
3. Prisoners and those supervised in the community
4. Other groups at risk of social exclusion including some ethnic minorities and those living in the most disadvantaged areas of the country.
In addition, English for Speakers of Other languages (ESOL) was a key part of the strategy. In 2010 additional groups became of interest including: individuals who are Not in Employment, Education or Training (‘NEET’), those who are socially and digitally excluded, people with disabilities and learning difficulties, and young people. This chapter explores the basic skills amongst the priority learner groups identified within the original Skills for Life strategy and amongst some of the current key government subgroups.
283 Department for Business, Innovation and Skills (2010) Skills for Sustainable Growth. Strategy Document, available online at: http://www.bis.gov.uk/assets/biscore/further-education-skills/docs/s/10-1274-skills-for-sustainable-growth-strategy.pdf, accessed on 28/03/12. 284 Department for Innovation, Universities and Skills (2009) Skills for Life: Changing Lives, available online at: http://www.bis.gov.uk/assets/biscore/corporate/migratedD/publications/S/SkillsforLifeChangingLives, accessed on 28/03/12.
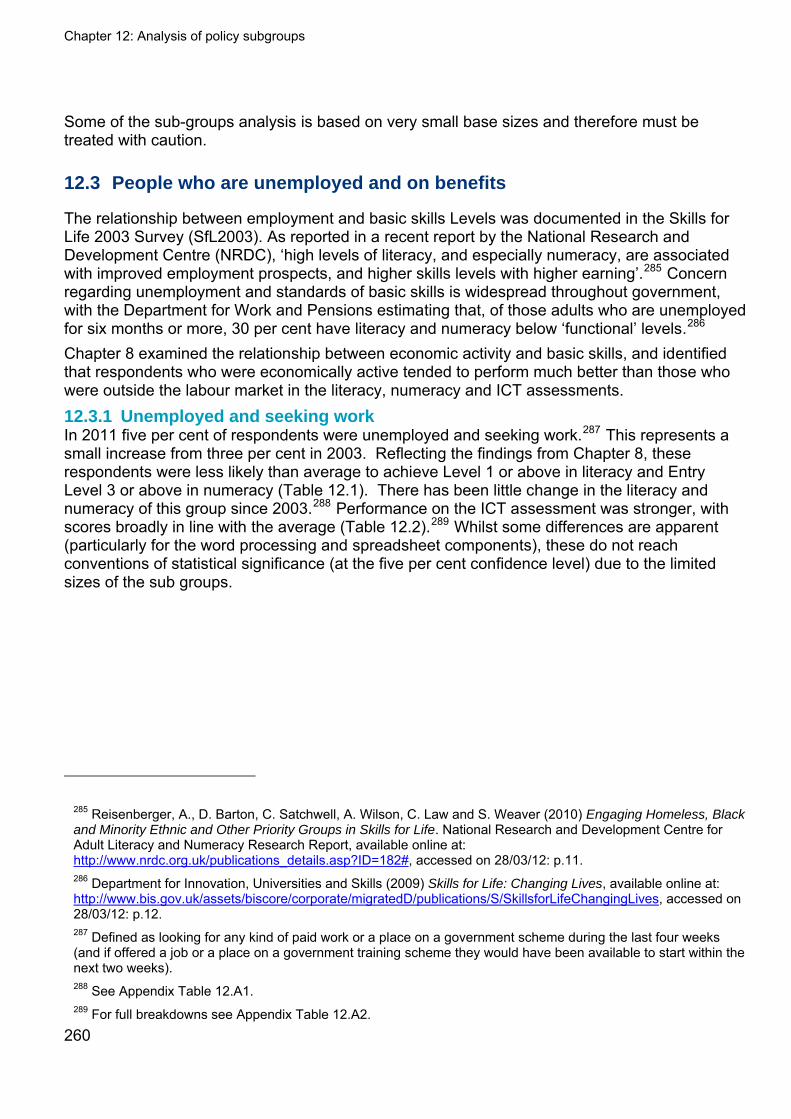
Chapter 12: Analysis of policy subgroups
260
Some of the sub-groups analysis is based on very small base sizes and therefore must be treated with caution.
12.3 People who are unemployed and on benefits
The relationship between employment and basic skills Levels was documented in the Skills for Life 2003 Survey (SfL2003). As reported in a recent report by the National Research and Development Centre (NRDC), ‘high levels of literacy, and especially numeracy, are associated with improved employment prospects, and higher skills levels with higher earning’.285 Concern regarding unemployment and standards of basic skills is widespread throughout government, with the Department for Work and Pensions estimating that, of those adults who are unemployed for six months or more, 30 per cent have literacy and numeracy below ‘functional’ levels.286 Chapter 8 examined the relationship between economic activity and basic skills, and identified that respondents who were economically active tended to perform much better than those who were outside the labour market in the literacy, numeracy and ICT assessments. 12.3.1 Unemployed and seeking work In 2011 five per cent of respondents were unemployed and seeking work.287 This represents a small increase from three per cent in 2003. Reflecting the findings from Chapter 8, these respondents were less likely than average to achieve Level 1 or above in literacy and Entry Level 3 or above in numeracy (Table 12.1). There has been little change in the literacy and numeracy of this group since 2003.288 Performance on the ICT assessment was stronger, with scores broadly in line with the average (Table 12.2).289 Whilst some differences are apparent (particularly for the word processing and spreadsheet components), these do not reach conventions of statistical significance (at the five per cent confidence level) due to the limited sizes of the sub groups.
285 Reisenberger, A., D. Barton, C. Satchwell, A. Wilson, C. Law and S. Weaver (2010) Engaging Homeless, Black and Minority Ethnic and Other Priority Groups in Skills for Life. National Research and Development Centre for Adult Literacy and Numeracy Research Report, available online at: http://www.nrdc.org.uk/publications_details.asp?ID=182#, accessed on 28/03/12: p.11. 286 Department for Innovation, Universities and Skills (2009) Skills for Life: Changing Lives, available online at: http://www.bis.gov.uk/assets/biscore/corporate/migratedD/publications/S/SkillsforLifeChangingLives, accessed on 28/03/12: p.12. 287 Defined as looking for any kind of paid work or a place on a government scheme during the last four weeks (and if offered a job or a place on a government training scheme they would have been available to start within the next two weeks). 288 See Appendix Table 12.A1. 289 For full breakdowns see Appendix Table 12.A2.
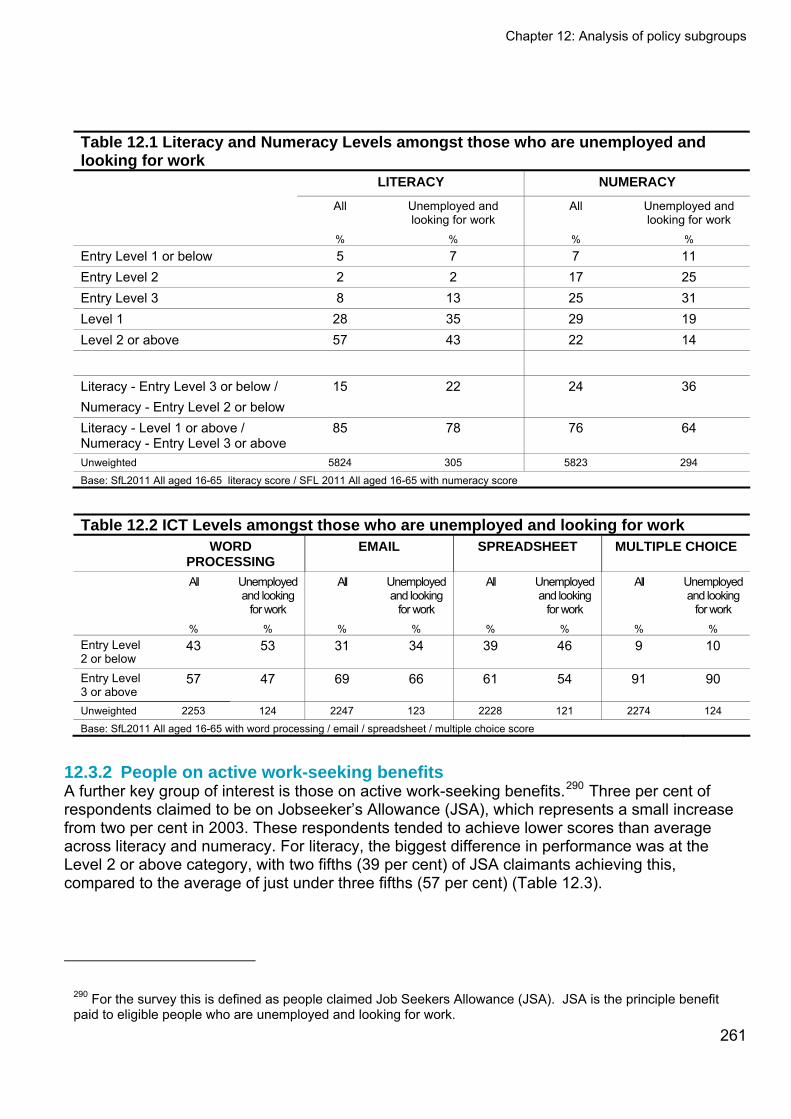
Chapter 12: Analysis of policy subgroups
261
Table 12.1 Literacy and Numeracy Levels amongst those who are unemployed and looking for work LITERACY NUMERACY
All Unemployed and looking for work
All Unemployed and looking for work
% % % %
Entry Level 1 or below 5 7 7 11 Entry Level 2 2 2 17 25 Entry Level 3 8 13 25 31 Level 1 28 35 29 19 Level 2 or above 57 43 22 14
Literacy - Entry Level 3 or below / Numeracy - Entry Level 2 or below
15 22 24 36
Literacy - Level 1 or above / Numeracy - Entry Level 3 or above
85 78 76 64
Unweighted 5824 305 5823 294
Base: SfL2011 All aged 16-65 literacy score / SFL 2011 All aged 16-65 with numeracy score
Table 12.2 ICT Levels amongst those who are unemployed and looking for work WORD
PROCESSING EMAIL SPREADSHEET MULTIPLE CHOICE
All Unemployed and looking
for work
All Unemployed and looking
for work
All Unemployed and looking
for work
All Unemployed and looking
for work % % % % % % % % Entry Level 2 or below
43 53 31 34 39 46 9 10
Entry Level 3 or above
57 47 69 66 61 54 91 90
Unweighted 2253 124 2247 123 2228 121 2274 124
Base: SfL2011 All aged 16-65 with word processing / email / spreadsheet / multiple choice score
12.3.2 People on active work-seeking benefits A further key group of interest is those on active work-seeking benefits.290 Three per cent of respondents claimed to be on Jobseeker’s Allowance (JSA), which represents a small increase from two per cent in 2003. These respondents tended to achieve lower scores than average across literacy and numeracy. For literacy, the biggest difference in performance was at the Level 2 or above category, with two fifths (39 per cent) of JSA claimants achieving this, compared to the average of just under three fifths (57 per cent) (Table 12.3).
290 For the survey this is defined as people claimed Job Seekers Allowance (JSA). JSA is the principle benefit paid to eligible people who are unemployed and looking for work.
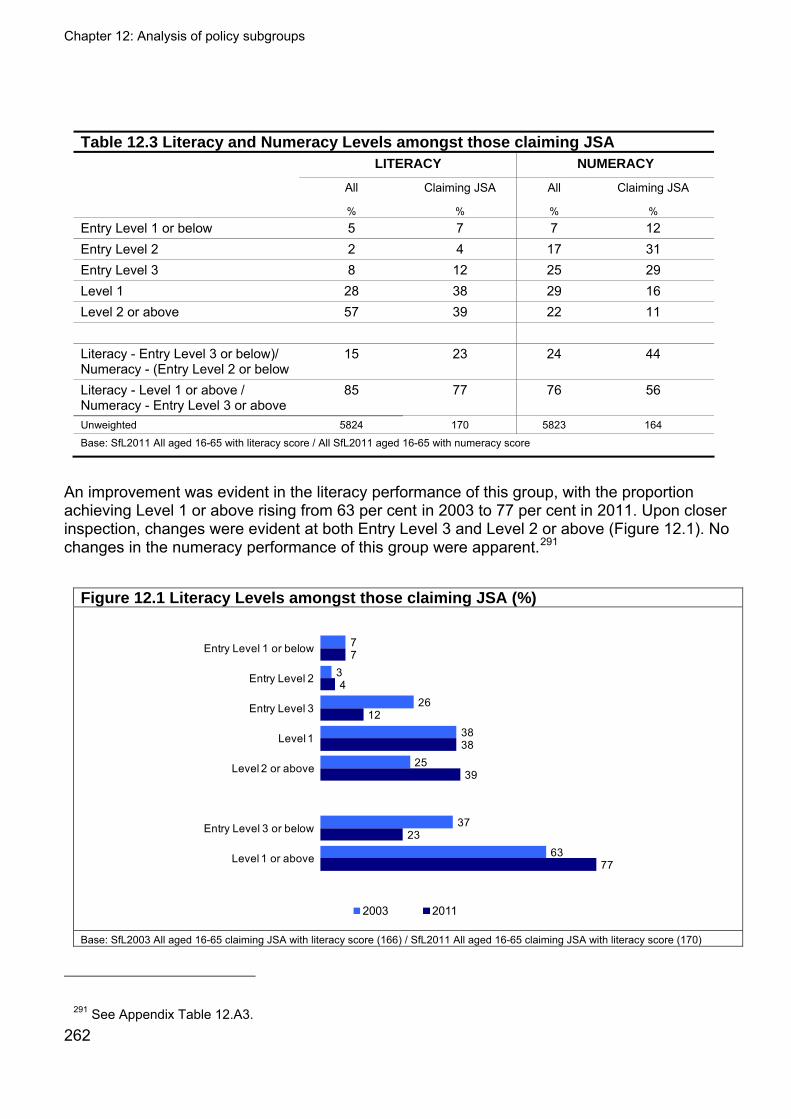
Chapter 12: Analysis of policy subgroups
Table 12.3 Literacy and Numeracy Levels amongst those claiming JSA LITERACY NUMERACY
All Claiming JSA All Claiming JSA
% % % %
Entry Level 1 or below 5 7 7 12 Entry Level 2 2 4 17 31 Entry Level 3 8 12 25 29 Level 1 28 38 29 16 Level 2 or above 57 39 22 11 Literacy - Entry Level 3 or below)/ Numeracy - (Entry Level 2 or below
15 23 24 44
Literacy - Level 1 or above / Numeracy - Entry Level 3 or above
85 77 76 56
Unweighted 5824 170 5823 164
Base: SfL2011 All aged 16-65 with literacy score / All SfL2011 aged 16-65 with numeracy score
An improvement was evident in the literacy performance of this group, with the proportion achieving Level 1 or above rising from 63 per cent in 2003 to 77 per cent in 2011. Upon closer inspection, changes were evident at both Entry Level 3 and Level 2 or above (Figure 12.1). No changes in the numeracy performance of this group were apparent.291
Figure 12.1 Literacy Levels amongst those claiming JSA (%)
7
3
26
38
25
37
63
7
4
12
38
39
23
77
Entry Level 1 or below
Entry Level 2
Entry Level 3
Level 1
Level 2 or above
Entry Level 3 or below
Level 1 or above
2003 2011 Base: SfL2003 All aged 16-65 claiming JSA with literacy score (166) / SfL2011 All aged 16-65 claiming JSA with literacy score (170)
291 See Appendix Table 12.A3. 262
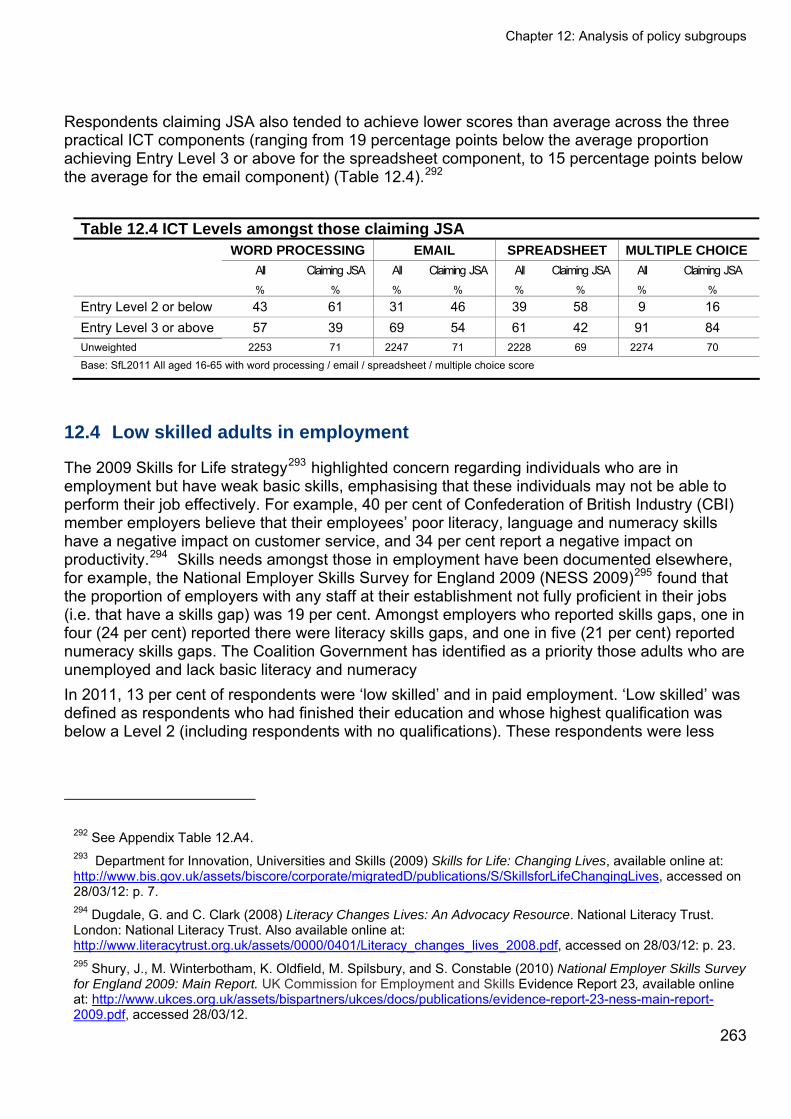
Chapter 12: Analysis of policy subgroups
263
Respondents claiming JSA also tended to achieve lower scores than average across the three practical ICT components (ranging from 19 percentage points below the average proportion achieving Entry Level 3 or above for the spreadsheet component, to 15 percentage points below the average for the email component) (Table 12.4).292
Table 12.4 ICT Levels amongst those claiming JSA WORD PROCESSING EMAIL SPREADSHEET MULTIPLE CHOICE
All Claiming JSA All Claiming JSA All Claiming JSA All Claiming JSA % % % % % % % %
Entry Level 2 or below 43 61 31 46 39 58 9 16 Entry Level 3 or above 57 39 69 54 61 42 91 84 Unweighted 2253 71 2247 71 2228 69 2274 70
Base: SfL2011 All aged 16-65 with word processing / email / spreadsheet / multiple choice score
12.4 Low skilled adults in employment
The 2009 Skills for Life strategy293 highlighted concern regarding individuals who are in employment but have weak basic skills, emphasising that these individuals may not be able to perform their job effectively. For example, 40 per cent of Confederation of British Industry (CBI) member employers believe that their employees’ poor literacy, language and numeracy skills have a negative impact on customer service, and 34 per cent report a negative impact on productivity.294 Skills needs amongst those in employment have been documented elsewhere, for example, the National Employer Skills Survey for England 2009 (NESS 2009)295 found that the proportion of employers with any staff at their establishment not fully proficient in their jobs (i.e. that have a skills gap) was 19 per cent. Amongst employers who reported skills gaps, one in four (24 per cent) reported there were literacy skills gaps, and one in five (21 per cent) reported numeracy skills gaps. The Coalition Government has identified as a priority those adults who are unemployed and lack basic literacy and numeracy In 2011, 13 per cent of respondents were ‘low skilled’ and in paid employment. ‘Low skilled’ was defined as respondents who had finished their education and whose highest qualification was below a Level 2 (including respondents with no qualifications). These respondents were less
292 See Appendix Table 12.A4. 293 Department for Innovation, Universities and Skills (2009) Skills for Life: Changing Lives, available online at: http://www.bis.gov.uk/assets/biscore/corporate/migratedD/publications/S/SkillsforLifeChangingLives, accessed on 28/03/12: p. 7. 294 Dugdale, G. and C. Clark (2008) Literacy Changes Lives: An Advocacy Resource. National Literacy Trust. London: National Literacy Trust. Also available online at: http://www.literacytrust.org.uk/assets/0000/0401/Literacy_changes_lives_2008.pdf, accessed on 28/03/12: p. 23. 295 Shury, J., M. Winterbotham, K. Oldfield, M. Spilsbury, and S. Constable (2010) National Employer Skills Survey for England 2009: Main Report. UK Commission for Employment and Skills Evidence Report 23, available online at: http://www.ukces.org.uk/assets/bispartners/ukces/docs/publications/evidence-report-23-ness-main-report-2009.pdf, accessed 28/03/12.
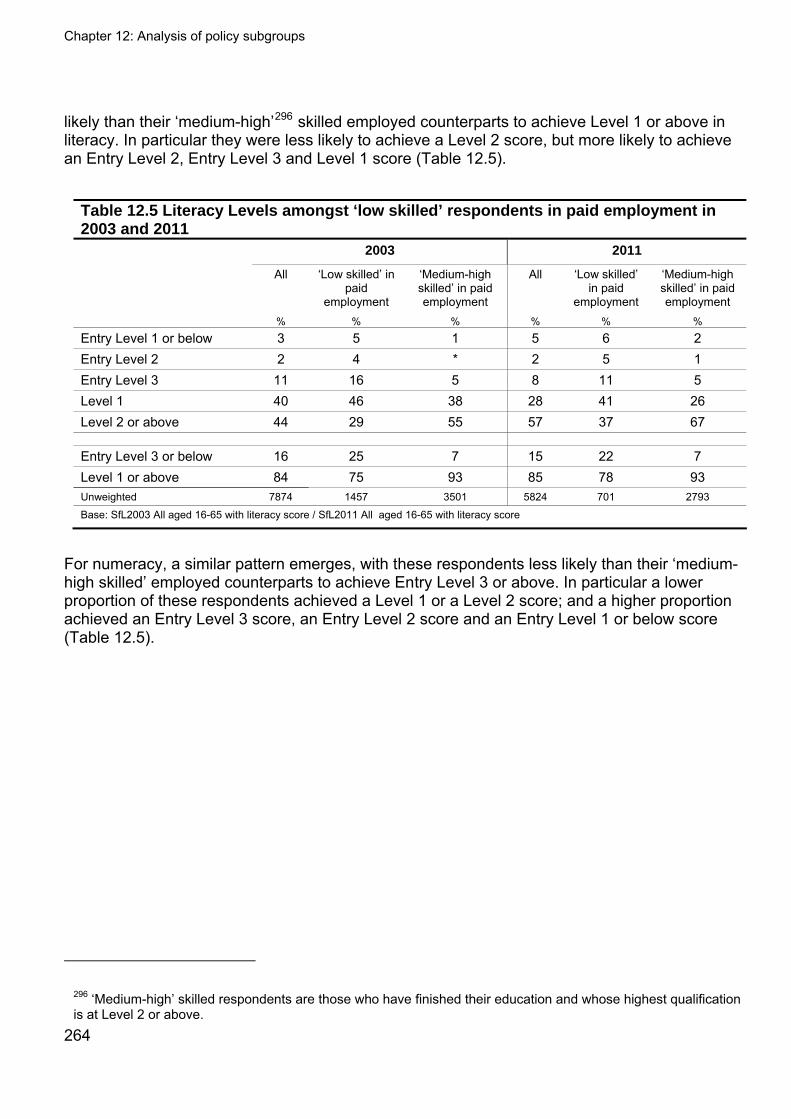
Chapter 12: Analysis of policy subgroups
264
likely than their ‘medium-high’296 skilled employed counterparts to achieve Level 1 or above in literacy. In particular they were less likely to achieve a Level 2 score, but more likely to achieve an Entry Level 2, Entry Level 3 and Level 1 score (Table 12.5).
Table 12.5 Literacy Levels amongst ‘low skilled’ respondents in paid employment in 2003 and 2011 2003 2011
All
‘Low skilled’ in paid
employment
‘Medium-high skilled’ in paid employment
All ‘Low skilled’ in paid
employment
‘Medium-high skilled’ in paid employment
% % % % % %
Entry Level 1 or below 3 5 1 5 6 2 Entry Level 2 2 4 * 2 5 1 Entry Level 3 11 16 5 8 11 5 Level 1 40 46 38 28 41 26 Level 2 or above 44 29 55 57 37 67
Entry Level 3 or below 16 25 7 15 22 7 Level 1 or above 84 75 93 85 78 93 Unweighted 7874 1457 3501 5824 701 2793
Base: SfL2003 All aged 16-65 with literacy score / SfL2011 All aged 16-65 with literacy score
For numeracy, a similar pattern emerges, with these respondents less likely than their ‘medium-high skilled’ employed counterparts to achieve Entry Level 3 or above. In particular a lower proportion of these respondents achieved a Level 1 or a Level 2 score; and a higher proportion achieved an Entry Level 3 score, an Entry Level 2 score and an Entry Level 1 or below score (Table 12.5).
296 ‘Medium-high’ skilled respondents are those who have finished their education and whose highest qualification is at Level 2 or above.

Chapter 12: Analysis of policy subgroups
265
Table 12.6 Numeracy Levels amongst ‘low skilled’ respondents in paid employment in 2003 and 2011 2003 2011
All
‘Low skilled’ in paid
employment
‘Medium-high skilled’ in paid employment
All ‘Low skilled’ in paid
employment
‘Medium-high skilled’ in paid employment
% % % % % %
Entry Level 1 or below 5 7 2 7 9 3
Entry Level 2 16 23 9 17 24 11
Entry Level 3 25 33 21 25 34 22
Level 1 28 24 32 29 25 35
Level 2 or above 25 13 37 22 8 30
Entry Level 2 or below 21 30 11 24 34 14
Entry Level 3 or above 79 70 89 76 66 86
Unweighted 8040 1492 3518 5823 690 2799
Base: SfL2003 All aged 16-65 with numeracy score / SfL2011 All aged 16-65 with numeracy score
In comparison to 2003, there has been no change in the proportion of these respondents achieving a Level 1 or above score in literacy. There has, however, been an increase in the proportion achieving Literacy Level 2 or above, but unlike the trend seen for all respondents, the proportion at Entry Level 3 has decreased, and the proportion at Level 1 has remained relatively unchanged. The data is displayed in Table 12.5. For numeracy the proportion of ‘low skilled’ respondents in paid employment performing at Entry Level 3 or above has remained relatively unchanged since 2003. However, there has been a small decrease in the proportion being classified at Level 2 or above (Table 12.6). The ICT performance of respondents in ‘low skilled’ paid employment tended to be lower across the four ICT components, with a much smaller proportion of these respondents performing at Entry Level 3 or above, than amongst all respondents or ‘medium-high skilled’ employees (Table 12.7).297
297 See Appendix Table 12.A5.
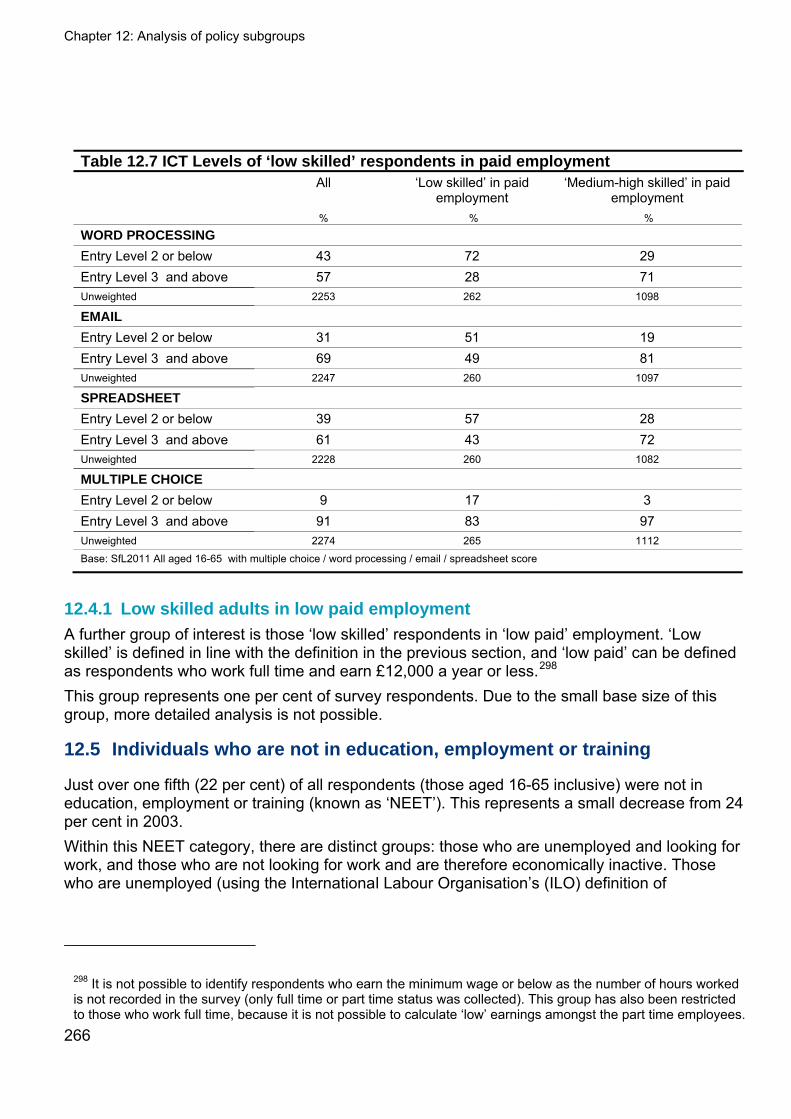
Chapter 12: Analysis of policy subgroups
266
Table 12.7 ICT Levels of ‘low skilled’ respondents in paid employment All ‘Low skilled’ in paid
employment ‘Medium-high skilled’ in paid
employment % % %
WORD PROCESSING
Entry Level 2 or below 43 72 29 Entry Level 3 and above 57 28 71 Unweighted 2253 262 1098
Entry Level 2 or below 31 51 19 Entry Level 3 and above 69 49 81 Unweighted 2247 260 1097
SPREADSHEET
Entry Level 2 or below 39 57 28 Entry Level 3 and above 61 43 72 Unweighted 2228 260 1082
MULTIPLE CHOICE
Entry Level 2 or below 9 17 3 Entry Level 3 and above 91 83 97 Unweighted 2274 265 1112
Base: SfL2011 All aged 16-65 with multiple choice / word processing / email / spreadsheet score
12.4.1 Low skilled adults in low paid employment
A further group of interest is those ‘low skilled’ respondents in ‘low paid’ employment. ‘Low skilled’ is defined in line with the definition in the previous section, and ‘low paid’ can be defined as respondents who work full time and earn £12,000 a year or less.298 This group represents one per cent of survey respondents. Due to the small base size of this group, more detailed analysis is not possible.
12.5 Individuals who are not in education, employment or training
Just over one fifth (22 per cent) of all respondents (those aged 16-65 inclusive) were not in education, employment or training (known as ‘NEET’). This represents a small decrease from 24 per cent in 2003. Within this NEET category, there are distinct groups: those who are unemployed and looking for work, and those who are not looking for work and are therefore economically inactive. Those who are unemployed (using the International Labour Organisation’s (ILO) definition of
298 It is not possible to identify respondents who earn the minimum wage or below as the number of hours worked is not recorded in the survey (only full time or part time status was collected). This group has also been restricted to those who work full time, because it is not possible to calculate ‘low’ earnings amongst the part time employees.
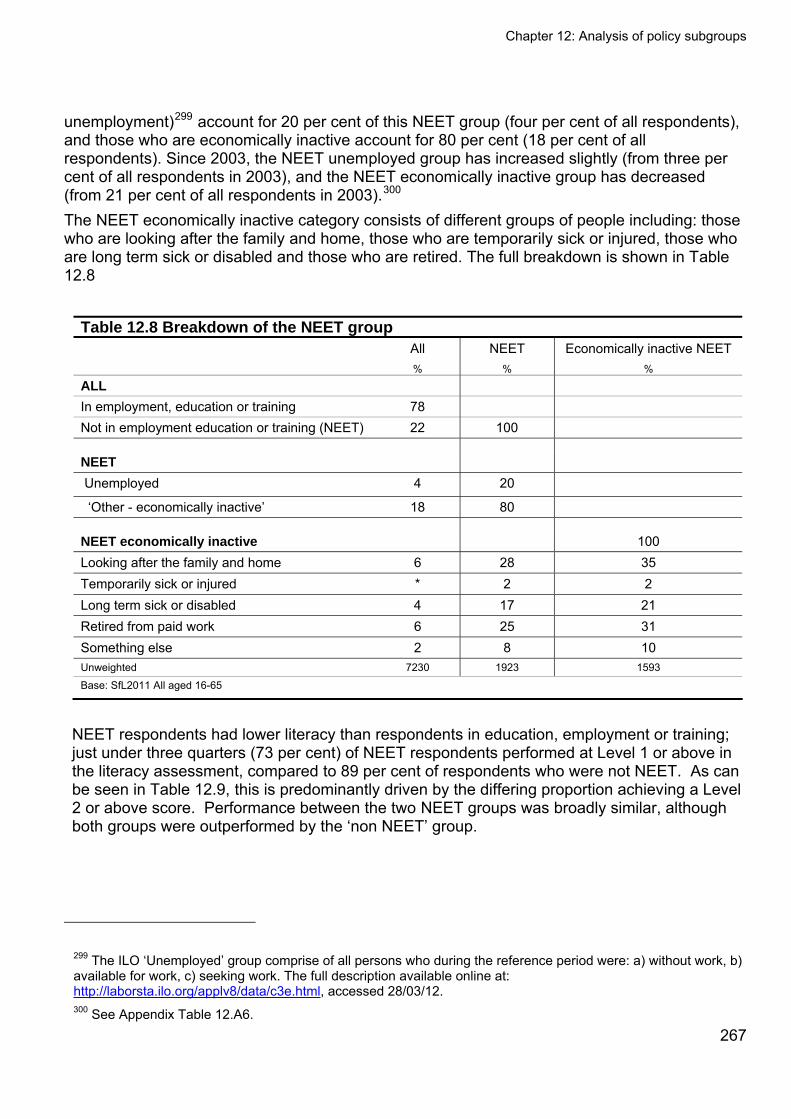
Chapter 12: Analysis of policy subgroups
267
unemployment)299 account for 20 per cent of this NEET group (four per cent of all respondents), and those who are economically inactive account for 80 per cent (18 per cent of all respondents). Since 2003, the NEET unemployed group has increased slightly (from three per cent of all respondents in 2003), and the NEET economically inactive group has decreased (from 21 per cent of all respondents in 2003).300 The NEET economically inactive category consists of different groups of people including: those who are looking after the family and home, those who are temporarily sick or injured, those who are long term sick or disabled and those who are retired. The full breakdown is shown in Table 12.8
Table 12.8 Breakdown of the NEET group All NEET Economically inactive NEET % % %
ALL In employment, education or training 78 Not in employment education or training (NEET) 22 100
NEET Unemployed 4 20
‘Other - economically inactive’ 18 80
NEET economically inactive 100 Looking after the family and home 6 28 35 Temporarily sick or injured * 2 2 Long term sick or disabled 4 17 21 Retired from paid work 6 25 31 Something else 2 8 10 Unweighted 7230 1923 1593
Base: SfL2011 All aged 16-65
NEET respondents had lower literacy than respondents in education, employment or training; just under three quarters (73 per cent) of NEET respondents performed at Level 1 or above in the literacy assessment, compared to 89 per cent of respondents who were not NEET. As can be seen in Table 12.9, this is predominantly driven by the differing proportion achieving a Level 2 or above score. Performance between the two NEET groups was broadly similar, although both groups were outperformed by the ‘non NEET’ group.
299 The ILO ‘Unemployed’ group comprise of all persons who during the reference period were: a) without work, b) available for work, c) seeking work. The full description available online at: http://laborsta.ilo.org/applv8/data/c3e.html, accessed 28/03/12. 300 See Appendix Table 12.A6.
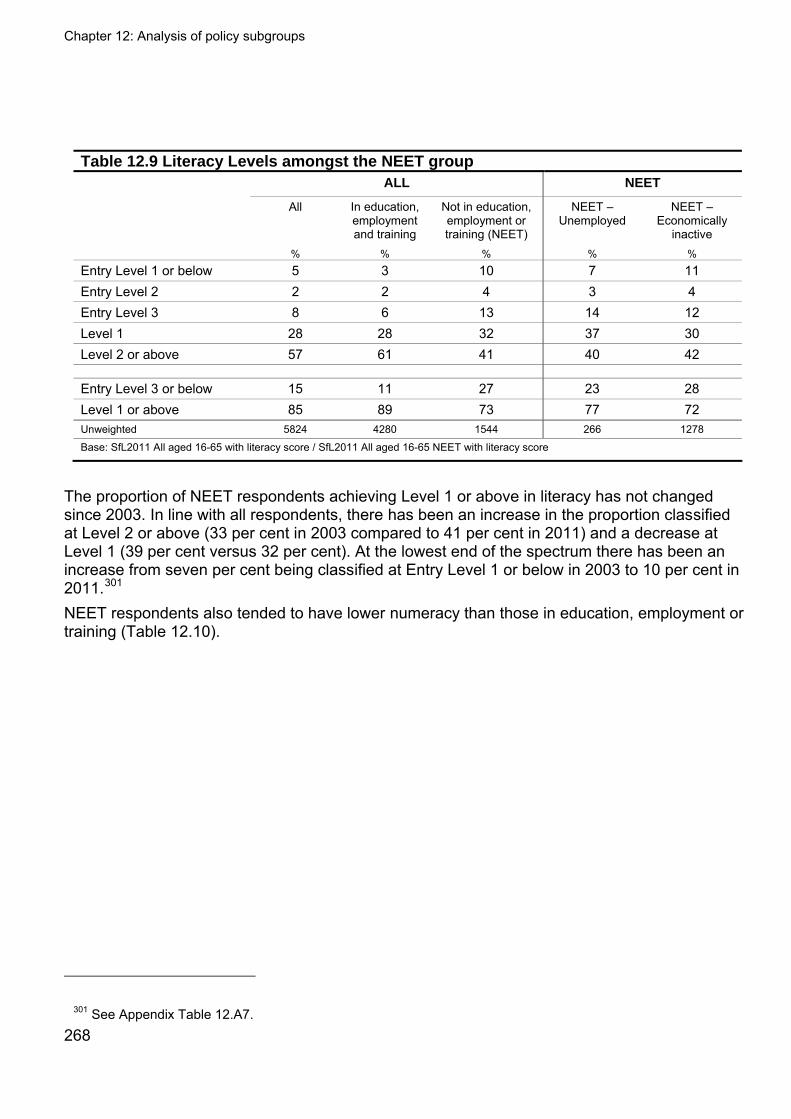
Chapter 12: Analysis of policy subgroups
268
Table 12.9 Literacy Levels amongst the NEET group ALL NEET
All In education, employment and training
Not in education, employment or training (NEET)
NEET – Unemployed
NEET – Economically
inactive % % % % %
Entry Level 1 or below 5 3 10 7 11 Entry Level 2 2 2 4 3 4 Entry Level 3 8 6 13 14 12 Level 1 28 28 32 37 30 Level 2 or above 57 61 41 40 42
Entry Level 3 or below 15 11 27 23 28 Level 1 or above 85 89 73 77 72 Unweighted 5824 4280 1544 266 1278
Base: SfL2011 All aged 16-65 with literacy score / SfL2011 All aged 16-65 NEET with literacy score
The proportion of NEET respondents achieving Level 1 or above in literacy has not changed since 2003. In line with all respondents, there has been an increase in the proportion classified at Level 2 or above (33 per cent in 2003 compared to 41 per cent in 2011) and a decrease at Level 1 (39 per cent versus 32 per cent). At the lowest end of the spectrum there has been an increase from seven per cent being classified at Entry Level 1 or below in 2003 to 10 per cent in 2011.301 NEET respondents also tended to have lower numeracy than those in education, employment or training (Table 12.10).
301 See Appendix Table 12.A7.
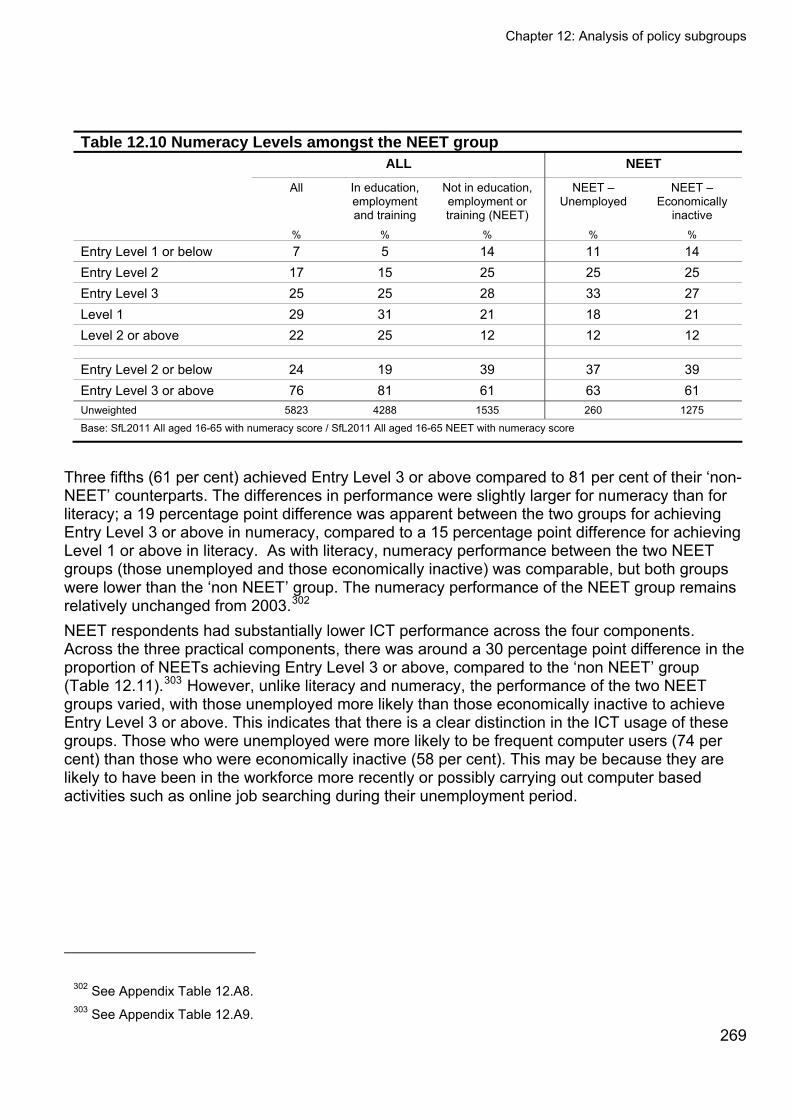
Chapter 12: Analysis of policy subgroups
269
Table 12.10 Numeracy Levels amongst the NEET group ALL NEET
All In education, employment and training
Not in education, employment or training (NEET)
NEET – Unemployed
NEET – Economically
inactive % % % % %
Entry Level 1 or below 7 5 14 11 14 Entry Level 2 17 15 25 25 25 Entry Level 3 25 25 28 33 27 Level 1 29 31 21 18 21 Level 2 or above 22 25 12 12 12
Entry Level 2 or below 24 19 39 37 39 Entry Level 3 or above 76 81 61 63 61 Unweighted 5823 4288 1535 260 1275
Base: SfL2011 All aged 16-65 with numeracy score / SfL2011 All aged 16-65 NEET with numeracy score
Three fifths (61 per cent) achieved Entry Level 3 or above compared to 81 per cent of their ‘non-NEET’ counterparts. The differences in performance were slightly larger for numeracy than for literacy; a 19 percentage point difference was apparent between the two groups for achieving Entry Level 3 or above in numeracy, compared to a 15 percentage point difference for achieving Level 1 or above in literacy. As with literacy, numeracy performance between the two NEET groups (those unemployed and those economically inactive) was comparable, but both groups were lower than the ‘non NEET’ group. The numeracy performance of the NEET group remains relatively unchanged from 2003.302 NEET respondents had substantially lower ICT performance across the four components. Across the three practical components, there was around a 30 percentage point difference in the proportion of NEETs achieving Entry Level 3 or above, compared to the ‘non NEET’ group (Table 12.11).303 However, unlike literacy and numeracy, the performance of the two NEET groups varied, with those unemployed more likely than those economically inactive to achieve Entry Level 3 or above. This indicates that there is a clear distinction in the ICT usage of these groups. Those who were unemployed were more likely to be frequent computer users (74 per cent) than those who were economically inactive (58 per cent). This may be because they are likely to have been in the workforce more recently or possibly carrying out computer based activities such as online job searching during their unemployment period.
302 See Appendix Table 12.A8. 303 See Appendix Table 12.A9.
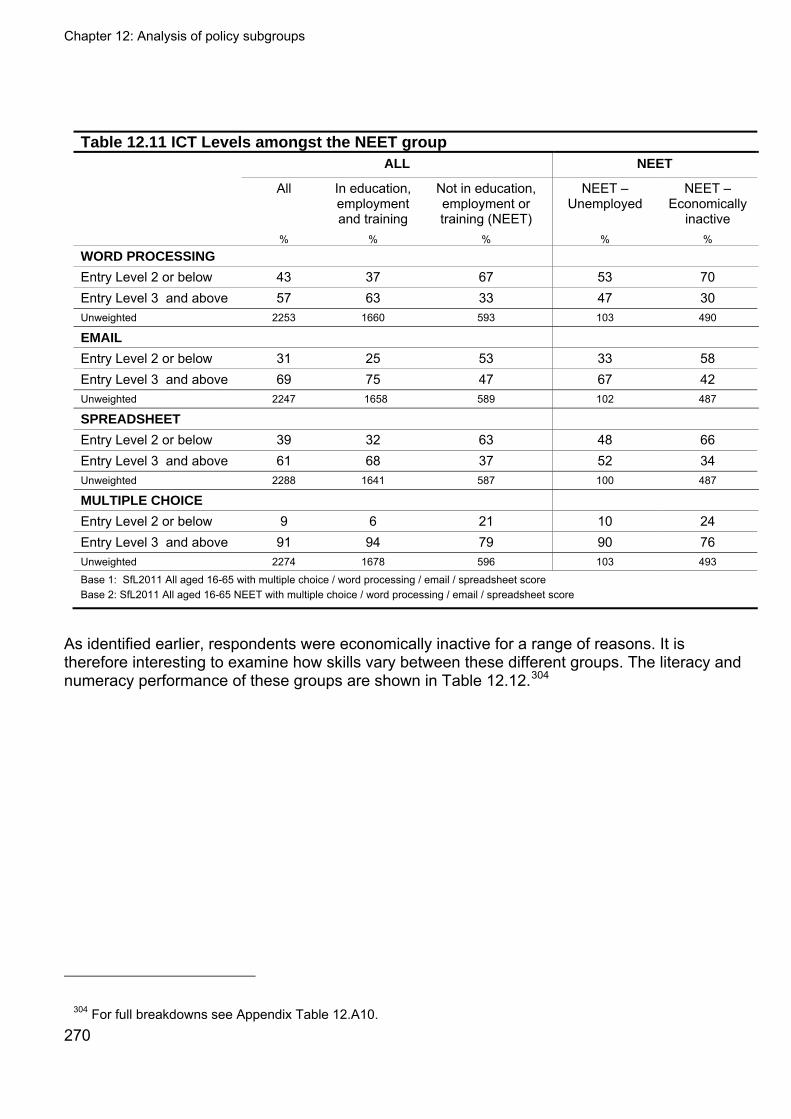
Chapter 12: Analysis of policy subgroups
270
Table 12.11 ICT Levels amongst the NEET group ALL NEET
All In education, employment and training
Not in education, employment or training (NEET)
NEET – Unemployed
NEET – Economically
inactive % % % % %
WORD PROCESSING
Entry Level 2 or below 43 37 67 53 70 Entry Level 3 and above 57 63 33 47 30 Unweighted 2253 1660 593 103 490
Entry Level 2 or below 31 25 53 33 58 Entry Level 3 and above 69 75 47 67 42 Unweighted 2247 1658 589 102 487
SPREADSHEET
Entry Level 2 or below 39 32 63 48 66 Entry Level 3 and above 61 68 37 52 34 Unweighted 2288 1641 587 100 487
MULTIPLE CHOICE
Entry Level 2 or below 9 6 21 10 24 Entry Level 3 and above 91 94 79 90 76 Unweighted 2274 1678 596 103 493
Base 1: SfL2011 All aged 16-65 with multiple choice / word processing / email / spreadsheet score Base 2: SfL2011 All aged 16-65 NEET with multiple choice / word processing / email / spreadsheet score
As identified earlier, respondents were economically inactive for a range of reasons. It is therefore interesting to examine how skills vary between these different groups. The literacy and numeracy performance of these groups are shown in Table 12.12.304
304 For full breakdowns see Appendix Table 12.A10.
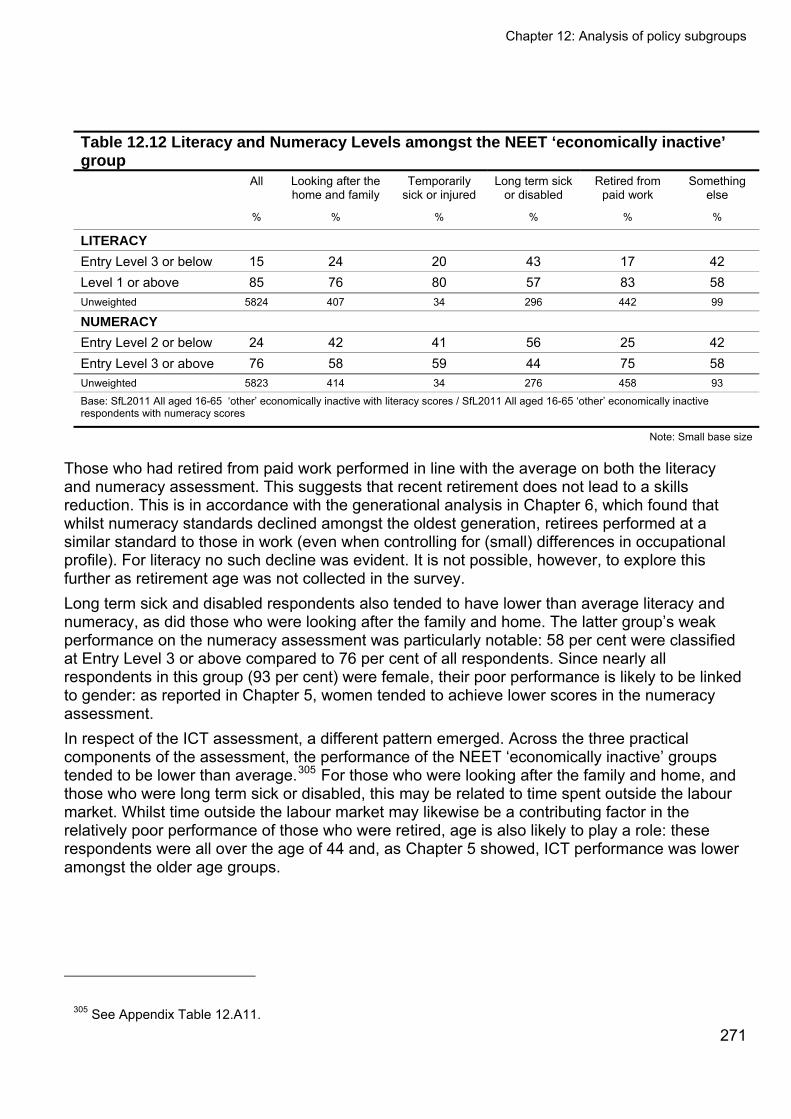
Chapter 12: Analysis of policy subgroups
271
Table 12.12 Literacy and Numeracy Levels amongst the NEET ‘economically inactive’ group All Looking after the
home and family Temporarily
sick or injured Long term sick
or disabled Retired from
paid work Something
else
% % % % % %
LITERACY
Entry Level 3 or below 15 24 20 43 17 42 Level 1 or above 85 76 80 57 83 58 Unweighted 5824 407 34 296 442 99
NUMERACY
Entry Level 2 or below 24 42 41 56 25 42 Entry Level 3 or above 76 58 59 44 75 58 Unweighted 5823 414 34 276 458 93
Base: SfL2011 All aged 16-65 ‘other’ economically inactive with literacy scores / SfL2011 All aged 16-65 ‘other’ economically inactive respondents with numeracy scores
Note: Small base size
Those who had retired from paid work performed in line with the average on both the literacy and numeracy assessment. This suggests that recent retirement does not lead to a skills reduction. This is in accordance with the generational analysis in Chapter 6, which found that whilst numeracy standards declined amongst the oldest generation, retirees performed at a similar standard to those in work (even when controlling for (small) differences in occupational profile). For literacy no such decline was evident. It is not possible, however, to explore this further as retirement age was not collected in the survey. Long term sick and disabled respondents also tended to have lower than average literacy and numeracy, as did those who were looking after the family and home. The latter group’s weak performance on the numeracy assessment was particularly notable: 58 per cent were classified at Entry Level 3 or above compared to 76 per cent of all respondents. Since nearly all respondents in this group (93 per cent) were female, their poor performance is likely to be linked to gender: as reported in Chapter 5, women tended to achieve lower scores in the numeracy assessment. In respect of the ICT assessment, a different pattern emerged. Across the three practical components of the assessment, the performance of the NEET ‘economically inactive’ groups tended to be lower than average.305 For those who were looking after the family and home, and those who were long term sick or disabled, this may be related to time spent outside the labour market. Whilst time outside the labour market may likewise be a contributing factor in the relatively poor performance of those who were retired, age is also likely to play a role: these respondents were all over the age of 44 and, as Chapter 5 showed, ICT performance was lower amongst the older age groups.
305 See Appendix Table 12.A11.
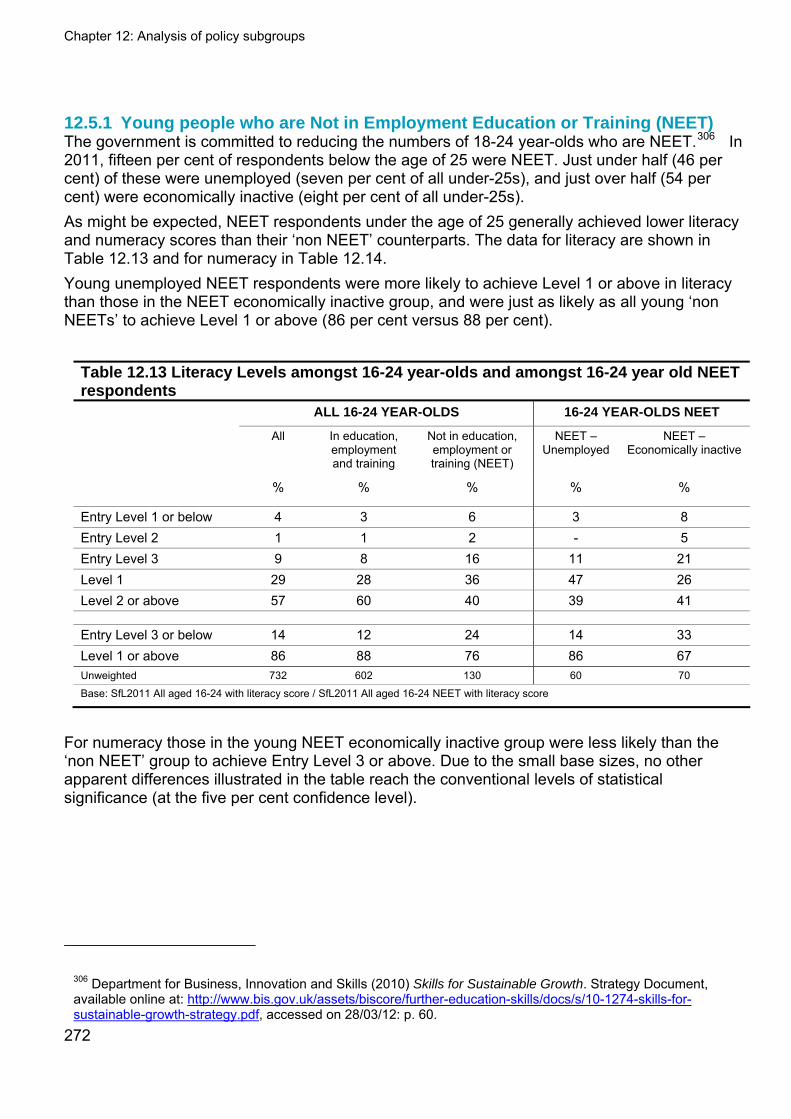
Chapter 12: Analysis of policy subgroups
272
12.5.1 Young people who are Not in Employment Education or Training (NEET) The government is committed to reducing the numbers of 18-24 year-olds who are NEET.306 In 2011, fifteen per cent of respondents below the age of 25 were NEET. Just under half (46 per cent) of these were unemployed (seven per cent of all under-25s), and just over half (54 per cent) were economically inactive (eight per cent of all under-25s). As might be expected, NEET respondents under the age of 25 generally achieved lower literacy and numeracy scores than their ‘non NEET’ counterparts. The data for literacy are shown in Table 12.13 and for numeracy in Table 12.14. Young unemployed NEET respondents were more likely to achieve Level 1 or above in literacy than those in the NEET economically inactive group, and were just as likely as all young ‘non NEETs’ to achieve Level 1 or above (86 per cent versus 88 per cent).
Table 12.13 Literacy Levels amongst 16-24 year-olds and amongst 16-24 year old NEET respondents ALL 16-24 YEAR-OLDS 16-24 YEAR-OLDS NEET
All In education, employment and training
Not in education, employment or training (NEET)
NEET – Unemployed
NEET – Economically inactive
% % % % %
Entry Level 1 or below 4 3 6 3 8 Entry Level 2 1 1 2 - 5 Entry Level 3 9 8 16 11 21 Level 1 29 28 36 47 26 Level 2 or above 57 60 40 39 41
Entry Level 3 or below 14 12 24 14 33 Level 1 or above 86 88 76 86 67 Unweighted 732 602 130 60 70
Base: SfL2011 All aged 16-24 with literacy score / SfL2011 All aged 16-24 NEET with literacy score
For numeracy those in the young NEET economically inactive group were less likely than the ‘non NEET’ group to achieve Entry Level 3 or above. Due to the small base sizes, no other apparent differences illustrated in the table reach the conventional levels of statistical significance (at the five per cent confidence level).
306 Department for Business, Innovation and Skills (2010) Skills for Sustainable Growth. Strategy Document, available online at: http://www.bis.gov.uk/assets/biscore/further-education-skills/docs/s/10-1274-skills-for-sustainable-growth-strategy.pdf, accessed on 28/03/12: p. 60.
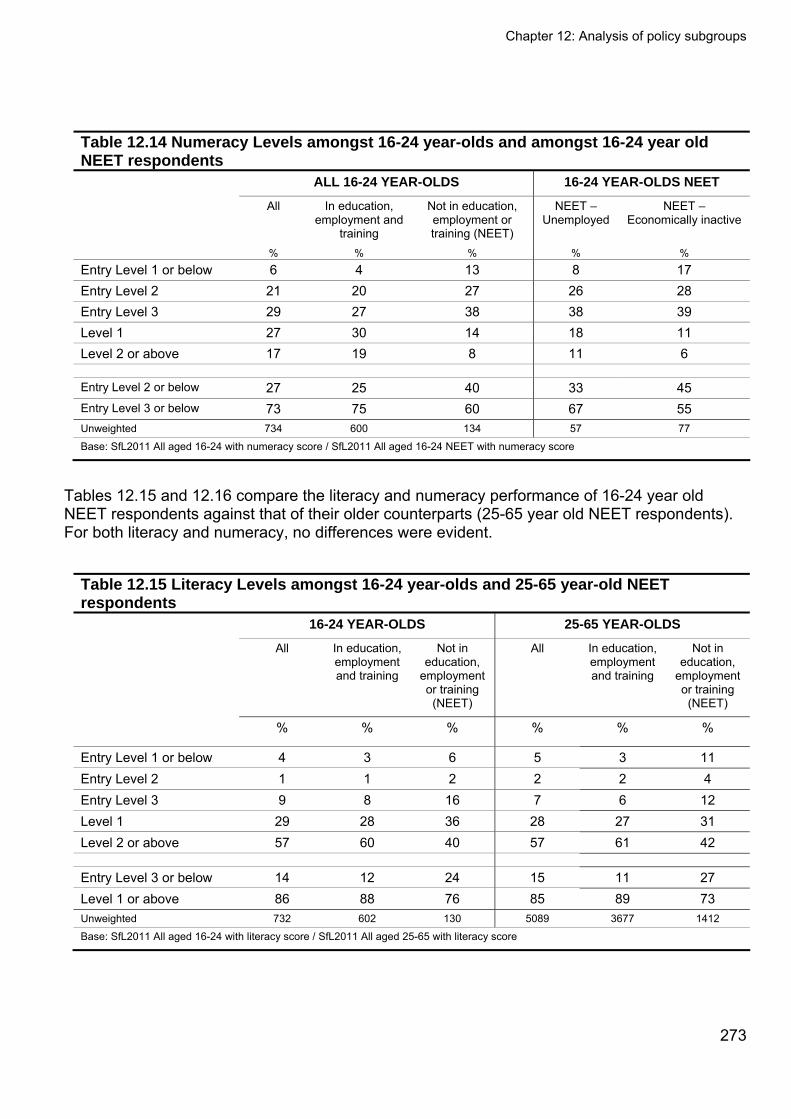
Chapter 12: Analysis of policy subgroups
273
Table 12.14 Numeracy Levels amongst 16-24 year-olds and amongst 16-24 year old NEET respondents ALL 16-24 YEAR-OLDS 16-24 YEAR-OLDS NEET
All In education, employment and
training
Not in education, employment or training (NEET)
NEET – Unemployed
NEET – Economically inactive
% % % % %
Entry Level 1 or below 6 4 13 8 17 Entry Level 2 21 20 27 26 28 Entry Level 3 29 27 38 38 39 Level 1 27 30 14 18 11 Level 2 or above 17 19 8 11 6
Entry Level 2 or below 27 25 40 33 45 Entry Level 3 or below 73 75 60 67 55 Unweighted 734 600 134 57 77
Base: SfL2011 All aged 16-24 with numeracy score / SfL2011 All aged 16-24 NEET with numeracy score
Tables 12.15 and 12.16 compare the literacy and numeracy performance of 16-24 year old NEET respondents against that of their older counterparts (25-65 year old NEET respondents). For both literacy and numeracy, no differences were evident.
Table 12.15 Literacy Levels amongst 16-24 year-olds and 25-65 year-old NEET respondents 16-24 YEAR-OLDS 25-65 YEAR-OLDS
All In education, employment and training
Not in education,
employment or training (NEET)
All In education, employment and training
Not in education,
employment or training (NEET)
% % % % % %
Entry Level 1 or below 4 3 6 5 3 11 Entry Level 2 1 1 2 2 2 4 Entry Level 3 9 8 16 7 6 12 Level 1 29 28 36 28 27 31 Level 2 or above 57 60 40 57 61 42
Entry Level 3 or below 14 12 24 15 11 27 Level 1 or above 86 88 76 85 89 73 Unweighted 732 602 130 5089 3677 1412
Base: SfL2011 All aged 16-24 with literacy score / SfL2011 All aged 25-65 with literacy score
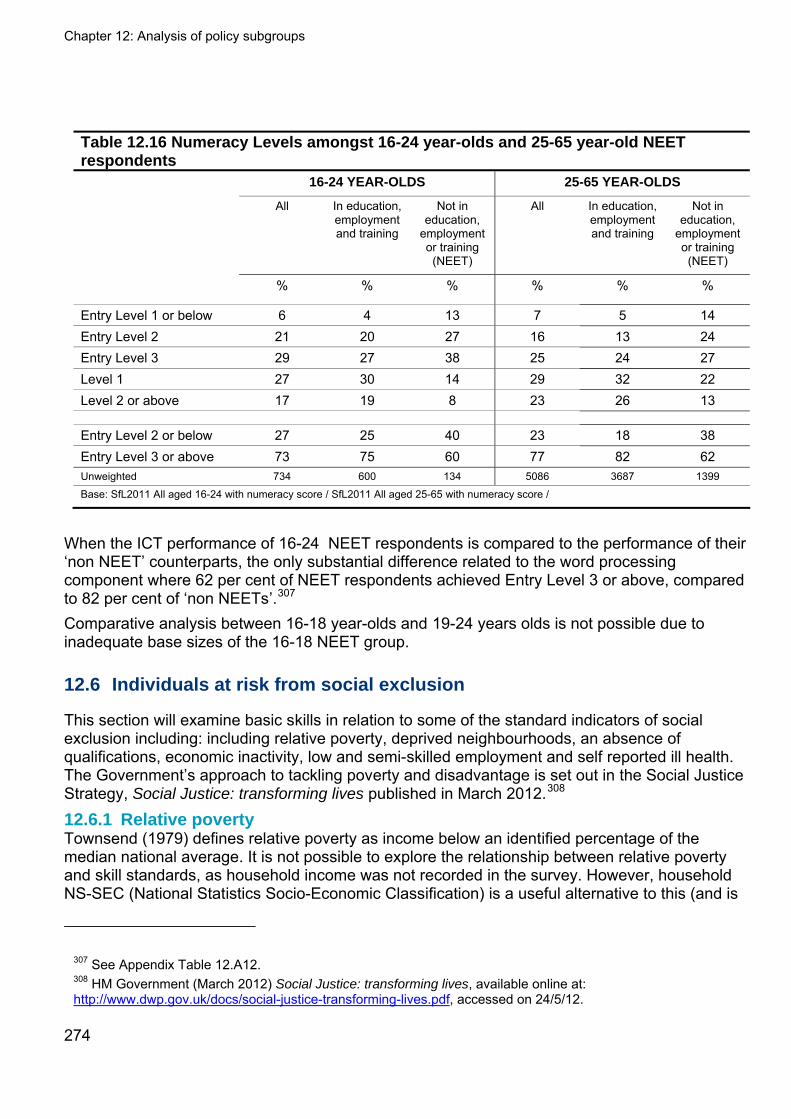
Chapter 12: Analysis of policy subgroups
274
Table 12.16 Numeracy Levels amongst 16-24 year-olds and 25-65 year-old NEET respondents 16-24 YEAR-OLDS 25-65 YEAR-OLDS
All In education, employment and training
Not in education,
employment or training (NEET)
All In education, employment and training
Not in education,
employment or training (NEET)
% % % % % %
Entry Level 1 or below 6 4 13 7 5 14 Entry Level 2 21 20 27 16 13 24 Entry Level 3 29 27 38 25 24 27 Level 1 27 30 14 29 32 22 Level 2 or above 17 19 8 23 26 13
Entry Level 2 or below 27 25 40 23 18 38 Entry Level 3 or above 73 75 60 77 82 62 Unweighted 734 600 134 5086 3687 1399
Base: SfL2011 All aged 16-24 with numeracy score / SfL2011 All aged 25-65 with numeracy score /
When the ICT performance of 16-24 NEET respondents is compared to the performance of their ‘non NEET’ counterparts, the only substantial difference related to the word processing component where 62 per cent of NEET respondents achieved Entry Level 3 or above, compared to 82 per cent of ‘non NEETs’.307 Comparative analysis between 16-18 year-olds and 19-24 years olds is not possible due to inadequate base sizes of the 16-18 NEET group.
12.6 Individuals at risk from social exclusion
This section will examine basic skills in relation to some of the standard indicators of social exclusion including: including relative poverty, deprived neighbourhoods, an absence of qualifications, economic inactivity, low and semi-skilled employment and self reported ill health. The Government’s approach to tackling poverty and disadvantage is set out in the Social Justice Strategy, Social Justice: transforming lives published in March 2012.308 12.6.1 Relative poverty Townsend (1979) defines relative poverty as income below an identified percentage of the median national average. It is not possible to explore the relationship between relative poverty and skill standards, as household income was not recorded in the survey. However, household NS-SEC (National Statistics Socio-Economic Classification) is a useful alternative to this (and is
307 See Appendix Table 12.A12. 308 HM Government (March 2012) Social Justice: transforming lives, available online at: http://www.dwp.gov.uk/docs/social-justice-transforming-lives.pdf, accessed on 24/5/12.
Chapter 12: Analysis of policy subgroups
275
less prone to the high levels of non-response that household income is often subject to). Household NS-SEC was explored in Chapter 5, and when using the five class NS-SEC classification the data shows that literacy, numeracy and ICT skills declined down the scale from NS-SEC group 1 (Managerial and professional occupation households) to group 5 (‘Working class’ households). The proportion of respondents achieving a Level 1 or above score in literacy, an Entry Level 3 or above score in numeracy, and an Entry Level 3 or above score in each of the ICT components was lowest amongst group 5 (‘Working class’ households). These performance differences were sizable. For numeracy, 60 per cent of those in group 5 (‘Working class’ households) achieved Entry Level 3 or above, compared to 88 per cent in group 1 (Managerial and professional occupation households); a difference of 28 percentage points. For literacy there was a difference of 22 percentage points in the proportion achieving Level 1 or above between groups 1 and 5.309 12.6.2 Other indicators of social exclusion All of the indicators of social exclusion (identified above) have been examined within this report. Weak skills have been found to be associated with all these indicators:
Chapter 5 (Section 5.4.2), explored the relationship between basic skills and deprived neighbourhoods using IMD 2011. Skills in literacy, numeracy and ICT were found to vary with IMD: areas with lower IMD scores (the least deprived) were linked with the highest skills Levels, while areas with the highest IMD scores (most deprived) exhibiting the greatest skill needs.
A lack of qualifications was associated with literacy, numeracy and ICT scores that were substantially below the average. It was notable that the performance of those with no qualifications was substantially weaker than those with low level qualifications (those at Level 1 or Level 2). These data are reported in detail in Chapter 7 (Section 7.4).
As examined in Chapter 8 (Section 8.6), people who were economically inactive tended to have weaker literacy, numeracy and ICT skills than those who were economically active.
Those in Semi-routine and Routine occupations also tended to have weaker skills. Amongst respondents in these two occupational groups, performance tended to be poorest for respondents who worked in Routine occupations (Section 8.7).
Performance in the assessments was associated with ratings of ill health. Skills Levels tended to decline down each rating of the self-reported health scale (from ‘very good’ to ‘poor / very poor’) (Section 5.5.3).
These findings suggest that individuals associated with indicators of social exclusion are likely to have skills needs. However it is important to remember that individuals do not fall into distinct categories and therefore their skills will be related to the combination and interrelations of these categories and indicators.
309 See Tables 5.35 and 5.36 in Chapter 5.

Chapter 12: Analysis of policy subgroups
276
12.7 Individuals at risk from digital exclusion
In recent decades changes and advances in Information and Communication Technologies (ICT) have been driving changes in how individuals, organisations and the government interact.310 In the 1990s there was a distinct digital divide to ‘haves’ and ‘have nots’ but this has radically changed in recent years as most people in the UK now have access to some digital technology.311 Whilst access to the internet is widespread, ONS figures suggest that in the first quarter of 2011, 8.71 million adults had never used the internet,312 and these tended to be those aged over 65, the widowed and those with a disability. This is potentially concerning as ‘using a computer and the internet are now basic skills for employability and many other aspects of learning and living’.313 There is no agreed definition of digital exclusion, but there is widespread consensus that key determinants of digital exclusion are access to and regular use of the internet. The vast majority of SfL2011 respondents (94 per cent) had used a computer, with only six per cent reporting that they had never used one. Of those who had used a computer, 89 per cent currently used a computer to access the internet (82 per cent of all respondents). As shown in Table 12.17, literacy and numeracy skills were related to computer and internet use. Those who used a computer to access the internet were more likely than average to achieve Level 1 or above in literacy, and Entry Level 3 or above for numeracy. Those respondents who currently used a computer but did not access the internet, and those who did not currently use a computer or had never used one, had lower than average literacy and numeracy performance. Performance between these groups also varied, with current computer users who did not access the internet more likely to achieve a Level 1 or above score on literacy and an Entry Level 3 or above score on numeracy than those who did not use a computer or have never used one.
310 Freshminds (2008) Understanding Digital Exclusion. Department for Communities and Local Government Research Report, available online at http://www.communities.gov.uk/documents/communities/pdf/1000404.pdf, accessed on 28/03/12: p. 5. 311 Longley, P. and A. Singleton (2008) Social Deprivation and Digital Exclusion in England. UCL Working Papers Series Paper 145. 312 Williams, M. (2011) Internet Access Quarterly Update 2011 Q1. Office for National Statistics, available online at: http://www.ons.gov.uk/ons/dcp171766_241030.pdf, accessed on 28/03/12. 313 Department for Business, Innovation and Skills (2010) Skills for Sustainable Growth. Strategy Document, available online at: http://www.bis.gov.uk/assets/biscore/further-education-skills/docs/s/10-1274-skills-for-sustainable-growth-strategy.pdf, accessed on 28/03/12: p. 37.
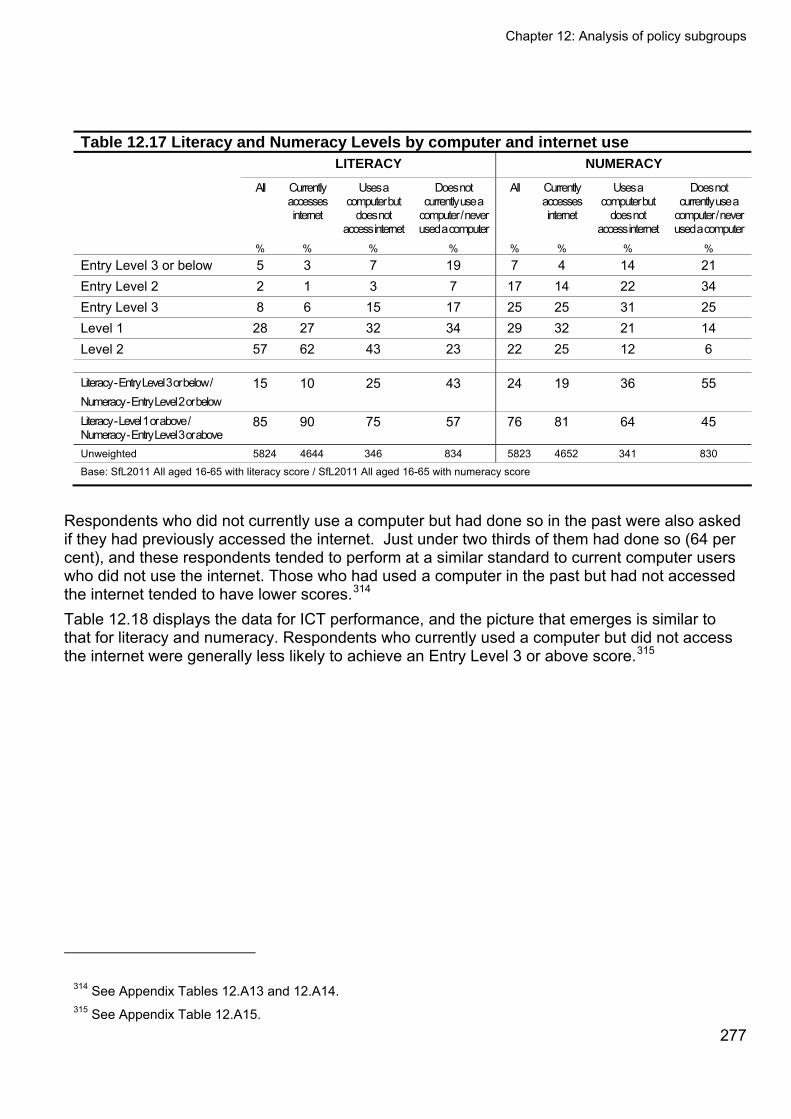
Chapter 12: Analysis of policy subgroups
277
Table 12.17 Literacy and Numeracy Levels by computer and internet use LITERACY NUMERACY
All Currently accesses internet
Uses a computer but
does not access internet
Does not currently use a
computer / never used a computer
All Currently accesses internet
Uses a computer but
does not access internet
Does not currently use a
computer / never used a computer
% % % % % % % %
Entry Level 3 or below 5 3 7 19 7 4 14 21 Entry Level 2 2 1 3 7 17 14 22 34 Entry Level 3 8 6 15 17 25 25 31 25 Level 1 28 27 32 34 29 32 21 14 Level 2 57 62 43 23 22 25 12 6
Literacy - Entry Level 3 or below / Numeracy - Entry Level 2 or below
15 10 25 43 24 19 36 55
Literacy - Level 1 or above / Numeracy - Entry Level 3 or above
85 90 75 57 76 81 64 45
Unweighted 5824 4644 346 834 5823 4652 341 830
Base: SfL2011 All aged 16-65 with literacy score / SfL2011 All aged 16-65 with numeracy score
Respondents who did not currently use a computer but had done so in the past were also asked if they had previously accessed the internet. Just under two thirds of them had done so (64 per cent), and these respondents tended to perform at a similar standard to current computer users who did not use the internet. Those who had used a computer in the past but had not accessed the internet tended to have lower scores.314 Table 12.18 displays the data for ICT performance, and the picture that emerges is similar to that for literacy and numeracy. Respondents who currently used a computer but did not access the internet were generally less likely to achieve an Entry Level 3 or above score.315
314 See Appendix Tables 12.A13 and 12.A14. 315 See Appendix Table 12.A15.
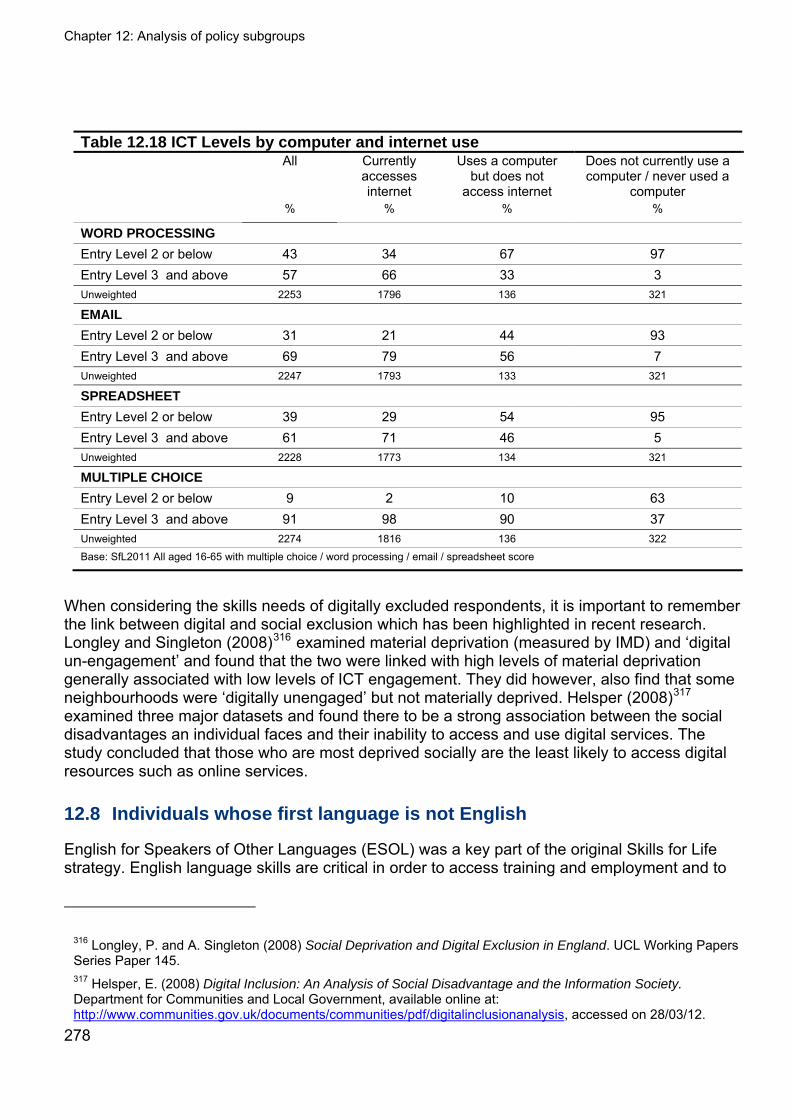
Chapter 12: Analysis of policy subgroups
278
Table 12.18 ICT Levels by computer and internet use All Currently
accesses internet
Uses a computer but does not
access internet
Does not currently use a computer / never used a
computer % % % %
WORD PROCESSING
Entry Level 2 or below 43 34 67 97 Entry Level 3 and above 57 66 33 3 Unweighted 2253 1796 136 321
Entry Level 2 or below 31 21 44 93 Entry Level 3 and above 69 79 56 7 Unweighted 2247 1793 133 321
SPREADSHEET
Entry Level 2 or below 39 29 54 95 Entry Level 3 and above 61 71 46 5 Unweighted 2228 1773 134 321
MULTIPLE CHOICE
Entry Level 2 or below 9 2 10 63 Entry Level 3 and above 91 98 90 37 Unweighted 2274 1816 136 322
Base: SfL2011 All aged 16-65 with multiple choice / word processing / email / spreadsheet score
When considering the skills needs of digitally excluded respondents, it is important to remember the link between digital and social exclusion which has been highlighted in recent research. Longley and Singleton (2008)316 examined material deprivation (measured by IMD) and ‘digital un-engagement’ and found that the two were linked with high levels of material deprivation generally associated with low levels of ICT engagement. They did however, also find that some neighbourhoods were ‘digitally unengaged’ but not materially deprived. Helsper (2008)317 examined three major datasets and found there to be a strong association between the social disadvantages an individual faces and their inability to access and use digital services. The study concluded that those who are most deprived socially are the least likely to access digital resources such as online services.
12.8 Individuals whose first language is not English
English for Speakers of Other Languages (ESOL) was a key part of the original Skills for Life strategy. English language skills are critical in order to access training and employment and to
316 Longley, P. and A. Singleton (2008) Social Deprivation and Digital Exclusion in England. UCL Working Papers Series Paper 145. 317 Helsper, E. (2008) Digital Inclusion: An Analysis of Social Disadvantage and the Information Society. Department for Communities and Local Government, available online at: http://www.communities.gov.uk/documents/communities/pdf/digitalinclusionanalysis, accessed on 28/03/12.
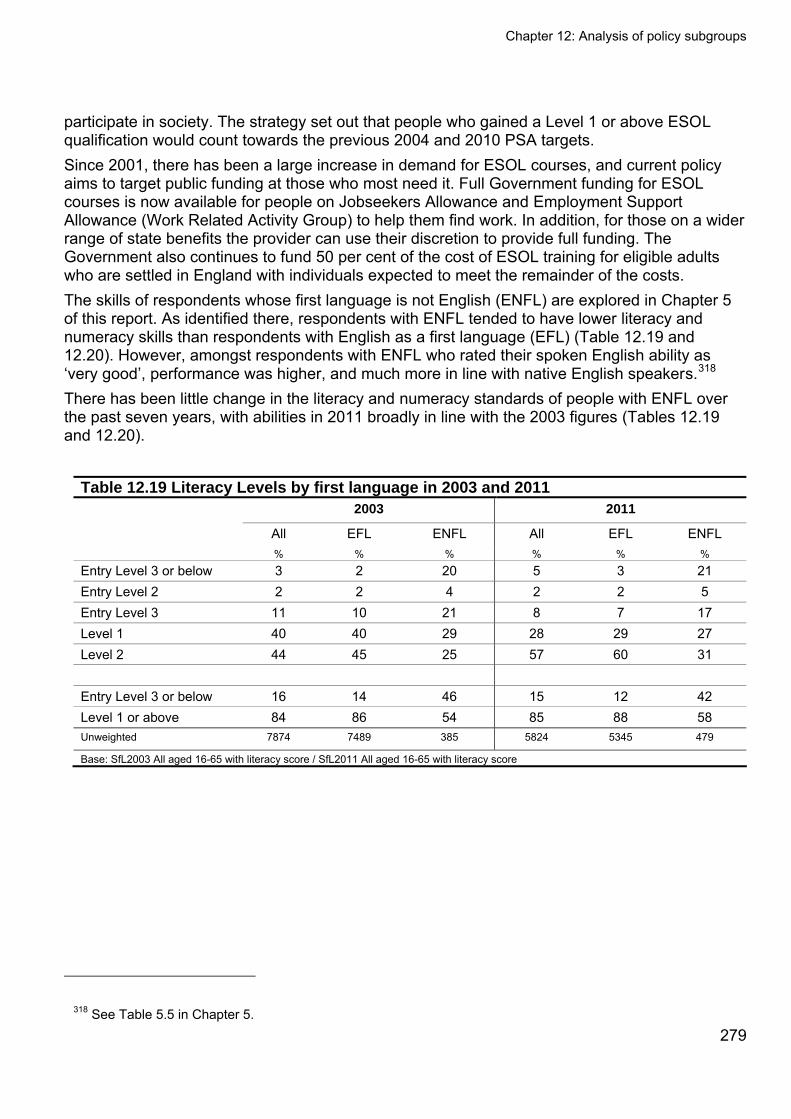
Chapter 12: Analysis of policy subgroups
279
participate in society. The strategy set out that people who gained a Level 1 or above ESOL qualification would count towards the previous 2004 and 2010 PSA targets. Since 2001, there has been a large increase in demand for ESOL courses, and current policy aims to target public funding at those who most need it. Full Government funding for ESOL courses is now available for people on Jobseekers Allowance and Employment Support Allowance (Work Related Activity Group) to help them find work. In addition, for those on a wider range of state benefits the provider can use their discretion to provide full funding. The Government also continues to fund 50 per cent of the cost of ESOL training for eligible adults who are settled in England with individuals expected to meet the remainder of the costs. The skills of respondents whose first language is not English (ENFL) are explored in Chapter 5 of this report. As identified there, respondents with ENFL tended to have lower literacy and numeracy skills than respondents with English as a first language (EFL) (Table 12.19 and 12.20). However, amongst respondents with ENFL who rated their spoken English ability as ‘very good’, performance was higher, and much more in line with native English speakers.318 There has been little change in the literacy and numeracy standards of people with ENFL over the past seven years, with abilities in 2011 broadly in line with the 2003 figures (Tables 12.19 and 12.20).
Table 12.19 Literacy Levels by first language in 2003 and 2011 2003 2011
All EFL ENFL All EFL ENFL % % % % % %
Entry Level 3 or below 3 2 20 5 3 21 Entry Level 2 2 2 4 2 2 5 Entry Level 3 11 10 21 8 7 17 Level 1 40 40 29 28 29 27 Level 2 44 45 25 57 60 31 Entry Level 3 or below 16 14 46 15 12 42 Level 1 or above 84 86 54 85 88 58 Unweighted 7874 7489 385 5824 5345 479
Base: SfL2003 All aged 16-65 with literacy score / SfL2011 All aged 16-65 with literacy score
318 See Table 5.5 in Chapter 5.
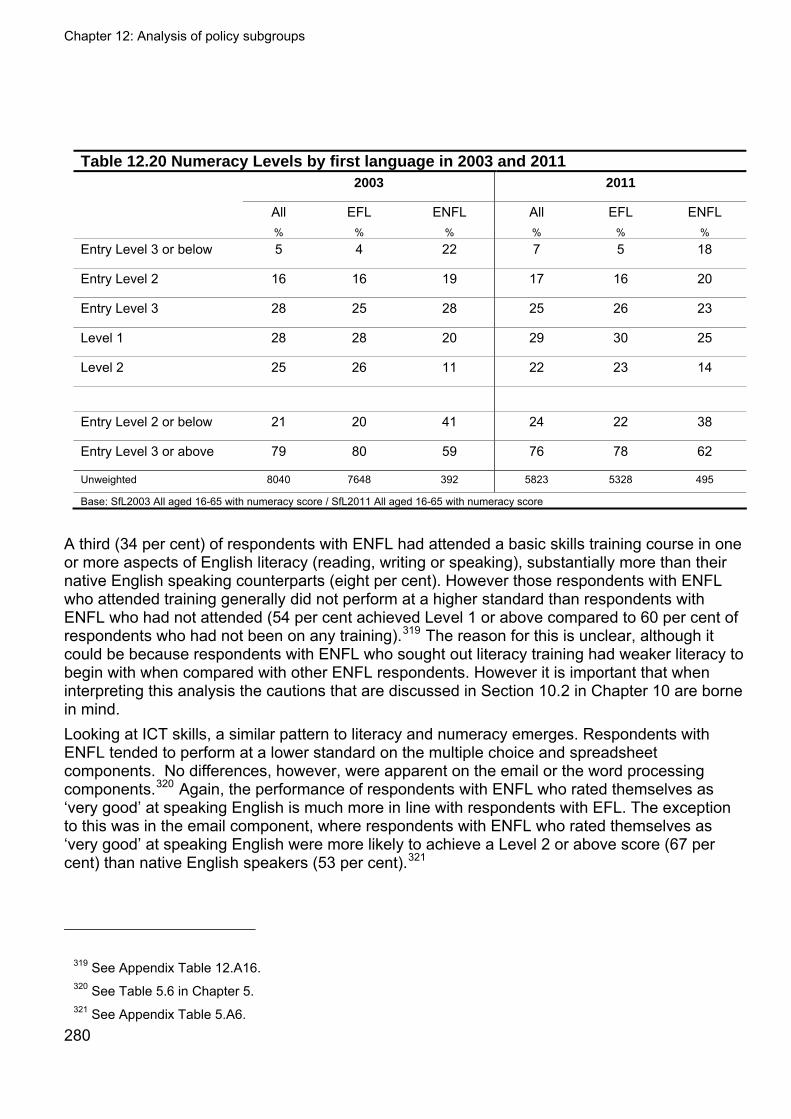
Chapter 12: Analysis of policy subgroups
280
Table 12.20 Numeracy Levels by first language in 2003 and 2011 2003 2011
All EFL ENFL All EFL ENFL % % % % % %
Entry Level 3 or below 5 4 22 7 5 18
Entry Level 2 16 16 19 17 16 20
Entry Level 3 28 25 28 25 26 23
Level 1 28 28 20 29 30 25
Level 2 25 26 11 22 23 14
Entry Level 2 or below 21 20 41 24 22 38
Entry Level 3 or above 79 80 59 76 78 62
Unweighted 8040 7648 392 5823 5328 495
Base: SfL2003 All aged 16-65 with numeracy score / SfL2011 All aged 16-65 with numeracy score
A third (34 per cent) of respondents with ENFL had attended a basic skills training course in one or more aspects of English literacy (reading, writing or speaking), substantially more than their native English speaking counterparts (eight per cent). However those respondents with ENFL who attended training generally did not perform at a higher standard than respondents with ENFL who had not attended (54 per cent achieved Level 1 or above compared to 60 per cent of respondents who had not been on any training).319 The reason for this is unclear, although it could be because respondents with ENFL who sought out literacy training had weaker literacy to begin with when compared with other ENFL respondents. However it is important that when interpreting this analysis the cautions that are discussed in Section 10.2 in Chapter 10 are borne in mind. Looking at ICT skills, a similar pattern to literacy and numeracy emerges. Respondents with ENFL tended to perform at a lower standard on the multiple choice and spreadsheet components. No differences, however, were apparent on the email or the word processing components.320 Again, the performance of respondents with ENFL who rated themselves as ‘very good’ at speaking English is much more in line with respondents with EFL. The exception to this was in the email component, where respondents with ENFL who rated themselves as ‘very good’ at speaking English were more likely to achieve a Level 2 or above score (67 per cent) than native English speakers (53 per cent).321
319 See Appendix Table 12.A16. 320 See Table 5.6 in Chapter 5. 321 See Appendix Table 5.A6.
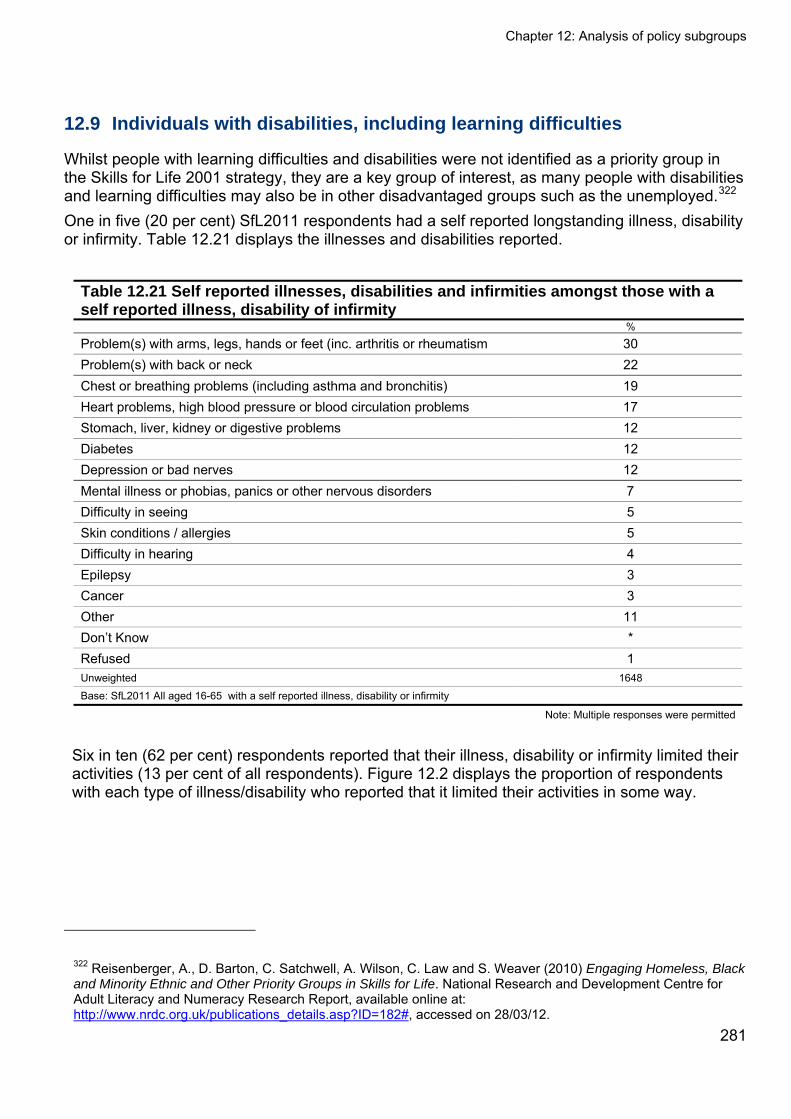
Chapter 12: Analysis of policy subgroups
281
12.9 Individuals with disabilities, including learning difficulties
Whilst people with learning difficulties and disabilities were not identified as a priority group in the Skills for Life 2001 strategy, they are a key group of interest, as many people with disabilities and learning difficulties may also be in other disadvantaged groups such as the unemployed.322 One in five (20 per cent) SfL2011 respondents had a self reported longstanding illness, disability or infirmity. Table 12.21 displays the illnesses and disabilities reported.
Table 12.21 Self reported illnesses, disabilities and infirmities amongst those with a self reported illness, disability of infirmity %
Problem(s) with arms, legs, hands or feet (inc. arthritis or rheumatism 30 Problem(s) with back or neck 22 Chest or breathing problems (including asthma and bronchitis) 19 Heart problems, high blood pressure or blood circulation problems 17 Stomach, liver, kidney or digestive problems 12 Diabetes 12 Depression or bad nerves 12 Mental illness or phobias, panics or other nervous disorders 7 Difficulty in seeing 5 Skin conditions / allergies 5 Difficulty in hearing 4 Epilepsy 3 Cancer 3 Other 11 Don’t Know * Refused 1 Unweighted 1648
Base: SfL2011 All aged 16-65 with a self reported illness, disability or infirmity
Note: Multiple responses were permitted Six in ten (62 per cent) respondents reported that their illness, disability or infirmity limited their activities (13 per cent of all respondents). Figure 12.2 displays the proportion of respondents with each type of illness/disability who reported that it limited their activities in some way.
322 Reisenberger, A., D. Barton, C. Satchwell, A. Wilson, C. Law and S. Weaver (2010) Engaging Homeless, Black and Minority Ethnic and Other Priority Groups in Skills for Life. National Research and Development Centre for Adult Literacy and Numeracy Research Report, available online at: http://www.nrdc.org.uk/publications_details.asp?ID=182#, accessed on 28/03/12.
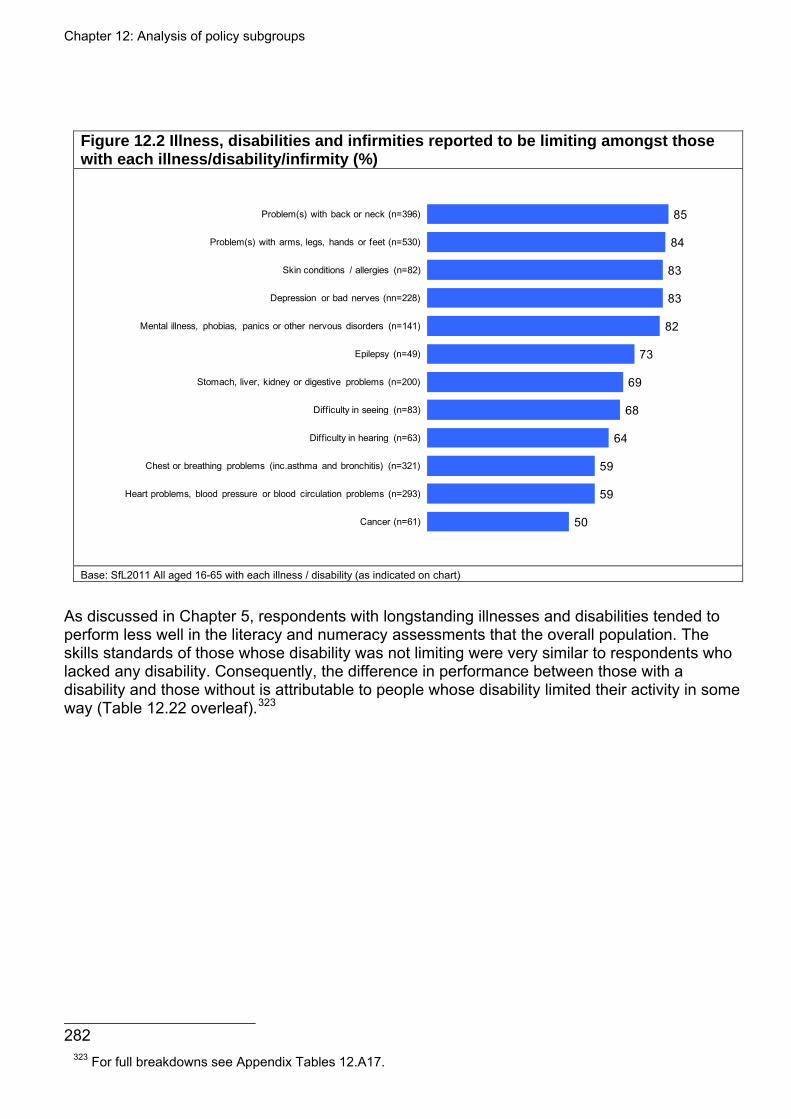
Chapter 12: Analysis of policy subgroups
282
Figure 12.2 Illness, disabilities and infirmities reported to be limiting amongst those with each illness/disability/infirmity (%)
85
84
83
83
82
73
69
68
64
59
59
50
Problem(s) with back or neck (n=396)
Problem(s) with arms, legs, hands or feet (n=530)
Skin conditions / allergies (n=82)
Depression or bad nerves (nn=228)
Mental illness, phobias, panics or other nervous disorders (n=141)
Epilepsy (n=49)
Stomach, liver, kidney or digestive problems (n=200)
Difficulty in seeing (n=83)
Difficulty in hearing (n=63)
Chest or breathing problems (inc.asthma and bronchitis) (n=321)
Heart problems, blood pressure or blood circulation problems (n=293)
Cancer (n=61)
Base: SfL2011 All aged 16-65 with each illness / disability (as indicated on chart)
As discussed in Chapter 5, respondents with longstanding illnesses and disabilities tended to perform less well in the literacy and numeracy assessments that the overall population. The skills standards of those whose disability was not limiting were very similar to respondents who lacked any disability. Consequently, the difference in performance between those with a disability and those without is attributable to people whose disability limited their activity in some way (Table 12.22 overleaf).323
323 For full breakdowns see Appendix Tables 12.A17.
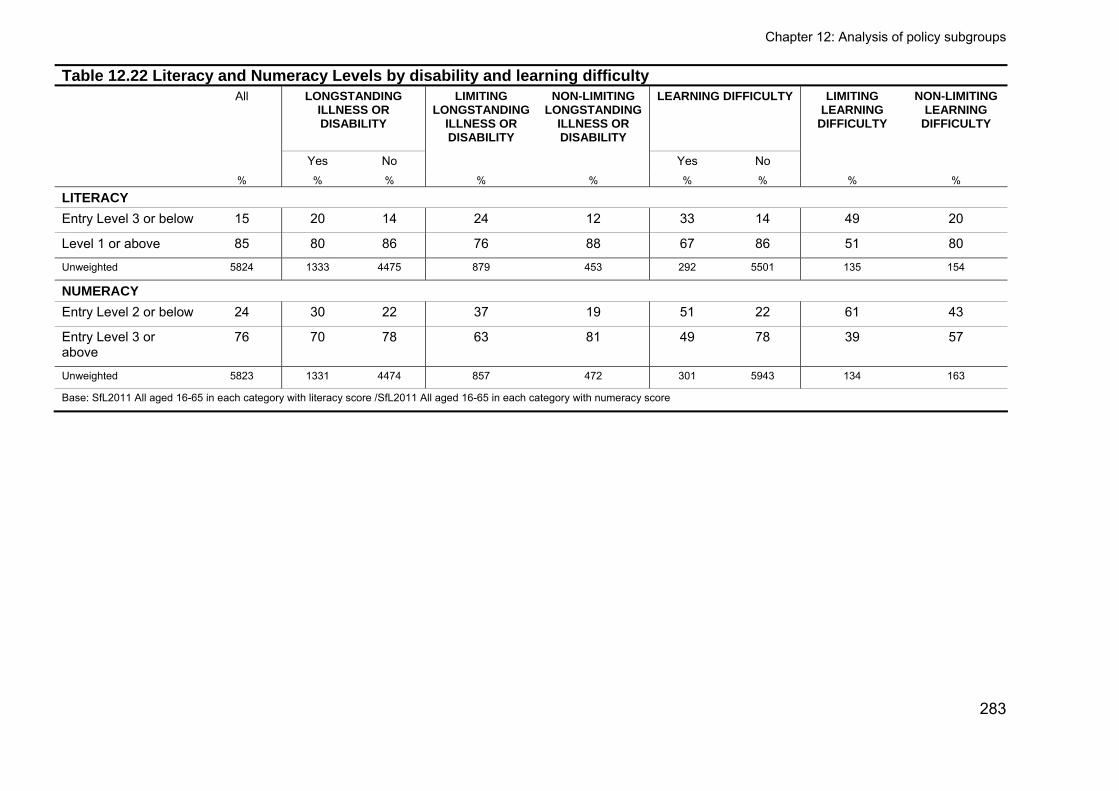
Chapter 12: Analysis of policy subgroups
Table 12.22 Literacy and Numeracy Levels by disability and learning difficulty All LONGSTANDING
ILLNESS OR DISABILITY
LIMITING LONGSTANDING
ILLNESS OR DISABILITY
NON-LIMITING LONGSTANDING
ILLNESS OR DISABILITY
LEARNING DIFFICULTY LIMITING LEARNING
DIFFICULTY
NON-LIMITING LEARNING
DIFFICULTY
Yes No Yes No % % % % % % % % %
LITERACY Entry Level 3 or below 15 20 14 24 12 33 14 49 20
Level 1 or above 85 80 86 76 88 67 86 51 80
Unweighted 5824 1333 4475 879 453 292 5501 135 154
NUMERACY Entry Level 2 or below 24 30 22 37 19 51 22 61 43
Entry Level 3 or above
76 70 78 63 81 49 78 39 57
Unweighted 5823 1331 4474 857 472 301 5943 134 163
Base: SfL2011 All aged 16-65 in each category with literacy score /SfL2011 All aged 16-65 in each category with numeracy score
283
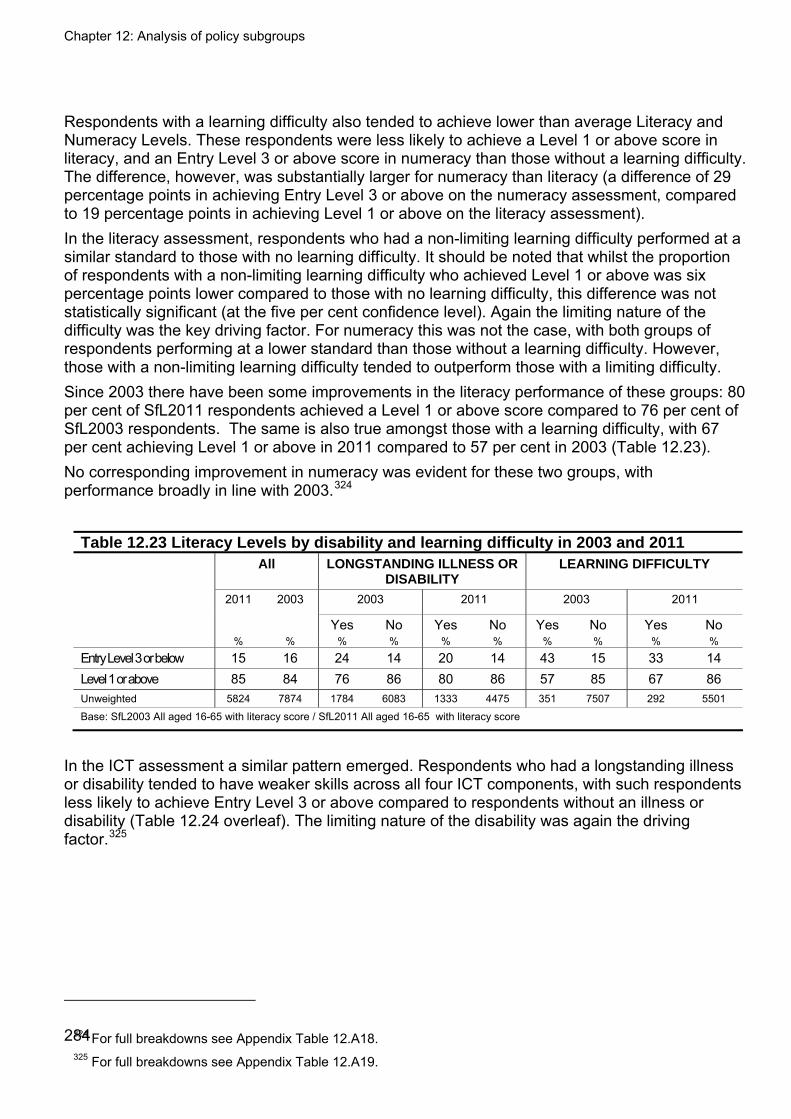
Chapter 12: Analysis of policy subgroups
2
84
Respondents with a learning difficulty also tended to achieve lower than average Literacy and Numeracy Levels. These respondents were less likely to achieve a Level 1 or above score in literacy, and an Entry Level 3 or above score in numeracy than those without a learning difficulty. The difference, however, was substantially larger for numeracy than literacy (a difference of 29 percentage points in achieving Entry Level 3 or above on the numeracy assessment, compared to 19 percentage points in achieving Level 1 or above on the literacy assessment). In the literacy assessment, respondents who had a non-limiting learning difficulty performed at a similar standard to those with no learning difficulty. It should be noted that whilst the proportion of respondents with a non-limiting learning difficulty who achieved Level 1 or above was six percentage points lower compared to those with no learning difficulty, this difference was not statistically significant (at the five per cent confidence level). Again the limiting nature of the difficulty was the key driving factor. For numeracy this was not the case, with both groups of respondents performing at a lower standard than those without a learning difficulty. However, those with a non-limiting learning difficulty tended to outperform those with a limiting difficulty. Since 2003 there have been some improvements in the literacy performance of these groups: 80 per cent of SfL2011 respondents achieved a Level 1 or above score compared to 76 per cent of SfL2003 respondents. The same is also true amongst those with a learning difficulty, with 67 per cent achieving Level 1 or above in 2011 compared to 57 per cent in 2003 (Table 12.23). No corresponding improvement in numeracy was evident for these two groups, with performance broadly in line with 2003.324
Table 12.23 Literacy Levels by disability and learning difficulty in 2003 and 2011 All LONGSTANDING ILLNESS OR
DISABILITY LEARNING DIFFICULTY
2011 2003 2003 2011 2003 2011
Yes No Yes No Yes No Yes No % % % % % % % % % %
Entry Level 3 or below 15 16 24 14 20 14 43 15 33 14 Level 1 or above 85 84 76 86 80 86 57 85 67 86 Unweighted 5824 7874 1784 6083 1333 4475 351 7507 292 5501
Base: SfL2003 All aged 16-65 with literacy score / SfL2011 All aged 16-65 with literacy score
In the ICT assessment a similar pattern emerged. Respondents who had a longstanding illness or disability tended to have weaker skills across all four ICT components, with such respondents less likely to achieve Entry Level 3 or above compared to respondents without an illness or disability (Table 12.24 overleaf). The limiting nature of the disability was again the driving factor.325
324 For full breakdowns see Appendix Table 12.A18. 325 For full breakdowns see Appendix Table 12.A19.
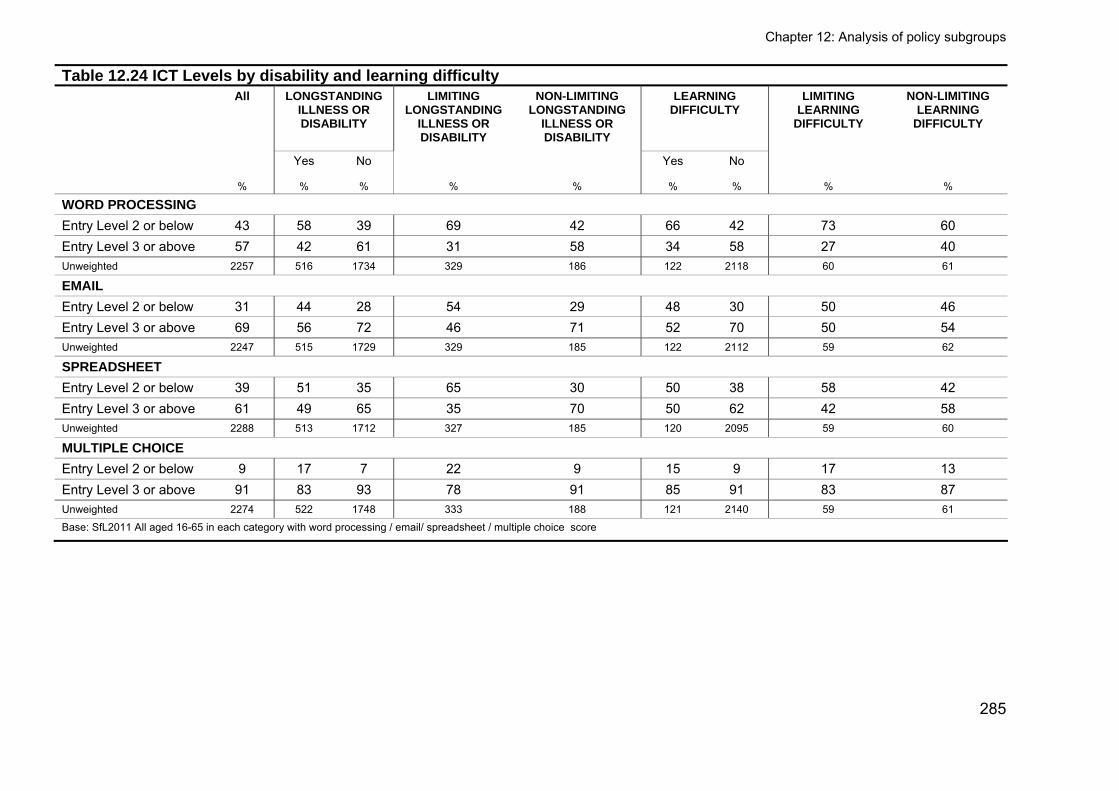
Chapter 12: Analysis of policy subgroups
Table 12.24 ICT Levels by disability and learning difficulty All LONGSTANDING
ILLNESS OR DISABILITY
LIMITING LONGSTANDING
ILLNESS OR DISABILITY
NON-LIMITING LONGSTANDING
ILLNESS OR DISABILITY
LEARNING DIFFICULTY
LIMITING LEARNING
DIFFICULTY
NON-LIMITING LEARNING
DIFFICULTY
Yes No Yes No
% % % % % % % % %
WORD PROCESSING
Entry Level 2 or below 43 58 39 69 42 66 42 73 60 Entry Level 3 or above 57 42 61 31 58 34 58 27 40 Unweighted 2257 516 1734 329 186 122 2118 60 61
Entry Level 2 or below 31 44 28 54 29 48 30 50 46 Entry Level 3 or above 69 56 72 46 71 52 70 50 54 Unweighted 2247 515 1729 329 185 122 2112 59 62
SPREADSHEET
Entry Level 2 or below 39 51 35 65 30 50 38 58 42 Entry Level 3 or above 61 49 65 35 70 50 62 42 58 Unweighted 2288 513 1712 327 185 120 2095 59 60
MULTIPLE CHOICE
Entry Level 2 or below 9 17 7 22 9 15 9 17 13 Entry Level 3 or above 91 83 93 78 91 85 91 83 87 Unweighted 2274 522 1748 333 188 121 2140 59 61
Base: SfL2011 All aged 16-65 in each category with word processing / email/ spreadsheet / multiple choice score
285
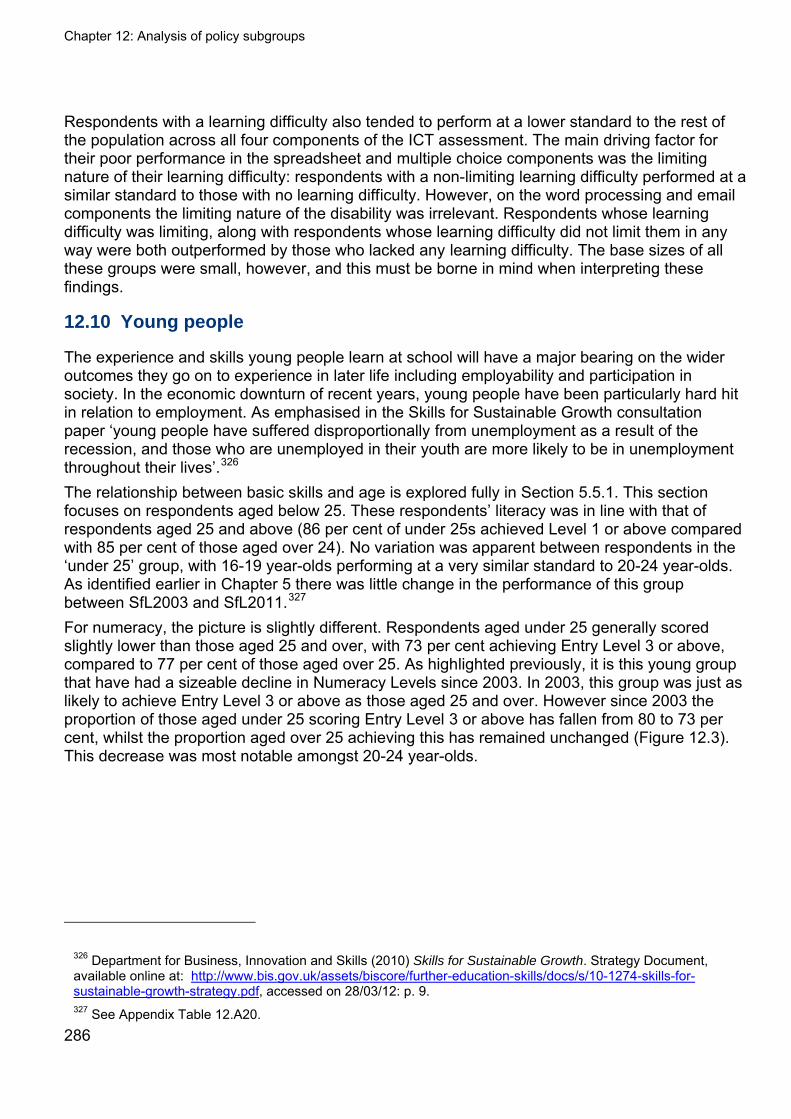
Chapter 12: Analysis of policy subgroups
286
Respondents with a learning difficulty also tended to perform at a lower standard to the rest of the population across all four components of the ICT assessment. The main driving factor for their poor performance in the spreadsheet and multiple choice components was the limiting nature of their learning difficulty: respondents with a non-limiting learning difficulty performed at a similar standard to those with no learning difficulty. However, on the word processing and email components the limiting nature of the disability was irrelevant. Respondents whose learning difficulty was limiting, along with respondents whose learning difficulty did not limit them in any way were both outperformed by those who lacked any learning difficulty. The base sizes of all these groups were small, however, and this must be borne in mind when interpreting these findings.
12.10 Young people
The experience and skills young people learn at school will have a major bearing on the wider outcomes they go on to experience in later life including employability and participation in society. In the economic downturn of recent years, young people have been particularly hard hit in relation to employment. As emphasised in the Skills for Sustainable Growth consultation paper ‘young people have suffered disproportionally from unemployment as a result of the recession, and those who are unemployed in their youth are more likely to be in unemployment throughout their lives’.326 The relationship between basic skills and age is explored fully in Section 5.5.1. This section focuses on respondents aged below 25. These respondents’ literacy was in line with that of respondents aged 25 and above (86 per cent of under 25s achieved Level 1 or above compared with 85 per cent of those aged over 24). No variation was apparent between respondents in the ‘under 25’ group, with 16-19 year-olds performing at a very similar standard to 20-24 year-olds. As identified earlier in Chapter 5 there was little change in the performance of this group between SfL2003 and SfL2011.327 For numeracy, the picture is slightly different. Respondents aged under 25 generally scored slightly lower than those aged 25 and over, with 73 per cent achieving Entry Level 3 or above, compared to 77 per cent of those aged over 25. As highlighted previously, it is this young group that have had a sizeable decline in Numeracy Levels since 2003. In 2003, this group was just as likely to achieve Entry Level 3 or above as those aged 25 and over. However since 2003 the proportion of those aged under 25 scoring Entry Level 3 or above has fallen from 80 to 73 per cent, whilst the proportion aged over 25 achieving this has remained unchanged (Figure 12.3). This decrease was most notable amongst 20-24 year-olds.
326 Department for Business, Innovation and Skills (2010) Skills for Sustainable Growth. Strategy Document, available online at: http://www.bis.gov.uk/assets/biscore/further-education-skills/docs/s/10-1274-skills-for-sustainable-growth-strategy.pdf, accessed on 28/03/12: p. 9. 327 See Appendix Table 12.A20.
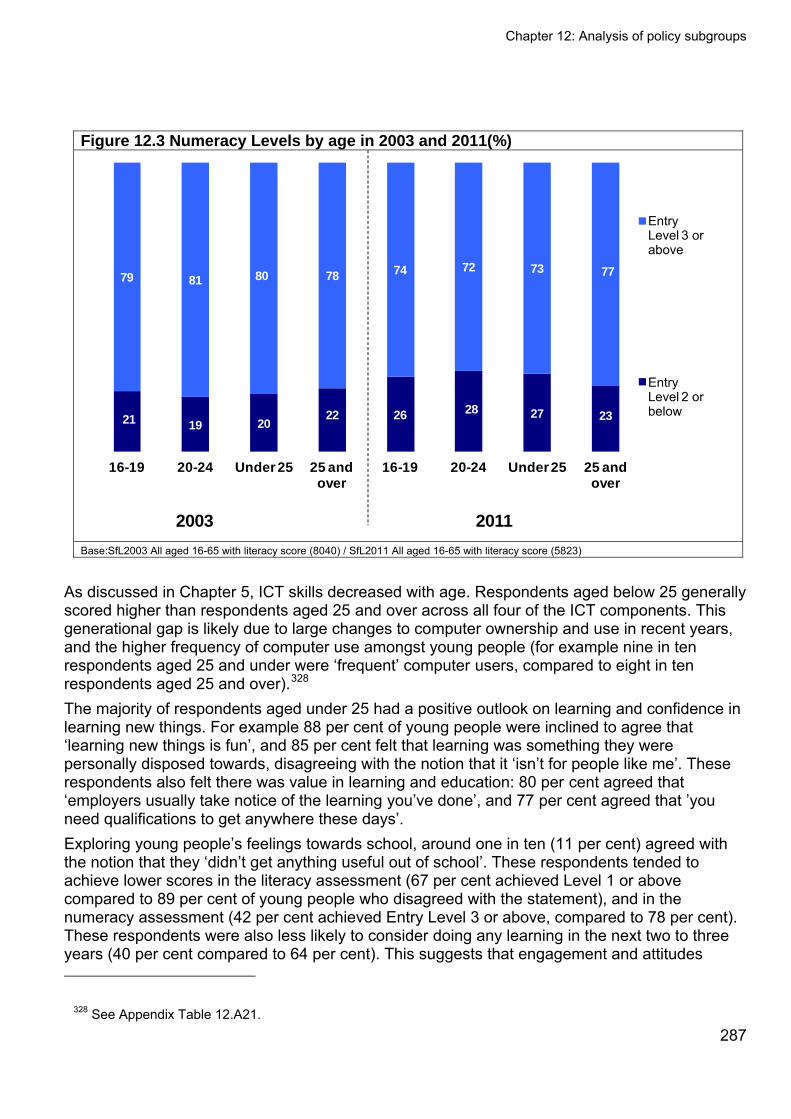
Chapter 12: Analysis of policy subgroups
Figure 12.3 Numeracy Levels by age in 2003 and 2011(%)
21 19 2022 26 28 27 23
79 81 80 78 74 72 73 77
16-19 20-24 Under 25 25 and over
16-19 20-24 Under 25 25 and over
Entry Level 3 or above
Entry Level 2 or below
2003 2011 Base:SfL2003 All aged 16-65 with literacy score (8040) / SfL2011 All aged 16-65 with literacy score (5823)
As discussed in Chapter 5, ICT skills decreased with age. Respondents aged below 25 generally scored higher than respondents aged 25 and over across all four of the ICT components. This generational gap is likely due to large changes to computer ownership and use in recent years, and the higher frequency of computer use amongst young people (for example nine in ten respondents aged 25 and under were ‘frequent’ computer users, compared to eight in ten respondents aged 25 and over).328 The majority of respondents aged under 25 had a positive outlook on learning and confidence in learning new things. For example 88 per cent of young people were inclined to agree that ‘learning new things is fun’, and 85 per cent felt that learning was something they were personally disposed towards, disagreeing with the notion that it ‘isn’t for people like me’. These respondents also felt there was value in learning and education: 80 per cent agreed that ‘employers usually take notice of the learning you’ve done’, and 77 per cent agreed that ’you need qualifications to get anywhere these days’. Exploring young people’s feelings towards school, around one in ten (11 per cent) agreed with the notion that they ‘didn’t get anything useful out of school’. These respondents tended to achieve lower scores in the literacy assessment (67 per cent achieved Level 1 or above compared to 89 per cent of young people who disagreed with the statement), and in the numeracy assessment (42 per cent achieved Entry Level 3 or above, compared to 78 per cent). These respondents were also less likely to consider doing any learning in the next two to three years (40 per cent compared to 64 per cent). This suggests that engagement and attitudes
328 See Appendix Table 12.A21. 287
Chapter 12: Analysis of policy subgroups
288
towards school are important in determining (or reflecting) the abilities of young people and their attitudes towards future learning. 12.10.1 Young lone parents Young lone parents are potentially a vulnerable group in society, as the demands of single parenthood at a young age lead to an increased chance of leaving education early, and not being in employment. Young lone parents (those aged under 25) made up one per cent of the survey respondents, which meant only limited analysis could be conducted with regards to this group. Therefore the following analysis must be treated with caution. Young lone parents were less likely to be in paid employment than all under 25 year-olds (36 per cent versus 52 per cent), and more likely not to be in education or training (NET) (84 per cent versus 48 per cent). Despite their lower likelihood of being in employment, education or training, young lone parents were not found to have lower Literacy Levels than young people in general (86 per cent in each group achieved Level 1 or above). Their numeracy performance was slightly weaker, with a smaller proportion achieving Level 1 (11 per cent versus 27 per cent of all under-25 year-olds) or Level 2 or above (six per cent versus 17 per cent of all under-25 year-olds).329 Analysis of ICT Levels is not possible due to small base sizes Examination of young lone parents’ attitudes towards learning suggests that a sizeable proportion of them may return to education in the future. Just under six in ten (58 per cent) agreed with the statement ‘I wish I had carried on longer in education’; a similar proportion (57 per cent) reported that they would like to do some sort of learning again in the future.
329 See Appendix Table 12.A22.
Chapter 13: Spiky profiles
289
13 Spiky profiles 13.1 Key Findings
This chapter provides an analysis of respondents’ sub-skills in literacy, numeracy and ICT, as demonstrated in the Skills for Life 2003 Survey (SfL2003) and Skills for Life 2011 Survey (SfL2011). Literacy sub-skills
The following literacy sub-skills were assessed: reading comprehension, vocabulary and word recognition, elements of composition, and writing (composition, spelling, grammar and punctuation). Speaking and listening skills were not assessed.
Analysis of the literacy sub-skills revealed that, with few exceptions, SfL2003 respondents and SfL2011 respondents who achieved the same Literacy Level share largely the same profile of strengths and weaknesses.
Reading and word recognition is the strongest skill area for both SfL2003 and SfL2011 respondents at all Literacy Levels. Elements of composition was the skill area that consistently revealed the largest gap between SfL2003 and SfL2011 respondents, suggesting a possible loss of writing composition skills over the period.
At Entry Levels, SfL2003 and SfL2011 respondents tended to have substantially better word recognition skills than comprehension skills. The difference between standards in these two topics is much reduced at Levels 1 and 2. Respondents at Levels 1 and 2 have stronger reading skills than writing skills.
Numeracy sub-skills
For numeracy, the following sub-skills were assessed: number, measures, shape and space, and handling data.
Analysis of the sub-skills revealed that, irrespective of the Numeracy Level achieved, SfL2003 respondents displayed either higher or equivalent skills to their SfL2011 counterparts. Moreover, the ranking of the sub-skill areas (from strongest to weakest) is the same for SfL2003 and SfL2011 respondents who achieved the same Numeracy Level. Taken together, these findings suggest a consistent difference between 2003 and 2011 sub-skill performance, with higher skills overall in 2003 than in 2011.
At Entry Levels 1 and 2, number skills are weakest and handling data is the strongest skill area. At Levels 1 and 2, number skills are stronger than the other sub-skill areas.
ICT sub-skills
The ICT assessment in SfL2011 assessed email, word processing and spreadsheet practical skills, and ICT knowledge using multiple choice questions. No comparable assessment data are available from 2003.
Skills in each of the three practical components are highly correlated. However, success on the multiple choice component is not a very good predictor of real practical skills.
Chapter 13: Spiky profiles
290
13.2 Introduction
This chapter presents additional detail about the Skills for Life 2011 Survey (SfL2011) respondents’ sub-skills in the topics assessed in the literacy, numeracy and ICT assessments, and compares the results with findings from the Skills for Life 2003 Survey (SfL2003). The topics assessed are as follows:
For literacy, reading comprehension, vocabulary and word recognition, elements of composition and writing (composition, spelling, grammar and punctuation). Note that speaking and listening skills were not assessed;
For numeracy, number, measures, shape and space, and handling data;
For ICT, skills in email, word processing and spreadsheets, and wider knowledge of ICT.
With respect to the profiling of skills in adult literacy and numeracy, it is worth repeating here what was written as the introduction to Chapter 9 (Spiky profiles in literacy and numeracy) of the SfL2003 report, as the same concerns and considerations apply to SfL2011.330
‘It is widely accepted that any assessment of adults’ literacy and numeracy skills will reveal a wide range of different skill profiles reflecting individual strengths and weaknesses. These are often called ‘spiky profiles’. Adults operating at broadly the same level are likely to perform at a higher level in certain skill areas than in others. They may, for example, be at a higher level for reading than writing or, at a more detailed level, be stronger at spelling than grammar.
Each test covered a number of different topic areas so it is possible to assess respondents’ relative performance in each. However, it should be borne in mind that each respondent will have faced only a small number of questions on each topic. This makes any topic analysis very sensitive to the ‘single item effect’. Some questions will prove more (or less) difficult than expected because of the way they are presented to respondents. This effect can never be entirely neutralised and is an accepted fact of test design. When there are very few questions, the influence of each question’s presentation will be magnified. Unfortunately, a question cannot be stripped of its presentation to reveal its ‘underlying’ difficulty.
Therefore, a strong caveat must be placed upon the following analysis. Although unlikely, conclusions reached about respondents’ relative performance on each topic may be due to accumulated single item effect. This analysis should be taken as a prompt for further investigation rather than the last word on the subject.’
We enlarge on these matters in the analysis that follows. The profiling of sub-skills in ICT was undertaken entirely separately from the work on literacy and numeracy, and involves far fewer caveats as the assessment is not adaptive, and the topics
330 Williams, J., S. Clemens, S. Oleinikova, and K. Tarvin (2003) The Skills for Life Survey: a National Needs and Impact Survey of Literacy, Numeracy and ICT skills. Department for Education and Skills Research Report 490, available online at: https://www.education.gov.uk/publications/standard/publicationDetail/Page1/RR490, accessed on 28/03/12: p. 129-134.
Chapter 13: Spiky profiles
291
considered align with the assessment activities undertaken very closely so concerns about content validity and adequate item numbers are greatly reduced.
13.3 Methodology for analysis of literacy and numeracy sub-skills
The purpose of the analysis in this chapter is to identify the profile of skills in the topics listed in the chapter introduction, for each of literacy, numeracy and ICT. The method aims to assess relative skill standards in these topics for each of the five outcome Level groups completing each of the assessments, so that conclusions such as ‘Level 2 or above literacy respondents tended to be stronger at punctuation than at grammar’ can be drawn.
For both the literacy and numeracy assessments, respondents follow different paths through the questions as the assessments adapt to their performance. More information about the design of the assessment is included in Annex 2, and the pathways followed are described in Annex 4. Additionally, Annex 6 describes the problems encountered during the 2003 survey which led to level outcomes for around 6 per cent of respondents not being recorded, and, for the remainder, some respondents’ answers to certain questions not being recorded properly. Although the assessment design aims to present a balanced range of topics irrespective of the path followed, inevitably some respondents will attempt more and/or harder questions on certain topics than others. This means that a simple performance index based on score on items by topic cannot be used – rather, a weighting is applied to the score achieved for each item based on its Level.
13.3.1 Classification of literacy and numeracy assessment items Each item (a question, but including multi-part questions which are considered as a single question) was assigned to a topic. In the case of literacy, the topics were retained from the work in 2003 and the mapping of items to topics is shown in Annex Table 2.1 in Annex 2 Section 2.4.5. For numeracy a new range of three topics was created and items were coded against it (as the original coding from 2003 is not recorded other than for items derived from pre-existing tests). The mapping for numeracy items to topics is shown in Annex Tables 2.4 and 2.5 in Annex 2 Section 2.5.5). For both subjects, items commonly cover more than one topic. This results from the design brief requiring coverage of as many topics as possible within a given time for the assessment. In each case the main topic covered based on expert review is included.
13.3.2 Calculation of sub-skill topic performance index for literacy and numeracy The method used to calculate the skill Levels in individual topics is as follows, repeated for literacy and numeracy.331 It is also repeated on the SfL2003 dataset: the methodology presented here was seen to offer improvements over that used in the SfL2003 report.
331 The methodology presented here is similar to the one presented in Chapter 9 of the SfL2003 report. It has not been possible to fully recreate the 2003 methodology as fully detailed information about the handling of partial scores and item exclusions was not recorded in the 2003 analysis of Literacy as has information about the curriculum/topic coding of numeracy items in the 2003 analysis has also not been recorded. This makes faithful replication of the method impossible, and so the method presented here has been run on both the SfL2003 and SfL2011 datasets.
Chapter 13: Spiky profiles
292
1. Remove from analysis of both the SfL2003 and SfL2011 datasets those items for which sound data do not exist (see Section 13.3.3).
2. Divide the respondents into five groups by outcome Level. 3. For each topic and skill Level:
a. Calculate the item weighted score for each item. This is calculated as item marks x item Level
i. Item marks is the score the respondent achieved on the item. ii. Item Level is as follows: Entry Level 1=1, Entry Level 2=2, etc. Level 2=5. iii. So, for example, a Level 1 item where the respondent scores 3 is worth 12,
a Level 2 item with a score of 2 scores 10, etc.
b. Calculate the weighted score total for all items attempted – the sum of item weighted scores.
c. Calculate the weighted item maximum mark. This is calculated as item maximum marks x item Level.
i. Item maximum marks is the maximum marks available for each item.
d. Calculate the weighted maximum marks total for all items attempted – the sum of weighted item maximum marks.
e. Calculate the topic performance index: (weighted score total/weighted maximum marks total). This has no units – it is simply an index from 0 to 1, a relative measure of respondents’ performance on items covering a particular topic.
4. Calculate the average topic performance index for all respondents in the Level group.
5. Repeat for all topics and all Level groups.
6. For each Level and for each topic, calculate the average number of items per respondent (across all respondents in the group) that have contributed to the weighted score total. Set a threshold and report results in (5) that are below that Level as less reliable than others.
The output from these analyses is, for each respondent group (by outcome Level), an estimated Level for each of the topics that the assessment measures. These can be compared against each other (for example to conclude that respondents at Level 2 or above in literacy tend to be stronger at reading tasks than writing tasks). It cannot be used to compare topic performance between respondent groups (for example, comparing respondents at Level 1 in literacy with those at Level 2 or above) for the reasons described below.
As a final point, it should be noted that the method used for assigning literacy and numeracy overall outcome levels to respondents in the survey, described in Annex 2, allows for an element of compensation (doing particularly well in one topic can compensate for particularly poor
Chapter 13: Spiky profiles
293
performance in another). This is discussed in more detail in Section 13.3.4 (point 5 below). In the analysis in this chapter, which considers performance on specific topics for groups of respondents at each of the outcome levels, a different method of performance calculation is used which does not include any form of compensation.
13.3.3 Issues with the literacy and numeracy data In implementing this method, a number of issues were encountered in the literacy data.
1. In 2003, the data non-capture problem meant that data for certain items was not recorded for some respondents (although account was taken of the responses in the adaptive routing). Since all data for these items was deleted in the SfL2003 dataset, this deletion was repeated for the SfL2011 dataset in the interests of comparability. The items in question are: BB104, BB61, BB93, MY5, MY115, MY9, RR104, RR42, RR9 (see Annex 2 Section 2.3.5). These items play no part in the profile analysis in this chapter.
2. Three items (BB6, BB8, RR8) have unreliable data in the SfL2003 dataset: each item is worth more than one mark, but the SfL2003 dataset resolves all scores to 1 or 0, and it is not clear how that process was undertaken for these items. These items are therefore also excluded from the analysis in this chapter.
3. Finally, spiky profile analysis was not undertaken for around 250 SfL2011 respondents without Levels recorded for numeracy and/or literacy (e.g. those who chose not to respond, or could not read English).
13.3.4 Caveats for the literacy and numeracy sub-skill analysis There are several strong caveats associated with the spiky profile analysis undertaken in 2003 and 2011. These have an unquantifiable impact. For this reason, the results in this chapter must be treated with great care.
1. Very limited numbers of appropriate Level items to make a judgement about the Level of skill in a topic In a typical minimum competence assessment, respondents would be expected to undertake a significant number of items at the required Level. The SfL2003 and SfL2011 literacy and numeracy assessments were not designed with the intention of measuring skills in a topic but for producing an overall Level. For all topic areas, the number of items on which the skill judgement is based is limited, as a result of the time constraints for the assessment. Many items also cover more than one topic, as mentioned above, which potentially affects the discriminating power of these items for a single topic. The results where the average number of items presented per topic per respondent (for each group) falls below three have been noted, but arguably in many cases there is insufficient evidence to draw a secure judgement about respondents’ topic Level.
2. Conflation of topics Many of the topics are broad – for example the entire numeracy domain is divided into only three topics (‘number’, ‘measures, shape and space’, and ‘handling data’). It cannot be assumed that within that topic all the items for particular sub-topics are of equal difficulty. Given that respondents experience differing sets of items (particularly respondents in different outcome Level groups), no comparison can be made between the reported topic Levels between these different output Level groups. So, for example, a score of 0.75 for
Chapter 13: Spiky profiles
294
respondents with Level 2 or above Numeracy has no meaning when considering the score for respondents with Level 1 Numeracy.
3. Assumption that all marks available for multi-mark items cover the same topic and all items only cover one topic each There is a major assumption that each item tests one topic only. In practice this was not a design requirement for the literacy and numeracy assessments. Instead, the requirement was to assess overall skill standards as quickly as possible, and the testing of multiple topics within a single item (more common for higher Level items) offers some benefits in this scenario. The spiky profile analysis assumes that items cover only one topic and in the case of numeracy in 2011 the topic coding of items has been done by inspection rather than being based on the design data at the time.
4. Item tariff assumptions (literacy only) In literacy, some items are worth more than one raw mark, with partial marks available. Given that these higher tariff items count as more valuable than a single mark item for determining a respondent’s overall Level, the methodology for the skills profile retains that weight. However, this does mean that high tariff items (for example item 44 (MY3), which is worth five marks) have a very high bearing on the topic skill Level for those respondents that attempted the item. This increases the reliance on individual items, and includes an assumption (noting caveat 3) that multi-mark items are essentially multiple items with several competency assessments contained within them, rather than a graded assessment of skills (this is the case for most items by inspection but may not be true for all).
5. Compensation Fundamentally Skills for Life is a competency-based set of standards. This means that (in assessment terms) respondents are expected to be able to demonstrate competency in the majority of topics. Being really good at one topic should not compensate for poor performance in another topic, and similarly, for example, having Level 1 skills in a topic should have no bearing on assessment of ability at Level 2 or above. This is in contrast to GCSE and other academic qualifications where the norm is to allow scores for strength in one area to compensate (to an extent at least) for weakness in another.
Both the literacy and numeracy assessments use a degree of compensation in calculating a final Level. For example, all respondents’ performance on all items counts for something in calculating a Numeracy Level. This derogation is common in competency assessments, particularly for assessments at lower Levels, but pass marks/cut scores are generally held high, which reduces the possibility of passing an assessment with very low skills in particular topics.
An ideal analysis would consider each respondent’s performance at each Level in each topic to form a judgement as to their Level. However there are insufficient items to do this so, as an alternative, items are weighted according to Level (which is counter to the principles of competency assessment) and results are displayed as a score index. Thus, no interpretation of the Level of skill required for each topic should be made.
6. The profiles are based on item performance Within competency based curricula and standards there is generally no requirement that topics must all be of the same difficulty. The Skills for Life curricula are based on
Chapter 13: Spiky profiles
295
requirements for literacy and numeracy in everyday life, which in turn are based on judgements of skill Levels required in individual topics for adequacy. A judgement of overall skill Level underlies the curriculum design and is implicit in the assessment criteria and examination content. With each new version of the curricula, some topics are moved from one Level to another, reflecting changes in the requirements of adequacy or perhaps differing views between curriculum experts. Thus, if certain topics are harder than others this is not necessarily a cause for concern (in practice though, topic difficulty tends to play a part in adequacy judgements).
While the SfL2003 and SfL2011 assessment items were designed to provide reasonable coverage of testable topics, the primary concern was a reliable judgement of overall Level. With such a small number of items for each topic, it is impossible to distinguish between the difficulty of the item and the difficulty of the topic as a whole. The fact that certain topics appear more difficult may relate to the difficulty of individual items. This is, of course, a feature of many assessments, however the development of assessments often involves benchmarking against other assessment information. This was not done for the SfL2003 and SfL2011 assessments: the assessments were based solely on the live assessment items and curricula specification which were in existence at the time, coupled with expert judgement.
7. Weighting of items is based on a linear scale Items are weighted by a multiple of 1 to 5. This assumes that, for example, Entry Level 2 represents twice the skill standards of Entry Level 1 (or below), or that Level 2 (or above) is 25 per cent higher than Level 1, etc. This involves very large assumptions about respondent progression which cannot be quantified in this work.
13.4 Sub-skill outcomes for literacy
The purpose of SfL2011 with regards to literacy was to establish as accurately as possible the literacy competences of the adult population (aged 16-65) of England and make comparisons with its performance in 2003, using the same assessment instruments. The items used for the assessments in both surveys were based on a limited range of assessment criteria and accompanying examples taken from the Adult Literacy Core Curriculum.332 Neither SfL2003 nor SfL2011 included, for example, items relating to Speaking & Listening. Moreover, given the nature of the computerised assessment instrument, items could not be included to assess practical, hands-on, writing skills. However, it was possible to include items on both reading and writing skills and thus reveal some particular strengths and weaknesses from the ways in which respondents performed in different skill areas.
Skills for Life programmes emphasise the need to carry out initial assessments of learners in order to establish not only their general standard of skills but also a profile of their strengths and weaknesses. This provides a platform on which to focus teaching and learning. The resulting profile for any individual learner is often uneven, so that she/he may be strong in reading skills
332 Department for Education and Skills (2001) Adult Literacy Core Curriculum including Spoken Communication, available online at: http://rwp.excellencegateway.org.uk/resource/Adult+literacy+core+curriculum/pdf/, accessed on 28/03/12.
Chapter 13: Spiky profiles
296
but weak in spelling, punctuation and/or grammar. This is commonly referred to as a ‘spiky profile’ by teachers of adults and is particularly valuable when working with less able learners who tend to show greater degrees of 'spikiness' than their more able colleagues.
SfL2011 employs the same items and assessment instrument as that used in SfL2003 and is therefore designed to take account of the variations in performance item by item, skill by skill. By extrapolation, it is thus possible to draw broad conclusions about the literacy skills' profile of the adult population (aged 16-65 inclusive) of England. As in SfL2003, the analysis of data for SfL2011 respondents reveals that it is possible to consider ‘spikiness’ under three headings: 4. the spiky profile of the mean scores of groups of respondents at each Level; 5. the spiky profiles of individual respondents; and 6. the movement of respondents between Levels. It should be emphasised that the summary findings here cover only the first of these. As mentioned above, the nature and limitations of the computerised assessment instrument and the amount of time available for the survey enable only a partial snapshot of aspects of literacy and by no means complete coverage of the skills identified in the Adult Core Curriculum. The literacy assessment used an adaptive algorithm with a total of 70 items (see Annex 2 for a full description of how the assessment functions). The items cover five Levels from Entry Level 1 to Level 2 and are organised in three layers - the first being a screening layer. All respondents attempt the first four items in the screening layer but, thereafter are routed automatically on the basis of how well they perform, to appropriate Levels and items. The individual respondent is unaware of the route they are on or how well they have performed. This arrangement has the advantage of routing respondents quickly to items at an appropriate Level. It should be noted that although the items assess performance criteria at each of five levels from Entry Level 1 to Level 2, outcomes for respondents are in five groups from Entry Level 1 or below to Level 2 or above. With no items assessing performance against criteria below Entry Level 1 or above Level 2, the assessment cannot distinguish between those respondents at Entry Level 1 and those below it, or between those respondents at Level 2 and those above it.
13.4.1 Literacy coverage The items used in SfL2011 are taken from the Adult Literacy Core Curriculum and can be divided into five broad sub-skill areas:
Reading (comprehension) – text focus, curriculum code (Rt)
Reading (vocabulary, word recognition) - word focus, curriculum code (Rw)
Writing (composition) – text focus, curriculum code (Wt) Writing (spelling) – curriculum code (Ww) Writing (grammar and punctuation) – curriculum code (Ws).
The algorithm was structured to ensure that all respondents faced a small number of items in each of the above categories and care was taken to ensure that, as far as possible, comparable criteria were addressed at all Levels as respondents progressed through the algorithm, layer by layer. Bearing that in mind, we may draw the following tentative conclusions from the data below. Note that each Level group is presented separately, and that the proportions of the population cited at
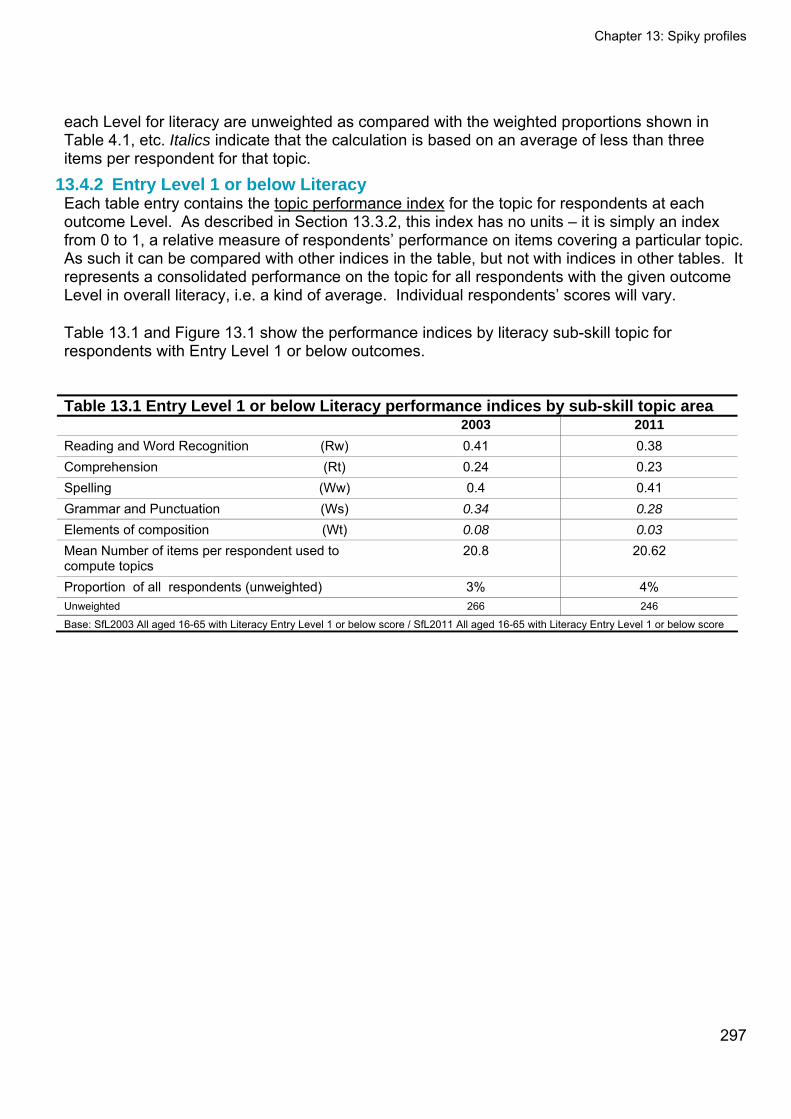
Chapter 13: Spiky profiles
each Level for literacy are unweighted as compared with the weighted proportions shown in Table 4.1, etc. Italics indicate that the calculation is based on an average of less than three items per respondent for that topic.
13.4.2 Entry Level 1 or below Literacy Each table entry contains the topic performance index for the topic for respondents at each outcome Level. As described in Section 13.3.2, this index has no units – it is simply an index from 0 to 1, a relative measure of respondents’ performance on items covering a particular topic. As such it can be compared with other indices in the table, but not with indices in other tables. It represents a consolidated performance on the topic for all respondents with the given outcome Level in overall literacy, i.e. a kind of average. Individual respondents’ scores will vary.
Table 13.1 and Figure 13.1 show the performance indices by literacy sub-skill topic for respondents with Entry Level 1 or below outcomes.
Table 13.1 Entry Level 1 or below Literacy performance indices by sub-skill topic area 2003 2011
Reading and Word Recognition (Rw) 0.41 0.38 Comprehension (Rt) 0.24 0.23 Spelling (Ww) 0.4 0.41 Grammar and Punctuation (Ws) 0.34 0.28
Elements of composition (Wt) 0.08 0.03
Mean Number of items per respondent used to compute topics
20.8 20.62
Proportion of all respondents (unweighted) 3% 4% Unweighted 266 246
Base: SfL2003 All aged 16-65 with Literacy Entry Level 1 or below score / SfL2011 All aged 16-65 with Literacy Entry Level 1 or below score
297
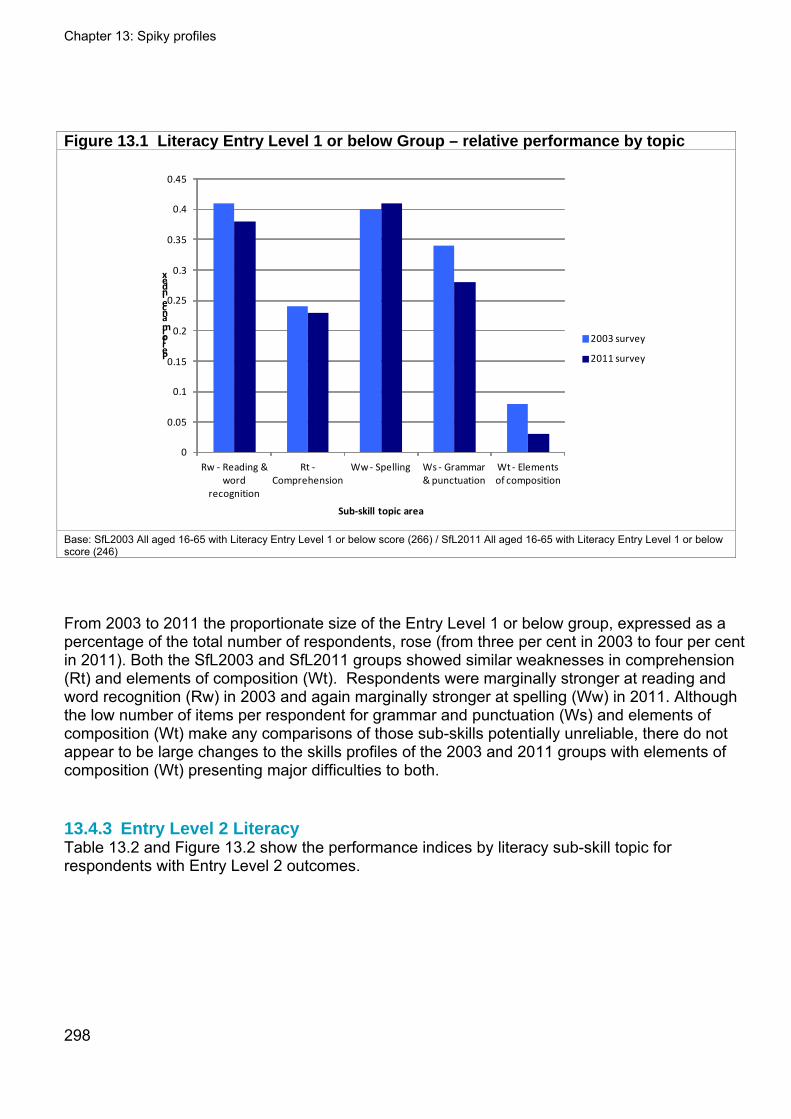
Chapter 13: Spiky profiles
Figure 13.1 Literacy Entry Level 1 or below Group – relative performance by topic
0
0.05
0.1
0.15
0.2
0.25
0.3
0.35
0.4
0.45
Rw ‐ Reading & word
recognition
Rt ‐Comprehension
Ww ‐ Spelling Ws ‐ Grammar & punctuation
Wt ‐ Elements of composition
Performance index
Sub‐skill topic area
2003 survey
2011 survey
Base: SfL2003 All aged 16-65 with Literacy Entry Level 1 or below score (266) / SfL2011 All aged 16-65 with Literacy Entry Level 1 or below score (246)
From 2003 to 2011 the proportionate size of the Entry Level 1 or below group, expressed as a percentage of the total number of respondents, rose (from three per cent in 2003 to four per cent in 2011). Both the SfL2003 and SfL2011 groups showed similar weaknesses in comprehension (Rt) and elements of composition (Wt). Respondents were marginally stronger at reading and word recognition (Rw) in 2003 and again marginally stronger at spelling (Ww) in 2011. Although the low number of items per respondent for grammar and punctuation (Ws) and elements of composition (Wt) make any comparisons of those sub-skills potentially unreliable, there do not appear to be large changes to the skills profiles of the 2003 and 2011 groups with elements of composition (Wt) presenting major difficulties to both.
13.4.3 Entry Level 2 Literacy Table 13.2 and Figure 13.2 show the performance indices by literacy sub-skill topic for respondents with Entry Level 2 outcomes.
298
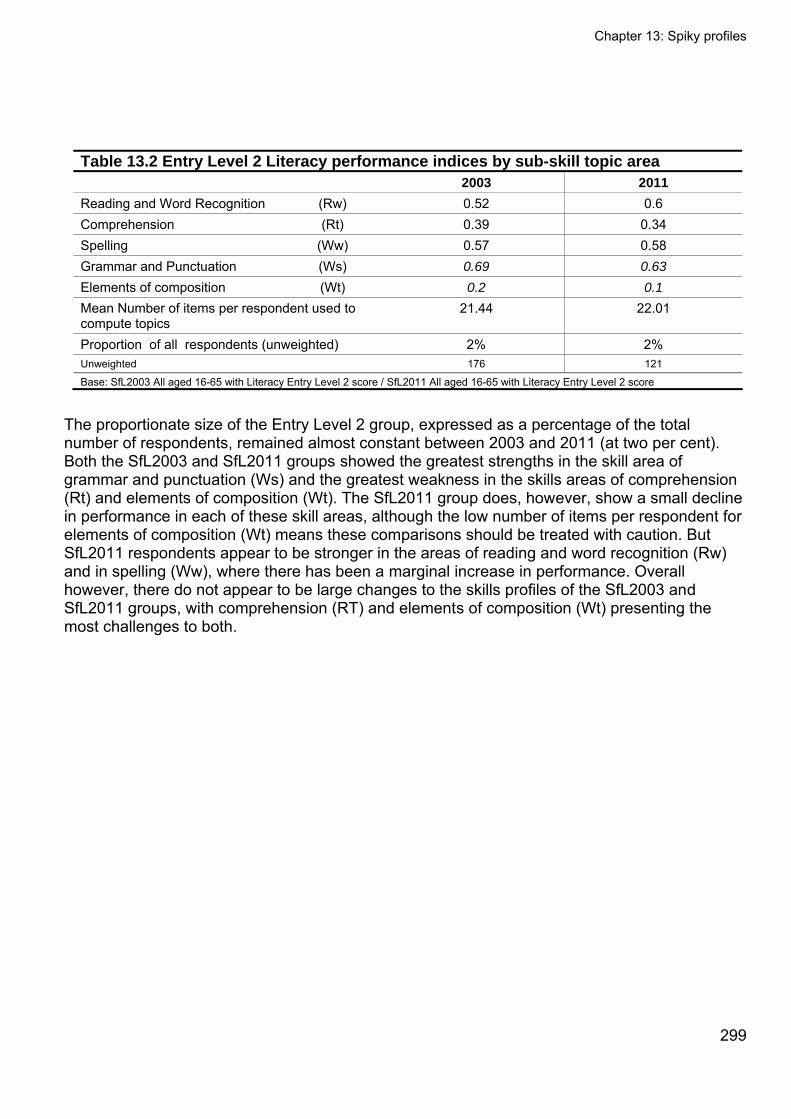
Chapter 13: Spiky profiles
299
Table 13.2 Entry Level 2 Literacy performance indices by sub-skill topic area 2003 2011
Reading and Word Recognition (Rw) 0.52 0.6 Comprehension (Rt) 0.39 0.34 Spelling (Ww) 0.57 0.58 Grammar and Punctuation (Ws) 0.69 0.63
Elements of composition (Wt) 0.2 0.1
Mean Number of items per respondent used to compute topics
21.44 22.01
Proportion of all respondents (unweighted) 2% 2% Unweighted 176 121
Base: SfL2003 All aged 16-65 with Literacy Entry Level 2 score / SfL2011 All aged 16-65 with Literacy Entry Level 2 score
The proportionate size of the Entry Level 2 group, expressed as a percentage of the total number of respondents, remained almost constant between 2003 and 2011 (at two per cent). Both the SfL2003 and SfL2011 groups showed the greatest strengths in the skill area of grammar and punctuation (Ws) and the greatest weakness in the skills areas of comprehension (Rt) and elements of composition (Wt). The SfL2011 group does, however, show a small decline in performance in each of these skill areas, although the low number of items per respondent for elements of composition (Wt) means these comparisons should be treated with caution. But SfL2011 respondents appear to be stronger in the areas of reading and word recognition (Rw) and in spelling (Ww), where there has been a marginal increase in performance. Overall however, there do not appear to be large changes to the skills profiles of the SfL2003 and SfL2011 groups, with comprehension (RT) and elements of composition (Wt) presenting the most challenges to both.
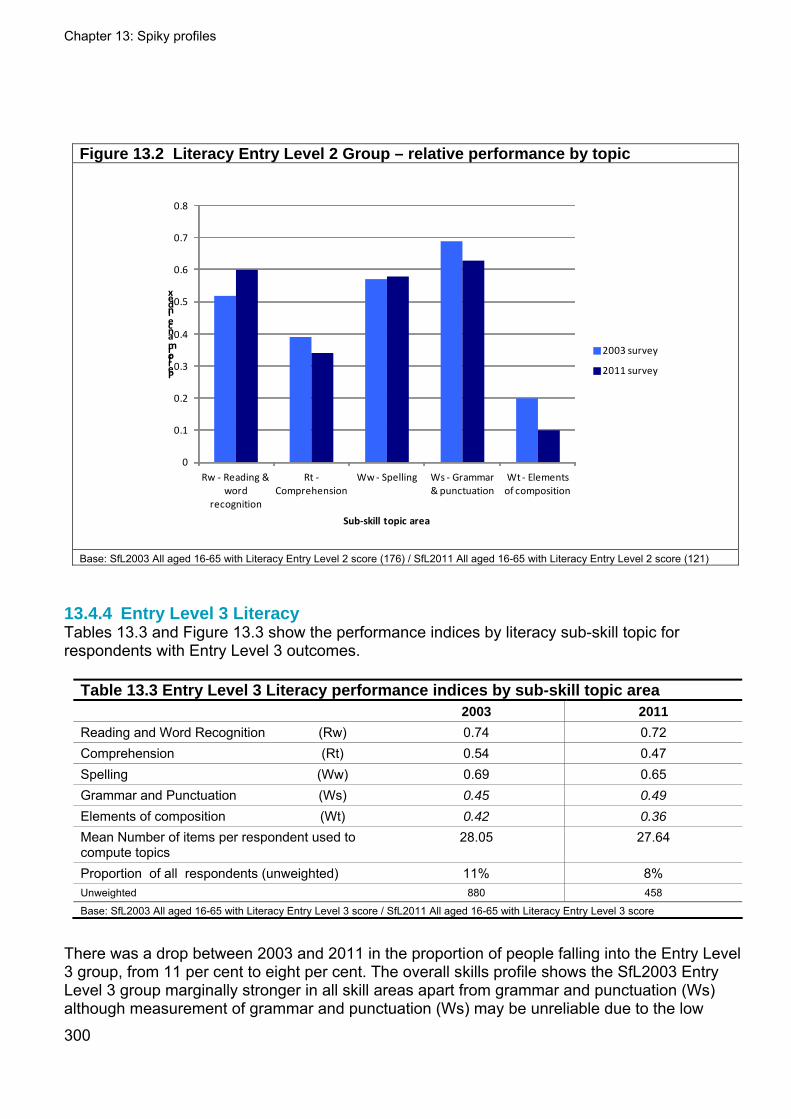
Chapter 13: Spiky profiles
Figure 13.2 Literacy Entry Level 2 Group – relative performance by topic
0
0.1
0.2
0.3
0.4
0.5
0.6
0.7
0.8
Rw ‐ Reading & word
recognition
Rt ‐Comprehension
Ww ‐ Spelling Ws ‐ Grammar & punctuation
Wt ‐ Elements of composition
Performance index
Sub‐skill topic area
2003 survey
2011 survey
Base: SfL2003 All aged 16-65 with Literacy Entry Level 2 score (176) / SfL2011 All aged 16-65 with Literacy Entry Level 2 score (121)
13.4.4 Entry Level 3 Literacy Tables 13.3 and Figure 13.3 show the performance indices by literacy sub-skill topic for respondents with Entry Level 3 outcomes.
Table 13.3 Entry Level 3 Literacy performance indices by sub-skill topic area 2003 2011
Reading and Word Recognition (Rw) 0.74 0.72 Comprehension (Rt) 0.54 0.47 Spelling (Ww) 0.69 0.65 Grammar and Punctuation (Ws) 0.45 0.49
Elements of composition (Wt) 0.42 0.36
Mean Number of items per respondent used to compute topics
28.05 27.64
Proportion of all respondents (unweighted) 11% 8% Unweighted 880 458
Base: SfL2003 All aged 16-65 with Literacy Entry Level 3 score / SfL2011 All aged 16-65 with Literacy Entry Level 3 score
There was a drop between 2003 and 2011 in the proportion of people falling into the Entry Level 3 group, from 11 per cent to eight per cent. The overall skills profile shows the SfL2003 Entry Level 3 group marginally stronger in all skill areas apart from grammar and punctuation (Ws) although measurement of grammar and punctuation (Ws) may be unreliable due to the low
300
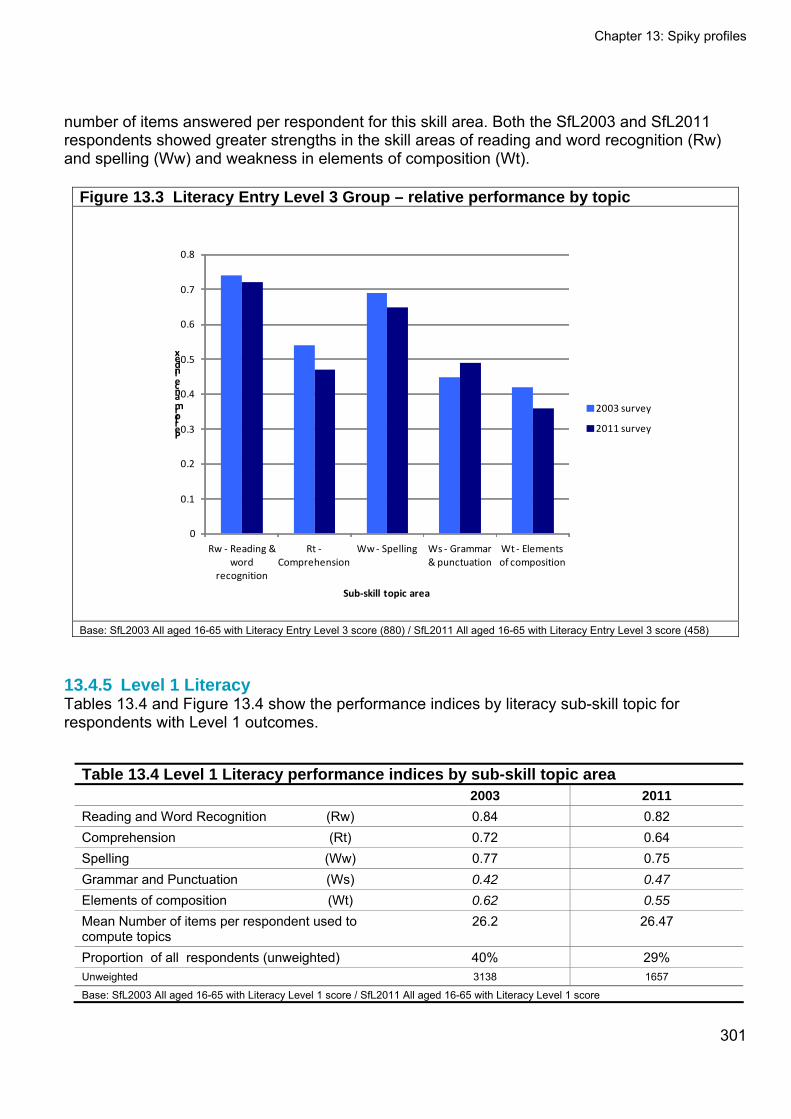
Chapter 13: Spiky profiles
number of items answered per respondent for this skill area. Both the SfL2003 and SfL2011 respondents showed greater strengths in the skill areas of reading and word recognition (Rw) and spelling (Ww) and weakness in elements of composition (Wt).
Figure 13.3 Literacy Entry Level 3 Group – relative performance by topic
0
0.1
0.2
0.3
0.4
0.5
0.6
0.7
0.8
Rw ‐ Reading & word
recognition
Rt ‐Comprehension
Ww ‐ Spelling Ws ‐ Grammar & punctuation
Wt ‐ Elements of composition
Performance index
Sub‐skill topic area
2003 survey
2011 survey
Base: SfL2003 All aged 16-65 with Literacy Entry Level 3 score (880) / SfL2011 All aged 16-65 with Literacy Entry Level 3 score (458)
13.4.5 Level 1 Literacy Tables 13.4 and Figure 13.4 show the performance indices by literacy sub-skill topic for respondents with Level 1 outcomes.
Table 13.4 Level 1 Literacy performance indices by sub-skill topic area 2003 2011
Reading and Word Recognition (Rw) 0.84 0.82 Comprehension (Rt) 0.72 0.64 Spelling (Ww) 0.77 0.75 Grammar and Punctuation (Ws) 0.42 0.47
Elements of composition (Wt) 0.62 0.55
Mean Number of items per respondent used to compute topics
26.2 26.47
Proportion of all respondents (unweighted) 40% 29% Unweighted 3138 1657
Base: SfL2003 All aged 16-65 with Literacy Level 1 score / SfL2011 All aged 16-65 with Literacy Level 1 score
301
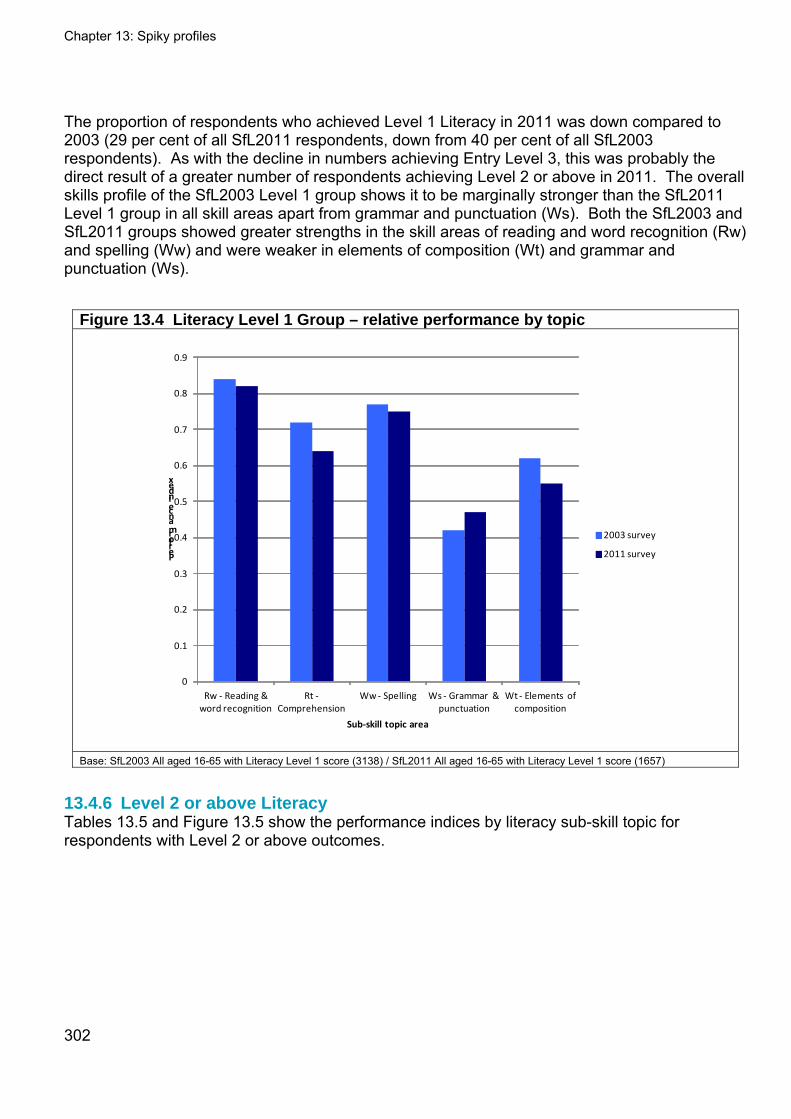
Chapter 13: Spiky profiles
The proportion of respondents who achieved Level 1 Literacy in 2011 was down compared to 2003 (29 per cent of all SfL2011 respondents, down from 40 per cent of all SfL2003 respondents). As with the decline in numbers achieving Entry Level 3, this was probably the direct result of a greater number of respondents achieving Level 2 or above in 2011. The overall skills profile of the SfL2003 Level 1 group shows it to be marginally stronger than the SfL2011 Level 1 group in all skill areas apart from grammar and punctuation (Ws). Both the SfL2003 and SfL2011 groups showed greater strengths in the skill areas of reading and word recognition (Rw) and spelling (Ww) and were weaker in elements of composition (Wt) and grammar and punctuation (Ws).
Figure 13.4 Literacy Level 1 Group – relative performance by topic
0
0.1
0.2
0.3
0.4
0.5
0.6
0.7
0.8
0.9
Rw ‐ Reading & word recognition
Rt ‐Comprehension
Ww ‐ Spelling Ws ‐ Grammar & punctuation
Wt ‐ Elements of composition
Performance index
Sub‐skill topic area
2003 survey
2011 survey
Base: SfL2003 All aged 16-65 with Literacy Level 1 score (3138) / SfL2011 All aged 16-65 with Literacy Level 1 score (1657)
13.4.6 Level 2 or above Literacy Tables 13.5 and Figure 13.5 show the performance indices by literacy sub-skill topic for respondents with Level 2 or above outcomes.
302
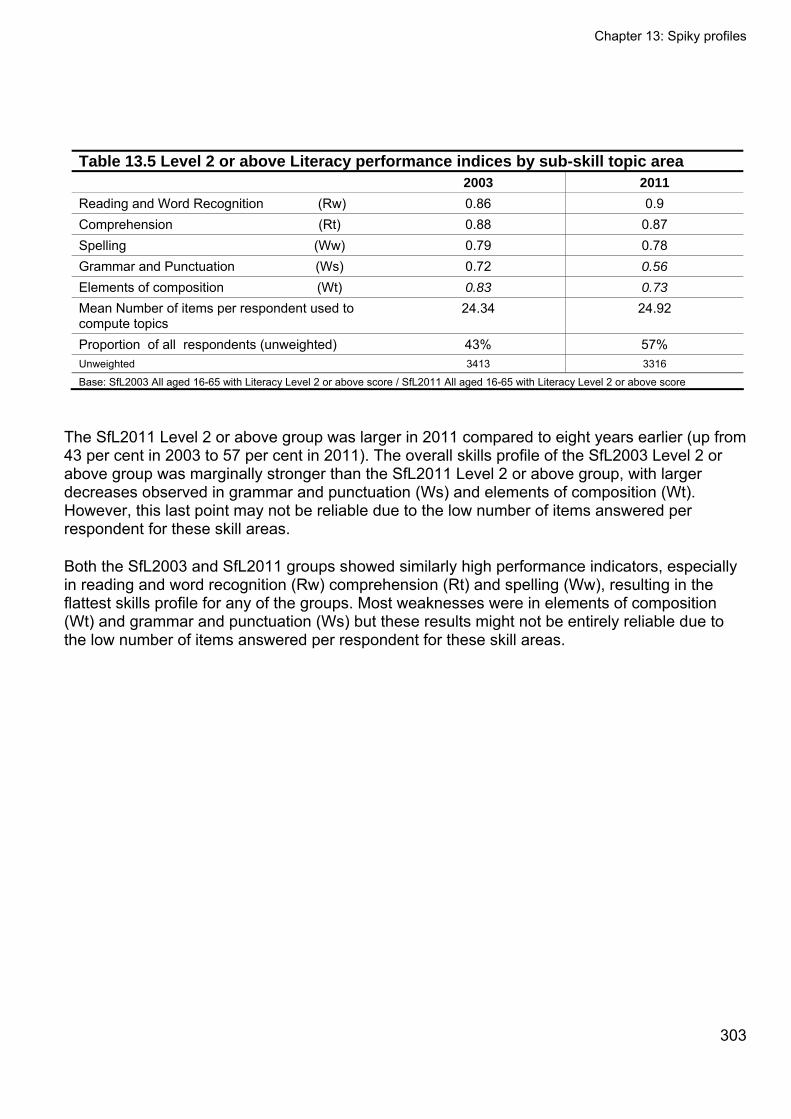
Chapter 13: Spiky profiles
303
Table 13.5 Level 2 or above Literacy performance indices by sub-skill topic area 2003 2011
Reading and Word Recognition (Rw) 0.86 0.9 Comprehension (Rt) 0.88 0.87 Spelling (Ww) 0.79 0.78 Grammar and Punctuation (Ws) 0.72 0.56
Elements of composition (Wt) 0.83 0.73
Mean Number of items per respondent used to compute topics
24.34 24.92
Proportion of all respondents (unweighted) 43% 57% Unweighted 3413 3316
Base: SfL2003 All aged 16-65 with Literacy Level 2 or above score / SfL2011 All aged 16-65 with Literacy Level 2 or above score
The SfL2011 Level 2 or above group was larger in 2011 compared to eight years earlier (up from 43 per cent in 2003 to 57 per cent in 2011). The overall skills profile of the SfL2003 Level 2 or above group was marginally stronger than the SfL2011 Level 2 or above group, with larger decreases observed in grammar and punctuation (Ws) and elements of composition (Wt). However, this last point may not be reliable due to the low number of items answered per respondent for these skill areas.
Both the SfL2003 and SfL2011 groups showed similarly high performance indicators, especially in reading and word recognition (Rw) comprehension (Rt) and spelling (Ww), resulting in the flattest skills profile for any of the groups. Most weaknesses were in elements of composition (Wt) and grammar and punctuation (Ws) but these results might not be entirely reliable due to the low number of items answered per respondent for these skill areas.
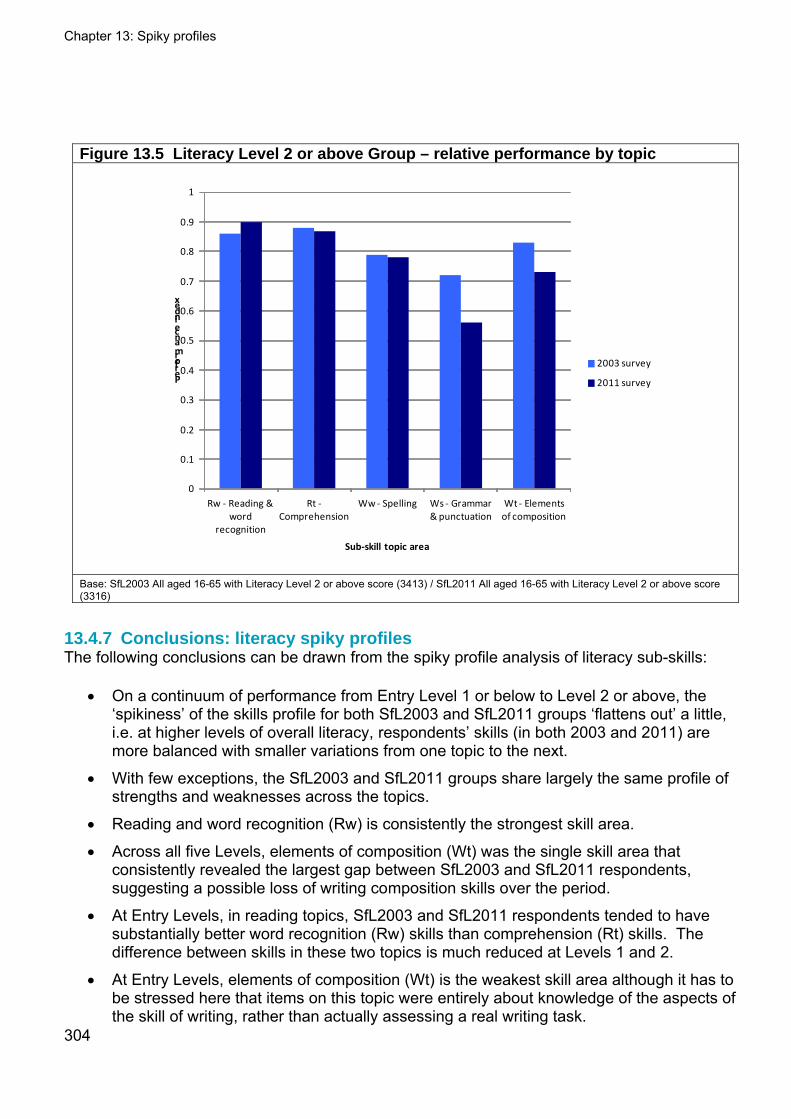
Chapter 13: Spiky profiles
Figure 13.5 Literacy Level 2 or above Group – relative performance by topic
0
0.1
0.2
0.3
0.4
0.5
0.6
0.7
0.8
0.9
1
Rw ‐ Reading & word
recognition
Rt ‐Comprehension
Ww ‐ Spelling Ws ‐ Grammar & punctuation
Wt ‐ Elements of composition
Performance index
Sub‐skill topic area
2003 survey
2011 survey
Base: SfL2003 All aged 16-65 with Literacy Level 2 or above score (3413) / SfL2011 All aged 16-65 with Literacy Level 2 or above score (3316)
13.4.7 Conclusions: literacy spiky profiles The following conclusions can be drawn from the spiky profile analysis of literacy sub-skills:
On a continuum of performance from Entry Level 1 or below to Level 2 or above, the ‘spikiness’ of the skills profile for both SfL2003 and SfL2011 groups ‘flattens out’ a little, i.e. at higher levels of overall literacy, respondents’ skills (in both 2003 and 2011) are more balanced with smaller variations from one topic to the next.
With few exceptions, the SfL2003 and SfL2011 groups share largely the same profile of strengths and weaknesses across the topics.
Reading and word recognition (Rw) is consistently the strongest skill area.
Across all five Levels, elements of composition (Wt) was the single skill area that consistently revealed the largest gap between SfL2003 and SfL2011 respondents, suggesting a possible loss of writing composition skills over the period.
At Entry Levels, in reading topics, SfL2003 and SfL2011 respondents tended to have substantially better word recognition (Rw) skills than comprehension (Rt) skills. The difference between skills in these two topics is much reduced at Levels 1 and 2.
304
At Entry Levels, elements of composition (Wt) is the weakest skill area although it has to be stressed here that items on this topic were entirely about knowledge of the aspects of the skill of writing, rather than actually assessing a real writing task.
Chapter 13: Spiky profiles
305
At Levels 1 and 2, respondents’ reading skills are stronger than their writing skills.
At Level 2 or above (the group which has seen the largest growth since 2003) SfL2011 respondents were weaker than their 2003 counterparts at grammar and punctuation (Ws) and elements of composition (Wt). This perhaps indicates a loss of sentence/paragraph level skills (grammar and punctuation, composing longer pieces of text). Coupled with the similarity of performance on other topics between the two groups, it also indicates that respondents at Literacy Level 2 or above in 2003 achieved higher scores than those in 2011.
13.5 Sub-skill outcomes for numeracy
13.5.1 Numeracy coverage Three sub-skill areas are tested under numeracy: Number – involves counting and basic arithmetic, including fractions, ratios and percentages
text (Nr)
Measure, shape and space - involves calculating with and converting between units such as money, lengths and areas, weight and time (Ss)
Handling data – involves extracting information from tables and lists, using mean, median and mode, and reading simple charts (Hd).
Each entry in the tables below contains the topic performance index for respondents at each outcome Level. As described in Section 13.3.2, this index has no units – it is simply an index from 0 to 1, a relative measure of respondents’ performance on items covering a particular topic. As such it can be compared with other indices in the table, but not with indices in other tables. It represents a consolidated performance on the topic for all respondents with the given Numeracy Level outcome, i.e. a kind of average. Individual respondents’ scores will vary.
As for literacy, it should be noted that although the numeracy items assess performance criteria at each of five levels from Entry Level 1 to Level 2, outcomes for respondents are in five groups from Entry Level 1 or below to Level 2 or above. With no items assessing performance against numeracy criteria below Entry Level 1 or above Level 2, the assessment cannot distinguish between those respondents at Entry Level 1 and those below it, or between those respondents at Level 2 and those above it. It should be noted that the proportions of the population cited at each Level for numeracy are unweighted as compared with the weighted proportions shown in Table 4.4. 13.5.2 Entry Level 1 or below Numeracy Table 13.6 and Figure 13.6 show the performance indices by numeracy sub-skill topic for SfL2003 and SfL2011 respondents with Entry Level 1 or below outcomes.
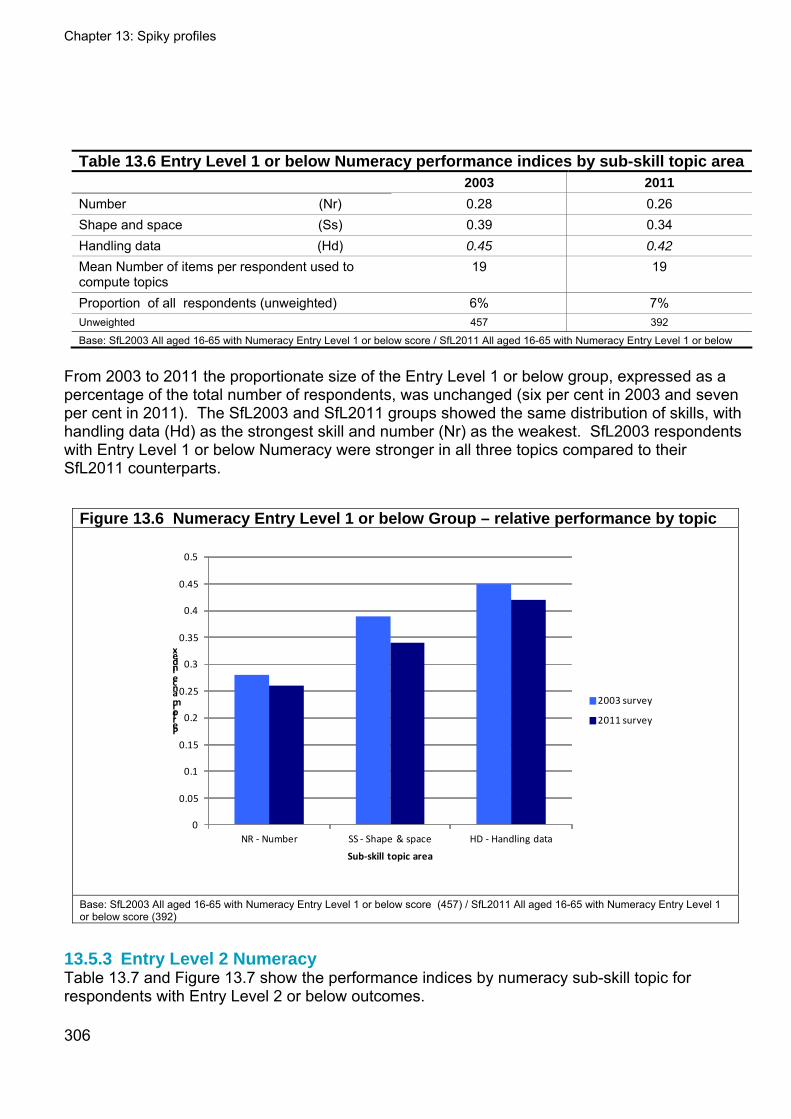
Chapter 13: Spiky profiles
Table 13.6 Entry Level 1 or below Numeracy performance indices by sub-skill topic area 2003 2011
Number (Nr) 0.28 0.26 Shape and space (Ss) 0.39 0.34 Handling data (Hd) 0.45 0.42
Mean Number of items per respondent used to compute topics
19 19
Proportion of all respondents (unweighted) 6% 7% Unweighted 457 392
Base: SfL2003 All aged 16-65 with Numeracy Entry Level 1 or below score / SfL2011 All aged 16-65 with Numeracy Entry Level 1 or below
From 2003 to 2011 the proportionate size of the Entry Level 1 or below group, expressed as a percentage of the total number of respondents, was unchanged (six per cent in 2003 and seven per cent in 2011). The SfL2003 and SfL2011 groups showed the same distribution of skills, with handling data (Hd) as the strongest skill and number (Nr) as the weakest. SfL2003 respondents with Entry Level 1 or below Numeracy were stronger in all three topics compared to their SfL2011 counterparts.
Figure 13.6 Numeracy Entry Level 1 or below Group – relative performance by topic
0
0.05
0.1
0.15
0.2
0.25
0.3
0.35
0.4
0.45
0.5
NR ‐ Number SS ‐ Shape & space HD ‐ Handling data
Performance index
Sub‐skill topic area
2003 survey
2011 survey
Base: SfL2003 All aged 16-65 with Numeracy Entry Level 1 or below score (457) / SfL2011 All aged 16-65 with Numeracy Entry Level 1 or below score (392)
13.5.3 Entry Level 2 Numeracy Table 13.7 and Figure 13.7 show the performance indices by numeracy sub-skill topic for respondents with Entry Level 2 or below outcomes.
306
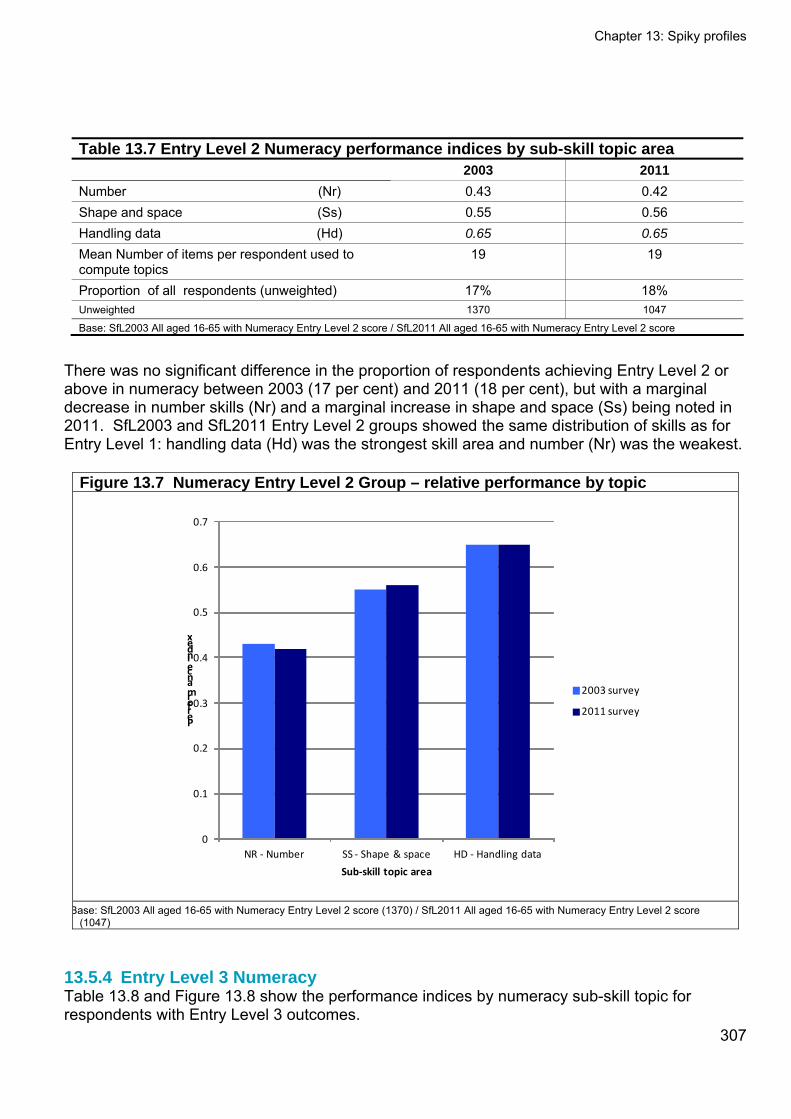
Chapter 13: Spiky profiles
Table 13.7 Entry Level 2 Numeracy performance indices by sub-skill topic area 2003 2011
Number (Nr) 0.43 0.42 Shape and space (Ss) 0.55 0.56 Handling data (Hd) 0.65 0.65
Mean Number of items per respondent used to compute topics
19 19
Proportion of all respondents (unweighted) 17% 18% Unweighted 1370 1047
Base: SfL2003 All aged 16-65 with Numeracy Entry Level 2 score / SfL2011 All aged 16-65 with Numeracy Entry Level 2 score
There was no significant difference in the proportion of respondents achieving Entry Level 2 or above in numeracy between 2003 (17 per cent) and 2011 (18 per cent), but with a marginal decrease in number skills (Nr) and a marginal increase in shape and space (Ss) being noted in 2011. SfL2003 and SfL2011 Entry Level 2 groups showed the same distribution of skills as for Entry Level 1: handling data (Hd) was the strongest skill area and number (Nr) was the weakest.
Figure 13.7 Numeracy Entry Level 2 Group – relative performance by topic
0
0.1
0.2
0.3
0.4
0.5
0.6
0.7
NR ‐ Number SS ‐ Shape & space HD ‐ Handling data
Performance index
Sub‐skill topic area
2003 survey
2011 survey
Base: SfL2003 All aged 16-65 with Numeracy Entry Level 2 score (1370) / SfL2011 All aged 16-65 with Numeracy Entry Level 2 score
(1047)
13.5.4 Entry Level 3 Numeracy
307
Table 13.8 and Figure 13.8 show the performance indices by numeracy sub-skill topic for respondents with Entry Level 3 outcomes.
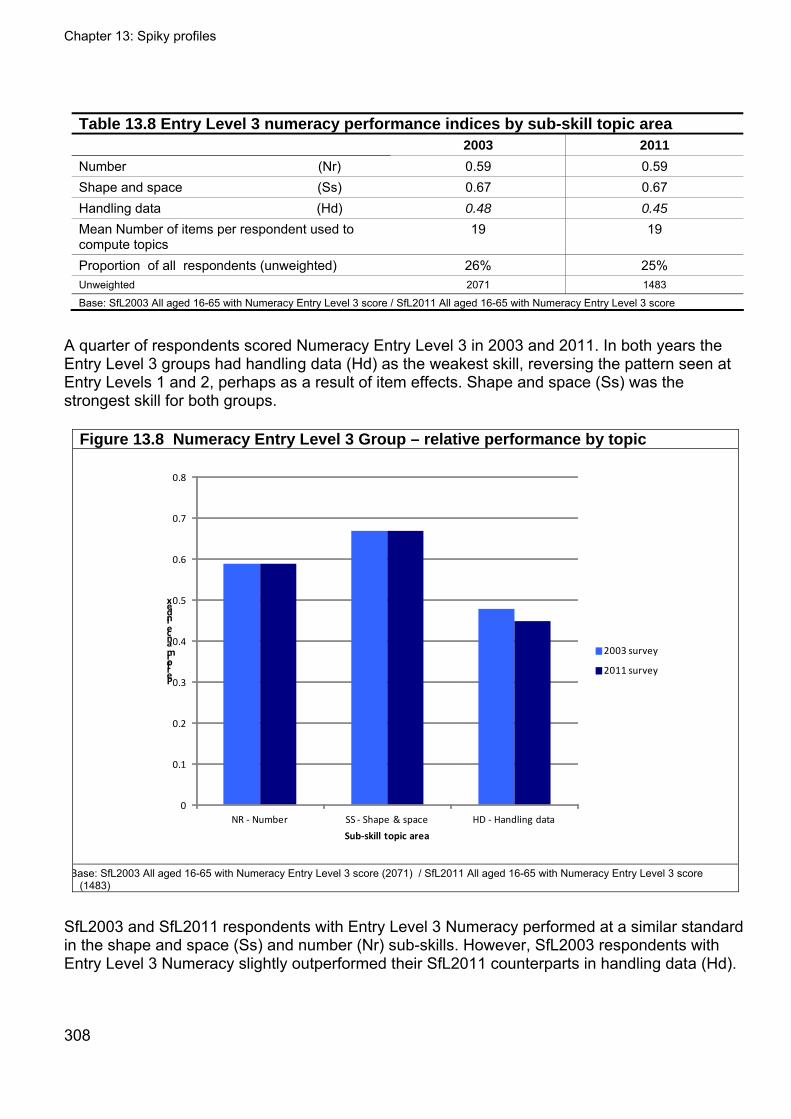
Chapter 13: Spiky profiles
Table 13.8 Entry Level 3 numeracy performance indices by sub-skill topic area 2003 2011
Number (Nr) 0.59 0.59 Shape and space (Ss) 0.67 0.67 Handling data (Hd) 0.48 0.45
Mean Number of items per respondent used to compute topics
19 19
Proportion of all respondents (unweighted) 26% 25% Unweighted 2071 1483
Base: SfL2003 All aged 16-65 with Numeracy Entry Level 3 score / SfL2011 All aged 16-65 with Numeracy Entry Level 3 score
A quarter of respondents scored Numeracy Entry Level 3 in 2003 and 2011. In both years the Entry Level 3 groups had handling data (Hd) as the weakest skill, reversing the pattern seen at Entry Levels 1 and 2, perhaps as a result of item effects. Shape and space (Ss) was the strongest skill for both groups.
Figure 13.8 Numeracy Entry Level 3 Group – relative performance by topic
0
0.1
0.2
0.3
0.4
0.5
0.6
0.7
0.8
NR ‐ Number SS ‐ Shape & space HD ‐ Handling data
Performance index
Sub‐skill topic area
2003 survey
2011 survey
Base: SfL2003 All aged 16-65 with Numeracy Entry Level 3 score (2071) / SfL2011 All aged 16-65 with Numeracy Entry Level 3 score
(1483)
SfL2003 and SfL2011 respondents with Entry Level 3 Numeracy performed at a similar standard in the shape and space (Ss) and number (Nr) sub-skills. However, SfL2003 respondents with Entry Level 3 Numeracy slightly outperformed their SfL2011 counterparts in handling data (Hd).
308
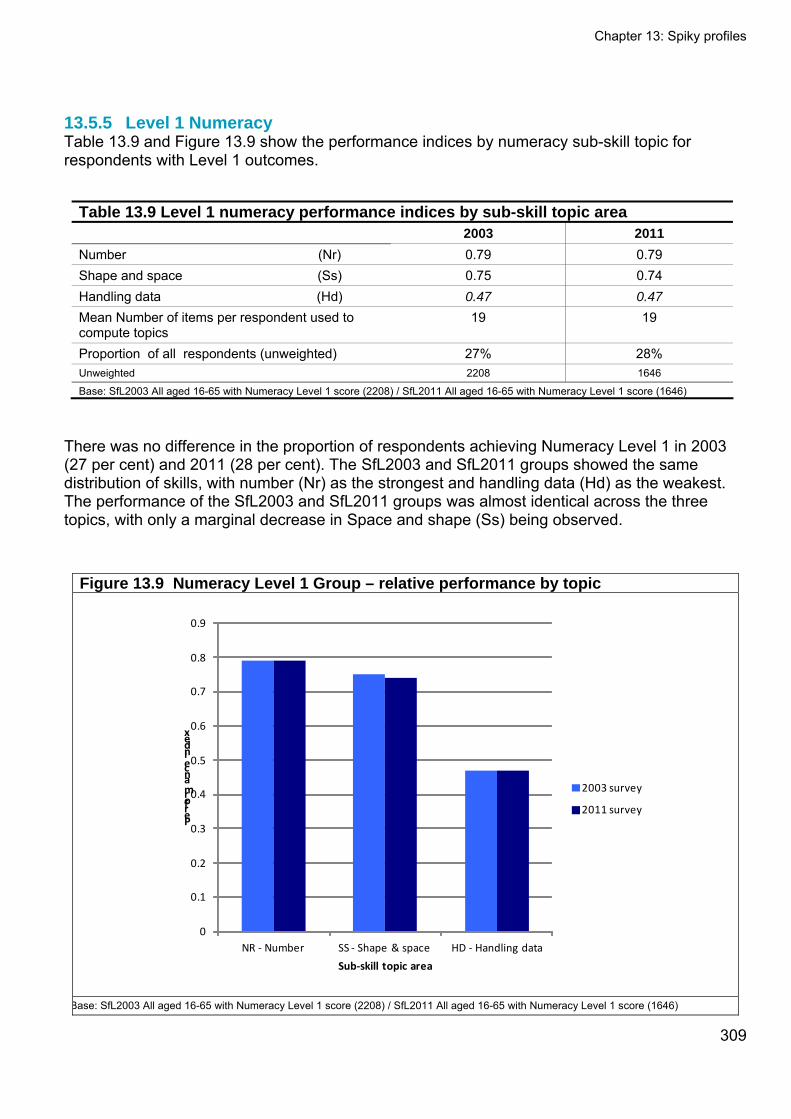
Chapter 13: Spiky profiles
13.5.5 Level 1 Numeracy Table 13.9 and Figure 13.9 show the performance indices by numeracy sub-skill topic for respondents with Level 1 outcomes.
Table 13.9 Level 1 numeracy performance indices by sub-skill topic area 2003 2011
Number (Nr) 0.79 0.79 Shape and space (Ss) 0.75 0.74 Handling data (Hd) 0.47 0.47
Mean Number of items per respondent used to compute topics
19 19
Proportion of all respondents (unweighted) 27% 28% Unweighted 2208 1646
Base: SfL2003 All aged 16-65 with Numeracy Level 1 score (2208) / SfL2011 All aged 16-65 with Numeracy Level 1 score (1646)
There was no difference in the proportion of respondents achieving Numeracy Level 1 in 2003 (27 per cent) and 2011 (28 per cent). The SfL2003 and SfL2011 groups showed the same distribution of skills, with number (Nr) as the strongest and handling data (Hd) as the weakest. The performance of the SfL2003 and SfL2011 groups was almost identical across the three topics, with only a marginal decrease in Space and shape (Ss) being observed.
Figure 13.9 Numeracy Level 1 Group – relative performance by topic
0
0.1
0.2
0.3
0.4
0.5
0.6
0.7
0.8
0.9
NR ‐ Number SS ‐ Shape & space HD ‐ Handling data
Performance index
Sub‐skill topic area
2003 survey
2011 survey
Base: SfL2003 All aged 16-65 with Numeracy Level 1 score (2208) / SfL2011 All aged 16-65 with Numeracy Level 1 score (1646)
309
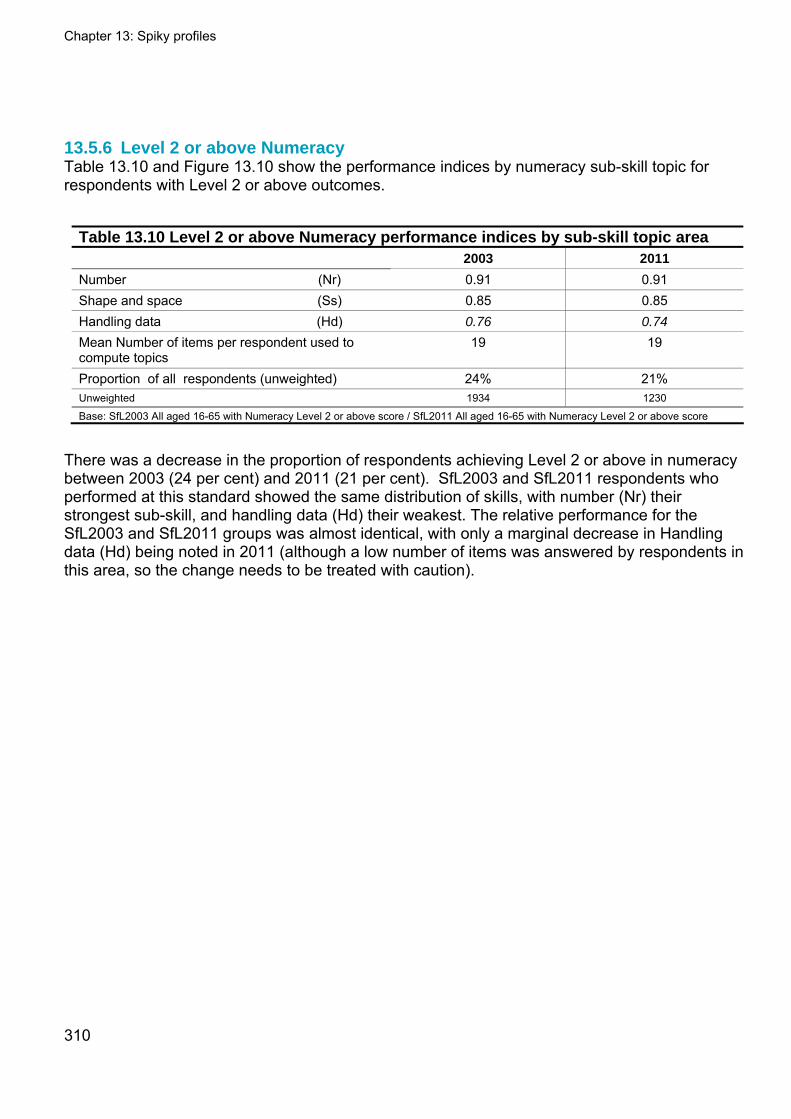
Chapter 13: Spiky profiles
310
13.5.6 Level 2 or above Numeracy Table 13.10 and Figure 13.10 show the performance indices by numeracy sub-skill topic for respondents with Level 2 or above outcomes.
Table 13.10 Level 2 or above Numeracy performance indices by sub-skill topic area 2003 2011
Number (Nr) 0.91 0.91 Shape and space (Ss) 0.85 0.85 Handling data (Hd) 0.76 0.74
Mean Number of items per respondent used to compute topics
19 19
Proportion of all respondents (unweighted) 24% 21% Unweighted 1934 1230
Base: SfL2003 All aged 16-65 with Numeracy Level 2 or above score / SfL2011 All aged 16-65 with Numeracy Level 2 or above score
There was a decrease in the proportion of respondents achieving Level 2 or above in numeracy between 2003 (24 per cent) and 2011 (21 per cent). SfL2003 and SfL2011 respondents who performed at this standard showed the same distribution of skills, with number (Nr) their strongest sub-skill, and handling data (Hd) their weakest. The relative performance for the SfL2003 and SfL2011 groups was almost identical, with only a marginal decrease in Handling data (Hd) being noted in 2011 (although a low number of items was answered by respondents in this area, so the change needs to be treated with caution).
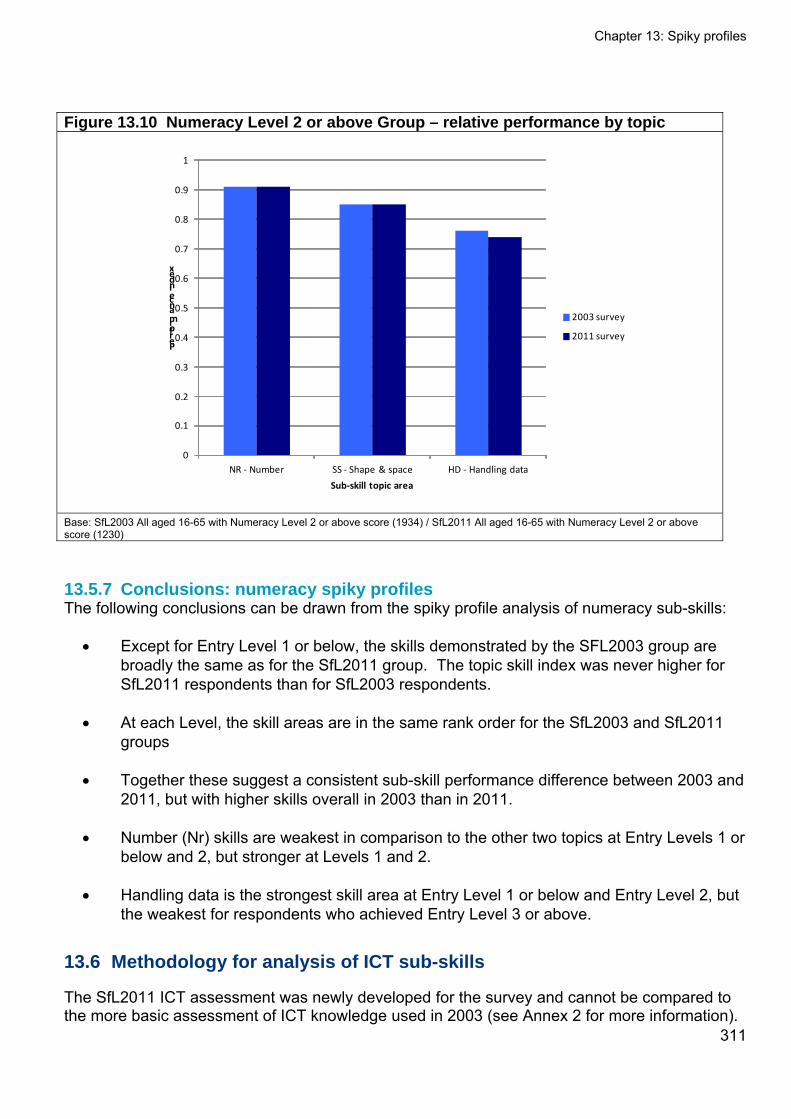
Chapter 13: Spiky profiles
Figure 13.10 Numeracy Level 2 or above Group – relative performance by topic
0
0.1
0.2
0.3
0.4
0.5
0.6
0.7
0.8
0.9
1
NR ‐ Number SS ‐ Shape & space HD ‐ Handling data
Performance index
Sub‐skill topic area
2003 survey
2011 survey
Base: SfL2003 All aged 16-65 with Numeracy Level 2 or above score (1934) / SfL2011 All aged 16-65 with Numeracy Level 2 or above score (1230)
13.5.7 Conclusions: numeracy spiky profiles The following conclusions can be drawn from the spiky profile analysis of numeracy sub-skills:
Except for Entry Level 1 or below, the skills demonstrated by the SFL2003 group are broadly the same as for the SfL2011 group. The topic skill index was never higher for SfL2011 respondents than for SfL2003 respondents.
At each Level, the skill areas are in the same rank order for the SfL2003 and SfL2011 groups
Together these suggest a consistent sub-skill performance difference between 2003 and 2011, but with higher skills overall in 2003 than in 2011.
Number (Nr) skills are weakest in comparison to the other two topics at Entry Levels 1 or below and 2, but stronger at Levels 1 and 2.
Handling data is the strongest skill area at Entry Level 1 or below and Entry Level 2, but the weakest for respondents who achieved Entry Level 3 or above.
13.6 Methodology for analysis of ICT sub-skills
311
The SfL2011 ICT assessment was newly developed for the survey and cannot be compared to the more basic assessment of ICT knowledge used in 2003 (see Annex 2 for more information).
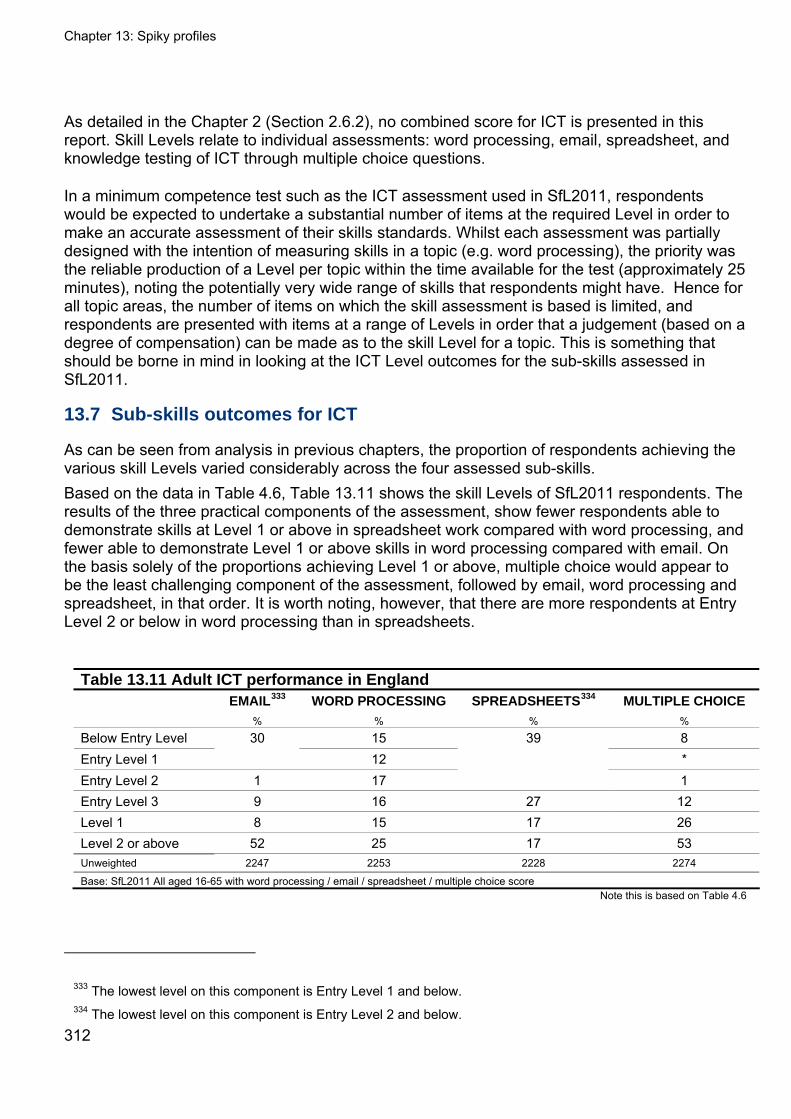
Chapter 13: Spiky profiles
312
As detailed in the Chapter 2 (Section 2.6.2), no combined score for ICT is presented in this report. Skill Levels relate to individual assessments: word processing, email, spreadsheet, and knowledge testing of ICT through multiple choice questions.
In a minimum competence test such as the ICT assessment used in SfL2011, respondents would be expected to undertake a substantial number of items at the required Level in order to make an accurate assessment of their skills standards. Whilst each assessment was partially designed with the intention of measuring skills in a topic (e.g. word processing), the priority was the reliable production of a Level per topic within the time available for the test (approximately 25 minutes), noting the potentially very wide range of skills that respondents might have. Hence for all topic areas, the number of items on which the skill assessment is based is limited, and respondents are presented with items at a range of Levels in order that a judgement (based on a degree of compensation) can be made as to the skill Level for a topic. This is something that should be borne in mind in looking at the ICT Level outcomes for the sub-skills assessed in SfL2011.
13.7 Sub-skills outcomes for ICT
As can be seen from analysis in previous chapters, the proportion of respondents achieving the various skill Levels varied considerably across the four assessed sub-skills. Based on the data in Table 4.6, Table 13.11 shows the skill Levels of SfL2011 respondents. The results of the three practical components of the assessment, show fewer respondents able to demonstrate skills at Level 1 or above in spreadsheet work compared with word processing, and fewer able to demonstrate Level 1 or above skills in word processing compared with email. On the basis solely of the proportions achieving Level 1 or above, multiple choice would appear to be the least challenging component of the assessment, followed by email, word processing and spreadsheet, in that order. It is worth noting, however, that there are more respondents at Entry Level 2 or below in word processing than in spreadsheets.
Table 13.11 Adult ICT performance in England EMAIL333 WORD PROCESSING SPREADSHEETS334 MULTIPLE CHOICE
% % % %
Below Entry Level 15 8 Entry Level 1
30 12 *
Entry Level 2 1 17
39
1 Entry Level 3 9 16 27 12 Level 1 8 15 17 26 Level 2 or above 52 25 17 53 Unweighted 2247 2253 2228 2274
Base: SfL2011 All aged 16-65 with word processing / email / spreadsheet / multiple choice score Note this is based on Table 4.6
333 The lowest level on this component is Entry Level 1 and below. 334 The lowest level on this component is Entry Level 2 and below.
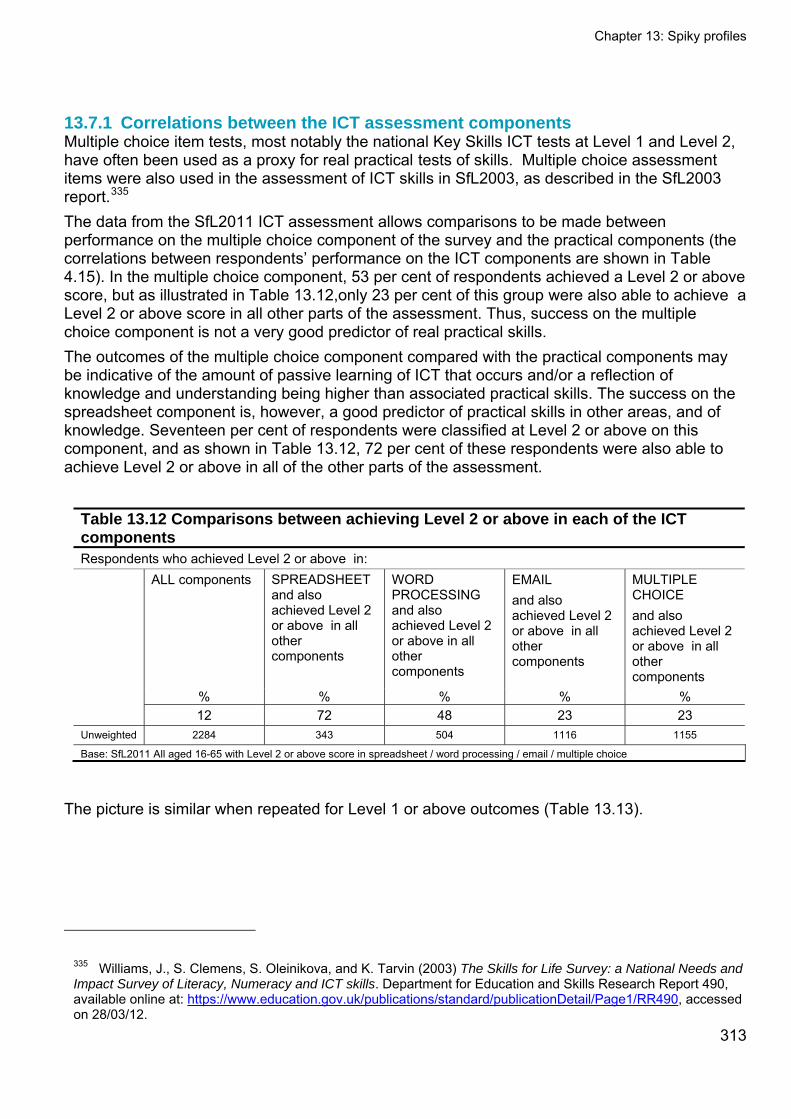
Chapter 13: Spiky profiles
313
13.7.1 Correlations between the ICT assessment components Multiple choice item tests, most notably the national Key Skills ICT tests at Level 1 and Level 2, have often been used as a proxy for real practical tests of skills. Multiple choice assessment items were also used in the assessment of ICT skills in SfL2003, as described in the SfL2003 report.335 The data from the SfL2011 ICT assessment allows comparisons to be made between performance on the multiple choice component of the survey and the practical components (the correlations between respondents’ performance on the ICT components are shown in Table 4.15). In the multiple choice component, 53 per cent of respondents achieved a Level 2 or above score, but as illustrated in Table 13.12,only 23 per cent of this group were also able to achieve a Level 2 or above score in all other parts of the assessment. Thus, success on the multiple choice component is not a very good predictor of real practical skills. The outcomes of the multiple choice component compared with the practical components may be indicative of the amount of passive learning of ICT that occurs and/or a reflection of knowledge and understanding being higher than associated practical skills. The success on the spreadsheet component is, however, a good predictor of practical skills in other areas, and of knowledge. Seventeen per cent of respondents were classified at Level 2 or above on this component, and as shown in Table 13.12, 72 per cent of these respondents were also able to achieve Level 2 or above in all of the other parts of the assessment.
Table 13.12 Comparisons between achieving Level 2 or above in each of the ICT components Respondents who achieved Level 2 or above in:
ALL components SPREADSHEET and also achieved Level 2 or above in all other components
WORD PROCESSING and also achieved Level 2 or above in all other components
EMAIL and also achieved Level 2 or above in all other components
MULTIPLE CHOICE and also achieved Level 2 or above in all other components
% % % % %
12 72 48 23 23 Unweighted 2284 343 504 1116 1155
Base: SfL2011 All aged 16-65 with Level 2 or above score in spreadsheet / word processing / email / multiple choice
The picture is similar when repeated for Level 1 or above outcomes (Table 13.13).
335 Williams, J., S. Clemens, S. Oleinikova, and K. Tarvin (2003) The Skills for Life Survey: a National Needs and Impact Survey of Literacy, Numeracy and ICT skills. Department for Education and Skills Research Report 490, available online at: https://www.education.gov.uk/publications/standard/publicationDetail/Page1/RR490, accessed on 28/03/12.
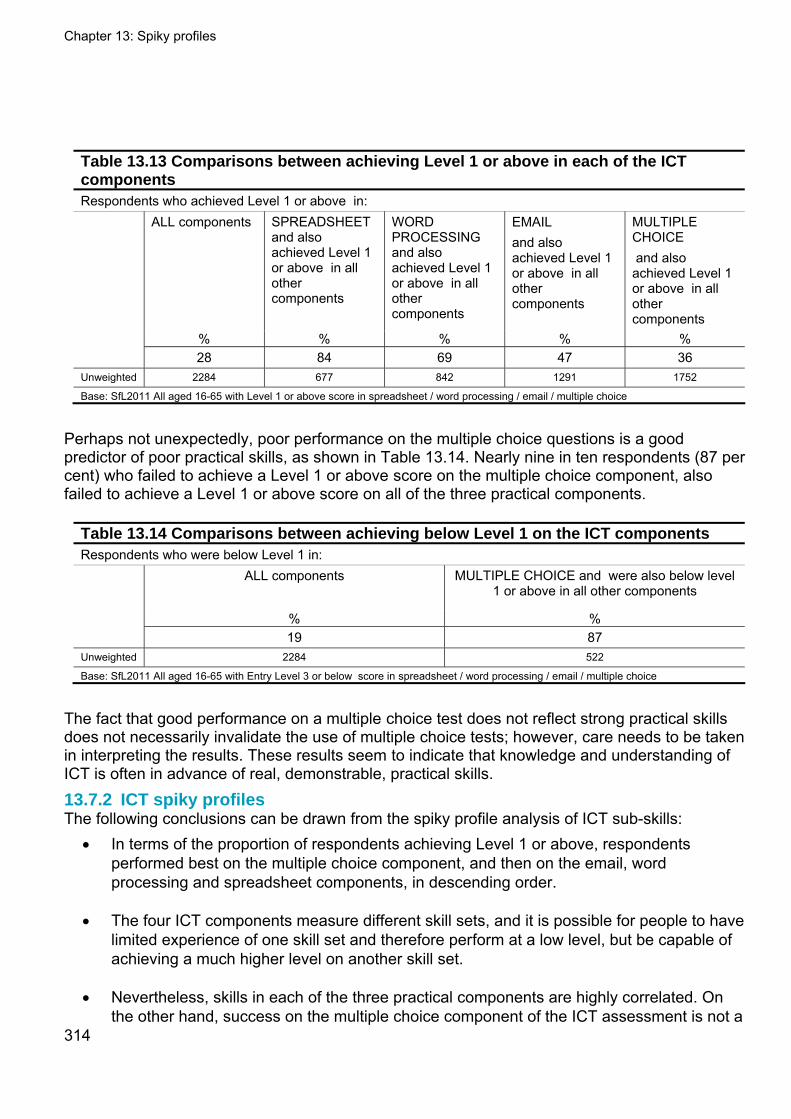
Chapter 13: Spiky profiles
314
Table 13.13 Comparisons between achieving Level 1 or above in each of the ICT components Respondents who achieved Level 1 or above in:
ALL components SPREADSHEET and also achieved Level 1 or above in all other components
WORD PROCESSING and also achieved Level 1 or above in all other components
EMAIL and also achieved Level 1 or above in all other components
MULTIPLE CHOICE and also achieved Level 1 or above in all other components
% % % % %
28 84 69 47 36 Unweighted 2284 677 842 1291 1752
Base: SfL2011 All aged 16-65 with Level 1 or above score in spreadsheet / word processing / email / multiple choice
Perhaps not unexpectedly, poor performance on the multiple choice questions is a good predictor of poor practical skills, as shown in Table 13.14. Nearly nine in ten respondents (87 per cent) who failed to achieve a Level 1 or above score on the multiple choice component, also failed to achieve a Level 1 or above score on all of the three practical components.
Table 13.14 Comparisons between achieving below Level 1 on the ICT components Respondents who were below Level 1 in:
ALL components MULTIPLE CHOICE and were also below level 1 or above in all other components
% %
19 87 Unweighted 2284 522
Base: SfL2011 All aged 16-65 with Entry Level 3 or below score in spreadsheet / word processing / email / multiple choice
The fact that good performance on a multiple choice test does not reflect strong practical skills does not necessarily invalidate the use of multiple choice tests; however, care needs to be taken in interpreting the results. These results seem to indicate that knowledge and understanding of ICT is often in advance of real, demonstrable, practical skills. 13.7.2 ICT spiky profiles The following conclusions can be drawn from the spiky profile analysis of ICT sub-skills:
In terms of the proportion of respondents achieving Level 1 or above, respondents performed best on the multiple choice component, and then on the email, word processing and spreadsheet components, in descending order.
The four ICT components measure different skill sets, and it is possible for people to have limited experience of one skill set and therefore perform at a low level, but be capable of achieving a much higher level on another skill set.
Nevertheless, skills in each of the three practical components are highly correlated. On the other hand, success on the multiple choice component of the ICT assessment is not a

Chapter 13: Spiky profiles
315
very good predictor of real practical skills, although a low score on this component does appear to be a good indicator of low score levels on the other ICT elements
Chapter 14: Comparisons of survey results with other surveys and standards
316
14 Comparisons of survey results with other surveys and standards
14.1 Key Findings
This chapter compares the Skills for Life survey assessments in literacy, numeracy and ICT with national standards and qualification assessments in England, as well as national and international surveys including:
The Skills for Life, Key Skills and Functional Skills standards in England, and the assessments for these qualifications. The chapter describes how the survey assessments necessarily take a more sampled approach to assessing skills than equivalent qualification assessments, particularly in the case of literacy, and how the newly introduced Functional Skills assessments take a more applied approach to assessing literacy and numeracy.
The 1997 International Adult Literacy Survey (IALS) and the 1997 Centre for Longitudinal Studies / National Foundation for Educational Research survey based on the National Child Development Study. These surveys provided important parts of the evidence base on which subsequent Skills for Life strategy was based, highlighting that Britain had around one in five people with low literacy and a similar number with low numeracy.
The National Surveys of Adult Skills in Wales, 2010 and 2004, which indicates that, starting from a lower base in 2004, literacy and numeracy skills have improved faster in Wales than England.
The Scottish Survey of Adult Literacies (SSAL), 2009, which suggests that literacy and numeracy skills are higher in Scotland than in England. However differences in methodology between the Scottish and English surveys make direct comparisons impossible.
The Progress In International Reading Literacy Study (PIRLS), which identifies a decline from 2001 to 2006 in reading skills among 10 year-olds in England, and a corresponding drop in England’s position in the ‘10 year-olds’ reading skills league table of countries participating in the survey. Although in the Skills for Life surveys a similar fall in skill has not been observed.
The Trends in International Mathematics and Science Study (TIMSS), the Programme for the International Assessment of Adult Competences (PIAAC) survey and the Programme for International Student Assessment (PISA) survey are also discussed.
Chapter 14: Comparisons of survey results with other surveys and standards
317
14.2 Introduction
This chapter examines the comparability of the assessments used in the Skills for Life 2003 Survey (SfL2003) and Skills for Life 2011 Survey (SfL2011) for literacy, numeracy and ICT with:
current standards, curricula and assessment resources from related qualifications in use in England; and, where appropriate,
other national and international surveys of adult literacy and numeracy in terms of both the design and coverage of the assessments and the outcomes of the surveys.
7. In setting the scene for this chapter it is worth stressing that the same literacy and numeracy tests were used in both SfL2003 and SfL2011.
14.3 The Skills for Life literacy assessment background
The Skills for Life 2011 survey literacy assessment was based on the standards and tests used in paper-based Key Skills/adult literacy tests published by the then QCA at the time the literacy survey assessment was created in 2002. This ensured that the Level 1 and Level 2 items used were 'tried and tested’, although the conversion of items from paper to computer screen could, in some cases, change items as well as impose limitations on the types of items that could be used. New items were written for Entry Levels 1, 2 and 3 as national testing at these Levels did not exist at the time when SfL2003 was conducted. The adult literacy standards (as opposed to Key Skills or other curricula) were used for SfL2011 because the survey addressed the English adult population. Further, these standards extended from Entry Level 1 to Level 2 and provided more detailed guidance than Key Skills, for example. All items were 'tagged', using the reference codes taken from the adult literacy standards for reading and writing,336 and these codes are presented in Annex 2.
Due to the limitations of the technology and the logistics of the survey, the assessment of speaking and listening was not included, nor were many aspects of writing.
14.3.1 Skills for Life Literacy Levels The authors of the Skills for Life survey used the examples and illustrations given in the adult literacy Core Curriculum guidance materials in order to devise suitable contexts and ensure that questions were pitched at an appropriate Level. So, for example, the adult literacy standards337 state that:
336 Department for Education and Skills (2001) Adult Literacy Core Curriculum including Spoken Communication, available online at: http://rwp.excellencegateway.org.uk/resource/Adult+literacy+core+curriculum/pdf/, accessed on 28/03/12: p. 6-7. 337 Department for Education and Skills (2001) Adult Literacy Core Curriculum including Spoken Communication, available online at: http://rwp.excellencegateway.org.uk/resource/Adult+literacy+core+curriculum/pdf/, accessed on 28/03/12: p. 14-19.
Chapter 14: Comparisons of survey results with other surveys and standards
318
At Entry Level 1, an adult can read short texts with repeated language patterns on familiar topics; read signs and symbols and produce limited writing – very short sentences only;
At Entry Level 2, an adult can read short straightforward texts on familiar topics and obtain information from familiar sources (e.g. a leaflet, short letter). She/he shows some awareness of audience when writing (e.g. a short informal letter or note);
At Entry Level 3, an adult reads more accurately and independently and obtains information from everyday sources (e.g. a popular newspaper). She/he is able to communicate in writing information and opinions with some adaption to the intended audience (e.g. a short formal letter, note or form);
At Level 1, an adult reads texts of varying lengths on a variety of topics and obtains information from different sources (e.g. reports, text books and work manuals). Written communication demonstrates an ability to express ideas and opinions (e.g. in a formal letter, memo, brief report);
At Level 2, the adult reads from texts of varying complexity, accurately and independently (e.g. complex books, text books, reports, training manuals etc.). She/he writes to communicate information, ideas and opinions clearly and effectively, using length, format and style appropriate to purpose, context and audience (e.g. complex letter, essay, report).
14.3.2 Literacy criteria tested in the Skills for Life Survey literacy assessment The range of criteria tested in the Skills for Life Survey literacy assessment is relatively small because of the limitations imposed by multiple choice testing, the technology available at the time of the assessment’s development and the time available for the respondent to take the assessment. These limitations and their implications are discussed further in Annex 2 and Annex 4. The assessment of writing skills is restricted to spelling, punctuation, grammar and a limited range of skills and techniques more accurately described as ‘knowledge about writing’ rather than the skill of writing itself. The brevity of the survey and the use of multiple choice questions were prerequisites in the survey design brief.
14.3.3 The structure of the Skills for Life Survey literacy assessment The assessment comprised a bank of 70 questions organised by Levels and stages. An underpinning algorithm controlled the assessment so that respondents were routed automatically from one question to the next, depending on their responses, ensuring that they were answering questions at an appropriate standard.
The assessment was designed to be completed in 25 to 30 minutes, during which time a respondent would be expected to respond to 35 multiple choice items. Questions were based on short pieces of everyday reading matter such as memos, letters, advertisements and news reports. The number of questions per item was commensurate with the length of text; the longer the text, the greater the number of questions. Onscreen devices, such as drop-down multiple choice questions, made it possible for the assessment to be completed within the allocated time. The range of criteria addressed within each stage of the algorithm was broadly similar for each of the five Levels assessed.
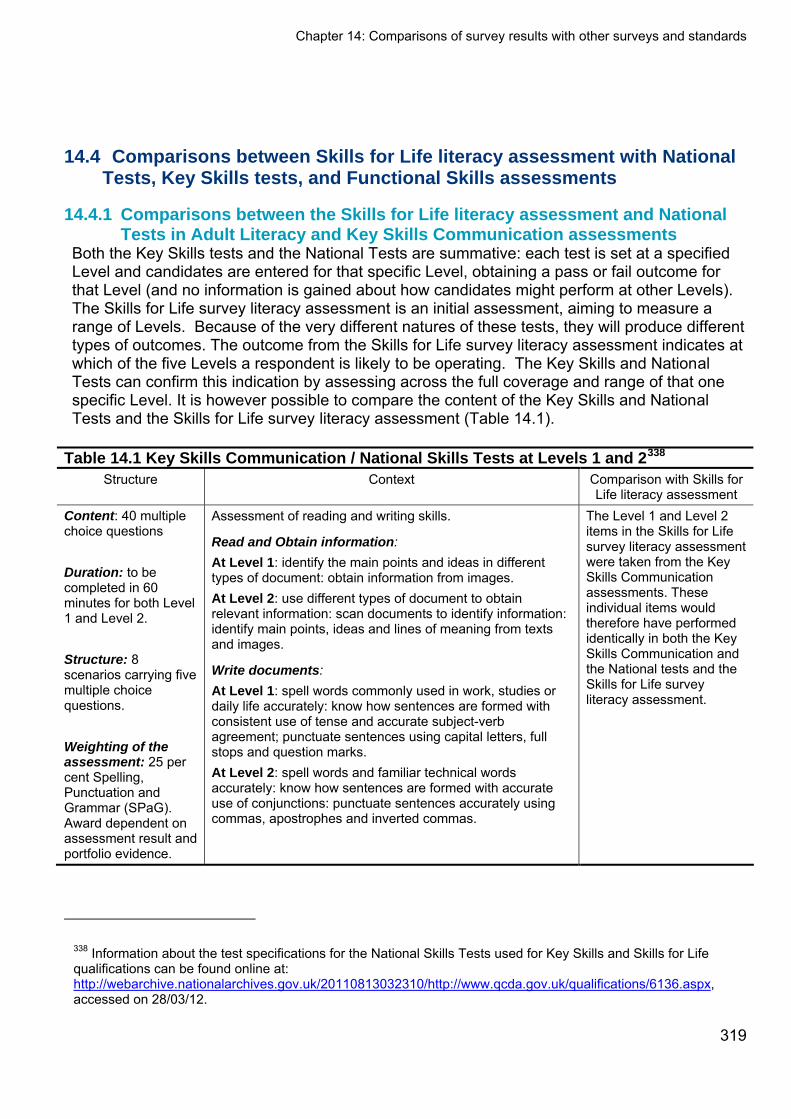
Chapter 14: Comparisons of survey results with other surveys and standards
319
14.4 Comparisons between Skills for Life literacy assessment with National Tests, Key Skills tests, and Functional Skills assessments
14.4.1 Comparisons between the Skills for Life literacy assessment and National Tests in Adult Literacy and Key Skills Communication assessments
Both the Key Skills tests and the National Tests are summative: each test is set at a specified Level and candidates are entered for that specific Level, obtaining a pass or fail outcome for that Level (and no information is gained about how candidates might perform at other Levels). The Skills for Life survey literacy assessment is an initial assessment, aiming to measure a range of Levels. Because of the very different natures of these tests, they will produce different types of outcomes. The outcome from the Skills for Life survey literacy assessment indicates at which of the five Levels a respondent is likely to be operating. The Key Skills and National Tests can confirm this indication by assessing across the full coverage and range of that one specific Level. It is however possible to compare the content of the Key Skills and National Tests and the Skills for Life survey literacy assessment (Table 14.1).
Table 14.1 Key Skills Communication / National Skills Tests at Levels 1 and 2338 Structure Context Comparison with Skills for
Life literacy assessment Content: 40 multiple choice questions Duration: to be completed in 60 minutes for both Level 1 and Level 2. Structure: 8 scenarios carrying five multiple choice questions. Weighting of the assessment: 25 per cent Spelling, Punctuation and Grammar (SPaG). Award dependent on assessment result and portfolio evidence.
Assessment of reading and writing skills.
Read and Obtain information:
At Level 1: identify the main points and ideas in different types of document: obtain information from images. At Level 2: use different types of document to obtain relevant information: scan documents to identify information: identify main points, ideas and lines of meaning from texts and images.
Write documents:
At Level 1: spell words commonly used in work, studies or daily life accurately: know how sentences are formed with consistent use of tense and accurate subject-verb agreement; punctuate sentences using capital letters, full stops and question marks. At Level 2: spell words and familiar technical words accurately: know how sentences are formed with accurate use of conjunctions: punctuate sentences accurately using commas, apostrophes and inverted commas.
The Level 1 and Level 2 items in the Skills for Life survey literacy assessment were taken from the Key Skills Communication assessments. These individual items would therefore have performed identically in both the Key Skills Communication and the National tests and the Skills for Life survey literacy assessment.
338 Information about the test specifications for the National Skills Tests used for Key Skills and Skills for Life qualifications can be found online at: http://webarchive.nationalarchives.gov.uk/20110813032310/http://www.qcda.gov.uk/qualifications/6136.aspx, accessed on 28/03/12.
Chapter 14: Comparisons of survey results with other surveys and standards
320
14.4.2 Comparisons between the Skills for Life survey literacy assessment and Functional Skills English assessments
Functional Skills qualifications became available in September 2010, and are replacing Key Skills qualifications from that date.339 Functional Skills qualifications are now offered by a number of awarding organisations each of whom now offer their own external340 assessments (i.e. there are no standardised national assessments for Functional Skills). A comparison of the Functional Skills assessment criteria with the Skills for Life literacy assessments is shown in Table 14.2, based on the Functional Skills criteria published by Ofqual.341
339 Functional Skills Questions and Answers, LSC, http://readingroom.lsc.gov.uk/SFA/SFA-functionalsSkillsQandA2010.pdf, accessed on 28/03/12. 340 Assessments that are set and marked by external agencies such as an awarding organisation, i.e. not by the candidate’s teacher/tutor. 341 Office of Qualifications and Examinations Regulation (2011) Functional Skills Criteria for English. Entry 1, Entry 2, Entry 3, Level 1 and Level 2, available online at: http://www.ofqual.gov.uk/downloads/category/68-functional-skills-subject-criteria?download=1171%3Afunctional-skills-criteria-for-english, accessed on 28/03/12.
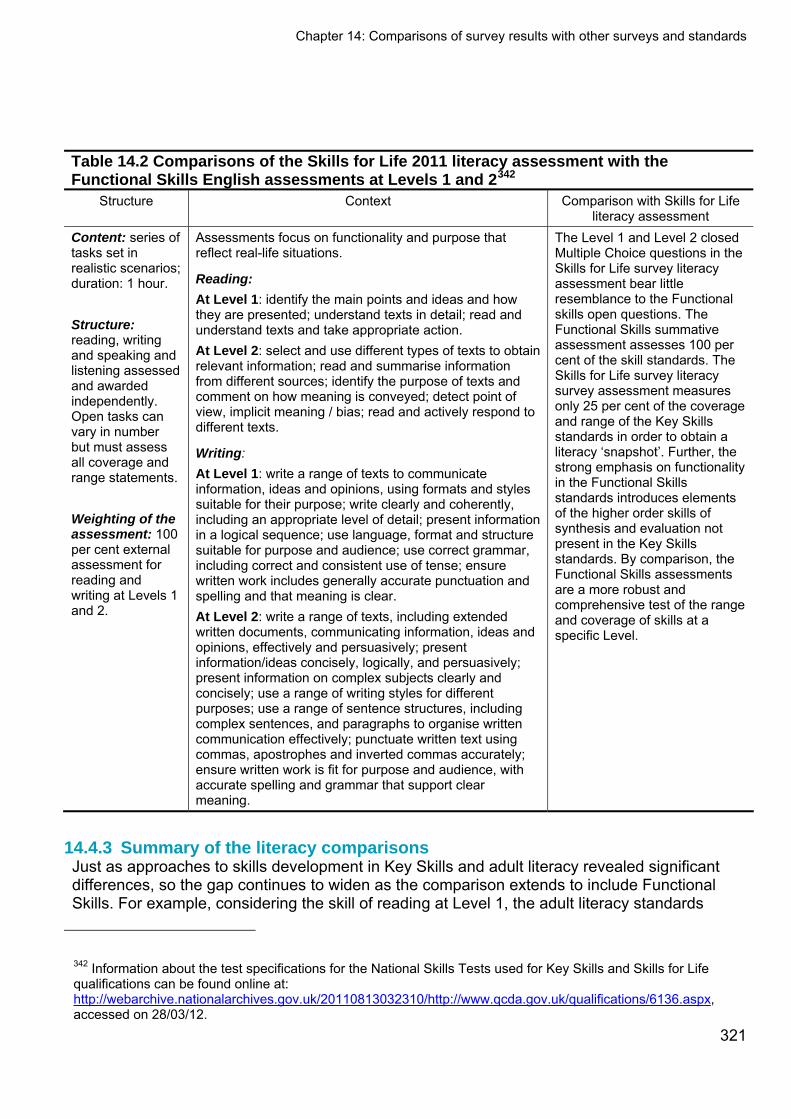
Chapter 14: Comparisons of survey results with other surveys and standards
321
Table 14.2 Comparisons of the Skills for Life 2011 literacy assessment with the Functional Skills English assessments at Levels 1 and 2342
Structure Context Comparison with Skills for Life literacy assessment
Content: series of tasks set in realistic scenarios; duration: 1 hour. Structure: reading, writing and speaking and listening assessed and awarded independently. Open tasks can vary in number but must assess all coverage and range statements. Weighting of the assessment: 100 per cent external assessment for reading and writing at Levels 1 and 2.
Assessments focus on functionality and purpose that reflect real-life situations.
Reading:
At Level 1: identify the main points and ideas and how they are presented; understand texts in detail; read and understand texts and take appropriate action. At Level 2: select and use different types of texts to obtain relevant information; read and summarise information from different sources; identify the purpose of texts and comment on how meaning is conveyed; detect point of view, implicit meaning / bias; read and actively respond to different texts.
Writing:
At Level 1: write a range of texts to communicate information, ideas and opinions, using formats and styles suitable for their purpose; write clearly and coherently, including an appropriate level of detail; present information in a logical sequence; use language, format and structure suitable for purpose and audience; use correct grammar, including correct and consistent use of tense; ensure written work includes generally accurate punctuation and spelling and that meaning is clear. At Level 2: write a range of texts, including extended written documents, communicating information, ideas and opinions, effectively and persuasively; present information/ideas concisely, logically, and persuasively; present information on complex subjects clearly and concisely; use a range of writing styles for different purposes; use a range of sentence structures, including complex sentences, and paragraphs to organise written communication effectively; punctuate written text using commas, apostrophes and inverted commas accurately; ensure written work is fit for purpose and audience, with accurate spelling and grammar that support clear meaning.
The Level 1 and Level 2 closed Multiple Choice questions in the Skills for Life survey literacy assessment bear little resemblance to the Functional skills open questions. The Functional Skills summative assessment assesses 100 per cent of the skill standards. The Skills for Life survey literacy survey assessment measures only 25 per cent of the coverage and range of the Key Skills standards in order to obtain a literacy ‘snapshot’. Further, the strong emphasis on functionality in the Functional Skills standards introduces elements of the higher order skills of synthesis and evaluation not present in the Key Skills standards. By comparison, the Functional Skills assessments are a more robust and comprehensive test of the range and coverage of skills at a specific Level.
14.4.3 Summary of the literacy comparisons Just as approaches to skills development in Key Skills and adult literacy revealed significant differences, so the gap continues to widen as the comparison extends to include Functional Skills. For example, considering the skill of reading at Level 1, the adult literacy standards
342 Information about the test specifications for the National Skills Tests used for Key Skills and Skills for Life qualifications can be found online at: http://webarchive.nationalarchives.gov.uk/20110813032310/http://www.qcda.gov.uk/qualifications/6136.aspx, accessed on 28/03/12.
Chapter 14: Comparisons of survey results with other surveys and standards
322
fleshed out the Key Skills criterion in greater detail. Subsequently, the Functional Skills standards and assessments add demands for further skill layers of analysis, application and purpose and consequently, as reported in the Evaluation of the Functional Skills Pilot, the Functional Skills curriculum (as delivered during the Functional Skills Pilot) is regarded as more challenging to deliver and achieve than Skills for Life.343 Similarly, in the writing tasks at Level 2 of the Functional Skills assessments, Ofqual accreditation requires that:
‘At Level 2, learners use a range of different styles that may require the selection of technical vocabulary where appropriate, using evidence to support argument, persuasive techniques and knowledge about how and when to use formal and informal language. Learners at this level organise their ideas into extended responses, making informed decisions about structure and presentation.’ 344
Simultaneously, the component-specific criteria require a move away from fixed to open response assessment in order to measure a candidate’s ability not only to read, but also to utilise information that they have read. This is as would be expected in a summative assessment. For direct comparison purposes, Table 14.A1 in the Appendix of Tables illustrates differences between Key Skills, adult literacy and Functional Skills reading standards as assessed at Level 1 and Level 2 as examples, providing an ‘element-by-element’, ‘level-by-level’ and ‘component-by-component’ overview of the criteria measured in the Skills for Life survey literacy assessment (the adult literacy standards), Key Skills tests and Functional Skills assessments. There is a close relationship between Key Skills, adult literacy skills and the Skills for Life survey literacy assessment: the adult literacy standards extend from Entry Level 1 to Level 2 and thus provide a more appropriate basis for baseline literacy testing. The content of the Key Skills and adult literacy standards are broadly the same for both reading skills and writing skills but the latter is fleshed out in greater detail. Because the specification for the Skills for Life survey literacy assessment required that it be completed in less than 30 minutes, a wide variety of brief scenarios, no more than a paragraph in length, were used. Thus, the number of questions attached to each context varies. However, a balance was maintained throughout the assessment to ensure that both reading skills and knowledge of writing skills were assessed in roughly equal measure and the number of criteria assessed was consistent across the Levels. Whilst comparisons can be drawn between the content of the Skills for Life survey literacy assessment and the Level 1 and Level 2 Key Skills/National Test assessments, the comparison of the findings from both assessments is a less valid exercise if only because the two instruments have a radically different function. The Skills for Life survey literacy assessment provides, in 30 minutes, a ‘snapshot’ of an anonymous respondent’s literacy skills based on assessment across a range of levels and a sample of skill areas. In contrast, the Key Skills national tests exist only at Levels 1 and 2 and are 1 hour summative assessments of skills at one Level only. In the case of Key Skills, the National Tests are used in conjunction with a
343 Qualifications and Curriculum Development Authority (2011) Evaluation of the Functional Skills Pilot, available online at: http://webarchive.nationalarchives.gov.uk/20110813032310/http://www.qcda.gov.uk/resources/7585.aspx, pages ii, iii, accessed on 28/03/12. 344 Qualifications and Curriculum Authority (2007) Functional Skills Standards, available online at:http://www.excellencegateway.org.uk/pdf/Functional%20skills%20standards.pdf, accessed on 28/03/12: p. 16.
Chapter 14: Comparisons of survey results with other surveys and standards
323
sections.
portfolio of evidence to confirm whether a candidate has achieved the skill Level and therefore is competent across the full coverage and range of criteria for that Level.
Few comparisons can be drawn between Functional Skills English assessments and the Skills for Life survey literacy assessment. Not only do they share the same generic dissimilarities to the Skills for Life survey literacy assessment as do the Key Skills tests, they comprise mainly open questions and confine multiple choice questions to the reading paper, where they represent only four per cent of the total marks for the qualification. Each version of a Functional Skills assessment covers 100 per cent of the coverage and range requirements, and thereby is able to confirm that a candidate has reached a specific Level of functional English/literacy, and cannot provide any information about attainment at other Levels.
14.5 Comparisons between the Skills for Life 2011 literacy survey, the International Adult Literacy Survey (IALS 1997)345 and the Centre for Longitudinal Studies/National Foundation for Educational Research 1997 survey346 for literacy
Apart from comparisons with contemporary curricula in England, it is also useful to compare the findings of SfL2011 alongside contemporary national and international surveys. The closest contemporary surveys of the scale of need for adult literacy skills in Britain to SfL2011 were ‘Adult Literacy in Britain’,347 which formed part of the International Adult Literacy Survey (IALS), and the reports from the Centre for Longitudinal Studies (CLS) at the Institute of Education, ‘It Doesn’t Get Any Better’348 and ‘The Basic Skills of Young Adults’,349 both of which are discussed as underpinning evidence for the findings in the Moser report. These produced similar results and so are discussed together in the following
14.5.1 Methodology of IALS The British IALS survey was the first literacy survey to be carried out in Britain on a national random sample of adults of working age. The survey was undertaken by the Office for National Statistics in 1996, and covered a sample of 3,811 adults, reporting in 1997. The survey set assessment tasks taken from a range of contexts simulating the range of activities that adults would encounter in everyday life. Note that, despite its title, IALS assesses both literacy and numeracy (mainly arithmetic) skills – IALS refers to this latter as ‘quantitative literacy’, by which they mean the ability to use arithmetic to perform tasks such as balancing a chequebook, verifying an invoice, or determining the amount of interest on a loan from an advertisement.
345 Organisation for Economic Co-operation and Development Statistics and Statistics Canada (2000) Literacy in the Information Age, available online at: http://www.oecd.org/dataoecd/24/21/39437980.pdf, accessed on 28/03/12 and Kirsch, I. S. (2001) The International Adult Literacy Survey (IALS): Understanding What Was Measured. Educational Testing Service Research Report, available online at: http://www.ets.org/Media/Research/pdf/RR-01-25-Kirsch.pdf, accessed on 28/03/12. 346 Referred to in: Moser, C. et al. (1999) Improving literacy and numeracy: a fresh start. The report of the working group chaired by Sir Claus Moser on behalf of the Department for Education and Skills, available online at: http://www.lifelonglearning.co.uk/mosergroup/index, accessed 28/03/12: Annex A. 347 Carey, S., Low, S., and J. Hansboro (1997). Adult literacy in Britain. Office for National Statistics. 348 Bynner, J. and S. Parsons (1997) It Doesn’t Get any Better. The Basic Skills Agency, 349 Ekinsmyth, C. and J. Bynner (1994) The Basic Skills of Young Adults. London: The Basic Skills Agency.

Chapter 14: Comparisons of survey results with other surveys and standards
324
The survey produced measurements for three broad categories of literacy:350 Prose literacy - Understanding and using information from text, e.g. understanding a
newspaper article.
Document literacy - Locating and using information from other formats, e.g. reading a bus timetable.
Quantitative literacy - Applying arithmetic operations to numbers embedded in print, e.g. working out the price of a loan from an advert.
Each of the three scales measuring these dimensions of literacy was grouped into five Literacy Levels: to be placed at a particular Level, respondents had to perform tasks at that Level correctly and consistently. The definition of consistent performance was set at 80 per cent.
The survey was conducted by personal interview in respondents’ homes and consisted of two main elements, a background questionnaire and a 'literacy' assessment. The background questionnaire collected information on the socio-demographic characteristics of the respondent such as age, sex, education, occupation and income as well as asking about literacy activities such as reading as part of their job or for pleasure, television viewing, and participation in training or adult education. In Britain both the questionnaire and administration of the assessment used computer-assisted interviewing methods. After the interview, respondents completed a short screening assessment which sought to identify those with very limited literacy skills. Respondents who correctly answered at least two of the six screening tasks were then asked to complete a larger assessment booklet which measured literacy. Although respondents had to write their answers in the booklet, the assessment did not measure writing ability.
In order to ensure as broad a range of item content as possible, the total number of tasks in the assessment was larger than any one individual could complete in the time available. Each respondent therefore was only asked to complete a subset of the total assessment. The assessment was paper-based and each respondent was required to attempt a number of tasks.
IALS contexts and text types
IALS assessments consisted of a varied collection of stimulus material/texts, each of which was used as the basis for a number of questions/tasks. The emphasis was on measuring a broad range of information-processing skills covering a variety of contexts. The six broad contexts used were: Home and family;
Health and safety;
Community and citizenship;
350 Kirsch, I. S. (2001) The International Adult Literacy Survey (IALS): Understanding What Was Measured. Educational Testing Service Research Report, available online at: http://www.ets.org/Media/Research/pdf/RR-01-25-Kirsch.pdf, accessed on 28/03/12.
Chapter 14: Comparisons of survey results with other surveys and standards
325
Consumer economics;
Work; and
Leisure and recreation.
Each text was designed to stand alone without requiring additional printed material. The texts consisted of:
Continuous texts in which organisation occurs by paragraph setting, indentation, and headings;
Non-continuous texts that allow the reader to employ different strategies for entering and extracting information from them (e.g. tables, schedules, charts, graphs, maps and forms).
A total of thirty-four tasks were developed for the survey, each question being graded according to its standard of difficulty using the IALS document literacy scale.
IALS measurement of literacy
IALS shares a number of features with SfL2011: both surveys employ a combination of questionnaire, interview and individual assessment; texts/contexts are taken from everyday adult life; assessments are graded in difficulty; and a screening device is used in both surveys. However, there are significant differences. The IALS survey: assessed both literacy and numeracy in integrated assessments;
did not assess writing skills;
was entirely paper-based and used open-ended questions;
required human marking; and
used assessment criteria developed especially for the survey.
The IALS survey measured two dimensions of literacy: prose literacy and document literacy. Writing, and speaking and listening skills were not assessed. IALS also made use of Item Response Theory (IRT), a statistical method for scaling assessment items for difficulty so that each item had a known probability of being correctly completed by an individual with a given proficiency level.
14.5.2 Methodology of CLS/NFER NCDS survey, 1997 The Centre for Longitudinal Studies carried out a series of studies of adults’ basic skills for the Basic Skills Agency based on two birth cohort studies. The first, known as the National Child Development Study (NCDS) comprises a sample of over 17,000 people born in one week in 1958. The other, known as the 1970 British Cohort Study (BCS70), is similar, and comprises a sample of over 17,000 people born in a single week in 1970. The 1997 survey, reported in the ‘It Doesn’t Get any Better: the Impact of Poor Basic Skills on the Lives of 37 Year Olds’ was carried out on a 10 per cent sample of the NCDS cohort
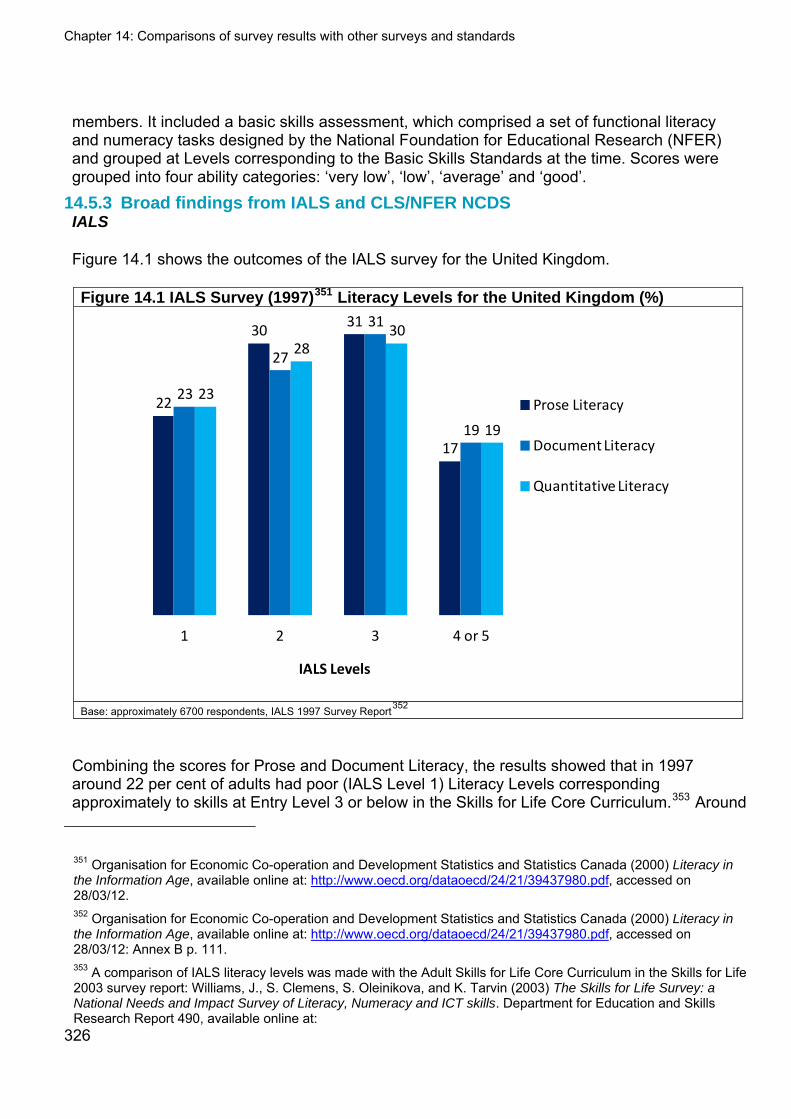
Chapter 14: Comparisons of survey results with other surveys and standards
members. It included a basic skills assessment, which comprised a set of functional literacy and numeracy tasks designed by the National Foundation for Educational Research (NFER) and grouped at Levels corresponding to the Basic Skills Standards at the time. Scores were grouped into four ability categories: ‘very low’, ‘low’, ‘average’ and ‘good’.
14.5.3 Broad findings from IALS and CLS/NFER NCDS IALS
Figure 14.1 shows the outcomes of the IALS survey for the United Kingdom.
Figure 14.1 IALS Survey (1997)351 Literacy Levels for the United Kingdom (%)
22
3031
17
23
27
31
19
23
2830
19
1 2 3 4 or 5
Prose Literacy
Document Literacy
Quantitative Literacy
IALS Levels
Base: approximately 6700 respondents, IALS 1997 Survey Report352
Combining the scores for Prose and Document Literacy, the results showed that in 1997 around 22 per cent of adults had poor (IALS Level 1) Literacy Levels corresponding approximately to skills at Entry Level 3 or below in the Skills for Life Core Curriculum.353 Around
351 Organisation for Economic Co-operation and Development Statistics and Statistics Canada (2000) Literacy in the Information Age, available online at: http://www.oecd.org/dataoecd/24/21/39437980.pdf, accessed on 28/03/12. 352 Organisation for Economic Co-operation and Development Statistics and Statistics Canada (2000) Literacy in the Information Age, available online at: http://www.oecd.org/dataoecd/24/21/39437980.pdf, accessed on 28/03/12: Annex B p. 111.
326
353 A comparison of IALS literacy levels was made with the Adult Skills for Life Core Curriculum in the Skills for Life 2003 survey report: Williams, J., S. Clemens, S. Oleinikova, and K. Tarvin (2003) The Skills for Life Survey: a National Needs and Impact Survey of Literacy, Numeracy and ICT skills. Department for Education and Skills Research Report 490, available online at:
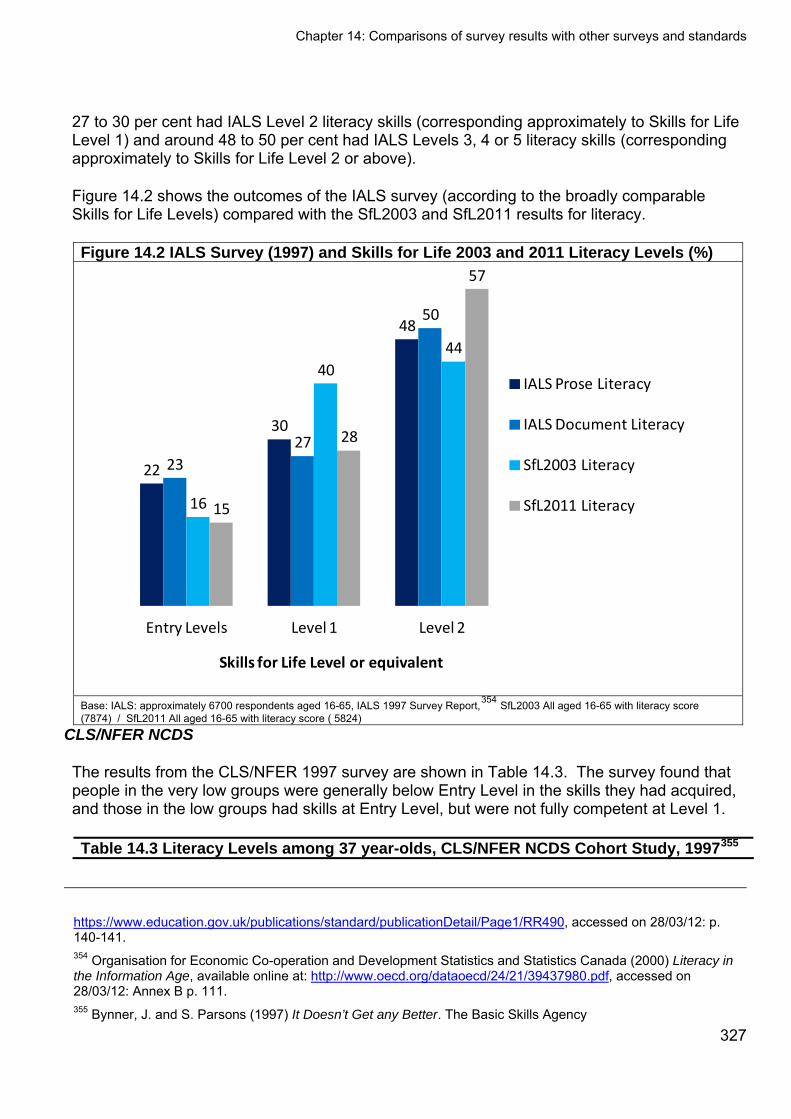
Chapter 14: Comparisons of survey results with other surveys and standards
27 to 30 per cent had IALS Level 2 literacy skills (corresponding approximately to Skills for Life Level 1) and around 48 to 50 per cent had IALS Levels 3, 4 or 5 literacy skills (corresponding approximately to Skills for Life Level 2 or above).
Figure 14.2 shows the outcomes of the IALS survey (according to the broadly comparable Skills for Life Levels) compared with the SfL2003 and SfL2011 results for literacy.
Figure 14.2 IALS Survey (1997) and Skills for Life 2003 and 2011 Literacy Levels (%)
22
30
48
23
27
50
16
40
44
15
28
57
Entry Levels Level 1 Level 2
IALS Prose Literacy
IALS Document Literacy
SfL2003 Literacy
SfL2011 Literacy
Skills for Life Level or equivalent
Base: IALS: approximately 6700 respondents aged 16-65, IALS 1997 Survey Report,354 SfL2003 All aged 16-65 with literacy score (7874) / SfL2011 All aged 16-65 with literacy score ( 5824)
CLS/NFER NCDS
The results from the CLS/NFER 1997 survey are shown in Table 14.3. The survey found that people in the very low groups were generally below Entry Level in the skills they had acquired, and those in the low groups had skills at Entry Level, but were not fully competent at Level 1.
Table 14.3 Literacy Levels among 37 year-olds, CLS/NFER NCDS Cohort Study, 1997355
https://www.education.gov.uk/publications/standard/publicationDetail/Page1/RR490, accessed on 28/03/12: p. 140-141. 354 Organisation for Economic Co-operation and Development Statistics and Statistics Canada (2000) Literacy in the Information Age, available online at: http://www.oecd.org/dataoecd/24/21/39437980.pdf, accessed on 28/03/12: Annex B p. 111. 355 Bynner, J. and S. Parsons (1997) It Doesn’t Get any Better. The Basic Skills Agency
327
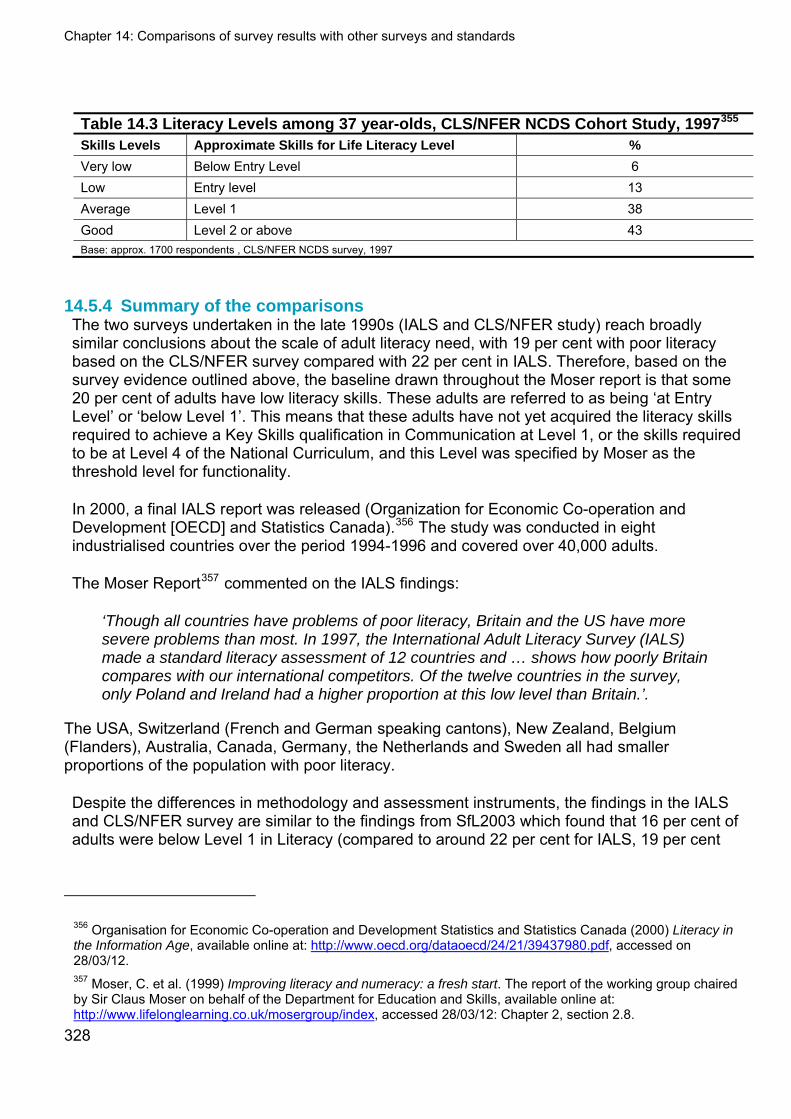
Chapter 14: Comparisons of survey results with other surveys and standards
328
Table 14.3 Literacy Levels among 37 year-olds, CLS/NFER NCDS Cohort Study, 1997355 Skills Levels Approximate Skills for Life Literacy Level %
Very low Below Entry Level 6 Low Entry level 13 Average Level 1 38 Good Level 2 or above 43 Base: approx. 1700 respondents , CLS/NFER NCDS survey, 1997
14.5.4 Summary of the comparisons The two surveys undertaken in the late 1990s (IALS and CLS/NFER study) reach broadly similar conclusions about the scale of adult literacy need, with 19 per cent with poor literacy based on the CLS/NFER survey compared with 22 per cent in IALS. Therefore, based on the survey evidence outlined above, the baseline drawn throughout the Moser report is that some 20 per cent of adults have low literacy skills. These adults are referred to as being ‘at Entry Level’ or ‘below Level 1’. This means that these adults have not yet acquired the literacy skills required to achieve a Key Skills qualification in Communication at Level 1, or the skills required to be at Level 4 of the National Curriculum, and this Level was specified by Moser as the threshold level for functionality.
In 2000, a final IALS report was released (Organization for Economic Co-operation and Development [OECD] and Statistics Canada).356 The study was conducted in eight industrialised countries over the period 1994-1996 and covered over 40,000 adults.
The Moser Report357 commented on the IALS findings:
‘Though all countries have problems of poor literacy, Britain and the US have more severe problems than most. In 1997, the International Adult Literacy Survey (IALS) made a standard literacy assessment of 12 countries and … shows how poorly Britain compares with our international competitors. Of the twelve countries in the survey, only Poland and Ireland had a higher proportion at this low level than Britain.’.
The USA, Switzerland (French and German speaking cantons), New Zealand, Belgium (Flanders), Australia, Canada, Germany, the Netherlands and Sweden all had smaller proportions of the population with poor literacy.
Despite the differences in methodology and assessment instruments, the findings in the IALS and CLS/NFER survey are similar to the findings from SfL2003 which found that 16 per cent of adults were below Level 1 in Literacy (compared to around 22 per cent for IALS, 19 per cent
356 Organisation for Economic Co-operation and Development Statistics and Statistics Canada (2000) Literacy in the Information Age, available online at: http://www.oecd.org/dataoecd/24/21/39437980.pdf, accessed on 28/03/12. 357 Moser, C. et al. (1999) Improving literacy and numeracy: a fresh start. The report of the working group chaired by Sir Claus Moser on behalf of the Department for Education and Skills, available online at: http://www.lifelonglearning.co.uk/mosergroup/index, accessed 28/03/12: Chapter 2, section 2.8.
Chapter 14: Comparisons of survey results with other surveys and standards
329
CLS/NFER), 40 per cent at Level 1 (around 28 per cent for IALS, 38 per cent for CLS/NFER) and 44 per cent at Level 2 or above (around 49 per cent for IALS, 43 per cent for CLS/NFER).
14.6 Comparisons between the Skills for Life 2011 literacy survey and the National Survey of Adult Skills in Wales, 2010358 for literacy
The latest statistics on adult skills produced by the Welsh Government were published in December 2011 and present summary information from The National Survey of Adult Skills in Wales.
14.6.1 Methodology The survey was carried out during 2010, and assessed overall literacy and numeracy skills of adults (aged 16 to 65) in Wales (through the English language medium), and Welsh medium literacy skills of Welsh-speaking adults in Wales. The surveys were designed as far as was practically possible to replicate similar surveys carried out in Wales in 2004,359 in order to consider changes in skills. The surveys (both in 2004 and 2010) use the same literacy (and numeracy) assessment tools and similar background questionnaires to SfL2003 and SfL2011 in England.
14.6.2 Broad findings Table 14.4 shows a comparison of the literacy results from the two surveys in England (2003 and 2011) and Wales (2004 and 2010). The results for EFL speakers in England are compared against the Welsh results of the ‘English medium’ survey in order to examine approximately comparable populations. 360
358 Miller, N and K.Lewis (2011) National Survey of Adult Skills in Wales 2010. Welsh Government social research report number 27/2011, available online: http://new.wales.gov.uk/about/aboutresearch/social/latestresearch/5618505/?lang=en, accessed on 28/03/12. 359 Williams, J, Kinnaird, R. (2004) The national survey of Adult Basic Skills in Wales, avaliable online at: http://www.learningobservatory.com/uploads/publications/1943.pdf, accessed on 18/06/12, with a summary available online at: : http://wales.gov.uk/topics/statistics/headlines/post16ed-2005/hdw200505111/?lang=en, accessed on 28/03/12. 360 When comparing the EFL literacy levels for the Skills for Life survey in England with the results for the Welsh English medium survey, it should be noted that the Welsh survey includes non-Welsh speaking people whose first language is not English. The parameters of the populations being compared are not precisely identical.

Chapter 14: Comparisons of survey results with other surveys and standards
330
Table 14.4 Literacy levels from Skills for Life surveys in England (2003, 2011) for EFL speakers and the Welsh ‘English Medium’ survey (2004, 2010)
ENGLAND WALES*
LITERACY LEVEL 2003 2011
Change since
2003361 2004 2010 Change
since 2004 % % % % % %
Entry Level 1 or below 2 3 +1 4 3 -1 Entry Level 2 2 2 0 3 2 -1 Entry Level 3 10 7 -3 18 7 -11 Level 1 40 29 -11 37 29 -8 Level 2 or above 45 60 +15 38 59 +21 Entry Level 3 or below 14 12 ‐2 25 12 ‐13
Level 1 or above 85 88 +3 75 88 +13 Base: SfL2003 England EFL respondents aged 16-65 with literacy score (7488), SfL2011 England EFL respondents aged 16-65 with literacy score (5344), Adult Skills Wales 2004 (2555) (English Medium Only) All aged 16-65, Adult Skills Wales 2010 (2116) (English Medium Only) All aged 16-65
*Welsh survey results reported to whole number percentage level only
Overall results from the ‘English medium’ survey suggest there has been a greater improvement in Literacy Levels in Wales than in England over a period that is shorter by two years, although it should be noted that Wales was starting from a lower literacy base:
Twelve per cent of adults were assessed to have Entry Level literacy in 2010, a decrease from 25 per cent in 2004.
Twenty-nine per cent of adults were assessed at Level 1 in 2010 (a decrease from 37 per cent in 2004)
Fifty-nine per cent of adults were assessed at Level 2 or above in 2010 (an increase from 38 per cent in 2004).
In line with the SfL2011 survey outcomes, Welsh Literacy Levels (and Numeracy Levels) were higher amongst the employed, those with higher household incomes and those with higher level qualifications.
14.6.3 Summary of the comparison In line with England, the results from Wales show a large increase in the proportion of respondents achieving a Level 2 or above score in literacy from 38 per cent in 2004 to 59 per
361 The changes listed in the table do not sum to 0 due to rounding.
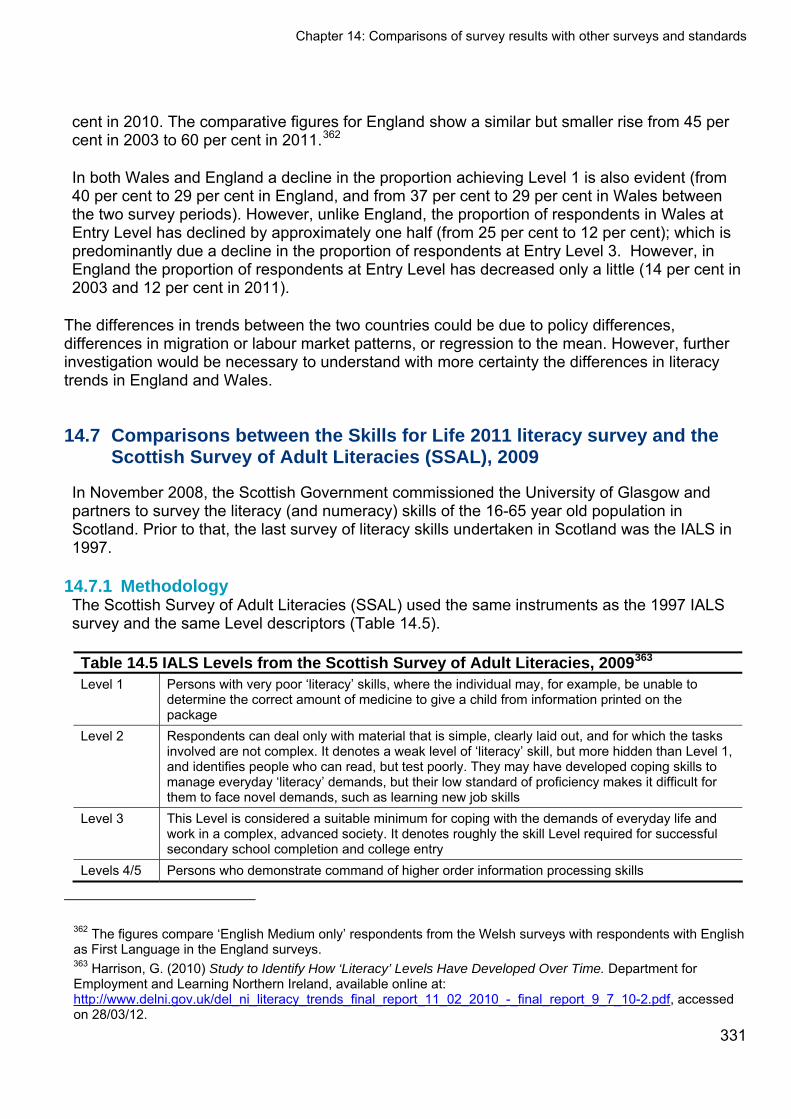
Chapter 14: Comparisons of survey results with other surveys and standards
331
cent in 2010. The comparative figures for England show a similar but smaller rise from 45 per cent in 2003 to 60 per cent in 2011.362
In both Wales and England a decline in the proportion achieving Level 1 is also evident (from 40 per cent to 29 per cent in England, and from 37 per cent to 29 per cent in Wales between the two survey periods). However, unlike England, the proportion of respondents in Wales at Entry Level has declined by approximately one half (from 25 per cent to 12 per cent); which is predominantly due a decline in the proportion of respondents at Entry Level 3. However, in England the proportion of respondents at Entry Level has decreased only a little (14 per cent in 2003 and 12 per cent in 2011).
The differences in trends between the two countries could be due to policy differences, differences in migration or labour market patterns, or regression to the mean. However, further investigation would be necessary to understand with more certainty the differences in literacy trends in England and Wales.
14.7 Comparisons between the Skills for Life 2011 literacy survey and the Scottish Survey of Adult Literacies (SSAL), 2009
In November 2008, the Scottish Government commissioned the University of Glasgow and partners to survey the literacy (and numeracy) skills of the 16-65 year old population in Scotland. Prior to that, the last survey of literacy skills undertaken in Scotland was the IALS in 1997.
14.7.1 Methodology The Scottish Survey of Adult Literacies (SSAL) used the same instruments as the 1997 IALS survey and the same Level descriptors (Table 14.5).
Table 14.5 IALS Levels from the Scottish Survey of Adult Literacies, 2009363 Level 1 Persons with very poor ‘literacy’ skills, where the individual may, for example, be unable to
determine the correct amount of medicine to give a child from information printed on the package
Level 2 Respondents can deal only with material that is simple, clearly laid out, and for which the tasks involved are not complex. It denotes a weak level of ‘literacy’ skill, but more hidden than Level 1, and identifies people who can read, but test poorly. They may have developed coping skills to manage everyday ‘literacy’ demands, but their low standard of proficiency makes it difficult for them to face novel demands, such as learning new job skills
Level 3 This Level is considered a suitable minimum for coping with the demands of everyday life and work in a complex, advanced society. It denotes roughly the skill Level required for successful secondary school completion and college entry
Levels 4/5 Persons who demonstrate command of higher order information processing skills
362 The figures compare ‘English Medium only’ respondents from the Welsh surveys with respondents with English as First Language in the England surveys. 363 Harrison, G. (2010) Study to Identify How ‘Literacy’ Levels Have Developed Over Time. Department for Employment and Learning Northern Ireland, available online at: http://www.delni.gov.uk/del_ni_literacy_trends_final_report_11_02_2010_-_final_report_9_7_10-2.pdf, accessed on 28/03/12.
Chapter 14: Comparisons of survey results with other surveys and standards
332
The resulting SSAL in 2009 was based on IALS. The survey involved a random sample of 1,927 16-65 year-olds in Scottish households. The sampling strategy ensured a high degree of representativeness as well as allowing in-depth discussion of issues such as gender, social class, and level of urbanisation. In line with IALS, SSAL measured three scales of literacy skills: prose, document and quantitative (numeracy).
However, there were three major differences between the 1997 and 2009 Scottish surveys, making direct comparison of findings inappropriate. These were: sample size, areas of data collection and the development of a new Item Response Theory model. Whilst the effects of these changes were positive for the 2009 survey, they reduce the validity of any comparison with the 1997 IALS survey.
14.7.2 Broad findings The levels for literacy (and numeracy) achieved by the Scottish working age population are shown in Figure 14.3. The SSAL 2009 survey report 364 found that:
Seventy three per cent of the Scottish working age population have a standard of literacies that is recognised internationally as appropriate for a contemporary society (IALS Level 3 or above in at least one of the three literacy scales, corresponding approximately to Skills for Life Level 2 or above in literacy and Skills for Life Level 1 or above in numeracy);
one quarter of the Scottish population (27 per cent) may face occasional challenges and constrained opportunities due to their literacies difficulties, but will generally cope with their day-to-day lives (all three IALS skills at Level 1 or 2, corresponding approximately to Skills for Life Level 1 or below in literacy and Skills for Life Entry Level 3 or below in numeracy);
within this quarter of the population, 3.6 per cent (one person in every 28) face serious challenges in their literacies practices (all three IALS skills at Level 1, corresponding approximately to Skills for Life Entry Level 3 or below in literacy and Skills for Life Entry Level 2 or below in numeracy).
Skills were not strongly related to gender, though there was a relationship with age (26 to 35 year-olds have stronger skills and higher education than other age groups). There were very few people who scored in Level 5 across the survey, as was also the case in 1997, and because of this Levels 4 and 5 are combined, and referred to as ‘Level 4/5.’
364 St.Clair, R., L. Tett and K. Maclachlan (2010) Scottish Survey of Adult Literacies 2009: Report of Findings. Scottish Government Research Report, available online at: http://www.scotland.gov.uk/Resource/Doc/319174/0102005.pdf, accessed on 28/03/12.
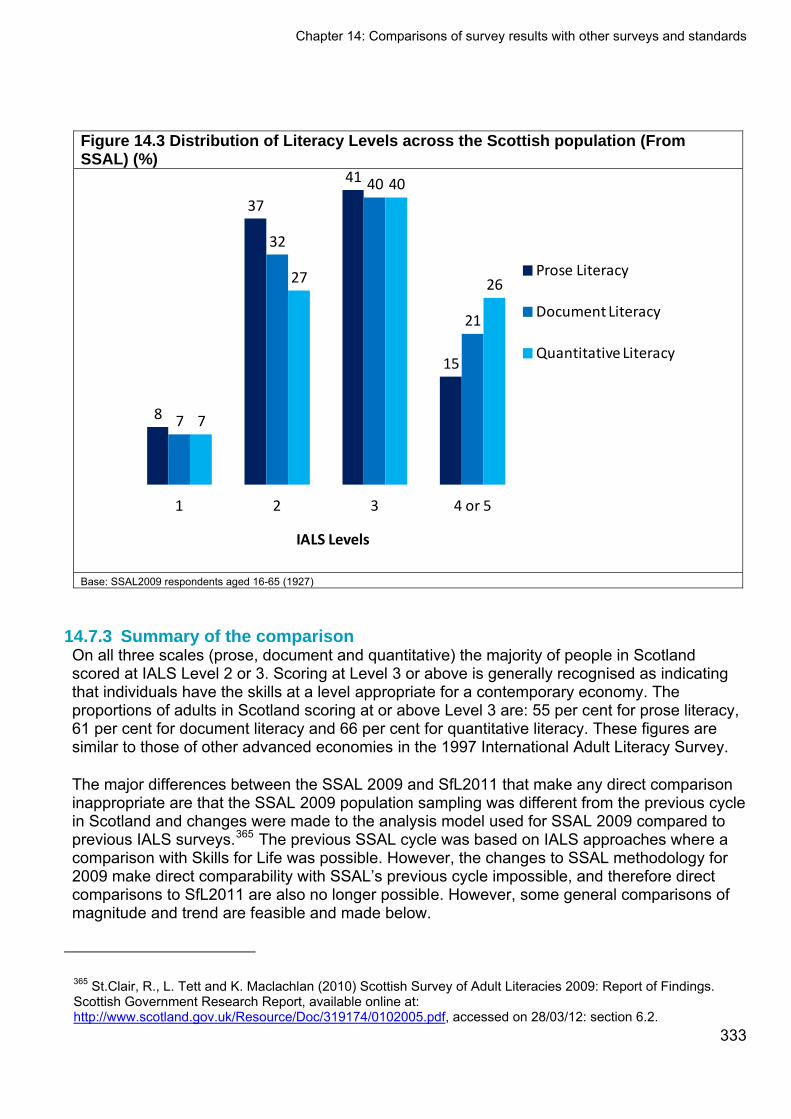
Chapter 14: Comparisons of survey results with other surveys and standards
Figure 14.3 Distribution of Literacy Levels across the Scottish population (From SSAL) (%)
8
37
41
15
7
32
40
21
7
27
40
26
1 2 3 4 or 5
Prose Literacy
Document Literacy
Quantitative Literacy
IALS Levels
Base: SSAL2009 respondents aged 16-65 (1927)
14.7.3 Summary of the comparison On all three scales (prose, document and quantitative) the majority of people in Scotland scored at IALS Level 2 or 3. Scoring at Level 3 or above is generally recognised as indicating that individuals have the skills at a level appropriate for a contemporary economy. The proportions of adults in Scotland scoring at or above Level 3 are: 55 per cent for prose literacy, 61 per cent for document literacy and 66 per cent for quantitative literacy. These figures are similar to those of other advanced economies in the 1997 International Adult Literacy Survey.
The major differences between the SSAL 2009 and SfL2011 that make any direct comparison inappropriate are that the SSAL 2009 population sampling was different from the previous cycle in Scotland and changes were made to the analysis model used for SSAL 2009 compared to previous IALS surveys.365 The previous SSAL cycle was based on IALS approaches where a comparison with Skills for Life was possible. However, the changes to SSAL methodology for 2009 make direct comparability with SSAL’s previous cycle impossible, and therefore direct comparisons to SfL2011 are also no longer possible. However, some general comparisons of magnitude and trend are feasible and made below.
333
365 St.Clair, R., L. Tett and K. Maclachlan (2010) Scottish Survey of Adult Literacies 2009: Report of Findings. Scottish Government Research Report, available online at: http://www.scotland.gov.uk/Resource/Doc/319174/0102005.pdf, accessed on 28/03/12: section 6.2.
Chapter 14: Comparisons of survey results with other surveys and standards
334
In IALS 1997 the UK population at IALS Level 1 was around 22 per cent for literacy (prose and document), and in 2009 the Scottish population at IALS Level 1 was around seven per cent suggests the possibilities that:
Scotland may have had a different profile of skills to the rest of the UK in 1997 at the time of the IALS survey, and/or
there has been a large change in the skills of that part of the population that had weaker skills in 1997, and/or
the skill level boundaries have moved significantly from the 1997 survey to the 2009 survey (no further information about this is available).
Noting the caveat that direct comparison is not possible, this difference is also observed between the results for Scotland in 2009 and the SfL2011 survey (for example, only around 8 per cent of adults at Entry Level or below compared to 15 per cent in England in 2011).
14.8 Comparisons between the Skills for Life 2011 literacy survey and the Progress in International Reading Literacy Study (PIRLS)366 for literacy
The objective of the Progress in International Reading Literacy Study (PIRLS) is to examine trends in reading achievement of children, aged 10, from different countries. The study is conducted by the International Association for the Evaluation of Educational Achievement (IEA) and is designed to measure children’s reading literacy achievement, to provide a baseline for future studies of trends in achievement, and to gather information about children’s home and school experiences in learning to read.
The first PIRLS was carried out in 2001 (in 35 countries including England) and repeated in 2006 (in 41 countries also including England), with the intention to carry out studies every five years thereafter. A further study was conducted in more than 60 countries, including England, in 2011, with the results due for publication in December 2012.
14.8.1 Methodology The assessment focuses on three main areas of literacy: Reading behaviours and attitudes;
Process of comprehension;
Purposes for reading.
Four ‘background’ questionnaires are used to determine reading behaviours and attitudes with regards to reading:
366 Further information is available at: http://www.iea.nl/pirls_2011.html accessed on 28/03/12.
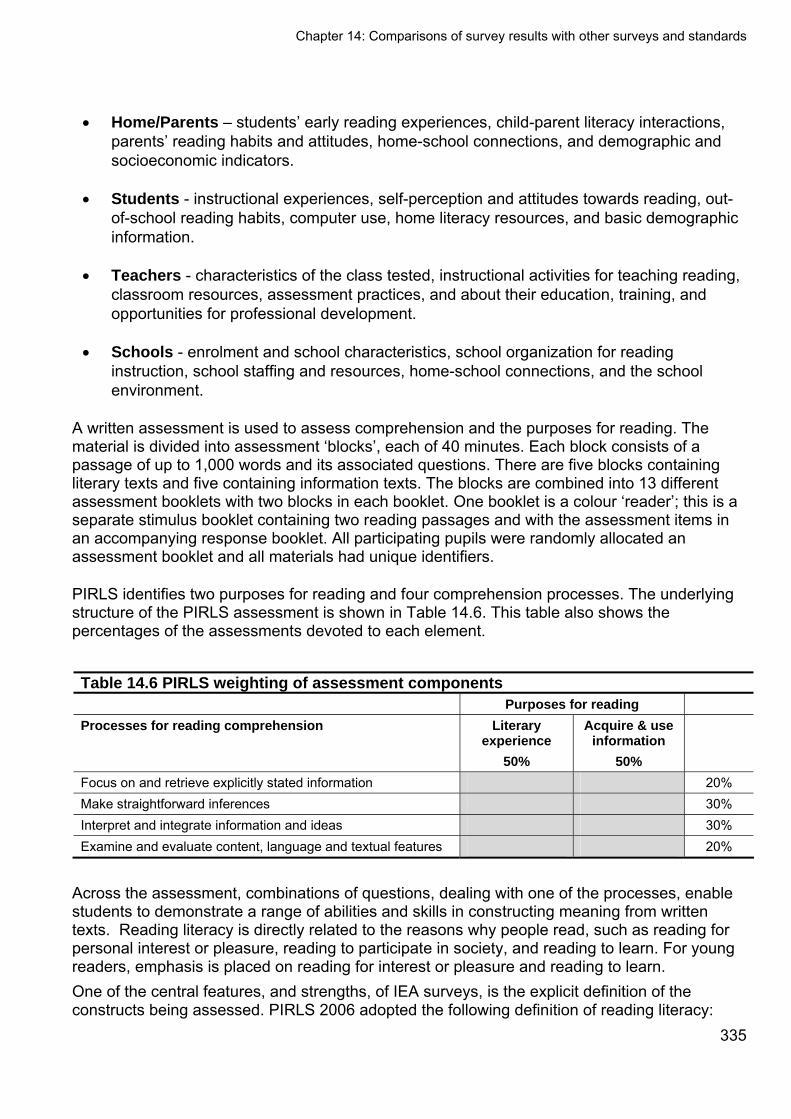
Chapter 14: Comparisons of survey results with other surveys and standards
335
Home/Parents – students’ early reading experiences, child-parent literacy interactions, parents’ reading habits and attitudes, home-school connections, and demographic and socioeconomic indicators.
Students - instructional experiences, self-perception and attitudes towards reading, out-of-school reading habits, computer use, home literacy resources, and basic demographic information.
Teachers - characteristics of the class tested, instructional activities for teaching reading, classroom resources, assessment practices, and about their education, training, and opportunities for professional development.
Schools - enrolment and school characteristics, school organization for reading instruction, school staffing and resources, home-school connections, and the school environment.
A written assessment is used to assess comprehension and the purposes for reading. The material is divided into assessment ‘blocks’, each of 40 minutes. Each block consists of a passage of up to 1,000 words and its associated questions. There are five blocks containing literary texts and five containing information texts. The blocks are combined into 13 different assessment booklets with two blocks in each booklet. One booklet is a colour ‘reader’; this is a separate stimulus booklet containing two reading passages and with the assessment items in an accompanying response booklet. All participating pupils were randomly allocated an assessment booklet and all materials had unique identifiers.
PIRLS identifies two purposes for reading and four comprehension processes. The underlying structure of the PIRLS assessment is shown in Table 14.6. This table also shows the percentages of the assessments devoted to each element.
Table 14.6 PIRLS weighting of assessment components Purposes for reading
Processes for reading comprehension Literary experience
50%
Acquire & use information
50%
Focus on and retrieve explicitly stated information 20% Make straightforward inferences 30% Interpret and integrate information and ideas 30% Examine and evaluate content, language and textual features 20%
Across the assessment, combinations of questions, dealing with one of the processes, enable students to demonstrate a range of abilities and skills in constructing meaning from written texts. Reading literacy is directly related to the reasons why people read, such as reading for personal interest or pleasure, reading to participate in society, and reading to learn. For young readers, emphasis is placed on reading for interest or pleasure and reading to learn. One of the central features, and strengths, of IEA surveys, is the explicit definition of the constructs being assessed. PIRLS 2006 adopted the following definition of reading literacy:
Chapter 14: Comparisons of survey results with other surveys and standards
336
‘For PIRLS, reading literacy is defined as the ability to understand and use those written language forms required by society and/or valued by the individual. Young readers can construct meaning from a variety of texts. They read to learn, to participate in communities of readers in school and everyday life, and for enjoyment.’367
This definition, in which reading is seen as a constructive and interactive process, is intended to embrace multi-modal forms of reading, as well as traditional print forms. At this stage in PIRLS all assessments are undertaken using paper-based texts. The written component of PIRLS consists of a mix of multiple choice questions, short answer questions and questions requiring longer written answers. Overall, approximately 50 per cent of the questions are multiple choice. The exact breakdown of question type is shown Table 14.A3, Table 14.A4 in the Appendix of Tables. Significantly fewer multiple choice questions are used (approximately 18 per cent) to assess the reading process skills of interpretation and integration. All questions are based on the student's reading and comprehension of the passages provided. Clearly, there are similarities between PIRLS and the assessment of reading used in the other assessment tools considered above such as the length of reading passage (Key Skills and Functional Skills); style of questions (Skills for Life, Key Skills). The amount of time required to undertake the survey, however, is significantly greater than with the other assessment approaches.
14.8.2 Broad findings PIRLS is designed as a trend study which permits the examination of changes in performance over time. The results include average scale scores for those countries that participated in both PIRLS assessments (2001, 2006) together with the magnitude of change that occurred during that period for each and whether such a change was statistically significant. The report also describes what students know and can do in the area of reading and the relationship between hours of reading instruction and achievement in reading over time.
Between 2001 and 2006 the reading scale score for ten year-olds in England fell significantly (by 13 per cent), placing England 26th out of 28 (just ahead of Romania and Morocco) in terms of changes (no significant change was observed for Scotland, placing it mid-table), bringing England close to being downgraded on the benchmark reading scale from High to Intermediate.
The results from PIRLS in 2006 also show that 67 per cent of pupils in England received 3 hours or less formal or integrated teaching of reading per week. Not only did this place England 41st out of 46 countries, it also revealed a 14 per cent decline since 2001 in the hours dedicated to the teaching of reading. This may go some way to explaining the statistically significant fall in reading achievement in England found in the 2006 survey compared to 2001.
14.8.3 Summary of the comparison Tentative comparisons can be drawn between the findings of the trends in literacy in the PIRLS surveys of 2001 and 2006 and the findings of SfL2011. Although the PIRLS surveys ten to eleven year-olds, those respondents (or their contemporaries) aged ten in 2001 may well have
367 Mullis, I. V. S., A. M. Kennedy, M. O. Martin and M. Sainsbury (2006). PIRLS 2006 Assessment Framework and Specifications. Progress in International Reading Literacy Study. Chestnut Hill, MA: Boston College. Available online at: http://timss.bc.edu/PDF/P06Framework.pdf, accessed on 28/03/12: p. 3.
Chapter 14: Comparisons of survey results with other surveys and standards
337
taken part in SfL2011 as 16 to 20 year-olds. (The ten year-olds in 2001 would still have been too young to be included in SfL2003.) Students surveyed in PIRLS in 2006 would have been too young to participate in SfL2011. PIRLS shows a decline in ten year-olds’ skills in reading over the 2001 to 2006 period for England. If this were indicative of a longer period (i.e. from before 2001 and going on beyond 2006) of declining reading skills of ten year-olds, then it might be expected that the literacy levels of the younger groups in SfL2011 might have poorer skills than their equivalents in 2003. Table 5.29 shows that this is not found to be the case – literacy levels for young groups are higher in 2011 than they were in 2003.
Given that more information would be needed to identify with confidence the trend in reading level for ten year-olds (e.g. from the results of the 2011 PIRLS survey) and that further information would be needed about the progress in reading made by England’s children between the ages of ten and 16, no further comparisons between PIRLS and the Skills for Life surveys are possible.
14.9 Comparisons between the Skills for Life 2011 literacy survey and the Programme for International Student Assessment (PISA) (2000, 2003, 2006, 2009) 368 reading outcomes
The Programme for International Student Assessment (PISA) is an internationally standardised assessment that was jointly developed by participating economies and administered to 15 year-olds in schools (in 65 countries in 2009, risen from 43 in 2000, in both cases including the United Kingdom, with breakdowns available for the four nations). PISA assesses how far students that are near the end of compulsory education have acquired some of the knowledge and skills that are essential for full participation in society.
14.9.1 Methodology In all cycles, the domains of reading, mathematical and scientific literacy are covered not merely in terms of mastery of the school curriculum, but in terms of important knowledge and skills needed in adult life. PISA’s relevance to lifelong learning is that it is not limited to assessing students’ competencies in school subjects. Students are also asked to report on their motivation to learn, their beliefs about themselves and their learning strategies. Tests are typically administered to between 4,500 and 10,000 students in each participating country. So far four assessments have been carried out (in 2000, 2003, 2006 and 2009).
14.9.2 Broad findings PISA results for the UK fell below the sampling standards required in 2000 and 2003 and so are not reported in PISA’s longitudinal study. Results for the assessment which took place in 2009 were released in December 2010, including both outcomes for England in terms of progress from one PISA cycle to the next, and
368 Further information is available online at: http://www.pisa.oecd.org/pages/0,2987,en_32252351_32235731_1_1_1_1_1,00.html, accessed on 28/03/12.
Chapter 14: Comparisons of survey results with other surveys and standards
338
for England in terms of its rank order compared to other participating countries.369 Results in 2009 for reading placed England 25th out of 65 countries, with a score not significantly different from average (12 countries had reading scores significantly higher than England, 14 with scores about the same allowing for statistical significance, and 38 with lower scores). England had a relatively large difference between the scores of the weakest and strongest pupils compared with many other countries. No significant change in score was observed between PISA in 2009 and 2006 for England, although in PISA 2006 only seven countries had scores significantly higher than England. This is perhaps a little in contrast to results from PIRLS although differences in the student age sampled and differences in methodology may be reflected in this.
14.9.3 Summary of the comparison The PISA results for 2006 and 2009 show similar reading scores suggesting little change in the reading skills of 15 year olds between those dates. Information about reading skills in England 2000 and 2003, i.e. around the time of the SfL2003 survey, is not comparable with later PISA results.370
14.10 The Skills for Life numeracy assessment background
The Skills for Life 2011 survey numeracy assessment has a similar background to the literacy assessment. As for literacy, the 2011 numeracy assessment used the same questions and adaptive routing algorithm as the Skills for Life 2003 survey numeracy assessment. This section compares the content and outcomes of the numeracy survey assessment with other national tests of numeracy and international surveys involving numeracy skills.
The Skills for Life numeracy assessment questions are based on the standards and assessments used in 2003 paper-based QCA Key Skills/adult numeracy assessments in order to ensure that the items used in the survey tool were 'tried and tested', although, as for the literacy items, it was acknowledged that the conversion of items from paper to computer screen could, in some cases, change items as well as impose limitations on the items that could be used. New items were developed to assess adults operating below Level 1 as national testing at these Levels did not exist at the time. Wherever possible, however, items were devised using ideas and contexts taken from Levels 1 and 2, with reduced task demand (and simplified language).
14.10.1 Skills for Life Numeracy Levels The authors of the assessment questions used the examples and illustrations given in the adult numeracy curriculum guidance materials and the adult numeracy standards in order to devise suitable contexts and ensure that questions were pitched at an appropriate Level. The adult numeracy curriculum covers three topics:
369 Organisation for Economic Co-operation and Development (2010) PISA 2009 Results: Learning Trends: Changes in Student Performance Since 2000 (Volume V), PISA, OECD Publishing. Available online at: http://www.pisa.oecd.org/dataoecd/11/15/48852742.pdf, accessed on 28/03/12. 370 The PISA 2003 survey in England failed to meet international response rate benchmarks and so England’s data was excluded from the published tables. Sturgis, P., Smith, P., Hughes, G., (2006) A study of Suitable Methods for Raising Response Rates in School Surveys, Department for Education and Skills, available online at: https://www.education.gov.uk/publications/eOrderingDownload/RR721.pdf, accessed on 06/08/12.
Chapter 14: Comparisons of survey results with other surveys and standards
339
Number, including numbers and the number system, and calculations
Measures, shape and space, including common measures of money, time, temperature, distance, length, weight, capacity, perimeter, area and volume, and shape and position
Handling data, including data and statistical measures, and probability
In summary of the Levels, the adult numeracy standards371 state that:
At Entry Level 1, an adult can read and understand information in simple graphical, numerical and written material; calculate and manipulate mathematical information to generate results which make sense and use given methods and given checking procedures appropriate to the specified purpose; present and explain results which show an understanding of the intended purpose using appropriate numbers, measures, objects or pictures.
At Entry Level 2, an adult can read and understand information given by numbers, symbols, simple diagrams and charts in graphical, numerical and written material; calculate and manipulate mathematical information to generate results to a given level of accuracy using given methods and given checking procedures appropriate to the specified purpose; present and explain results which meet the intended purpose using appropriate numbers, simple diagrams and symbols.
At Entry Level 3, an adult can read and understand information given by numbers, symbols, diagrams and charts used for different purposes and in different ways in graphical, numerical and written material; calculate and manipulate mathematical information to generate results to a given level of accuracy using given methods, measures and checking procedures appropriate to the specified purpose; present and explain results which meet the intended purpose using appropriate numbers, diagrams, charts and symbols.
At Level 1, an adult can read and understand straightforward mathematical information used for different purposes and independently select relevant information from given graphical, numerical and written material; calculate and manipulate mathematical information to generate results to a given level of accuracy using methods, measures and checking procedures appropriate to the specified purpose; present and explain results which meet the intended purpose using an appropriate format to a given level of accuracy.
At Level 2, an adult can read and understand mathematical information used for different purposes and independently select and compare relevant information from a variety of graphical, numerical and written material; calculate and manipulate mathematical information to generate results to an appropriate level of accuracy using methods,
371 Department for Education and Skills (2001) Adult Numeracy Core Curriculum, available online at: http://rwp.excellencegateway.org.uk/resource/Adult+numeracy+core+curriculum/pdf/, accessed on 28/03/12.
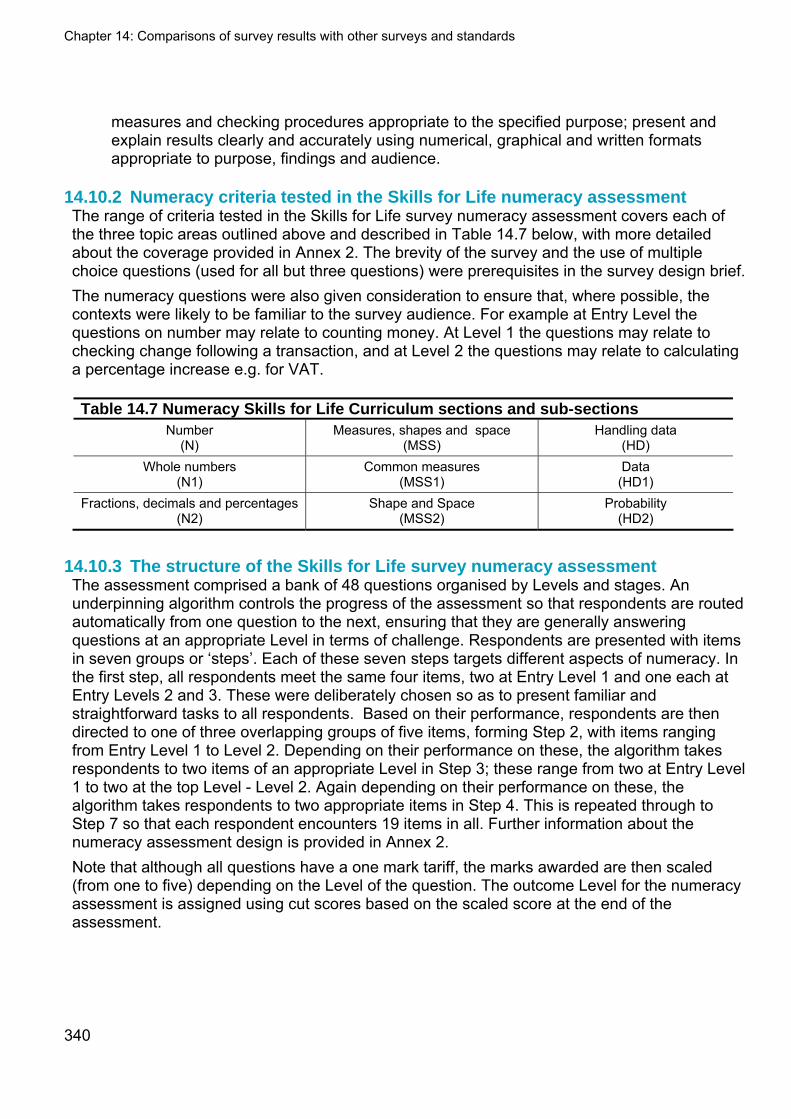
Chapter 14: Comparisons of survey results with other surveys and standards
340
measures and checking procedures appropriate to the specified purpose; present and explain results clearly and accurately using numerical, graphical and written formats appropriate to purpose, findings and audience.
14.10.2 Numeracy criteria tested in the Skills for Life numeracy assessment The range of criteria tested in the Skills for Life survey numeracy assessment covers each of the three topic areas outlined above and described in Table 14.7 below, with more detailed about the coverage provided in Annex 2. The brevity of the survey and the use of multiple choice questions (used for all but three questions) were prerequisites in the survey design brief. The numeracy questions were also given consideration to ensure that, where possible, the contexts were likely to be familiar to the survey audience. For example at Entry Level the questions on number may relate to counting money. At Level 1 the questions may relate to checking change following a transaction, and at Level 2 the questions may relate to calculating a percentage increase e.g. for VAT.
Table 14.7 Numeracy Skills for Life Curriculum sections and sub-sections Number
(N) Measures, shapes and space
(MSS) Handling data
(HD) Whole numbers
(N1) Common measures
(MSS1) Data (HD1)
Fractions, decimals and percentages (N2)
Shape and Space (MSS2)
Probability (HD2)
14.10.3 The structure of the Skills for Life survey numeracy assessment The assessment comprised a bank of 48 questions organised by Levels and stages. An underpinning algorithm controls the progress of the assessment so that respondents are routed automatically from one question to the next, ensuring that they are generally answering questions at an appropriate Level in terms of challenge. Respondents are presented with items in seven groups or ‘steps’. Each of these seven steps targets different aspects of numeracy. In the first step, all respondents meet the same four items, two at Entry Level 1 and one each at Entry Levels 2 and 3. These were deliberately chosen so as to present familiar and straightforward tasks to all respondents. Based on their performance, respondents are then directed to one of three overlapping groups of five items, forming Step 2, with items ranging from Entry Level 1 to Level 2. Depending on their performance on these, the algorithm takes respondents to two items of an appropriate Level in Step 3; these range from two at Entry Level 1 to two at the top Level - Level 2. Again depending on their performance on these, the algorithm takes respondents to two appropriate items in Step 4. This is repeated through to Step 7 so that each respondent encounters 19 items in all. Further information about the numeracy assessment design is provided in Annex 2. Note that although all questions have a one mark tariff, the marks awarded are then scaled (from one to five) depending on the Level of the question. The outcome Level for the numeracy assessment is assigned using cut scores based on the scaled score at the end of the assessment.
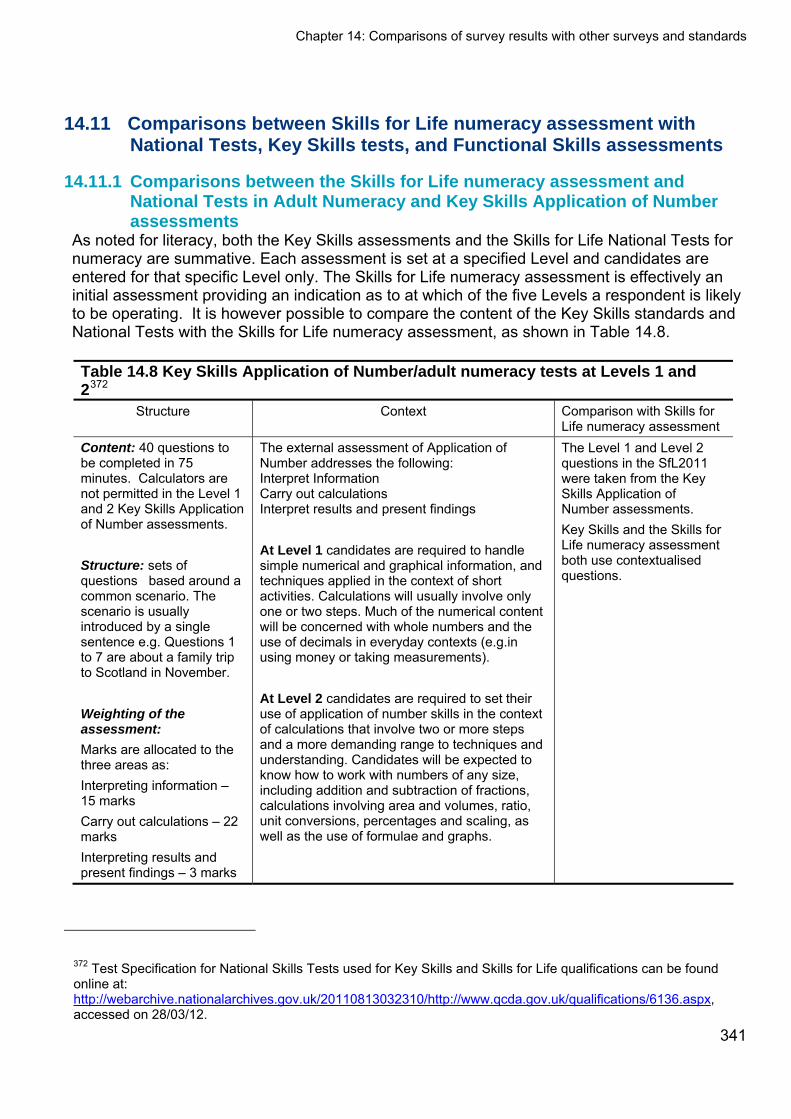
Chapter 14: Comparisons of survey results with other surveys and standards
341
14.11 Comparisons between Skills for Life numeracy assessment with National Tests, Key Skills tests, and Functional Skills assessments
14.11.1 Comparisons between the Skills for Life numeracy assessment and National Tests in Adult Numeracy and Key Skills Application of Number assessments
As noted for literacy, both the Key Skills assessments and the Skills for Life National Tests for numeracy are summative. Each assessment is set at a specified Level and candidates are entered for that specific Level only. The Skills for Life numeracy assessment is effectively an initial assessment providing an indication as to at which of the five Levels a respondent is likely to be operating. It is however possible to compare the content of the Key Skills standards and National Tests with the Skills for Life numeracy assessment, as shown in Table 14.8.
Table 14.8 Key Skills Application of Number/adult numeracy tests at Levels 1 and 2372
Structure Context Comparison with Skills for Life numeracy assessment
Content: 40 questions to be completed in 75 minutes. Calculators are not permitted in the Level 1 and 2 Key Skills Application of Number assessments. Structure: sets of questions based around a common scenario. The scenario is usually introduced by a single sentence e.g. Questions 1 to 7 are about a family trip to Scotland in November. Weighting of the assessment:
Marks are allocated to the three areas as: Interpreting information – 15 marks Carry out calculations – 22 marks Interpreting results and present findings – 3 marks
The external assessment of Application of Number addresses the following: Interpret Information Carry out calculations Interpret results and present findings
At Level 1 candidates are required to handle simple numerical and graphical information, and techniques applied in the context of short activities. Calculations will usually involve only one or two steps. Much of the numerical content will be concerned with whole numbers and the use of decimals in everyday contexts (e.g.in using money or taking measurements).
At Level 2 candidates are required to set their use of application of number skills in the context of calculations that involve two or more steps and a more demanding range to techniques and understanding. Candidates will be expected to know how to work with numbers of any size, including addition and subtraction of fractions, calculations involving area and volumes, ratio, unit conversions, percentages and scaling, as well as the use of formulae and graphs.
The Level 1 and Level 2 questions in the SfL2011 were taken from the Key Skills Application of Number assessments. Key Skills and the Skills for Life numeracy assessment both use contextualised questions.
372 Test Specification for National Skills Tests used for Key Skills and Skills for Life qualifications can be found online at: http://webarchive.nationalarchives.gov.uk/20110813032310/http://www.qcda.gov.uk/qualifications/6136.aspx, accessed on 28/03/12.
Chapter 14: Comparisons of survey results with other surveys and standards
342
14.11.2 Comparisons between the Skills for Life survey numeracy assessment and Functional Skills Mathematics assessments
As for Functional English, Functional Mathematics373 has external assessment at Levels 1 and 2, with internal assessment required for Entry Levels. Awarding organisations develop their own assessment materials for all Levels – there are no National Tests, and so comparison of the numeracy survey assessment against Functional Skills assessments is impractical. However a comparison of the Functional Mathematics criteria374 is possible, and is shown in Table 14.8. The evaluation of the Functional Skills pilot375 identifies that Functional Skills adds demand for further skill layers of analysis, application and purpose and consequently Functional Skills is regarded as more challenging to deliver and achieve than Skills for Life (the standards against which the numeracy survey assessment is based), and this is illustrated in Table 14.9.
373 Qualifications and Curriculum Authority (2007) Functional Skills Standards, available online at: http://www.excellencegateway.org.uk/pdf/Functional%20skills%20standards.pdf, accessed on 28/03/12. 374 Office of Qualifications and Examinations Regulation (2011) Functional Skills Criteria for Mathematics. Entry 1, Entry 2, Entry 3, Level 1 and Level 2, available online at: http://www.ofqual.gov.uk/downloads/category/68-functional-skills-subject-criteria?download=1173%3Afunctional-skills-criteria-for-mathematics, accessed 28/03/12. 375 Qualifications and Curriculum Development Authority (2011) Evaluation of the Functional Skills Pilot, available online at: http://webarchive.nationalarchives.gov.uk/20110813032310/http://www.qcda.gov.uk/resources/7585.aspx, accessed on 28/03/12.
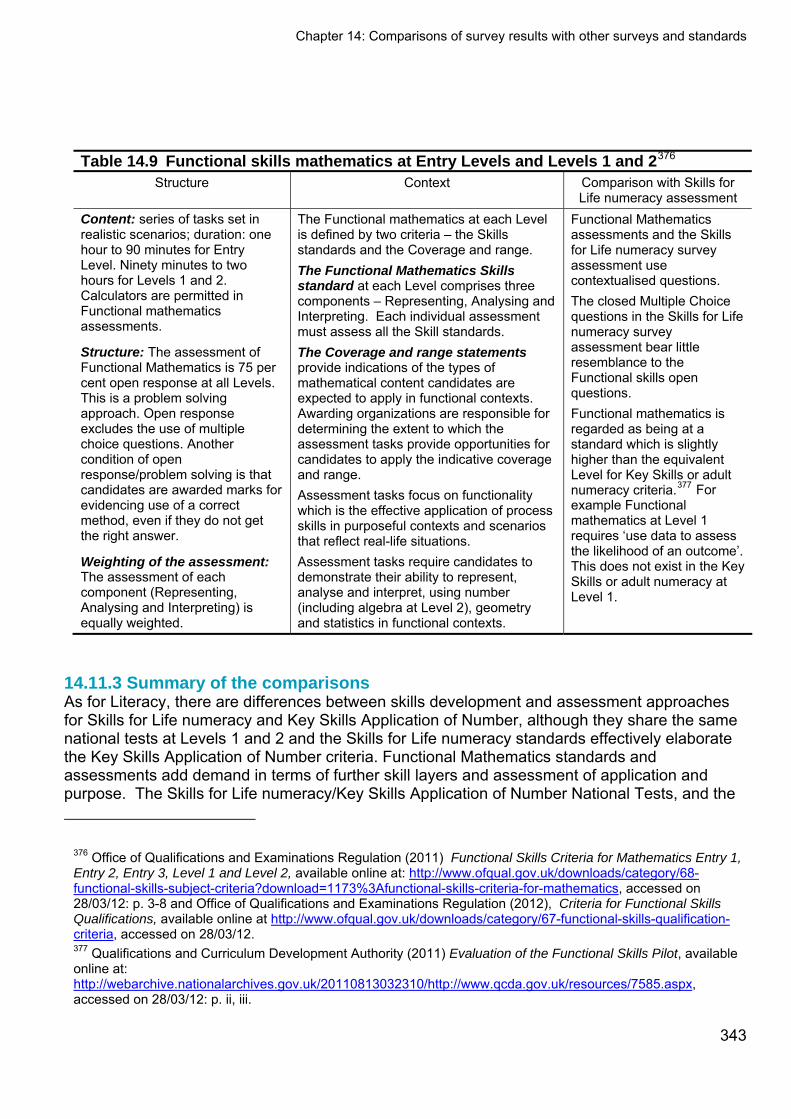
Chapter 14: Comparisons of survey results with other surveys and standards
343
Table 14.9 Functional skills mathematics at Entry Levels and Levels 1 and 2376 Structure Context Comparison with Skills for
Life numeracy assessment Content: series of tasks set in realistic scenarios; duration: one hour to 90 minutes for Entry Level. Ninety minutes to two hours for Levels 1 and 2. Calculators are permitted in Functional mathematics assessments.
Structure: The assessment of Functional Mathematics is 75 per cent open response at all Levels. This is a problem solving approach. Open response excludes the use of multiple choice questions. Another condition of open response/problem solving is that candidates are awarded marks for evidencing use of a correct method, even if they do not get the right answer.
Weighting of the assessment: The assessment of each component (Representing, Analysing and Interpreting) is equally weighted.
The Functional mathematics at each Level is defined by two criteria – the Skills standards and the Coverage and range. The Functional Mathematics Skills standard at each Level comprises three components – Representing, Analysing and Interpreting. Each individual assessment must assess all the Skill standards. The Coverage and range statements provide indications of the types of mathematical content candidates are expected to apply in functional contexts. Awarding organizations are responsible for determining the extent to which the assessment tasks provide opportunities for candidates to apply the indicative coverage and range. Assessment tasks focus on functionality which is the effective application of process skills in purposeful contexts and scenarios that reflect real-life situations. Assessment tasks require candidates to demonstrate their ability to represent, analyse and interpret, using number (including algebra at Level 2), geometry and statistics in functional contexts.
Functional Mathematics assessments and the Skills for Life numeracy survey assessment use contextualised questions. The closed Multiple Choice questions in the Skills for Life numeracy survey assessment bear little resemblance to the Functional skills open questions. Functional mathematics is regarded as being at a standard which is slightly higher than the equivalent Level for Key Skills or adult numeracy criteria.377 For example Functional mathematics at Level 1 requires ‘use data to assess the likelihood of an outcome’. This does not exist in the Key Skills or adult numeracy at Level 1.
14.11.3 Summary of the comparisons As for Literacy, there are differences between skills development and assessment approaches for Skills for Life numeracy and Key Skills Application of Number, although they share the same national tests at Levels 1 and 2 and the Skills for Life numeracy standards effectively elaborate the Key Skills Application of Number criteria. Functional Mathematics standards and assessments add demand in terms of further skill layers and assessment of application and purpose. The Skills for Life numeracy/Key Skills Application of Number National Tests, and the
376 Office of Qualifications and Examinations Regulation (2011) Functional Skills Criteria for Mathematics Entry 1, Entry 2, Entry 3, Level 1 and Level 2, available online at: http://www.ofqual.gov.uk/downloads/category/68-functional-skills-subject-criteria?download=1173%3Afunctional-skills-criteria-for-mathematics, accessed on 28/03/12: p. 3-8 and Office of Qualifications and Examinations Regulation (2012), Criteria for Functional Skills Qualifications, available online at http://www.ofqual.gov.uk/downloads/category/67-functional-skills-qualification-criteria, accessed on 28/03/12. 377 Qualifications and Curriculum Development Authority (2011) Evaluation of the Functional Skills Pilot, available online at: http://webarchive.nationalarchives.gov.uk/20110813032310/http://www.qcda.gov.uk/resources/7585.aspx, accessed on 28/03/12: p. ii, iii.
Chapter 14: Comparisons of survey results with other surveys and standards
344
Functional Skills Assessments assess at a single level and cover the entire range of criteria at that level in order to reach a judgement about competence. In both cases the assessments last an hour or more. The Skills for Life survey numeracy assessments takes around half that time, and measures skills at a wide range of levels from Entry Level 1 to Level 2, and so must necessarily sample the specification and make judgements based on responses to a smaller number of items. It should however be noted though that whereas in the case of literacy, all the assessments, including the Skills for Life survey assessments, assess only a relatively small part of the criteria (reading and very limited elements of writing, not assessing most of writing or any of speaking and listening), all the numeracy assessments cover the breadth of the criteria relatively well.
For direct comparison purposes, Table 14.A2 in the Appendix of Tables illustrates differences between Key Skills, adult literacy and Functional Skills standards as assessed at Level 1 and Level 2.
14.12 Comparisons between the Skills for Life 2011 numeracy survey, the International Adult Literacy Survey (IALS 1997)378 and the Centre for Longitudinal Studies/ National Foundation for Educational Research 1997 survey379 for numeracy
As mentioned in Section 14.5, the 1997 IALS survey included as one of its three measures a score for ‘quantitative literacy - the knowledge and skills required to apply arithmetic operations, either alone or sequentially, to numbers embedded in printed materials, such as balancing a chequebook, figuring out a tip, completing an order form or determining the amount of interest on a loan from an advertisement.380 The CLS/NFER study also included an assessment of numeracy. More information regarding the methodology for these two surveys is provided in sections 14.5.1 and 14.5.2.
14.12.1 Broad findings from IALS and CLS/NFER NCDS IALS
Based on the twelve fairly simple numeracy questions, 22 per cent of adults in Britain got fewer than six correct answers, as compared with Australia (14 per cent), France (ten per cent), Sweden and Denmark (both seven per cent), Japan (five per cent) and the Netherlands (four per cent).
378 Kirsch, I. S. (2001) The International Adult Literacy Survey (IALS): Understanding What Was Measured. Educational Testing Service Research Report, available online at: http://www.ets.org/Media/Research/pdf/RR-01-25-Kirsch.pdf, accessed on 28/03/12. 379 Bynner, J. and S. Parsons (1997) It Doesn’t Get any Better. The Basic Skills Agency. 380 Organisation for Economic Co-operation and Development Statistics and Statistics Canada (2000) Literacy in the Information Age, available online at: http://www.oecd.org/dataoecd/24/21/39437980.pdf, accessed on 28/03/12.
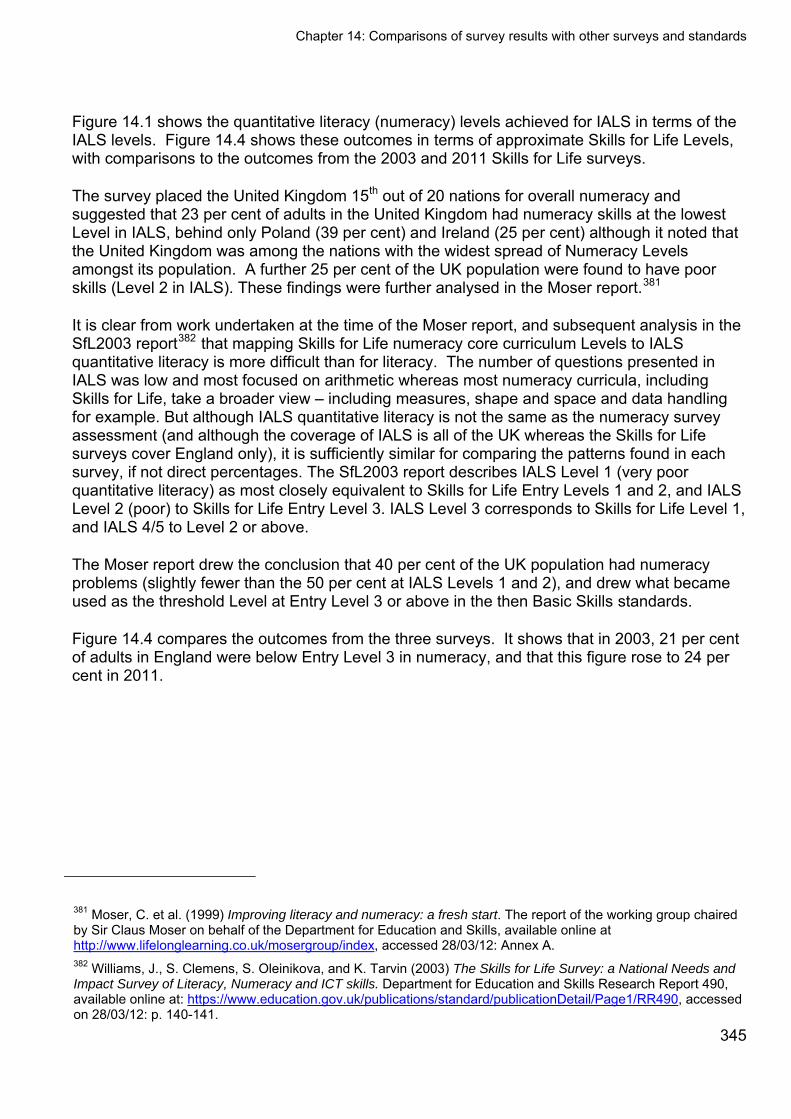
Chapter 14: Comparisons of survey results with other surveys and standards
345
Figure 14.1 shows the quantitative literacy (numeracy) levels achieved for IALS in terms of the IALS levels. Figure 14.4 shows these outcomes in terms of approximate Skills for Life Levels, with comparisons to the outcomes from the 2003 and 2011 Skills for Life surveys.
The survey placed the United Kingdom 15th out of 20 nations for overall numeracy and suggested that 23 per cent of adults in the United Kingdom had numeracy skills at the lowest Level in IALS, behind only Poland (39 per cent) and Ireland (25 per cent) although it noted that the United Kingdom was among the nations with the widest spread of Numeracy Levels amongst its population. A further 25 per cent of the UK population were found to have poor skills (Level 2 in IALS). These findings were further analysed in the Moser report.381
It is clear from work undertaken at the time of the Moser report, and subsequent analysis in the SfL2003 report382 that mapping Skills for Life numeracy core curriculum Levels to IALS quantitative literacy is more difficult than for literacy. The number of questions presented in IALS was low and most focused on arithmetic whereas most numeracy curricula, including Skills for Life, take a broader view – including measures, shape and space and data handling for example. But although IALS quantitative literacy is not the same as the numeracy survey assessment (and although the coverage of IALS is all of the UK whereas the Skills for Life surveys cover England only), it is sufficiently similar for comparing the patterns found in each survey, if not direct percentages. The SfL2003 report describes IALS Level 1 (very poor quantitative literacy) as most closely equivalent to Skills for Life Entry Levels 1 and 2, and IALS Level 2 (poor) to Skills for Life Entry Level 3. IALS Level 3 corresponds to Skills for Life Level 1, and IALS 4/5 to Level 2 or above.
The Moser report drew the conclusion that 40 per cent of the UK population had numeracy problems (slightly fewer than the 50 per cent at IALS Levels 1 and 2), and drew what became used as the threshold Level at Entry Level 3 or above in the then Basic Skills standards.
Figure 14.4 compares the outcomes from the three surveys. It shows that in 2003, 21 per cent of adults in England were below Entry Level 3 in numeracy, and that this figure rose to 24 per cent in 2011.
381 Moser, C. et al. (1999) Improving literacy and numeracy: a fresh start. The report of the working group chaired by Sir Claus Moser on behalf of the Department for Education and Skills, available online at http://www.lifelonglearning.co.uk/mosergroup/index, accessed 28/03/12: Annex A. 382 Williams, J., S. Clemens, S. Oleinikova, and K. Tarvin (2003) The Skills for Life Survey: a National Needs and Impact Survey of Literacy, Numeracy and ICT skills. Department for Education and Skills Research Report 490, available online at: https://www.education.gov.uk/publications/standard/publicationDetail/Page1/RR490, accessed on 28/03/12: p. 140-141.
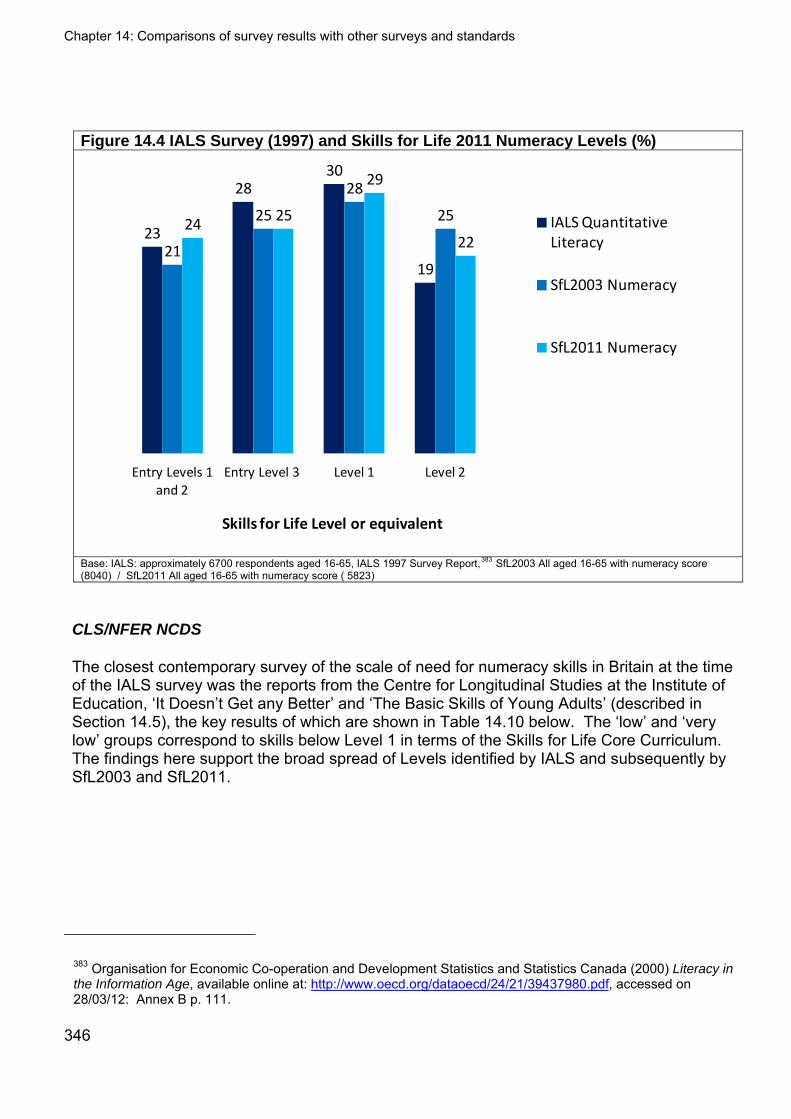
Chapter 14: Comparisons of survey results with other surveys and standards
Figure 14.4 IALS Survey (1997) and Skills for Life 2011 Numeracy Levels (%)
23
2830
1921
25
28
2524
25
29
22
Entry Levels 1 and 2
Entry Level 3 Level 1 Level 2
IALS Quantitative Literacy
SfL2003 Numeracy
SfL2011 Numeracy
Skills for Life Level or equivalent
Base: IALS: approximately 6700 respondents aged 16-65, IALS 1997 Survey Report,383 SfL2003 All aged 16-65 with numeracy score (8040) / SfL2011 All aged 16-65 with numeracy score ( 5823)
CLS/NFER NCDS
The closest contemporary survey of the scale of need for numeracy skills in Britain at the time of the IALS survey was the reports from the Centre for Longitudinal Studies at the Institute of Education, ‘It Doesn’t Get any Better’ and ‘The Basic Skills of Young Adults’ (described in Section 14.5), the key results of which are shown in Table 14.10 below. The ‘low’ and ‘very low’ groups correspond to skills below Level 1 in terms of the Skills for Life Core Curriculum. The findings here support the broad spread of Levels identified by IALS and subsequently by SfL2003 and SfL2011.
383 Organisation for Economic Co-operation and Development Statistics and Statistics Canada (2000) Literacy in the Information Age, available online at: http://www.oecd.org/dataoecd/24/21/39437980.pdf, accessed on 28/03/12: Annex B p. 111.
346

Chapter 14: Comparisons of survey results with other surveys and standards
347
Table 14.10 Numeracy Levels among 37 year-olds, CLS/NFER NCDS Cohort Study 1997384 Skills Levels Approximate Skills for Life Numeracy Level %
Very low Below Entry Level 23 Low Entry level 25 Average Level 1 25 Good Level 2 or above 27 Base: approx. 1700 respondents , CLS/NFER NCDS survey, 1997
The 16 to 25 year old cohort in IALS was educated at a different time from the 16 to 24 year-olds in SfL2003. So any gap in performance between this IALS cohort and the next one up may suggest an age effect rather than a cohort effect.
In IALS in 1997, there was the same significant gap in the proportions of 16 to 25 year-olds and 26 to 35 year-olds achieving the top Levels as seen in SfL2003. Only 20 per cent of 16 to 25 year-olds achieved IALS Levels 4/5 in quantitative literacy (the highest Levels, corresponding approximately to National Qualifications Framework385 Level 2 or above as used in SfL2003 and SfL2011), compared to 30 per cent of 26 to 35 year-olds.
The equivalent figures for the SfL2003 survey were 24 per cent for 16 to 24 year-olds achieving Level 2 or above and 29 per cent of 25 to 34 year -olds (this latter corresponding largely to the 16 to 25 year old cohort from IALS). The equivalent figures for SfL2011 were 17 per cent for 16 to 24 year-olds achieving Level 2 or above and 23 per cent for 25 to 34 year-olds.
There was very little difference in the proportions in IALS and SfL2003 survey classified at the lowest Level (IALS Level 1, roughly equivalent to Entry Level 2 or below), but, in SfL2011, 16 to 25 year-olds were more likely than 26 to 35 year-olds to be classified at the medium-low and low Levels in IALS (IALS Levels 1 and 2, roughly equivalent to all of Entry Level 3 or below in this survey). Sixteen to 25 year-olds were more likely than 26 to 35 year-olds to be classified at the medium-low and low Levels (IALS Levels 1 and 2, roughly equivalent to all of Entry Level 3 or below in this survey). This is similar to the results of SfL2003 and SfL2011 (27 per cent of respondents aged 16 to 24 at Entry Level 2 or below in 2011, and 20 per cent in 2003).
14.12.2 Summary of the comparisons The IALS and CLS/NFER surveys provided similar evidence for the Moser Report which concluded in 1999 that 40 per cent of the UK population had numeracy problems, and led to the threshold of functionality being drawn at Entry Level 3 in numeracy (at the time, around 23 per cent of adults were below that level according to the IALS survey although comparisons of levels between IALS and the Skills for Life surveys is more difficult in numeracy than literacy).
384 Bynner, J. and S. Parsons (1997) It Doesn’t Get any Better. The Basic Skills Agency 385 Office of Qualifications and Examinations Regulation (2010) Explaining the National Qualifications Framework, available online at: http://www.ofqual.gov.uk/qualifications-assessments/89-articles/250-explaining-the-national-qualifications-framework, accessed on 28/03/12.
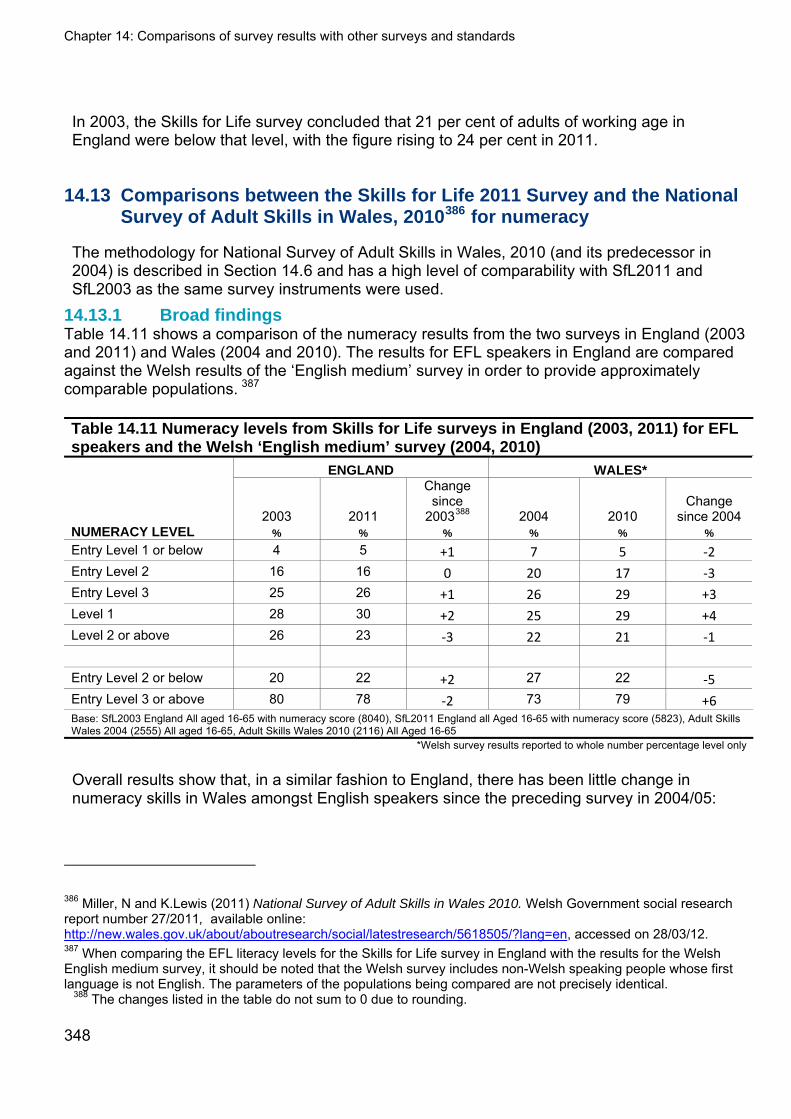
Chapter 14: Comparisons of survey results with other surveys and standards
348
In 2003, the Skills for Life survey concluded that 21 per cent of adults of working age in England were below that level, with the figure rising to 24 per cent in 2011.
14.13 Comparisons between the Skills for Life 2011 Survey and the National Survey of Adult Skills in Wales, 2010386 for numeracy
The methodology for National Survey of Adult Skills in Wales, 2010 (and its predecessor in 2004) is described in Section 14.6 and has a high level of comparability with SfL2011 and SfL2003 as the same survey instruments were used.
14.13.1 Broad findings Table 14.11 shows a comparison of the numeracy results from the two surveys in England (2003 and 2011) and Wales (2004 and 2010). The results for EFL speakers in England are compared against the Welsh results of the ‘English medium’ survey in order to provide approximately comparable populations. 387
Table 14.11 Numeracy levels from Skills for Life surveys in England (2003, 2011) for EFL speakers and the Welsh ‘English medium’ survey (2004, 2010)
ENGLAND WALES*
2003 2011
Change since
2003388 2004 2010 Change
since 2004 NUMERACY LEVEL % % % % % %
Entry Level 1 or below 4 5 +1 7 5 ‐2 Entry Level 2 16 16 0 20 17 ‐3 Entry Level 3 25 26 +1 26 29 +3 Level 1 28 30 +2 25 29 +4 Level 2 or above 26 23 ‐3 22 21 ‐1
Entry Level 2 or below 20 22 +2 27 22 ‐5
Entry Level 3 or above 80 78 ‐2 73 79 +6 Base: SfL2003 England All aged 16-65 with numeracy score (8040), SfL2011 England all Aged 16-65 with numeracy score (5823), Adult Skills Wales 2004 (2555) All aged 16-65, Adult Skills Wales 2010 (2116) All Aged 16-65
*Welsh survey results reported to whole number percentage level only
Overall results show that, in a similar fashion to England, there has been little change in numeracy skills in Wales amongst English speakers since the preceding survey in 2004/05:
386 Miller, N and K.Lewis (2011) National Survey of Adult Skills in Wales 2010. Welsh Government social research report number 27/2011, available online: http://new.wales.gov.uk/about/aboutresearch/social/latestresearch/5618505/?lang=en, accessed on 28/03/12. 387 When comparing the EFL literacy levels for the Skills for Life survey in England with the results for the Welsh English medium survey, it should be noted that the Welsh survey includes non-Welsh speaking people whose first language is not English. The parameters of the populations being compared are not precisely identical.
388 The changes listed in the table do not sum to 0 due to rounding.
Chapter 14: Comparisons of survey results with other surveys and standards
349
51 per cent of adults who in Wales were assessed to have Entry Level numeracy skills compared to 53 per cent in 2004. In comparison in England 47 per cent of respondents achieved an Entry Level score in 2011, as did 45 per cent of respondents in 2003.
29 per cent of adults in Wales were assessed to have Level 1 numeracy skills compared to 25 per cent in 2004. In comparison in England 30 per cent of respondents were at Level 1 in 2011 and 28 per cent in 2003.
21 per cent of adults in Wales were assessed to have Level 2 or above numeracy skills, compared to 22 per cent in 2004. In comparison, in England had 23 per cent at Level 2 in 2011 and 26 per cent in 2003.
14.13.2 Summary of the comparison In contrast to literacy, numeracy skills in both England and Wales have changed little over the periods between the surveys. Numeracy skills in Wales have improved a little overall, which is in contrast to England, where they have declined slightly. In both cases, numeracy skills at Level 2 are a little lower in the later surveys than the earlier ones. It should be noted that the period between the surveys in Wales is approximately two years shorter that in England. In line with the findings for England, numeracy skills in Wales were higher for the employed, those with higher household incomes and those with higher qualifications.
14.14 Comparisons between the Skills for Life 2011 numeracy survey and the Scottish Survey of Adult Literacies (SSAL) (numeracy outcomes), 2009
The background and methodology for the SSAL 2009 survey are described in Section 14.7. 14.14.1 Broad findings The survey results for quantitative literacy (comparable to Skills for Life numeracy, see Section 14.5) are presented in Figure 14.3.
14.14.2 Summary of the comparison With 66 per cent achieving IALS Levels 3, 4 or 5 (broadly equivalent to Level 2 in the Skills for Life surveys and corresponding to the skills appropriate for a contemporary economy) in ‘quantitative literacy’ compared to 22 per cent in England in 2011, this suggests that numeracy skills are substantially stronger among people in Scotland than in England. More detailed comparison is not possible due to the factors described in Section 14.7.3.
14.15 Comparisons between the Skills for Life 2011 Survey and the Trends in International Mathematics and Science Study (TIMSS)389 for numeracy
14.15.1 Methodology The Trends in International Mathematics and Science Study (TIMSS) measures trends in mathematics and science achievement in schools around the world. Conducted on a regular 4-
389 Further information is available online at: http://www.iea.nl/current_studies.html, accessed on 28/03/12.
Chapter 14: Comparisons of survey results with other surveys and standards
350
year cycle, TIMSS has assessed mathematics and science in 1995, 1999, 2003, 2007 and 2011. TIMSS 2007 involved approximately 425,000 students from 52 countries around the world. TIMSS 2011 is presently being processed and the outcomes will be published from December 2012. The aim of TIMSS is to provide comparative information about educational achievements across countries to improve teaching and learning in mathematics and science. The study involves students in their fourth and eighth year of education (fourth grade and eighth grade). Students in England start school a year earlier than most other countries but in order to maintain the study across the same age group, TIMSS testing in England is with Year 5 and Year 9 students. The average age world-wide for the testing is 10.2 years for fourth grade students and 14.2 years for eighth grade students. This matches to the average age for English students at Year 5 and Year 9.
14.15.2 Broad findings The outcomes of TIMSS are published as an average points score per country. TIMSS data from 2007 shows England as rated 7th in rank order for mathematics at both fourth and eighth grade (Year 5 and Year 9 for England) among the 52 countries that participated. England has maintained a consistently high standard of performance throughout the TIMMS cycle, and standards for 14 year-olds have improved with each cycle of the survey (i.e. 14 year-olds in 2007 did better than 14 year-olds in 2003, and so on). The 14 year-olds surveyed by TIMSS in 1995 would have been 22 in 2003, and so may have participated in the SfL2003 as part of the 20-24 age group. Similarly, 14 year-olds surveyed for TIMSS in 2003 would have been 22 in 2011 and so may have participated in the SfL2011 survey. Although TIMSS suggests that numeracy improved for 14 year-olds from 1995 to 2003, the Skills for Life survey, shows (see Table 5.30) that numeracy standards declined for the 20-24 year old age groups in 2011 compared to 2003.
14.15.3 Summary of the comparisons TIMSS analyses result in an overall average points score per country. This does not enable a comparison of trends based on Levels, as produced in SfL2011, so no further comparison can be drawn between its results and the results from the SfL2011 survey.
14.16 Comparisons between the Skills for Life 2011 numeracy survey and the Programme for International Student Assessment (PISA) (2000, 2003, 2006, 2009) 390 mathematics outcomes
The methodology for PISA is described in Section 14.9.1. The results for mathematics in 2009 are less rigorous than for reading as mathematics was not the main focus of assessment in the 2009 PISA survey.
14.16.1 Broad findings Results for the assessment which took place in 2009 were released in December 2010, including both outcomes for England in terms of progress from one PISA cycle to the next, and for England in terms of its rank order compared to other participating countries.391
390 Further information is available online at: http://www.pisa.oecd.org/pages/0,2987,en_32252351_32235731_1_1_1_1_1,00.html, accessed on 28/03/12.
Chapter 14: Comparisons of survey results with other surveys and standards
351
Results in 2009 for mathematics placed England 27th out of 65 countries, with a score not significantly different from the average (20 countries had scores significantly higher than England, 12 with scores about the same allowing for statistical significance, and 32 with lower scores).
England had a relatively small difference between the mathematics scores of the weakest and strongest pupils compared with many other countries. PISA scores in mathematics for all countries increased a little between 2006 and 2009 and England retained its position relative to the average.
14.16.2 Summary of the comparison For reasons described in Section 14.9.3 no direct comparison is drawn with the Skills for Life survey results.
14.17 Future international survey of literacy and numeracy: Programme for the International Assessment of Adult Competences (PIAAC)392
PIAAC is intended to be the most comprehensive international survey of adult skills ever undertaken, measuring literacy, numeracy and problem solving skills. It is being conducted by collaboration between governments, an international consortium of organisations and the OECD, and is taking place across 27 OECD and partner countries (including England). Collection of data began in August 2011 and the first results will be published at the end of 2013. PIAAC comparisons were considered in the development stage of SfL2011 and the conclusion was that although the two sets of assessments have similar objectives they are constructed differently and test different skills - in this regard a simple mapping of results from one to the other would not be accurate. There will however be some scope to contextualise the SfL2011 findings within the thematic findings of the PIAAC field trial. The rationale for BIS commissioning two basic skills survey is that the timescales for reporting are different, different skills are measured and they compare against different benchmarks – national and international. Additionally, PIAAC will provide a time-series comparison against the International Adult Literacy Survey in which the UK participated during 1996. At the outset it should be noted that the purpose of PIAAC to determine the extent to which adults have developed the basic component skills and to help individual countries understand more about those people who are identified as having low Literacy/Numeracy Levels. The purpose of SfL2003 and SfL2011 is not as comprehensive: they were commissioned as an initial assessment to determine (within 25 minutes) the probable Levels of literacy at which respondents were functioning.
391 Organisation for Economic Co-operation and Development (2010) PISA 2009 Results: Learning Trends: Changes in Student Performance Since 2000 (Volume V), PISA, OECD Publishing. Available online at: http://www.pisa.oecd.org/dataoecd/11/15/48852742.pdf, accessed on 28/03/12, and Bradshaw, J et al (2010) PISA 2009: Achievements of 15-year-olds in England, available online at: http://www.nfer.ac.uk/nfer/publications/NPDZ01/NPDZ01.pdf, accessed 18/06/12. 392 Further information available online at: http://www.oecd.org/document/35/0,3746,en_2649_201185_40277475_1_1_1_1,00.html, accessed on 28/03/12.
Chapter 14: Comparisons of survey results with other surveys and standards
352
14.17.1 PIAAC and the Skills for Life 2011 Survey: alignment, coverage and Levels Literacy
PIAAC defines literacy as
‘…the ability to understand and use information from written texts in a variety of contexts to achieve goals and further develop knowledge and potential.’ 393
The PIAAC assessment of literacy draws heavily on previous international studies (IALS in particular, considered earlier in this chapter, in Section 14.5). However, the PIAAC assessments have been refined and extended in new ways. PIAAC is intended to give an overall measure only of ‘reading literacy’; countries can report prose and document reading literacy results separately. The PIAAC Literacy Expert Group found that an expanded and re-ordered version of the IALS/ALLS394 definition would meet both the descriptive, expansive, and linking criteria it wanted for PIAAC. As a result it incorporates the wide range of material introduced by IALS and ALLS, drawing about 60 per cent of the tasks/items from the existing IALS surveys, with the remaining 40 per cent being new items developed for PIAAC. It also extends the framework used in earlier surveys to include electronic texts.
During the production of this report it has not been possible to obtain the full set of IALS items (although a selection are available in the IALS technical reports), although information about the IALS outcome Levels is available and is presented in Section 14.5. The PIAAC items are not yet published.
It has to be stressed that the SfL2011and PIAAC surveys have differing assessment criteria and weighting of assessment elements. For example, the only literacy skill area shared by both assessments is ‘Reading’. Here SfL2011 requires respondents to access and identify information from a given text. The PIAAC assessment goes much further: respondents are required to undertake descriptive, expansive, and linking tasks, i.e. initially they are required to access and identify information in a set text; they are then required to integrate and interpret information, and finally evaluate and further reflect on what they have read. Tasks can involve elements of problem solving and ‘functionality’ that involve drawing on knowledge, ideas or values external to the text.
393 OECD PIAAC information document No 88999 (2010) available online at: http://www.oecd.org/dataoecd/13/45/41690983.pdf , accessed on 28/03/12:p. 7. 394 The All Adult Literacy and Life Skills Survey (ALLS), 2003, measured the literacy and numeracy skills of a nationally representative sample of 16 to 65 year-olds from six participating countries (Bermuda, Canada, Italy, Norway, Switzerland, and the United States) and was undertaken by Statistics Canada and ETS who also undertook the IALS study.
Chapter 14: Comparisons of survey results with other surveys and standards
353
Numeracy
PIAAC defines numeracy as
‘…the ability to access, use, interpret, and communicate mathematical information and ideas, in order to engage in and manage the mathematical demands of a range of situations in adult life.’ 395
The PIAAC numeracy and the SfL2011 numeracy assessments have a number of common features as follows:
1. The SfL2011 numeracy assessment was built using the Adult Numeracy curriculum as a source. The domains covered in the Adult Numeracy curriculum are number, measures, shape and space and handling data whereas the PIAAC assessments are based on quantity and number, dimension and shape, pattern, relationships, and change, and data and chance.
2. The SfL2011 numeracy assessment establishes the respondent’s Numeracy Level based on an initial assessment model and done by using a computer based adaptive testing process in which participants are moved up or down through Levels according to their ability. The PIAAC numeracy assessment also uses a computer based adaptive testing process in which participants are moved according to the cumulative score they have achieved. The score given for questions in the PIAAC numeracy assessment are used cumulatively to place respondents on a scale of five Levels of performance (using the scale presented in Table 14.5 previously).
3. The questions in the SfL2011 numeracy assessment and the PIAAC test are both contextualised although there is some difference in the types of contexts as might be expected given that PIAAC is an international assessment so the contexts have to be a common feature for all countries involved.
Potential for further comparison work
Work was undertaken in SfL2003 to compare IALS Levels with Skills for Life Levels, as discussed earlier in this chapter (Section 14.5.3), based at the time on a review of assessment content, criteria and weighting. This qualitative comparison work could be repeated, taking similar account of item content, criteria and weighting for PIAAC, taking particular note of the:
different purposes of the assessments; different structures, ‘adaptivity’ and timings; inclusion of problem solving in PIAAC; exclusion of writing from IALS and PIAAC; and
395 PIAAC Numeracy Expert Group (2009) PIAAC Numeracy: A Conceptual Framework. OECD Education Working Paper No. 35. Available online at: http://www.oecd.org/officialdocuments/displaydocumentpdf?cote=edu/wkp(2009)14&doclanguage=en, accessed on 28/03/12: p. 20.
Chapter 14: Comparisons of survey results with other surveys and standards
354
dissimilar question types.
A further possibility, as considered in the research development and piloting project (prior to the main stage of SfL2011) would be for selected respondents of SfL2011 to be re-contacted and asked to undertake the PIAAC survey. If respondents completed both surveys it may be possible to build statistical models of the Skills for Life assessment items for direct comparison with the PIAAC item performance modelling (including both the IALS pre-existing items and the newly created ones). This would allow comparative work to move beyond comparison of the assessments as a whole and towards comparisons based on particular items or sub-skills. However the adaptive nature of the Skills for Life assessments will require complex statistical processes to establish suitable models and the success of this approach is not certain.
14.18 Comparisons of the Skills for Life 2011 Survey ICT assessment
The preceding sections look at comparisons between SfL2003 and SfL2011 in England and comparable surveys in those subjects undertaken in the UK and internationally. In the following sections, the Skills for Life 2011 survey ICT assessment is compared with other ICT qualifications and standards in England (there are no equivalent surveys against which it can be compared). The authors of the Skills for Life survey ICT assessment used the adult ICT skills standards in order to devise suitable contexts and ensure that questions were pitched at an appropriate Level. So, for example, the standards396 describe the following progression of skills from Entry Level 1 to Level 2: At Entry Level 1, a person can follow recommended safe practices with ICT, recognising
sources of information, obtaining information and receiving ICT-based communication, as well as creating and editing simple information.
At Entry Level 2, an adult can also keep access information such as passwords secure, find and use information appropriately, use ICT to communicate, and present information using ICT.
At Entry Level 3, an adult can also keep information secure, select and use information sources to match requirements, create and edit numerical, visual and textual information, and present information in ways that are fit for purpose.
At Level 1, an adult can use ICT independently to meet their needs, following appropriate safety and security procedures, select and use information for a variety of purposes including ensuring that the information gathered and recorded is fit for purpose. They can also use ICT to communicate and exchange information, and organise, develop, format and present information of a variety of types to be fit for purpose and audience.
396 National Standards for adult literacy, numeracy and ICT, QCA, 2005, http://www.ifl.ac.uk/__data/assets/pdf_file/0006/6639/14130_national_standards_for_adult_literacy_numeracy_ict.pdf, accessed on 28/03/12: p. 20-21.
Chapter 14: Comparisons of survey results with other surveys and standards
355
At Level 2, an adult can also select suitable ICT systems for purpose, manage and store information efficiently, select and use information for more complex tasks, and evaluate fitness for purpose of information obtained. They can also store ICT messages (e.g. emails) effectively, manage address lists and evaluate the fitness for purpose of different methods of presenting information.
14.19 The Skills for Life 2011 ICT assessment and national IT standards
The National Occupational Standards397 (NOS) for ICT Users398 are the source from which the ICT Skills for Life Standards399, the ICT Key Skills standards400 and the Information Technology Qualification401 (ITQ) derive. ICT Skill for Life Standards were developed from the NOS ICT user skills standards and were finalised in 2005. They do not include the more specialised and technical skills that are part of the NOS but focus on broad general skills required to work with common user applications. The ITQ is unit-based with each unit corresponding to an area of competence in the NOS. Each ITQ assessment criteria corresponds to a knowledge statement or performance criteria in the NOS. Complexity of competence in the NOS is defined within areas of competence at three Levels: Foundation - (corresponding to QCF Level 1)
Intermediate - (corresponding to QCF Level 2)
Advanced - (corresponding to QCF Level 3)
The SfL2011 ICT assessment maps directly to the Skills for Life Standards from Entry Level 1 to Level 2, but as these standards align with the NOS at Levels 1 and 2, 402 the SfL2011 ICT assessment at Levels 1 and 2 could also be mapped to the NOS and ITQ, as well as the Key Skills standards.
397 National Occupational Standards are statements of the standards of performance that individuals must achieve when carrying out functions in the workplace. More information is available from UK Standards online at: http://www.ukstandards.co.uk/about-nos/Pages/About-NOS.aspx, accessed on 28/03/12. 398 E-Skills UK (2009) National Occupational Standards for ICT Users v3, available online at: http://www.e-skills.com/standards-and-qualifications/national-occupational-standards-nos, (from download link at bottom of page) accessed on 20/08/12 399 Qualifications and Curriculum Authority (2007) Skill for Life ICT Curriculum. Department for Education and Skills, available online at: http://archive.niace.org.uk/Research/ICT/ICT-Skill-for-Life-curriculum-Jan07.pdf, accessed on 28/03/12. 400 Qualifications and Curriculum Authority (2004) The Key Skills Qualifications Standards and Guidance. Communication, Application of Number and Information and Communication Technology, available online at: http://www.cityandguilds.com/documents/ind_general_learning_keyskills/3638_qca-stdsguidance2004_main.pdf, accessed on 28/03/12. 401 More information about ICT user qualifications is available online at: http://www.e-skills.com/itq, accessed on 28/03/12. 402 The National Occupational Standard for ICT Users start at Level 1 so no mapping for ICT skills between Skills for Life and NOS is possible below Level 1.
Chapter 14: Comparisons of survey results with other surveys and standards
356
The tasks set in the three user application components of the 2011 assessment (word processing, email and spreadsheet) can be mapped to NOS performance criteria in the NOS area of competence Using IT productivity tools and applications within the Foundation and Intermediate levels of complexity.
14.19.1 Nature of skills assessed The NOS specify skills and knowledge primarily related to the workplace. In that respect they provide a traditional view of ICT user skills based on office productivity PC applications: word processing, database, spreadsheet, presentation, graphics, email communications, web browser, plus more specialist technical applications. The remit for SfL2011 was to assess aspects of these ‘traditional’ skills in a practical manner. This was accomplished by asking respondents to complete specified tasks set in credible everyday contexts using real user applications. The NOS do not take account of recent rapid developments in the use of powerful mobile devices and ‘apps’, the widespread use of social media (Facebook, Twitter, LinkedIn, YouTube, blogging etc.), by both individuals and commercial organisations, and the growing integration of ICT into daily life. The survey did not set out to assess what have become everyday ‘life skills’, such as managing bank accounts online, making internet purchases of goods, travel tickets and services etc. Arguably, these recent developments define a different type of ICT user and skill set. The multiple choice section of the assessment does assess wider ICT knowledge to a degree but is not a skills assessment. It is certain that among our respondents are those that have ICT skills which were not assessed in the survey. The question is to what extent these more ‘modern’ skills can be inferred from our results.
14.19.2 Rationale for the Skills for Life 2011 ICT assessment The NOS are concerned with areas of competence and complexity of competence: what it is that users are able to do using appropriate ICT applications in a work setting. It was therefore considered essential that the BIS ICT assessment should be practical and task based, otherwise interpretation of outcomes would be likely to present difficulties. As described in Annex 2, a practical assessment technology based on real user applications (RATE) had made it feasible to create an entirely automated test system that would provide a high degree of realism and familiarity for respondents. The level and range of tasks required for the assessment were well within the capabilities of the user applications and the automatic marking system. Time constraints on the assessment limited the number of tasks that could be set at each of the Levels from Entry Level 1 to Level 2. Thus those achieving Level 2, for example, in any one of the practical components will have attempted relatively few tasks at that Level, there being insufficient time to include a confirmatory phase in the assessment which could have been used to present an extended range of tasks at a particular Level. This possible shortcoming is alleviated by the fact that each set of tasks at a given Level were presented as a contextualised group which taken together produced an overall outcome, i.e. tasks were neither atomic nor set in isolation. Another factor to be taken into account is that tasks at each Level were set for each of the three user applications, so the total number of tasks at any Level across the assessment was reasonably substantial.
Chapter 14: Comparisons of survey results with other surveys and standards
357
14.20 The Skills for Life 2011 ICT assessment and Functional Skills ICT assessments
The ICT Functional Skills403 qualifications are replacing the ICT Key Skills qualifications at Levels 1 and 2, and are available as both standalone qualifications and are also embedded within the umbrella qualifications of diplomas and apprenticeships, and offered within foundation learning programmes.404 A marked difference in the assessment models is the move from a portfolio plus 40-item multiple choice assessment for Key Skills to practical, context-based, holistic examination assessments for Functional Skills. The essence of the approach is that candidates must choose and use familiar applications to solve problems, produce information and create documents (under exam conditions). As the outcomes from SfL2011 indicate (see Chapter 4), the results from a multiple choice assessment alone cannot be used as a reliable measure of actual user skills. Indeed, the introduction of portfolio assessment alongside the multiple choice assessment in Key Skills was recognition at the time of the need to assess both knowledge and skills in a valid way. Advances in examinations – allowing candidates to take examinations using computers has facilitated the use of a single skills examination, and removed the need for a portfolio component. In that respect the move to practical assessment is to be welcomed and should certainly prove to be both more efficient and an accurate method of ICT skills measurement than previous measures (there are a number of reliability issues with portfolio assessment and it is time consuming for candidates). At present, most, if not all, Functional Skills assessments are human marked, either from printouts or files. However, as this survey has shown, it is now possible to provide respondents with real user applications and automatically mark output. Other than consolidating results to determine respondent Levels, no human marking at all was used in the SfL2011 ICT assessment. It is not difficult to envisage the same technology being adapted to provide an automated means of assessment for an ICT Functional Skills qualification at Entry Level 3, Level 1 or Level 2, and a number of awarding organisations offering Functional Skills ICT are working on such systems.
403 Office of Qualifications and Examinations Regulation (2011) Functional Skills Criteria for ICT Entry 1, Entry 2, Entry 3, Level 1 and Level 2, available online at: http://www.ofqual.gov.uk/downloads/category/68-functional-skills-subject-criteria?download=1172%3Afunctional-skills-criteria-for-ict, accessed on 28/03/12 404 Further information is available online at: http://www.direct.gov.uk/en/EducationAndLearning/QualificationsExplained/DG_173874, accessed on 28/03/12.
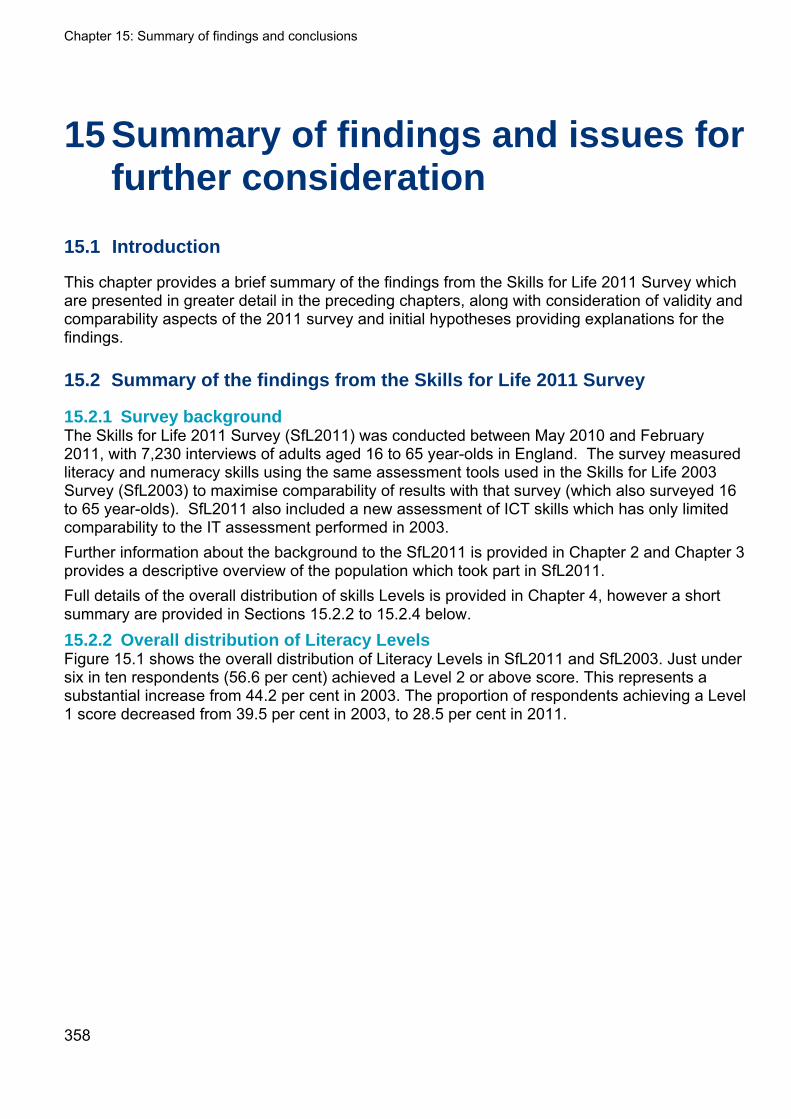
Chapter 15: Summary of findings and conclusions
358
15 Summary of findings and issues for further consideration
15.1 Introduction
This chapter provides a brief summary of the findings from the Skills for Life 2011 Survey which are presented in greater detail in the preceding chapters, along with consideration of validity and comparability aspects of the 2011 survey and initial hypotheses providing explanations for the findings.
15.2 Summary of the findings from the Skills for Life 2011 Survey
15.2.1 Survey background The Skills for Life 2011 Survey (SfL2011) was conducted between May 2010 and February 2011, with 7,230 interviews of adults aged 16 to 65 year-olds in England. The survey measured literacy and numeracy skills using the same assessment tools used in the Skills for Life 2003 Survey (SfL2003) to maximise comparability of results with that survey (which also surveyed 16 to 65 year-olds). SfL2011 also included a new assessment of ICT skills which has only limited comparability to the IT assessment performed in 2003. Further information about the background to the SfL2011 is provided in Chapter 2 and Chapter 3 provides a descriptive overview of the population which took part in SfL2011. Full details of the overall distribution of skills Levels is provided in Chapter 4, however a short summary are provided in Sections 15.2.2 to 15.2.4 below. 15.2.2 Overall distribution of Literacy Levels Figure 15.1 shows the overall distribution of Literacy Levels in SfL2011 and SfL2003. Just under six in ten respondents (56.6 per cent) achieved a Level 2 or above score. This represents a substantial increase from 44.2 per cent in 2003. The proportion of respondents achieving a Level 1 score decreased from 39.5 per cent in 2003, to 28.5 per cent in 2011.
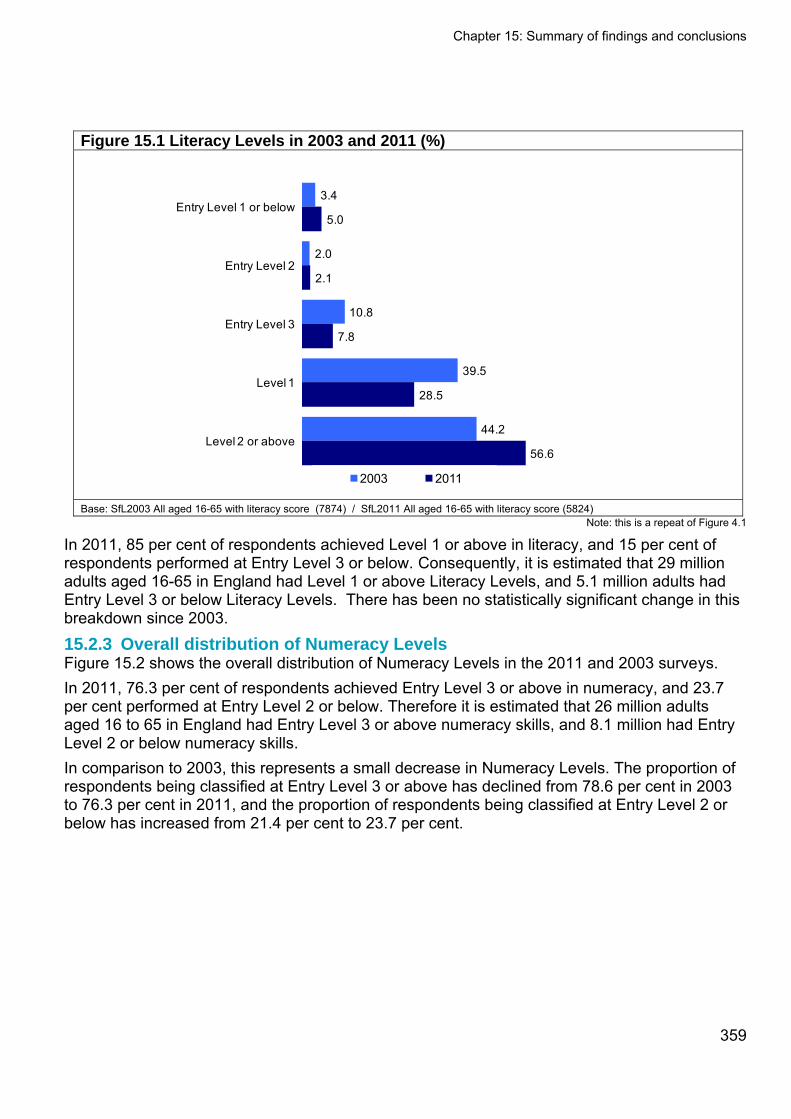
Chapter 15: Summary of findings and conclusions
Figure 15.1 Literacy Levels in 2003 and 2011 (%)
3.4
2.0
10.8
39.5
44.2
5.0
2.1
7.8
28.5
56.6
Entry Level 1 or below
Entry Level 2
Entry Level 3
Level 1
Level 2 or above
2003 2011
Base: SfL2003 All aged 16-65 with literacy score (7874) / SfL2011 All aged 16-65 with literacy score (5824) Note: this is a repeat of Figure 4.1
In 2011, 85 per cent of respondents achieved Level 1 or above in literacy, and 15 per cent of respondents performed at Entry Level 3 or below. Consequently, it is estimated that 29 million adults aged 16-65 in England had Level 1 or above Literacy Levels, and 5.1 million adults had Entry Level 3 or below Literacy Levels. There has been no statistically significant change in this breakdown since 2003. 15.2.3 Overall distribution of Numeracy Levels Figure 15.2 shows the overall distribution of Numeracy Levels in the 2011 and 2003 surveys. In 2011, 76.3 per cent of respondents achieved Entry Level 3 or above in numeracy, and 23.7 per cent performed at Entry Level 2 or below. Therefore it is estimated that 26 million adults aged 16 to 65 in England had Entry Level 3 or above numeracy skills, and 8.1 million had Entry Level 2 or below numeracy skills. In comparison to 2003, this represents a small decrease in Numeracy Levels. The proportion of respondents being classified at Entry Level 3 or above has declined from 78.6 per cent in 2003 to 76.3 per cent in 2011, and the proportion of respondents being classified at Entry Level 2 or below has increased from 21.4 per cent to 23.7 per cent.
359
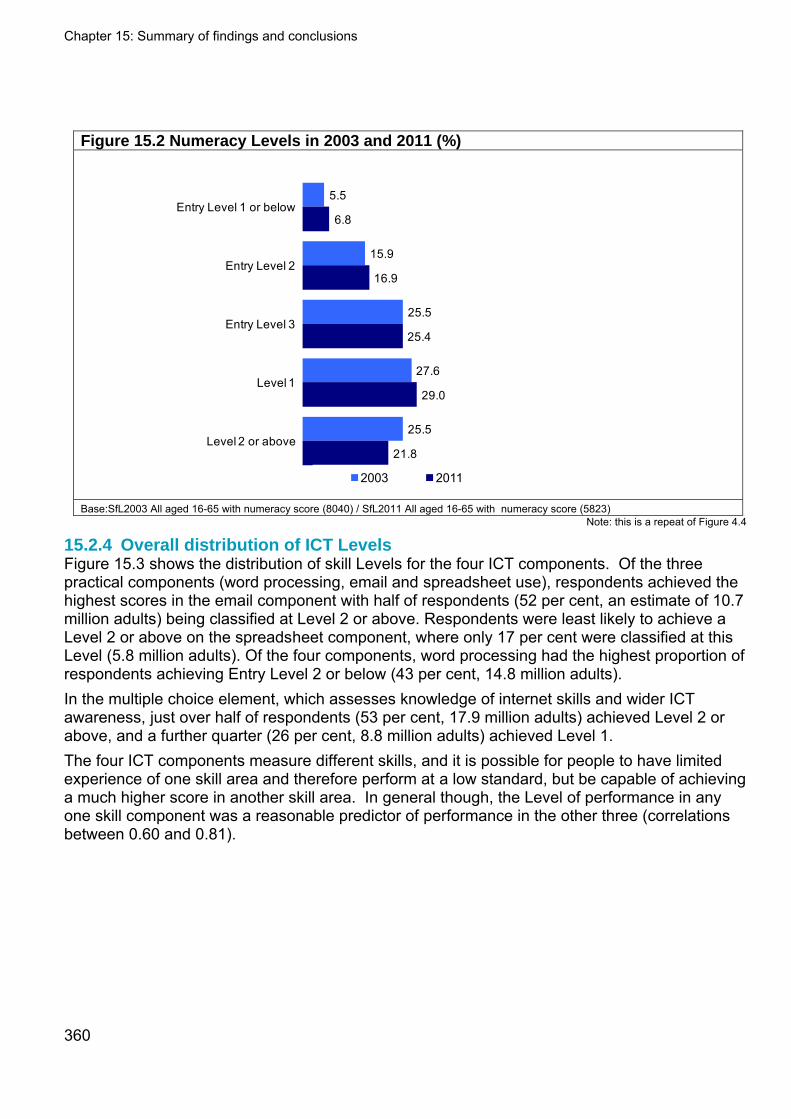
Chapter 15: Summary of findings and conclusions
Figure 15.2 Numeracy Levels in 2003 and 2011 (%)
5.5
15.9
25.5
27.6
25.5
6.8
16.9
25.4
29.0
21.8
Entry Level 1 or below
Entry Level 2
Entry Level 3
Level 1
Level 2 or above
2003 2011
Base:SfL2003 All aged 16-65 with numeracy score (8040) / SfL2011 All aged 16-65 with numeracy score (5823) Note: this is a repeat of Figure 4.4
15.2.4 Overall distribution of ICT Levels Figure 15.3 shows the distribution of skill Levels for the four ICT components. Of the three practical components (word processing, email and spreadsheet use), respondents achieved the highest scores in the email component with half of respondents (52 per cent, an estimate of 10.7 million adults) being classified at Level 2 or above. Respondents were least likely to achieve a Level 2 or above on the spreadsheet component, where only 17 per cent were classified at this Level (5.8 million adults). Of the four components, word processing had the highest proportion of respondents achieving Entry Level 2 or below (43 per cent, 14.8 million adults). In the multiple choice element, which assesses knowledge of internet skills and wider ICT awareness, just over half of respondents (53 per cent, 17.9 million adults) achieved Level 2 or above, and a further quarter (26 per cent, 8.8 million adults) achieved Level 1. The four ICT components measure different skills, and it is possible for people to have limited experience of one skill area and therefore perform at a low standard, but be capable of achieving a much higher score in another skill area. In general though, the Level of performance in any one skill component was a reasonable predictor of performance in the other three (correlations between 0.60 and 0.81).
360
Chapter 15: Summary of findings and conclusions
Figure 15.3 ICT Levels (%)
9
39
31
43
12
27
9
16
26
17
8
15
53
17
52
25
Multiple Choice
Spreadsheets
Emailing
Word Processing
Entry Level 2 or below Entry Level 3 Level 1 Level 2 or above
Base: SfL2011 All aged 16-65 with word processing score (2253) / email score (2247) / spreadsheet score (2228) / multiple choice score (2274)
Note: this is a repeat of Figure 4.5
15.2.5 The relationship between literacy, numeracy and ICT skills Literacy and numeracy are two different skills but as in 2003, numeracy skill was correlated with literacy skill in the 2011 survey. Just over six in ten respondents (62 per cent) performed at a lower Level in the numeracy assessment than in the literacy assessment. Only six per cent of respondents achieved a higher Level in numeracy than in literacy. This is shown in Figure 15.4. In 2003, one in ten respondents (10 per cent) were classified at a higher Level in numeracy than literacy, and 53 per cent performed to a lower standard.
361
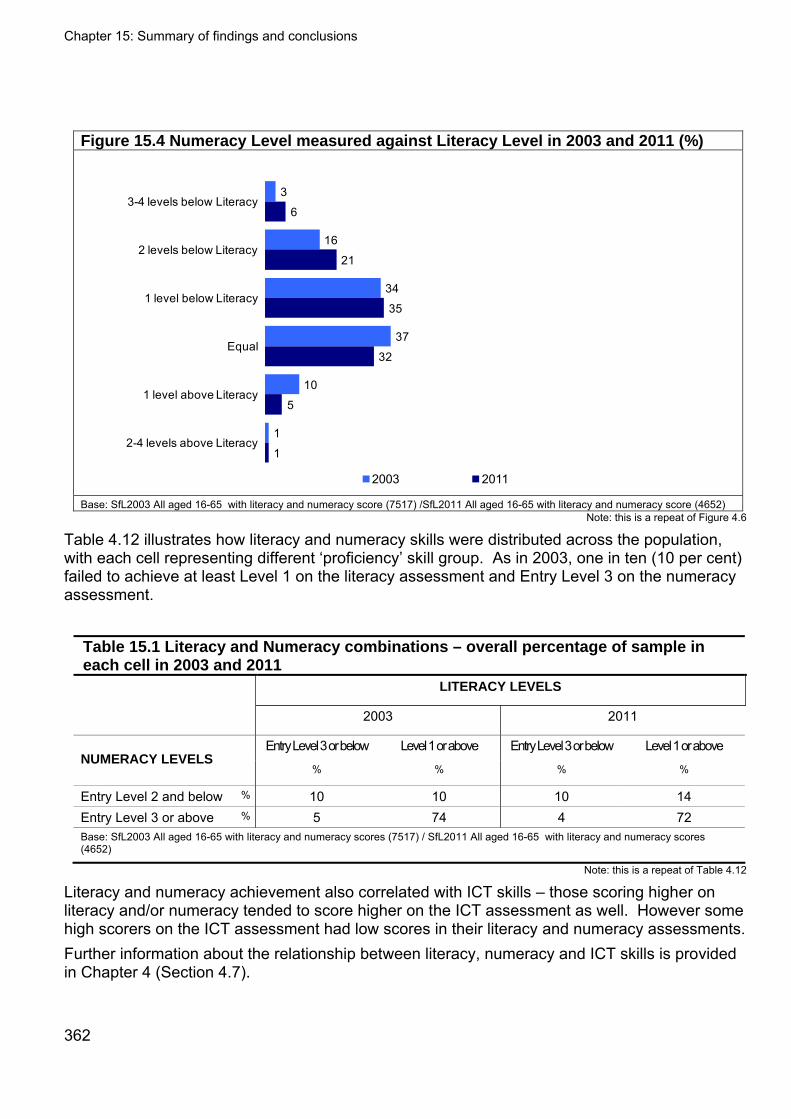
Chapter 15: Summary of findings and conclusions
Figure 15.4 Numeracy Level measured against Literacy Level in 2003 and 2011 (%)
3
16
34
37
10
1
6
21
35
32
5
1
3-4 levels below Literacy
2 levels below Literacy
1 level below Literacy
Equal
1 level above Literacy
2-4 levels above Literacy
2003 2011 Base: SfL2003 All aged 16-65 with literacy and numeracy score (7517) /SfL2011 All aged 16-65 with literacy and numeracy score (4652)
Note: this is a repeat of Figure 4.6
Table 4.12 illustrates how literacy and numeracy skills were distributed across the population, with each cell representing different ‘proficiency’ skill group. As in 2003, one in ten (10 per cent) failed to achieve at least Level 1 on the literacy assessment and Entry Level 3 on the numeracy assessment.
Table 15.1 Literacy and Numeracy combinations – overall percentage of sample in each cell in 2003 and 2011 LITERACY LEVELS
2003 2011
Entry Level 3 or below Level 1 or above Entry Level 3 or below Level 1 or above NUMERACY LEVELS
% % % %
Entry Level 2 and below % 10 10 10 14 Entry Level 3 or above % 5 74 4 72 Base: SfL2003 All aged 16-65 with literacy and numeracy scores (7517) / SfL2011 All aged 16-65 with literacy and numeracy scores (4652)
Note: this is a repeat of Table 4.12
Literacy and numeracy achievement also correlated with ICT skills – those scoring higher on literacy and/or numeracy tended to score higher on the ICT assessment as well. However some high scorers on the ICT assessment had low scores in their literacy and numeracy assessments. Further information about the relationship between literacy, numeracy and ICT skills is provided in Chapter 4 (Section 4.7).
362
Chapter 15: Summary of findings and conclusions
363
15.2.6 Linguistic and cultural backgrounds Eleven per cent of respondents did not speak English as a first language (ENFL) (up from seven per cent in 2003) with London having by far the largest proportion of such respondents (34 per cent). Respondents who spoke English as a first language (EFL) tended to score higher across the literacy, numeracy and ICT assessments, as they did in 2003. Amongst EFL respondents, a small increase in the proportion reaching Level 1 or above in literacy was evident (from 86 per cent in 2003 to 88 per cent in 2011). Eighty-six per cent of respondents selected their ethnicity as White, so it is difficult to make statistically sound judgements about the performance of other ethnic groups in the assessments due to small base sizes. Nevertheless, differences were apparent for some ethnic groups. These correspond well with the regression analysis (see Chapter 6), which showed that ethnicity (in particular for Pakistani respondents) had an additional influence on Literacy Levels over and above those associated with first language effects. Further information about skill Levels for people from different cultural and linguistic backgrounds is provided in Chapter 5 (Section 5.3) and Chapter 6. 15.2.7 Skills in different parts of England There was a relationship between basic skills and geo-demographic characteristics, deprivation in particular. When controlling for first language spoken, the North East tended to have the poorest numeracy and ICT performance. It also showed the poorest performance in the literacy assessment, along with London. In Yorkshire and the Humber, the West Midlands, and the South East, increases were observed in literacy performance since 2003. London was the only Region to see a significant decline in numeracy performance since 2003. London has a higher proportion of respondents with ENFL (34 per cent). When accounting for this by considering only EFL respondents, London’s literacy scores remain low compared to the average for all Regions (83 per cent at Level 1 and above compared to the average of 88 per cent). However, numeracy scores are broadly in line with the average (75 per cent at Entry Level 3 or above compared to 78 per cent across all Regions). Further information about regional variations in literacy, numeracy and ICT skills is provided in Chapter 5 (Section 5.4). 15.2.8 The relationship between personal characteristics and skills Age
The impact of age on basic skills was explored in two separate ways: in Chapter 5, between-cohort differences were examined (comparing the same age groups between the 2003 and 2011 surveys), and in Chapter 6, generational analysis was carried out, which looked at passage of time differences (comparing the same generation between SfL2003 and SfL2011). Very few differences in literacy performance were evident by age at Level 1 or above. Small variations were apparent however at the highest Level, with those aged 45 or over were least likely to achieve a Level 2 or above score. This is supported by the regression analysis which found that being aged 45 or above was a predictor of ‘weak’ literacy. Since 2003, there has been little change in the performance of the age groups, with the exception of 55-65 year-olds. Within this group there has been a substantial increase in literacy skills. This is likely to be a cohort effect, and may be due to the educational circumstances of those aged 55-65 in SfL2003 (the majority of whom were not eligible to take part in SfL2011). For numeracy, some variations by age were apparent. Since 2003 there has been a sizeable decrease in performance of the youngest group. In 2003, the youngest group outperformed the

Chapter 15: Summary of findings and conclusions
364
oldest group; however, in 2011 the two groups performed to a similar standard. This pattern is supported by the regression analysis, which showed that both the youngest and oldest age groups were associated with ‘weak’ numeracy. The pattern was still evident when restricting analysis only to those respondents with EFL. It is important to note that in the final regression models the explanatory power of age in relation to other variables is not as high as might be expected. This is due to its relationship with other variables, such as highest qualification. The generational analysis found only minor passage of time effects for literacy. The exception to this was the youngest generation, which reached the standard of their slightly older peers: this suggests that for most people literacy reaches a ‘steady state’ by their mid twenties. It was also notable that there was a general ‘conversion’ of Level 1 into Level 2 or above skills between 2003 and 2011 among all generations, but that this was strongest for the youngest generations. The generational analysis revealed a decline in numeracy across the generations, most noticeably in the oldest generation. However, there is little evidence of retirement being the causal variable, as retirees performed at a similar standard to their working counterparts. For ICT, older respondents (aged 35 and above) were far more likely to perform weakly across the four components of the assessment. Those aged 55 and over performed weakest of all. Further information about the relationship between age and literacy, numeracy and ICT skills is provided in Chapter 5 (Section 5.5.1) and Chapter 6. Other personal characteristics
Personal characteristics are explored in Chapter 5 and through the regression analysis in Chapter 6. Women were slightly more likely than men to achieve Level 2 or above in literacy, in contrast to 2003 when men and women achieved Level 2 in similar proportions. In numeracy men still outperformed women, but this was less marked than in 2003. The regression analysis shows that women were much more likely than men to be categorised below Entry Level 3 in numeracy. In line with 2003, household socio-economic class was linked to skills in all subjects –respondents from households where the household reference person (HRP) was in managerial and professional occupations tended to have the strongest performance, and ‘working class’ households the weakest. While Literacy Levels were affected by age and first language (as discussed in Sections 15.2.6 and earlier in this section), the regression analysis showed that weak literacy was also associated with other personal characteristics including working in certain industry sections, not using a computer, and working in Routine occupations. The regression modelling for numeracy shows similarities to that for literacy, except that first language is a lesser factor, as might be expected. In addition, as mentioned above, gender is a predictive factor for weak numeracy. As for literacy, working in routine occupations in particular is associated with weaker numeracy; but while with literacy there was no strong distinction between ‘white collar’ categories, those in higher professional or managerial occupations score significantly better for numeracy. This suggests that either senior ‘white collar’ work helps individuals retain numeracy skills, or that a high standard of numeracy is one of the keys to seniority. Health was a predictive indicator of performance in all basic skills, with performance declining in line with falling ratings in self-reported health status. The regression modelling showed that having a learning difficulty was associated with weak literacy, but not with weak numeracy.
Chapter 15: Summary of findings and conclusions
365
For ICT, age is the dominant factor, with older respondents (aged 35 and above) far more likely to perform weakly, and those aged 55 and over performing weakest of all. ‘Blue collar’ occupations, unemployment and illness or disability are also predictive of weaker ICT skills. Attitudes to skills and learning
Respondents’ attitudes to learning were linked to skills – those with a negative outlook tended to have lower literacy, numeracy and ICT skills. Three quarters of respondents felt that their school years were useful. A positive perception of the usefulness of school was linked to better literacy, numeracy and ICT skills. The majority of respondents placed practical (and financial) value on qualifications, learning and education, with respondents from BME backgrounds disproportionately likely to agree with all three of the statements used to measure these attitudes. However, higher performance in the skills assessments correlated with only one of the three statements in this area: agreeing with ‘I see paying for my education as an investment’ (32 per cent of people agreed with this statement). In terms of learning as a continuous process, respondents who agreed that ‘learning is something you should do throughout your life’ tended to score higher on the skills assessments than those who did not agree. However, there was little difference in the skills of those who believed that improvement was necessary to succeed at work compared with those who disagreed with this notion. When examining respondents’ future intentions towards learning, 17 per cent of respondents were not considering undertaking any learning in the next two to three years. Those who were least inclined to do so had the greatest room for improvement as they tended to achieve lower scores on the skills assessments. Further information about the relationship between attitudes toward learning and literacy, numeracy and ICT skills is provided in Chapter 11. 15.2.9 The impact of education on skills People are staying on in education for longer than they were in 2003. The age at which people left education was linked to literacy, numeracy and ICT skills: respondents who left education at a later age tended to score higher on the skills assessments. More respondents held qualifications than in 2003, with only 11 per cent not holding any qualifications (compared to 22 per cent in 2003). In terms of the qualifications held, there has been an increase (from 19 per cent to 24 per cent) in the proportion possessing a qualification at degree level or above. Possession of qualifications was linked to employment status and gender. As in 2003, the higher the qualification held, the higher respondents tended to score on the literacy, numeracy and ICT assessments. Possession of GCSE English and Maths (at grade C or above) was linked to stronger performance in literacy and numeracy respectively. When controlling for qualifications held; parental education had a low relationship with literacy and numeracy amongst those respondents who held an English/Maths GCSE (or equivalent) at grade C or above. However, amongst those holding a lower qualification (or no qualification at all) a relationship was apparent; with those respondents whose parents did not stay in education beyond 16 being more likely to achieve lower literacy and numeracy scores. The regression modelling also supports the relationship between education and skills Levels. The association between highest qualification and performance in the numeracy assessment was high. Holding any qualifications at all was a significant advantage over holding none, and

Chapter 15: Summary of findings and conclusions
366
holding Level 3 qualifications and above was a significant advantage over holding lower level qualifications. A degree is particularly valuable in this context. For literacy, an absence of qualifications was strongly associated with weak literacy. The association between highest qualification and performance in the ICT assessment was also high. Holding any qualifications at all was a significant advantage over holding none, and the ‘return’ associated with a degree level qualification was greater still. Further information about the relationship between education and literacy, numeracy and ICT skills is provided in Chapter 7. 15.2.10 Literacy, numeracy and ICT in life and work Since 2003 there has been a rise in the population’s self confidence in their literacy and numeracy skills. Respondents with higher confidence tended to achieve higher scores in the literacy and numeracy assessments. Those who read most frequently tend to have the highest literacy skills, and those who never read the lowest. Similarly, the frequency of carrying out numerical calculations in everyday life was reflected in performance in the numeracy assessment. People who rated themselves as poor in reading, writing and number skills also believed that their shortcomings affected their job prospects. Respondents in work tended to be stronger in literacy, numeracy and ICT, as did those with higher personal earnings. Those on means tested benefits tended to have weaker skills in all three subjects. Their scores were in line with those of other respondents who shared their demographic characteristics (i.e. others who were unemployed, had a limiting disability, or left school before the age of 17). As mentioned above, occupation was linked to literacy, numeracy and ICT skills, with respondents in high occupation categories generally achieving higher scores. Since 2003 there has been an improvement in literacy standards across all occupations, with more people from every group achieving Level 2 or above, though those in Semi-routine occupations were also more likely than their 2003 counterparts to achieve Level 1 or above. Decreases in numeracy performance were apparent amongst those in managerial and professional occupations.
Industry sector also had an impact, with those working in Education, Information and communication and Public administration likely to possess higher than average literacy and numeracy skills. They also had strong performance in the ICT assessment, along with those who worked in Finance and Professional, scientific and technical industries. Further information about literacy, numeracy and ICT skills in everyday life and work is provided in Chapter 8. 15.2.11 Use of computers Computer access has increased dramatically since 2003, with 93 per cent of respondents having access to a computer (either at home or at work) compared to 71 per cent in 2003. The past eight years have also seen a striking increase in the frequency of computer usage, with weekly and daily users rising from 51 per cent to 82 per cent amongst 16-65 year-olds. Frequency of computer use was an effective predictor of ICT performance. Unsurprisingly, those without computer access performed considerably less well on the ICT assessment, particularly in the practical components. The most common activities carried out (at home and in the workplace) were searching the internet and emailing. As might be expected, respondents who
Chapter 15: Summary of findings and conclusions
367
carried out a greater range of computer tasks tended to score higher in the various components of the ICT assessment. Ninety per cent of respondents had internet access in their home. An absence of home internet was associated with older respondents. Those who had internet access at home tended to perform better in the ICT assessment. Self confidence in ICT skills has also grown since 2003. These high levels of self-assurance tend to be justified when comparing ratings with performance across the ICT components. Further information about the relationship between computer use and literacy, numeracy and ICT skills is provided in Chapter 9. 15.2.12 Basic skills training The analysis examines the confidence and skill standards of respondents who undertook training in basic literacy, numeracy or ICT (at any time). It should be noted that inferences about the impact of training cannot be drawn from SfL2011 data, as information about individuals’ skill before and after training was not collected.
Further information about the relationship between basic skills training and literacy, numeracy and ICT skills is provided in Chapter 10. Literacy
Eleven per cent of respondents had received literacy training, with most tackling two or three skills (reading and writing more commonly than speaking) as part of a single course. One per cent of respondents were receiving literacy training at the time of the survey. People currently in training were the most likely to rate their reading and writing negatively, and had the lowest Literacy Levels out of all those who had trained, suggesting that it is people with below-average confidence and skills who tend to access literacy courses. However, having weak literacy did not always prompt people to seek out training. Over four fifths (83 per cent) of those who scored below Level 1 in the literacy assessment – and could therefore be described as having a training need – did not enrol on any courses in literacy.
ENFL respondents were more likely to attend training than EFL respondents. The performance of respondents with ENFL who tried to improve their literacy through training was broadly similar to that of the overall population with ENFL. By contrast, people with EFL who had attended a literacy course tended to perform slightly less well than the overall population with EFL. People who undertook their training further in the past performed no better or worse in the assessment than recent learners: this could be an indication that skills gained during training tend to be retained over time. People who trained more than three years ago were more self-assured about their reading abilities than recent learners, suggesting that confidence may grow as time elapses after the completion of training. Performance in the literacy assessment was similar amongst SfL2011 respondents who had received training and their counterparts from SfL2003 survey. At both points in time, almost half achieved Level 2 or above. Numeracy
Eight per cent of respondents had received training in numeracy, unchanged since 2003. The demographic characteristics of maths learners have changed, however, with people in search of employment and under-25s now the most likely groups to seek out training.
Chapter 15: Summary of findings and conclusions
368
Less than one per cent of 16-65 year-olds were currently receiving training in basic maths or number skills. Current learners gave the weakest performance in the numeracy assessment - this is unsurprising given that this group may not yet have felt the full benefit of the training on their skills. By contrast, people who completed a course in the past demonstrated a similar standard of numeracy as those who had never trained. Whilst inferences about the impact of training must be treated with caution, as nothing is known about the Literacy Levels of individuals immediately before and after training, this may indicate that the completion of a training course was able to raise the maths abilities of learners to the same standard as the general population. Numeracy skills were broadly similar amongst learners who had trained recently and those who trained further in the past: hence, there was no indication that numeracy skills become lost over time. Despite the similar performance of recent and past learners in the numeracy assessment, respondents who trained more than three years ago were more self-assured than recent learners about their maths skills, suggesting that people continue to grow in confidence after completing their course even if their skills cease to improve. The majority of those with arguably the greatest training need did not attend a maths course: 91 per cent of the respondents who scored Numeracy Entry Level 2 or below did not seek out any training. People in the 20-24 age range were the most likely out of everyone with a training need to have accessed a maths course. Compared to their counterparts from SfL2003, SfL2011 respondents with experience of maths training were less likely to achieve Entry Level 3 or above in the numeracy assessment. The relatively poor performance of SfL2011 maths learners is linked to the presence in the survey of a ‘fresh stock’ of poorly skilled under-25s. ICT More than half of respondents (54 per cent, the same proportion as in 2003) received training in computer skills outside of school, mostly in an academic, work, or an adult education centre setting. The incidence of training was higher than average amongst women and under-25s, and low amongst those who finished their education before they were 17. Three quarters (74 per cent) of those who could be described as having a training need (i.e. respondents who scored or were assigned Entry Level 2 or below in all the practical components of the ICT assessment), did not access any ICT courses. This group had lower confidence than other people with a training need.
In contrast to literacy and numeracy, people who attended courses in ICT tended to have higher skills than the general population. ICT trainees had a higher than average likelihood of reaching or surpassing Level 2 in all four components of the assessment. Current learners were just as likely as past learners to score highly in the various components of the assessment, suggesting that ICT skills tend to be picked up quite rapidly. People who trained more than three years ago did no better or worse in the assessment than those who received their training within the last three years, demonstrating little or no loss of ICT awareness or skills with the passage of time since the completion of a course. 15.2.13 Sub-skills Respondents with Entry Level Literacy tended to be strongest at reading and writing at word level (i.e. dealing with individual words) and weaker at composition and meaning, grammar and punctuation. Respondents with Literacy Levels 1 and 2 tend to be stronger at reading than writing generally.
Chapter 15: Summary of findings and conclusions
369
Respondents with Entry Level 1 and 2 Numeracy tended to be weaker than other respondents at number skills and stronger at measures, shape and space and interpretation of data (graphs and charts). At Levels 1 and 2, number skills and measures, shape and space are stronger than data skills. In ICT, respondents at all Levels were stronger on the multiple choice questions than the practical assessments, suggesting many have much stronger understanding about ICT than they can demonstrate with skills in practice. Email skills were stronger among respondents than word processing and spreadsheet skills. Further information about the sub-skill levels in literacy, numeracy and ICT skills is provided in Chapter 13. 15.2.14 Policy Sub-groups Those who were unemployed and seeking work were less likely than average to achieve Level 1 or above in literacy and/or Entry Level 3 or above in numeracy (see Section 12.3.1), with little evident change in skills since 2003. These respondents also tended to have lower than average ICT skills. The proportion of respondents ‘Not in Education, Employment or Training’ (NEET) at Level 1 or above in literacy and Entry Level 3 or above on numeracy was lower than ‘non-NEET’ respondents, with the proportions reaching these Levels unchanged from 2003. This group also exhibited lower ICT skills. Young NEET respondents generally achieved lower literacy and numeracy scores than young ‘non-NEET’ respondents, however their ICT performance was broadly in line. The literacy performance of young people (those aged under 25) was broadly in line with that of older people. However, as revealed by the generational analysis, since 2003 the conversion from Level 1 to Level 2 or above has been particularly strong for young people. Young people’s performance in numeracy was weaker and has fallen since 2003. Young people’s ICT scores tended to be higher than those of older age groups. Despite being less likely to be in education or employment, young lone parents did not have lower literacy skills than young people in general. They were, however, slightly less likely to achieve Entry Level 3 or above in the numeracy assessment. Low literacy, numeracy and ICT skills were associated with the indicators of both social exclusion and digital exclusion. The skills of ENFL respondents tended to be weaker than those of EFL respondents. Their skills were broadly in line with those of their SfL2003 counterparts, although the proportion of people with ENFL in the population grew substantially from seven per cent in 2003 to 11 per cent in 2011. Respondents with a limiting disability or learning difficulty tended to display lower literacy and numeracy performance. The literacy of both groups has improved since 2003, with a higher proportion reaching Level 1 or above. No corresponding changes in numeracy were apparent. Further information about literacy, numeracy and ICT skill Levels among policy sub-groups is provided in Chapter 12. 15.2.15 Summary The key findings from the Skills for Life 2011 survey are as follows:
Literacy standards have surpassed the benchmark set in 2003, with more achieving Level 2 or above than had previously been the case. The growth in high performers, however,
Chapter 15: Summary of findings and conclusions
370
reflects an upward shift from Level 1 rather than a reduction in the number of poor performers: the proportions achieving Entry Level 3 or below remains unchanged. Literacy standards have improved for all age groups.
Numeracy standards have fallen slightly since 2003, with declines at both ends of the performance scale, with fewer people in 2011 managing to exceed Level 1 and slightly more falling below Entry Level 2. In 2003, the 55-65 year-old age group had the weakest numeracy. In 2011 this age group continued to achieve low numeracy scores; however, the youngest age group in 2011 also had very weak skills, performing to a similar standard as the oldest respondents and much more poorly than the youngest SfL2003 respondents.
With regards to ICT, there is now widespread knowledge of computers and communication technologies such as the internet, and large proportions of the population are skilled in using email. However many still struggle with word processing and spreadsheets.
Skills varied according to respondents’ first language, and to an extent cultural background, with EFL respondents achieving higher scores in all areas.
Controlling for first language, numeracy and ICT skills were weakest in the North East. The North East along with London also had the weakest literacy skills. When focusing solely on EFL respondents, only London showed a significant decline in numeracy performance since 2003.
A range of personal characteristics were linked to poor literacy and numeracy skills, including poor qualifications, level of parents’ education and attitudes to learning and skills. For ICT age was an important determinant, with skills Levels decreasing with an increase in age.
Regression analysis shows that many personal characteristics associated with weak performance are common to all three domains (literacy, numeracy and ICT) including:
- English not being the first language of the respondent, especially for some ethnic groups;
- Neither parent staying in education beyond the age of 16;
- A (self-assessed) learning difficulty;
- Having no educational qualifications;
- Working in some industry sectors (sample size limitations prevent identification of those most closely associated with weak assessment performance); and
- Working in routine occupations (or long-term unemployed).
Infrequent or zero computer use appears to predict weak literacy and numeracy performance beyond that expected from educational and work status.
Chapter 15: Summary of findings and conclusions
371
Women tended to perform at a lower standard than men in numeracy.
A mild decline after the age of 45 is seen for literacy, a gentle u-shaped distribution for numeracy (youngest and oldest age groups were weakest) and a strong linear relationship for ICT with each succeeding generation having stronger skills than the previous one.
15.3 Survey validity and comparability
The Skills for Life 2011 Survey was designed with two clear purposes:
1. To measure the literacy, numeracy and ICT skills of the working age population in England accurately against the Skills for Life standards.
2. To ensure that the survey results are directly comparable with the SfL2003 results.
This section considers the extent to which the survey assessment has validity (i.e. sufficiently comprehensive in scope of assessment, accuracy and repeatability of skills measurement, and authentic) and concludes that the survey is both valid and reliable, and directly comparable to SfL2003.
15.3.1 Comparability of results from 2003 and 2011 SfL2011 was designed so as to maximise comparability with SfL2003, in terms of reporting on literacy and numeracy. The literacy and numeracy assessments used in 2011 are the same as those used in 2003, and the sampling strategy for SfL2011 was designed to achieve a similar effective sample size to that achieved in 2003 while interviewing fewer respondents; moreover, it uses 2003 statistical wards as the Primary Sampling Units to ensure comparability. Further details are provided in Annex 1. Care was taken to ensure that the eligibility criteria used to route people in or out of the literacy and numeracy assessments in 2003 were replicated in 2011. The background questionnaire was updated and revised, but many of the items included in 2003 remain in the SfL2011 questionnaire. A small data error occurred in SfL2003, whereby data were not captured for all assessments (this is discussed in more detail in Annex 4), and to safeguard against this in 2011 a security wrapper was added to the tools for SfL2011. Follow-up work was conducted to quantify the potential impact of the data non-capture (detailed in Annex 6) and it found that it did not seriously distort the survey comparisons. In conclusion, the Skills for Life survey results from 2003 and 2011 are directly comparable. 15.3.2 Numeracy and literacy assessment validity and reliability The literacy and numeracy assessments were based on the Key Skills standards in existence in 2001 for Communication and Application of Number, which covered Levels 1 to 5. The assessments themselves only made use of the standards for Levels 1 and 2 as there were no Key Skills standards or tests at Entry Level (nor were the Skills for Life Core Curricula available at the time), with new questions written to assess Entry Levels 1 to 3. The assessments were piloted prior to the survey being undertaken in 2002.
Chapter 15: Summary of findings and conclusions
372
The literacy and numeracy assessments were critiqued by National Research and Development Centre (NRDC) in a report published in 2005,405 noting for example that the skills-area coverage was not comprehensive in that the literacy assessment focuses on reading rather than listening or writing. These limitations were in part the result of design constraints and available technology at the time. In terms of content validity they reflect a common feature of many objectively assessed literacy assessments: they do not assess constructed responses, including notably the skill of writing in literacy and mathematical process in numeracy. Furthermore, as far as Skills for Life literacy is concerned, they also do not test speaking and listening, raising questions of coverage (content validity). However, the current Skills for Life assessments406 (the National Tests on which all Skills for Life achievements at Levels 1 and 2 are based) consist entirely of multiple choice questions with the same content validity/coverage issues. Any measurement error across the two surveys should be consistent, so any observed trend can be considered to be robust. Separately, it is conceivable that although the survey assessments measure ‘literacy’ and ‘numeracy’, they measure a different set of skills to those which learners have developed and been assessed on during basic skills training. Analysis of the assessments suggests this is not the case (more information is provided in Annex 2). Annex 4 presents further evidence that the assessments have performed with good internal reliability. It should also be noted that the SfL2003 and SfL2011 findings largely accord with the results other national and international surveys, as presented in Chapter 14. Although the Skills for Life Survey assessment can be seen to be close enough to the Skills for Life National Tests to be a fair assessment of skills in those terms, there are substantial wider issues in assessing literacy and numeracy. One of the most notable which might have an impact on survey results is the extent to which respondents’ experience of literacy and numeracy is heavily embedded in everyday life and the possibility that they may not recognise the activities they are undertaking in the survey assessment as literacy and numeracy tasks, because the settings are unfamiliar. However it should be noted that the Skills for Life survey assessment questions are short, and have only relatively limited contextual information, so concerns about context making the assessment inaccessible should not be overstated. More recent qualifications such as Functional Skills (the replacement for Key Skills) use more heavily contextualised and open-ended assessment approaches, which involve elements of problem solving and wider skills alongside literacy and numeracy. The results from the Functional Skills Pilot evaluation suggested that Functional Skills qualifications (at that time) were more difficult to achieve than the equivalent Skills for Life qualifications.407 Finally, it is also worth noting that England’s Key Skills assessment regime involves a combination of test and portfolio evidence, to provide improved reliability and curriculum coverage, a model which is common in skills qualifications settings but is clearly not practical within a survey interview.
405 Brooks, G., K. Heath, and A. Pollard (2005) Assessing Adult Literacy and Numeracy: a Review of Assessment Instruments. National Research and Development Centre for Adult Literacy and Numeracy, available online at: http://www.nrdc.org.uk/publications_details.asp?ID=23#, accessed on 28/03/12. 406 These assessments are no longer being supported for new learners from August 2012. 407 Qualifications and Curriculum Development Authority (2011) Evaluation of the Functional Skills Pilot, available online at: http://webarchive.nationalarchives.gov.uk/20110813032310/http://www.qcda.gov.uk/resources/7585.aspx, accessed on 28/03/12: p.44 etc. (The QCDA closed in March 2012).
Chapter 15: Summary of findings and conclusions
373
In conclusion, while there are limitations in the assessments of Skills for Life both in this survey’s assessments and the examinations for the qualifications (particularly in terms of curriculum coverage in literacy), and noting that other qualifications take a different approach to assessing literacy and numeracy, the survey assessments are a reliable and valid measure of the Skill for Life standards. 15.3.3 The possibility of reading, writing and cultural bias contaminating
assessment results Almost all assessments involve a degree of reading in order to be able to answer the questions. In many cases, writing is also required to present a response. This is true for the ICT assessment in part, but not for the numeracy (and literacy) assessment where answers are always selected from a pre-prepared list. So to some extent at least, the assessments of numeracy and ICT are also measuring literacy skills. Even within the literacy assessment, questions which are supposed to be testing composition skills (spelling, punctuation, grammar) inevitably involve an implicit assessment of reading skills as well. This is of course of lesser concern as the literacy assessment outcome is a holistic Literacy Level, although it could affect item functioning and hence some elements of assessment performance. The relatively high correlations between literacy performance and each of numeracy and ICT performances suggests that such contamination is a possibility. Modern assessment design specifications often place requirements on reading level. For example, the specification for Functional mathematics requires the reading standard of the question to be no higher than one Level below the mathematics Level being assessed. Looking to SfL2011, if this requirement had been in place then approximately one per cent of numeracy respondents would have been affected (i.e. experienced numeracy questions with reading requirements potentially more than one Level above their reading standard) with perhaps a slightly higher, but still very small, proportion for ICT. However these requirements were not in place at the time the assessment was designed. Looking first at the items in the numeracy assessment, it is clear that the items are very terse – context is kept to a minimum (one of the main causes of wordy questions). Nevertheless some questions do include significant reading requirements: for example item 27, which requires the respondent to read a TV programme schedule, or item 47, which presents two weighing scale readings and uses text to describe the difference between the readings (screenshots of these questions are included in Annex 2). However, the wordier questions are at the higher Levels of numeracy, so it is likely that the reading requirements for the assessment are sufficiently low as to have no contamination impact on the outcomes. Turning to the ICT assessment, examples of tasks are shown in Annex 2 along with the 15 multiple choice questions. Clearly the multiple choice questions require reading, in some cases at quite a high standard due to the use of common technical terminology. Similarly, the word processor task involves both manipulating English text and reading instructions presented in English. While English composition is not assessed, reading the instructions is clearly essential for good performance; understanding the text being manipulated (while probably not strictly essential) is the intention of the assessment design. The extent to which literacy skills at or above Level 1 in literacy are an implicit requirement for word processing is unclear, although an examination of the National Occupational Standards for IT users includes high level literacy requirements throughout. The same applies to a slightly lesser extent to the email and spreadsheet assessments, where the reading load on instructions is lighter. The correlations between literacy and the component skills of the ICT assessment, and between numeracy skill and the component skills of the ICT assessment are both moderate (at around
Chapter 15: Summary of findings and conclusions
374
0.5, see Chapter 4, Section 4.7.2). It seems reasonable to assume that any contamination of ICT assessment by literacy requirements (particularly reading) is likely to be no more than a workplace competency assessment would assume, and clearly the spreadsheet skill at least requires a degree of numeracy skill. Assessment error can also occur because of cultural bias in questions. Questions which ask respondents to make judgements in contexts that the assessment writer expects to be familiar to the respondent are likely to be harder for those respondents who have no knowledge of these. Considering the numeracy assessment, the questions are situated within a UK setting; measures include UK money, UK TV schedules, foodstuffs common in the UK (spaghetti bolognese, baked beans, etc.) and UK food labelling. In most cases this is likely to present no additional problems over and above the reading issue discussed earlier. The literacy and ICT assessments similarly use scenarios common in the UK; the weather, property rental, holidays, letters, timetables, advertisements, warning notices and user instructions for devices. As for numeracy although the contexts are designed to be familiar, the extent to which any cultural bias might affect performance over and above the effect of Literacy Level for ethnic minority groups is not known but could also be investigated. Overall, the assessments were designed to take account of the potential for literacy contamination and cultural bias, although an inevitable degree of literacy and cultural knowledge is needed to answer some of the questions. Modern assessments of literacy, numeracy and ICT skills are similar in that they use context and require the ability to demonstrate transferable skills in new situations and so it can be concluded that the SFL2011 assessments are comparable with assessments used for related qualifications in England. 15.3.4 The possibility that population sampling led to skills improvements being
missed As with any survey, the statistics derived from SfL2003 and SfL2011 are estimates with differences noted in the headline findings statistically significant at the five per cent level: this means that it is possible to miss an effect by chance - an inevitable consequence of using a sample-based approach.
The sample size and design for SfL2011 was based on standard parameters and techniques for a survey of this type (80 per cent power and a 95 per cent confidence interval). The survey was designed so that a real difference of +/- 3 percentage points would lead to a statistically significant finding. Examining the probabilities of the actual change being within a certain range, it is noted that:
The likelihood that the actual change in the proportion of people achieving Literacy Level 1 or above between 2003 and 2011 is less than or equal to two percentage points is 79 per cent. The likelihood of the actual change being negative is six per cent.
The likelihood that the actual change in the proportion of people achieving Numeracy Entry Level 3 and above is less than or equal to -2 percentage points is 64 per cent. The likelihood that the actual change is positive is one per cent.
Although the survey provides estimates, these should be reliable within the parameters stated.
Chapter 15: Summary of findings and conclusions
375
15.4 Initial interpretation of trends in literacy and numeracy
15.4.1 Introduction SfL2011 shows that there has been no improvement in low-level literacy skills (below Level 1) and numeracy skills (below Entry Level 3) since the 2003 survey, despite substantial investment in adult skills provision following the publication of the Moser Report in 1999.408 Many learners have undertaken Skills for Life programmes: the Statistical First Release data for post-16 education409 shows that in 2010/11, 1,471,300 post-16 learners participated in Skills for Life courses, with similar numbers in preceding years back to 2006/07 (although it should be noted that figures from 2008/09 on are not directly comparable to earlier years due to changes in data collection and the definition of funded learners). With around 4.3 million learners overall participating in FE and Skills in 2010/11, Skills for Life is therefore a large strand of activity. As outlined in Chapter 2, Skills for Life provision has been prioritised by successive governments which has included support and recruitment programmes to build capacity and maximise engagement.410 Much of this report focuses on outcomes in terms of the literacy and numeracy thresholds in the Leitch411 and Moser412 reports for literacy (skills at Level 1 and above) and numeracy (skills at Entry Level 3 and above) which were reflected in historical Public Service Agreement (PSA) targets. The English School Education system today places by far the greatest emphasis (in terms of expectations for schools and students through to the end of Key Stage 4 (KS4) at age 16) on achievement at Level 2 (GCSE grade C equivalent) and, to a lesser extent, at Level 1 (GCSE grades D-G), and recognises the particular importance of students achieving both GCSE English and mathematics to at least Level 2 (Grade C).413 Following its review of literacy and numeracy provision for adults, the Coalition Government is now focusing on supporting adults to reach Level 2 standard, which includes funding GCSE English and Maths qualifications for adults from August 2012. Table 15.2 shows progress from 2003 to 2011 against these measures as recorded in the SfL2003 and SfL2011 surveys.
408 Moser, C. et al. (1999) Improving literacy and numeracy: a fresh start. The report of the working group chaired by Sir Claus Moser on behalf of the Department for Education and Skills, available online at: http://www.lifelonglearning.co.uk/mosergroup/index, accessed 28/03/12. 409 The Data Service (June 2012) Quarterly Statistical First Release June 2012 Post-16 Education & Skills: Learner Participation, Outcomes and Level of Highest Qualification Held. Available online at: http://www.thedataservice.org.uk/statistics/statisticalfirstrelease/sfr_current/, Table 7.1, Table 9 and Table 1, accessed on 25/09/12,. 410 National Audit Office (2008) Skills for Life: Progress in Improving Adult Literacy and Numeracy, available online at: http://www.nao.org.uk/publications/0708/skills_for_life_progress_in_i.aspx, accessed on 28/03/12: p. 18. 411 HM Treasury (2006) Leitch Review of Skills. Prosperity for All in the Global Economy - World Class Skills. Final Report, available online at: http://webarchive.nationalarchives.gov.uk/+/http://www.hm-treasury.gov.uk/media/6/4/leitch_finalreport051206.pdf, accessed on 28/03/12. 412 Moser, C. et al. (1999) Improving literacy and numeracy: a fresh start. The report of the working group chaired by Sir Claus Moser on behalf of the Department for Education and Skills, available online at http://www.lifelonglearning.co.uk/mosergroup/index, accessed on 28/03/12: Annex A. 413 Skills for Life literacy and numeracy at Level 2 are broadly equivalent to GCSE Mathematics and English in terms of the level of challenge although cover a somewhat narrower curriculum.
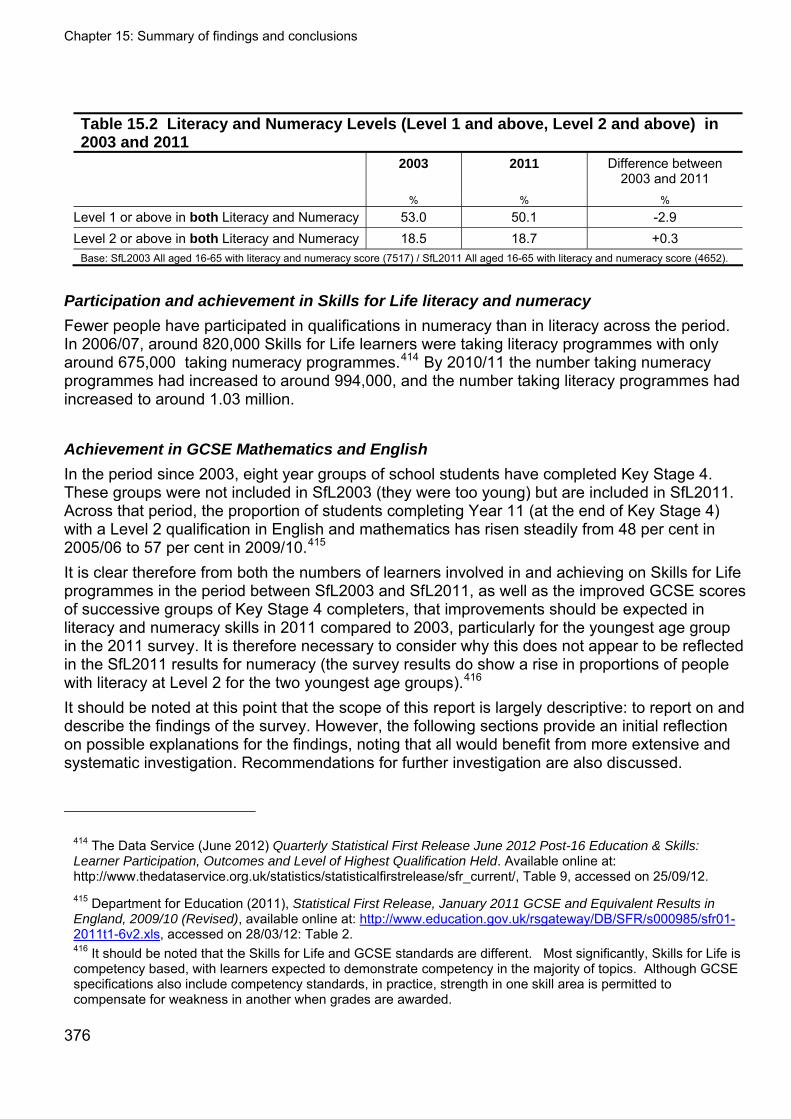
Chapter 15: Summary of findings and conclusions
376
Table 15.2 Literacy and Numeracy Levels (Level 1 and above, Level 2 and above) in 2003 and 2011
2003 2011 Difference between 2003 and 2011
% % %
Level 1 or above in both Literacy and Numeracy 53.0 50.1 -2.9 Level 2 or above in both Literacy and Numeracy 18.5 18.7 +0.3
Base: SfL2003 All aged 16-65 with literacy and numeracy score (7517) / SfL2011 All aged 16-65 with literacy and numeracy score (4652).
Participation and achievement in Skills for Life literacy and numeracy
Fewer people have participated in qualifications in numeracy than in literacy across the period. In 2006/07, around 820,000 Skills for Life learners were taking literacy programmes with only around 675,000 taking numeracy programmes.414 By 2010/11 the number taking numeracy programmes had increased to around 994,000, and the number taking literacy programmes had increased to around 1.03 million. Achievement in GCSE Mathematics and English
In the period since 2003, eight year groups of school students have completed Key Stage 4. These groups were not included in SfL2003 (they were too young) but are included in SfL2011. Across that period, the proportion of students completing Year 11 (at the end of Key Stage 4) with a Level 2 qualification in English and mathematics has risen steadily from 48 per cent in 2005/06 to 57 per cent in 2009/10.415 It is clear therefore from both the numbers of learners involved in and achieving on Skills for Life programmes in the period between SfL2003 and SfL2011, as well as the improved GCSE scores of successive groups of Key Stage 4 completers, that improvements should be expected in literacy and numeracy skills in 2011 compared to 2003, particularly for the youngest age group in the 2011 survey. It is therefore necessary to consider why this does not appear to be reflected in the SfL2011 results for numeracy (the survey results do show a rise in proportions of people with literacy at Level 2 for the two youngest age groups).416 It should be noted at this point that the scope of this report is largely descriptive: to report on and describe the findings of the survey. However, the following sections provide an initial reflection on possible explanations for the findings, noting that all would benefit from more extensive and systematic investigation. Recommendations for further investigation are also discussed.
414 The Data Service (June 2012) Quarterly Statistical First Release June 2012 Post-16 Education & Skills: Learner Participation, Outcomes and Level of Highest Qualification Held. Available online at: http://www.thedataservice.org.uk/statistics/statisticalfirstrelease/sfr_current/, Table 9, accessed on 25/09/12. 415 Department for Education (2011), Statistical First Release, January 2011 GCSE and Equivalent Results in England, 2009/10 (Revised), available online at: http://www.education.gov.uk/rsgateway/DB/SFR/s000985/sfr01-2011t1-6v2.xls, accessed on 28/03/12: Table 2. 416 It should be noted that the Skills for Life and GCSE standards are different. Most significantly, Skills for Life is competency based, with learners expected to demonstrate competency in the majority of topics. Although GCSE specifications also include competency standards, in practice, strength in one skill area is permitted to compensate for weakness in another when grades are awarded.
Chapter 15: Summary of findings and conclusions
377
15.4.2 Skills loss in literacy and numeracy If people tend to forget what they have learned soon after completing training then this would offer an explanation for some of the survey’s findings. It should be noted here that the survey data cannot be used to directly assess skills gain or loss relating to training, because respondents’ skills before and after training are not known.
Concerns have been raised about the impact of ‘teaching to the test’ in Skills for Life programmes,417 the main concern being that the pressure on achievement targets has led to a narrower curriculum in teaching, focused only on passing the tests (i.e. on developing skills only in those areas covered by the National Test, a particular concern for literacy where the test coverage in terms of the curriculum has been most limited), with associated cramming and very context-specific skills development. Such approaches may lead to more rapid skills loss after achievement than approaches focused more on consolidating skills.418 People clearly do forget skills, but the extent of ‘forgetting’, the causes, and whether the rate of forgetting differs from one skill to the next are all clearly important factors as far as this survey is concerned, as is the impact on ‘forgetting’ of different approaches to training and skills development. Some skills are ‘never’ forgotten; learning to ride a bike for example, others appear to have an element of “use it or lose it”, and whether and how this applies to literacy and numeracy is perhaps worthy of further investigation. It seems possible, for example, that low-skill jobs offer little opportunity to develop or consolidate skills learned prior to entering the workforce or as a result of training, so may exacerbate skills loss. The inconclusive evidence from the survey suggests that literacy and numeracy skills are not easily lost, but the survey’s report of poor numeracy skills among young people shortly after good GCSE performance suggests it may be. Additionally, if skills loss is significant, then an important follow-up question in terms of training impact is: ‘if skills are gained and then lost, can they be regained, at need, faster than if they had never been known before’. It is conceivable that although ‘skills loss’ respondents cannot demonstrate their numeracy skills ‘on demand’, i.e. when an interviewer turns up at their door, they may be able to regain them very quickly when they need to use them. Skills loss is a potential explanatory factor for the literacy and numeracy trends observed, although any skills loss that does occur may not affect literacy and numeracy in the same way. Further research into skills loss would be worthwhile including studying the skills of those who have recently undergone training or completed qualifications.
417 For example: Cara, O., J. Litster, J. Swain and J. Vorhaus (2008) The Teacher Study: The Impact of the Skills for Life Strategy on Teachers - Summary Report, National Research and Development Centre for Adult Literacy and Numeracy, available online at: http://www.nrdc.org.uk/publications_details.asp?ID=151#, accessed on 28/03/12: pg 42 etc and Marsh, M. (2011) Numeracy Counts NIACE Committee of Inquiry on Adult Numeracy Learning Final Report, available online at: http://shop.niace.org.uk/media/catalog/product/n/u/numeracy_counts_final_report_feb_2011a.pdf, accessed on 28/03/12. 418 Cepeda, N., Vul, E., Rohrer, D. Wixted, J. and Pashler, H (2008). Spacing effects in learning: A temporal ridgeline of optimal retention, available online at http://escholarship.org/uc/item/0kp5q19x#page-6, accessed on 03/08/12. A full investigation of this assertion is beyond the scope of the report.
Chapter 15: Summary of findings and conclusions
378
15.4.3 Numeracy skills have worsened due to poorly skilled young people entering the survey population.
The literacy performance of respondents aged under 25 was in line with the performance of those aged 25 and over, however the picture for numeracy is different: respondents aged under 25 generally scored slightly lower than those aged 25 and over, with 73 per cent achieving Entry Level 3 or above, compared to 77 per cent of those aged over 25. And, as highlighted previously, it is this young group that have had a sizeable decline in numeracy Levels since 2003. In 2003, this group was just as likely to achieve Entry Level 3 or above as those aged 25 and over. Since 2003, however, the proportion of those aged under 25 scoring Entry Level 3 or above has fallen from 80 to 73 per cent, whilst the proportion aged over 25 achieving this Level has remained unchanged. Within the under 25 age group this decrease was most notable amongst 20-24 year-olds. This finding is in contrast to GCSE results in mathematics: the proportion of KS4 completers achieving grade C or above (equivalent to Level 2 numeracy) rose from 48 per cent in 2002/03419 to 60 per cent in 2009/10.420 Similarly, the proportion achieving GCSE mathematics grades A* to G (equivalent to Level 1) rose from 90 per cent to 92 per cent. So, despite almost all 16 year-olds421 receiving a qualification deemed equivalent to Level 1 numeracy, around a quarter of them cannot demonstrate those skills within a skills assessment up to 8 years later.422 Indeed, the survey notes that it is possible to hold a maths GCSE (or equivalent) at grade C or above, but perform much lower on the numeracy assessment: 11 per cent of such respondents failed to reach Entry Level 3 or above numeracy in the 2011 survey. This appears to be clear evidence of skills loss over that period, and may reflect a combination of skills not properly consolidated at KS4 (for example teaching to the test issues as raised for Skills for Life programmes) and/or skills forgotten because they are not used. As stated earlier, skills loss, particularly around numeracy, is worthy of further investigation.
15.4.4 Ineffective training in numeracy Chapter 10 considers skills in terms of self-reported participation in basic skills courses in literacy and numeracy, and in ICT training. The findings here are complex and not conclusive in that they are unable to take account of skills before and after training, but participation and achievement rates in Numeracy and Literacy Skills for Life (and in related qualifications such as Functional Skills and Key Skills), in the intervening years between the two Skills for Life surveys provide a basis for considering the outcomes that might have been expected from the Skills for Life survey in 2011.
419 Department for Education (2004) Statistical First Release January 2004 GCSE/GNVQ Results and Key Stage 3 to GCSE/GNVQ value added measure for young people in England 2002/2003 (Revised), available online at: http://www.education.gov.uk/rsgateway/DB/SFR/s000442/sfr02-2004.xls, accessed on 28/03/12: Table 7. 420 Department for Education (2011) Statistical First Release January 2011 GCSE and Equivalent Results in England, 2009/10 (Revised), available online at: http://www.education.gov.uk/rsgateway/DB/SFR/s000985/sfr01-2011t7-17.xls, accessed on 28/03/12: Table 9. 421 Approximately 94 per cent of pupils completing Key Stage 4 have attempted GCSE mathematics (see reference above) and more than 90 per cent of these achieve a result equivalent to Level 1 or above. 422 It should be noted that the Skills for Life and GCSE standards are different. Most significantly, Skills for Life is competency based, with learners expected to demonstrate competency in the majority of topics. Although GCSE specifications also include competency standards, in practice, strength in one skill area is permitted to compensate for weakness in another when grades are awarded.
Chapter 15: Summary of findings and conclusions
379
One hypothesis for the poor progress seen by SfL2011, particularly in numeracy, is that skills are not properly learned in the first place - whether in school or in post-compulsory education - and so cannot be demonstrated during the survey assessments although, achievement rates of around 50 per cent would suggest this is largely not the case. It may be the case that the skills are not consolidated, leading to poorer performances on future tests. The National Audit Office report highlights concerns about the quality of teachers in terms of their qualifications,423 and Ofsted’s recent inspection summary identifies the ongoing need for improvements in literacy and numeracy teaching in general alongside issues of disengagement:
‘The opportunity to apply learning in a realistic work environment, either through well-structured assignments or through employment, brings vocational learning to life. This also applies to teaching the key skills of literacy and numeracy. Historically, these have been isolated from work-related aspects of learning and have suffered as a result. Young people have been disengaged and failed to see why these skills are important or how they can be applied. The most successful providers have broken down this false distinction and, by integrating key skills provision fully within a vocational context, are gaining better engagement and higher achievement.’ 424
In a separate report on numeracy, mixed quality of provision was observed.425 There were issues with tutor skills (67 per cent of the 46 providers sampled had less than half their tutors qualified to the required level). In other research, some Skills for Life tutors report a strong ‘teaching to the test’ culture resulting from flow down of previous PSA targets and associated incentives in funding arrangements.426 As part of further work, the impact of numeracy provision on skills gain and loss should be considered, including the impact of reported weaknesses in the quality of numeracy provision compared to better quality numeracy provision.
423 National Audit Office (2008) Skills for Life: Progress in Improving Adult Literacy and Numeracy, available online at: http://www.nao.org.uk/publications/0708/skills_for_life_progress_in_i.aspx, accessed on 28/03/12: p. 33-35. 424 Office for Standards in Education, Children's Services and Skills (2010) The Annual Report of Her Majesty’s Chief Inspector of Education, Children’s Services and Skills 2009/10, available online at: http://www.ofsted.gov.uk/sites/default/files/documents/Ofsted%20Annual%20Report%2009-10%20-%20full%20report.pdf, accessed on 28/03/12:p. 168. 425 Office for Standards in Education, Children's Services and Skills (2011) Tackling The Challenge Of Low Numeracy Skills In Young People And Adults, available online at: http://www.ofsted.gov.uk/sites/default/files/documents/surveys-and-good-practice/t/Tackling%20the%20challenge%20of%20low%20numeracy%20skills%20in%20young%20people%20and%20adults.pdf, accessed on 28/03/12. 426 For example:
Marsh, M. (2011) Numeracy Counts NIACE Committee of Inquiry on Adult Numeracy Learning Final Report, available online at: http://shop.niace.org.uk/media/catalog/product/n/u/numeracy_counts_final_report_feb_2011a.pdf, accessed on 28/03/12.
Teaching and Learning Research Programme (2007) Policy, learning and inclusion in the learning and skills section. Research Briefing Number 28, available online at: http://www.tlrp.org/pub/documents/Coffield%20RB%2028%20FINAL.pdf, accessed on 28/03/12.
Chapter 15: Summary of findings and conclusions
380
15.4.5 Population changes relating to migration balance out literacy and numeracy skills gains in the ‘base population’.
Eleven per cent of SfL2011 respondents did not speak English as a first language (ENFL) (an increase from seven per cent in 2003). Speaking English as a first language was linked with skills, with respondents in this category tending to score more highly across not just the literacy assessment but also the numeracy and ICT assessments. Focusing solely on respondents who speak English as a first language (EFL), there has been a small increase in the proportion achieving Level 1 or above in literacy since 2003, rising from 86 per cent in 2003 to 88 per cent in 2011. While the survey is unable to consider migration directly, examining the results of ENFL respondents may serve as a useful proxy. The numeracy skills of ENFL respondents are broadly as they were in 2003 (41 per cent at Entry Level 2 or below in 2003 falling to 38 per cent in 2011), with a small decline also evident for literacy skills (46 per cent at Entry Level 3 or below in 2003 falling to 42 per cent in 2011). The small overall decline in literacy skills among ENFL respondents would have reduced an overall small improvement in literacy in the whole population. By inspection it is clear that in 2011 ENFL respondents account for around one third (29 per cent) of those at Entry Level Literacy and 13 per cent of those at Entry Level Numeracy, so changes in the skills of that population will have a large effect on overall skills at Entry Level. The potential impact of migration on Numeracy Levels in young people was examined in Chapter 5. Due the rise in the proportion of ENFL in the youngest age groups, it might be hypothesised that the decline in the Numeracy Levels of young people is related to a flow of young migrants into the county with ENFL. However, this does not seem to be solely the case, as declines in the numeracy performance of the youngest age groups were also apparent amongst respondents for whom English is their first language. Rapid or frequent population changes due to migration may have a significant impact on overall skills Levels, particularly if the skills of migrants differ greatly from those of the base population. Relatively little is known about migrants’ skills Levels and so this is an area worthy of further investigation.
15.4.6 Skills improvement is marginal or long term, or not measured in terms of literacy and numeracy
It is perhaps possible that the effects of training are only measurable over the very long-term. However, there is an eight-year time gap between the fieldwork periods of SfL2003 and SfL2011 (June 2002 – May 2003 and May 2010 – February 2011), so it seems likely that any emerging trends would become apparent during that timeframe. It is also possible that Skills for Life training might not always provide a substantial increase in an individual’s skills but might have more of an effect on self-confidence, employability and/or usage of skills, together with proportionate increases in skills. These might then over time increase the individual’s abilities, creating a virtuous circle. Such effects might take a long time to work through though, as well as probably being small. Research into the impact of some work-based basic skills courses has found that the main outcome of shorter (typically 30 hour) courses on offer designed to increase employees’ literacy skills was an increase in confidence rather than an increase in skills.427
427 Wolf, A. et al. (2009) Enhancing 'Skills for Life': Adult Basic Skills and Workplace Learning: Full Research Report, ESRC End of Award Report, available online at: http://www.thelearningchain.net/Enhancing%20SfL%20Adult%20Basic%20Skills%20and%20Workplace%20Learning%20FULL%20REPORT.pdf, accessed on 18/06/12: p32.
Chapter 15: Summary of findings and conclusions
381
The SfL2011 data revealed a tendency for confidence in literacy and numeracy skills to increase as time elapses following the completion of training (although this is not necessarily because of training). Further research into the impact of provision on skills gain and the wider benefits of participating in Skills for Life training would be worthwhile. 15.4.7 Other possibilities The discussions above represent only some of the possible explanations and interpretations of the observed outcomes. Other factors which may contribute to understanding of the outcomes, and which would be worthy of further investigation include the following:
Successful Basic Skills interventions may be most difficult for those requiring the most help, with multiple factors perpetuating the prevalence of weak skills. Noting the extensive investment in Skills for Life and related programmes, it appears that the group of people with skills below the Level 1 in literacy and Entry Level 3 in numeracy are the hardest to help (this group has seen the smallest change between 2003 and 2011). A recent UK Commission for Employment and Skills (UKCES) report identifies the challenges faced by those with the poorest skills, for example for those in work:
‘Generally, the least skilled are the least likely to be offered or to receive job-related training and this tends to reinforce the weak competitive position of low skilled people in the job market’.428
Interventions to date may have prevented decline. It is possible that the lack of change for most skill Levels since 2003 reflects successful interventions which have prevented a decline. The survey was unable to gather information about skills before and after training. As a result, no assessment as to the impact of training interventions has been possible. Any future measurement of impact would need to consider the change in skill level before and after training.
The importance of early education and opportunity for early experiences to counter factors such as poor education and skills of parents and other household members. Most of the factors discussed in this report relate to the skills, demographics and personal characteristics of individuals, but where skills are poor, these may be in part the consequence of social exclusion in the individual’s entire household, with, for example, one in eight households having no working adult (where the households contain at least one adult of working age). 429 The attainment of children in these households is much lower than for households where adults are in work (under 40 per cent of children
428 Hasluck, C, (2011) Low skills and Social Disadvantage in a Changing Economy. UK Commission for Employment and Skills, available online at: http://www.ukces.org.uk/assets/bispartners/ukces/docs/publications/equality-low-skills.pdf, accessed on 28/03/12:p31. 429 Hasluck, C, (2011) Low Skills and Social Disadvantage in a Changing Economy. UK Commission for Employment and Skills, available online at: http://www.ukces.org.uk/assets/bispartners/ukces/docs/publications/equality-low-skills.pdf, accessed on 28/03/12: p. 22.
Chapter 15: Summary of findings and conclusions
382
obtaining five GCSEs at grade C or above, compared to around 80 per cent in households whose parents were in higher professional employment).430
15.5 Discussion and initial interpretation of the ICT headline findings
The initial interpretation above has concentrated on issues relating to literacy and numeracy, and in particular, possible explanations for changes observed since 2003. The 2011 survey also included a detailed analysis of ICT skills for which outline interpretation of findings is presented in the following section.
15.5.1 ICT Skills in the 2011 survey SfL2011 measured practical ICT skills in word processing, spreadsheet use and emailing as well as knowledge of wider ICT skills such as using the internet. The results are not comparable with the more limited assessment of IT skills in the 2003 survey due to differences in the skills assessed.
In 2011, around half of those surveyed had a high standard of emailing skills, reaching Level 2 or above (the highest Level in the Skills for Life ICT standards), and good understanding of wider ICT such as the internet. Skills in word processing and spreadsheet use were a little less strong (with around 60 per cent reaching Entry Level 3 or above in each). More than half of respondents had received ICT training other than at school, which coupled with the survey outcomes from the knowledge-based multiple choice questions, suggests high levels of awareness of ICT.
15.5.2 ICT skills in work and society The government’s Race Online 2012 manifesto431 identifies that 8.2 million adults have never used the internet in Britain, with four million of these from digitally disadvantaged groups (aged over 65, unemployed, families with children). These figures are corroborated by the 2011 SfL finding that an estimated 3.2 million people aged 16 or over in England are below Entry Level 3 in ICT awareness (tested by the multiple choice assessment), 10.7 million are below Entry Level 3 in emailing and an estimated 3.4 million are without internet access in their home.432
The SfL2011 ICT assessment focuses on a relatively traditional view of ICT skills – assessing word processing, spreadsheet and email skills, as emphasised in the Skills for Life ICT curriculum (which the tool is designed to assess), and the Key Skills and Functional Skills standards. The multiple choice questions attempt to assess other areas that cannot easily be assessed in a test (e.g. effective use of the internet) and areas not covered by these curricula and standards (use of mobile technology, social media, etc.). However the assessment here is
430 Department for Children, Schools and Families (2008) Youth Cohort Study, and Longitudinal Study of Young People in England: The activities and experiences of 16 year olds: England 2007. Statistical Bulletin, available online at: http://www.education.gov.uk/rsgateway/DB/SBU/b000795/b01-2008.pdf, accessed 28/03/12: Table 4.1.1. The figures mentioned for households with workless adults is taken from an ‘other / not classified’ NS-SEC category, which frequently denotes, but is not limited to ‘no occupation’. 431 Available online at: http://raceonline2012.org/manifesto/1, accessed 28/03/12. 432 See Section 9.6, approximately one in ten people do not have internet access at home.
Chapter 15: Summary of findings and conclusions
383
limited partly due to the number of questions but also because it assesses knowledge rather than skill. Separately, the background questionnaire captures information about ICT usage. Recent government policy outside of education places a much greater emphasis on ICT as a tool for participation and access. For example the ‘Manifesto for a networked nation’ 433 highlights simply the use of a browser or web-enabled application to access the internet for accessing services as critical to digital and social inclusion (largely ignoring the more ‘traditional ICT user skills’). The implication here is that even email skills may be best learned as using a browser based email rather than an installed custom email application (e.g. Microsoft Outlook) as included in the survey’s ICT assessment. Social media and mobile communications are for many young people their first and sole experience of ICT. Messaging tools such as Short Message Service (SMS) text and Facebook may have replaced email, and smart phone applications (‘apps’) have eaten quickly and heavily into the browsers’ dominance of internet usage434 particularly for younger users, perhaps because their internet usage is better suited to apps, or because they are more comfortable using them (probably the latter more than the former). Against this backdrop it is clear that there are substantial elements of ICT skill not covered in the standards, or in the survey’s ICT assessment. The impact of this is likely to be an under-reporting of ICT skill, and proportionately greater under-reporting for younger users. Future surveys may wish to consider the limitations of curricula and standards (they are commonly out of date where ICT is concerned due to the rate of progress) and look to a broader specification of ICT competence based more on ICT skills for everyday life than the specific subset required for work in information rich occupations. As might be expected, the SfL2011 findings suggest a substantial increase in computer use compared to 2003 (up from around 44 per cent using computers at least twice a week in 2003 to around 82 per cent in 2011). However, the survey also shows that older respondents are likely to have weaker ICT as are those not in work or in low-skill occupations, those with poor or no educational qualifications, and those with self-reported long-standing health problems. The implications of this are that although the vast majority of the working age population uses ICT regularly and has skills to do so, a minority do not use ICT, and therefore do not receive the benefits that it can bring. This minority group includes a high proportion of those classed as digitally disadvantaged, a group with similar characteristics to those at wider risk of disadvantage and exclusion.
15.6 Further work
It is clearly essential for future research work to focus first on why the survey results do not show the improvements in Literacy and Numeracy Levels that might have been expected based on the level of investment and high levels of participation and achievement. The hypotheses presented and discussed are complex and a single factor is unlikely to be the sole cause. The differences
433 Race Online 2012 (2010) Manifesto for a Networked Nation, available online at: http://raceonline2012.org/sites/default/files/resources/manifesto_for_a_networked_nation_-_race_online_2012.pdf, accessed on 28/03/12. 434 Newark-French, C. (2011) Mobile Apps Put the Web in Their Rear-view Mirror. Flurry, available online at: http://blog.flurry.com/bid/63907/ accessed on 28/03/12.
Chapter 15: Summary of findings and conclusions
384
between the changes seen for literacy and numeracy skills are particularly worthy of further investigation.
There are a number of areas of further work which may help with interpretation, including further work on the SfL2003 and SfL2011 datasets, and consideration of other research alongside these datasets. Noting comments made earlier in this chapter, the following areas are suggested:
More detailed investigation into the possible effects of skills loss in literacy and particularly numeracy.
Further consideration of aspects of policy and delivery relating to Skills for Life in Wales which might explain the significant differences in outcomes, particularly for the improving trends seen in the Welsh population’s skills at Entry Levels for literacy and numeracy.
Consideration of whether the threshold levels defined in 1999 and adopted under preceding policies as representing “functional” i.e. Level 1 or above in literacy and Entry Level 3 or above in numeracy are still suitable for today’s society and workplace.
Further and more detailed multivariate analysis of subgroups, particularly policy subgroups to identify predictive factors.
Further research to explore the issues around training. For example, a propensity score match approach might help assess the impact of basic skills training more precisely. Additionally, further research using a longitudinal or experimental design to explore assessment scores before and after attending basic skills training.
Research to investigate the alignment of ENFL measures with immigration, in order to allow an estimation of the extent to which population churn might contribute to the findings.
Consideration of the impact of basic skills training including investigation of the role of mandatory and voluntary access to provision.
Research into the appropriateness of ESOL provision for ENFL learners, and the funding, support and signposting for this provision.
Research to investigate how employers of people in low skill jobs, typically with poor skills, might be supported to improve progression and retention through skills development as part of wider human capital development.
It would also be worthwhile ensuring that the assessments used in subsequent surveys either measure performance above Level 2 (particularly for literacy, as 57 per cent of respondents obtained a Level 2 or above literacy outcome in 2011) or quickly filter out respondents at these Levels to concentrate more resource on assessing the strengths and weaknesses of those at Level 1 or below in more detail.
Future surveys of ICT skill should consider the strengths and weaknesses of particular ICT curricula in order to identify a range of skills to asses which will both reflect modern society and provide respondents with the widest possible scope to demonstrate their skill.
Bibliography Baker, F. B. (2001) The Basics Of Item Response Theory. ERIC Clearinghouse on Assessment and Evaluation. Available online at: http://info.worldbank.org/etools/docs/library/117765/Item%20Response%20Theory%20-%20F%20Baker.pdf, accessed on 28/03/12.
Bradshaw, J et al. (2010) PISA 2009: Achievements of 15-year-olds in England, available online at: http://www.nfer.ac.uk/nfer/publications/NPDZ01/NPDZ01.pdf, accessed 18/06/12.
Brooks, G., K. Heath, and A. Pollard (2005) Assessing Adult Literacy and Numeracy: a Review of Assessment Instruments. National Research and Development Centre for Adult Literacy and Numeracy, available online at: http://www.nrdc.org.uk/publications_details.asp?ID=23#, accessed on 28/03/12.
Bynner, J. and S. Parsons (1997) It Doesn’t Get any Better. The Basic Skills Agency.
Cara, O., J. Litster, J. Swain and J. Vorhaus (2008) The Teacher Study: The Impact of the Skills for Life Strategy on Teachers - Summary Report, National Research and Development Centre for Adult Literacy and Numeracy, available online at: http://www.nrdc.org.uk/publications_details.asp?ID=151#, accessed on 28/03/12.
Carey, S., Low, S., and J. Hansboro (1997). Adult literacy in Britain. Office for National Statistics.
Carneiro, P., C. Meghir and M. Parey (2010) Maternal Education, Home Environments and the Development of Children and Adolescents. The Institute of Fiscal Studies, Cemmap Working Paper (CWP39/10), available online at: http://ftp.iza.org/dp3072.pdf, accessed on 28/03/12.
Cepeda, N., Vul, E., Rohrer, D. Wixted, J. and Pashler, H (2008). Spacing effects in learning: A temporal ridgeline of optimal retention, available online at http://escholarship.org/uc/item/0kp5q19x#page-6, accessed on 03/08/12.
Chevalier, A. (2004) Parental Education and Child’s Education: A Natural Experiment. Centre for the Economics of Education Discussion Paper 40, available online at: http://ftp.iza.org/dp1153.pdf, accessed on 28/03/12.
Coleman, N., R. Naylor and E. Kennedy (2006), FE Learners Longitudinal Survey Wave 1: Findings from Quantitative Research. Department for Education and Skills Research Report 768, available online at: https://www.education.gov.uk/publications/eOrderingDownload/RR768.pdf, accessed on 28/03/12.
Communities and Local Government (2010) The English Indices of Deprivation 2010, available online at: http://www.communities.gov.uk/documents/statistics/pdf/1871208.pdf, accessed on 28/03/12.
De Coulon, A., Meschi, E. and Vignoles, A. (2008) Parents’ Basic Skills and Children’s Cognitive Outcomes. Centre for the Economics of Education Discussion Paper 104, available online at: http://eprints.lse.ac.uk/23653/1/ceedp104.pdf, accessed on 28/03/12.
Department for Business, Innovation and Skills (2010) Skills for Sustainable Growth. Strategy Document, available online at: http://www.bis.gov.uk/assets/biscore/further-education-skills/docs/s/10-1274-skills-for-sustainable-growth-strategy.pdf, accessed on 28/03/12.

Chapter 15: Summary of findings and conclusions
Department for Business, Innovation and Skills (2011) New Challenges, New Chances – Further Education and Skills System Reform Plan: Building a World Class Skills System. Strategy Document, available online at: http://www.bis.gov.uk/assets/biscore/further-education-skills/docs/f/11-1380-further-education-skills-system-reform-plan.pdf, accessed on 28/12/12.
Department for Children, Schools and Families (2008) Youth Cohort Study, and Longitudinal Study of Young People in England: The activities and experiences of 16 year olds: England 2007. Statistical Bulletin, available online at: http://www.education.gov.uk/rsgateway/DB/SBU/b000795/b01-2008.pdf, accessed 28/03/12.
Department for Education (2004) Statistical First Release January 2004 GCSE/GNVQ Results and Key Stage 3 to GCSE/GNVQ value added measure for young people in England 2002/2003 (Revised), available online at: http://www.education.gov.uk/rsgateway/DB/SFR/s000442/sfr02-2004.xls, accessed on 28/03/12.
Department for Education (2011) Statistical First Release January 2011 GCSE and Equivalent Results in England, 2009/10 (Revised), available online at: http://www.education.gov.uk/rsgateway/DB/SFR/s000985/sfr01-2011t1-6v2.xls, accessed on 28/03/12.
Department for Education and Skills (2001) Adult Literacy Core Curriculum including Spoken Communication, available online at: http://rwp.excellencegateway.org.uk/resource/Adult+literacy+core+curriculum/pdf/, accessed on 28/03/12.
Department for Education and Skills (2001) Adult Numeracy Core Curriculum, available online at: http://rwp.excellencegateway.org.uk/resource/Adult+numeracy+core+curriculum/pdf/, accessed on 28/03/12.
Department for Education and Skills (2002) Skills for Life: The National Strategy for Improving Adult Literacy and Numeracy Skills. ‘What Works’ Early Findings from the Pathfinder Projects. Department for Education and Skills Research Report RR342, available online at https://www.education.gov.uk/publications/eOrderingDownload/RR342.pdf, accessed on 28/03/12.
Department for Education and Skills (2003) 21st Century Skills, Realising Our Potential. Individual, Employers, Nation. Government White Paper, available online at: http://www.bis.gov.uk/assets/biscore/corporate/migratedd/publications/2/21st%20century%20skills.pdf, accessed on 28/03/12.
Department for Education and Skills (2005) 14-19 Education and Skills. Government White Paper, available online at: https://www.education.gov.uk/publications/eOrderingDownload/CM%206476.pdf, accessed on 28/03/12
Department for Education and Skills (2006) Avon Longitudinal Study of Parents and Children (ALSPAC): Adult Learning and Families. Department for Education and Skills Research Brief RBX02-06, available online at: http://www.dcsf.gov.uk/rsgateway/DB/RRP/u014257/index.shtml, accessed on 28/03/12.
Department for Innovation, Universities and Skills (2005) Skills: Getting on in Business, Getting on at Work. Government White Paper, available online at: https://www.education.gov.uk/publications/standard/publicationDetail/Page1/CM%206483, accessed on 28/03/12.
386
Chapter 15: Summary of findings and conclusions
Department for Innovation, Universities and Skills (2009) Skills for Life: Changing Lives, available online at: http://www.bis.gov.uk/assets/biscore/corporate/migratedD/publications/S/SkillsforLifeChangingLives, accessed on 28/03/12.
Dugdale, G. and C. Clark (2008) Literacy Changes Lives: An Advocacy Resource. National Literacy Trust. London: National Literacy Trust. Also available online at: http://www.literacytrust.org.uk/assets/0000/0401/Literacy_changes_lives_2008.pdf, accessed on 28/03/12.
Ekinsmyth, C. and J. Bynner (1994) The Basic Skills of Young Adults. London: The Basic Skills Agency.
E-Skills UK (2009) National Occupational Standards for IT Users v3, available online at: http://www.e-skills.com/standards-and-qualifications/national-occupational-standards-nos, (from download link at bottom of page) accessed on 20/08/12
Freshminds (2008) Understanding Digital Exclusion. Department for Communities and Local Government Research Report, available online at http://www.communities.gov.uk/documents/communities/pdf/1000404.pdf, accessed on 28/03/12.
Goldstein, H. (1979). Consequences of Using the Rasch Model for Educational Assessment. British Educational Research Journal 5(2), 211 – 220, available online at: http://www.bris.ac.uk/cmm/team/hg/full-publications/1979/rasch-model-consequences.pdf, retrieved 28/03/12.
Hasluck, C. (2011) Low skills and Social Disadvantage in a Changing Economy. UK Commission for Employment and Skills, available online at: http://www.ukces.org.uk/assets/bispartners/ukces/docs/publications/equality-low-skills.pdf, accessed on 28/03/12.
Harding, C, et al (2011) 2011 Skills for Life Survey: Headline findings. Department for Business, Innovation and Skills Research Paper Number 57, available online at: http://www.bis.gov.uk/assets/biscore/further-education-skills/docs/0-9/11-1367-2011-skills-for-life-survey-findings.pdf, accessed on 28/03/12.
Harrison, G. (2010) Study to Identify How ‘Literacy’ Levels Have Developed Over Time. Department for Employment and Learning Northern Ireland, available online at: http://www.delni.gov.uk/del_ni_literacy_trends_final_report_11_02_2010_-_final_report_9_7_10-2.pdf, accessed on 28/03/12.
Helsper, E. (2008) Digital Inclusion: An Analysis of Social Disadvantage and the Information Society. Department for Communities and Local Government, available online at: http://www.communities.gov.uk/documents/communities/pdf/digitalinclusionanalysis, accessed on 28/03/12.
HM Government (March 2012) Social Justice: transforming lives, available online at: http://www.dwp.gov.uk/docs/social-justice-transforming-lives.pdf, accessed on 24/5/12.
HM Treasury (1998) Public Services for the Future: Modernisation, Reform, Accountability. Comprehensive Spending Review: Public Service Agreements 1999–2002, available online at: http://archive.treasury.gov.uk/pub/html/psa/csrpsa.pdf, accessed on 28/03/12.
387
Chapter 15: Summary of findings and conclusions
HM Treasury (2006) Leitch Review of Skills. Prosperity for All in the Global Economy - World Class Skills. Final Report, available online at: http://webarchive.nationalarchives.gov.uk/+/http://www.hm-treasury.gov.uk/media/6/4/leitch_finalreport051206.pdf, accessed on 28/03/12.
Levesley, T., J. Regan, and J. Hillage (2009) Train to Gain Learner Evaluation Report from Wave 4 Research. Learning and Skills Council Report, available online at: http://readingroom.lsc.gov.uk/lsc/National/nat-ttg_learner_eval_report_from_wave4_research-re-june2009-v1-1.pdf, accessed on 28/03/12.
Longley, P. and A. Singleton (2008) Social Deprivation and Digital Exclusion in England. UCL Working Papers Series Paper 145.
Kirsch, I. S. (2001) The International Adult Literacy Survey (IALS): Understanding What Was Measured. Educational Testing Service Research Report, available online at: http://www.ets.org/Media/Research/pdf/RR-01-25-Kirsch.pdf, accessed on 28/03/12.
Marsh, M. (2011) Numeracy Counts NIACE Committee of Inquiry on Adult Numeracy Learning Final Report, available online at: http://shop.niace.org.uk/media/catalog/product/n/u/numeracy_counts_final_report_feb_2011a.pdf, accessed on 28/03/12.
Miller, N, Lewis, K. (2011) National Survey of Adult Skills in Wales, 2010. Welsh Government social research report number 21/2011, available online at: http://new.wales.gov.uk/about/aboutresearch/social/latestresearch/5618505/?lang=en, accessed on 28/03/12.
Morris, E. (2009) Independent Review of ICT User Skills, available online at: http://www.dius.gov.uk/~/media/3F79A51589404CFDB62F3DA0DEBA69A1.ashx, accessed on 28/03/12.
Moser, C. et al. (1999) Improving literacy and numeracy: a fresh start. The report of the working group chaired by Sir Claus Moser on behalf of the Department for Education and Skills, available online at http://www.lifelonglearning.co.uk/mosergroup/index, accessed on 28/03/12.
Mullis, I. V. S., A. M. Kennedy, M. O. Martin and M. Sainsbury (2006). PIRLS 2006 Assessment Framework and Specifications. Progress in International Reading Literacy Study. Chestnut Hill, MA: Boston College. Available online at: http://timss.bc.edu/PDF/P06Framework.pdf, accessed on 28/03/12.
National Audit Office (2008) Skills for Life: Progress in Improving Adult Literacy and Numeracy, available online at: http://www.nao.org.uk/publications/0708/skills_for_life_progress_in_i.aspx, accessed on 28/03/12.
Newark-French, C. (2011) Mobile Apps Put the Web in Their Rear-view Mirror. Flurry, available online at: http://blog.flurry.com/bid/63907/ accessed on 28/03/12.
Office for National Statistics (1992) UK Standard Industrial Classification 1992, available online at: http://www.ons.gov.uk/ons/guide-method/classifications/archived-standard-classifications/uk-standard-industrial-classification-1992--sic92-/uk-standard-industrial-classification-1992.pdf, accessed on 28/03/12.
Office of Qualifications and Examinations Regulation (2010) Explaining the National Qualifications Framework, available online at: http://www.ofqual.gov.uk/qualifications-assessments/89-articles/250-explaining-the-national-qualifications-framework, accessed on 28/03/12.
388
Chapter 15: Summary of findings and conclusions
Office of Qualifications and Examinations Regulation (2011) Functional Skills Criteria for English. Entry 1, Entry 2, Entry 3, Level 1 and Level 2, available online at: http://www.ofqual.gov.uk/downloads/category/68-functional-skills-subject-criteria?download=1171%3Afunctional-skills-criteria-for-english, accessed on 28/03/12.
Office of Qualifications and Examinations Regulation (2011) Functional Skills Criteria for Mathematics Entry 1, Entry 2, Entry 3, Level 1 and Level 2, available online at: http://www.ofqual.gov.uk/downloads/category/68-functional-skills-subject-criteria?download=1173%3Afunctional-skills-criteria-for-mathematics, accessed on 28/03/12.
Office of Qualifications and Examinations Regulation (2011) Functional Skills Criteria for ICT Entry 1, Entry 2, Entry 3, Level 1 and Level 2, available online at: http://www.ofqual.gov.uk/downloads/category/68-functional-skills-subject-criteria?download=1172%3Afunctional-skills-criteria-for-ict, accessed on 28/12/12.
Office of Qualifications and Examinations Regulation (2012), Criteria for Functional Skills Qualifications, available online at http://www.ofqual.gov.uk/downloads/category/67-functional-skills-qualification-criteria, accessed on 28/03/12.
Office for Standards in Education, Children's Services and Skills (2010) The Annual Report of Her Majesty’s Chief Inspector of Education, Children’s Services and Skills 2009/10, available online at: http://www.ofsted.gov.uk/sites/default/files/documents/Ofsted%20Annual%20Report%2009-10%20-%20full%20report.pdf, accessed on 28/03/12.
Office for Standards in Education, Children's Services and Skills (2011) Tackling The Challenge Of Low Numeracy Skills In Young People And Adults, available online at: http://www.ofsted.gov.uk/sites/default/files/documents/surveys-and-good-practice/t/Tackling%20the%20challenge%20of%20low%20numeracy%20skills%20in%20young%20people%20and%20adults.pdf, accessed on 28/03/12.
Organisation for Economic Co-operation and Development (2010) PISA 2009 Results: Learning Trends: Changes in Student Performance Since 2000 (Volume V), PISA, OECD Publishing. Available online at: http://www.pisa.oecd.org/dataoecd/11/15/48852742.pdf, accessed on 28/03/12.
Organisation for Economic Co-operation and Development Statistics and Statistics Canada (2000) Literacy in the Information Age, available online at: http://www.oecd.org/dataoecd/24/21/39437980.pdf, accessed on 28/03/12.
Panayides, P., C. Robinson, C. and P. Tymms (2010) The Assessment Revolution That Has Passed England By: Rasch Measurement. British Educational Research Journal 36 (4), 611-626. Available online at: http://dro.dur.ac.uk/6405/1/6405.pdf, accessed on 28/03/12.
PIAAC Numeracy Expert Group (2009) PIAAC Numeracy: A Conceptual Framework. OECD Education Working Paper No. 35. Available online at: http://www.oecd.org/officialdocuments/displaydocumentpdf?cote=edu/wkp(2009)14&doclanguage=en, accessed on 28/03/12.
Pollard, E., P. Bates, W. Hunt and A. Bellis (2008) University is Not Just for Young People. Working Adults’ Perceptions of and Orientation to Higher Education. Department for Innovation and Skills Research Report 0806, available online at: http://www.employment-studies.co.uk/pdflibrary/dius0806.pdf, accessed on 28/03/12.
Qualifications and Curriculum Authority (2004) The Key Skills Qualifications Standards and Guidance. Communication, Application of Number and Information and Communication Technology, available
389

Chapter 15: Summary of findings and conclusions
online at: http://www.cityandguilds.com/documents/ind_general_learning_keyskills/3638_qca-stdsguidance2004_main.pdf, accessed on 28/03/12.
Qualifications and Curriculum Authority (2007) Functional Skills Standards, available online at: http://www.excellencegateway.org.uk/pdf/Functional%20skills%20standards.pdf, accessed on 28/03/12.
Qualifications and Curriculum Authority (2007) Skill for Life ICT Curriculum. Department for Education and Skills, available online at: http://archive.niace.org.uk/Research/ICT/ICT-Skill-for-Life-curriculum-Jan07.pdf, accessed on 28/03/12.
Qualifications and Curriculum Development Authority (2011) Evaluation of the Functional Skills Pilot, available online at: http://webarchive.nationalarchives.gov.uk/20110813032310/http://www.qcda.gov.uk/resources/7585.asp, pages ii, iii, accessed on 28/03/12.
Race Online 2012 (2010) Manifesto for a Networked Nation, available online at: http://raceonline2012.org/sites/default/files/resources/manifesto_for_a_networked_nation_-_race_online_2012.pdf, accessed on 28/03/12.
Reisenberger, A., D. Barton, C. Satchwell, A. Wilson, C. Law and S. Weaver (2010) Engaging Homeless, Black and Minority Ethnic and Other Priority Groups in Skills for Life. National Research and Development Centre for Adult Literacy and Numeracy Research Report, available online at: http://www.nrdc.org.uk/publications_details.asp?ID=182#, accessed on 28/03/12.
Saunders, P. (2003) Can Social Exclusion Provide a New Framework for Measuring Poverty? Social Policy Research Discussion Paper 127, available online at: http://www.sprc.unsw.edu.au/media/File/DP127.pdf, accessed on 28/03/12.
Shury, J., M. Winterbotham, K. Oldfield, M. Spilsbury, and S. Constable (2010) National Employer Skills Survey for England 2009: Main Report. UK Commission for Employment and Skills Evidence Report 23, available online at: http://www.ukces.org.uk/assets/bispartners/ukces/docs/publications/evidence-report-23-ness-main-report-2009.pdf, accessed 28/03/12.
Skills Funding Agency (2011) 2011/12 Learner Eligibility and Contribution Rules Version 2.1, available online at: http://readingroom.lsc.gov.uk/SFA/LearnerEligibilityandContributionRules_2011_12_12Aug2011__June_revision_V2.1.pdf, accessed on 22/5/12.
Snape, E., E. Tanner, R. Sinclair, J. Michaelson and S. Finsch (2006) National Adult Learning Survey (NALS) 2005. Department for Education and Skills Research Report 815, available online at: https://www.education.gov.uk/publications/eOrderingDownload/RR815.pdf, accessed on 28/03/12.
St.Clair, R., L. Tett and K. Maclachlan (2010) Scottish Survey of Adult Literacies 2009: Report of Findings. Scottish Government Research Report, available online at: http://www.scotland.gov.uk/Resource/Doc/319174/0102005.pdf, accessed on 28/03/12.
Sturgis, P., Smith, P., Hughes, G., (2006) A study of Suitable Methods for Raising Response Rates in School Surveys. Department for Education and Skills, available online at: https://www.education.gov.uk/publications/eOrderingDownload/RR721.pdf, accessed on 06/08/12.
Teaching and Learning Research Programme (2007) Policy, learning and inclusion in the learning and skills section. Research Briefing Number 28, available online at:
390
Chapter 15: Summary of findings and conclusions
http://www.tlrp.org/pub/documents/Coffield%20RB%2028%20FINAL.pdf, accessed on 28/03/12.
The Data Service (June 2012) Quarterly Statistical First Release Post-16 Education & Skills: Learner Participation, Outcomes and Level of Highest Qualification Held. Available online at: http://www.thedataservice.org.uk/statistics/statisticalfirstrelease/sfr_current/, accessed on 25/09/12. Note that the June 2012 is only ‘currrent’ for one quarter, after which it will be stored in the SFR archive, available at: http://www.thedataservice.org.uk/statistics/statisticalfirstrelease/sfr_archive/, accessed on 25/09/12.
Townsend, P. (1979) Poverty in the United Kingdom. Harmondsworth: Penguin.
Tyers, C. and A. Sinclair (2005) Intermediate impacts of Advice and Guidance. Department for Education and Skills Research Report 638, available online at: https://www.education.gov.uk/publications/eOrderingDownload/RR638.pdf, accessed on 28/03/12.
Vickers, D. and P. Rees (2006) Methodology Used for Producing ONS’s Small Area Population Estimates. The Office for National Statistics, Population Trends 125 (Autumn 2006), available online at: http://www.ons.gov.uk/ons/rel/population-trends-rd/population-trends/no--125--autumn-2006/population-trends-pt3.pdf, accessed on 28/03/12.
Welsh Government Statistical Release (2011) National Survey of Adult Skills in Wales, 2010. Statistical Directorate Report 119/201, available online at http://wales.gov.uk/docs/statistics/2011/110713sdr1192011en.pdf, accessed on 28/03/12.
Williams, J., S. Clemens, S. Oleinikova, and K. Tarvin (2003) The Skills for Life Survey: a National Needs and Impact Survey of Literacy, Numeracy and ICT skills. Department for Education and Skills Research Report 490, available online at: https://www.education.gov.uk/publications/standard/publicationDetail/Page1/RR490, accessed on 28/03/12.
Williams, J. and R. Kinnaird (2004) The national survey of Adult Basic Skills in Wales, available online at: http://www.learningobservatory.com/uploads/publications/1943.pdf, accessed on 18/06/12.
Williams, S. and A. Botterill (2006) Profiling Areas Using the Output Area Classification. Office for National Statistics, Regional Trends 39.
Williams, M. (2011) Internet Access Quarterly Update 2011 Q1. Office for National Statistics, available online at: http://www.ons.gov.uk/ons/dcp171766_241030.pdf, accessed on 28/03/12.
Wolf, A. et al. (2009) Enhancing 'Skills for Life': Adult Basic Skills and Workplace Learning: Full Research Report, ESRC End of Award Report, available online at: http://www.thelearningchain.net/Enhancing%20SfL%20Adult%20Basic%20Skills%20and%20Workplace%20Learning%20FULL%20REPORT.pdf, accessed on 18/06/12.
391
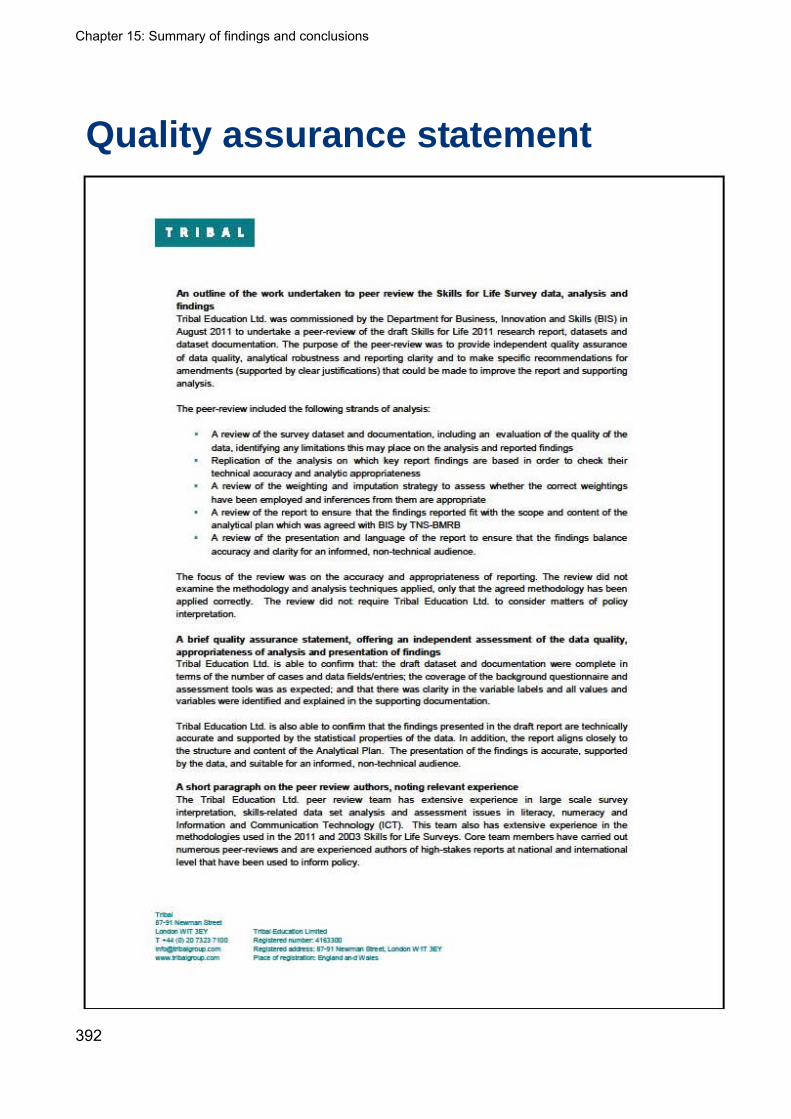
Chapter 15: Summary of findings and conclusions
Quality assurance statement
TRIBAL
An outline of t:he work undertake-n to peer review the Skills for Life Surwy data. OW'Ialysis and findings Tribal Education Ltd. was commissioned by the Department foe Business, Innovation and Skills {BIS) in August 201 1 to undertake a peer~ew of the draft Skills for life 2011 reseateh report, datasets and dataset docomentation. The purpose of the pe«-review was to provide independent quality assurance
of dais quafrty, anafytical robustness and reporting clarity and to make specific recommendations for amendments (supported by clear justifications) that coukf be made to improve the report and supporting
aRalysts.
The peer-review induded the following strands of analysis:
A review of the survey dabset and documentation, induding an evaluation d the quality d the data. identifying any limUtions this may place on the analysis and reported findings Replication of the an.afysis on wtich key report findings are based in ordef- to check their technical accuracy and analytic appropriateness A review of the weighting and imputation strategy to assess whether the corTec:t weightings
have been employed and inferences from them are appropriate A review of the report to ensure that the findings reported fit with the scope and oonteoi of the analytical plan which was agreed with BIS by TNS-BMRS
A rE!View of the presentation and language of the report to ensure that the findings balance aocuracy and darity for an infon'ned, non-technical aucfenoe.
The focus of the review was on the acctJracy and appropriateness of reporting. The review did not examine the methodology and analysis t echniques applied. onty that the agreed methodology has been applied correctly. The review did not require Tribal Education Ltd. to consider matters of policy
interp(etation.
A brief quality assurance statement, offering an independent assessment of the data quality, appropriateness of aN.Iysis and presentation of findings Tribal Education Ltd. is able to confinn that: the draft dataset and documentation 'NIM"e complete in
tenns of the m.m ber of cases and data fields/entries: the coverage of the ba<;:i(ground questionnaire and assessment tools was as expected: and that there was d arity in the variable labels and all values and variables were identified and explained in the supporting documentation.
Tribal Education Ud. is also able to ooofinn tnat the findings presented in the draft report are technically aocurate and supported by the statisticad properties of the data. In addition. the report aligns closely to the structure and content of the Analytical Plan. The presentation of the findings is aocurate. supported
by the data. and suitable for an irtonned, non-technical audience.
A short paragraph on the peer review authors, noting relevant experience The Tribal Education Ltd. peer review team has extensive experience in large scale survey interptetatioo, skits-related data set analysis and assessment issues in riteracy, runeracy and lnfonnation and Communication Techrlo4ogy (ICT). Tljs team also has exteosive experience in the methodologies used in the 2011 and 2003 Ski ls fOI' Life Surveys. Core team mem.bers have carried out numerous peer-reviews and are experienced authors of high-stakes reports at national and intemational level that have beeo used ao inform poicy.
--T-117·91 Ntw!'NI'I Slrnt l.oaOon. WIT !EY Tilt* ~on U!MI:CI T *'"(O'P07l2l7100 Roegi~IIUfl'ltlet:~1&3llll
A<eg!Sllmel ~ 8Hl ~ Snd.l«lcc::n W1T lEY -.~lgrl:qi..((II'SI Pl:!la:GI~~II!Id .., OWelel:
392

Chapter 15: Summary of findings and conclusions
393
© Crown copyright 2012
You may re-use this information (not including logos) free of charge in any format or medium, under the terms of the Open Government Licence. Visit www.nationalarchives.gov.uk/doc/open-government-licence, write to the Information Policy Team, The National Archives, Kew, London TW9 4DU, or email: [email protected].
This publication is also available on our website at www.bis.gov.uk
Any enquiries regarding this publication should be sent to: Department for Business, Innovation and Skills 1 Victoria Street London SW1H 0ET Tel: 020 7215 5000 If you require this publication in an alternative format, email [email protected], or call 020 7215 5000. URN 12/P168