Embed Size (px)
Citation preview
WORKING PAPER
Financial Literacy and Consumer Choice of Health Insurance
Evidence from Low-Income Populations in the United States
Sebastian Bauhoff, Katherine Grace Carman, and Amelie Wuppermann
RAND Labor & Population RAND The Bing Center
WR-1013 August 2013 This paper series made possible by the NIA funded RAND Center for the Study of Aging (P30AG012815) and the NICHD funded RAND Population Research Center (R24HD050906).
RAND working papers are intended to share researchers’ latest findings and to solicit informal peer review. They have been approved for circulation by RAND Labor and Population but have not been formally edited or peer reviewed. Unless otherwise indicated, working papers can be quoted and cited without permission of the author, provided the source is clearly referred to as a working paper. RAND’s publications do not necessarily reflect the opinions of its research clients and sponsors. RAND® is a registered trademark.

1
Title: “Financial Literacy and Consumer Choice of Health Insurance: Evidence from Low-Income Populations in the United States”
Short Title: “Financial Literacy and Choice of Health Insurance”
Words including abstract/notes but not tables/figures: 2,414
Corresponding authorSebastian Bauhoff, Ph.D.Associate EconomistRAND Corporation1200 South Hayes StreetArlington, VA 22202(703) 413-1100 ext. [email protected]
Co-authorsKatherine Grace Carman, Ph.D.EconomistRAND Corporation1776 Main StreetSanta Monica, CA 90401(310) 393-0411 ext. [email protected]
Amelie Wuppermann, Ph.D.Assistant ProfessorDepartment of EconomicsLudwig-Maximilians-University, Munich80539 MunichGermany+49 (89) 2180 [email protected]
Funding supportThis study was supported by the RAND Roybal Center for Financial Decisionmaking and the RAND Bing Center for Health Economics.

2
“Low Financial Literacy May Counteract Benefits of Consumer
Choice of Health Insurance: Evidence from Low-Income Populations
in the United States”
Abstract
Under the U.S. Affordable Care Act (ACA), many low income
consumers will become eligible for government support to buy
health insurance. Whether these consumers are able to take
advantage of the support and to make sound decisions about
purchasing health insurance will likely depend on their
knowledge and skills in navigating complex financial products.
This ability is frequently referred to as “financial literacy”.
We examined the level and distribution of consumers’ financial
literacy across income groups, using 2012 data collected in the
RAND American Life Panel, an internet panel representative of
the U.S. population. Financial illiteracy was particularly
prevalent among individuals with incomes between 100-400% of the
Federal Poverty Line, many of whom will be eligible for
subsidies. In this group, the young, less educated, females,
and those with less income were more likely to have low
financial literacy. Our findings suggest the need for targeted
policies to support vulnerable consumers in making good choices
for themselves, possibly above and beyond the support measures
already planned for in the ACA.

3
INTRODUCTION
With the implementation of the Affordable Care Act (ACA),
millions of Americans will need to make a high-stakes financial
decision: choosing appropriate health insurance. The ACA
includes incentives for individuals to take up health insurance,
including an individual mandate with penalties for
noncompliance, subsidies for low-income households, and the
health insurance exchanges as new marketplaces where individuals
can compare and shop for insurance.
The ability of consumers to understand and navigate the new
environment, and the rules and regulations, is critical to the
intended functioning of U.S. health care reform. This ability
is particularly important for low-income households who may be
affected by the penalty and subsidy, and may be likely to obtain
their coverage through the insurance exchanges. In particular,
the penalty is the higher of a flat fee or a percent of income
($95 or 1% of income in 2014), and households with low incomes
are more likely to incur the flat-fee – implying that their
penalty is large relative to their income.
Similarly, government support is targeted at consumers with
relatively low household incomes (between 100 and 400% of the

4
Federal Poverty Line, FPL, or $23,550 to $94,200 annually for a
family of four in 2013). These consumers may be eligible to
receive premium tax credits and cost-sharing subsidies that are
phased out over this income range. Subsidy-eligible consumers
who have access to health insurance through their employer will
further have to be able to assess whether switching to a plan in
the health insurance exchange will be more or less beneficial
than staying with their old coverage and thus foregoing
subsidies. These calculations will depend on the available
income as well as on family size and available health insurance
plans.(1) Experience with other government entitlements, such as
Medicaid and the Earned Income Tax Credit, suggest that many
eligible households may not take up the subsidies.(2)
In addition to navigating the penalty and subsidy schedules,
health plan choice itself may be confusing for consumers. Many
have little experience and proficiency with selecting health
insurance, a choice of a multidimensional product that requires
understanding deductibles, co-payments, out-of-pocket limits and
other complex attributes and making trade-offs between these
attributes. Experience is limited even among those individuals
who currently have health insurance through their employer as
many of those select their coverage from a limited menu of
employer-sponsored plans: in 2012, more than 80% of firms

5
offered only one type of plan.(3) The insurance mandate and
potential penalties make it costly not to purchase health
insurance, while potential access to subsidies adds to the
complexity of choice. Research on employer-sponsored health
insurance and Medicare suggests that individuals consistently
overpay for health insurance as they give unmerited weight to
some plan attributes in their initial choice or do not switch as
better choices become available.(4,5) In one employer-based
setting, about one-third of workers were enrolled in a plan that
was unambiguously worse than available alternative plans.(6)
Under the ACA, the health insurance exchanges will offer active
consumer guidance (navigators, help lines) and passive support
(tiers by actuarial value, explanations, etc.) to assist
consumers in choosing appropriate coverage. However, comparing
and selecting plans can remain a daunting task. The role model
for the insurance exchanges, the Massachusetts Connector, offers
plans in three high-level tiers of actuarial value (bronze,
silver, gold; the ACA adds a fourth tier, platinum). These are
further divided into three groups each (low, medium, high) and
the Connector screens plans that participate in the program by
awarding its “Seal of Approval”. Evidence of choices in the
Connector suggests that consumers struggle to make good choices
even in a supportive setting and may use overly simplistic
6
heuristics to guide their decisions.(7,8) Qualitative work and
small-scale experiments indicate the relevance of these concerns
to the exchanges.(9,10)
Successfully navigating the penalties, subsidies, and health
insurance choices requires sufficient understanding of complex
financial relationships. As recognized in research on related
areas of financial decision-making, consumers often lack the
understanding, ability and confidence to make financial choices
that are in their best interest.(11) Consumers’ financial
literacy, “the ability to use knowledge and skills to manage
financial resources effectively for a lifetime of financial
well-being”(12), has been found to be critical to decisions in
areas such as retirement planning, investing and debt.(11,13)
Financial literacy may also be critical to achieving many of the
coverage objectives of the ACA because the decision to purchase
insurance or not will depend on financial penalties and
subsidies and the choice of a plan will in part depend on
expected costs. To shed light on consumers’ ability to navigate
the ACA and understand subsidy eligibility and financial
consequences of foregoing health insurance, we examined the
distribution of a measure of general financial literacy.

7
DATA AND ANALYSIS
To measure financial literacy we used data from the RAND
American Life Panel (ALP), a population-representative online
panel. The ALP includes about 6,000 civilian, non-
institutionalized individuals ages 18 and older who are
reimbursed for their participation in the panel and are provided
with a computer and internet access if not already available
(https://mmicdata.rand.org/alp/). Sample weights are provided
to correct for remaining selectivity and allow population
inference using benchmark distributions from the Current
Population Survey (CPS). Since 2006 the ALP has supported a
wide range of research studies. We combined individual
responses to questions on insurance status in ALP survey 192
(fielded to 4,924 people in March to June 2012 with a response
rate of 76%) with the same respondents’ answers to questions on
financial literacy recorded in ALP survey 243 (fielded to 4,643
people in March and April 2012 with a response rate of 71%; the
financial literacy questions are described below.) The joint
response rate for these two surveys was 63%. We used
information on household income and size to express income as
percent of the FPL, which will be used to determine federal
subsidies under the ACA. We excluded respondents with a
reported income above 1,000% of the FPL ($230,500 for a family
of four in 2012) as well as individuals aged 65 and older.

8
These groups are unlikely to be directly affected by the policy
changes. Table 1 shows the distribution of ALP respondents in
our study sample. Among those with incomes between 100-400% of
FPL, 30% (261 of 868) were uninsured. The uninsured had lower
educational attainment and income and were less likely to be
employed and working than the insured. They also had relatively
lower scores on the financial literacy questions, although this
difference was not statistically significant.
We employed general measures of financial literacy since, to our
knowledge, there are no validated measures of financial literacy
in the context of health insurance. General financial literacy
focuses on domains such as numeracy, understanding of compound
interest and inflation, as well as risk diversification and
investing.(11) The associated measures were developed primarily
in the context of saving and planning for the future. We used a
widely used set of three questions on numeracy, inflation, and
risk diversification that are shown in Table 2. The questions
were designed to assess knowledge of basic concepts of finance.
As these measures have been developed in the context of savings
and portfolio choice,(11) they do not map perfectly to the
choice of health insurance. However, measures of general
financial literacy will likely capture individuals’ comfort with

9
complex financial products, which could affect choices about not
only saving and investing but also products like health
insurance.
We constructed an index of financial literacy from these three
questions by counting the number of correct responses for each
individual, as is typically done in the financial literacy
literature. The bottom panel of Table 1 shows the individual
components of the index. There was a moderate correlation
between the answers to the individual financial literacy
questions: the correlation coefficients between the answers to
questions 1 and 2, 1 and 3, and 2 and 3 were 0.23, 0.18, and
0.33, respectively.
Our analysis has several potential weaknesses. First, our
measures of financial literacy are not specific to health
insurance and, as a result, may miss important concepts that are
relevant to consumers’ abilities to choose. Our measures do not
test for respondents’ understanding of insurance terminology,
such as deductibles, cost-sharing and copayments nor of drug
tiers and in/out of network care. Given the added complexity of
health insurance, our measure of financial literacy may
therefore not capture the true level of “financial literacy in

10
health insurance.” However, basic financial literacy is likely
important to understanding the financial consequences, such as
penalties and subsidies, of the decision to purchase health
insurance or forgo coverage under the ACA. Second, this
analysis focused on an online panel that, while representative
of the U.S. population, may not precisely reflect the population
that will be required to make choices under the ACA. As incomes
fluctuate especially for lower-income households, some of the
respondents between 100-400% of the FPL will be eligible for
Medicaid while others may exceed the subsidy eligibility
threshold in 2014.(14) Nevertheless, households that are
eligible at the time the program is implemented are likely to be
similar to those who would have been eligible had the program
been implemented at the time of data collection. Many
households may also have access to employer-sponsored insurance
and hence select from a more limited, preselected menu of plans.
However, even these households will have to decide if they are
better off in the exchanges where they could receive government
subsidies. Third, we could not identify in the ALP whether
respondents were dependents who could be covered under their
parents’ policy. However, our results were comparable when
excluding respondents younger than 26 years. Fourth, income in
the ALP is self-reported and interval-coded (<$5,000, $5,000-
$7,499, $7,500-$9,999, etc.). We took the center of each income

11
interval to construct income in percent of the FPL. Our results
were robust to using either the upper or the lower bound of the
intervals. Finally, the surveys we used for the empirical
analysis had a joint response rate of 63%, and those who did not
respond may have differed from the respondents. However, the
statistical weights ensured that our sample remained
representative for the U.S. population based on observable
characteristics.
RESULTS
On average, respondents in the 100-400% FPL sample answered 1.9
of the three financial literacy questions correctly, while
respondents with income between 400-1000% of FPL answered on
average 2.4 questions correctly (Table 1). This difference was
statistically significant (p-value<0.001). Across all groups of
individuals in our sample the numeracy question had the highest
score. Those who did not have health insurance performed worse
on all measures of financial literacy, although the differences
were not statistically significant.
Differences by income group
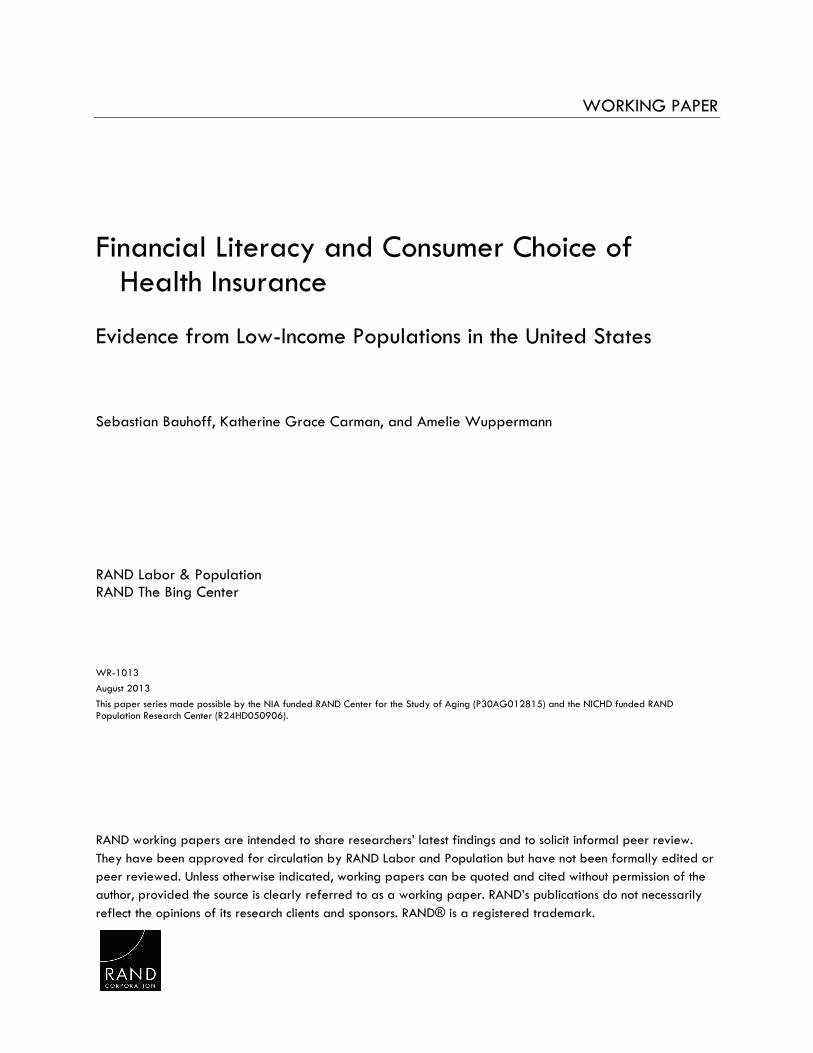
Figure 1 plots the financial literacy index and its three
components for groups at different income levels. The figure

12
indicates that general financial literacy increased with income
and that this increase flattened out for incomes above 400% of
the FPL. Financial literacy was particularly low for the
population eligible to receive subsidies and most likely to
enroll in the exchanges (incomes between 100 and 400% of the
FPL, as measured in 2012). The empirical pattern suggests that
these individuals may have difficulties in responding to the
opportunities and requirements of the ACA. The individual
components of the index had similar patterns as the overall
index.
Characteristics of those with limited financial literacy
Table 3 focuses on individuals with incomes between 100% and
400% of the FPL and compares those with lower levels of
financial literacy (0 or 1 question answered correctly) to those
with higher levels of financial literacy (2 or 3 questions
answered correctly). The young, less educated, women, and
individuals with low income were more likely to have low
financial literacy. Furthermore, individuals who did not report
having health insurance were more likely to have low financial
literacy. The difference, however, was not statistically
significant (p-value 0.13). In multivariate regression age,
sex, education and income remained the only statistically

13
significant predictors of low financial literacy (see Appendix
Table 1).
CONCLUSION
The ACA’s penalties, subsidies and health plan choice require
consumers to understand and make complex financial decisions
with potentially significant consequences. Using nationally
representative data to document levels of financial literacy by
income as a percent of FPL, we found that financial literacy
increased with income and was lowest among individuals with
income less than 400% of the FPL. Although the ACA provides
this group with subsidies to purchase insurance, their low
levels of financial literacy may impede the uptake of this
support and, ultimately, reduce the benefits of the ACA to these
consumers.
Financial literacy is low in the population most likely to face
complex choices of health insurance under the ACA. Consumers
with low financial literacy may not fully understand the
potential financial consequences of foregoing insurance and may
not reap the full benefits of available government support to
obtain coverage. Furthermore, they might struggle to
discriminate among different plans and may ultimately select a
plan that does not best fit their interests.
14
In addition to the important benefits for individuals’ welfare,
supporting consumers in making their choices could drive down
premiums and thus reduce government spending on the premium tax
credit, as the latter is tied to market premiums.
Targeted tracking and improving of consumers’ financial
literacy may be a cost-effective policy with significant
benefits for consumers. Consumer decision-support tools in
particular may be critical to the success of the ACA. These
tools need to accommodate the needs of all consumers, including
those with low financial literacy.
15
NOTES
1. CBO. CBO and JCT’s Estimates of the Effects of the Affordable Care Act on the Number of People Obtaining Employment-BasedHealth Insurance [Internet]. Congressional Budget Office; 2012. Available from: http://cbo.gov/sites/default/files/cbofiles/attachments/03-15-ACA_and_Insurance_2.pdf
2. Sommers B, Kronick R, Finegold K, Po R, Schwartz K, Glied S. Understanding Participation Rates in Medicaid: Implications for the Affordable Care Act. Assistant Secretary for Planning and Evaluation; U.S. Department of Health and Human Services; 2012. ASPE Issue Brief.
3. KFF/HRET. Kaiser/HRET Employer Health Benefits Survey. Kaiser Family Foundation; 2012.
4. Abaluck J, Gruber J. Heterogeneity in Choice Inconsistencies among the Elderly: Evidence from Prescription Drug Plan Choice. American Economic Review. 2011;101(3):377–81.
5. Heiss F, Leive A, McFadden D, Winter J. Plan Selection in Medicare Part D: Evidence from Administrative Data. NBER Working Paper. 2012;18166.
6. Sinaiko AD, Hirth RA. Consumers, health insurance and dominated choices. Journal of Health Economics. 2011 Mar;30(2):450–7.
7. Sinaiko AD, Ross-Degnan D, Soumerai SB, Lieu T, Galbraith A. The Experience Of Massachusetts Shows That Consumers Will Need Help In Navigating Insurance Exchanges. Health Aff. 2013 Jan 1;32(1):78–86.
8. Ericson K, Starc A. Heuristics and Heterogeneity in Health Insurance Exchanges: Evidence from the Massachusetts Connector. American Economic Review: Papers & Proceedings. 2012;102(3):493–7.
9. PBGH. Consumer Choice of Health Plan Decision Support Rules for Exchanges, Installments 1, 2 and 3 [Internet]. 2012. Available from: http://www.pbgh.org/news-and-publications/pbgh-articles-a-publications

16
10. Consumers Union. What’s Behind the Door: Consumers’ Difficulties Selecting Health Plans. Consumers Union; 2012.
11. Lusardi A, Mitchell OS. Financial literacy around the world: an overview. Journal of Pension Economics and Finance. 2011;10(04):497–508.
12. PACFL. 2008 Annual Report to the President. President’s Advisory Council on Financial Literacy; 2008.
13. Moore D. Survey of Financial Literacy in Washington State: Knowledge, Behavior, Attitudes, and Experiences. Social and Economic Sciences Research Center; Washington State University; 2003. Technical Report 03-39.
14. Sommers BD, Rosenbaum S. Issues In Health Reform: How Changes In Eligibility May Move Millions Back And Forth Between Medicaid And Insurance Exchanges. Health Aff. 2011 Feb 1;30(2):228–36.

17
List of tables and figures (in order)
Table 1: Descriptive statistics of ALP sample. Table, source: ALP
Table 2: Financial Literacy Questions in ALP. Table, source:ALP
Figure 1: Financial Literacy by Income Group. Figure, source: ALP
Table 3: Characteristics of respondents by score on the financial literacy questions. Table, source: ALP
Appendix Table 1: Linear Probability Model of Low Financial Literacy. Table, source: ALP

18
Figure 1: Financial Literacy by Income Group

19
Table 1: Descriptive statistics of ALP sampleWholeSample 100-400% FPL
All Uninsured InsuredMean SD Mean SD Mean SD Mean SD
Age (years) 41.6 11.5 40.5 11.2 39.2 11.2 41.2 11.1Female (%) 51.2 50.0 49.5 50.0 51.4 48.9 48.6 50.5Married (%) 63.4 48.2 59.7 49.1 58.7 48.2 60.1 49.5Race (%)
White 74.0 43.9 73.4 44.2 62.4 47.4 78.4 41.6Ethnicity (%)
Hispanic 23.0 42.1 25.7 43.7 32.2 45.7 22.8 42.4Education (%)
High School 47.3 49.9 50.6 50.0 54.3 48.8 48.9 50.5Some College 29.0 45.4 32.8 47.0 36.2 47.0 31.3 46.9BA or equiv. 23.8 42.6 16.6 37.2 9.5 28.6 19.9 40.3
Income (% FPL) 318.1 225.1 227.5 82.7 190.8 69.2 244.3 83.2Working 64.6 47.9 66.0 47.4 49.6 48.9 73.6 44.6Employed 58.5 49.3 61.3 48.7 42.7 48.4 69.8 46.4Financial Literacy (FL)
FL Index 1.99 0.97 1.91 0.96 1.81 0.90 1.95 0.98Numeracy 0.82 0.38 0.80 0.40 0.77 0.41 0.82 0.39Inflation 0.64 0.48 0.61 0.49 0.60 0.48 0.62 0.49Risk
Diversification 0.53 0.50 0.49 0.50 0.44 0.49 0.52 0.50
N 1898 868 261 607Notes: Based on ALP survey MS 243, individuals aged 18-64 with income of maximal 1000% of FPL, excluding snowball sample and individuals with missing information on relevant individual or household characteristics. Measure of health insurance comes from ALP survey 192. Raking weights are used to correct for sample selection.

20
Table 2: Financial Literacy Questions in ALP (* indicates the correct answer)
1. Numeracy: Suppose you had $100 in a savings account and the interest rate was 2% per year. After 5 years, how much do you think you would have in the account if you left the money to grow?
1 More than $102*2 Exactly $1023 Less than $1024 Don't know
2. Inflation: Imagine that the interest rate on your savings account was 1% per year and inflation was 2% per year. After 1 year, would you be able to buy:
1 More than today2 Exactly the same as today3 Less than today*4 Don't know
3. Risk Diversification: Please tell us whether this statement is true or false. Buying a single company stock usually provides a safer return than a stock mutual fund.
1 True2 False*3 Don't know
Source: ALP.

21
Table 3: Characteristics of respondents by score on the financial literacy questions
Financial Literacy Questions0-1 correct 2-3 correct
Mean SD Mean SD Difference
p-value
Age (years) 37.5 8.9 42.0 12.0 -4.5 <0.001Female (%) 58.5 44.0 45.0 52.2 13.6 0.03Married (%) 57.3 44.2 60.8 51.3 -3.5 0.55Race (%)
White 69.2 41.2 75.5 45.2 -6.2 0.21Ethnicity (%)
Hispanic 33.7 42.2 21.8 43.3 11.9 0.02Education (%)
High School 65.2 42.5 43.3 52.0 21.9 <0.001Some College 23.9 38.1 37.3 50.8 -13.4BA or more 10.9 27.8 19.4 41.5 -8.5
Income (% FPL) 204.8 71.8 238.8 85.5 -34.0 <0.001Working (%) 66.0 42.3 66.0 49.7 -0.1 0.99Employed (%) 61.0 43.5 61.4 51.1 -0.4 0.94Insured (%) 62.9 43.1 71.4 47.5 -8.5 0.13N 229 639Notes: Individuals with income between 100-400% of FPL, weighted. p-values are displayed for testing hypotheses that the differences in means are equal to 0 using t-tests for all items except for education where Pearson’s chi2 test was used. Source: authors’ calculations using ALP.

22
Appendix
Table 1: Linear Probability Model of Low Financial Literacy
Coefficient t-statistic
Age -0.008*** (-3.79)Female 0.183*** (4.13)Married -0.041 (-0.85)White -0.021 (-0.41)Hispanic 0.096 (1.63)Some College -0.224*** (-4.49)BA or more -0.215*** (-3.82)Income (100 % FPL) -0.396** (-2.29)Income squared 0.065* (1.82)Working 0.075 (0.70)Employed -0.085 (-0.80)Insured 0.012 (0.22)N 868R2 0.158* p<.1, ** p<.05, *** p<.01
Notes: t-statistics in parenthesis. Coefficients of linear probability model displayed with indicator for low financial literacy (zero or one questions answered correctly) as dependent variable. Model incorporates weights to adjust to US population. t-statistics are based on heteroskedasticity robust Huber-White standard errors.