Embed Size (px)
Citation preview
Financial Integration and Rebalancing in Asia
Runchana Pongsaparn and Olaf Unteroberdoerster
WP/11/243

© 2011 International Monetary Fund WP/11/243
IMF Working Paper
Asia and Pacific Department
Financial Integration and Rebalancing in Asia
Prepared by Runchana Pongsaparn and Olaf Unteroberdoerster1
Authorized for distribution by Roberto Cardarelli
October 2011
Abstract
JEL Classification Numbers: E29; E44; G00
Keywords: Financial Integration; Financial Development; Rebalancing; Asia;
Author’s E-Mail Address: [email protected]; [email protected]
1 Section II.B builds on data and analysis prepared by Nujin Prasertsom under an IMF internship project, entitled: Assessment of Global and Regional Financial Integration in Asia. We thank Lesa Yee for formatting the paper.
This Working Paper should not be reported as representing the views of the IMF. The views expressed in this Working Paper are those of the author(s) and do not necessarily represent those of the IMF or IMF policy. Working Papers describe research in progress by the author(s) and are published to elicit comments and to further debate.
The paper shows that Asia’s degree of financial integration, both with the world and within the region remains low by various measures. The paper also provides empirical evidence that greater financial integration can support economic rebalancing in statistically meaningful ways. The implication is that in the debate on managing capital inflows the longer-term benefits of financial openness for broader-based growth should not be forgotten.
Contents Page I. Introduction ......................................................................................................................... 5
II. Measuring Financial Integration………………………………………………. ............. ...6
A. Literature Review ........................................................................................................... 6
B. Trends in Cross-Border Direct and Portfolio Investment, and Banking ........................ 7
C. Is Financial Integration in Asia Lagging? .................................................................... 15
D. Capital Account Restrictions, Financial Development, and Financial Integration ...... 21 III. Asia Rebalancing: A Role for Financial Integration? ....................................................... 24
A. The Link between Financial Integration and Rebalancing .......................................... 24
B. Empirical Estimates...................................................................................................... 25
IV. Conclusion ........................................................................................................................ 28 References ............................................................................................................................... 29 Figures
1. Total Portfolio Investment Liabilities by Region ............................................................... 9
2. Total Portfolio Investment Assets by Region ..................................................................... 9
3. Total Portfolio Investment Liabilities to GDP by Region .................................................. 9
4. Total Portfolio Investment Assets to GDP by Region ........................................................ 9
5. Source of Portfolio Investment Liabilities (average 2004–07) ........................................... 9
6. Destination of Portfolio Investment Assets (average 2004–07) ......................................... 9
7. Source of Regional Portfolio Investment Liabilities (average 2004–07) ......................... 10
8. Contribution to year-on-year Growth of Total Portfolio Investment Liabilities .............. 11
9. Regional and Non-regional Sources of Portfolio Investment Liabilities (Corrected for
Financial Center Intermediary) ..................................................................................... 11
10. Debt and Equity Portfolio Investment Liabilities to GDP ................................................ 11
11. Total Foreign Direct Investment Inflows by Region ........................................................ 12
12. Total Foreign Direct Investment Outflows by Region ..................................................... 12
13. Total Foreign Direct Investment Inflows to GDP by Region ........................................... 12
14. Total Foreign Direct Investment Outflows to GDP by Region ........................................ 12
15. Sources of FDI Inflows (as of 2007)................................................................................. 12
4
16. Destinations of FDI Outflows (as of 2007)....................................................................... 12
17. Sources of Regional FDI Inflows (as of 2007) ................................................................. 13
18. Total Liabilities vis-à-vis Reporting Banks ...................................................................... 14
19. Total Assets vis-à-vis Reporting Banks ............................................................................ 14
20. Total Liabilities vis-à-vis Reporting Banks to GDP ......................................................... 14
21. Total Assets vis-à-vis Reporting Banks to GDP ............................................................... 14
22. z score for Financial Integration (average 2004–07) ........................................................ 16
23. Trade Intensity (average 2004–07) ................................................................................... 17
24. Portfolio Investment Intensity (average 2004–07) ........................................................... 17
25. FDI Intensity (average 2004–07) ...................................................................................... 17
26. Banking Intensity (average 2004–07) ............................................................................... 17
27. Trade and Financial Intensity ............................................................................................ 18
28. Country-specific Factors (Fixed Effects) of Financial Integration Equation .................... 19
29. Capital Restrictions and Trade to Financial Intensity Ratio ............................................. 21
30. Capital Restriction Indices (as of 2005) ............................................................................ 22
31. Liabilities and Assets to GDP by Type (Asia excluding Financial Centers) .................... 22
32. Capital Restriction Indices (Asia excluding financial centers) ......................................... 22
33. Domestic Financial Reform and Capital Restriction Index .............................................. 23
34. Financial Reform Index and Private Sector Credit to GDP .............................................. 24
35. Financial Integration and Financial Development ............................................................ 24
36. Current Account to GDP by Region ................................................................................. 25
37. Change in CA to GDP due to Increase of Financial Integration to Global Norm ............ 28 Tables
1. Estimation of Financial Integration .................................................................................. 19
2. Estimation of Portfolio Gravity Model ............................................................................. 20
3. Comparing the Degree of Portfolio Integration ................................................................ 22
4. Macroprudential Measures in Asia ................................................................................... 23
5. Estimation of Augmented Macroeconomic Balance Approach ........................................ 27

5
I. INTRODUCTION
The global financial crisis of 2008 and subsequent Great Recession have highlighted Asia’s dependence on demand from outside the region as an engine of growth. This paper sets out to show how further financial integration in Asia can help the region achieve more broad-based and resilient growth. While the need for rebalancing Asia’s growth has been extensively discussed, and there is also a large body of work on financial development and integration in Asia, the link between the two has been subject to relatively little analysis and debate so far. Against this background, the paper focuses on the following questions: (i) How financially integrated are Asian economies, both outside and inside the region? (ii) What would be the impact on rebalancing of greater financial integration in Asia?
To address these questions we will first discuss various approaches to measuring financial integration in Asia. In addition to reviewing major trends of financial integration, we will assess the degree to which Asian economies are financially integrated compared with benchmarks, such as averages for other world regions or model-based norms which account for country characteristics. In doing so, we will also analyze the determinants of financial integration. This will be followed by a discussion of channels through which further financial integration can foster economic rebalancing across the region, for example by providing underserved households and firms better access to financial services and thus boosting low consumption or investment. Finally, the beneficial role of greater financial integration for rebalancing will be tested empirically.
Our findings can be summarized as follows: both simple stock-staking and model-based quantitative analysis provide evidence of Asia’s relatively low degree of financial integration. Furthermore, our findings suggest that Asian economies tend to be more financially integrated with economies outside the region than inside, particularly with regard to portfolio investment. To some extent, the low degree of financial integration can be accounted for by capital restrictions, which, indirectly, also inhibit overall financial development. Yet, more financial integration can foster economic rebalancing in a significant way. If the degree of financial integration of Asia were to increase to a level implied by its trade integration, current account surpluses in the region would fall by about 1 percent of GDP on average.
The main policy implications of the paper are that further financial integration of Asian economies, both globally and regionally, should be pursued to strengthen Asia’s domestic sources of growth and improve the region’s economic resilience. With pressures rising in recent years for adopting measures to limit volatile capital inflows, these longer-term benefits of financial integration for the Asia region should not be forgotten. In other words, capital flows and financial integration should be viewed as an opportunity to start correcting growth imbalances. Policies are needed that improve the allocation of capital (both domestic and foreign) and are conducive to harnessing more long-term stable inflows, for example by lowering remaining restrictions on foreign direct investment, promoting private-public

6
partnerships for much needed infrastructure investment, or enhancing the financial infrastructure, including for smaller and service-oriented firms which remain credit-constrained.
II. MEASURING FINANCIAL INTEGRATION
A. Literature Review
The literature offers no single and generally accepted definition and measurement of financial integration. Nevertheless, the term financial integration typically encompasses financial openness, free cross-border movement of capital and integration of financial services.2 Many studies relate financial integration to the law of one price, where assets of similar risk and return profiles should be identically priced. Other studies focus on the institutional development towards the creation of a single market. For example, according to a European Central Bank (ECB) study, a market is fully integrated if all potential market participants face a single set of rules, have equal access to instruments and services and treated equally when they are active in the market. 3 In a broader context, prevailing differentiation in financial regulations and preferential treatments may serve as impediments to cross-border transactions. Nevertheless, countries with comparable regulatory settings may not necessarily have the same degree of financial integration, given that other factors such as relative economic prospects and trade linkages also play a role in determining financial integration.
The measurement of financial integration thus depends on how financial integration is defined. Broadly speaking, financial integration measurement can be categorized into two main types: price-based and quantity-based measures.4 Quantity-based measures are closely related to the notion of financial openness and cross-border movement of capital while price-based measures are essentially a test of the law-of-one-price hypothesis.
Quantity-based measures are typically simple ratios intended to capture the extent of cross-border activities. For example, Lane and Milesi-Ferretti (2003 and 2008) as well as Kim and Lee (2008) calculate the ratio to GDP of the total stocks of aggregate foreign assets and liabilities (from the IMF’s Coordinated Portfolio Investment Survey (CPIS) database) as a measure of international financial integration. Some studies use the ratio of capital flows to GDP from the IFS database instead of stock data to indicate the degree of financial
2 See Fung, Tam, and Yu (2008) for a review of literature on the definition and measurement of financial integration.
3 See Baele and others (2004).
4 Baele and others, op. cit., also identifies a news-based measure as a third category of financial integration measure. As an area of economies becomes more financially integrated and portfolios more diversified, the impact of idiosyncratic (or economy-specific), as opposed to area-wide, news becomes smaller.

7
integration (see, for example, Vo (2005) and Edison and others (2002)). There are also indirect quantity-based measurements of financial integration, such as correlations of consumption patterns, which should increase with integration.5
Among price-based measures of financial integration, the ECB (2005) calculates cross-country standard deviation of money market rates and bond yields from their respective benchmarks, which has been applied to Asia by Kim and Lee (2008). Adam and others (2002) proposed a “beta-convergence” measure of financial integration to capture the speed of convergence on government bond yields. Other price-based measures include, for example, dynamic co-integration analysis, a sensitivity indicator to measure the sensitivity of individual country’s bond/equity market index to corresponding index in the United States compared to regional peers (Haldane and Hall, 1991), and a rolling concordance index to capture market cycle synchronization (Edward, Biscarri, and de Gracia, 2003).6
Both quantity-based and price-based measures have advantages and drawbacks. Although price-based measures provide a direct test on the degree of impediments to exploit cross-border arbitrage opportunities, they tend to rely on strong assumptions. For instance, the law of one price only works, if there are similar financial instruments across countries. However, in less-developed countries, comparable financial instruments may not be available, which inhibits a more comprehensive inclusion of these countries. In addition, under flexible exchange rates, expected exchange rate movements are also an important component of the overall risk-return profile. Quantity-based measures are simpler and more intuitive; nevertheless they are also subject to data availability constraints, although to a lesser extent. In addition, when these measures are applied across countries and regions, there is also a possibility of differentiated or nonstandardized treatment of data.7
B. Trends in Cross-Border Direct and Portfolio Investment, and Banking
Mainly as a result of data limitations in a number of Asian economies, this paper employs quantity-based measures of financial integration in line with Lane and Milesi-Ferretti (2003). We consider cross-border transaction, of financial integration, in three dimensions—portfolio investment, direct investment, and cross-border bank transactions. Corresponding data sources are the IMF’s CPIS database8 (for stock of portfolio investment), United Nations
5 See Cowen and Salgado (2006).
6 See Kasa (1992), Click and Plummer (2005) and Fung, Tam, and Yu, op. cit.
7 For example, some countries (Australia, Japan, and Thailand) report foreign asset and liability positions by all sectors, namely banks, other financial institutions, general government and nonfinancial institutions sectors, while others (e.g., India, Indonesia, Malaysia and the Philippines) do not report holdings by general government.
8 See http://www.imf.org/external/np/sta/pi/datarsl.htm (Geographic break down Tables 8, 8.1 and 8.2).
8
Conference on Trade and Development (UNCTAD),9 International Financial Statistics (IFS), and Economist Intelligence Unit (EIU) (for direct investment flows) and Bank for International Settlements (BIS)10 (for stock of cross-border bank transactions). These data sources also allow analysis of bilateral cross-border holdings and thus differentiation between regional and global financial integration. At the same time, stock data typically exhibit less pronounced short-run fluctuations. However, a drawback of stock data is that changes due to flows can generally not be separated from valuation effects. We review cross-border transactions relative to GDP over time, across Asian countries and in comparison to other regions. In addition, we consider bilateral transactions, both at the intraregional and interregional level, and the role of financial centers in Asia. For a broader comparison, we examine four major regions: Asia, the euro area (members as of 2001), Eastern Europe, and Latin America.11
Portfolio Investment
Before the recent crisis, cross-border portfolio investment was on an upward trend in absolute U.S. dollar-terms across all regions under consideration (Figures 1 and 2). Relative to GDP, cross-border portfolio investment was also generally on the rise and the ratio was much higher among the euro zone economies than in other regions (Figures 3 and 4). On average, cross-border portfolio investment relative to GDP in Asia has been somewhat higher than in Latin America and Eastern European but well below the euro zone. In 2008, the decline in cross-border portfolio investment (relative to GDP) was particularly severe in the euro zone countries, while 2009 saw a pickup to levels last seen in 2005.12
There are noteworthy differences across regions regarding the source and destination of portfolio investment.
For Asian economies, both the United States and the euro area are important sources of funds. By contrast, Latin America and Eastern Europe rely predominantly either on the United States or the euro area as sources for portfolio funds, reflecting geographic
9 See http://unctadstat.unctad.org/ (Foreign Direct Investment Flows).
10 See http://www.bis.org/statistics/bankstats.htm (External positions of reporting banks vis-à-vis individual countries Table 6A).
11 Asia includes Australia, China, Hong Kong SAR, India, Indonesia, Japan, Korea, Malaysia, New Zealand, the Philippines, Singapore, Taiwan Province of China, Thailand, and Vietnam. The euro area includes Austria, Belgium, Finland, France, Germany, Greece, Ireland, Italy, Luxembourg, the Netherlands, Portugal, and Spain. Eastern Europe includes Bulgaria, Croatia, Czech Republic, Estonia, Hungary, Latvia, Lithuania, Poland, Romania, Slovak Republic, and Slovenia. Latin America includes Argentina, Bolivia, Brazil, Chile, Colombia, Mexico, Paraguay, Peru, Uruguay, and Venezuela.
12 This may partly be a consequence of valuation changes due to dollar depreciation.

9
Panel 1. Portfolio Investment
Prior to the recent crisis, portfolio investment has been on a rise in absolute U.S. dollar terms. The crisis year of 2008 saw a significant drop in portfolio investment followed by a strong pickup in 2009.
Figure 1. Total Portfolio Investment Liabilities by Region
Figure 2. Total Portfolio Investment Assets by Region
Having adjusted for the size of the economy, cross-border portfolio investment in Asia and other emerging markets have remained well below that of the euro area.
Figure 3. Total Portfolio Investment Liabilities to GDP by Region
Figure 4. Total Portfolio Investment Assets to GDP by Region
Asia’s portfolio investment is generally more interregional than intraregional, while the opposite holds true for the euro area.
Figure 5. Source of Portfolio Investment Liabilities (average 2004–07)
Figure 6. Destination of Portfolio Investment Assets (average 2004–07)
0
5000
10000
15000
20000
2001 2002 2003 2004 2005 2006 2007 2008 2009
in b
illio
n of
USD
0
200
400
600
800Asia euro area Latin America (RHS)Eastern Europe (RHS)
Source: Coordinated Portfolio Investment Survey (CPIS)
0
1000
2000
3000
4000
5000
2001 2002 2003 2004 2005 2006 2007 2008 2009
in b
illio
n of
USD
0
50
100
150
200Asiaeuro area Latin America (RHS)Eastern Europe (RHS)
Source: Coordinated Portfolio Investment Survey (CPIS)
0
20
40
60
80
100
120
140
160
2001 2002 2003 2004 2005 2006 2007 2008 2009
in p
erce
nt o
f G
DP
Asia euro area Latin AmericaEastern Europe
Source: Coordinated Portfolio Investment Survey (CPIS)
0
20
40
60
80
100
120
140
160
2001 2002 2003 2004 2005 2006 2007 2008 2009
in p
erce
nt o
f G
DP
Asia euro area Latin AmericaEastern Europe
Source: Coordinated Portfolio Investment Survey (CPIS)
0%
20%
40%
60%
80%
100%
Aust
ralia
Chin
a
Hon
g Ko
ng S
AR
Indi
a
Indo
nesi
a
Japa
n
Kore
a
Mal
aysi
a
New
Zea
land
Phili
ppin
es
Sing
apor
e
Taiw
an P
OC
Thai
land
Viet
nam
Asia
Latin
Am
eric
a
East
ern
Euro
pe
euro
are
a
regional US UK euro-area others
Source: Coordinated Portfolio Investment Survey (CPIS); and staff calculations.
0%
20%
40%
60%
80%
100%
Aust
ralia
Hon
g Ko
ng S
AR
Indi
a
Indo
nesi
a
Japa
n
Kore
a
Mal
aysi
a
New
Zea
land
Phili
ppin
es
Sing
apor
e
Thai
land
Asia
Latin
Am
eric
a
East
ern
Euro
pe
euro
are
a
regional US UK euro-area others
Source: Coordinated Portfolio Investment Survey (CPIS); and staff calculations.
10
proximity and closer economic ties, a pattern that is also repeated on the asset side.
By contrast, for euro area countries, most portfolio assets and liabilities are intraregional.
Asian economies display strong differentiation on the asset side. The Asian financial centers (Hong Kong SAR and Singapore) intermediate funds from advanced economies into the region as evident in the disproportionally large inter-regional liabilities position and intra-regional assets position. On the other hand, other regional economies generally invest more in developed markets such as the United States and the euro area than within the region as shown by their relatively large inter-regional assets position (Figures 5 and 6).
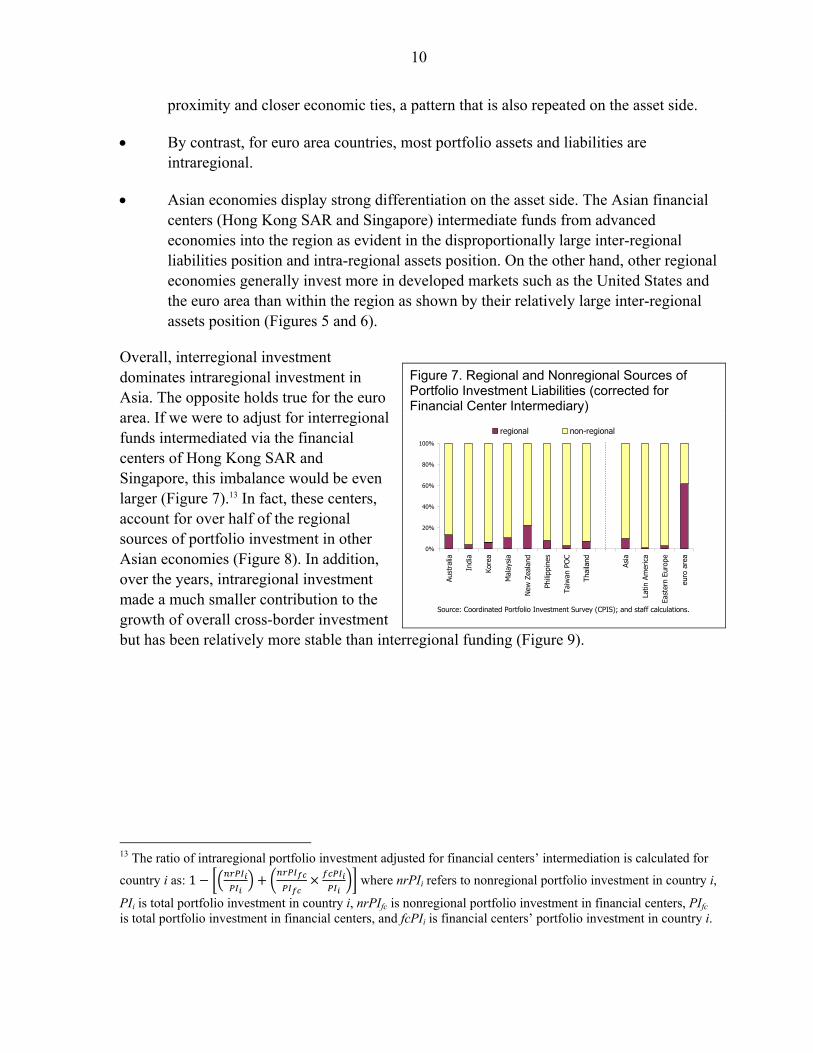
Overall, interregional investment dominates intraregional investment in Asia. The opposite holds true for the euro area. If we were to adjust for interregional funds intermediated via the financial centers of Hong Kong SAR and Singapore, this imbalance would be even larger (Figure 7).13 In fact, these centers, account for over half of the regional sources of portfolio investment in other Asian economies (Figure 8). In addition, over the years, intraregional investment made a much smaller contribution to the growth of overall cross-border investment but has been relatively more stable than interregional funding (Figure 9).
13 The ratio of intraregional portfolio investment adjusted for financial centers’ intermediation is calculated for
country i as: 1 where nrPIi refers to nonregional portfolio investment in country i,
PIi is total portfolio investment in country i, nrPIfc is nonregional portfolio investment in financial centers, PIfc
is total portfolio investment in financial centers, and fcPIi is financial centers’ portfolio investment in country i.
Figure 7. Regional and Nonregional Sources of Portfolio Investment Liabilities (corrected for Financial Center Intermediary)
0%
20%
40%
60%
80%
100%Au
stra
lia
Indi
a
Kore
a
Mal
aysi
a
New
Zea
land
Phili
ppin
es
Taiw
an P
OC
Thai
land
Asia
Latin
Am
eric
a
East
ern
Euro
pe
euro
are
a
regional non-regional
Source: Coordinated Portfolio Investment Survey (CPIS); and staff calculations.

11
Figure 8. Source of Regional Portfolio Investment Liabilities (average 2004–07)
Figure 9. Contribution to Year-on-Year Growth of Total Portfolio Investment Liabilities
The relatively low level of intraregional as opposed to interregional portfolio transactions likely reflects differences in market depth. In fact, the magnitude of cross-border equity investment in Asia is much larger compared to investment in debt instruments, while the reverse is true in the case of the euro area. Compared with advanced economies, Asia’s bond markets in particular have remained shallow. Based on BIS data for 2010, except for Korea and Malaysia, bond market capitalization in emerging Asia is less than 50 percent of GDP, compared with 173 percent in the United States and 107 percent in Europe. For other emerging regions the magnitude of both equity and debt investment is more comparable (Figure 10).
Direct Investment
Precrisis trends of cross-border direct investment flows in absolute terms have varied substantially, both over time and across regions (Figures 11 and 12). However, relative to GDP, a general upward trend prevails both in terms of inflows and outflows. Adjusting for the size of the economy, Eastern European countries seem to attract more FDI inflows than other regions and, somewhat surprisingly, FDI inflows into Asia have frequently been lower than into any other region in recent years (Figure 13. Regarding FDI outflows, the euro area has been the leading source of investment, followed by Asia (Figure 14). In 2008, FDI flows
Figure 10. Debt and Equity Portfolio Investment Liabilities to GDP
0%
50%
100%
Aust
ralia
Chin
a
Indi
a
Kore
a
Mal
aysi
a
New
Zeal
and
Phili
ppin
es
Taiw
an P
OC
Thai
land
financial centers Japan Others
Source: Coordinated Portfolio Investment Survey (CPIS); and staff calculations.
-40%
-20%
0%
20%
40%
60%
80%
2002 2003 2004 2005 2006 2007 2008 2009
regional non-regional
0%
30%
60%
90%
120%
Aust
ralia
Chin
a
Hon
g Ko
ng S
AR
Indi
a
Indo
nesi
a
Japa
n
Kore
a
Mal
aysi
a
New
Zea
land
Phili
ppin
es
Sing
apor
e
Taiw
an P
OC
Thai
land
Viet
nam
Asia
Latin
Am
eric
a
East
ern
Euro
pe
euro
are
a
debt equity
Source: Coordinated Portfolio Investment Survey (CPIS); and staff calculations.

12
Panel 2. Direct Investment
Unlike portfolio investment, direct investment in absolute US dollar-term exhibits mixed trends across regions.
Figure 11. Total Foreign Direct Investment Inflows by Region
Figure 12. Total Foreign Direct Investment Outflows by Region
Having adjusted for the size of the economy, Eastern Europe attracted relatively more FDI inflows than other regions, while FDI inflows into Asia were the lowest. In 2008, FDI flows declined and continued to do so in 2009.
Figure 13. Total Foreign Direct Investment Inflows to GDP by Region
Figure 14. Total Foreign Direct Investment Outflows to GDP by Region
Contrary to portfolio investment, much of Asia’s FDI flows have been intraregional.
Figure 15. Sources of FDI Inflows (as of 2007)
Figure 16. Destinations of FDI Outflows (as of 2007)
0
200
400
600
800
2001 2002 2003 2004 2005 2006 2007 2008 2009
in b
illio
n of
USD
0
50
100
150Asia euro area Latin America (RHS)Eastern Europe (RHS)
Source: UNCTAD; and EIU.
0
200
400
600
800
1000
2001 2002 2003 2004 2005 2006 2007 2008 2009
in b
illio
n of
USD
0
50
100
150
200Asiaeuro area Latin America (RHS)Eastern Europe (RHS)
Source: UNCTAD; and EIU.
0
2
4
6
8
10
2001 2002 2003 2004 2005 2006 2007 2008 2009
in p
erce
nt o
f G
DP
Asia euro area Latin AmericaEastern Europe
Source: UNCTAD; and EIU.
0
2
4
6
8
10
2001 2002 2003 2004 2005 2006 2007 2008 2009
in p
erce
nt o
f G
DP
Asia euro area Latin AmericaEastern Europe
Source: UNCTAD; and EIU.
-40%
-20%
0%
20%
40%
60%
80%
100%
Aust
ralia
Chin
a
Hon
g Ko
ng S
AR
Indi
a
Japa
n
Kore
a
Mal
aysi
a
New
Zea
land
Phili
ppin
es
Sing
apor
e
Thai
land
Viet
nam
Asia
Latin
Am
eric
a
East
ern
Euro
pe
euro
are
a
regional US UK euro-area others
Source: UNCTAD; EIU; and staff calculations.
-20%
0%
20%
40%
60%
80%
100%
Aust
ralia
Chin
a
Hon
g Ko
ng S
AR
Indi
a
Indo
nesi
a
Japa
n
Kore
a
Mal
aysi
a
New
Zea
land
Phili
ppin
es
Sing
apor
e
Taiw
an P
OC
Thai
land
Asia
Latin
Am
eric
a
East
ern
Euro
pe
euro
are
a
regional US UK euro-area others
Source: UNCTAD; EIU; and staff calculations.

13
relative to GDP declined sharply particularly in the case of European economies (both the euro area and Eastern Europe) and the decline continued well into 2009.
In terms of sources of FDI inflows and destination of FDI outflows, some noteworthy differences relative to the cross-border portfolio investment patterns emerge: Generally, Asia leads other regions (including the euro area) in terms of intraregional FDI inflows (Figure 15). Moreover, the destination pattern of outflows resembles that of inflows, with Asia again investing a larger share than in the case of portfolio investment within the region (Figure 16).
A closer examination of FDI inflows in Asia reveals two special factors driving intraregional integration: First, Japan is the major source of intraregional FDI flows (Figure 17). This indicates an important role of Japan as a regional medium-to-long term investor. Blaise (2009) points out a close linkage between Japan’s official development assistance and FDI in ASEAN economies, which could serve as a plausible explanation. In addition, firms from more advanced Asian economies, notably Japan and Korea, invest in emerging and developing Asia to capture locational and cost advantages, which help form regional production and distribution networks—a corollary of greater vertical trade integration in the region.14 Second, round-tripping between Mainland China and Hong Kong SAR. Over 70 percent of all intraregional FDI inflows into Hong Kong SAR are from mainland China, while over 90 percent of total FDI outflows from Hong Kong SAR are to mainland China. This points to evidence of the round-tripping phenomenon (Leung and Unteroberdoerster, 2008; and Lane and Milesi-Ferretti, 2010) to maximize the gains from regulatory arbitrage between Mainland China and Hong Kong SAR. 15
14 See for example, IMF (2010).
15 Over 40 percent of intra-Asian FDI flows are FDI flows between China and Hong Kong SAR. From a statistical point of view, round tripping may inflate FDI flows, which should actually be classified as domestic investment. However, to the extent that these flows require the same services (e.g., legal, consulting, financial and advisory) as other FDI flows channeled through Hong Kong SAR they matter in measuring Hong Kong SAR’s role as an international financial intermediary.
Figure 17. Sources of Regional FDI Inflows (as of 2007)
0%
20%
40%
60%
80%
100%
Aust
ralia
Chin
a
Hon
g Ko
ng
Indi
a
Indo
nesi
a
Kore
a
Mal
aysi
a
New
Zea
land
Phili
ppin
es
Sing
apor
e
Thai
land
Viet
nam
Asia
fin center Japan Other regional
Source: UNCTAD; EIU; and staff calculations.

14
Banking The BIS international locational banking statistics do not allow for a comprehensive analysis on a bilateral basis, given the limited number of reporting countries (including in Asia). That said, before the recent crisis, the absolute size of overall cross-border banking exposures has been on the rise for all regions both on the asset and liability sides (Figures 18 and 19). However, adjusted for the size of the economy, liabilities have been relatively stable in Asia, increasing in the euro area and Eastern Europe, but declining in Latin America (Figure 20). A similar trend applies to the asset side, except that Eastern Europe has been relatively stable (Figure 21). During the crisis years of 2008–09, unlike portfolio investment and FDI, the decline in banking exposures has been relatively mild in all regions. Relative to GDP, the level of cross-border banking in Asia is comparable to other emerging markets, but three times lower than in the euro area.
Panel 3. Banking
Prior to the recent crisis, cross-border banking exposure in US dollar-term was on the rise.
Figure 18. Total Liabilities vis-à-vis Reporting Banks
0
2000
4000
6000
8000
10000
12000
2001 2002 2003 2004 2005 2006 2007 2008 2009
in b
illio
n of
USD
0
200
400
600
800
1000Asiaeuro area Latin America (RHS)Eastern Europe (RHS)
Source: BIS
Figure 19. Total Assets vis-à-vis Reporting Banks
0
2000
4000
6000
8000
10000
2001 2002 2003 2004 2005 2006 2007 2008 2009
in b
illio
n of
USD
0
50
100
150
200
250
300
350Asia euro area Latin America (RHS)Eastern Europe (RHS)
Source: BIS
Relative to GDP, however, the trend has been mixed across regions. Asia’s cross-border banking exposure was stable both on the assets and liabilities sides.
Figure 20. Total Liabilities vis-à-vis Reporting Banks to GDP
0
20
40
60
80
100
2001 2002 2003 2004 2005 2006 2007 2008 2009
in p
erce
nt o
f G
DP
Asia euro area Latin AmericaEastern Europe
Source: BIS
Figure 21. Total Assets vis-à-vis Reporting Banks to GDP
0
20
40
60
80
2001 2002 2003 2004 2005 2006 2007 2008 2009
in p
erce
nt o
f G
DP
Asia euro area Latin AmericaEastern Europe
Source: BIS

15
In sum, portfolio investment, FDI flows and banking activities have generally been on an upward trend in the years prior to the recent crisis, followed by a decline in crisis years of 2008–09. Cross-border financial positions in Asia are smaller than in the euro area, but broadly comparable to those of other emerging economies. Cross-border portfolio investment in Asia is predominantly interregional, while FDI flows are mainly intraregional, partly influenced by round-tripping phenomenon between Mainland China and Hong Kong SAR, and the role of Japan and other advanced economies in setting up production networks in the region.
C. Is Financial Integration in Asia Lagging?
This section provides a formal assessment of the degree of financial integration in Asia, capturing not only the progress across time but also a country’s position relative to the rest of the world. Given that both global and country-specific factors come into play in determining the degree of financial integration, we control for common factors that help explain global trends, and then construct measures that assess the extent to which countries deviate from normal levels of financial integration with the world. We explore two alternative measures of financial integration: the Z score and trade-financial relative intensity.
Z score
The Z score measures how far (how many standard deviations) an individual country’s observation is from the global mean. Each individual country’s observation is compared against the global mean and the dispersion from the mean is scaled by the global standard deviation. The observations reflect measures of financial integration discussed above, such as the ratio of cross-border portfolio investment assets to GDP. Z-score calculations implicitly take into account common global factors, such as a favorable global and financial environment, which may increase the overall cross-border financial activities of all countries. If the impact of a common global factor is symmetric across countries, the Z score will not change for an individual country. The Z score is defined as follows:
,, ,
,
Where zf,it refers to a Z score for a measure of financial integration of country i at time t; xf,it is a ratio of cross-border financial activity f to GDP of country i at time t. and refer to
the mean and standard deviation across countries. The average global score for each type of cross-border financial activity is equal to zero (by construction). A positive Z score indicates that an individual country’s ratio of cross-border financial activity to GDP is higher than the global average. For example, a z-score of 2 means the ratio is greater than the global average by two (global) standard deviations. The higher the score, the greater the ratio compared to the global average. The opposite is true for the negative score. To aggregate over different types of cross-border financial activities, we calculate the overall Z score for country i by

16
simply averaging zf,it across the six types of cross-border financial activities discussed in the previous section, namely: portfolio investment liabilities, portfolio investment assets, FDI inflows, FDI outflows, banking liabilities and banking assets to GDP.
The average z score for Asia is close to the world’s average and that of Eastern European countries but well below the euro area’s (Figure 22). However, excluding the financial centers of Hong Kong SAR and Singapore, the average Z score for Asia is well below the world’s average and closer to that of Latin America.
The role of trade integration
Asian economies are highly integrated through trade. As trade in goods and cross-border financial activities are found to have strong complementarities (Shin and Yang, 2006) one would also expect Asian economies to be also highly financially integrated. To account for this important country characteristic of Asian economies, we compare Asian economies’ trade intensity with the intensity of their cross-border financial transactions.16 Specifically, the intensity measure is calculated as follows:
,∑
∑
Where refers to intensity of trade or cross-border financial transactions of
country i at time t. n is the number of economies in the sample and fit is the sum of exports and imports or of cross-border financial assets and liabilities (or flows) of country i at time t.
refers to Gross Domestic Product of country i at time t in U.S. dollars. In simple terms, the intensity measures a country’s “footprint” in global trade or finance, relative to its weight in the global economy.
16 See Leung and Unteroberdoerster (2008).
Figure 22. Z score for Financial Integration (average 2004–07)
-1 -0.5 0 0.5 1 1.5 2 2.5 3
Hong Kong SARSingapore
AustraliaMalaysia
Taiwan POCNew Zealand
ThailandPhilippines
VietnamJapanChinaKorea
IndonesiaIndia
AsiaAsia excl financial centers
Latin AmericaEastern Europe
euro area excl Luxembough
Source: staff calculations.

17
While trade intensity in Asia (especially emerging Asia) has been relatively high compared with other regions (Figure 23), financial intensity is much lower. In fact, an observation similar to that of z score emerges. Asia on average (excluding Hong Kong SAR and Singapore) appears to have lower financial intensity compared to the world average and the euro zone.
Looking closely within the region, the ranking somewhat differs across types of transaction (Figures 24, 25, and 26). If we compare intensity in banking and portfolio transaction, industrial Asia generally has greater intensity than emerging Asia but the opposite is true in the case of direct investment intensity—underscoring important difference in the composition of cross-border financial transaction across Asian economies.
Figure 25. FDI Intensity (average 2004–07) Figure 26. Banking Intensity (average 2004–07)
0 2 4 6 8 10 12
JapanKoreaIndia
PhilippinesIndonesia
Taiwan POCNew Zealand
ChinaThailandVietnamMalaysiaAustralia
SingaporeHong Kong SAR
WorldAsia
Asia excl financial centersLatin America
Eastern Europeeuro area
Source: UNCTAD; EIU; IFS; and staff calculations.
0 1 2 3 4 5 6 7 8
ChinaVietnam
IndiaIndonesia
KoreaJapan
ThailandPhilippines
AustraliaMalaysia
Taiwan POCNew Zealand
Hong Kong SARSingapore
WorldAsia
Asia exclLatin America
Eastern Europeeuro area
Source: BIS; IFS; and staff calculations.
Figure 23. Trade Intensity (average 2004–07)
Figure 24. Portfolio Investment Intensity (average 2004–07)
0 1 2 3 4 5 6 7 8 9
JapanIndia
AustraliaNew Zealand
IndonesiaChinaKorea
PhilippinesTaiwan POC
ThailandVietnamMalaysia
Hong Kong SARSingapore
WorldAsia
Asia excl financial centersLatin America
Eastern Europeeuro area
Source: DOTS; IFS; and staff calculations.
0 0.5 1 1.5 2 2.5 3 3.5 4 4.5 5
IndonesiaIndia
ThailandPhilippines
KoreaMalaysia
New ZealandJapan
AustraliaSingapore
Hong Kong SAR
WorldAsia
Asia excl financial centersLatin America
Eastern Europeeuro area
Source: CPIS; IFS; and staff calculations.

18
Aggregating the different types of cross-border financial activities, Figure 27 captures the lack of Asian economies’ overall financial integration with the world relative to their role in global trade. On average across the world, a country’s financial intensity tends to increase with its trade intensity. But this does not seem to be the case in the same way for Asian economies. Compared to the world norm, most Asian economies’ rapid expansion into global trade (position on the x-axis measuring trade intensity) has not been matched by their role in international finance (position on the y-axis measuring cross-border financial intensity). This appears to hold in particular for the emerging economies of South East Asia, including Malaysia, Thailand, the Philippines, and Indonesia.
The role of cyclical and structural factors: Is regional integration in Asia lagging?
To identify the cyclical and structural factors that may influence cross-border activities and hence the measurement of financial integration, we draw on the literature of asset gravity models. The gravity model has originally been used to explain bilateral trade flows.17 Recent examples of the application of the gravity model to cross-border financial activities include Portes and Rey (2005), Ahearne, Griever, and Warnock (2004), Dahlquist and others (2003) and Garcia-Herrero, Wooldridge, and Yang(2009) on portfolio investment, Wei (2000) and Di Giovanni (2005) on FDI, and Rose and Spiegel (2004) on cross-border bank lending. We will first discuss the role of country-specific and structural factors in a multilateral context and then assess the degree of intraregional financial integration in a bilateral gravity model setup.18
Our multilateral model of financial integration (as measured by overall z score) uses a panel Generalized Methods of Moments (GMM). The model allows us to separate country-specific effects (fixed effects) on financial integration from the effects of other drivers—in this case, relative growth rates, trade openness, interest rate differentials, exchange rate movements, and volatility. High relative growth rate could either induce accumulation of financial assets (by acting as a push factor) or attract financial liabilities (a pull factor). As discussed above,
17 The original gravity model was proposed by Tinbergen (1962) and augmented to account for trade costs by Anderson and Van Wincoop (2004).
18 Multilateral trade is the sum of total exports and imports. Multilateral relative returns are calculated as the difference between domestic short-term interest rate and GDP-weighted short-term rates for the rest of the world.
Figure 27. Trade and Financial Intensity
US
JPNIND
AUZ
UK
NZL
FRN
IDN
CHN
GER
KORPHL
TWN
THAVNM
MLY
HKG
SGP
y = 0.6306x + 0.0839R2 = 0.2128
0
1
2
3
4
5
6
7
8
9
10
0 1 2 3 4 5 6 7 8 9 10
Trade Intensity
Financial Intensity
Source: staff calculations.
45° line

19
trade openness, as captured by the sum of imports and exports to overall GDP, is also an important factor driving financial flows (e.g., Lane and Milesi-Ferretti, 2008). Interest rate differentials and exchange rate movement are included to capture differences in returns on (short-term) financial assets which may trigger cross-border financial flows. Exchange rate volatility accounts for exchange rate risks associated with cross-border holding of assets. The specification adopted is therefore:
ititititititiit Voleroptradediffdiffgeffectsfixedz 543210 ))ln(()()(int)(
where g diffit is the difference between GDP growth of country i at time t and the rest of the world, int diffit is the difference between short-term (money market) rate of country i and the rest of the world at time t, trade opit is the ratio of the sum of exports and imports to GDP of country i at time t, erit is bilateral exchange rate of country i vis-à-vis the U.S. dollar (an increase in erit means depreciation in country i’s currency), and Volit is the standard deviation of the monthly return of country i’s bilateral exchange rate over year t.
The estimation results are presented in Table 1. The results suggest important contributions from all factors, with expected signs except for the short-term interest rate, which is found to be insignificant. Having constructed a normal degree of financial integration, the country-specific effects (fixed effects) can be viewed as a measure of a country’s deviation from the “norm” or, if they are negative, of a lack of financial integration. Figure 28 illustrates Asia’s country-specific (fixed) effects and the averages across the regions and the world. The results suggest that Asia’s (excluding Hong Kong SAR and Singapore) degree of financial integration is significantly lower than the world average, but in line with Latin America. Eastern European countries are now performing much worse than the world average and appear to be less financially integrated than Asia, while the euro zone appears more financially integrated. Taking a closer look at the relative performance across Asian economies, we find
Table 1. Estimation of Financial Integration
Dependent variable: financial integration score (z)
Variable Coefficient
Constant -0.176 (-2.324)
ln(exchange rate) -0.303 (-2.260)
Trade to GDP ratio 0.324 (2.706)
Relative GDP growth 0.036 (2.048)
Relative short term interest rate -0.018 (-0.935)
Exchange rate volatility -1.846 (-6.386)
Number of observations Adjusted R2
266 0.95
Note: t-statistic in brackets
Figure 28. Country-specific Factors (Fixed Effects) of Financial Integration Equation
-0.8-0.6-0.4-0.2
00.20.40.60.8
11.21.4
Asia
exc
l fin
anci
al c
ente
rs
Asia
Latin
Am
eric
a
East
ern
Euro
pe
euro
are
a ex
cl L
uxem
boug
h
US
UK
Wor
ld
Mal
aysi
a
Thai
land
Kore
a
Phili
ppin
es
Indo
nesi
a
Japa
n
New
Zea
land
Aust
ralia
Sing
apor
e
Hon
g Ko
ng S
AR
Source: staff calculations.

20
again, as is the case when controlling for trade alone, that the degree of financial integration is particularly low in emerging Asia.
Is Asia’s regional integration abnormally low?
In our second model, we examine determinants of bilateral portfolio financial integration based on CPIS data over 2004–07. The following form of financial gravity model is estimated for 1,809 country pairs, covering all regions:
itk
kkk
kkijtijt
ijtijtijtijijijijt
globalregionVoler
diffdiffgtradecolonylangdistport
4
1,10
4
1,987
6543210
))ln((
)(int)(
Where portijt is the ratio (in percent) of total portfolio assets between countries i and j to countries i and j’s total GDP at time t (source: CPIS), refers to coefficients, distij is the log of distance between countries i and j, langij and colonyij are dummy variables indicating common language and colonial relation respectively (Rose and Spiegel, 2004), g diffijt is the absolute value of the difference between GDP growth of countries i and j at time t, int diffijt is the absolute value of the difference between short-term (money market) rate of countries i and j at time t (source: IFS), tradeijt is the ratio (in percent) of total exports between countries i and j to countries i and j’s total GDP at time t (source: DOTS), erijt is bilateral exchange rate of country i vis-à-vis country j, Volijt is the standard deviation of the monthly return of country i and j’s bilateral exchange rate over year t (source: IFS), regionk are dummy variables capturing intraregional portfolio transaction for each regions—Asia, euro area, Latin America and Eastern Europe, and globalk are dummy variables capturing interregional portfolio transactions between the four regions and the rest of the world.
The results in Tables 2 and 3 confirm our earlier simple evidence on portfolio transaction that Asia is less integrated than
Table 2. Estimation of Portfolio Gravity Model
Dependent variable: portfolio assets to GDP (port)
Variable Coefficient
Constant 0.311(5.530)
Lang 0.262(5.804)
Colony 0.716(26.002)
Dist -0.003(-2.141)
Trade 0.654(24.553)
Vol -3.068(-4.045)
Asia-global -0.070(-6.104)
Euro-global 0.119(18.037)
LatAm-global -0.168(-3.704)
EEur-global -0.278(-5.251)
Asia-regional -0.805(-18.208)
Euro-regional 2.878(20.811)
LatAm-regional -0.603(-6.301)
EEur-regional -0.863(-9.857)
Number of observations 5,292Adjusted R2 0.41
Note: t-statistic in brackets

21
the euro area both on intraregional and interregional fronts, but that the level of regional integration is also low compared with other emerging market regions. The estimation follows a general-to-specific approach, consequently, a few variables were dropped due to their statistical insignificance and/or incorrect signs. The result suggests an important contribution from noneconomic regional factors—the distance between countries, common languages as well as colonial relation. In line with the global model estimated earlier, trade integration and volatility in exchange rate play an important role in determining portfolio transaction. Moreover, the estimated coefficients on regional and global dummies allow us to rank the degree of portfolio integration by region—both on intraregional and interregional dimensions. Based on the Wald test of coefficient restriction,19 we are able to rank the degree of portfolio integration across regions and compare the degree of intra and interregional integration (Table 3). All regions except the euro area tend to be more integrated globally than regionally. In comparison to other emerging market regions, Asia fares relatively well in global integration but less so in regional integration. In fact, anything else being equal, for any intra-Asian country pair, financial integration tends to be 0.8 percentage points of GDP lower than the world average, a measure of underperformance that is worse than for the Latin America region, but comparable to the case of emerging Eastern European economies. D. Capital Account Restrictions, Financial Development, and Financial Integration
One reason for the abnormally low degree of financial integration in Asia could be capital account restrictions in a number of countries. In fact, measures of de jure restrictions on cross-border financial transactions developed by Schindler (2009),20 and the measures assessing the lack of financial integration developed in the previous are positively correlated (see Figure 29
19 We perform the Wald test of coefficient restriction with the null hypothesis of no difference in two coefficients under consideration (c1 = c2). If the test cannot reject the null at 1-percent significance level, the two coefficients are comparable (c1 c2), otherwise, they can be ranked—either c1 > c2 or c1 < c2.
20 The index was constructed based on information contained in the Annual Report on Exchange Arrangements and Exchange Restrictions (AREAER) published by the IMF and dubbed ‘financial integration index’. However, since this measure captures de jure controls but not de facto outcome, we view the index as an indicator of capital restrictions.
Table 3. Comparing the Degree of Portfolio Integration
Global integration euro > Asia LatAm > EEur
Regional integration euro > LatAm > Asia EEur
Global > regional Asia, LatAm, EEur
Regional > global euro
Figure 29. Capital Restrictions and Trade to Financial Intensity Ratio
y = 2.1128x + 1.6536R2 = 0.2607
0
1
2
3
4
5
6
0 0.2 0.4 0.6 0.8 1
Capital restriction index
Trad
e to
fin
anci
al in
tens
ity
rati
o
THA
PHLMYR
CHN
IND
HKG
IDN
JPNSGP
KOR
NZD
AUZ

22
for the trade and financial intensity ratio).
A closer examination at a more disaggregated level of the capital account restriction indices—both on the inflows and the outflows—yields an interesting fact. Capital account restrictions on outflows are generally greater than on inflows (Figure 30).21 This results in a clear imbalance between cross-border assets and liabilities in portfolio investment and banking transaction, as well as between inflows and outflows of FDI (Figure 31). Restrictions on inflows have been liberalized more rapidly than on outflows in the wake of the Asian crisis (Figure 32).22 However, in the face of the surge in capital inflows in 2010, some countries in Asia, namely Korea, Indonesia, Taiwan Province of China and Thailand have adopted macroprudential measures to help manage the inflows (Table 4).
21 This is as of 2005, when the data end.
22 Between 2000 and 2005, capital restriction index on the inflow side increased slightly. Based on Schindler (2009) index, this was due to restrictions on bond inflows in India and a few countries in ASEAN.
Figure 30. Capital Restriction Indices (as of 2005)
Figure 31. Liabilities and Assets to GDP by Type (Asia excluding financial centers)
Figure 32. Capital Restriction Indices (Asia excluding financial centers)
0 0.2 0.4 0.6 0.8 1
Hong Kong
Japan
New Zealand
Korea
Singapore
Australia
Indonesia
Malaysia
Philippines
Thailand
India
China
AsiaAsia excl financial centers
Latin America
Eastern Europe
euro area
Inflows Outflows
Source: Schindler (2009); and staff calculations.
0%
10%
20%
30%
40%
Liabilities Assets Liabilities Assets Liabilities Assets
Portfolio Investment FDI Banking Transaction
Source: BIS; CPIS; EIU; IFS; UNCTAD; and staff calculations.
0.4
0.45
0.5
0.55
0.6
0.65
0.7
1995 1996 1997 1998 1999 2000 2001 2002 2003 2004 2005
Cap
ital
Res
tric
tion
Ind
ices
Inflows Outflows
Source: Schindler (2009); and staff calculations.

23
Capital restrictions are found to inhibit financial development (Chinn and Ito, 2002). They might lessen overall liquidity in the financial markets which may impede further development and restrict the ability of market participants to hedge or diversify risks. For most economies, therefore, capital account liberalization may be a critical component of plans to develop the domestic financial market. First, based on a database of financial reforms developed by Abiad, Detragiache, and Tressel (2008) which records changes in financial policy (liberalization) in different dimensions (both domestic and external), capital restrictions also appear to have a direct relationship with domestic financial reforms (Figure 33). Second, although financial reforms per se do not necessarily lead to financial development, financial reforms are found to have some positive relationship with financial development (Figure 34).23 As a result, going forward, greater financial integration and development should be positively related as illustrated in Figure 35 (note that a high trade-to-financial intensity ratio means a low degree of financial integration). 23 Some literature investigates micro evidence and relates financial reforms to financial development by means of relaxing financing constraints and found some supporting evidence (see for example, Ghosh, 2006 on India) and dissimilar impacts on small and large firms based on cross-country study by Laeven (2000). Abiad and others (2004) found evidence that financial reforms improve allocative efficiency based on firm-level data for five emerging markets.
Table 4. Macroprudential Measures
Country Measures
Korea Rein in short-term foreign currency borrowing by commercial banks
Indonesia Lengthen maturity structure of central bank’s external liabilities and make one-month certificate less liquid
Taiwan Province of China Limits placed on foreign investors’ access to time deposits
Thailand Liberalization of capital outflows
Thailand Removal of tax exemptions for foreign investment in government bonds
New Zealand, Korea Rules to reduce risks of bank funding strains
Sources: National authorities; IMF, October 2010 Asia and Pacific Regional Economic Outlook.
Figure 33. Domestic Financial Reform and Capital Restriction Index
THA
SGP
PHL
NZD
MLY
KOR
JPN
IDN
IND
HK
CHN
AUZ
UK
US
y = -1.4802x + 1.525R2 = 0.3044
-0.1
0.1
0.3
0.5
0.7
0.9
1.1
1.3
1.5
0.4 0.5 0.6 0.7 0.8 0.9 1Domestic Financial Reform Index
Cap
ital
Res
tric
tion
Ind
ex
Source: Schindler (2009); Abiad et al. (2008); and staff calculations.

24
Figure 34. Financial Reform Index and Private Sector Credit to GDP
Figure 35. Financial Integration and Financial Development
y = 0.5742x - 0.0518R2 = 0.0805
0%
20%
40%
60%
80%
100%
120%
140%
0.2 0.4 0.6 0.8 1 1.2
Financial Reform Index
Cla
ims
on P
riva
te S
ecto
r to
GD
P
Source: Abiad et al. (2008); IFS; staff calculations
y = -0.0469x + 0.9348R2 = 0.2714
0.2
0.4
0.6
0.8
1
1.2
0 1 2 3 4 5 6
trade-financial intensity ratio
dom
esti
c fi
nan
cial
ref
orm
inde
x
Source: Abiad et al. (2008); and staff calculations.
AUZ
CHN
HKG
IND
IDN
JPN
KOR
MLY
NZL
PHLSGP
THA
To summarize, this section introduces two different model-based measures of the degree of financial integration—the z score measure and trade-financial intensity ratios—and provides model-based benchmarks against which the degree of financial integration is compared. All measures arrive at the same conclusion: Asian economies, particularly emerging Asia (except the financial centers of Hong Kong SAR and Singapore), appear to have a low degree of financial integration, both in terms of integration with the world and with other countries inside Asia. A low degree of financial integration or openness tends to be mirrored by a lack of financial development. This linkage serves as an important channel through which the degree of financial integration can help foster rebalancing in Asia, which will be discussed in the following section.
III. ASIA REBALANCING: A ROLE FOR FINANCIAL INTEGRATION?
A. The Link Between Financial Integration and Rebalancing
Growth in Asia depends on external demand more than other advanced economies and emerging market regions (Mohommad, N’Diaye, and Unteroberdoerster, 2010). This dependence has led to an unbalanced production structure that is heavily tilted towards industry. From a demand side-perspective, only a few economies seem to have excessively low consumption, most notably China, while several others may well need to increase their investment-to-GDP ratios from current levels. However, in many economies strengthening domestic sources of growth will require boosting productivity of the services sector. Overall, economic rebalancing will mean different things for different countries and encompass comprehensive policy packages that foster investment in domestic demand oriented sectors such as services, in infrastructure which would enhance productivity and crowd in private investment, and measures to boost consumption.
Greater financial integration in Asia can play an important role in strengthening the domestic source of growth. For example, by inducing more competition in sheltered banking systems it

25
could provide access of underserved households and firms thereby reducing financing constraints hampering consumption and investment. In a similar vein, by providing greater liquidity, foreign participation in local currency bond markets is found to lower yields (Peiris, 2010). Moreover, by facilitating the transfer of financial know-how it fosters financial innovation which could lessen the motives for precautionary savings, for instance by providing households with a broader range of savings and insurance instruments, or result in more suitable forms to finance investment. Greater financial openness also tends to be conducive to improved corporate governance by exposing firms to a broader range of investors and investor classes. Similarly, pressure for greater transparency exerted by foreign investors reduces price volatility of financial assets because it improves the quality and frequency of information (Prasad and Rajan, 2008).
The Asian Bond Market Initiative is a specific example how greater financial integration is used to promote deeper and more resilient local financial markets. Through coordinated efforts between national policy makers to strengthen and harmonize institutional and legal frameworks and the setting up of pooled bond funds the initiative sets out to promote the development of local bond markets and create a “spare tire” in the event of disruptions to still bank-dominated funding channels or global finance. With foreign investors in advanced economies set to increase the share of emerging market assets in their portfolio (in line with their weight in global trade and production), the additional demand is likely to improve liquidity, lowering the volatility and cost of funding, thereby encouraging domestic firms to issue bonds. Foreign participation could thus trigger a virtuous cycle of bond market development allowing Asia to become less bank dominated and develop a “twin engine” financial system (Felman and others, 2010).
B. Empirical Estimates
To quantify the link between financial integration and rebalancing, we start from the macroeconomic balance approach. On a macro scale, the need for rebalancing in Asia means a redress to savings-investment imbalances and thus can be captured by relative size of overall current account surplus to GDP (Figure 36). As discussed above, a wide spectrum of structural factors related to the financial system and the degree of financial integration can play an important role in affecting savings-investment norms. And these factors are found to be economically meaningful. For example:
Figure 36. Current Account to GDP by Region
-10%
-8%
-6%
-4%
-2%
0%
2%
4%
6%
Asia Latin America Eastern Europe euro area
Source: WEO; IFS; staff calculations.

26
On investment, Nabar and Syed (2010) using firm-level data find that a 10 percent increase in the availability of finance would increase investment rates of small and medium-sized firms and those operating in the services sector by about 2 percent.
On corporate savings, Jain-Chandra, Nabar, and Porter (2011) show that better access to funding markets can significantly lessen the need to rely on own funds and thus the incentives for corporate funding. They estimate that if Asia were to reach the average level of financial development of advanced economies, corporate savings would be lower by as much as 5 percent of GDP.
On consumption, Jain-Chandra and Chamon (2011) argue that improving household’s access to financial services provides a net boost to consumption. For China, they estimate that further financial reforms, including improving household’s access to financial services, would raise private consumption by about 5 percent of GDP.24
Using the standard macroeconomic balance approach, we therefore test the hypothesis whether financial integration is among the set of important structural determinants of cross-country variations in the current account balance. 25 Based on this approach, structural determinants of the current account balance include old age dependency ratio, population growth, income, income growth and fiscal balance—all relative to an individual country’s major trading partners—along with oil-trade balance and initial net foreign assets (as ratios to GDP). We augment the model to include our measures of financial integration developed in section II as an additional explanatory variable and follow a general-to-specific approach. A panel regression model of 105 countries is estimated by the generalized method of moments (GMM) and also accounts for heteroscedasticity.
Table 5 presents the estimation results comparing the model with z-score measure against that with trade-financial intensity measure of financial integration. Both models confirm the significance of financial integration as determinants of the savings-investment norm. Compared to the original model, these two augmented models fit the data better. The results clearly indicate an important role played by financial integration in rebalancing.
24 This assumes that the level of financial development would be raised to the G7 average.
25 See Isard (2007), Lee, Milesi-Ferretti, Ostry, Prati and Ricci (2008), and Vitek (2010). See also Bayoumi, Oni, Vamvakidis, and Vitek (2010) on the linkage between financial sector regulatory gaps and global imbalances using similar approach.

27
Table 5. Estimation of Augmented Macroeconomic Balance Approach
Dependent variable: current account to GDP
Variable Original Macrobalance Model
1
Z score Model Trade-Financial Intensity Model
Constant -0.001 (-0.159)
0.002 (0.252)
-0.006 (-0.880)
Relative old age dependency -0.108 (-1.197)
-0.106 (-1.376)
-0.008 (-0.108)
Relative population growth -0.613 (-1.324)
Relative income growth -0.719 (-2.030)
-0.546 (-1.599)
-0.733 (-2.498)
Oil trade balance 0.383 (5.303)
0.406 (6.262)
0.398 (6.158)
Relative fiscal balance 0.265 (1.590)
0.166 (1.545)
0.266 (2.162)
Initial net foreign assets 0.051 (4.791)
0.060 (4.854)
0.053 (4.472)
Z score -0.014 (-1.698)
Trade to financial intensity ratio 0.004 (2.005)
Number of observations Adjusted R2
795 0.451
488 0.467
698 0.473
Note: t-statistic in brackets 1 Vitek (2010).

28
Based on the model estimates, we find that if the degree of financial integration in Asia were to be at the world norm, on average across emerging Asia (excluding Hong Kong SAR and Singapore), the current account surplus will be reduced by around 1 percent of GDP (Figure 37). The extent of current account adjustment does not depend on the size of the overall current account surplus (or imbalances) since a number of other structural factors besides the degree of financial integration also come into play in determining current account imbalances. Consequently, countries with larger current account imbalances, such as China, are not necessarily the ones that would benefit most in terms of rebalancing from further financial integration due to overwhelming impact of other structural determinants at work. On the other hand, despite relatively lower current account imbalances, Thailand, Korea, Indonesia, and Malaysia may stand to rebalance in a more significant way by moving towards the “norm” of financial integration.
IV. CONCLUSION
The recent financial crisis and subsequent global recession underscore the need for rebalancing in the case of Asia. At the same time, Asia’s financial integration has received increasing attention following a revival of the Chiang Mai Initiative. While much has been explored on both issues separately, little analysis has been done on the link between the two. This paper attempts to fill this gap in the literature. First, it offers empirical evidence which frequently points to relatively low degree of financial integration, both inside and outside the Asia region, by offering alternative measurements which compare Asia against various simple and model-based benchmarks. The low degree of financial integration in Asia in part reflects capital account restrictions in a number of countries. However, a relatively closed financial system tends to inhibit financial development, which could then weigh down on strengthening domestic demand and the rebalancing process. The paper also provides empirical evidence which confirms that financial integration can foster economic rebalancing. Although financial integration is not the only factor, but one amongst many others, further financial integration could provide non-negligible support to the overall rebalancing process. The policy implications are clear. Further financial integration of Asian economies, both globally and regionally, should be pursued as a critical component of broader financial development to strengthen Asia’s domestic sources of growth and improve economic resilience. With pressures for adopting measures to limit volatile capital inflows rising in recent years, these longer-term benefits of financial integration for the Asia region should not be forgotten.
Figure 37. Change in CA to GDP due to Increase in Financial Integration to Global Norm
-1.6%
-1.2%
-0.8%
-0.4%
0.0%
0.4%
Thai
land
Kore
a
Indo
nesi
a
Mal
aysi
a
Viet
nam
Taiw
an P
OC
Phili
ppin
es
Chin
a
Indi
a
New
Zea
land
Japa
n
Sing
apor
e
Hon
g Ko
ng S
AR
Aust
ralia
Source: Staff calculations.

29
REFERENCES
Abiad, A., N. Oomes, and K. Ueda, 2004, “The Quality Effect: Does Financial Liberalization Improve the Allocation of Capital?” IMF Working Paper 04/112 (Washington: International Monetary Fund).
Abiad, A., E. Detragiache, and T. Tressel, 2008, “A New Database of Financial Reforms,” IMF
Working Paper 08/266 (Washington: International Monetary Fund). Adam, K., T. Jappelli, A. Menichini, M. Padula, and M. Pagano, 2002, “Analyse, Compare, and
Apply Alternative Indicators and Monitoring Methodologies to Measure the Evolution of Capital Market Integration in the European Union,” Centre for Studies in Economics and Finance, University of Salerno, January 28.
Ahearne, A., W. Griever and F. Warnock, 2004, “Information Costs and the Home Bias,”
Journal of International Economics, Vol. 62, No. 2, pp. 313–36. Anderson, J. E. and E. Van Wincoop, 2004, “Trade Costs,” Journal of Economic Literature,
Vol. 42, No. 3, (September), pp. 691–751. Baele, L., A. Ferrando, P. Hördal, E. Krylova, and C. Monnet, 2004, “Measuring Financial
Integration in the Euro Area,” European Central Bank Occasional Paper Series, No. 14. Bayoumi, T., T. Oni, A. Vamvakidis, and F. Vitek, forthcoming, “How Far Do Differenced in
Financial Sector Regulation Drive Global Imbalances?” IMF Staff Position Note (Washington: International Monetary Fund).
Blaise, S., 2009, “Japanese Aid as a Prerequisite for FDI: The Case of Southeast Asian
Countries,” Asia Pacific Economic Papers, No. 385. Chinn, M. D. and H. Ito, 2002, “Capital Account Liberalization, Institutions and Financial
Development: Cross Country Evidence,” NBER Working Papers No. 8967 (Cambridge, Massachusetts: National Bureau of Economic Research).
Click, R. W. and M. G. Plummer, 2005, “Stock Market Integration in ASEAN after the Asian
Financial Crisis,” Journal of Asian Economics, Vol. 16, No. 1, (February), pp. 5–28. Cowen, D.and R. Salgado, 2006, “Globalization of Production and Financial Integration in
Asia,” Financial Integration in Asia: Recent Developments and Next Steps, ed. by D. Cowen, R. Salgado, H. Shah, L. Teo, and A. Zanello, IMF Working Paper 06/196 (Washington: International Monetary Fund).
Dahlquist, M., L. Pinkowitz, R. Stulz, and R. Williamson, 2003, “Corporate Governance and the
Home Bias,” Journal of Financial and Quantitative Analysis, Vol. 38, No. 1, pp. 87–110.

30
Di Giovanni, J., 2005, “What Drives Capital Flows? The Case of Cross-border M&A Activity and Financial Deepening,” Journal of International Economics, Vol. 65, No. 1, pp. 127–49.
Edison, H. J., R. Levine, L. Ricci, and T. Sløk, 2002: “International Financial Integration and
Economic Growth,” Journal of International Money and Finance, Vol. 21, No. 6, (November), pp. 749–76.
Edwards, S., J. G. Biscarri, and F. P. de Gracia, 2003, “Stock Market Cycles, Financial
Liberalization and Volatility,” Journal of International Money and Finance, Vol. 22, No. 7, (December), pp. 925–55.
European Central Bank, 2005, Indicators of Financial Integration in the Euro Area, September. Felman, J., S. Gray, A. Jobst, S. Peiris, and D. Seneviratne, 2010, “ASEAN5 Bond Market
Development: Where Does It Stand? Where is It Going?” mimeo, (Washington: International Monetary Fund).
Fung, L. K., C. Tam and I. Yu, 2008, “Assessing the Integration of Asia’s Equity and Bond
Markets,” in Regional Financial Integration in East Asia: Present and Future, BIS Papers No. 42, pp. 1–37 (Basle: Bank for International Settlements).
Garcia-Herrero, A., D. Yang and P. Wooldridge, 2008, “Why is There So Little Regional
Financial Integration in Asia?” in Regional Financial Integration in East Asia: Present and Future, BIS Papers No. 42, pp. 38–61 (Basle: Bank for International Settlements).
Garcia-Herrero, A., P. Wooldridge and D. Y. Yang, 2009, “Why Don’t Asians Invest in Asia?
The Determinants of Cross-Border Portfolio Holdings,” Asian Economic Paper, No. 8:3, pp. 228–46.
Ghosh, S., 2006, “Did Financial Liberalization Ease Financing Constraint? Evidence from Indian
Firm-Level Data,” Emerging Markets Review, Vol. 7, pp. 176−190. Guo, K. and P. N’Diaye, 2010, “Determinants of China’s Private Consumption: An International
Perspective,” IMF Working Paper 10/93 (Washington: International Monetary Fund). Haldane, A. G. and S. G. Hall, 1991, “Sterling’s Relationship with the Dollar and the
Deutschemark: 1976–89,” The Economic Journal, Vol. 101, No. 406, (May), pp. 436–43. International Monetary Fund, 2010, Regional Economic Outlook: Asia and Pacific (Washington,
October). Isard, P., 2007, “Equilibrium Exchange Rates: Assessment Methodologies,” IMF Working Paper
07/296 (Washington: International Monetary Fund). Jain-Chandra, S., M. Nabar, and N. Porter, 2009, “Corporate Saving and Rebalancing in Asia,”
in Regional Economic Outlook: Asia and Pacific (Washington, October).

31
Jain-Chandra, S. and M. Chamon, 2011, “Access to Finance and Household Saving” in
Rebalancing Growth in Asia, ed. by V. Arora and R. Cardarelli (Washington: International Monetary Fund).
Jain-Chandra, S., M. Nabar, and N. Porter, 2011, Corporate Saving and Rebalancing in Asia,” in
Rebalancing Growth in Asia, ed. by V. Arora and R. Cardarelli (Washington: International Monetary Fund).
Kasa, K., 1992, “Common Stochastic Trends in International Stock Markets,” Journal of
Monetary Economics, Vol. 29, pp. 95–124. Kim, S., J. W. Lee, and K. Shin, 2006, “Regional and Global Financial Integration in East Asia,”
Institute of Economic Research, Korea University Discussion Paper Series, No. 0602 (Seoul: Korea University).
Kim, S. and J. Lee, 2008, “Real and Financial Integration in East Asia,” ADB Working Paper
Series on Regional Economic Integration, No. 17 (Manila: Asian Development Bank). Laeven, L., 2000, “Does Financial Liberalization Relax Financing Constraints on Firms?” Policy
Research Working Paper Series No. 2467 (Washington: World Bank). Lane, P. R. and G. M. Milesi-Ferretti, 2003, “International Financial Integration,” Staff Papers,
Vol. 50, Special Issue, pp. 82–113 (Washington: International Monetary Fund). Lane, P. R. and G. M. Milesi-Ferretti, 2008, “The Drivers of Financial Globalization,” American
Economic Review, Vol. 98, No. 2, pp. 327–32. Lane, P. R. and G. M. Milesi-Ferretti, 2010, “Cross-Border Investment in Small International
Financial Centers,” IMF Working Paper 10/38 (Washington: International Monetary Fund). Lee, J., G. M. Milesi-Ferretti, J. Ostry, A. Prati, and L. Ricci, 2008, Exchange Rate Assessments:
CGER Methodologies, IMF Occasional Paper No. 261 (Washington: International Monetary Fund).
Leung, C. and O. Unteroberdoerster, 2008, “Hong Kong SAR as a Financial Center for Asia:
Trends and Implications,” International Monetary Fund Working Paper 08/57. Mohommad, A., P. N’Diaye, and O. Unteroberdoerster, 2010, “Does Asia Need Rebalancing?”
in Regional Economic Outlook: Asia and Pacific, (Washington, May). Nabar, M. and M. Syed, 2010, “Investment and Rebalancing in Asia,” in Regional Economic
Outlook: Asia and Pacific, (Washington: October). Peiris, S., 2010, “Foreign Participation in Emerging Markets’ Local Currency Bond Markets,”
IMF Working Paper 10/88 (Washington: International Monetary Fund).

32
Portes, R. and H. Rey, 2005, “The Determinants of Cross-Border Equity Flows,” Journal of
International Economics, Vol 65, No. 2, pp. 269–96. Prasad, E. and R Rajan, 2008, “A Pragmatic Approach to Capital Account Liberalization,”
Journal of Economic Perspectives, American Economic Association, Vol. 22, No. 3, pp. 149–72.
Prasertsom, N., 2010, “Assessment of Global and Regional Financial Integration in Asia,” IMF
summer 2010 internship project, mimeo. Rose, A. and M. Spiegel, 2004, “A Gravity Model of Sovereign Lending: Trade, Default and
Credit,” Staff Papers, Vol. 51, pp. 64–74 (Washington: International Monetary Fund). Schindler, M., 2009, “Measuring Financial Integration: A New Data Set,” Staff Papers, Vol. 56,
No.1 (Washington: International Monetary Fund). Tinbergen, J., 1962, Shaping the World Economy. Suggestions for an International Economic
Policy (New York: The Twentieth Century Fund). Vitek, F., 2010, “Exchange Rate Assessment Tools for Advanced, Emerging, and Developing
Economies,” mimeo (Washington: International Monetary Fund). Vo, X. V., 2005, “A New Set of Measures on International Financial Integration”, University of
Western Sydney Working Papers, No. 2005–1. Wei, S., 2000, “How Taxing is Corruption on International Investors?” Review of Economics and
Statistics, Vol. 82, No. 1, pp. 1–11.