Embed Size (px)
Citation preview

Journal of Applied Economics and Business Research JAEBR, 7(1): 38-58 (2017)
Copyright © 2017 JAEBR ISSN 1927-033X
Financial Information Quality and Cost of Equity Capital: Evidence from Tunisia Mejda Dakhlaoui1 University of Tunis, Tunisia Azhaar Lajmi University of Tunis, Tunisia. Marjène Rabah Gana University of Carthage, Tunisia Abstract
This paper investigates the relationship between the financial information quality and the cost of equity capital. The financial information quality is described by the following three attributes: earnings quality, financial transparency and audit quality. This study used a sample of 26 companies listed on the Tunis Stock Exchange (TSE), over the period 2004 to 2010. After verifying endogeneity problem, regressions are estimated using the bootstrap technique associated with the Ordinary Least Squares method and consider nonlinear relationships. Different financial information quality attributes as well as a composite index are used as dependent variables. Our results indicated a negative relationship between most of the attributes mentioned above and the cost of equity capital. Furthermore, the existence of a nonlinear relationship, namely a U-shaped relationship, is confirmed between the financial information quality index and the cost of equity through a robustness check. JEL Classification: G30, M41 Keywords: Accruals quality, financial transparency, audit quality, cost of equity capital Copyright © 2017 JAEBR
1. Introduction The role of corporate governance in increasing performance or reducing cost of capital
has been the subject of many studies. Corporate governance as particularly defined by the financial information disclosure, reduces information asymmetry, corrects uninformed investors’ perception of the current and future performance of the company and favors capital collection. The financial information is then used by the agent to convince the principal with its managerial talent. Thus, a high quality of financial reporting improves the firm's value (Zimmerman, 2012), its performance (Akhigbe et al. 2013) and reduces the cost of equity capital (Persakis and Iatridis, 2015).
1 Correspondence to Mejda Dakhlaoui, E-mail: [email protected]

39 M. Dakhlaoui, A. Lajmi and M. R. Gana
Copyright © 2017 JAEBR ISSN 1927-033X
Although these relations are conceptually well accepted, the empirical results have not convincingly established them. Besides, such researches are rare in emerging markets. It should be remembered that emerging markets are characterized by a low level of corporate disclosure (Boubaker and Nguyen, 2012) and a weak minority shareholders’ right protection (La Porta et al., 1998). Moreover, in emerging markets, the financial information is largely unregulated and the IFRS standards are not usually adopted. These markets are very interesting to study as they continue to draw the foreign investors’ attention mainly because they enable them to lower the risk of their portfolios through diversification.
In this study, we examine the relationship between the financial information quality and the cost of equity capital of Tunisian listed companies. In such markets, results should be clearly in favor of a negative relationship. In fact, the variability of information quality across firms is large due to their fragile corporate governance regime. Some firms will tend to distinguish themselves by providing superior financial information quality than the average. Thus, the marginal effect of a better financial information quality will be important.
The financial information quality is defined by three attributes namely the earnings quality, the financial transparency and the external audit quality. A good earnings quality encourages the development of capital markets. It also increases economic growth by improving the credibility of companies' financial reporting which results in the minimization of the financial risks. Financial transparency is also crucial to reduce the information asymmetry between the company and its capital providers. Finally, the auditor's quality is a sign that the financial information is reliable, particularly those given to the stakeholders in the financial statements.
The main objective of this study is to contribute to the existing literature by analyzing the relationship between the financial information quality and the cost of equity in an emerging market, namely the Tunisian one. This relationship is analyzed at the same time t, firstly and then using the future cost of equity. To give more validity to our results, different robustness tests are conducted, using a composite index as a proxy of financial information quality and testing possible nonlinear relationship between the cost of equity capital and the information quality. So, compared to the previous studies (Khlif and Bouri, 2006; Sebai et al., 2014), this study analyzes, using a robust methodology, the relationship between the financial information quality and the cost of equity in a context that has received little attention to date.
The remainder of the paper is structured as follows: The next section deals with the theoretical framework and presents the main hypotheses. Section 3 describes data, methodology and descriptive analysis. The empirical results are depicted in section 4. The robustness tests are presented in section 5 and finally section 6 concludes. 2. Literature review
Based on the separation between ownership and control in a firm, agency theory is positioned at the heart of the theoretical framework of the relationship between financial information quality and cost of capital. Given the existence of agency costs which may be detrimental to capital providers and their interests, it is important to establish effective governance mechanisms by providing high quality of financial information. Diamond and Verrecchia (1991) argue that the transparency of financial reporting reduces information asymmetry and increases investor demand for shares, which, by the way, improves the firm’s liquidity and reduces its financing cost.
In addition to the agency theory, the relationship between the financial information quality and the cost of capital is theoretically explained by several other theories such as the Entrenchment theory. According to Stiglitz and Edlin (1992), the management entrenchment

Financial Information Quality and Cost of Equity Capital 40
Copyright © 2017 JAEBR ISSN 1927-033X
is manifested by the manipulation of information, its withholding or by making its access costs high. As a result, the company's cost of capital increases.
The signal theory and the positive accounting theory are other theories that can explain appropriately the relationship between governance attributes and cost of equity capital. The main empirical results related to the main financial information quality attributes are presented hereafter. 2.1 Earnings quality and cost of equity capital
Prior studies examine the relationship between earning quality and cost of equity capital. Ashbaugh et al. (2004) define the earnings quality with abnormal accruals which positively influences the cost of equity. Francis et al. (2005) tested the association between accruals quality as measured by abnormal accruals and the cost of capital. Their result shows a negative relationship between the quality of accruals, the cost of equity and the cost of debt.
Francis et al. (2008) investigate the relationship between voluntary information disclosure, the earnings quality and the cost of capital. They find that the effect of disclosure on the cost of capital decreases or simply disappears if it is conditioned by the earnings quality.
In the Australian context which is characterized by institutional and regulatory differences that are expected to have an influence on the relationship between accruals quality and cost of capital, Gray et al. (2009) show that the cost of equity and the cost of debt are largely influenced by the accruals quality resulting from economic fundamentals and not from the choice of discretionary reporting.
In the Tunisian context, Triki and Omri (2010) study the effect of the earnings quality on the cost of equity capital of listed companies. They conclude that there is a significant relationship between these two variables. This supports the theoretical debate stating that investors are interested in reliable financial information that enables them to diversify their portfolios.
Demirkan et al. (2012) examine the effect of discretionary accruals on the cost of capital. They distinguish diversified firms from non-diversified ones. The authors confirm their hypothesis by showing that the discretionary accruals quality is less important in diversified firms. Furthermore, the cost of capital is higher in these firms compared to the one in non-diversified firms. The authors explain these results by the severe agency problems characterizing firms that are diversifying their business.
In this same line of research, Artiach and Clarkson (2014) look for the economic consequences of accounting conservatism by testing its effect on the cost of equity. Based on US listed companies, the authors confirm the inverse relationship between accounting conservatism and their ex ante measure of the cost of equity.
Based on a sample of privatized multinational enterprises in industrialized and developing countries, Ben-Nasr and Al-Dakheel (2015) recently examined the relationship between earnings quality and cost of equity capital. They find a positive relationship between the absolute value of abnormal accruals and the cost of equity capital.
Khalifa and Ben Othman (2015) tested the relationship between the earnings quality, defined by the conditional accounting conservatism and the cost of equity. They confirm,

41 M. Dakhlaoui, A. Lajmi and M. R. Gana
Copyright © 2017 JAEBR ISSN 1927-033X
first, the presence of accounting conservatism in MENA countries. Thereafter, the inverse relationship between the conditional conservatism and the cost of equity is verified.
Persakis and Iatridis (2015) show that the association between the attributes of earnings quality and the cost of capital is significantly negative before and during the crisis of 2008. Indeed, the authors find that the ex post conservatism and the earnings relevance, before the crisis, and the accruals quality and earnings relevance, during the crisis period, are negatively associated with the cost of equity capital. Accordingly, the following hypothesis is developed: H1: Earnings quality negatively affects the cost of equity capital. 2.2 Financial transparency and cost of equity capital
Lev (1988) stipulates that by reducing the information asymmetry the financial transparency will contribute to enhance the market liquidity. With reference to several empirical studies, the result of increasing the transparency and liquidity will reduce the cost of capital (Hail, 2002), specifically the cost of equity capital (Diamond and Verrecchia, 1991) and the cost of debt (Sengupta, 1998). This last result is related to the reduction of bid-ask spreads (Botosan and Plumlee, 2002), the improvement of the transaction volumes and the reduction of the volatility of the stock return (Leuz and Verrecchia, 2000). As well, the inverse relationship between financial transparency and the cost of capital is justified in part by its role in reducing the risk of shareholders’ expropriation and thus, reducing the rate of return required by investors.
Ashbaugh et al. (2004) find an inverse relationship between financial transparency, measured by the earnings transparency and the cost of equity capital. In another study, Ashbaugh et al. (2006) find that more transparent earnings reduce idiosyncratic risk, beta and cost of equity capital. These results agree with the general hypothesis showing that good governance present less agency risk for shareholders and result in lower required return for their shares.
In the Tunisian context, Khlif and Bouri (2006) conduct a disclosure index to estimate the level of transparency. The authors did not find any association between the cost of equity capital and the transparency measure. Khlif (2009) examines the relationship between disclosure and cost of equity capital. Empirically, this relationship is not verified. Among all the tested hypotheses, only the one on the lack of interaction between the disclosure score and the cost of equity in the case of adopting conservative accounting choices is verified.
In the American context, Barth et al. (2013) test the effect of the earnings transparency on the cost of capital. Mainly, the study confirms that the governance indicator is significantly and negatively related to the cost of capital.
In a recent study, Tran (2014) reveal that firms with a high level of financial transparency, as measured by a disclosure score, minimize their cost of equity. The same conclusion is advanced by Francis et al. (2005). Based on the above discussion, we derive the following hypothesis: H2: Financial transparency negatively affects the cost of equity capital. 2.3 External audit quality and cost of equity capital
The positive signals of transparency and financial credibility resulting from the use of qualified auditor may adversely affect the cost of capital. Khurana and Raman (2004) find a negative association between the audit quality measured by a BIG 4 auditor and the ex ante

Financial Information Quality and Cost of Equity Capital 42
Copyright © 2017 JAEBR ISSN 1927-033X
cost of equity capital for companies based in the United States but not for companies in other countries (Australia, Canada and United-Kingdom). Li et al. (2009) demonstrate a direct effect of audit quality in mitigating the cost of equity. The indirect effect is that the shift to an audit quality mitigates the positive relationship between total accruals and cost of equity capital. El Ghoul et al. (2016) compare the effect of the audit choice on the cost of ex ante capital of public companies in 37 countries. Their results show a decrease of 55 and 23 points in the cost of equity of US and non-US companies, respectively, when choosing a BIG 4 auditor. In their study, Fernando et al. (2010) find a negative effect of the auditor size, its industrial specialization and the audit duration on the cost of capital. Similarly, the authors find that the client firm’s cost of capital increases when the auditor issues an opinion other than “subject to”. Hajiha and Sobhani (2012) conclude that the quality of the audit can reduce the cost of capital in emerging markets. Their results indicated that the auditor size, his specialization in the industry, and the auditor tenure (4 years) reduce the cost of equity capital. This is in line with the results of Choi and Lee (2014) who find, in the American context, a negative relationship between the choice of a BIG 4 auditor and the cost of equity capital. The authors show that this negative relationship is more pronounced when firms are more diversified. In a recent study, Persakis and Iatridis (2015) conclude that cost of equity capital is negatively associated with audit quality, as measured by BIG 4 control, and the existence of an audit committee. We express our third hypothesis as follows: H3: External audit quality negatively affects the cost of equity. 3. Data, methods and descriptive analysis 3.1 Sample and data sources
In order to test our hypotheses in the Tunisian context, we select a sample of 26 companies listed on the TSE. This number is limited because we have eliminated the financial companies due to their specific financial data. This study is based on observations from 2004 to 2010. The choice of not going beyond 2010 was made to avoid getting results that are influenced by the post-revolution period; a period in which the TSE has been widely affected. The data are calculated manually by consulting the publications of the sample companies (annual reports, prospectuses...) available at the Financial Market Council, among some brokers or some companies’ websites and on the publications of the TSE.
3.2 Variables measurement 3.2.1 Cost of equity capital (COE)
Several studies show the complexity of the assessment of the cost of equity. In this regard, there are several valuation models developed by previous studies. These models are divided into two types. The first type includes the ex-ante measures (based on forecast data). However, the second type of models includes the ex post measures (based on historical data). Given the criticisms addressed to the first type of measures and problems to meet the conditions of their application (including a dividend growth rate or forecasted earnings), especially in the context of emerging countries such as Tunisia, we will use an ex post measure of the COE. Referring to the study of Dakhlaoui and Gana (2015), we choose to use the Four Factor Pricing Model (FFPM) developed by Carhart (1997). Thus, the monthly annualized cost of equity capital is estimated for each company in accordance to the following formula [1]:
tiCOE , = tRf + ib )( RfRM − + SMBsiˆ + HMLhi + WMLwiˆ (1) Where: COEi,t : the annualized cost of equity capital of firm i in month t ; Rft : The annualized risk-free rate in month t ;

43 M. Dakhlaoui, A. Lajmi and M. R. Gana
Copyright © 2017 JAEBR ISSN 1927-033X
)( RfRM − , SMB , HML and WML : the annualized average risk premiums (market risk premium, size, value and momentum premium, respectively) ; ib , is , ih and iw : Firm-Specific Coefficients [2].
The annual cost of equity (COE) for a firm i will be equal to the geometric mean of the monthly annualized costs.
3.2.2 Financial information quality proxies
Financial information quality proxies are defined as follows: - Accruals quality (AQ)
The first financial information quality proxy is the accruals quality, based on McNichols (2002) model. This one has been considered by several authors such as Kim and Qi (2010) and Klai and Omri (2011). McNichols (2002) constructed the model based on the main contributions of Dechow and Dichev (2002) model and on the criticisms addressed to the modified Jones (1991) model.
Thus, the equation is presented as follows:
ti
ti
AATCA
,
, = a0 + a1 ti
ti
AACFO
,
1, − + a2 ti
ti
AACFO
,
, + a3 ti
ti
AACFO
,
1, + + a4 ti
ti
AAREV
,
,∆ + a5 ti
ti
AAPPE
,
, + vit (2)
Where: TCAi,t : Total current accruals of firm i in year t (TCAi,t = ΔCAi,t - ΔCLi,t - ΔCASHi,t + ΔDEBTCLi,t) ; CFOi,t : Cash flow from operations of firm i in year t (CFOi,t = NIi,t - TAi,t) ; TAi,t : Total accruals of firm i in year t (TAi,t = TCAi,t - DAEi,t) ; ΔREVi,t : Firm i’s change in revenues between t-1 and t ; PPEi,t : Gross property, plant and equipment of firm i in year t ; AAi,t : Firm i’s average total assets between t-1 and t ; ΔCAi,t : Firm i’s change in current assets between t-1 and t ; ΔCLi,t : Firm i’s change in current liabilities between t-1 and t ; ΔCASHi,t : Firm i’s change in cash between t-1 and t ; ΔDEBTCLi,t : Firm i’s change in debt in current liabilities between t-1 and t ; NIi,t : Net income of firm i in year t ; DAEi,t : Depreciation and amortization expense of firm i in year t.
The accruals quality is measured, in our case, by the standard deviation of the residuals obtained from the regression of the equation (2). This measure is used in several previous research such as Kim and Qi (2010) and Raman et al. (2013).
As the residuals reflect a low accruals quality and to facilitate the interpretation, we multiplied this measure by (-1):
AQi,t = - σi ( tiv ,ˆ ) (3)
- Financial transparency (TRANS)
The financial transparency proxy is based on several empirical studies, such as the studies of Ashbaugh et al. (2004, 2006), and is derived from the following equation:

Financial Information Quality and Cost of Equity Capital 44
Copyright © 2017 JAEBR ISSN 1927-033X
(4)
Where: RETi,t : Adjusted return for firm i in year t ; NIPSi,t : Net income per share for firm i in year t ; Pi,t-1: Adjusted share price of firm i at the end of the year t-1; LOSSi,t: Is equal to one if NIPSi,t < 0 and zero otherwise ; ΔNIPSi,t : Firm i’s change in net income per share between t-1 and t ; NIPSi,t / Pi,t-1 x LOSSi,t : Interaction term.
The residuals reflect the degree of price or return variation that is not explained by the accounting earnings (Gu, 2007). Thus, low residuals indicate more transparent earnings.
Based on the last equation, financial transparency is measured, like AQ, as follows:
TRANSi,t = - σi ( ti ,
∧
θ ) (5)
- Audit quality index (AQI)
Several studies (Khurana and Raman, 2004; Persakis and Iatridis, 2015) explain the cost of capital through auditors belonging to the Big network. In addition, the control exercised by more than one auditor promotes the information credibility and helps create a good governance practices. To measure the audit quality, we construct an index (AQI) based on a non-weighted summation [3]. A score of 1 is assigned to the company if its auditor belongs to the BIG 4. If the company is audited by two auditors, we add a score of 1 to its index [4]. After building the index, its validity and reliability are verified [5].
3.2.3 Control variables - Firm size (SIZE)
The size is measured by the natural logarithm of the firm's total assets. Many studies such as Gana and Lajmi (2013) and Choi and Lee (2014) use this measure. The firm size mitigates the cost of equity which is advanced by several studies in a corporate governance context (Boujelbene and Affes, 2013; Chen et al., 2011). Thus, we assume that the firm size is negatively associated with the cost of equity capital.
- Financial leverage (LEV)
Financial leverage is measured by the ratio total debt divided by the firm's total assets. This ratio is also a measure of financial risk related to the company's business. Hence, since Modigliani and Miller (1958), it is established that the cost of equity increases when financial leverage increases. This measure is used in several studies such as Lim et al. (2014) and Persakis and Iatridis (2016). The positive relationship between leverage and the cost of equity is advanced by Chen et al. (2011). Thus, we predict that financial leverage is positively related to the cost of equity capital.
titi
titi
ti
titi
ti
titi P
NIPSbLOSS
PNIPS
bLOSSbP
NIPSbbRET ,
1,
,4,
1,
,3,2
1,
,10, θ+
∆+×+++=
−−−
45 M. Dakhlaoui, A. Lajmi and M. R. Gana
Copyright © 2017 JAEBR ISSN 1927-033X
- Return on assets (ROA) Return on assets is reflected by the ratio net income divided by the firm's total assets. Many studies, such as Dhaliwal et al. (2014), Tsipouridou and Spathis (2014) and Howe and Houston (2016) use this ratio. Muiño and Trombetta (2009) argue that because the ROA includes the risk level, it may be the best predictor for the cost of equity capital. Lopes and De Alencar (2010) contest that this performance indicator influences the relationship between disclosure and the cost of capital since the most profitable firms are more likely to disclose information and are likely to have a low cost of capital. Thus, the most successful firms are likely to overcome information asymmetries as they build more trust with their current and potential shareholders. Consequently, the cost of equity capital is less important. This leads us to predict a negative relationship between the financial performance and the cost of equity capital.
- Firm age (AGE) Ghorbel and Kolsi (2011) as well as Tsipouridou and Spathis (2014) use firm age as a control variable. The firm age is measured as follows:
AGEi,t = Ln (1+(year t – year of creation)) (6)
Choi and Lee (2014) find that, for young firms with a severe level of information asymmetry, the interaction between the choice of a BIG 4 auditor and the number of sectors is negatively and significantly related to the cost of equity capital. Hwang et al. (2013) predict that the firm age affects the ex ante cost of equity capital measures. Their results show a negative but not a significant relationship between these variables. In the case of emerging market, we assume that young firms face severe agency problems, asymmetric information and high risk level. They will not, therefore, be able to convince their current and potential shareholders with their good management. Therefore, a negative relationship between firm age and cost of equity capital is predicted. 3.3 Models specification and methods
To test the previous hypotheses, two multiple regressions are applied. The first one reefers to the current cost of equity (COEt) and the second one reefers to the subsequent cost of equity (COEt+1). Considering these two costs of equity gives interesting information concerning how the market reacts to financial information quality instantly and over a longer horizon of one year after the information has been publicly communicated.
The econometric specifications are formulated as follows: COEi,t = e0 + e1 AQi,t + e2 TRANSi,t + e3 AQIi,t + e4 SIZEi,t + e5 LEVi,t + e6 ROAi,t + e7 AGEi,t + ξi,t (7) COEi, t+1 = f0 + f1 AQi,t + f2 TRANSi,t + f3 AQIi,t + f4 SIZEi,t + f5 LEVi,t + f6 ROAi,t + f7 AGEit + µi,t (8) Where: COEt (t+1): Cost of equity capital in the year t (t+1); AQ: Accruals quality measure; TRANS: Financial transparency measure; AQI: Audit quality index;

Financial Information Quality and Cost of Equity Capital 46
Copyright © 2017 JAEBR ISSN 1927-033X
SIZE: Firm size; LEV: Financial leverage; ROA: Return on assets; AGE: Firm age.
Our results are based on the bootstrap method associated with the Ordinary Least Squares “OLS” estimation. The narrowness of our sample leads us to use the bootstrapping approach to get efficient estimators [6]. The choice of this method is preceded by Durbin’s (1954) and Wu–Hausman’s (Wu 1974; Hausman 1978) endogeneity tests of all variables. When the null hypothesis of these tests (after Two-Stage least squares regression “2SLS”) is accepted, it means that the variables under consideration can be treated as exogenous. Thus, the OLS estimator is more efficient than instrumental-variables one. Endogeneity tests are performed after going through an instruments validity tests. Thus, Using the 2SLS estimator, we perform Sargan’s (1958) and Basmann’s (1960) tests of overidentifying restrictions. These tests simultaneously test whether the instruments are valid and if the structural equation is correctly specified. Panel A of table 1 reports the validity of the instrumental variables while Panel B of table 1 shows that our variables are exogenous.
Table 1: Overidentifying restrictions and endogeneity tests
Panel A : Over identifying restrictions tests
Instrumental variables (2SLS) regression : Instrumented : AQ TRANS AQI SIZE LEV ROA AGE Instruments : AQ2 AQ3 TRANS2 TRANS3 AUDIT2
LSIZE LLEV LROA LAGE
Dependent variable
COEt COEt+1
Sargan (score) chi2 (2) 2.32392 (p = 0.3129) 0.717043 (p = 0.6987) Basmann chi2 (2) 2.1842 (p = 0.3355) 0.657229 (p = 0.7199)
Panel B : Endogenity Tests Instrumental variables (2SLS) regression :
Instrumented: AQ TRANS AQI SIZE LEV ROA AGE Instruments : AQ2 AQ3 TRANS2 TRANS3 AUDIT2
LSIZE LLEV LROA LAGE
Dependent variable
COEt COEt+1
Durbin (score) chi2(7) 5.63487 (p = 0.5830) 8.93436 (p = 0.2574) Wu-Hausman F (1,115) 0.744364 (p = 0.6349) 1.20122 (p = 0.3095)
Notes: Where: COEt (t+1): cost of equity capital in the year t (t+1) based on the FFPM; AQ: accruals quality based on the standard deviation of residuals calculated from the regression of the model (2); AQ2 and AQ3: alternative accruals quality measures based on the absolute value and the squared value of residuals issued from the regression of the model (2), respectively; TRANS: financial transparency based on the standard deviation of residuals calculated from the regression of the model (4); TRANS2 and TRANS3: alternative financial transparency measures based on the absolute value and the squared value of residuals issued from the regression of the model (4), respectively; AQI: audit quality index measured as the sum of notes attributed to the selected items; AUDIT2: binary variable that takes 1 in case of co-auditor ship, 0 otherwise; SIZE: size of the firm measured by the natural logarithm of the value of assets of the firm; LEV: financial leverage measured by the ratio total debt divided by firm's total assets; ROA: return on assets measured by the ratio net income divided by total assets of the firm; AGE: age of the firm measured by the natural logarithm of 1+ (year t – year of creation). LSIZE, LLEV, LROA and LAGE: lagged control variables (t-1). 3.4 Descriptive analysis
Panel A of table 2 presents the main descriptive statistics of the used variables. The first line of this panel displays an average value of the cost of equity capital around 18%. This same indicator has a volatility about 7% which corresponds to a standard error of 0.55%. This value is lower than those recorded by Ng and Rezaee (2015). Indeed, the authors find

47 M. Dakhlaoui, A. Lajmi and M. R. Gana
Copyright © 2017 JAEBR ISSN 1927-033X
standard errors of the 2.728% and 2.903%. As for the study of Triki (2010), it displays, in the Tunisian context, an average cost of equity over 11% with a standard-deviation of 5%. All these authors based their work on the Three Factor Pricing Model.
The AQI has the largest mean value; this variable is also the most volatile. This reflects the differences between the sample firms in terms of auditor choice. Descriptive statistics show that the size has a high volatility (0.88). This statistical indicator demonstrates the heterogeneity of our sample. The level of debt in the Tunisian firm’s financial structure is not negligible. Indeed, LEV has an average value close to 0.40. In addition, the average ROA of our sample is 5.5%. It has the lowest standard deviation regarding the control variables (8.9%). The firms have an average age of 33 years with a high standard deviation (0.44). Table 2: Descriptive analysis
COEt AQ TRANS AQI SIZE LEV ROA AGE
Panel A : Summary statistics Mean Standard deviation Min Max
0.182 0.069 0.091 0.443
-0.105 0.091 -0.461 -0.024
-0.122 0.117 -0.492 -0.006
0.632 0.815 0.000 2.000
17.933 0.882
16.539 21.113
0.395 0.247 0.019 1.592
0.055 0.089 -0.255 0.400
3.518 0.442 2.485 4.454
Panel B : Correlation matrix COEt 1 AQ -0.1072 1 TRANS -0.1152 -0.0835 1
AQI -0.2872*** -0.0932 0.0719 1
SIZE -0.2284*** -0.0597 -0.3442*** 0.4913*** 1 LEV 0.0537 0.0277 -0.0162 0.2551*** 0.3770*** 1
ROA -0.2378*** -0.1660** -0.0232 0.0628 -0.0409 -0.5181*** 1
AGE -0.3567*** 0.0994 -0.2830*** 0.2761*** 0.4425*** -0.0149 0.3963*** 1
Notes: Where: COEt : cost of equity capital in the year t based on the FFPM; AQ: accruals quality based on the standard deviation of residuals calculated from the regression of the model (2); TRANS: financial transparency based on the standard deviation of residuals calculated from the regression of the model (4); AQI: audit quality index measured as the sum of notes attributed to the selected items; SIZE: size of the firm measured by the natural logarithm of the value of assets of the firm; LEV: financial leverage measured by the ratio total debt divided by firm's total assets; ROA: return on assets measured by the ratio net income divided by total assets of the firm; AGE: age of the firm measured by the natural logarithm of 1+ (year t – year of creation). ***, ** and * denote significance at 1%, 5% and 10% respectively.
In order to verify the existence of a relationship between the variables, we presented the
Pearson correlation matrix in panel B of table 2. Among our governance measures, only AQI is significantly and negatively correlated with COE. The meaning of this correlation is a priori consistent with our hypothesis. As for the firms’ characteristics, the size, financial performance and age exhibit significantly negative correlation coefficients with the cost of equity (at the 1% level). This result highlights that the cost of equity is reduced for the large, successful or old firms. The correlation matrix shows insignificant coefficients, except the performance measure, between the accruals quality and the remaining variables. Besides, the variable TRANS is inversely correlated with SIZE and AGE, while AQI records positive correlations with SIZE, LEV and AGE.
Financial Information Quality and Cost of Equity Capital 48
Copyright © 2017 JAEBR ISSN 1927-033X
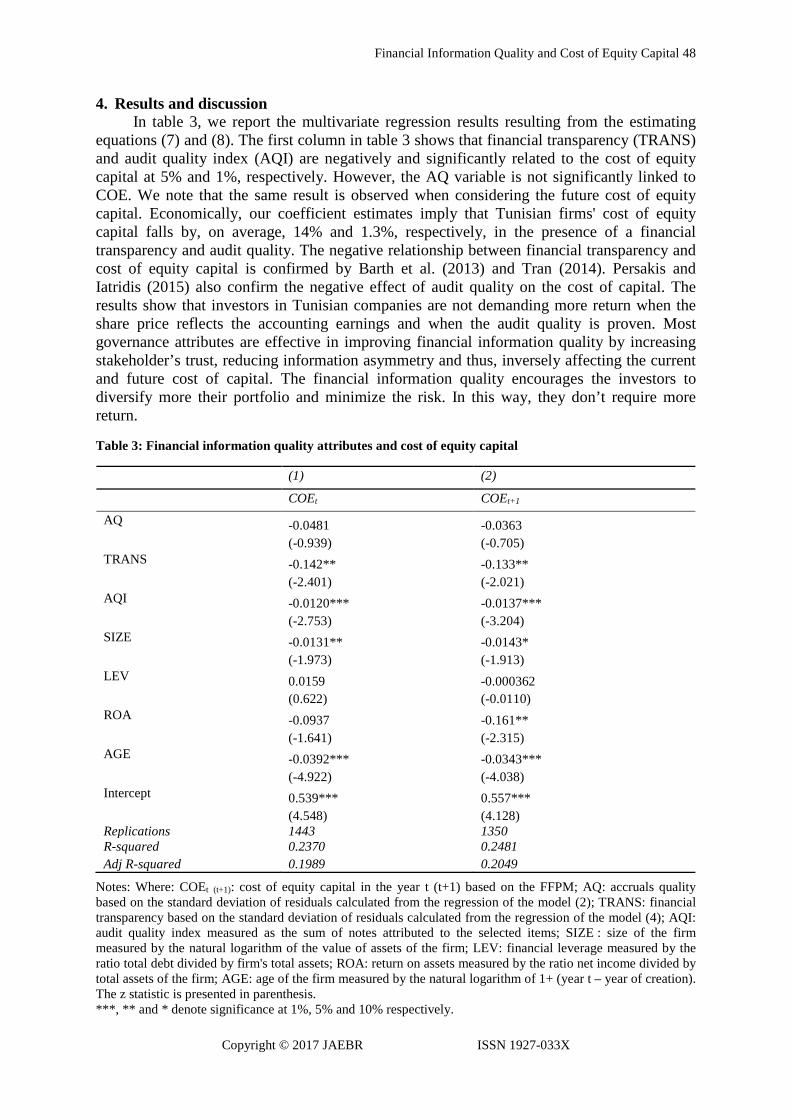
4. Results and discussion In table 3, we report the multivariate regression results resulting from the estimating
equations (7) and (8). The first column in table 3 shows that financial transparency (TRANS) and audit quality index (AQI) are negatively and significantly related to the cost of equity capital at 5% and 1%, respectively. However, the AQ variable is not significantly linked to COE. We note that the same result is observed when considering the future cost of equity capital. Economically, our coefficient estimates imply that Tunisian firms' cost of equity capital falls by, on average, 14% and 1.3%, respectively, in the presence of a financial transparency and audit quality. The negative relationship between financial transparency and cost of equity capital is confirmed by Barth et al. (2013) and Tran (2014). Persakis and Iatridis (2015) also confirm the negative effect of audit quality on the cost of capital. The results show that investors in Tunisian companies are not demanding more return when the share price reflects the accounting earnings and when the audit quality is proven. Most governance attributes are effective in improving financial information quality by increasing stakeholder’s trust, reducing information asymmetry and thus, inversely affecting the current and future cost of capital. The financial information quality encourages the investors to diversify more their portfolio and minimize the risk. In this way, they don’t require more return.
Table 3: Financial information quality attributes and cost of equity capital
(1) (2)
COEt COEt+1 AQ -0.0481 -0.0363
(-0.939) (-0.705) TRANS -0.142** -0.133**
(-2.401) (-2.021) AQI -0.0120*** -0.0137***
(-2.753) (-3.204) SIZE -0.0131** -0.0143*
(-1.973) (-1.913) LEV 0.0159 -0.000362
(0.622) (-0.0110) ROA -0.0937 -0.161**
(-1.641) (-2.315) AGE -0.0392*** -0.0343***
(-4.922) (-4.038) Intercept 0.539*** 0.557***
(4.548) (4.128) Replications 1443 1350 R-squared 0.2370 0.2481 Adj R-squared 0.1989 0.2049
Notes: Where: COEt (t+1): cost of equity capital in the year t (t+1) based on the FFPM; AQ: accruals quality based on the standard deviation of residuals calculated from the regression of the model (2); TRANS: financial transparency based on the standard deviation of residuals calculated from the regression of the model (4); AQI: audit quality index measured as the sum of notes attributed to the selected items; SIZE : size of the firm measured by the natural logarithm of the value of assets of the firm; LEV: financial leverage measured by the ratio total debt divided by firm's total assets; ROA: return on assets measured by the ratio net income divided by total assets of the firm; AGE: age of the firm measured by the natural logarithm of 1+ (year t – year of creation). The z statistic is presented in parenthesis. ***, ** and * denote significance at 1%, 5% and 10% respectively.

49 M. Dakhlaoui, A. Lajmi and M. R. Gana
Copyright © 2017 JAEBR ISSN 1927-033X
Turning to the control variable, the coefficient associated with SIZE is significantly negative (at 5% and 1% level) when considering the cost of equity in t and t + 1, respectively. Hence, we confirm our hypothesis stipulating that the shareholders of large companies do not require an important rate of return on their invested funds. This result coincides with several research, similar to our first regression, such as those conducted by Botosan and Plumlee (2002) and Ashbaugh et al. (2004, 2006). The negative effect of size on the lagged cost of equity capital is validated by La Rosa and Liberatore (2014) and Dhaliwal et al. (2014). In addition to the size, the firm age has a negative and significant coefficient at 1% level in both regressions. This confirms the previous predictions. Therefore, according to several studies, older firms enjoy less cost of equity capital. This suggests that, by requiring additional returns, investors do not trust the management and governance of young firms. Furthermore, we note that ROA negatively affects the future cost of equity (-0.161). The most performing companies show a better financial information quality, which reduces, over the long term, their cost of capital.
We also note that the constant term of our models is still significantly positive at 1% level. This result proves that our explanatory variables can partially explain the cost of equity capital of the listed Tunisian firms and subsequently other determinants of this indicator can be added. Further, the overall significance of the models (7) and (8) expressed by the adjusted R-squared, is about 20%. 5. Robustness check
After separately analyzing the effect of various financial information quality measures, we test the robustness of our results by using the Principal Components Analysis technique in order to join our governance attributes in one axis, and then test the general hypothesis of our research in the Tunisian context. We retain the Nonlinear Principal Component Analysis (NPCA) method. The choice of this method is justified by the nature of the selected variables [7]. It allows us to construct and validate a financial information quality index [8].
We also supplement our robustness analysis by checking the existence of a threshold effect. In particular, we try to check whether the quadratic relationship is present between the financial information quality index and the cost of equity capital in t and t + 1[9]. Thus, we estimate the next specifications: COEi,t = g0 + g1 FIQIi,t + g2 SIZEi,t + g3 LEVi,t + g4 ROAi,t + g5 AGEi,t + αi,t (9) COEi, t+1 = h0 + h1 FIQIi,t + h2 SIZEi,t + h3 LEVi,t + h4 ROAi,t + h5 AGEit + £i,t (10) COEi,t = i0 + i1 FIQIi,t + i2 FIQI2
i,t + i3 SIZEi,t + i4 LEVi,t + i5 ROAi,t + i6 AGEi,t + πi,t (11) COEi, t+1 = j0 + j1 FIQIi,t + j2 FIQI2
i,t + j3 SIZEi,t + j4 LEVi,t + j5 ROAi,t + j6 AGEit + €i,t (12) Where FIQI represents the financial information quality index. Table 4 reports the validity of the instruments and the exogeneity of our selected variables. Table 5 summarizes the results of the regressions using the Bootstrapping approach with the OLS estimation.

Financial Information Quality and Cost of Equity Capital 50
Copyright © 2017 JAEBR ISSN 1927-033X
Table 4: overidentifying restrictions and endogeneity tests
Panel A : Overidentifying restrictions tests
Instrumental variables (2SLS) regression : Instrumented:FIQI SIZE LEV ROA AGE Instruments : AQ TRANS AQI LSIZE LLEV LROA LAGE
Dependent variable
COEt COEt+1
Sargan (score) chi2 (2) 1.59475 (p = 0.4505) 0.9751 (p = 0.6128) Basmann chi2 (2) 1.5152 (p = 0.4688) 0.91757 (p = 0.6321) Instrumental variables (2SLS) regression : Instrumented:FIQI FIQI2 SIZE LEV ROA AGE Instruments : AQ2 TRANS2 LAQI LSIZE LLEV LROA LAGE
COEt COEt+1
Sargan (score) chi2 (1) 3.30031 (p = 0.0693) 1.43158 (p = 0.2315) Basmann chi2 (1) 3.17789 (p = 0.0746) 1.34654 (p = 0.2459)
Panel B : Endogeneity tests
Instrumental variables (2SLS) regression : Instrumented:FIQI SIZE LEV ROA AGE Instruments : AQ TRANS AQI LSIZE LLEV LROA LAGE
Dependent variable
COEt COEt+1
Durbin (score) chi2(5) 6.62234 (p = 0.2503) 7.97325 (p = 0.1577) Wu-Hausman F (5, (119,101)) 1.27747 (p = 0.2782) 1.54825 (p = 0.1817) Instrumental variables (2SLS) regression : Instrumented:FIQI FIQI2 SIZE LEV ROA AGE Instruments : AQ2 TRANS2 LAQI LSIZE LLEV LROA LAGE
COEt COEt+1
Durbin (score) chi2(6) 4.72145 (p = 0.5800) 7.87133 (p = 0.2477) Wu-Hausman F (6, (117,99)) 0.734909 (p = 0.6225) 1.24727 (p = 0.2890)
Notes: Where: COEt (t+1): cost of equity capital in the year t (t+1) based on the FFPM; FIQI: financial information quality index constructed according to the NPCA technique; FIQI2: squared financial information quality index; AQ: accruals quality based on the standard deviation of residuals calculated from the regression of the model (2); AQ2: alternative accruals quality measure based on the absolute value of residuals issued from the regression of the model (2); TRANS: financial transparency based on the standard deviation of residuals calculated from the regression of the model (4); TRANS2: alternative financial transparency measure based on the absolute value of residuals issued from the regression of the model (4); AQI: audit quality index measured as the sum of notes attributed to the selected items; LAQI: lagged variable of AQI (t-1); SIZE: size of the firm measured by the natural logarithm of the value of assets of the firm; LEV: financial leverage measured by the ratio total debt divided by firm's total assets; ROA: return on assets measured by the ratio net income divided by total assets of the firm; AGE: age of the firm measured by the natural logarithm of 1+ (year t – year of creation). LSIZE, LLEV, LROA and LAGE: lagged control variables (t-1).
The first column in table 5 shows that the financial information quality index is significantly related to our cost of equity capital measure (at 1% level). Moreover, the negative coefficient, when comparing with the results presented in table 3, shows that the financial information quality attributes reduce the required return of shareholders for the same period when they are combined in a single component. Furthermore, this relationship shows that the insignificant effect of the earnings quality on the cost of capital, previously noted, is absorbed when combined with financial transparency and audit quality. Thus, the immediate effect of financial information quality is checked in this case. This highlights the complementary effect of AQ, TRANS and AQI in reducing the current cost of equity.
These results do not change when the dependent variable is the future cost of equity. The second column in table 5 shows that the effect of financial information quality on the future cost of equity capital is also negatively significant at 1% level. So, companies with better governance practices, represented by their financial information quality, have a current and future cost of equity capital around 2.42% lower compared to companies that have poorer

51 M. Dakhlaoui, A. Lajmi and M. R. Gana
Copyright © 2017 JAEBR ISSN 1927-033X
governance practices. Shareholders are, therefore, less requiring returns if the firm ensures financial transparency and audit quality and limit the earnings management.
Our results confirm the importance of the complementary relationship between the trinomial AQ, TRANS and AQI in reducing the current and future firm cost of capital in the Tunisian context.As for the control variables, both AGE and ROA are inversely and significantly related to the current and future cost of equity capital. Thus, the old and high performing Tunisian firms benefit from low cost of capital. This result can be explained by the fact that they are establishing principles of good governance. However, the SIZE variable is not significant. We notice that the joint significance of the exogenous variables included in the linear models, through the adjusted R-squared, is the same, about 26% in both cases. Therefore, the use of the financial index increases the overall explanatory power of 6% for both models.
Table 5: Financial information quality index and cost of equity capital
(1) (2) (3) (4)
Linear relationship Quadratic relationship
COEt COEt+1 COEt COEt+1
FIQI -0.0242*** (-6.522)
-0.0242*** (-6.132)
-0.0275*** (-10.40)
-0.0275*** (-9.410)
FIQI2
0.0195*** (6.317)
0.0198*** (6.438)
SIZE -0.00544 (-1.038)
-0.00712 (-1.264)
-0.000161 (-0.0260)
-0.00295 (-0.479)
LEV 0.00642 (0.300)
-0.0114 (-0.402)
-0.0236 (-1.097)
-0.0399 (-1.555)
ROA -0.100* (-1.699)
-0.171*** (-2.610)
-0.136** (-2.538)
-0.192*** (-3.213)
AGE -0.0320*** (-4.039)
-0.0280*** (-3.390)
-0.0529*** (-6.622)
-0.0480*** (-5.919)
Intercept 0.396*** (4.250)
0.423*** (4.159)
0.368*** (3.444)
0.409*** (3.748)
Replications 981 1088 1226 906 R-squared 0.2781 0.2894 0.3485 0.3572 Adj R-squared 0.2525 0.2608 0.3208 0.3258 Threshold level - - 0.7 0.7
Notes: Where: COEt (t+1): cost of equity capital in the year t (t+1) based on the FFPM; FIQI: financial information quality index constructed according to the NPCA technique; FIQI2: squared financial information quality index; SIZE: size of the firm measured by the natural logarithm of the value of assets of the firm; LEV: financial leverage measured by the ratio total debt divided by firm's total assets; ROA: return on assets measured by the ratio net income divided by total assets of the firm; AGE: age of the firm measured by the natural logarithm of 1+ (year t – year of creation).
The z statistic is presented in parenthesis. ***, ** and * denote significance at 1%, 5% and 10% respectively.
By adding the squared financial information quality index to the models (9) and (10), the joint significance of the variables, shown in table 5, is notably improved (32.08% vs 25.25% and 32.58 vs 26.08). Columns 3 and 4 in table 5 indicate that the same coefficient of FIQI is significant and negative (-0.0275) while the coefficient of FIQI2 is significantly positive (0.0195 and 0.0198, respectively). This result confirms that there is no monotonic

Financial Information Quality and Cost of Equity Capital 52
Copyright © 2017 JAEBR ISSN 1927-033X
relationship between our governance index and the current and future cost of equity capital. This has allowed us to check the threshold level at which the relationship sign change [10]. This level is about 0.7.
In summary, the composite index describing the quality of financial information, through its three dimensions (accruals quality, financial transparency and audit quality), significantly affects the Tunisian companies' cost of capital. More specifically, the relationship between these two variables is nonlinear. The first level of the financial information quality reduces the cost of equity capital, since uncertainty about the company is reduced. Especially, it lowers the future liquidity risk by decreasing the uncertainty about the company's value. This decrease is indemnified by investors requiring lower remuneration of their funds (Paugam et al., 2013). The linear and negative association between cost of capital and the quality of accounting information is detected, in the Tunisian context, by Sebai et al. (2014) and Triki (2010).
From a certain threshold level, the relationship between the composite index and the cost of equity capital becomes positive. Since the SMB premium is positive while HML and WML premiums are negative (Dakhlaoui and Gana, 2015), this relationship can be further explained through the risk factors included in the Carhart (1997) model. Thus, it is only at the value stocks owned by large companies displaying high historical returns (momentum); a better financial information quality reduces their cost of equity capital. As for growth and small size firms, which displaying low historical returns, the financial information quality is a double-edged sword: it reduces the cost of equity capital but reaches a threshold level, the reverse sign indicates that certain opacity is necessary for the good functioning of these fragile firms. We remind here that Gana and Dakhlaoui (2011) find that social disclosure index affects the future cost of equity capital negatively then positively. 6. Conclusion
The purpose of this study was to extend our knowledge on the relationship between corporate governance and cost of equity in an emerging context, such as the Tunisian one, where the marginal effect of the changing of governance practices is more remarkable. In particular, we are interested in the financial information quality as a governance attribute. Three indicators were chosen to define this attribute: accruals quality, financial transparency and external audit quality. Similarly, we have assumed attenuation of the cost of equity capital by our governance attribute through these measures.
Our findings in the Tunisian context enabled us to validate the most of our hypotheses. Indeed, we conclude that financial transparency and external audit quality minimize the firm’s cost of capital. The same result is observed for the future cost of equity capital. This proves that the shareholders on the Tunisian market will demand less extra return if the company ensures financial transparency and external control entrusted to more than one auditor, especially if one of them is a BIG4 member. While the accruals quality wasn’t significant, a negative and significant relationship between the financial information quality index, composed of the three financial information quality attributes, and the cost of equity capital is confirmed by the robustness tests. Thus, financial information quality can be seen as an indicator of good corporate governance in our context, as it provides trust to current investors and attract potential ones to invest in the Tunisian market.
Our results confirm a complementary relationship between the trinomial AQ, TRANS and AQI in reducing the firm cost of capital in the Tunisian context. The findings also point

53 M. Dakhlaoui, A. Lajmi and M. R. Gana
Copyright © 2017 JAEBR ISSN 1927-033X
to demonstrate a U-shaped relationship between the financial information quality index and the current and future cost of equity capital. A first level of the financial information quality reduces the cost of equity capital since the uncertainty about the company is reduced. Beyond a threshold level, the relationship between our index and the current and future cost of equity capital becomes positive. This relationship sign can be explained by the fact that for growth and small size firms, which display low historical returns, the negative effect of financial information quality on cost of capital is limited since certain opacity is necessary for the good functioning of these fragile firms.
This study presents an empirical and methodological contribution distinguishing it from other studies, especially in the Tunisian context, as it is one of the few studies that investigate the relationship between information quality and cost of equity capital in an emerging market context (Tunisia), characterized by a low level corporate disclosure environment and a weak minority shareholders’ rights protection. So, this work will enrich the studies dealing with the corporate governance subject. It is also, to our knowledge, the first to explain the financial information quality by different attributes in the Tunisian context. Our study may enrich the literature describing the relationship financial information quality - cost of equity in the Tunisian context before the revolution and thus can serve as a benchmark to conduct comparisons by resorting to post-revolution observations.
In addition to the consideration of the current and future cost of equity capital, the
bootstrapping approach, the test of nonlinear relationships and the use of the NPCA method enrich the methodological and empirical contribution of this study. Finally, the use of the FFPM, previously validated in the Tunisian context (Dakhlaoui and Gana, 2015), distinguish our study from others that have dealt with the same context. Similarly, this paper shows that Tunisian listed firms could benefit from adopting the best practices of governance particularly those dealing with the information quality and that equity holders are concerned about the quality of financial information adopted by the firm to better protect their interests. Thus, a practical contribution can be added to our study.
Despite the above-mentioned contributions, this study has limitations. The first is related to the limited sample size. Furthermore, the analysis of the causal relationship between the cost of equity capital and our governance attribute appears important. Other financial information quality measures could have been used, such as accounting conservatism. Additional governance attributes could have a significant effect on the cost of equity capital and thus complete this research. These limitations extend our study to future research avenues.
Notes: 1. The calculation procedure is explicitly defined in Dakhlaoui and Gana (2015). 2. After checking the heterogeneity of coefficients, the coefficients vector specific to each
firm is determined on the basis of Swamy model using panel data estimation by the generalized least squares method.
3. This simple approach, consisting of a sum of notes without any weighting, was inspired from several research such as Eng and Mak (2003) and Gana and Lajmi (2012).
4. We thought it was appropriate to add an extra point when the second auditor belongs to a big network. However, no company in our sample meets this criterion.

Financial Information Quality and Cost of Equity Capital 54
Copyright © 2017 JAEBR ISSN 1927-033X
5. The internal coherence of our audit quality index is verified based on an analysis of Pearson correlation. Furthermore, the internal consistency of our index is checked through a Cronbach's alpha (Cronbach, 1951) and Kuder and Richardson (1937) coefficient (0.6926 and 0.6998, respectively).
6. The number of bootstrap replications needed is based on the Andrews and Buchinsky’s three-step method (Poi, 2004).
7. This analysis is beyond the limits of the linear PCA because it allows the analysis of continuous and categorical variables. Moreover, this method allows specifying non-linear relationships between variables by quantifying optimal qualitative variables relative to the number of specified dimensions (Meulman and Heiser, 2012).
8. The Cronbach's alpha reflecting the internal consistency of the index belongs to the acceptance zone since its value exceeds 0.6. Moreover, the eigenvalue of the one dimension created exceeds 1 (1.679), which allows retaining our index. Indeed this second indicator cannot exceed the number of items. The validity of the index is showed by the explained variance. It shows an effective contribution with a variance of 56%.
9. We advance this hypothesis, after conducting a graphical analysis, by presenting data scatter plot and a quadratic approximation (graphics available upon request) showing that the linearity of the relationship can be limited.
10. This level is determined using the STATA software. References Akhigbe A, McNulty JE, Stevenson BA. 2013. How does transparency affect bank financial
performance? International Review of Financial Analysis 29, 24-30. Artiach TC, Clarkson PM. 2014. Conservatism, disclosure and the cost of equity capital.
Australian Journal of Management 39:2, 293-314. Ashbaugh H, Collins DW, Lafond R. 2004. Corporate governance and the cost of equity
capital. University of Iowa Working Paper. Ashbaugh H, Collins DW. Lafond R. 2006. Corporate governance, risk and cost of equity
capital. University of Iowa Working Paper. Barth ME, Konchitchki Y, Landsman WR. 2013. Cost of capital and earnings transparency.
Journal of Accounting and Economics 55:2-3, 206-224. Basmann RL. 1960. On finite sample distributions of generalized classical linear
identifiability test statistics. Journal of the American Statistical Association 55:292, 650-659.
Ben-Nasr H, Al-Dakheel AM. 2015. The Impact of Earnings Quality on the Cost of Equity: Evidence from Privatized Firms. International Journal of Financial Research 6:1, 68-78.
Botosan CA, Plumlee M. 2002. A re-examination of disclosure level and the expected cost of equity capital, Journal of Accounting Research 40:1, 21-40.
Boubaker S, Nguyen DK, 2012. Board directors and corporate social responsibility, Palgrave Macmillan, UK.
Boujelbene MA, Affes H. 2013. The impact of intellectual capital disclosure on cost of equity capital: A case of French firms. Journal of Economics, Finance and Administrative Science 18:34, 45-53.

55 M. Dakhlaoui, A. Lajmi and M. R. Gana
Copyright © 2017 JAEBR ISSN 1927-033X
Carhart MM. 1997. On persistence in mutual fund performance. The Journal of Finance 52:1, 57-82.
Chen KCW, Chen Z, Wei KCJ. 2011. Agency costs of free cash flow and the effect of shareholder rights on the implied cost of equity capital. Journal of Financial and Quantitative Analysis 46:1, 171-207.
Chen H, Chen JZ, Lobo G, Yang Y. 2011. Effects of audit quality on earnings management and cost of equity capital: evidence from China. Contemporary Accounting Research 28:3, 892-925.
Choi JH, Lee WJ. 2014. Association between Big 4 Auditor Choice and Cost of Equity Capital for Multiple-Segment Firms. Accounting and Finance 54:1, 135-163.
Cronbach L. 1951. Coefficient alpha and the internal structure of tests. Psychometrika 16:3, 297-334.
Dakhlaoui M, Gana MR. 2015. Estimating the Cost of Equity Capital: An Empirical Analysis in the Tunisian Context. Accounting and Finance Research 4:2, 110-122.
Dechow P, Dichev I. 2002. The quality of accruals and earnings: the role of accrual estimation errors. The Accounting Review 77, 35-59.
Demirkan S, Radhakrishnan S, Urcan O. 2012. Discretionary accruals quality, cost of capital, and diversification. Journal of Accounting, Auditing & Finance 27:4, 496-526.
Dhaliwal D, Li OZ, Tsang A, Yang YG. 2014. Corporate social responsibility disclosure and the cost of equity capital: The roles of stakeholder orientation and financial transparency. Journal of Accounting and Public Policy 33:4, 328-355.
Diamond D, Verrecchia R. 1991. Disclosure, liquidity, and the cost of capital. The Journal of Finance 46:4, 1325-1359.
El Ghoul S, Guedhami O, Pittman J. 2016. Cross-country evidence on the Importance of big four auditors to equity pricing: the mediating role of legal institutions. Accounting, Organizations and Society 54, 60-81.
Durbin J. 1954. Errors in variables. Review of the International Statistical Institute 22:1/3, 23-32.
Eng LL, Mak YT. 2003. Corporate governance and voluntary disclosure. Journal of Accounting and Public Policy 22:4, 325-345.
Fernando GD, Abdel-Meguid AM, Elder RJ. 2010. Audit quality attributes, client size and cost of capital. Review of Accounting and Finance 9:4, 363-381.
Francis J, LaFond R, Olsson P, Schipper K. 2005. The market pricing of accruals quality. Journal of Accounting and Economics 39, 295-327.
Francis J, Nanda D, Olsson P. 2008. Voluntary disclosure, earnings quality, and the cost of capital. Journal of Accounting Research 46:1, 53-99.
Gana MR, Dakhlaoui M. 2011. Societal information disclosure and the cost of equity: The case of Tunisian companies. Global Journal of Management and Business Research 11:7, 1-8.
Gana MR, Lajmi A. 2012. Structure de propriété et qualité de l’audit externe : cas des entreprises belges cotées. Gestion 2000 29:3, 83-96.
Gana MR, Lajmi A. 2013. Audit committee and external audit quality: substitution or complementarity? Empirical evidence on Euronext Brussels. International Journal of Financial Management Research and Development 3:2, 22-38.

Financial Information Quality and Cost of Equity Capital 56
Copyright © 2017 JAEBR ISSN 1927-033X
Ghorbel H, Kolsi M. 2011. Effet des mécanismes de gouvernance sur la performance financière et boursière : Cas des entreprises canadiennes. Recherches en comptabilité et finance 6, 3-21.
Gray P, Koh PS, Tong YH. 2009. Accruals quality, information risk and cost of capital: evidence from Australia. Journal of Business Finance & Accounting 36:1-2, 51-72.
Gu Z. 2007. Across-sample incomparability of R2s and additional evidence on value relevance changes over time. Journal of Business Finance & Accounting 34:7-8, 1073-1098.
Hail L. 2002. The impact of voluntary corporate disclosures on the ex ante cost of capital for Swiss firms. European Accounting Review 11:4, 741-773.
Hajiha Z, Sobhani N. 2012. Audit quality and cost of equity capital: evidence of Iran. International Research Journal of Finance and Economics 94, 159-171.
Hausman JA. 1978. Specification tests in econometrics. Econometrica 46:6, 1251-1271. Howe JS, Houston R. 2016. Earnings Management, Earnings Surprises, and Distressed
Firms. Accounting and Finance Research 5:1, 64-87. Hwang LS, Lee WJ, Lim SY, Park KH. 2013. Does information risk affect the implied cost
of equity capital? An analysis of PIN and adjusted PIN. Journal of Accounting and Economics 55:2-3, 148-167.
Jones J. 1991. Earnings management during import relief investigations. Journal of Accounting Research 29:2, 193-228.
Khalifa M, Ben Othman H. 2015. The Effect of Conservatism on Cost of Capital: MENA Evidence. Applied Economics 47:1, 71-87.
Khlif H, Bouri A. 2006. Transparency level and cost of equity capital: The case of Tunisian stock exchange. Euro-Mediterranean Economics And Finance Review 1:2, 17-27.
Khlif H. 2009. Divulgation : Déterminants et Effet sur le Coût des Actions. PhD thesis in management sciences, University of Sfax, Tunisia.
Khurana IK, Raman KK. 2004. Litigation risk and the financial reporting credibility of big 4 versus non-big 4 audits: evidence from Anglo-American countries. The Accounting Review 79:2, 473-495.
Kim D, Qi Y. 2010. Accruals quality, stock returns, and macroeconomic conditions. The Accounting Review 85:3, 937-978.
Klai N, Omri A. 2011. Corporate governance and financial reporting quality: the case of Tunisian firms. International Business Research 4:1, 158-166.
Kuder GF, Richardson MW. 1937. The theory of the estimation of test reliability. Psychometrika 2:3, 151-160.
Lambert R, Leuz C, Verrecchia R. 2007. Accounting information, disclosure and the cost of capital. Journal of Accounting Research 45, 385-420.
LA Porta R, Lopez-De-Silanes F, Shliffer A, Vishny R. 1998. Law and finance. Journal of Political Economy 106:6, 1113-1150.
LA Rosa F, Liberatore G. 2014. Biopharmaceutical and chemical firms’ R&D disclosure, and cost of equity: The impact of the regulatory regime. European Management Journal 32:5, 806-820.
Leuz C, Verrecchia R. 2000. The economic consequences of increased disclosure. Journal of Accounting Research 38, 91-124.

57 M. Dakhlaoui, A. Lajmi and M. R. Gana
Copyright © 2017 JAEBR ISSN 1927-033X
Lev B. 1988. Toward a theory of equitable and efficient accounting policy. The Accounting Review 63:1, 1-20.
Li Y, Stokes D, Taylor SL, Wong L. 2009. Audit quality, earnings quality and the cost of equity capital. University of New South Wales Working Paper.
Lim M, How J, Verhoeven P. 2014. Corporate ownership, corporate governance reform and timeliness of earnings: Malaysian evidence. Journal of Contemporary Accounting & Economics 10:1, 32-45.
Lopes AB, De Alencar RC. 2010. Disclosure and cost of equity capital in emerging markets: The Brazilian case. The International Journal of Accounting 45:4, 443-464.
Mcnichols M. 2002. Discussion of the quality of accruals and earnings: the role of accrual estimation errors. The Accounting Review 77, 61-69.
Meulman JJ, Heiser WJ, 2012. IBM SPSS Categories 20, SPSS, Inc, Chicago. Modigliani F, Miller M. 1958. The expected cost of equity capital, corporation finance and
the theory of investment. The American Economic Review 48:3, 261-297. Ng AC, Rezaee Z. 2015. Business sustainability performance and cost of equity capital.
Journal of Corporate Finance 34, 128-149. Paugam L, Ramond O, Husson B, Philippe H, Casta JF. 2013. Risque d’estimation, coût du
capital et communication des tests de dépréciation. Finance Contrôle Stratégie 16:1. Persakis A, Iatridis GE. 2015. Cost of capital, audit and earnings quality under financial
crisis: A global empirical investigation. Journal of International Financial Markets, Institutions and Money 38, 3-24.
Persakis A, Iatridis GE. 2016. Audit quality, investor protection and earnings management during the financial crisis of 2008: An international perspective. Journal of International Financial Markets, Institutions & Money 41, 73-101.
Poi BP. 2004. From the help desk: Some bootstrapping techniques. The Stata Journal 4:3, 312-328.
Raman K, Shivakumar L, Tamayo A. 2013. Target’s earnings quality and bidders’ takeover decisions. Review of Accounting Studies 18:4, 1050-1087.
Sargan JD. 1958. The estimation of economic relationships using instrumental variables. Econometrica 26 :3, 393-415.
Sebai S, Messai M, Jouini F. 2014. Qualité de l’information comptable et coût de capital : cas des entreprises tunisiennes. International Journal of Innovation and Applied Studies 9:1, 249-259.
Sengupta P. 1998. Corporate disclosure quality and the cost of debt. The Accounting Review 73:4, 459-474.
Stiglitz JE, Edlin AS. 1992. Discouraging Rivals: Managerial Rent Seeking and Economic Insufficiencies National Bureau of Economic Research Working Paper No. 4145, Cambridge, MA.
Tran DH. 2014. Multiple corporate governance attributes and the cost of capital – Evidence from Germany. The British Accounting Review 46:2, 179-197.
Triki F. 2010. Impact de la qualité du résultat comptable sur le coût des capitaux propres des entreprises tunisiennes cotées, PhD thesis in management sciences, University of Tunis, Tunisia
Triki F, Omri A. 2010. Earnings quality and cost of equity capital: evidence from Tunisia. International Journal of Managerial and Financial Accounting 2:2, 161-176.

Financial Information Quality and Cost of Equity Capital 58
Copyright © 2017 JAEBR ISSN 1927-033X
Tsipouridou M, Spathis C. 2014. Audit opinion and earnings management: Evidence from Greece. Accounting Forum 38:1, 38-54.
Muiño F, Trombetta M. 2009. Does graph disclosure bias reduce the cost of equity? Accounting and Business Research 39:2, 83-102.
Wu DM. 1974. Alternative tests of independence between stochastic regressors and disturbances: Finite sample results. Econometrica 42:3, 529-546.
Zimmerman JL. 2012. Myth: external financial reporting quality has a 1st order effect on firm value. University of Rochester - Simon School Working Paper No. 12-23.