Embed Size (px)
Citation preview

FINANCIAL INFORMATION
The Financial Statements show that Council has achieved a sound financial result for 2015/16. Council’s net operating result for the financial year ended 30 June 2016 was a surplus of $41.97m including Grants and Contributions for capital purposes. After adjusting for Capital Grants and Contributions, the net operating result was $6.82m.The actual working capital as at 2015/16 was $4.69m in line with the
target identified in Council’s Annual Budget.
The Financial Statements for the year ended 30 June 2016 have been prepared in accordance with the Local Government Act 1993 (as amended) and Regulations, the Australian Accounting Standards and professional pronouncements and the Local Government Code of Accounting Practice and Financial
Reporting (Update No 24). The Statements are made up of the following:
■ General Purpose Financial Statements (independently audited)
■ Special Purpose Financial Statements (independently audited)
■ Special Schedules
Income Statement '000 Actual 2016 Actual 2015
Income from Continuing Operations 156,027 133,320
Expenses from Continuing Operations 114,057 110,734
Net Operating Result for the Year 41,970 22,586Net Operating Result for the year before Grants and Contributions for Capital purposes 6,819 13,460
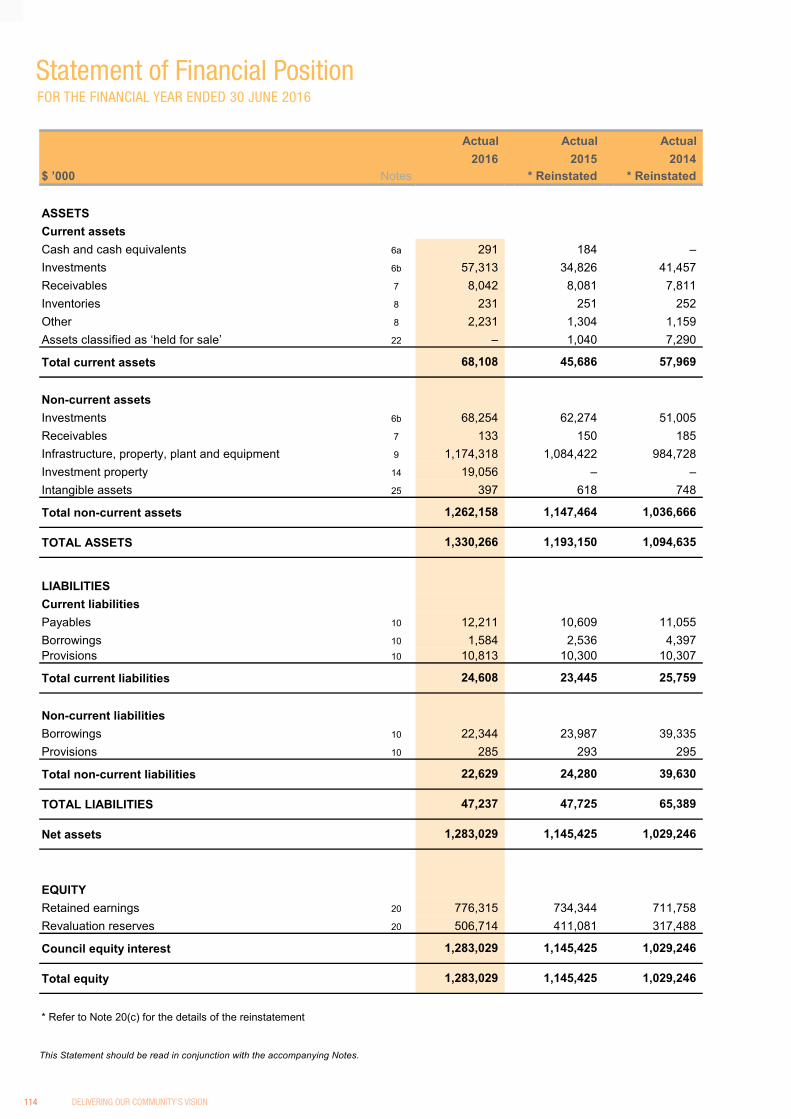
Statement of Financial Position '000 Actual 2016 Actual 2015
Current Assets 68,108 45,686
Non-Current Assets 1,262,158 1,147,464
Total Assets 1,330,266 1,193,150Current Liabilities 24,608 23,445
Non-Current Liabilities 22,629 24,280
Total Liabilities 47,237 47,725
Net Assets 1,283,029 1,145,425
Total Equity 1,283,029 1,145,425
Statement of Cash Flows '000 Actual 2016 Actual 2015
Net Cash Flow from Operating Activities 61,987 29,265
Net Cash Flow from Investing Activities (59,285) (11,122)
Net Cash Flow from Financing Activities (2,595) (17,909)
Net Decrease in Cash 107 234
Plus: Cash at beginning of year 184 (50)
Cash at end of Year 291 184
Plus: Investments on hand at end of year 125,567 97,100
Total Cash & Investments 125,858 97,284
For further details regarding the above financial results see the Financial Statements on page 109.
SUMMARY - FINANCIAL POSITION OF COUNCIL AS AT 30 JUNE 2016
The following table provides a summary of the financial results from the Financial Statements 2015/16:
FINA
NC
IALS
Native Flowers. Photo by David Spira.
KU-RING-GAI COUNCIL ANNUAL REPORT 2015 - 2016 105

PERFORMANCE MEASUREMENT INDICATORS
The Statement of Performance Measurement (See Note 13 of the Financial Statements on page 148 to 150 and Special Schedule 7 on page 221) provide ratios used to assess various aspects of Council’s financial performance. These ratios have been prescribed by the Code of Accounting Practice for 2015/16, which are mainly the financial ratios identified in T-Corp’s Financial Assessment and Benchmarking Report. The Infrastructure assets ratios listed in “Special Schedule 7 - Report on Infrastructure Assets” are Building, Infrastructure & Other Structures Renewal Ratio, Infrastructure Backlog Ratio and Asset Maintenance Ratio. These can be found on page 224 in the Special Schedule section of the Financial Statements.
The results of all financial indicators, including asset ratios, providing previous four years comparisons and commentary, are detailed in the charts below.
► Operating Performance Ratio
This ratio measures Council’s achievement of containing operating expenditure within operating revenue. It is important to distinguish that this ratio is focussing on operating performance and hence capital grants and contributions, fair value adjustments and reversal of revaluation decrements are excluded. The benchmark is greater than (0%).
Council performance ratio is above the benchmark which means that Council can easily contain operating expenditure (excluding capital grants and contributions) within its operating revenue. The ratio has been above benchmark for the last four years. The increase from the previous year is largely due to higher operating revenue from user fees and charges
► Own Source Operating Revenue
This ratio measures fiscal flexibility. It is the degree of reliance on external funding sources such as operating grants and contributions. Council’s financial flexibility improves the higher the level of its own source revenue. The benchmark is greater than 60%.
Council’s Own Source Operating Revenue Ratio (72%) has remained above the benchmark of (>60%) in the last four years. Council has sufficient level of fiscal flexibility, in the event of being faced with unforeseen events.
► Unrestricted Current Ratio
The Unrestricted Current Ratio is designed to represent Council’s ability to meet short term obligations as they fall due. The benchmark is greater than 1.5x.
Council’s Unrestricted Current Ratio at 2.58x is above benchmark of >1.5x and has been outperforming benchmark for the last four years. Council’s liquidity is good and it can readily pay its debts as they fall due.
106 DELIVERING OUR COMMUNITY'S VISION
► Debt Service Cover Ratio
This ratio measures the availability of operating cash to service debt including interest, principal and lease payments. The benchmark is greater than 2x.
The Debt Service Cover Ratio has increased from the previous year and is above the benchmark of 2x, mainly due to decreased principal and interest repayments during the financial year compared to the year before.
► Rates, Annual Charges, Interest & Extra Outstanding Percentage
The purpose of this ratio is to assess the impact of uncollected rates and annual charges on liquidity and the adequacy of recovery efforts.
The percentage of rates and annual charges that are unpaid at the end of the financial year is a measure of how well Council is managing debt recovery. Council’s ratio of 3.16% is satisfactory and is better than benchmark of “less than 5%”.
► Cash Expense Cover Ratio
This liquidity ratio indicates the number of months a Council can continue paying for its immediate expenses without additional cash inflow.
Council’s Cash Expense Cover Ratio is satisfactory and above benchmark of “greater than 3 months”.
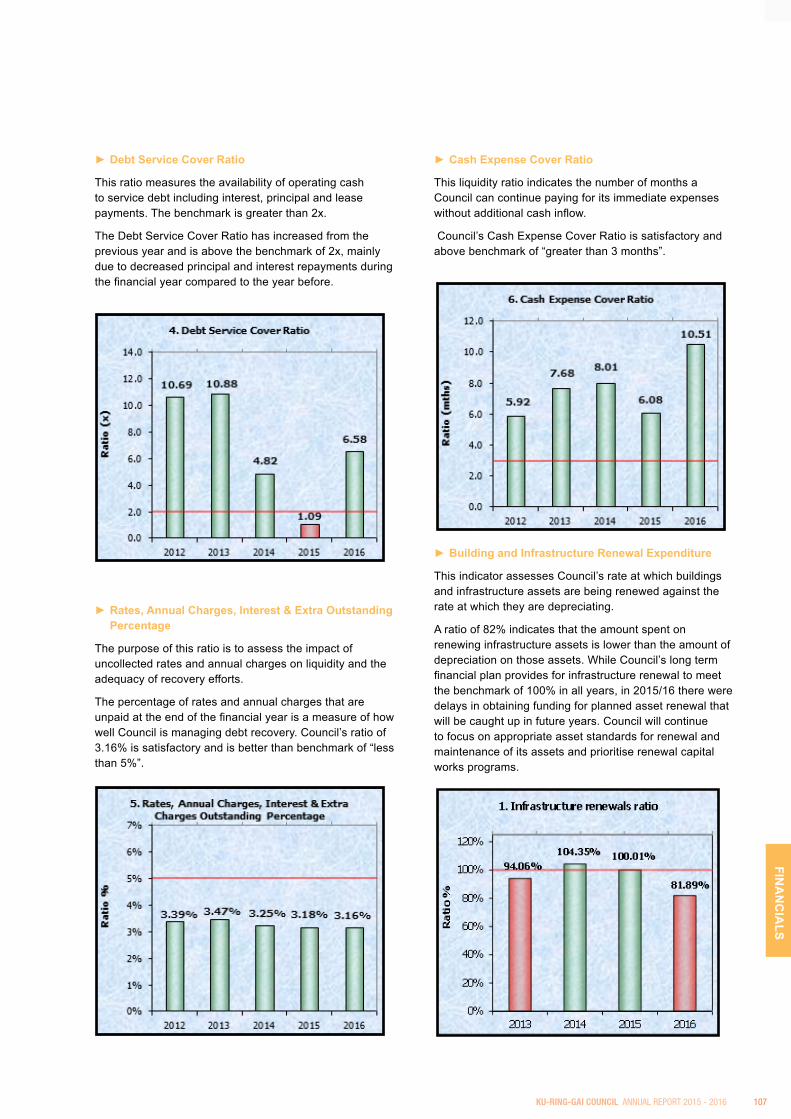
► Building and Infrastructure Renewal Expenditure
This indicator assesses Council’s rate at which buildings and infrastructure assets are being renewed against the rate at which they are depreciating.
A ratio of 82% indicates that the amount spent on renewing infrastructure assets is lower than the amount of depreciation on those assets. While Council’s long term financial plan provides for infrastructure renewal to meet the benchmark of 100% in all years, in 2015/16 there were delays in obtaining funding for planned asset renewal that will be caught up in future years. Council will continue to focus on appropriate asset standards for renewal and maintenance of its assets and prioritise renewal capital works programs.
FINA
NC
IALS
KU-RING-GAI COUNCIL ANNUAL REPORT 2015 - 2016 107

► Infrastructure Backlog Ratio
This ratio shows what proportion of the backlog is against the total value of Council’s infrastructure. Council achieved a backlog ratio of 5.58% at the end of 2015/16, which is an increase from the previous year largely due to less expenditure on asset renewals. The ratio indicates that Council still has an infrastructure backlog. Council is continuing to focus on appropriate asset standards for renewal and decreasing the infrastructure backlog in future.
► Asset Maintenance Ratio
This ratio compares actual versus required annual asset maintenance. A ratio of above 1.0 indicates that Council is investing enough funds within the year to ensure assets reach their useful lives. The benchmark is greater than1.0.
Council is committed to increase expenditure on asset maintenance in future to maintain its infrastructure assets in satisfactory condition in the long term.
108 DELIVERING OUR COMMUNITY'S VISION

FINA
NC
IALS
1. Understanding Council's Financial Statements .........................................................................................................110
2. Statement by Councillors and Management ...............................................................................................................111
3. Primary Financial Statements:
- Income Statement ........................................................................................................................................................112
- Statement of Comprehensive Income.........................................................................................................................113
- Statement of Financial Position ...................................................................................................................................114
- Statement of Changes in Equity ..................................................................................................................................115
- Statement of Cash Flows ............................................................................................................................................116
4. Notes to the Financial Statements ................................................................................................................................117
5. Independent Auditor's Reports:
- On the Financial Statements (Sect 417 [2]) ................................................................................................................190
- On the Conduct of the Audit (Sect 417 [3]) .................................................................................................................192
Contents
Overview
(i) These financial statements are General Purpose Financial Statements and cover the consolidated operations for Ku-ring-gai Council.
(ii) Ku-ring-gai Council is a body politic of NSW, Australia - being constituted as a Local Government area by proclamation and is duly empowered by the Local Government Act (LGA) 1993 of NSW.
Council's Statutory Charter is detailed in Paragraph 8 of the LGA and includes giving Council;
• the ability to provide goods, services & facilities, and to carry out activities appropriate to the current & future needs of the local community and of the wider public,
• the responsibility for administering regulatory requirements under the LGA and
• a role in the management, improvement and development of the resources in the area.
A description of the nature of Council's operations and its principal activities are provided in Note 2(b).
(iii) All figures presented in these financial statements are presented in Australian Currency.
(iv) These financial statements were authorised for issue by the Council on 08 September 2015. Council has the power to amend and reissue these financial statements.
FINANCIAL STATEMENTSFOR THE FINANCIAL YEAR ENDED 30 JUNE 2016
KU-RING-GAI COUNCIL ANNUAL REPORT 2015 - 2016 109

FOR THE FINANCIAL YEAR ENDED 30 JUNE 2016
Understanding Council's Financial Statements
INTRODUCTION
Each year, individual Local Governments across NSW are required to present a set of audited financial statements to their Council and Community.
WHAT YOU WILL FIND IN THE STATEMENTS
The financial statements set out the financial performance, financial position and cash flows of Council for the financial year ended 30 June 2016.
The format of the financial statements is standard across all NSW Councils and complies with both the accounting and reporting requirements of Australian Accounting Standards and requirements as set down by the Office of Local Government.
ABOUT THE COUNCILLOR/MANAGEMENT STATEMENT
The financial statements must be certified by senior staff as "presenting fairly" the Council's financial results for the year, and are required to be adopted by Council - ensuring both responsibility for and ownership of the financial statements.
ABOUT THE PRIMARY FINANCIAL STATEMENTS
The financial statements incorporate five "primary" financial statements:
► 1. The Income Statement
Summarises Council's financial performance for the year, listing all income and expenses. This statement also displays Council's original adopted budget to provide a comparison between what was projected and what actually occurred.
► 2. The Statement of Comprehensive Income
Primarily records changes in the fair values of Council's Infrastructure, Property, Plant and Equipment.
► 3. The Statement of Financial Position
A 30 June snapshot of Council's financial position indicating its Assets, Liabilities and Net Wealth.
► 4. The Statement of Changes in Equity
The overall change for the year (in dollars) of Council's Net Wealth.
► 5. The Statement of Cash Flows
Indicates where Council's cash came from and where it was spent. This statement also displays Council's original adopted budget to provide a comparison between what was projected and what actually occurred.
ABOUT THE NOTES TO THE FINANCIAL STATEMENTS
The Notes to the financial statements provide greater detail and additional information on the 5 primary financial statements.
ABOUT THE AUDITOR'S REPORTS
Council's financial statements are required to be audited by external accountants (that generally specialize in Local Government).
In NSW, the Auditor provides two audit reports:
1. An opinion on whether the financial statements present fairly the Council's financial performance and position.
2. Their observations on the conduct of the Audit including commentary on the Council's financial performance and financial position.
WHO USES THE FINANCIAL STATEMENTS?
The financial statements are publicly available documents and must be presented at a Council meeting between seven days and five weeks after the date of the Audit Report.
Submissions from the public can be made to Council up to seven days subsequent to the public presentation of the financial statements.
Council is required to forward an audited set of financial statements to the Office of Local Government.
110 DELIVERING OUR COMMUNITY'S VISION

Statement by Councillors and Management
FOR THE FINANCIAL YEAR ENDED 30 JUNE 2016
MADE PURSUANT TO SECTION 413(2)(C) OF THE LOCAL GOVERNMENT ACT 1993 (AS AMENDED)
FINA
NC
IALS
KU-RING-GAI COUNCIL ANNUAL REPORT 2015 - 2016 111

FOR THE FINANCIAL YEAR ENDED 30 JUNE 2016
Income Statement
Financial Statements 2016
This statement should be read in conjunction with the accompanying notes. page 4
Ku-ring-gai Council
Income Statementfor the year ended 30 June 2016
$ ’000
Income from continuing operationsRevenue:Rates and annual chargesUser charges and feesInterest and investment revenueOther revenuesGrants and contributions provided for operating purposesGrants and contributions provided for capital purposesOther income:Net gains from the disposal of assets
Total income from continuing operations
Expenses from continuing operationsEmployee benefits and on-costsBorrowing costsMaterials and contractsDepreciation and amortisationOther expensesNet losses from the disposal of assets
Total expenses from continuing operations
Operating result from continuing operations
Net operating result for the year
Net operating result for the year before grants andcontributions provided for capital purposes
Original budget as approved by Council – refer Note 16
22,586
13,460
Actual 2015
Actual
76,370
4,0279,534
22,586
110,734
13,683
35,151 9,126
12,852
–16,242
114,057
41,970
141,599
9,108
156,027
38,39019,349
41,970
133,320
15,306
36,127
19,47639,539
4e
405
4c
948
Budget 1
3e,f
4d
5
4b
8,295
78,537
Notes
3a
3d
3c
2016 2016
–
4a 37,447
3e,f
5,587
–
27,270
1,562
1
3b 18,0034,218
11,8237,728
114,329
27,270
6,819
5
7,56618,162
4,18310,723
78,38716,991
16,748
38,65419,155
38,6791,093
This Statement should be read in conjunction with the accompanying Notes.
112 DELIVERING OUR COMMUNITY'S VISION

This Statement should be read in conjunction with the accompanying Notes.
Statement of Comprehensive IncomeFOR THE FINANCIAL YEAR ENDED 30 JUNE 2016
FINA
NC
IALS
Financial Statements 2016
This statement should be read in conjunction with the accompanying notes. page 5
Ku-ring-gai Council
Statement of Comprehensive Incomefor the year ended 30 June 2016
$ ’000
Net operating result for the year (as per Income Statement)
Other comprehensive income:
Amounts which will not be reclassified subsequently to the operating resultGain (loss) on revaluation of I,PP&E
Total other comprehensive income for the year
Total comprehensive income for the year 116,179
Actual 2015
93,593
22,586
20b (ii) 95,633
NotesActual
41,970
93,59395,633
137,604
2016
KU-RING-GAI COUNCIL ANNUAL REPORT 2015 - 2016 113
Financial Statements 2016
This Statement should be read in conjunction with the accompanying Notes. page 6
Ku-ring-gai Council
Statement of Financial Positionas at 30 June 2016
$ ’000
ASSETSCurrent assetsCash and cash equivalentsInvestmentsReceivablesInventoriesOtherAssets classified as ‘held for sale’
Total current assets
Non-current assetsInvestmentsReceivablesInfrastructure, property, plant and equipmentInvestment propertyIntangible assets
Total non-current assets
TOTAL ASSETS
LIABILITIESCurrent liabilitiesPayablesBorrowingsProvisions
Total current liabilities
Non-current liabilitiesBorrowingsProvisions
Total non-current liabilities
TOTAL LIABILITIES
Net assets
EQUITYRetained earningsRevaluation reserves
Council equity interest
Total equity
* Refer to Note 20(c) for the details of the reinstatement
65,389
1,029,246
1,029,246
711,758317,488
1,029,246
39,630
–748
11,0554,397
10,307
25,759
295
1,094,635
1,036,666
39,335
Actual 2014
–41,457
7,290
51,005
984,728
57,969
7,811252
185
* Reinstated
8,081
1,304
62,274
1,0401,159
10 12,211
1,330,266
1,147,4641,262,158
618
7
1,174,318
231
6b
9
25
Actual
18434,826
2016
291
Actual 2015
57,313
Notes
6a
6b
* Reinstated
251
1331,084,422
68,254
14
45,686
150
1,58410,813
–19,056397
10 28522,344
23,445
29323,987
1,193,150
10,609
10,3002,536
24,608
10
7
8
8
22 –
68,108
8,042
2,231
10
20 734,344
1,283,029
1,283,029
47,237
24,280
776,315411,081506,714
47,725
1,145,425
1,145,4251,283,029
20
22,629
10
1,145,425
This Statement should be read in conjunction with the accompanying Notes.
Statement of Financial PositionFOR THE FINANCIAL YEAR ENDED 30 JUNE 2016
114 DELIVERING OUR COMMUNITY'S VISION

Statement of Changes in Equity
This Statement should be read in conjunction with the accompanying Notes.
FOR THE FINANCIAL YEAR ENDED 30 JUNE 2016
FINA
NC
IALS
Financial Statements 2016
This statement should be read in conjunction with the accompanying notes. page 7
Ku-ring-gai Council
Statement of Changes in Equityfor the year ended 30 June 2016
$ ’000
Opening balance (as per last year’s audited accoua. Correction of prior period errorsb. Changes in accounting policies (prior year effec
Revised opening balance (as at 1/7/15)
c. Net operating result for the year
d. Other comprehensive income – Revaluations: IPP&E asset revaluation reserve
Total comprehensive income (c&d)
Equity – balance at end of the reporting period
$ ’000
Opening balance (as per last year’s audited accoua. Correction of prior period errorsb. Changes in accounting policies (prior year effec
Revised opening balance (as at 1/7/14)
c. Net operating result for the year
d. Other comprehensive income – Revaluations: IPP&E asset revaluation reserve
Total comprehensive income (c&d)
Equity – balance at end of the reporting period
–93,593 93,593
TotalInterest
–
1,283,029
137,604
–
–
41,970
1,145,425
1,145,425
–
–
Non-
137,604
– ––
controlling
1,145,425
1,145,425
–
–
CouncilInterest
–
equity
Non-
95,633–95,63395,633
41,970
20 (c)
20 (d)
–41,970
411,081
734,344
–
RetainedEarningsNotes
––
20b (ii) –
734,344
(Refer 20b)Reserves
Reserves
95,633
506,714
–
411,081
(Refer 20b)
2016
–
1,145,425411,081
2015
–22,586
704,772
–
317,488
317,488–
20 (d)
734,344
22,586
–
93,593 116,179
1,029,246
–
20b (ii) 93,593
1,145,425
116,179
–
Council
1,283,029
711,758
–
6,986
Earnings
22,586
–
–
1,029,246
1,022,260
22,586
–
RetainedNotes
41,970
776,315
TotalInterest
controlling
–
EquityInterest
20 (c) 6,986––
1,022,2606,986
KU-RING-GAI COUNCIL ANNUAL REPORT 2015 - 2016 115

Financial Statements 2016
This statement should be read in conjunction with the accompanying notes. page 8
Ku-ring-gai Council
Statement of Cash Flowsfor the year ended 30 June 2016
$ ’000
Cash flows from operating activitiesReceipts:Rates and annual chargesUser charges and feesInvestment and interest revenue receivedGrants and contributionsBonds, deposits and retention amounts receivedOtherPayments:Employee benefits and on-costsMaterials and contractsBorrowing costsBonds, deposits and retention amounts refundedOther
Net cash provided (or used in) operating activities
Cash flows from investing activitiesReceipts:Sale of investment securitiesSale of assets held for saleSale of infrastructure, property, plant and equipmentPayments:Purchase of investment securitiesPurchase of investment propertyPurchase of infrastructure, property, plant and equipment
Net cash provided (or used in) investing activities
Cash flows from financing activitiesReceipts:Proceeds from borrowings and advancesPayments:Repayment of borrowings and advances
Net cash flow provided (used in) financing activities
Net increase/(decrease) in cash and cash equivalents
Plus: cash and cash equivalents – beginning of year
Cash and cash equivalents – end of the year
plus: Investments on hand – end of year
Total cash, cash equivalents and investments
Please refer to Note 11 for additional cash flow information
6b
Notes
3,969
(36,187)
14,789
17,89725 36
19,052
12,856
20152016
9,464
3,489
(2,228)
5,975
(36,082)
11a
(2,228)
–
–
–
(47,669)
11,587
–
–
–
41,799
(20,930)
10,744–
25,7284,183
77,465
Budget
(36,853)
(355)(35,174)
2016
16,991
283
(3,251)
(43,813)
125,858
125,567
291
97,284
184
97,100
–
11a
61,987
(64,052)
656
(256)(32,328)
4,238
78,500
44,340
14,925
Actual
76,298
29,265
(948)(42,885)(36,992)
(15,894)(305)
(812)(42,295)
39,21635,5461,146
(11,122)(59,285)
(28,750)
(18,192)
(50)
(17,909)
234
184
107
(2,595)
Actual
(19,231)
11b
77312,607
9,618
(124)
Statement of Cash Flows
This Statement should be read in conjunction with the accompanying Notes.
FOR THE FINANCIAL YEAR ENDED 30 JUNE 2016
116 DELIVERING OUR COMMUNITY'S VISION

Contents of the Notes accompanying the Financial Statements
Note Details Page
1 Summary of Significant Accounting Policies 118
2(a) Council Functions / Activities - Financial Information 129
2(b) Council Functions / Activities - Component Descriptions 130
3 Income from Continuing Operations 131
4 Expenses from Continuing Operations 136
5 Gains or Losses from the Disposal of Assets 139
6(a) Cash & Cash Equivalent Assets 140
6(b) Investments 140
6(c) Restricted Cash, Cash Equivalents & Investments - Details 141
7 Receivables 142
8 Inventories & Other Assets 142
9(a) Infrastructure, Property, Plant & Equipment 143
9(b) Externally Restricted Infrastructure, Property, Plant & Equipment 143
9(c) Infrastructure, Property, Plant & Equipment - Current Year Impairments 143
10(a) Payables, Borrowings & Provisions 143
10(b) Description of (and movements in) Provisions 145
11 Statement of Cash Flows - Additional Information 146
12 Commitments for Expenditure 147
13 Statement of Performance Measures: 148
13a (i) Local Government Industry Indicators (Consolidated) 148
13a (ii) Local Government Industry Graphs (Consolidated) 149
14 Investment Properties 151
15 Financial Risk Management 152
16 Material Budget Variations 156
17 Statement of Developer Contributions 158
18 Contingencies and Other Liabilities/Assets not recognised 160
19 Interests in other Entities 162
20 Equity - Retained Earnings and Revaluation Reserves 164
21 Financial Result & Financial Position by Fund 166
22 "Held for Sale" Non Current Assets & Disposal Groups 166
23 Events occurring after the Reporting Date 167
24 Discontinued Operations 167
25 Intangible Assets 168
26 Reinstatement, Rehabilitation & Restoration Liabilities 168
27 Fair Value Measurement 169
FOR THE FINANCIAL YEAR ENDED 30 JUNE 2016
FINA
NC
IALS
KU-RING-GAI COUNCIL ANNUAL REPORT 2015 - 2016 117
Note 1. Summary of Significant Accounting PoliciesFOR THE FINANCIAL YEAR ENDED 30 JUNE 2016
Financial Statements 2016
Ku-ring-gai Council
Notes to the Financial Statementsfor the year ended 30 June 2016
Note 1. Summary of Significant Accounting Policies
page 10
Ku-ring-gai Council has its principal business office at 818 Pacific Highway Gordon NSW 2072. Council is empowered by the New South Wales Local Government Act (LGA) 1993 and its Charter as specified in Section 8 of the Act.
The principal accounting policies adopted by Council in the preparation of these consolidated financial statements are set out below in order to assist in its general understanding.
Under Australian Accounting Standards Board (AASBs), accounting policies are defined as those specific principles, bases, conventions, rules and practices applied by a reporting entity (in this case Council) in preparing and presenting its financial statements.
(a) Basis of preparation
(i) Background
These financial statements are general purpose financial statements, which have been prepared in accordance with:
Australian Accounting Standards and Australian Accounting Interpretations issued by the Australian Accounting Standards Board,
the Local Government Act (1993) and Regulation, and
the Local Government Code of Accounting Practice and Financial Reporting.
For the purpose of preparing these financial statements, Council has been deemed to be a not-for-profit entity.
(ii) Compliance with International Financial Reporting Standards (IFRSs)
Because AASBs are sector neutral, some standards either:
(a) have local Australian content and prescription that is specific to the not-for-profit sector (including local government) which are not in compliance with IFRSs, or
(b) specifically exclude application by not-for-profit entities.
Accordingly, in preparing these financial statements and accompanying notes, Council has been unable to comply fully with International Accounting Standards, but has complied fully with Australian Accounting Standards.
Under the Local Government Act (LGA), Regulation and Local Government Code of Accounting Practice and Financial Reporting, it should be noted that Councils in NSW only have a requirement to comply with AASBs.
(iii) New and amended standards adopted by Council
There have been no new accounting standards adopted in this year’s financial statements which have had any material impact on reported financial position, performance or cash flows.
(iv) Early adoption of accounting standards
Council has not elected to apply any pronouncements before their operative date in the annual reporting period beginning 1 July 2015, except for AASB 2015-7 Amendments to Australian Accounting Standards – Fair Value Disclosures of Not-for-Profit Public Sector Entities, which has reduced the fair value disclosures for Level 3 assets.
(v) Basis of accounting
These financial statements have been prepared under the historical cost convention except for:
(i) assets held for sale - measured at fair value less cost of disposal
(ii) the write down of any asset on the basis of impairment (if warranted), and
(iii) certain classes of non-current assets (eg. infrastructure, property, plant and equipment and investment property) that are accounted for at fair value.
The accrual basis of accounting has also been applied in their preparation.
(vi) Changes in accounting policies
Council’s accounting policies have been consistently applied to all the years presented, unless otherwise stated.
118 DELIVERING OUR COMMUNITY'S VISION

Note 1. Summary of Significant Accounting Policies (continued)FOR THE FINANCIAL YEAR ENDED 30 JUNE 2016
FINA
NC
IALS
Financial Statements 2016
Ku-ring-gai Council
Notes to the Financial Statements for the year ended 30 June 2016
Note 1. Summary of Significant Accounting Policies (continued)
page 11
There have also been no changes in accounting policies when compared with previous financial statements unless otherwise stated.
(vii) Critical accounting estimates
The preparation of financial statements requires the use of certain critical accounting estimates (in conformity with AASBs).
Accordingly, this requires management to exercise its judgement in the process of applying the Council's accounting policies.
Critical accounting estimates and assumptions
Council makes estimates and assumptions concerning the future.
The resulting accounting estimates will, by definition, seldom equal the related actual results.
The estimates and assumptions that have a significant risk of causing a material adjustment to the carrying amounts of assets and liabilities within the next financial year are set out below:
(i) Estimated fair values of infrastructure, property, plant and equipment.
(b) Revenue recognition
Council recognises revenue when the amount of revenue can be reliably measured, it is probable that future economic benefits will flow to it, and specific criteria have been met for each of the Council’s activities as described below.
Revenue is measured at the fair value of the consideration received or receivable.
Revenue is measured on major income categories as follows:
Rates, Annual Charges, Grants and Contributions
Rates, annual charges, grants and contributions (including developer contributions) are recognised as revenues when the Council obtains control over the assets comprising these receipts.
Control over assets acquired from rates and annual charges is obtained at the commencement of the rating year as it is an enforceable debt linked to the rateable property or, where earlier, upon receipt of the rates.
A provision for the impairment on rates receivables has not been established as unpaid rates represent a charge against the rateable property that will be recovered when the property is next sold.
Control over granted assets is normally obtained upon their receipt (or acquittal) or upon earlier notification that a grant has been secured, and is valued at their fair value at the date of transfer.
Revenue from contributions is recognised when the Council either obtains control of the contribution or the right to receive it, (i) it is probable that the economic benefits comprising the contribution will flow to the Council and (ii) the amount of the contribution can be measured reliably.
Where grants or contributions recognised as revenues during the financial year were obtained on condition that they be expended in a particular manner or used over a particular period and those conditions were undischarged at balance date, the unused grant or contribution is disclosed in Note 3 (g).
Note 3 (g) also discloses the amount of unused grant or contribution from prior years that was expended on Council’s operations during the current year.
The Council has obligations to provide facilities from contribution revenues levied on developers under the provisions of s94 of the EPA Act 1979.
Whilst Council generally incorporates these amounts as part of a Development Consents Order, such developer contributions are only recognised as income upon their physical receipt by Council, due to the possibility that individual development consents may not be acted upon by the applicant and accordingly would not be payable to Council.
Developer contributions may only be expended for the purposes for which the contributions were required but the Council may apply contributions according to the priorities established in work schedules.
KU-RING-GAI COUNCIL ANNUAL REPORT 2015 - 2016 119

FOR THE FINANCIAL YEAR ENDED 30 JUNE 2016
Financial Statements 2016
Ku-ring-gai Council
Notes to the Financial Statements for the year ended 30 June 2016
Note 1. Summary of Significant Accounting Policies (continued)
page 12
A detailed note relating to developer contributions can be found at Note 17.
User charges, fees and other Income
User charges, fees and other income are recognised as revenue when the service has been provided, the payment is received, or when the penalty has been applied, whichever first occurs.
A provision for the impairment of these receivables is recognised when collection in full is no longer probable.
Sale of infrastructure, property, plant and equipment
The profit or loss on sale of an asset is determined when control of the asset has irrevocably passed to the buyer.
Interest and rents
Rental income is accounted for on a straight-line basis over the lease term.
Interest income from cash and investments is accounted for using the effective interest rate at the date that interest is earned.
Other Income
Other income is recorded when the payment is due, the value of the payment is notified or the payment is received, whichever occurs first.
(c) Principles of consolidation
These financial statements incorporate (i) the assets and liabilities of Council and any entities (or operations) that it controls (as at 30 June 2016) and (ii) all the related operating results (for the financial year ended the 30th June 2016).
(i) The Consolidated Fund
In accordance with the provisions of section 409(1) of the LGA 1993, all money and property received by Council is held in the Council’s consolidated fund. Council’s General Purpose Operations have been included as part of the consolidated fund. Council does not hold money or property in a Trust fund.
(ii) Joint Arrangements
Joint operations (controlled assets and operations)
Joint operations represent operational arrangements where the joint control parties have rights to specific assets and obligations for specific liabilities relating to the arrangement rather than a right to the net assets of the arrangement.
The proportionate interests of Council in the assets, liabilities, income and expenses of all Joint Operation activities have been incorporated throughout the financial statements under the appropriate notes and line items.
Detailed information relating to Council’s joint operations can be found at Note 19 (c).
Joint ventures
Council has no interest in any joint venture.
Associates
Council has no interest in any associates.
(d) Leases
All leases entered into by Council are reviewed and classified on inception date as either a Finance Lease or an Operating Lease.
Operating Leases
Leases in which a significant portion of the risks and rewards of ownership are retained by the lessor are classified as operating leases.
Payments made under operating leases are charged to the income statement on a straight-line basis over the period of the lease.
Lease income from operating leases is recognised in income on a straight-line basis over the lease term.
(e) Cash and Cash Equivalents
For Statement of Cash Flows (and Statement of Financial Position) presentation purposes, cash and cash equivalents includes;
Note 1. Summary of Significant Accounting Policies (continued)
120 DELIVERING OUR COMMUNITY'S VISION
FOR THE FINANCIAL YEAR ENDED 30 JUNE 2016
Financial Statements 2016
Ku-ring-gai Council
Notes to the Financial Statements for the year ended 30 June 2016
Note 1. Summary of Significant Accounting Policies (continued)
page 13
cash on hand,
deposits held at call with financial institutions,
bank overdrafts.
Bank overdrafts are shown within borrowings in current liabilities on the balance sheet but are incorporated into cash and cash equivalents for presentation of the Cash Flow Statement.
(f) Investments and other financial assets
Council (in accordance with AASB 139) classifies each of its investments into one of the following categories for measurement purposes:
financial assets at fair value through profit or loss,
loans and receivables,
held-to-maturity investments,
Each classification depends on the purpose or intention for which the investment was acquired and at the time it was acquired.
Management determines each investment classification at the time of initial recognition and re-evaluates this designation at each reporting date.
(i) Financial assets at fair value through profit or loss
Financial assets at fair value through profit or loss include financial assets that are ‘held for trading’.
A financial asset is classified in the ‘held for trading’ category if it is acquired principally for the purpose of selling in the short term.
(ii) Loans and receivables
Loans and receivables are non-derivative financial assets with fixed or determinable payments that are not quoted in an active market.
They arise when the Council provides money, goods or services directly to a debtor with no intention (or in some cases ability) of selling the resulting receivable.
They are included in current assets, except for those with maturities greater than 12 months after the balance sheet date, which are classified as non-current assets.
(iii) Held-to-maturity investments
Held-to-maturity investments are non-derivative financial assets with fixed or determinable payments and fixed maturities that the Council’s management has the positive intention and ability to hold to maturity.
In contrast to the ‘loans and receivables’ classification, these investments are generally quoted in an active market.
Held-to-maturity financial assets are included in non-current assets, except for those with maturities less than 12 months from the reporting date, which are classified as current assets.
General accounting and measurement of financial instruments:
(i) Initial recognition
Investments are initially recognised (and measured) at fair value, plus in the case of investments not at ‘fair value through profit or loss’, directly attributable transactions costs.
Purchases and sales of investments are recognised on trade-date – the date on which the Council commits to purchase or sell the asset.
Financial assets are derecognised when the rights to receive cash flows from the financial assets have expired or have been transferred and the Council has transferred substantially all the risks and rewards of ownership.
(ii) Subsequent measurement
Financial assets at fair value through profit and loss are subsequently carried at fair value.
Loans and receivables and held-to-maturity investments are carried at amortised cost using the effective interest method.
Realised and unrealised gains and losses arising from changes in the fair value of the financial assets classified as ‘fair value through profit or loss’
FINA
NC
IALS
Note 1. Summary of Significant Accounting Policies (continued)
KU-RING-GAI COUNCIL ANNUAL REPORT 2015 - 2016 121

FOR THE FINANCIAL YEAR ENDED 30 JUNE 2016
Financial Statements 2016
Ku-ring-gai Council
Notes to the Financial Statements for the year ended 30 June 2016
Note 1. Summary of Significant Accounting Policies (continued)
page 14
category are included in the income statement in the period in which they arise.
Impairment
Council assesses at each balance date whether there is objective evidence that a financial asset or group of financial assets is impaired.
A financial asset or a group of financial assets is impaired and impairment losses are incurred only if there is objective evidence of impairment as a result of one or more events that occurred after the initial recognition of the asset (a ‘loss event’) and that loss event (or events) has an impact on the estimated future cash flows of the financial asset or group of financial assets that can be reliably estimated.
If there is evidence of impairment for any of Council’s financial assets carried at amortised cost (eg. loans and receivables), the amount of the loss is measured as the difference between the asset’s carrying amount and the present value of estimated future cash flows (excluding future credit losses that have not been incurred) discounted at the financial asset’s original effective interest rate.
(iii) Types of investments
Council has an approved Investment Policy in order to invest in accordance with (and to comply with) section 625 of the Local Government Act and s212 of the LG (General) Regulation 2005.
Investments are placed and managed in accordance with the policy and having particular regard to authorised investments prescribed under the Ministerial Local Government Investment Order.
Council maintains its Investment Policy in compliance with the Act and ensures that it or its representatives exercise care, diligence and skill that a prudent person would exercise in investing Council funds.
Council amended its policy following revisions to the Ministerial Local Government Investment Order arising from the Cole Inquiry recommendations. Certain investments that Council holds are no longer prescribed (eg. managed funds, CDOs, and equity linked notes), however they have been retained under grandfathering provisions of the Order. These will be disposed of when most financially advantageous to Council.
(g) Fair value estimation
The fair value of financial assets and financial liabilities must be estimated for recognition and measurement or for disclosure purposes.
The fair value of financial instruments traded in active markets is based on quoted market prices at the balance sheet date.
The fair value of financial instruments that are not traded in an active market is determined using valuation techniques.
(h) Receivables
Receivables are initially recognised at fair value and subsequently measured at amortised cost, less any provision for impairment.
Receivables (excluding rates and annual charges) are generally due for settlement no more than 30 days from the date of recognition.
A provision for impairment (i.e. an allowance account) relating to receivables is established when objective evidence shows that Council will not be able to collect all amounts due according to the original terms of each receivable.
(i) Inventories
(i) Raw materials and stores, work in progress and finished goods
Raw materials and stores, work in progress and finished goods in respect of business undertakings are all stated at the lower of cost and net realisable value.
Costs are assigned to individual items of inventory on the basis of weighted average costs.
(j) Infrastructure, property, plant and equipment (I,PP&E)
Acquisition of assets
Council’s non-current assets are continually revalued (over a 5-year period) in accordance with the Fair
Note 1. Summary of Significant Accounting Policies (continued)
122 DELIVERING OUR COMMUNITY'S VISION

FOR THE FINANCIAL YEAR ENDED 30 JUNE 2016
Financial Statements 2016
Ku-ring-gai Council
Notes to the Financial Statements for the year ended 30 June 2016
Note 1. Summary of Significant Accounting Policies (continued)
page 15
Valuation Policy as mandated by the Office of Local Government.
At balance date, the following classes of I,PP&E were stated at their fair value:
- Plant and equipment(as approximated by depreciated historical cost)
- Operational land (external valuation)
- Community land (VG valuation)
- Land improvements(as approximated by depreciated historical cost)
- Buildings – specialised/non-specialised (external valuation)
- Other structures(as approximated by depreciated historical cost)
- Roads assets including roads, bridges and footpaths (internal valuation)
- Bulk earthworks (internal valuation)
- Stormwater drainage (internal valuation)
- Swimming pools (as approximated by depreciated historical cost)
- Recreational Facility Assets (as approximated by depreciated historical cost)
- Other infrastructure (as approximated by depreciated historical cost)
- Other assets(as approximated by depreciated historical cost)
Initial recognition
On initial recognition, an asset’s cost is measured at its fair value, plus all expenditure that is directly attributable to the acquisition.
Where infrastructure, property, plant and equipment assets are acquired for no cost or for an amount other than cost, the assets are recognised in the financial statements at their fair value at acquisition date, being the amount that the asset could have been exchanged between knowledgeable willing parties in an arm’s length transaction.
Subsequent costs
Subsequent costs are included in the asset’s carrying amount or recognised as a separate asset, as appropriate, only when it is probable that future economic benefits associated with the item will flow to Council and the cost of the item can be measured reliably.
All other repairs and maintenance are charged to the income statement during the financial period in which they are incurred.
Asset revaluations (including indexation)
In accounting for asset revaluations relating to infrastructure, property, plant and equipment:
increases in the combined carrying amounts of asset classes arising on revaluation are credited to the asset revaluation reserve,
to the extent that a net asset class increase reverses a decrease previously recognised via the profit or loss, then increase is first recognised in profit or loss,
net decreases that reverse previous increases of the same asset class are first charged against revaluation reserves directly in equity to the extent of the remaining reserve attributable to the asset, with all other decreases charged to the Income Statement.
Full revaluations are undertaken for all assets on a 5-year cycle.
Capitalisation thresholds
Items of infrastructure, property, plant and equipment are not capitalised unless their cost of acquisition exceeds the following:
Asset capitalisation thresholds:
- Road Assets $10,000 - Bridge Assets $10,000 - Road & Reserve Furniture $2,000 - Car Park Assets $10,000 - Footpath Assets $5,000 - Kerb & Gutter Assets $5,000 - Stormwater Drainage Assets $10,000 - Buildings $5,000 - Parks & Recreation Assets $5,000
FINA
NC
IALS
Note 1. Summary of Significant Accounting Policies (continued)
KU-RING-GAI COUNCIL ANNUAL REPORT 2015 - 2016 123

FOR THE FINANCIAL YEAR ENDED 30 JUNE 2016
Financial Statements 2016
Ku-ring-gai Council
Notes to the Financial Statements for the year ended 30 June 2016
Note 1. Summary of Significant Accounting Policies (continued)
page 16
- Fleet & Plant $2,000 - Information Technology Hardware/ $2,000
Software
In determining (and annually reviewing) such thresholds, regard is given to the nature of the asset and its estimated service life.
Depreciation
Depreciation on Council's infrastructure, property, plant and equipment assets is calculated using the straight-line method in order to allocate an asset’s cost (net of residual values) over its estimated useful life.
Land is not depreciated.
Estimated useful lives for Council's I,PP&E include:
- Roads: Surface 20 - 30 years - Roads: Pavement 50 - 100 years - Roads: Formation 120 years - Recreational Facilities 30 -100 years - Drain Structures 10 - 50 years - Drain grates, inlets and pipes 100 -150 years - Buildings 60 - 95 years - Motor vehicles 10 years - Plant & Equipment 10 years - Office Equipment 10 years - Software 5 years - Land Improvement 20 years - Car Park 20 - 100 years - Bridges 10 - 100 years - Footpaths 40 - 80 years - Kerb & Gutter 60 - 100 years
All asset residual values and useful lives are reviewed and adjusted (if appropriate) at each reporting date.
An asset’s carrying amount is written down immediately to its recoverable amount if the asset’s carrying amount is greater than its estimated recoverable amount.
Disposal and de-recognition
An item of property, plant and equipment is derecognised upon disposal or when no further future economic benefits are expected from its use or disposal.
Any gain or loss arising on derecognition of the asset (calculated as the difference between the net disposal proceeds and the carrying amount of the asset) is included in Council’s Income Statement in the year the asset is derecognised.
(k) Land
Land (other than land under roads) is in accordance with Part 2 of Chapter 6 of the Local Government Act (1993) classified as either operational or community.
This classification of land is disclosed in Note 9 (a).
(l) Land under roads
Land under roads is land under roadways and road reserves, including land under footpaths, nature strips and median strips.
Council has elected not to recognise land under roads acquired before 1 July 2008 in accordance with AASB 1051.
Land under roads acquired after 1 July 2008 is recognised in accordance with AASB 116 – Property, Plant and Equipment.
(m) Intangible assets
IT development and software
Systems and costs incurred in acquiring software and licenses that will contribute to future period financial benefits through revenue generation and/or cost reduction are capitalised to software and systems. Costs capitalised include software licenses.
Amortisation is calculated on a straight line bases over periods generally ranging from 3 to 5 years.
(n) Investment property
Investment property comprises buildings that are principally held for long-term rental yields, capital gains or both, that is not occupied by Council. Investment property is carried at fair value. Annual changes in the fair value of investment properties are
Note 1. Summary of Significant Accounting Policies (continued)
124 DELIVERING OUR COMMUNITY'S VISION

FOR THE FINANCIAL YEAR ENDED 30 JUNE 2016
Financial Statements 2016
Ku-ring-gai Council
Notes to the Financial Statements for the year ended 30 June 2016
Note 1. Summary of Significant Accounting Policies (continued)
page 17
recorded in the Income Statement as part of ‘other income’.
(o) Non-current assets ‘held for sale’
Non-current assets (or disposal groups) are classified as held for sale and stated at the lower of either (i) their carrying amount and (ii) fair value less costs to sell, if their carrying amount will be recovered principally through a sale transaction rather than through continuing use.
The exception to this is plant and motor vehicles, which are turned over on a regular basis. Plant and motor vehicles are retained in non-current assets under the classification of infrastructure, property, plant and equipment – unless the assets are to be traded in after 30 June and the replacement assets were already purchased and accounted for as at 30 June.
For any assets or disposal groups classified as non-current assets ‘held for sale’, an impairment loss is recognised at any time when the assets carrying value is greater than its fair value less costs to sell.
Non-current assets ‘held for sale’ are not depreciated or amortised while they are classified as ‘held for sale’.
Non-current assets classified as ‘held for sale’ are presented separately from the other assets in the balance sheet.
(p) Impairment of assets
All Council's I,PP&E is subject to an annual assessment of impairment.
Assets that are subject to amortisation are reviewed for impairment whenever events or changes in circumstances indicate that the carrying amount may not be recoverable.
An impairment loss is recognised for the amount by which the asset’s carrying amount exceeds its recoverable amount.
(q) Payables
These amounts represent liabilities and include goods and services provided to the Council prior to the end of financial year that are unpaid.
The amounts for goods and services are unsecured and are usually paid within 30 days of recognition.
(r) Borrowing costs
Borrowing costs are expensed, except to the extent that they are incurred during the construction of qualifying assets.
(s) Provisions
Provisions for legal claims, service warranties and other like liabilities are recognised when:
Council has a present legal or constructive obligation as a result of past events,
it is more likely than not that an outflow of resources will be required to settle the obligation, and
the amount has been reliably estimated.
Provisions are not recognised for future operating losses.
(t) Employee benefits
(i) Short-term obligations
Short-term employee benefit obligations include liabilities for wages and salaries (including non-monetary benefits), annual leave and vesting sick leave expected to be wholly settled within the 12 months after the reporting period.
Leave liabilities are recognised in the provision for employee benefits in respect of employees’ services up to the reporting date with other short term employee benefit obligations disclosed under payables.
These provisions are measured at the amounts expected to be paid when the liabilities are settled.
FINA
NC
IALS
Note 1. Summary of Significant Accounting Policies (continued)
KU-RING-GAI COUNCIL ANNUAL REPORT 2015 - 2016 125

Financial Statements 2016
Ku-ring-gai Council
Notes to the Financial Statements for the year ended 30 June 2016
Note 1. Summary of Significant Accounting Policies (continued)
page 18
All other short-term employee benefit obligations are presented as payables.
Liabilities for non-vesting sick leave are recognised at the time when the leave is taken and measured at the rates paid or payable, and accordingly no liability has been recognised in these reports.
Wages and salaries, annual leave and vesting sick leave are all classified as current liabilities.
(ii) Other long-term obligations
The liability for all long service and annual leave in respect of services provided by employees up to the reporting date (which is not expected to be wholly settled within the 12 months after the reporting period) are recognised in the provision for employee benefits.
These liabilities are measured at the present value of the expected future payments to be made using the projected unit credit method.
Consideration is given to expected future wage and salary levels, experience of employee departures and periods of service.
Expected future payments are then discounted using market yields at the reporting date based on national government bonds with terms to maturity and currency that match as closely as possible the estimated future cash outflows.
Due to the nature of when and how long service leave can be taken, all long service leave for employees with 5 or more years of service has been classified as current, as it has been deemed that Council does not have the unconditional right to defer settlement beyond 12 months – even though it is not anticipated that all employees with more than 5 years service (as at reporting date) will apply for and take their leave entitlements in the next 12 months.
(iii) Retirement benefit obligations
All employees of the Council are entitled to benefits on retirement, disability or death.
Council contributes to various defined benefit plans and defined contribution plans on behalf of its employees.
Defined benefit plans
A liability or asset in respect of defined benefit superannuation plans would ordinarily be recognised in the balance sheet, and measured as the present value of the defined benefit obligation at the reporting date plus unrecognised actuarial gains (less unrecognised actuarial losses) less the fair value of the superannuation fund’s assets at that date and any unrecognised past service cost.
The present value of the defined benefit obligation is based on expected future payments which arise from membership of the fund to the reporting date, calculated annually by independent actuaries using the projected unit credit method. Consideration is given to expected future wage and salary levels, experience of employee departures and periods of service.
However, when this information is not reliably available, Council can account for its obligations to defined benefit plans on the same basis as its obligations to defined contribution plans – i.e. as an expense when they become payable.
Council is party to an Industry Defined Benefit Plan under the Local Government Superannuation Scheme, named the ‘Local Government Superannuation Scheme – Pool B’.
This scheme has been deemed to be a ‘multi-employer fund’ for the purposes of AASB 119.
Sufficient information is not available to account for the Scheme as a defined benefit plan (in accordance with AASB 119) because the assets to the scheme are pooled together for all Councils.
The last valuation of the Scheme was performed by Mr Richard Boyfield, FIAA on 24th February 2016, relating to the period ending 30 June 2015.
The position is monitored annually and the actuary has estimated that as at 30 June 2016 the prior period deficit still exists.
As a result the Scheme has asked for a continuation of increased future contributions to recover that deficiency.
Council’s share of that deficiency cannot be accurately calculated as the scheme is a mutual
FOR THE FINANCIAL YEAR ENDED 30 JUNE 2016
Note 1. Summary of Significant Accounting Policies (continued)
126 DELIVERING OUR COMMUNITY'S VISION

Financial Statements 2016
Ku-ring-gai Council
Notes to the Financial Statements for the year ended 30 June 2016
Note 1. Summary of Significant Accounting Policies (continued)
page 19
arrangement where assets and liabilities are pooled together for all member councils.
For this reason, no liability for the deficiency has been recognised in these financial statements.
Council has, however, disclosed a contingent liability in Note 18 to reflect the possible obligation that may arise should the scheme require immediate payment to correct the deficiency.
Defined contribution plans
Contributions to defined contribution plans are recognised as an expense as they become payable. Prepaid contributions are recognised as an asset to the extent that a cash refund or a reduction in the future payments is available.
(u) Allocation between current and non-current assets and liabilities
In the determination of whether an asset or liability is classified as current or non-current, consideration is given to the time when each asset or liability is expected to be settled.
The asset or liability is classified as current if it is expected to be settled within the next 12 months, being the Council’s operational cycle.
Exceptions
In the case of liabilities where Council does not have the unconditional right to defer settlement beyond 12 months (such as vested long service leave), the liability is classified as current even if it is not expected to be settled within the next 12 months.
(v) Taxes
The Council is exempt from both Commonwealth Income Tax and Capital Gains Tax.
Council does, however, have to comply with both Fringe Benefits Tax and Goods and Services Tax (GST).
Goods and Services Tax (GST)
Income, expenses and assets are all recognised net of the amount of GST, except where the amount of GST incurred is not recoverable from the Australian Tax Office (ATO).
In these circumstances the GST is recognised as part of the cost of acquisition of the asset or as part of the revenue / expense.
Receivables and payables within the Balance Sheet are stated inclusive of any applicable GST.
The net amount of GST recoverable from or payable to the ATO is included as a current asset or current liability in the Balance Sheet.
(w) New accounting standards and Interpretations issued (not yet effective)
Certain new (or amended) accounting standards and interpretations have been published that are not mandatory for reporting periods ending 30 June 2016.
Council has not adopted any of these standards early.
These include the following standards that are anticipated will impact on local government:
AASB 9 – Financial Instruments
AASB 15 – Revenue from Contracts with Customers and associated amending standards
AASB ED 260 – Income of Not-for-Profit Entities
AASB16 – Leases
AASB2015-6 – Amendments to Australian Accounting Standards – Extending Related Party Disclosures to Not-for-Profit Public Sector Entities
AASB 2014 – 10 Sale or Contribution of Assets Between an Investor and its Associate or Joint Venture
AASB 2014 – 3 Amendments to Australian Accounting Standards – Accounting for Acquisitions of Interests in Joint Operations [AASB 1 and AASB 11]
FOR THE FINANCIAL YEAR ENDED 30 JUNE 2016
FINA
NC
IALS
Note 1. Summary of Significant Accounting Policies (continued)
KU-RING-GAI COUNCIL ANNUAL REPORT 2015 - 2016 127

Financial Statements 2016
Ku-ring-gai Council
Notes to the Financial Statements for the year ended 30 June 2016
Note 1. Summary of Significant Accounting Policies (continued)
page 20
The full impact of the above standards has yet to be ascertained or quantified but will range from additional and/or revised disclosures to changes in how certain transactions and balances are accounted for.
(x) Rounding of amounts
Unless otherwise indicated, amounts in the financial statements have been rounded off to the nearest thousand dollars.
(y) Comparative figures
To ensure comparability with the current reporting period’s figures, some comparative period line items and amounts may have been reclassified or individually reported for the first time within these financial statements and/or the notes.
(z) Disclaimer
Nothing contained within these statements may be taken to be an admission of any liability to any person under any circumstance.
FOR THE FINANCIAL YEAR ENDED 30 JUNE 2016
Note 1. Summary of Significant Accounting Policies (continued)
128 DELIVERING OUR COMMUNITY'S VISION

Ku-
ring-
gai C
ounc
il
Not
es to
the
Fina
ncia
l Sta
tem
ents
for t
he y
ear e
nded
30
June
201
6
Not
e 2(
a). C
ounc
il Fu
nctio
ns/A
ctiv
ities
– F
inan
cial
Info
rmat
ion
1. In
clud
es: r
ates
and
ann
ual c
harg
es (i
ncl.
ex-g
ratia
), un
tied
gene
ral p
urpo
se g
rant
s an
d un
rest
ricte
d in
tere
st a
nd in
vest
men
t inc
ome.
page 21
Financial Statements 2016
2016
Act
ual
2015
Act
ual
2015
2016
2016
2015
2016
(292
)23
,778
33,4
4282
0
2016
Act
ual
Orig
inal
Bud
get
2016
Act
ual
$ ’0
00
Inco
me,
exp
ense
s an
d as
sets
hav
e be
en d
irect
ly a
ttrib
uted
to th
e fo
llow
ing
func
tions
/act
iviti
es.
Det
ails
of t
hese
func
tions
/act
iviti
es a
re p
rovi
ded
in N
ote
2(b)
.
Inco
me
from
Con
tinui
ng
Ope
ratio
nsEx
pens
es fr
om C
ontin
uing
O
pera
tions
Tota
l Ass
ets
held
(c
urre
nt &
no
n-cu
rren
t) F
unct
ions
/act
iviti
es
2016
2015
Act
ual
Act
ual
Act
ual
Gra
nts
incl
uded
in
Inco
me
from
C
ontin
uing
O
pera
tions
Ope
ratin
g R
esul
t fro
m
Con
tinui
ng O
pera
tions
Orig
inal
Bud
get
Orig
inal
Act
ual
638
4,40
5 P
ublic
ord
er a
nd s
afet
y
Bud
get
(3,9
63)
4,14
759
,292
71,6
793
725
,20017
622
,44426
529
511
48,9
7825
,850
Gov
erna
nce
Adm
inis
tratio
n
(4,2
52)
26,7
396,
514
6,80
820
,905
24,5
4726
,414
591
173
509
6,51
1
567
7,22
8
(437
)37
3 H
ealth
Env
ironm
ent
22,4
87442
4,43
013
028
9
1,19
91,
148
23,1
96
4,53
1 H
ousi
ng a
nd c
omm
unity
am
eniti
es1,
022
Rec
reat
ion
and
cultu
re7,
077
7,07
8
7,58
7 C
omm
unity
ser
vice
s an
d ed
ucat
ion
7,10
2
14,5
72
(3,5
09)
4,46
6
7,82
9
4,13
426
,816
2,25
913
,441
10,6
4625
,561
23,8
46
Tra
nspo
rt an
d co
mm
unic
atio
n5,
764
Min
ing,
man
ufac
turin
g an
d co
nstru
ctio
n2,
266
2,46
34,
792
6,89
85,
230
14,3
02(4
,435
)(9
,780
)6,
678
1,75
01,
951
574,
187
376,
358
332
513
337,
665
Act
ual
2016
96,8
7820
15
388
278
6,53
3
56,5
67
(220
)(3
,610
)–52
(165
)49
,235
(258
)
Act
ual
59–87
,463
184,
940
165,
926
4,98
06,
578
10,5
3263
,049
473
475
(3,5
09)
–(2
00)
24
1,41
4(3
,318
)
211
172
1,23
311
,739
7,28
18,
332
5,55
1(3
,217
)(3
,642
)
(2,9
35)
359
294
(13,
200)
(1
8,48
4)
(19,
738)
308
(8,5
38)
(2,9
64)
5,70
8
110,
734
–
110,
734
––
4,50
0(1
2,45
9) 22
,586
(5,5
70)
1,30
21,
811 –
(275
)
(8,6
81)
27,2
7041
,970
195
35,0
4535
,951
36,2
62
4,23
71,
193,
150
(6,7
63)
–
1,33
0,26
6
––
(164
)51
5,15
5
1,19
3,15
0
–
1,33
0,26
6
–
8,07
0
3,80
1
8,30
1
3,83
3
114,
057
11
4,32
9
133,
320
–
338
347
–
655
31
98,2
7511
4,32
9
114,
057
35,0
45
119,
765
Gen
eral
pur
pose
inco
me
1
con
tinui
ng o
pera
tions
36,2
62 O
pera
ting
resu
lt fr
om
Eco
nom
ic a
ffairs
105,
648
T
otal
func
tions
and
act
iviti
es63
35,9
51
156,
027
14
1,59
9
FOR
THE
FINA
NCIA
L YE
AR E
NDED
30
JUNE
201
6
Note
2(a
) Cou
ncil
Func
tions
/Act
iviti
es -
Fin
anci
al In
form
atio
n
FINA
NC
IALS
KU-RING-GAI COUNCIL ANNUAL REPORT 2015 - 2016 129

Financial Statements 2016
page 22
Ku-ring-gai Council
Notes to the Financial Statementsfor the year ended 30 June 2016
Note 2(b). Council Functions/Activities – Component Descriptions
Details relating to the Council’s functions/activities as reported in Note 2(a) are as follows:
GOVERNANCE
ADMINISTRATION
PUBLIC ORDER AND SAFETY
HEALTH
ENVIRONMENT
COMMUNITY SERVICES AND EDUCATION
HOUSING AND COMMUNITY AMENITIES
RECREATION AND CULTURE
MINING, MANUFACTURING AND CONSTRUCTION
TRANSPORT AND COMMUNICATION
ECONOMIC AFFAIRSCamping areas, caravan parks, tourism and area promotion, industrial development promotion, saleyards and markets, realestate development, commercial nurseries, other business undertakings.
Administration, family day care, child care, youth services, other family and children, aged and disabled, migrant services,Aboriginal services, other community services, education.
Housing, town planning, street lighting, other sanitation and garbage, public cemeteries, public conveniences, othercommunity amenities.
Public libraries, museums, art galleries, community centres, public halls, other cultural services, swimming pools, sportinggrounds, parks and gardens (lakes), other sport and recreation.
Building control, abattoirs, quarries, pits and other.
Urban roads, sealed rural roads, unsealed rural roads, bridges, footpaths, aerodromes, parking areas, bus shelters andservices, water transport, RMS works, other.
Noxious plants and insect/vermin control, other environmental protection, solid waste management, street cleaning,drainage, stormwater management.
Costs relating to the Council’s role as a component of democratic government, including elections, members’ fees andexpenses, subscriptions to local authority associations, meetings of council and policy making committees, arearepresentation and public disclosure and compliance.
Corporate Support and Other Support Services (not otherwise attributed to the listed functions / activities).
Fire protection, animal control, enforcement of local government regulations, emergency services, other.
Inspection, immunisations, food control, health centres, other, administration.
FOR THE FINANCIAL YEAR ENDED 30 JUNE 2016
Note 2(b) Council Functions/Activities - Component Descriptions
Details relating to the Council's functions / activities as reported in Note 2(a) are as follows:
130 DELIVERING OUR COMMUNITY'S VISION
Financial Statements 2016
page 23
Ku-ring-gai Council
Notes to the Financial Statementsfor the year ended 30 June 2016
Note 3. Income from Continuing Operations
$ ’000
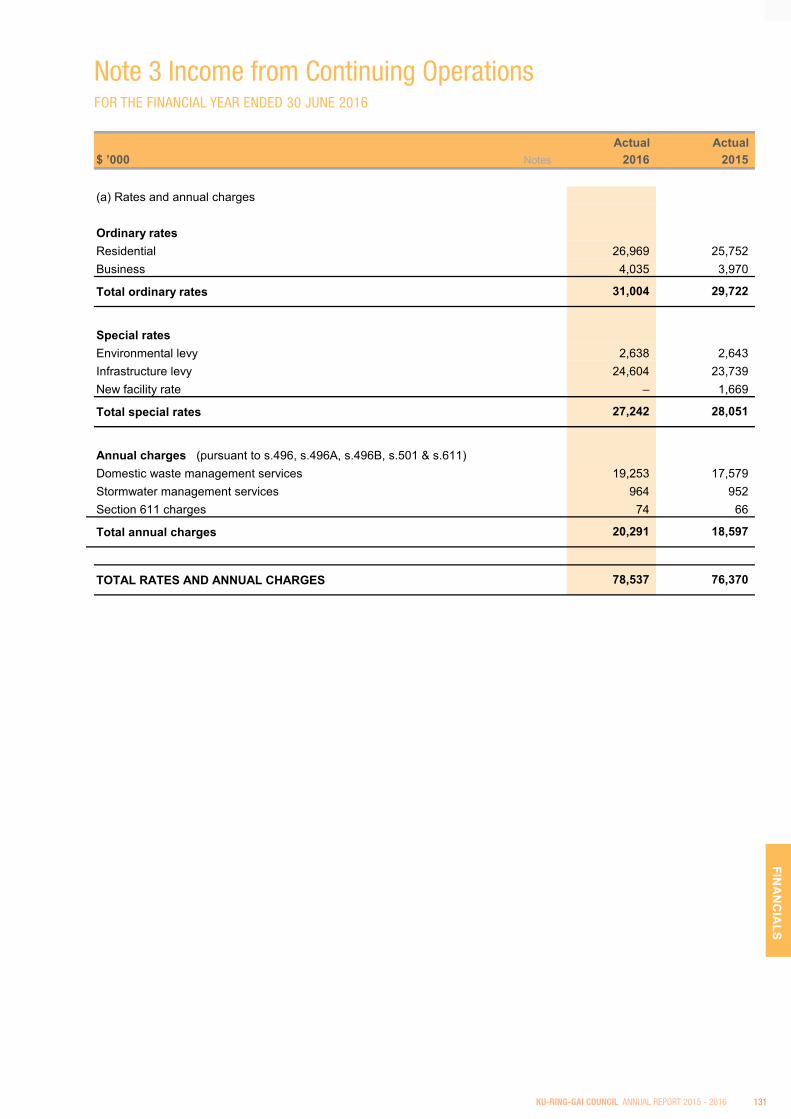
(a) Rates and annual charges
Ordinary ratesResidentialBusiness
Total ordinary rates
Special ratesEnvironmental levyInfrastructure levyNew facility rate
Total special rates
Annual charges (pursuant to s.496, s.496A, s.496B, s.501 & s.611)Domestic waste management servicesStormwater management servicesSection 611 charges
Total annual charges
TOTAL RATES AND ANNUAL CHARGES
18,597
74
20,291
78,537
96419,253
76,370
28,051
17,579
3,970
27,242
24,604
66
25,752
2,643
31,004
Actual
26,9694,035
Actual
23,739
29,722
Notes 2016 2015
1,669–
2,638
952
Note 3 Income from Continuing OperationsFOR THE FINANCIAL YEAR ENDED 30 JUNE 2016
FINA
NC
IALS
KU-RING-GAI COUNCIL ANNUAL REPORT 2015 - 2016 131

Financial Statements 2016
page 24
Ku-ring-gai Council
Notes to the Financial Statementsfor the year ended 30 June 2016
Note 3. Income from Continuing Operations (continued)
$ ’000
(b) User charges and fees
Other user charges and fees
(i) Fees and charges – statutory and regulatory functions (per s.608)Building regulationCertificatesDA advertising feesDriveway application feesOutstanding noticesRegulatory application feesTree preservation charges
Total fees and charges – statutory/regulatory
(ii) Fees and charges – other (incl. general user charges (per s.608))Art centreBus sheltersThomas Carlyle Children Centre & Family day careGolf courses (Gordon & Turramurra)HallsHoliday activitiesLeaseback fees – Council vehiclesLibraryNursery & Wildflower GardenParksRestoration chargesSale of documentsShowgroundSwimming centresTennis courtsTrade waste chargesOther
Total fees and charges – other
TOTAL USER CHARGES AND FEES
446330 323
1,287 1,1061,139 725
328
353
706
382
Notes
2,230696
83302
Actual
243
342
482
10,473
574
6 6
3221,666
62
1,781
4,197299
73
237
806
612,234
1,282
447 386
212 148
1,660
38
76
2015Actual
91
508
3,210
90
43
1,779
2016
252
746
18,003 13,683
14,147
101
3,856
Note 3 Income from Continuing OperationsFOR THE FINANCIAL YEAR ENDED 30 JUNE 2016
132 DELIVERING OUR COMMUNITY'S VISION

Financial Statements 2016
page 25
Ku-ring-gai Council
Notes to the Financial Statementsfor the year ended 30 June 2016
Note 3. Income from Continuing Operations (continued)
$ ’000
(c) Interest and investment revenue (including losses)
Interest – Interest on overdue rates and annual charges (incl. special purpose rates) – Interest earned on investments (interest and coupon payment income)Amortisation of premiums and discounts – ‘Held to maturity’ investments
TOTAL INTEREST AND INVESTMENT REVENUE
Interest revenue is attributable to:Unrestricted investments/financial assets:Overdue rates and annual charges (general fund)General Council cash and investments
Restricted investments/funds – external:Development contributions – Section 94
Restricted investments/funds – internal:Internally restricted assets
Total interest and investment revenue recognised
(d) Other revenues
Rental income – investment propertiesRental income – other council propertiesFines – parkingFines – otherLegal fees recovery – rates and charges (extra charges)Legal fees recovery – otherCommissions and agency feesCredit card surchargeDog registration feesFilming feesInsurance claim recoveriesLicence incomeProgram feesRecycling income (non-domestic)Trade discountDomestic waste other incomeOther
TOTAL OTHER REVENUE
4,218
26
290
9,534
87
119
1,833632
740
4
1,106
127
11,823
956
26
387
407
4,232
6
140
–
378
4,027
227
17
79350
–
2,001
118
26
2,5372,761
4,027
867 892
463
120
2016
4,130127
2015Notes
3,866
Actual
120
1,164497
4,720
1,025
71
478
Actual
(39)
4,218
41
14
454
93
FINA
NC
IALS
Note 3 Income from Continuing OperationsFOR THE FINANCIAL YEAR ENDED 30 JUNE 2016
KU-RING-GAI COUNCIL ANNUAL REPORT 2015 - 2016 133

Financial Statements 2016
page 26
Ku-ring-gai Council
Notes to the Financial Statementsfor the year ended 30 June 2016
Note 3. Income from Continuing Operations (continued)
$ ’000
(e) Grants
General purpose (untied)Financial assistancePensioners’ rates subsidies – general component
Total general purpose
Specific purposePensioners’ rates subsidies: – Domestic waste managementCommunity careCommunity centresEnvironmental protectionFire managementLibraryLIRS subsidyNSW rural fire servicesRecreation and cultureRoad safetyStreet lightingTransportBetter waste and recycling fundOther
Total specific purpose
Total grants
Grant revenue is attributable to:– Commonwealth funding– State funding
20162015
–––
–
–
–
3,833
–
–
2015Capital
40
203
289
60 –1,298 –
172
92
271
3,544
715
–
––
1,212
Operating 2016
–
171
–
55
710
–
8,127
5,609
–
3,801
203
6160
276
61
70
271 –
– –
7,360
–362
–
174
174
174
–
234 –
–
–
21
7,360
3,8163,544
34
3,527
286
–
710
274
–
141
51
42
298
4,326
8,127
2,518
5429
174
1,811
3,527
–
–
Capital Operating
1
–
655
710
137
–
Note 3 Income from Continuing OperationsFOR THE FINANCIAL YEAR ENDED 30 JUNE 2016
134 DELIVERING OUR COMMUNITY'S VISION

Financial Statements 2016
page 27
Ku-ring-gai Council
Notes to the Financial Statementsfor the year ended 30 June 2016
Note 3. Income from Continuing Operations (continued)
$ ’000
(f) Contributions
Developer contributions:S 94 – contributions towards amenities/services
Total developer contributions
Other contributions:Contribution to worksRMS contributions (regional roads, block grant)Other
Total other contributions
Total contributions
TOTAL GRANTS AND CONTRIBUTIONS
$ ’000
(g) Restrictions relating to grants and contributions
Certain grants and contributions are obtained by Council on conditionthat they be spent in a specified manner:
Unexpended at the close of the previous reporting period
Add: grants and contributions recognised in the current period but not yet spent:
Less: grants and contributions recognised in a previous reporting period now spent:
Net increase in restricted assets during the period
Unexpended and held as restricted assets
Comprising: – Specific purpose unexpended grants – Developer contributions
–
33,401
–166
Operating
Actual
168
2
700–
2
20152016 2015
7,671
89,481
33,401
366
2
Capital 2016
Operating
(15,089)
65,970
8,295
166
2
368 34,977
7,728
65,970
35,151
972
17
366–
38,600
89,481
82388,509 65,147
–
Actual
1,576
93
Capital
9,126
876
745
8,416
2016 2015
12,219
7,671
– 652
23,511
(7,693)
61,444
65,970
4,526
FINA
NC
IALS
Note 3 Income from Continuing OperationsFOR THE FINANCIAL YEAR ENDED 30 JUNE 2016
KU-RING-GAI COUNCIL ANNUAL REPORT 2015 - 2016 135

Financial Statements 2016
page 28
Ku-ring-gai Council
Notes to the Financial Statementsfor the year ended 30 June 2016
Note 4. Expenses from Continuing Operations
$ ’000
(a) Employee benefits and on-costs
Salaries and wagesEmployee leave entitlements (ELE)SuperannuationWorkers’ compensation insuranceFringe benefit tax (FBT)Training costs (other than salaries and wages)Other
Total employee costs
Less: capitalised costs
TOTAL EMPLOYEE COSTS EXPENSED
Number of ‘full-time equivalent’ employees (FTE) at year end
(b) Borrowing costs
(i) Interest bearing liability costsInterest on loans
Total interest bearing liability costs
TOTAL BORROWING COSTS EXPENSED
(c) Materials and contracts
Raw materials and consumablesContractor and consultancy costsAuditors remuneration Lease expenseLegal expenses: – Legal expenses: planning and development – Legal expenses: otherOperating leases: – Operating lease rentals: minimum lease paymentsOther
TOTAL MATERIALS AND CONTRACTS
3,552
270
3,555
157
424
296362
57
1,562
82
Notes
273
249
37,447
38,300
1,277
409
1,562
424
201
4,972
2016
39,539
1,805
Actual
356
28,77930,003
150252
32,978
1,562
350
39,575
78
36,127
948
948
948
(2,128)
4,925
2015
329
Actual
3,531
358
38,390
32,8183,319
(2,173)
46
FOR THE FINANCIAL YEAR ENDED 30 JUNE 2016
Note 4 Expenses from Continuing Operations
136 DELIVERING OUR COMMUNITY'S VISION

Financial Statements 2016
page 29
Ku-ring-gai Council
Notes to the Financial Statementsfor the year ended 30 June 2016
Note 4. Expenses from Continuing Operations (continued)
$ ’000
(c) Materials and contracts (continued)
1. Auditor remuneration During the year, the following fees were incurred for services provided by
the Council’s Auditor:
Audit and other assurance services – Audit and review of financial statements: Council’s Auditor
Remuneration for audit and other assurance services
Total Auditor remuneration
2. Operating lease payments are attributable to:Computers
$ ’000
(d) Depreciation, amortisation and impairment
Plant and equipmentOffice equipmentFurniture and fittingsLand improvements (depreciable)Infrastructure: – Buildings – non-specialised – Buildings – specialised – Other structures – Roads – Bridges – Footpaths – Stormwater drainage – Swimming pools – Other open space/recreational assetsOther assets – Library books – OtherIntangible assets
TOTAL DEPRECIATION AND IMPAIRMENT COSTS EXPENSED
Actual 2016
57
353
1,899
1,653
Notes
402
Notes
46
290
33427
46
46
2,494
273270
57
57
270
2,396
272
Actual
172
530
25
750 1,235
54
2015
451
266
162
2,931
191
163
Actual
625
Depreciation/amortisation
53
Actual 2016
273
19,349
894895
512
8,810 6,664
21
2015
442
2,853
31
19,476
FOR THE FINANCIAL YEAR ENDED 30 JUNE 2016
Note 4 Expenses from Continuing Operations
FINA
NC
IALS
KU-RING-GAI COUNCIL ANNUAL REPORT 2015 - 2016 137

Financial Statements 2016
page 30
Ku-ring-gai Council
Notes to the Financial Statementsfor the year ended 30 June 2016
Note 4. Expenses from Continuing Operations (continued)
$ ’000
(e) Other expenses
AdvertisingBad and doubtful debtsBank chargesCommissionsComputer software chargesConferencesContributions/levies to other levels of government – Department of Planning levy – NSW Fire Brigade LevyCorporate eventsCouncillor expenses – mayoral feeCouncillor expenses – councillors’ feesDonations, contributions and assistance to other organisations (Section 356)Electricity and heatingExternal plant hireFamily day care (child care assistance)InsuranceInsurance excessPostageRate issue costsRental rebatesStreet lightingSubscriptions and publicationsSydney waterTelephone and communicationsValuation feesVehicle registrationOther
TOTAL OTHER EXPENSES
511
356
2,085
275
40
47
255
374
212
497
1,286
1741,069
172,306
Notes
244305
44
278
340
907
16,242
1,087
59507
73
283
149
2,32121
155
464604
231
1,450
179
158
281,956
Actual
2,212
1,029
2015
243303
184
391
173
2,237
207
39
497
1,169
215
15,306
1,267
32
3
2016Actual
FOR THE FINANCIAL YEAR ENDED 30 JUNE 2016
Note 4 Expenses from Continuing Operations
138 DELIVERING OUR COMMUNITY'S VISION

Financial Statements 2016
page 31
Ku-ring-gai Council
Notes to the Financial Statementsfor the year ended 30 June 2016
Note 5. Gains or Losses from the Disposal of Assets
$ ’000
Plant and equipmentProceeds from disposal – plant and equipmentLess: carrying amount of plant and equipment assets sold/written off
Net gain/(loss) on disposal
InfrastructureProceeds from disposal – infrastructureLess: carrying amount of infrastructure assets sold/written off
Net gain/(loss) on disposal
Financial assetsProceeds from disposal/redemptions/maturities – financial assetsLess: carrying amount of financial assets sold/redeemed/matured
Net gain/(loss) on disposal
Non-current assets classified as ‘held for sale’Proceeds from disposal – non-current assets ‘held for sale’Less: carrying amount of ‘held for sale’ assets sold/written off
Net gain on disposal
OtherProceeds from disposal – OtherLess: carrying amount of Other assets sold/written off
Net (loss) on disposal
NET GAIN/(LOSS) ON DISPOSAL OF ASSETS 12,852
Notes
(712)
(39,216)
–
(45)
(908)
Actual 2015
720774
2016
(135)
––
12,607
–
–
(35,546)
8
9,004
Actual
(405)
(1,040)
106
6,067(331)
6,777
–
–
1,146
35,546
(5,830)
(45)
39,216
(331) (2,937)
Note 5 Gains or Losses from the Disposal of AssetsFOR THE FINANCIAL YEAR ENDED 30 JUNE 2016
FINA
NC
IALS
KU-RING-GAI COUNCIL ANNUAL REPORT 2015 - 2016 139

Financial Statements 2016
page 32
Ku-ring-gai Council
Notes to the Financial Statementsfor the year ended 30 June 2016
Note 6a. – Cash Assets and Note 6b. – Investments
$ ’000
Cash and cash equivalents (Note 6a)
Cash on hand and at bank
Total cash and cash equivalents
Investments (Note 6b)
–Term deposits – FRN’s (with maturities > 3 months) – Deposits (Short Term) 1
– Other Long Term Financial Assets (CPDO PP)
Total investments
1 Those investments where time to maturity (from date of purchase) is less than 3 months.
Refer to Note 27. Fair value measurement for information regarding the fair value of investments held.
$ ’000
Reconciliation of investmentsclassified as ‘held to maturity’Balance at the beginning of the yearAdditionsDisposals (sales and redemptions)Transfers between current/non-current
Balance at end of year
Comprising:– Term deposits– FRN’s (with maturities > 3 months)
– Other Long Term Financial Assets (CPDO PP)
Total
TOTAL CASH ASSETS, CASHEQUIVALENTS AND INVESTMENTS
Actual
–
68,254
4,993
68,254
29,833 43,000
Actual Non-current
Notes
2016Actual
Current
291
Actual
–
291
Current Actual
2015
Non-current
3,00943,500
68,254
–
41,45762,274
(2)42,052
(35,544)
24,254
(16,018)
–3,009
57,313
34,826
44,000
–
34,826
Actual
10,804
2016
57,604
–
57,313
54,304
10,978
22,000
16,018
57,313
2016
24,254
–– 13,833
34,826
68,254 35,010
2016 2015
Current
184
(9)
44,000
–
51,005
2015
Non-current Current
62,274
–
43,000
(10,978)
22,256
6,000
(39,166)
34,826
13,274
62,274
21,557
13,274
62,274
–
Actual 2015
6,000–
Actual
Non-current
184
16,000
62,274
4,993
Note 6a Cash Assets and Note 6b InvestmentsFOR THE FINANCIAL YEAR ENDED 30 JUNE 2016
140 DELIVERING OUR COMMUNITY'S VISION
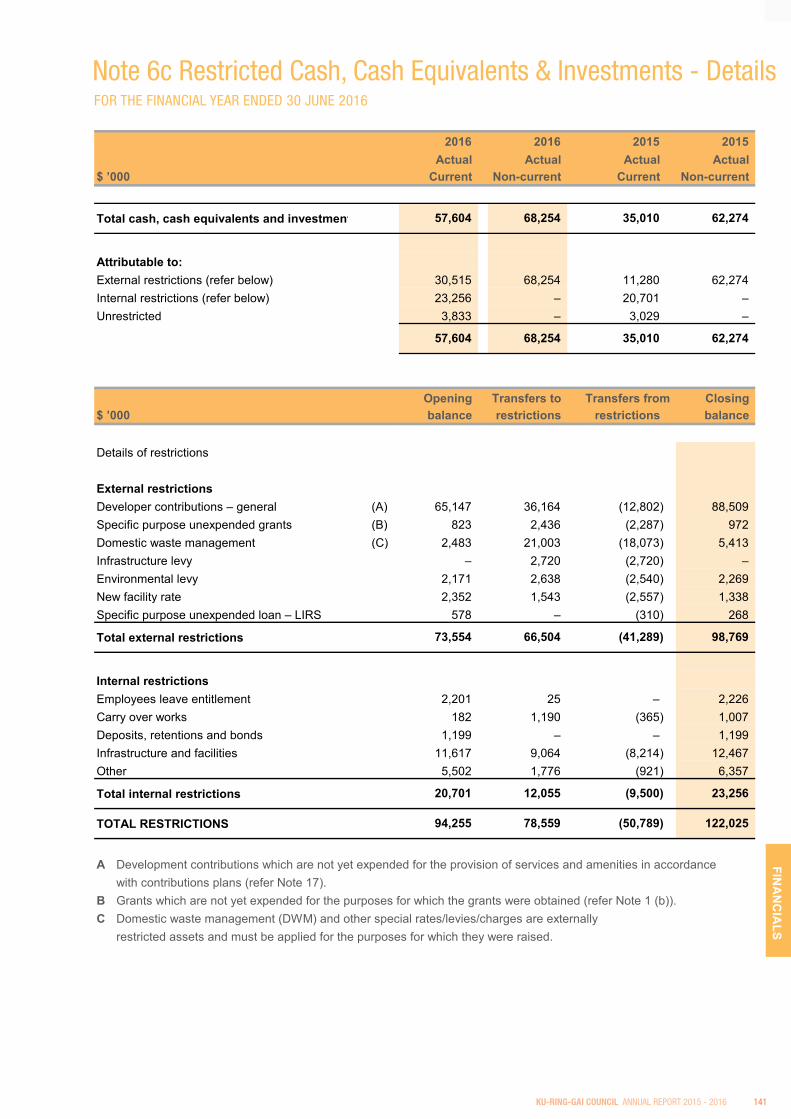
Financial Statements 2016
page 33
Ku-ring-gai Council
Notes to the Financial Statementsfor the year ended 30 June 2016
Note 6c. Restricted Cash, Cash Equivalents and Investments – Details
$ ’000
Total cash, cash equivalents and investment
Attributable to:External restrictions (refer below)Internal restrictions (refer below)Unrestricted
$ ’000
Details of restrictions
External restrictions Developer contributions – general (A)Specific purpose unexpended grants (B)Domestic waste management (C)Infrastructure levy Environmental levyNew facility rateSpecific purpose unexpended loan – LIRS
Total external restrictions
Internal restrictionsEmployees leave entitlementCarry over worksDeposits, retentions and bondsInfrastructure and facilitiesOther
Total internal restrictions
TOTAL RESTRICTIONS
A Development contributions which are not yet expended for the provision of services and amenities in accordancewith contributions plans (refer Note 17).
B Grants which are not yet expended for the purposes for which the grants were obtained (refer Note 1 (b)).C Domestic waste management (DWM) and other special rates/levies/charges are externally
restricted assets and must be applied for the purposes for which they were raised.
2015
3,833
2,638
Actual
62,274
–
9,064 (8,214) 12,467
balance
36,164
restrictions
1,007
88,509
2,720
–1,190
66,504
–
578
(12,802)972
1,338(2,540) 2,269
–
Current
(18,073)
2,226
(2,720)
(310)
1,199(365)
(41,289)
122,025
268
(2,287)
6,357
23,256
(921)
20,701
balance restrictions
Actual
–
2,483
1,543
25
(9,500)
2,201
1,199
94,255
12,055
1,776
(50,789)
98,769
20,701
30,515
2016
78,559
2,352
5,50211,617
73,554
Transfers to
21,003
Current
68,254
2,436823
2,171
57,604
68,254
Actual Non-current
–
65,147
57,604
182
–5,413
(2,557)
2016 Closing Transfers from
–23,256
35,010
62,274
3,029
Opening
2016 2015
–
68,254 62,274
Actual
11,280
–
35,010
Non-current
Note 6c Restricted Cash, Cash Equivalents & Investments - DetailsFOR THE FINANCIAL YEAR ENDED 30 JUNE 2016
FINA
NC
IALS
KU-RING-GAI COUNCIL ANNUAL REPORT 2015 - 2016 141

Financial Statements 2016
page 34
Ku-ring-gai Council
Notes to the Financial Statementsfor the year ended 30 June 2016
Note 7. Receivables
$ ’000
PurposeRates and annual chargesInterest and extra chargesUser charges and feesCapital debtors (being sale of assets) – Other asset salesAccrued revenues – Interest on investments – Other income accrualsGovernment grants and subsidiesNet GST receivableOther debtors
Total
Less: provision for impairmentUser charges and fees
Total provision for impairment – receivables
TOTAL NET RECEIVABLES
There are no restrictions applicable to the above assets.
Notes on debtors above:(i) Rates and annual charges outstanding are secured against the property.(ii) Interest was charged on overdue rates and charges at 8.00% (2015 8.50%).
Generally all other receivables are non-interest bearing.(iii) Please refer to Note 15 for issues concerning credit risk and fair value disclosures.
Note 8. Inventories and Other Assets
$ ’000
(a) InventoriesInventories at costStores and materialsTrading stock
TOTAL INVENTORIES
(b) Other assetsPrepayments
TOTAL OTHER ASSETS
TOTAL INVENTORIES AND OTHER ASSETS
There are no restrictions applicable to the above assets.
Non-current
118
–
Current
2,154
–
–
Non-current
752687
–
32
–
––
–
–
251
142
–
2,29646
8,185
–
2016
(203)
106
(203)
–
150
150
1,513
2015
914
–
2016
2,231
–
–
934
133
–
Non-current
8,081
27
–
211
–
1,5552,462 ––
2,231
139–
231
1,304
Non-current Notes Current
–92 109
2015
1,304–
–
–
8,042
–
133
(104)
(104)
––
–
9351,604
–1,825
Current
43
8,245
207
Notes
–
–
2,222 87
Current
Note 7 ReceivablesFOR THE FINANCIAL YEAR ENDED 30 JUNE 2016
Note 8 Inventories & Other AssetsFOR THE FINANCIAL YEAR ENDED 30 JUNE 2016
142 DELIVERING OUR COMMUNITY'S VISION

Ku-
ring-
gai C
ounc
il
Not
es to
the
Fina
ncia
l Sta
tem
ents
for t
he y
ear e
nded
30
June
201
6
Not
e 9a
. Inf
rast
ruct
ure,
Pro
perty
, Pla
nt a
nd E
quip
men
t
At
At
Car
ryin
gA
tA
tC
arry
ing
$ ’0
00co
stfa
ir va
lue
depr
ecia
tion
valu
eco
stfa
ir va
lue
depr
ecia
tion
impa
irmen
tva
lue
Cap
ital w
ork
in p
rogr
ess
8,46
2–
–8,
462
3,71
13,
630
––
(5,3
24)
–(2
)–
––
10,4
76–
––
10,4
76 P
lant
and
equ
ipm
ent
–12
,223
6,19
36,
030
1,78
1–
(865
)(8
95)
––
––
––
–12
,284
6,23
2–
6,05
2 O
ffice
equ
ipm
ent
–2,
363
1,17
11,
192
–65
(43)
(191
)–
–(5
0)–
––
–1,
743
770
–97
3 F
urni
ture
and
fitti
ngs
–44
523
121
4–
6–
(27)
––
––
––
–45
125
8–
193
Lan
d:
– O
pera
tiona
l lan
d–
52,6
32–
52,6
32–
2,51
5–
––
1,14
5–
––
––
56,2
92–
–56
,292
1
– C
omm
unity
land
*–
334,
736
–33
4,73
6–
1,70
0–
––
(1,1
45)
––
(23,
008)
116,
122
–42
8,40
6–
–42
8,40
62
–
Lan
d un
der r
oads
(pos
t 30/
6/08
)–
66–
66–
––
––
––
––
––
66–
–66
3 L
and
impr
ovem
ents
– d
epre
ciab
le–
17,9
1130
417
,607
–3,
522
–(3
34)
–(1
8,60
0)–
––
––
2,83
463
9–
2,19
5 In
fras
truc
ture
:
– B
uild
ings
– n
on-s
peci
alis
ed–
126,
472
60,1
9266
,280
1,43
51,
242
–(1
,899
)14
017
2–
(19,
228)
––
–10
9,80
561
,663
–48
,142
6
– B
uild
ings
– s
peci
alis
ed–
11,8
991,
431
10,4
68–
17–
(402
)–
3,10
0–
––
––
15,0
161,
833
–13
,183
5
– O
ther
stru
ctur
es–
13,0
325,
131
7,90
133
––
(272
)–
––
––
––
12,9
885,
326
–7,
662
8
– R
oads
–45
5,34
820
5,74
524
9,60
37,
608
108
–(8
,810
)1,
276
603
––
––
–46
4,94
321
4,55
5–
250,
388
9
– B
ridge
s–
11,4
184,
869
6,54
9–
––
(163
)–
––
––
––
11,4
185,
032
–6,
386
#
– F
ootp
aths
–45
,413
14,0
6631
,347
434
35–
(750
)–
––
––
––
45,8
8214
,816
–31
,066
8
– B
ulk
earth
wor
ks (n
on-d
epre
ciab
le)
–58
,789
–58
,789
–93
7–
––
––
––
––
59,7
26–
–59
,726
4
– S
torm
wat
er d
rain
age
–23
6,23
773
,118
163,
119
113
171
–(1
,653
)–
––
––
––
236,
520
74,7
70–
161,
750
–
Sw
imm
ing
pool
s–
23,9
794,
091
19,8
8812
299
4–
(353
)–
––
––
––
25,0
954,
444
–20
,651
–
Oth
er o
pen
spac
e/re
crea
tiona
l ass
ets
–87
,192
41,3
8645
,806
593
2,44
1(3
31)
(2,8
53)
3,89
214
,897
––
–2,
080
–11
0,08
743
,562
–66
,525
Oth
er a
sset
s:
– L
ibra
ry b
ooks
–12
,931
10,1
922,
739
582
––
(530
)16
––
––
––
13,5
2810
,721
–2,
807
7
– O
ther
*–
5,23
34,
239
994
––
–(5
4)–
––
––
439
–5,
671
4,29
2–
1,37
9TO
TAL
INFR
AST
RU
CTU
RE,
PRO
PER
TY, P
LAN
T A
ND
EQ
UIP
.
Ren
ewal
s ar
e de
fined
as
the
repl
acem
ent o
f exis
ting
asse
ts (a
s op
pose
d to
the
acqu
isitio
n of
new
ass
ets)
.
Ref
er to
Not
e 27
. Fai
r val
ue m
easu
rem
ent f
or in
form
atio
n re
gard
ing
the
fair
valu
e of
oth
er in
frast
ruct
ure,
pro
perty
, pla
nt a
nd e
quip
men
t.
page 35
Financial Statements 2016
–17
2(5
2)1,
174,
318
as a
t 30/
6/20
16
Acc
umul
ated
Tfrs
fro
m/(t
o)
inve
stm
ent
prop
ertie
s
Oth
erm
ovem
ents
10,4
761,
612,
755
448,
913
–16
,412
(1,2
39)
(19,
186)
17,3
83(1
9,22
8)(2
3,00
8)11
8,64
1
as a
t 30/
6/20
15A
sset
mov
emen
ts d
urin
g th
e re
port
ing
perio
d
Acc
umul
ated
WIP
trans
fers
Adju
stm
ents
and
trans
fers
Addi
tions
new
ass
ets
Addi
tions
rene
wal
s
Car
ryin
g va
lue
of d
ispo
sals
Dep
reci
atio
n ex
pens
e
Rev
alua
tion
decr
emen
tsto
equ
ity
(AR
R)
Rev
alua
tion
incr
emen
tsto
equ
ity
(AR
R)
8,46
21,
508,
319
432,
359
1,08
4,42
2
FOR
THE
FINA
NCIA
L YE
AR E
NDED
30
JUNE
201
6
Note
9a
Infra
stru
ctur
e, P
rope
rty, P
lant
& E
quip
men
t
FINA
NC
IALS
KU-RING-GAI COUNCIL ANNUAL REPORT 2015 - 2016 143

Financial Statements 2016
page 36
Ku-ring-gai Council
Notes to the Financial Statementsfor the year ended 30 June 2016
Note 9b. Externally Restricted Infrastructure, Property, Plant and Equipment
Council has no externally restricted infrastructure, property, plant and equipment.
Note 9c. Infrastructure, Property, Plant and Equipment – Current YearImpairments
Council has recognised no impairment losses during the reporting period nor reversed any prior period losses.
Note 10a. Payables, Borrowings and Provisions
$ ’000
PayablesGoods and services – operating expenditureGoods and services – capital expenditurePayments received In advanceAccrued expenses:Security bonds, deposits and retentionsOther
Total payables
BorrowingsLoans – secured 1
Total borrowings
ProvisionsEmployee benefits:Annual leaveSick leaveLong service leaveGratuities
Total provisions
(i) Liabilities relating to restricted assets
There are no restricted assets (external or internal) applicable to the above liabilities except for certain employee entitlements.
1. Loans are secured over the general rating income of Council Disclosures on liability interest rate risk exposures, fair value disclosures and security can be found in Note 15.
–
–
– 1,625
10,813
2,570
22,629
1,382
1,584
6,093
673
323
24,280
–
Current
23,987
–
–
–
–
2016
4,588 4,347
1,9452,435
2015
–
Current Non-current
Actual Actual
Notes
2,621–
2,536
12,211
–
10,609
TOTAL PAYABLES, BORROWINGSAND PROVISIONS
22,344
7626,714
634
293–
1,584
–
2,53622,344
3,058
293
23,445
–
10,300285
Non-current
24,608
–
285321
–
–3,124
718
–
23,987
Note 9b Externally Restricted Infrastructure, Property, Plant & Equipment
Note 9c Infrastructure, Property, Plant & Equipment - Current Year Impairments
Note 10a Payables, Borrowings & Provisions
FOR THE FINANCIAL YEAR ENDED 30 JUNE 2016
FOR THE FINANCIAL YEAR ENDED 30 JUNE 2016
FOR THE FINANCIAL YEAR ENDED 30 JUNE 2016
Council has no Externally Restricted Infrastructure, Property, Plant & Equipment.
Council has recognised no impairment losses during the reporting period nor reversed any prior period losses.
144 DELIVERING OUR COMMUNITY'S VISION

Financial Statements 2016
page 37
Ku-ring-gai Council
Notes to the Financial Statementsfor the year ended 30 June 2016
Note 10a. Payables, Borrowings and Provisions (continued)
$ ’000
(ii) Current liabilities not anticipated to be settled within the next twelve months
The following liabilities, even though classified as current, are not expectedto be settled in the next 12 months.
Provisions – employees benefitsPayables – security bonds, deposits and retentions
Note 10b. Description of and Movements in Provisions
a. Employees leave entitlements and on-costs represents those benefits accrued and payable and an estimate of those that will become payable in the future as a result of past service.
–
–
–1,453 –
(2,448)
Closingbalance
as at 30/6/16
2,486
2015
Additional provisions
Gratuities
–
–
Annual leave –
762
10,039 9,696
6,999
2,470
(44)
Unused amounts reversed
–
2015
10,593 3,837
3233,058
Sick leave
Openingbalance
as at 1/7/15
11,098(3,332)
2,382
6,386
Class of provision Decrease due to payments
Long service leave
3,124321
TOTAL
–
–
7,210
2016
718
2(840) –
Actual2016
7,569
Actual
Remeasurement effects due to
discounting
–
Note 10b Description of and movements in ProvisionsFOR THE FINANCIAL YEAR ENDED 30 JUNE 2016
FINA
NC
IALS
Note 10a Payables, Borrowings & Provisions (continued)FOR THE FINANCIAL YEAR ENDED 30 JUNE 2016
KU-RING-GAI COUNCIL ANNUAL REPORT 2015 - 2016 145

Financial Statements 2016
page 38
Ku-ring-gai Council
Notes to the Financial Statementsfor the year ended 30 June 2016
Note 11. Statement of Cash Flows – Additional Information
$ ’000
(a) Reconciliation of cash assets
Total cash and cash equivalent assets
Balance as per the Statement of Cash Flows
(b) Reconciliation of net operating result to cash provided from operating activities
Net operating result from Income StatementAdjust for non-cash items:Depreciation and amortisationNet losses/(gains) on disposal of assetsNon-cash capital grants and contributionsAmortisation of premiums, discounts and prior period fair valuations – ‘Held to maturity’ financial assets
+/- Movement in operating assets and liabilities and other cash items:Decrease/(increase) in receivablesIncrease/(decrease) in provision for doubtful debtsDecrease/(increase) in inventoriesDecrease/(increase) in other assetsIncrease/(decrease) in payablesIncrease/(decrease) in other liabilitiesIncrease/(decrease) in employee leave entitlements
Net cash provided from operating activities from the Statement of Cash Flows
(c) Non-cash investing and financing activities
Nil
(d) Financing arrangements
Unrestricted access was available at balance date to the following lines of credit:
Bank overdraft facilities (1)
Credit cards
Total financing arrangements
1. The bank overdraft facility may be drawn at any time and may be terminated by the bank without notice. Interest rates on overdrafts are interest rates on loans and other payables are disclosed in Note 15.
2,0002,520
(41)
(9)
(3)
308
2015
(145)
2016
750
184291
405
Notes
29,265
(67)
291
99(149)
–
(126)
505
241(927)
2,620
20
19,476
22,586
(12,852)
(178)
41,970
100
2,100
Actual
100
Actual
6a
19,349
39
184
1
61,987
Note 11 Statement of Cash Flows - Additional InformationFOR THE FINANCIAL YEAR ENDED 30 JUNE 2016
146 DELIVERING OUR COMMUNITY'S VISION

Financial Statements 2016
page 39
Ku-ring-gai Council
Notes to the Financial Statementsfor the year ended 30 June 2016
Note 12. Commitments for Expenditure
$ ’000
(a) Capital commitments (exclusive of GST)
Capital expenditure committed for at the reporting date but notrecognised in the financial statements as liabilities:
Property, plant and equipmentBuildingsOther
Total commitments
These expenditures are payable as follows:Within the next year
Total payable
Sources for funding of capital commitments:Unrestricted general funds
Total sources of funding
(b) Finance lease commitments
Nil
(c) Operating lease commitments (non-cancellable)
a. Commitments under non-cancellable operating leases at the reporting date, but not recognised as liabilities are payable:
Within the next yearLater than one year and not later than 5 years
Total non-cancellable operating lease commitments
b. Non-cancellable operating leases include the following assets:
Council's current operating leases are for IT Equipment including desktop computers, laptops, printersand multi-function devices and are for a term of four years.
Conditions relating to operating leases:– All operating lease agreements are secured only against the leased asset.– No lease agreements impose any financial restrictions on Council regarding future debt etc.
5,350
2,617
Actual
1,597
2,617
5,350
5,350
1,020
297
859
490369
830
5,350
2015
2,617
4,459
Notes
2,617
533
5,350
2,617
Actual 2016
891
FOR THE FINANCIAL YEAR ENDED 30 JUNE 2016
Note 12 Commitments for Expenditure
FINA
NC
IALS
KU-RING-GAI COUNCIL ANNUAL REPORT 2015 - 2016 147

Financial Statements 2016
page 40
Ku-ring-gai Council
Notes to the Financial Statementsfor the year ended 30 June 2016
Note 13a(i). Statement of Performance Measurement – Indicators (consolidated)
$ ’000
Local government industry indicators – consolidated
1. Operating performance ratioTotal continuing operating revenue (1) excluding capitalgrants and contributions less operating expensesTotal continuing operating revenue (1) excluding capitalgrants and contributions
2. Own source operating revenue ratioTotal continuing operating revenue (1)
excluding all grants and contributionsTotal continuing operating revenue (1)
3. Unrestricted current ratioCurrent assets less all external restrictions (2)
Current liabilities less specific purpose liabilities (3, 4)
4. Debt service cover ratioOperating result (1) before capital excluding interestand depreciation/impairment/amortisationPrincipal repayments (Statement of Cash Flows)plus borrowing costs (Income Statement)
5. Rates, annual charges, interest and extra charges outstanding percentageRates, annual and extra charges outstandingRates, annual and extra charges collectible
6. Cash expense cover ratioCurrent year’s cash and cash equivalentsplus all term depositsPayments from cash flow of operating andfinancing activities
Notes
(1) Excludes fair value adjustments and reversal of revaluation decrements, net gain/(loss) on sale of assets and the net share of interests in joint ventures and associates.(2) Refer Notes 6-8 inclusive. Also excludes any real estate and land for resale not expected to be sold in the next 12 months.(3) Refer to Note 10(a).(4) Refer to Note 10(a)(ii) – excludes all payables and provisions not expected to be paid in the next 12 months (incl. ELE).
120,876
2016
0.55%7,224 5.98%
2015Prior periods
1.09x
2014
14,56937,593
84.72%
Amounts
27,6484,199
3.18%
2016
x12
1.56%
2.50x
4.82x
86.01%
2,566
8,35687,791
81,175
156,027
Indicator
112,581
8.01 mths
2.58x
72.15%
3.25%3.16%
6.08 mths
2.78x
10.51 mths
6.58x
Note 13a(i) Statement of Performance Measurement - Indicators (Consolidated)FOR THE FINANCIAL YEAR ENDED 30 JUNE 2016
148 DELIVERING OUR COMMUNITY'S VISION

Note 13a(ii) Local Government Industry Indicators - Graphs (Consolidated)FOR THE FINANCIAL YEAR ENDED 30 JUNE 2016
Financial Statements 2016
page 41
Ku-ring-gai Council
Notes to the Financial Statementsfor the year ended 30 June 2016
Note 13a(ii). Local Government Industry Indicators – Graphs (consolidated)
Benchmark: ――― Minimum >=0.00% Ratio achieves benchmarkSource for benchmark: Code of Accounting Practice and Financial Reporting #24 Ratio is outside benchmark
Benchmark: ――― Minimum >=60.00% Ratio achieves benchmarkSource for benchmark: Code of Accounting Practice and Financial Reporting #24 Ratio is outside benchmark
Benchmark: ――― Minimum >=1.50 Ratio achieves benchmarkSource for benchmark: Code of Accounting Practice and Financial Reporting #24 Ratio is outside benchmark
Commentary on 2015/16 resultPurpose of
unrestricted current ratio
Purpose of operating
performance ratio
Purpose of own source operating
revenue ratio
Council’s Own Source Operating Revenue Ratio has remained above the benchmark of ( >60%) in the last four years. Council has sufficient level of fiscal flexibility, in the
event of being faced with unforeseen events.
Commentary on 2015/16 result
2015/16 ratio 72.15%
This ratio measures Council’s
achievement of containing operating expenditure within operating revenue.
This ratio measures fiscal flexibility. It is
the degree of reliance on external funding
sources such as operating grants and
contributions.
To assess the adequacy of working capital and its ability to satisfy obligations in the short term for
the unrestricted activities of Council.
2015/16 ratio 2.58x
Commentary on 2015/16 result
Council’s Unrestricted Current Ratio is above the benchmark of >1.5x and has
been outperforming benchmark for the last four years. Council’s liquidity is good and it can readily pay its debts as they fall due.
Council's performance ratio is above the benchmark of (0%), which means that Council can easily contain operating
expenditure (excluding capital grants and contributions) within its operating revenue. The ratio has been above benchmark for
the last four years. The increase from previous year is mainly due to higher operating revenue from user fees and
charges.
2015/16 ratio 5.98%5.84%
1.56%
0.55%
5.98%
0%
1%
2%
3%
4%
5%
6%
7%
2013 2014 2015 2016
Rat
io %
1. Operating performance ratio
84.22% 84.72% 86.01%
72.15%
0%
10%
20%
30%
40%
50%
60%
70%
80%
90%
100%
2013 2014 2015 2016
Rat
io %
2. Own source operating revenue ratio
2.04
2.782.50
2.58
0.0
0.5
1.0
1.5
2.0
2.5
3.0
3.5
2013 2014 2015 2016
Rat
io (
x)
3. Unrestricted current ratio
FINA
NC
IALS
KU-RING-GAI COUNCIL ANNUAL REPORT 2015 - 2016 149

Financial Statements 2016
page 42
Ku-ring-gai Council
Notes to the Financial Statementsfor the year ended 30 June 2016
Note 13a(ii). Local Government Industry Indicators – Graphs (consolidated)
Benchmark: ――― Minimum >=2.00 Ratio achieves benchmarkSource for benchmark: Code of Accounting Practice and Financial Reporting #24 Ratio is outside benchmark
Benchmark: ――― Maximum <5.00% Ratio is within BenchmarkSource for Benchmark: Code of Accounting Practice and Financial Reporting #24 Ratio is outside Benchmark
Benchmark: ――― Minimum >=3.00 Ratio achieves benchmarkSource for benchmark: Code of Accounting Practice and Financial Reporting #24 Ratio is outside benchmark
This ratio measures the availability of operating cash to
service debt including interest, principal and
lease payments
The Debt Service Cover Ratio has increased from previous year and is above
the benchmark of 2x, mainly due to decreased principal and interest
repayments during the financial year compared to the year before.
Purpose of cash expense cover ratio
Purpose of rates and annual charges
outstanding ratio
Commentary on 2015/16 result
To assess the impact of uncollected rates and annual charges on Council’s liquidity and the adequacy of
recovery efforts.
Commentary on 2015/16 result
Purpose of debt service cover ratio
This liquidity ratio indicates the number of months a Council can continue paying
for its immediate expenses without
additional cash inflow.
2015/16 ratio 3.16%
2015/16 ratio 6.58x
2015/16 ratio 10.51 mths
Commentary on 2015/16 result
Council’s Cash Expense Cover Ratio is satisfactory and above benchmark of “greater than 3 months”. The ratio has increased compared to the year before largely due to a higher proportion of the investment portfolio invested in shorter
term deposits.
The percentage of rates and annual charges that are unpaid at the end of the financial year is a measure of how well
Council is managing debt recovery. Council’s ratio of 3.16% is satisfactory and is better than the benchmark of “less than
5%”.
10.88
4.82
6.58
1.09
0
2
4
6
8
10
12
2013 2014 2015 2016
Rat
io (
x)
4. Debt service cover ratio
3.47% 3.25% 3.18% 3.16%
0%
1%
2%
3%
4%
5%
6%
2013 2014 2015 2016
Rat
io %
5. Rates, annual charges, interest and extra charges outstanding percentage
7.68 8.01
6.08
10.51
0
2
4
6
8
10
12
2013 2014 2015 2016
Rat
io (
mth
s)
6. Cash expense cover ratio
FOR THE FINANCIAL YEAR ENDED 30 JUNE 2016
Note 13a(ii). Local Government Industry Indicators - Graphs (Consolidated)
150 DELIVERING OUR COMMUNITY'S VISION

Financial Statements 2016
page 43
Ku-ring-gai Council
Notes to the Financial Statementsfor the year ended 30 June 2016
Note 14. Investment Properties
$ ’000
(a) Investment properties at fair value
Investment properties on hand
CLOSING BALANCE – INVESTMENT PROPERTIES
(b) Leasing arrangements
Details of leased investment properties are as follows;
Future minimum lease payments receivable under non-cancellableinvestment property operating leases not recognised in thefinancial statements are receivable as follows:Within 1 yearLater than 1 year but less than 5 yearsLater than 5 years
Total minimum lease payments receivable
(c) Investment property income and expenditure – summary
Rental income from investment properties:– Other incomeDirect operating expenses on investment properties:– that generated rental income
Net revenue contribution from investment properties
plus:Fair value movement for year
Total income attributable to investment properties
Refer to Note 27. Fair value measurement for information regarding the fair value of investment properties held.
2015
19,056
Notes
2,218
343
1,903
–
(763)
–
–
343
–
–
–
–
–
–
315
1,106
19,056 –
–
Actual Actual
–
–
2016
FOR THE FINANCIAL YEAR ENDED 30 JUNE 2016
Note 14 Investment Properties
FINA
NC
IALS
KU-RING-GAI COUNCIL ANNUAL REPORT 2015 - 2016 151

Financial Statements 2016
page 44
Ku-ring-gai Council
Notes to the Financial Statementsfor the year ended 30 June 2016
Note 15. Financial Risk Management
$ ’000
Risk management
Council’s activities expose it to a variety of financial risks including (1) price risk, (2) credit risk, (3) liquidity riskand (4) interest rate risk.
The Council’s overall risk management program focuses on the unpredictability of financial markets and seeksto minimise potential adverse effects on the financial performance of the Council.
Council does not engage in transactions expressed in foreign currencies and is therefore not subject to foreigncurrency risk.
A comparison by category of the carrying amounts and fair values of Council’s financial assets and financialliabilities recognised in the financial statements is presented below.
Financial assetsCash and cash equivalentsInvestments – ‘Held to maturity’Receivables
Total financial assets
Financial liabilitiesPayablesLoans/advances
Total financial liabilities
Fair value is determined as follows:
– Cash and cash equivalents, receivables, payables – are estimated to be the carrying value that approximates market value.
– Borrowings and held-to-maturity investments – are based upon estimated future cash flows discounted by the current market interest rates applicable to assets and liabilities with similar risk profiles, unless quoted market prices are available.– Payables – excludes payments received in advance
Refer to Note 27. Fair value measurement for information regarding the fair value of financial assets and liabilities.
184
97,129
2016
8,175 8,231
105,515
8,98410,26623,928
134,033 105,544
8,833
34,19434,194
291 184
97,100
26,523
2015Fair value
2015Carrying value
134,232
125,567 125,567
10,266
8,3748,231
23,928
291
26,523
35,507 35,356
2016
FOR THE FINANCIAL YEAR ENDED 30 JUNE 2016
Note 15 Financial Risk Management
152 DELIVERING OUR COMMUNITY'S VISION

Financial Statements 2016
page 45
Ku-ring-gai Council
Notes to the Financial Statementsfor the year ended 30 June 2016
Note 15. Financial Risk Management (continued)
$ ’000
(a) Cash & Cash Equivalents & "Held-to-maturity" Investments
Council’s objective is to maximise its return on cash and investments whilst maintaining an adequate level ofliquidity and preserving capital.
Council’s finance area manages the cash and Investments portfolio with the assistance of independent advisors.
Council has an investment policy which complies with the Local Government Act 1993 and Minister’sinvestment order. This policy is regularly reviewed by Council and it’s staff and an investment report is tabledbefore Council on a monthly basis setting out the portfolio breakup and its performance.
The risks associated with the investments held are:
– Price risk – the risk that the capital value of Investments may fluctuate due to changes in market prices,whether there changes are caused by factors specific to individual financial instruments or their issuersor are caused by factors affecting similar instruments traded in a market.
– Interest rate risk – the risk that movements in interest rates could affect returns and income.
– Credit risk – the risk that the investment counterparty will not complete their obligations particular to afinancial instrument, resulting in a financial loss to Council – be it of a capital or income nature.
Council manages these risks (amongst other measures) by diversifying its portfolio and only purchasinginvestments with high credit ratings or capital guarantees.
Council also seeks advice from independent advisers before placing any funds in cash equivalents andinvestments.
The following represents a summary of the sensitivity of Council’s Income Statement and accumulated surplus(for the reporting period) due to a change in either the price of a financial asset or the interest rates applicable.
It is assumed that the change in interest rates would have been constant throughout the reporting period.
2016Possible impact of a 10% movement in market valuesPossible impact of a 1% movement in interest rates
2015Possible impact of a 10% movement in market valuesPossible impact of a 1% movement in interest rates
(1,383)
(108)
138
Equity
108
Equity
1,080 (1,080)
Profit
138
(108)1,080
Decrease of values/rates
(138)(1,383)
Profit
(1,080)
Increase of values/rates
108
1,383 1,383(138)
FINA
NC
IALS
FOR THE FINANCIAL YEAR ENDED 30 JUNE 2016
Note 15 Financial Risk Management (continued)
KU-RING-GAI COUNCIL ANNUAL REPORT 2015 - 2016 153

Financial Statements 2016
page 46
Ku-ring-gai Council
Notes to the Financial Statementsfor the year ended 30 June 2016
Note 15. Financial Risk Management (continued)
$ ’000
(b) Credit risk
Council’s major receivables comprise (i) rates and annual charges and (ii) user charges and fees.
The major risk associated with these receivables is credit risk – the risk that debts due and payable to Councilmay not be repaid in full.
Council manages this risk by monitoring outstanding debt and employing stringent debt recovery procedures.It also encourages ratepayers to pay their rates by the due date through incentives.
Credit risk on rates and annual charges is minimised by the ability of Council to secure a charge over the landrelating to the debts – that is, the land can be sold to recover the debt. Council is also able to charge intereston overdue rates and annual charges at higher than market rates which further encourages the payment of debt.
A profile of Council’s receivables credit risk at balance date follows:
(i) Ageing of receivables – %
Current (not yet overdue)Overdue
(ii) Ageing of receivables – valueRates and annual charges Other receivables
Current Current< 1 year overdue 0 – 30 days overdue1 – 2 years overdue 30 – 60 days overdue2 – 5 years overdue 60 – 90 days overdue
(iii) Movement in provision for impairment of receivables
Balance at the beginning of the year+ new provisions recognised during the year– amounts already provided for and written off this year
Balance at the end of the year
receivables
0%
annual
100%
annual Other
Rates and
receivables
100%
Other
– 1,147
2016
5,064
84%
Rates and annual
charges charges
329 162
100%
2,272
–
2016
(104)
107
6,0632,2722,309
678
203
2015
203
––
4,469
Rates and
charges
2,309
6,069
104
–
2016 2015
124
74%26%
2015
100%
receivables charges
0%
–
Rates and
16%
Other
100%
receivables
annual Other
100%
159
104
–
(3)
FOR THE FINANCIAL YEAR ENDED 30 JUNE 2016
Note 15 Financial Risk Management (continued)
154 DELIVERING OUR COMMUNITY'S VISION

Financial Statements 2016
page 47
Ku-ring-gai Council
Notes to the Financial Statementsfor the year ended 30 June 2016
Note 15. Financial Risk Management (continued)
$ ’000
(c) Liquidity risk
Payables and borrowings are both subject to liquidity risk – the risk that insufficient funds may be on hand tomeet payment obligations as and when they fall due.
Council manages this risk by monitoring its cash flow requirements and liquidity levels and maintaining anadequate cash buffer.
Payment terms can (in extenuating circumstances) also be extended and overdraft facilities utilised as required.
The contractual undiscounted cash outflows (ie. principal and interest) of Council’s payables and borrowingsare set out in the maturity table below:
$ ’000
Trade/other payablesLoans and advances
Total financial liabilities
Trade/other payablesLoans and advances
Total financial liabilities
Borrowings are also subject to interest rate risk – the risk that movements in interest rates could adverselyaffect funding costs and debt servicing requirements. Council manages this risk through the diversification ofborrowing types, maturities and interest rate structures.
The following interest rates were applicableto Council’s borrowings at balance date:
Trade/other payablesLoans and advances – fixed interest rateLoans and advances – variable interest rate
> 5 Yrs2-3 Yrs
ActualTotal
2,621
≤ 1 Year valuescash
10,266
23,928764
404
–
19,743 1,388
carryingto no3-4 Yrs
Subject
1,802
1-2 Yrs
2,621
– 2,824
6,363
maturity 4-5 Yrs
– 7,6962,570
–
1,497
2,570 1,177
1,177
26,523–
–
741 24,574
9,498
–
2015
2016
404
outflows
34,19434,840
10,266
payable in:
708
1,388
6.00%
value
2015
–
35,507
3.60%
1,153
–
19,686
–
–
34,194
22,7755.13% 1,804
19,686
8,98427,278
8,984
35,507
Average
741
Carrying
708
0.00%
1,497
Carrying
1,118
36,262
8,984
24,719
–
value interest rate
2016
10,266
19,743 1,118
Average
9,187
764
interest rate
5.00%
3.90%
FINA
NC
IALS
FOR THE FINANCIAL YEAR ENDED 30 JUNE 2016
Note 15 Financial Risk Management (continued)
KU-RING-GAI COUNCIL ANNUAL REPORT 2015 - 2016 155
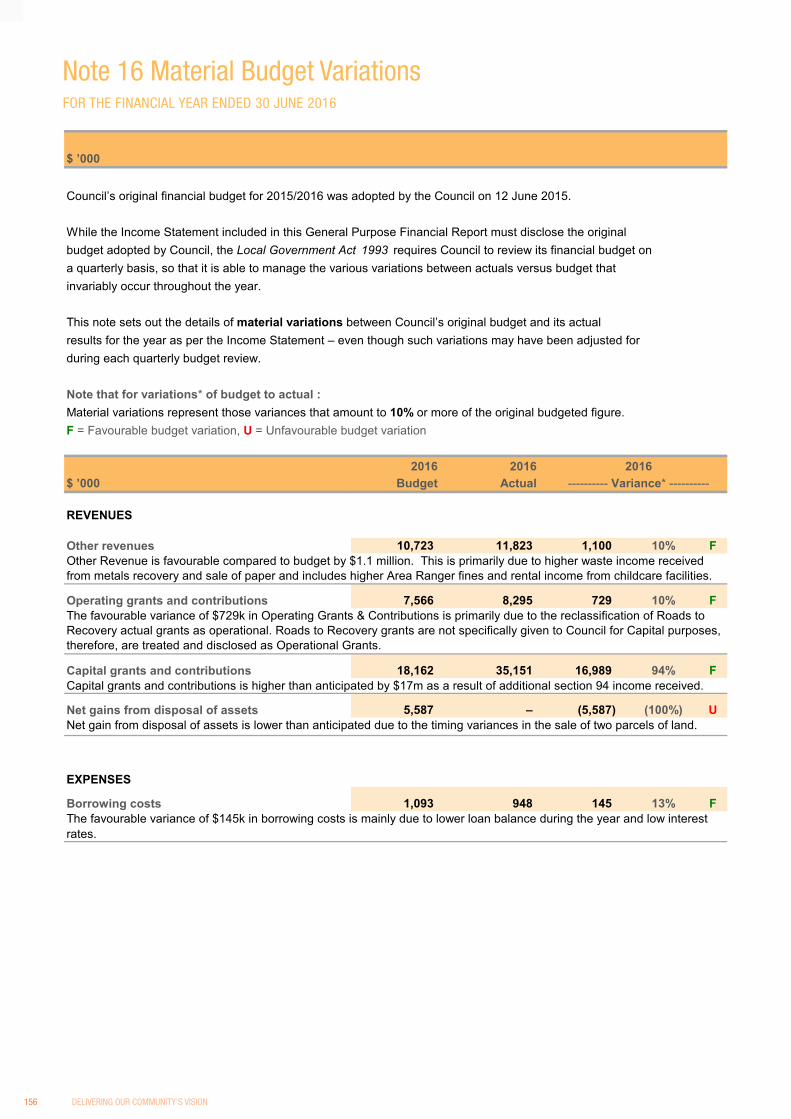
Financial Statements 2016
page 48
Ku-ring-gai Council
Notes to the Financial Statementsfor the year ended 30 June 2016
Note 16. Material Budget Variations
$ ’000
Council’s original financial budget for 2015/2016 was adopted by the Council on 12 June 2015.
While the Income Statement included in this General Purpose Financial Report must disclose the originalbudget adopted by Council, the Local Government Act 1993 requires Council to review its financial budget ona quarterly basis, so that it is able to manage the various variations between actuals versus budget thatinvariably occur throughout the year.
This note sets out the details of material variations between Council’s original budget and its actualresults for the year as per the Income Statement – even though such variations may have been adjusted forduring each quarterly budget review.
Note that for variations* of budget to actual :Material variations represent those variances that amount to 10% or more of the original budgeted figure.F = Favourable budget variation, U = Unfavourable budget variation
$ ’000
REVENUES
Other revenues
Operating grants and contributions
Capital grants and contributions
Net gains from disposal of assets
EXPENSES
Borrowing costs
Other Revenue is favourable compared to budget by $1.1 million. This is primarily due to higher waste income received from metals recovery and sale of paper and includes higher Area Ranger fines and rental income from childcare facilities.
Budget
10,723 11,823
16,989
2016---------- Variance* ----------Actual
20162016
145 F948
1,100
10%
F
(5,587) (100%)
10%
1,093
F
729
13%
35,151
8,295
–
94%Capital grants and contributions is higher than anticipated by $17m as a result of additional section 94 income received.
The favourable variance of $729k in Operating Grants & Contributions is primarily due to the reclassification of Roads to Recovery actual grants as operational. Roads to Recovery grants are not specifically given to Council for Capital purposes, therefore, are treated and disclosed as Operational Grants.
Net gain from disposal of assets is lower than anticipated due to the timing variances in the sale of two parcels of land.
The favourable variance of $145k in borrowing costs is mainly due to lower loan balance during the year and low interestrates.
18,162
5,587
7,566
U
F
Note 16 Material Budget VariationsFOR THE FINANCIAL YEAR ENDED 30 JUNE 2016
156 DELIVERING OUR COMMUNITY'S VISION

Ku-
ring-
gai C
ounc
il
Not
es to
the
Fina
ncia
l Sta
tem
ents
for t
he y
ear e
nded
30
June
201
6
Not
e 17
. Sta
tem
ent o
f Dev
elop
er C
ontri
butio
ns
$ ’0
00
Cou
ncil
reco
vers
con
tribu
tions
, rai
ses
levi
es a
nd e
nter
s in
to p
lann
ing
agre
emen
ts o
n de
velo
pmen
t wor
ks th
at a
re s
ubje
ct to
a d
evel
opm
ent c
onse
nt is
sued
by
Cou
ncil.
All
cont
ribut
ions
mus
t be
spen
t/util
ised
for t
he s
peci
fic p
urpo
se th
ey w
ere
levi
ed a
nd a
ny in
tere
st a
pplic
able
to u
nspe
nt fu
nds
mus
t be
attri
bute
d to
rem
aini
ng fu
nds.
The
follo
win
g ta
bles
det
ail t
he re
ceip
t, in
tere
st a
nd u
se o
f the
abo
ve c
ontri
butio
ns a
nd le
vies
and
the
valu
e of
all
rem
aini
ng fu
nds
whi
ch a
re ‘r
estri
cted
’ in
thei
r fut
ure
use.
SUM
MA
RY
OF
CO
NTR
IBU
TIO
NS
AN
D L
EVIE
S
Roa
dsTr
affic
faci
litie
sP
arki
ngO
pen
spac
eC
omm
unity
faci
litie
sO
ther
page 49
Financial Statements 2016
41 34–
(95)
Tota
l S94
reve
nue
unde
r pla
ns
–
33,3
69
–33
,403
Hel
d as 20
,822 86
4
–7,
570
–
Inte
rnal
31(9
,614
)1,
966
Expe
nditu
rebo
rrow
ing
–
rest
ricte
d(to
)/fro
mdu
ring (1,4
92)
(5,7
50)
–
(12,
802)
2,76
1
–
2,76
1
88,4
75
88,5
09
–
88,5
09
– –
(1,3
48)
asse
t
–
in y
ear
64,9
28
–
(250
)
6,18
2
Cas
h
65,1
47
–23
9
65,1
47
(12,
802)
3
(6,7
85)
–13
0
earn
ed
836
Con
trib
utio
nsre
ceiv
ed d
urin
g th
e ye
arIn
tere
st
(3)
year
Non
-cas
h
3
–
–
2,76
165
,147
Tota
l con
trib
utio
ns
S94
cont
ribut
ions
– u
nder
a p
lan
PUR
POSE
Ope
ning
bala
nce
–
––
53,8
8218
,694
2,49
7
10,9
0252
2–
– –
2,52
79,
648
– –
34S9
4A le
vies
– u
nder
a p
lan
(12,
802)
33,4
03
–– – – – – – – – –
Cum
ulat
ive
inte
rnal
bo
rrow
ings
du
e/(p
ayab
le)
FOR
THE
FINA
NCIA
L YE
AR E
NDED
30
JUNE
201
6
Note
17
Stat
emen
t of D
evel
oper
Con
tribu
tions
FINA
NC
IALS
KU-RING-GAI COUNCIL ANNUAL REPORT 2015 - 2016 157

Ku-
ring-
gai C
ounc
il
Not
es to
the
Fina
ncia
l Sta
tem
ents
for t
he y
ear e
nded
30
June
201
6
Not
e 17
. Sta
tem
ent o
f Dev
elop
er C
ontri
butio
ns (c
ontin
ued)
$ ’0
00
S94
CO
NTR
IBU
TIO
NS
– U
ND
ER A
PLA
NC
ON
TRIB
UTI
ON
PLA
N -
1993
Pla
n
Par
king
Com
mun
ity fa
cilit
ies
CO
NTR
IBU
TIO
N P
LAN
- 20
00 to
200
3 R
esid
entia
l Pla
n
Ope
n sp
ace
Com
mun
ity fa
cilit
ies
CO
NTR
IBU
TIO
N P
LAN
- 2
004/
2009
Res
iden
tial P
lan
Ope
n sp
ace
Com
mun
ity fa
cilit
ies
Oth
er
page 50
Financial Statements 2016
durin
gye
ar
–
1,09
0
–
asse
tre
stric
ted
Inte
rnal
864
Hel
d as
– –
borr
owin
g
–
Con
trib
utio
ns
3,26
2
–
1,44
3
rest
ricte
d
Hel
d as
asse
t
Hel
d as
–
–51 75
durin
g
(22)(4
)
rest
ricte
dIn
tern
al
(to)/f
rom
bala
nce
–66
4
asse
tea
rned
39
–in
yea
r
–
Cas
h
Expe
nditu
re
1,41
4
2,05
4
640
bala
nce
year
––83
6
Inte
rest
219
31
Ope
ning
earn
ed
–
PUR
POSE
–
Non
-cas
hC
ash
Expe
nditu
re
Tota
l
8
Cas
hCon
trib
utio
nsre
ceiv
ed d
urin
g th
e ye
ar
–
–
1,05
5
Ope
ning
–
Tota
l
PUR
POSE
26 17–24
Inte
rest
132
rece
ived
dur
ing
the
year
–
4,81
5
33,
130
115
(94)–
44114
0
226
year
durin
g
(1)
Inte
rest
in y
ear
–(3
)
borr
owin
gEx
pend
iture
(2,5
74)
(2,4
80)
(22)
–
Non
-cas
hin
yea
r 250
Tota
l8,
085
50–
2,49
3– –
(to)/f
rom
–
Ope
ning
rece
ived
dur
ing
the
year
Non
-cas
h
Inte
rnal
borr
owin
g
2,10
7
–
5,80
5
(to)/f
rom
earn
edPU
RPO
SEC
ontr
ibut
ions
bala
nce
– – – – – –– – – –
Cum
ulat
ive
inte
rnal
bo
rrow
ings
du
e/(p
ayab
le)
Cum
ulat
ive
inte
rnal
bo
rrow
ings
du
e/(p
ayab
le)
Cum
ulat
ive
inte
rnal
bo
rrow
ings
du
e/(p
ayab
le)
Note 15 Cont'
FOR
THE
FINA
NCIA
L YE
AR E
NDED
30
JUNE
201
6
Note
17
Stat
emen
t of D
evel
oper
Con
tribu
tions
(con
tinue
d)
158 DELIVERING OUR COMMUNITY'S VISION

Ku-
ring-
gai C
ounc
il
Not
es to
the
Fina
ncia
l Sta
tem
ents
for t
he y
ear e
nded
30
June
201
6
Not
e 17
. Sta
tem
ent o
f Dev
elop
er C
ontri
butio
ns (c
ontin
ued)
$ ’0
00
S94
CO
NTR
IBU
TIO
NS
– U
ND
ER A
PLA
NC
ON
TRIB
UTI
ON
PLA
N -
2010
Pla
n
Roa
dsTr
affic
faci
litie
sO
pen
spac
eC
omm
unity
faci
litie
sO
ther
CO
NTR
IBU
TIO
N P
LAN
- K
u-rin
g-ga
i SE
PP
5 P
lan
Ope
n sp
ace
S94A
LEV
IES
– U
ND
ER A
PLA
NC
ON
TRIB
UTI
ON
PLA
N N
UM
BE
R -
Sec
tion
94 A
levi
es
Ope
n sp
ace
page 51
Financial Statements 2016
Non
-cas
h
522
–
33,3
25
2,48
0
9,64
8
–
10,9
02
earn
edN
on-c
ash
rece
ived
dur
ing
the
year
–
rece
ived
dur
ing
the
year
––
(1)
durin
g (1,4
92)
340
Tota
l
3434(to
)/fro
mbo
rrow
ing
rest
ricte
dH
eld
as
asse
tdu
ring
earn
edIn
tern
alEx
pend
iture
Inte
rnal
–
durin
gbo
rrow
ing
(250
)
Inte
rest
Con
trib
utio
ns
year(7
,112
)
2,38
5
–
–
earn
ed
12
–
in y
ear
in y
ear
12
year
Cas
h
92
–
(1,3
47)
–
Cas
h
– – –
Inte
rest1,
771
––
Inte
rnal
Expe
nditu
re
352
Expe
nditu
re
(to)/f
rom
(10,
202)
Tota
l
bala
nce
Ope
ning
(10)
–
Ope
ning
47,3
132,
193
2,52
7
PUR
POSE
PUR
POSE
340
(6,7
85)
–
bala
nce
53,6
13
18,6
68
Con
trib
utio
ns
2–
79,1
21
Hel
d as
(9)
352
–
asse
tre
stric
ted
3,41
8
borr
owin
g(to
)/fro
m
Hel
d as
asse
tre
stric
ted
(5,7
50)
–
60,6
4020
,822
rece
ived
dur
ing
the
year
34
Ope
ning
Tota
l
bala
nce
PUR
POSE
Non
-cas
h–
year
in y
ear
Con
trib
utio
ns
Cas
h
Inte
rest
–
34–
–
––
–––
–
– –– – – – – – – –
Cum
ulat
ive
inte
rnal
bo
rrow
ings
du
e/(p
ayab
le)
Cum
ulat
ive
inte
rnal
bo
rrow
ings
du
e/(p
ayab
le)
Cum
ulat
ive
inte
rnal
bo
rrow
ings
du
e/(p
ayab
le)
FINA
NC
IALS
FOR
THE
FINA
NCIA
L YE
AR E
NDED
30
JUNE
201
6
Note
17
Stat
emen
t of D
evel
oper
Con
tribu
tions
(con
tinue
d)
KU-RING-GAI COUNCIL ANNUAL REPORT 2015 - 2016 159
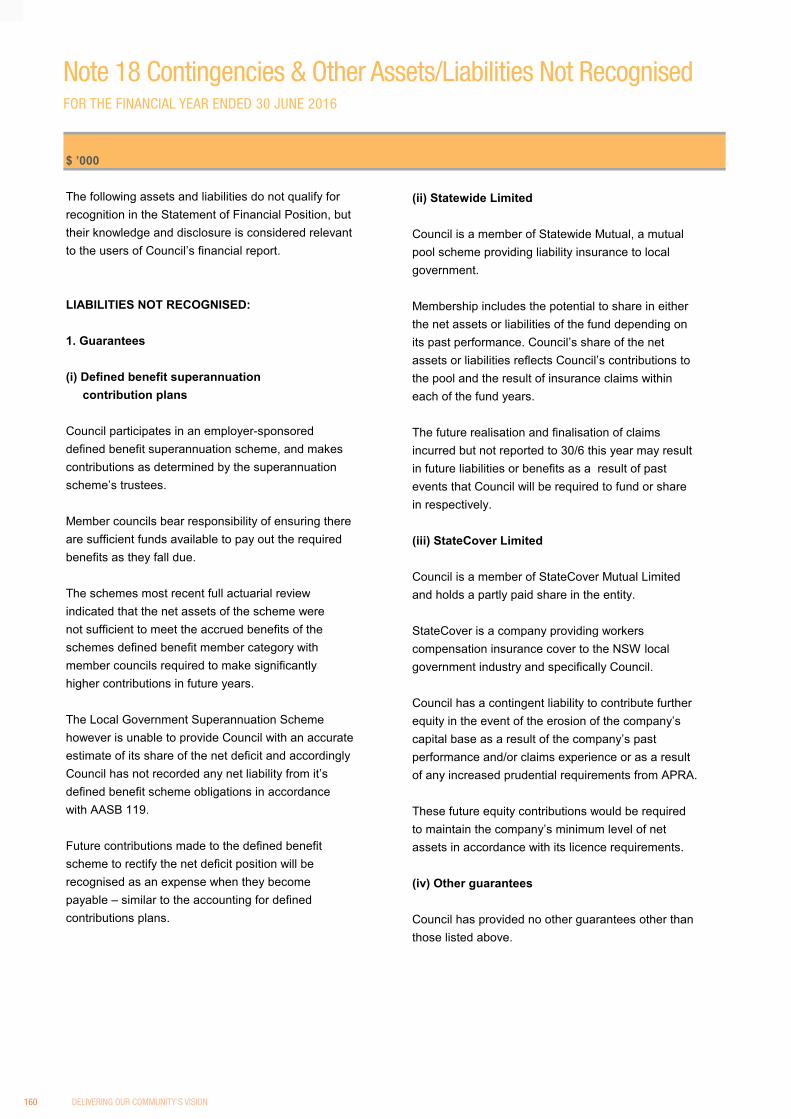
Financial Statements 2016
page 52
Ku-ring-gai Council
Notes to the Financial Statementsfor the year ended 30 June 2016
Note 18. Contingencies and Other Assets/Liabilities Not Recognised
$ ’000
The following assets and liabilities do not qualify for (ii) Statewide Limitedrecognition in the Statement of Financial Position, buttheir knowledge and disclosure is considered relevant Council is a member of Statewide Mutual, a mutualto the users of Council’s financial report. pool scheme providing liability insurance to local
government.
LIABILITIES NOT RECOGNISED: Membership includes the potential to share in eitherthe net assets or liabilities of the fund depending on
1. Guarantees its past performance. Council’s share of the netassets or liabilities reflects Council’s contributions to
(i) Defined benefit superannuation the pool and the result of insurance claims within contribution plans each of the fund years.
Council participates in an employer-sponsored The future realisation and finalisation of claimsdefined benefit superannuation scheme, and makes incurred but not reported to 30/6 this year may resultcontributions as determined by the superannuation in future liabilities or benefits as a result of pastscheme’s trustees. events that Council will be required to fund or share
in respectively.Member councils bear responsibility of ensuring thereare sufficient funds available to pay out the required (iii) StateCover Limitedbenefits as they fall due.
Council is a member of StateCover Mutual LimitedThe schemes most recent full actuarial review and holds a partly paid share in the entity.indicated that the net assets of the scheme werenot sufficient to meet the accrued benefits of the StateCover is a company providing workersschemes defined benefit member category with compensation insurance cover to the NSW localmember councils required to make significantly government industry and specifically Council.higher contributions in future years.
Council has a contingent liability to contribute furtherThe Local Government Superannuation Scheme equity in the event of the erosion of the company’showever is unable to provide Council with an accurate capital base as a result of the company’s pastestimate of its share of the net deficit and accordingly performance and/or claims experience or as a resultCouncil has not recorded any net liability from it’s of any increased prudential requirements from APRA.defined benefit scheme obligations in accordancewith AASB 119. These future equity contributions would be required
to maintain the company’s minimum level of netFuture contributions made to the defined benefit assets in accordance with its licence requirements.scheme to rectify the net deficit position will berecognised as an expense when they become (iv) Other guaranteespayable – similar to the accounting for definedcontributions plans. Council has provided no other guarantees other than
those listed above.
Note 18 Contingencies & Other Assets/Liabilities Not RecognisedFOR THE FINANCIAL YEAR ENDED 30 JUNE 2016
160 DELIVERING OUR COMMUNITY'S VISION

Financial Statements 2016
page 53
Ku-ring-gai Council
Notes to the Financial Statementsfor the year ended 30 June 2016
Note 18. Contingencies and Other Assets/Liabilities Not Recognised (continued)
$ ’000
LIABILITIES NOT RECOGNISED (continued): At reporting date, reliable estimates as to the valueof any potential liability (and subsequent land asset)
2. Other liabilities from such potential acquisitions has not beenpossible.
(i) Third party claims
The Council is involved from time to time in various ASSETS NOT RECOGNISED:claims incidental to the ordinary course of businessincluding claims for damages relating to its services. (i) Land under roads
Council believes that it is appropriately covered As permitted under AASB 1051, Council has electedfor all claims through its insurance coverage and not to bring to account land under roads that itdoes not expect any material liabilities to eventuate. owned or controlled up to and including 30/6/08.
(ii) S94 plans (ii) Infringement notices/fines
Council levies Section 94 contributions upon Fines and penalty income, the result of Council various development across the Council area through issuing infringement notices is followed up and the required contributions plans. collected by the Infringement Processing Bureau.
As part of these plans, Council has received funds Council’s revenue recognition policy for suchfor which it will be required to expend the monies in income is to account for it as revenue on receipt.accordance with those plans.
Accordingly, at year end, there is a potential assetAs well, these plans indicate proposed future due to Council representing issued but unpaidexpenditure to be undertaken by Council, which will infringement notices. be funded by making levies and receipting funds infuture years or where a shortfall exists by the use of Due to the limited information available on the status,Council’s general funds. value and duration of outstanding notices, Council is
unable to determine the value of outstanding income.These future expenses do not yet qualify as liabilitiesas of the reporting date, but represent Council’sintention to spend funds in the manner and timingset out in those plans.
(iii) Potential land acquisitions due to planning
Council has zoned a number of privately owned landparcels as RE1Local Open Space or SP2 Local Road.
As a result, where notified in writing by the variousowners, Council will be required to purchase theseland parcels.
Note 18 Contingencies & Other Assets/Liabilities Not Recognised (continued)FOR THE FINANCIAL YEAR ENDED 30 JUNE 2016
FINA
NC
IALS
KU-RING-GAI COUNCIL ANNUAL REPORT 2015 - 2016 161

Financial Statements 2016
page 54
Ku-ring-gai Council
Notes to the Financial Statementsfor the year ended 30 June 2016
Note 19. Interests in Other Entities
$ ’000
Council’s objectives can and in some cases are best met through the use of separate entities and operations.
These operations and entities range from 100% ownership and control through to lower levels of ownershipand control via co-operative arrangements with other councils, bodies and other outside organisations.
The accounting and reporting for these various entities, operations and arrangements varies in accordancewith accounting standards, depending on the level of council’s (i) interest and (ii) control and the type (form) ofentity/operation, as follows;
Controlled entities (subsidiaries) Note 19(a)Operational arrangements where Council’s control (but not necessarily interest) exceeds 50%.
Joint ventures and associates Note 19(b)Joint ventures are operational arrangements where the parties that have joint control haverights to the net assets of the arrangement.Associates are separate entities where Council has significant influence over the operations(but neither controls nor jointly controls them).
Joint operations Note 19(c)Operational arrangements where the parties that have joint control have rights to specificassets and obligations for specific liabilities relating to the arrangement rather than a rightto the net assets of the arrangement.
Unconsolidated structured entities Note 19(d)Unconsolidated structured entities represent “special vehicles” that Council has an interestin but which are not controlled by Council and therefore not consolidated as a subsidiary,joint arrangement or associate. Attributes of structured entities include restricted activities,a narrow and well-defined objective and insufficient equity to finance its activities withoutfinancial support.
Note 19 Interests in Other EntitiesFOR THE FINANCIAL YEAR ENDED 30 JUNE 2016
162 DELIVERING OUR COMMUNITY'S VISION

Financial Statements 2016
page 55
Ku-ring-gai Council
Notes to the Financial Statementsfor the year ended 30 June 2016
Note 19. Interests in Other Entities (continued)
$ ’000
(a) Controlled entities (subsidiaries) – being entities and operations controlled by Council
Council has no interest in any controlled entities (subsidiaries).
(b) Joint ventures and associates
Council has no interest in any joint ventures or associates.
(c) Joint operations
(I) Council was involved in the following joint operations (JO’s)
Name of joint operation Principal activity
B2 Land Subdivision Joint Operation with the Office of Strategic Lands, NSW Environmentand Planning, the joint development and sale of 26 lots housingsubdivision.
(ii) Council assets employed in the joint operations
Council’s own assets employed in the operations Current assets:
Other assets Total assets – Council owned
Council’s share of assets jointly owned with other partners Current assets Current liabilities
Total net assets employed – Council and jointly owned
(d) Unconsolidated structured entities
Council has no unconsolidated structured entities
(12)–
1,040
–
2016
1,040–
votingbusiness 2016 2015 2016 2015
South 0% 54% 0% 50%
Interest in Interest inPlace of ownership
–
16
Turramurra
2015
–
1,044
Note 19 Interests in Other Entities (continued)FOR THE FINANCIAL YEAR ENDED 30 JUNE 2016
FINA
NC
IALS
KU-RING-GAI COUNCIL ANNUAL REPORT 2015 - 2016 163

Financial Statements 2016
page 56
Ku-ring-gai Council
Notes to the Financial Statementsfor the year ended 30 June 2016
Note 20. Retained Earnings, Revaluation Reserves, Changes in Accounting Policies, Changes in Accounting Estimates and Errors
$ ’000
(a) Retained earnings
Movements in retained earnings were as follows:Balance at beginning of year (from previous years audited accounts)a. Correction of prior period errorsb Net operating result for the year
Balance at end of the reporting period
(b) Revaluation reserves
(i) Reserves are represented by:
– Infrastructure, property, plant and equipment revaluation reserve
Total
(ii) Reconciliation of movements in reserves:
Infrastructure, property, plant and equipment revaluation reserve– Opening balance– Revaluations for the year (Community Land & Artworks)
Balance at end of year
Total value of reserves
(iii) Nature and purpose of reserves
Infrastructure, property, plant and equipment revaluation reserve– The infrastructure, property, plant and equipment revaluation
reserve is used to record increments/decrements of non-currentasset values due to their revaluation.
411,081506,714
411,081
506,714
411,081
734,344
411,081
704,772
22,586
2015
317,48895,633
776,315
9(a)
–
93,593
Actual
41,970
Notes 2016
20 (c) 6,986
506,714
411,081
734,344
Actual
506,714
Note 20 Equity - Retained Earnings and Revaluation ReservesFOR THE FINANCIAL YEAR ENDED 30 JUNE 2016
164 DELIVERING OUR COMMUNITY'S VISION

Financial Statements 2016
page 57
Ku-ring-gai Council
Notes to the Financial Statementsfor the year ended 30 June 2016
Note 20. Retained Earnings, Revaluation Reserves, Changes in Accounting Policies, Changes in Accounting Estimates and Errors (continued)
$ ’000
(c) Correction of error/s relating to a previous reporting period
Correction of errors disclosed in this year’s financial statements:
Adjustment to Retained Earnings and Assets RegisterAs part of the revaluation of Community Land and Art Works Council undertook a detailed review of assets classified as CommunityLand and Art Works. As a result, an adjustment has been made to Retained Earnings to recognise assets not previously recordedin the Assets Register .
The following adjustment has been made to Retained Earnings:- Community Land Assets- Art Works Assets- Retained Earnings
Correction of errors as disclosed in last year’s financial statements:During 2013/14 Council received reimbursement of expensesfrom the NSW Department of Planning for works undertaken as part of the Joint Operation for B2 land subdivision. This reimbursement was treated as contribution and accounted for as income in the Income Statement, rather than offset against expenditure. As a result, Council’s held for sale assets relating to B2 were overstated due to projects gross expenditure being capitalised.
To correct this error, the following balances have been reinstated:
- Assets held for sale- Retained Earnings
Minor adjustment to Council's Assets Register As part of an Assets review performed last year, an immaterial discrepancy was identified between the Financial Assets Register and the General ledger which was carried forward from previous financial years. This discrepancy was rectified to Retained Earnings at the end of financial year.
This adjustment resulted in a net increase/(decrease) in Council’saccumulated surplus as at 30/6/14.
In accordance with AASB 108 – Accounting Policies, Changes inAccounting Estimates and Errors, the above prior period errorshave been recognised retrospectively.
These amounted to the following equity adjustments:
– Adjustments to opening equity – 1/7/14 (relating to adjustments for the 30/6/14 reporting year end and prior periods)
Total prior period adjustments – prior period errors 6,986
458(8,419)
23
Actual Actual
7,961
(1,456)
–
1,456
6,986–
Notes 2016 2015
7,961458
(8,419)
Note 20 Equity - Retained Earnings and Revaluation Reserves (continued)FOR THE FINANCIAL YEAR ENDED 30 JUNE 2016
FINA
NC
IALS
KU-RING-GAI COUNCIL ANNUAL REPORT 2015 - 2016 165

Financial Statements 2016
page 58
Ku-ring-gai Council
Notes to the Financial Statementsfor the year ended 30 June 2016
Note 20. Retained Earnings, Revaluation Reserves, Changes in Accounting Policies, Changes in Accounting Estimates and Errors (continued)
(d) Voluntary changes in accounting policies
Council made no voluntary changes in any accounting policies during the year.
Note 21. Financial Result and Financial Position by Fund
Council utilises only a general fund for its operations.
Note 22. ‘Held for Sale’ Non-Current Assets and Disposal Groups
$ ’000
(i) Non-current assets and disposal group assets
Non-current assets ‘held for sale’Land
Total non-current assets ‘held for sale’
$ ’000
(ii) Reconciliation of non-current assets ‘held for sale’ and disposal groups – i.e. discontinued operationsOpening balanceLess: carrying value of assets/operations soldBalance still unsold after 12 months:Plus new transfers in:– Assets ‘held for sale’
Closing balance of ‘held for sale’ non-current assets and operations
Refer to Note 27. Fair value measurement for fair value measurement information.
Current
–(5,830)
1,040
–
–
1,040–
Current
–
– 1,040
Actual Actual
–
2015
–
Non-current2016 2016 2015
–
2016
Non-current
7,290
2015
–
1,460
Assets ‘held for sale’
–(1,040)–
–
–– 1,040
(420)–
Note 21 Financial Result & Financial Position by FundFOR THE FINANCIAL YEAR ENDED 30 JUNE 2016
FOR THE FINANCIAL YEAR ENDED 30 JUNE 2016
Note 22 "Held for Sale" Non Current Assets
Note 20 Equity - Retained Earnings and Revaluation Reserves (continued)FOR THE FINANCIAL YEAR ENDED 30 JUNE 2016
166 DELIVERING OUR COMMUNITY'S VISION

Financial Statements 2016
page 59
Ku-ring-gai Council
Notes to the Financial Statementsfor the year ended 30 June 2016
Note 23. Events Occurring After the Reporting Date
$ ’000
Events that occur between the end of the reporting period (30 June 2016) and the date when the financial statementsare ‘authorised for issue’ have been taken into account in preparing these statements.
Council has adopted the date of receipt of the Auditors’ Report as the applicable ‘authorised for issue’ date relatingto these General Purpose Financial Statements.
Accordingly, the ‘authorised for issue’ date is 20 September 2016.
Events that occur after the reporting period represent one of two types:
(i) Events that provide evidence of conditions that existed at the reporting period
These financial statements (and the figures therein) incorporate all ‘adjusting events’ that provided evidence of conditionsthat existed at 30 June 2016.
(ii) Events that provide evidence of conditions that arose after the reporting period
These financial statements (and figures therein) do not incorporate any ‘non-adjusting events’ that have occurred after30 June 2016 and which are only indicative of conditions that arose after 30 June 2016.
Council is unaware of any material or significant ‘non-adjusting events’ that should be disclosed.
Proposed merger of Ku-ring-gai Council with part of Hornsby Shire Council
The Minister for Local Government is considering a proposal to merge Ku-ring-gai Council with part of Hornsby ShireCouncil. This merger is opposed by Ku-ring-gai Council and supported by Hornsby Shire Council.
Ku-ring-gai Council has taken legal action to challenge the process undertaken by the State Government to assess themerger proposal. A decision on the merger proposal by the Minister for Local Government is pending, subject to adecision by the courts.
Note 24. Discontinued Operations
Council has not classified any of its operations as ‘discontinued’.
Note 23 Events occurring after the Reporting DateFOR THE FINANCIAL YEAR ENDED 30 JUNE 2016
Note 24 Discontinued OperationsFOR THE FINANCIAL YEAR ENDED 30 JUNE 2016
FINA
NC
IALS
KU-RING-GAI COUNCIL ANNUAL REPORT 2015 - 2016 167
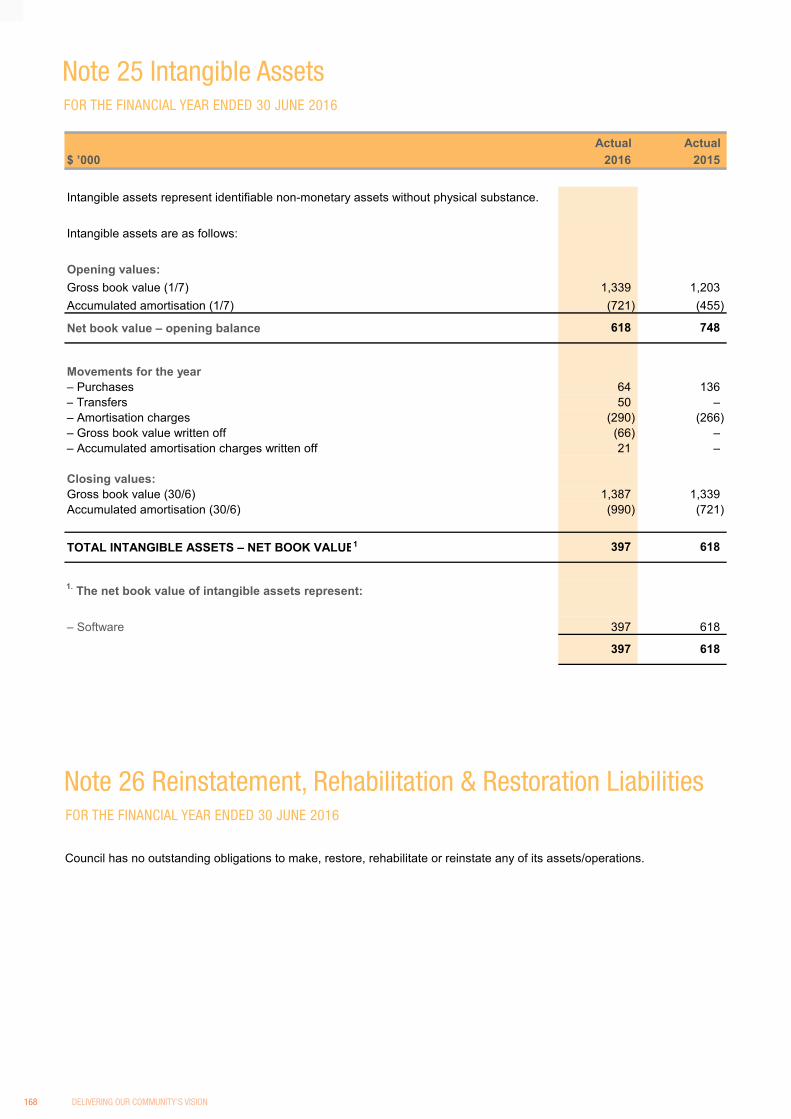
Financial Statements 2016
page 60
Ku-ring-gai Council
Notes to the Financial Statementsfor the year ended 30 June 2016
Note 25. Intangible Assets
$ ’000
Intangible assets represent identifiable non-monetary assets without physical substance.
Intangible assets are as follows:
Opening values:Gross book value (1/7)Accumulated amortisation (1/7)
Net book value – opening balance
Movements for the year– Purchases– Transfers– Amortisation charges– Gross book value written off– Accumulated amortisation charges written off
Closing values:Gross book value (30/6)Accumulated amortisation (30/6)
TOTAL INTANGIBLE ASSETS – NET BOOK VALUE 1
1. The net book value of intangible assets represent:
– Software
Note 26. Reinstatement, Rehabilitation and Restoration Liabilities
Council has no outstanding obligations to make, restore, rehabilitate or reinstate any of its assets/operations.
618
(721)
618
Actual Actual 2016 2015
1,339
–
(721)
(290)(66)
(266)
1,203
50
21
618397
(990)
–
748
(455)
64
1,339
397
–136
397 618
1,387
FOR THE FINANCIAL YEAR ENDED 30 JUNE 2016
Note 25 Intangible Assets
FOR THE FINANCIAL YEAR ENDED 30 JUNE 2016
Note 26 Reinstatement, Rehabilitation & Restoration Liabilities
168 DELIVERING OUR COMMUNITY'S VISION

Financial Statements 2016
page 61
Ku-ring-gai Council
Notes to the Financial Statementsfor the year ended 30 June 2016
Note 27. Fair Value Measurement
$ ’000
The Council measures the following asset and liability classes at fair value on a recurring basis:
– Infrastructure, property, plant and equipment– Investment property– Financial assets and liabilities
The fair value of assets and liabilities must be estimated in accordance with various accounting standards for either recognition and measurement requirements or for disclosure purposes.
AASB 13 Fair Value Measurement requires all assets and liabilities measured at fair value to be assigned to a ‘level’ in the fair value hierarchy as follows:
Level 1: Unadjusted quoted prices in active markets for identical assets or liabilities that the entity can access at the measurement date.
Level 2: Inputs other than quoted prices included within level 1 that are observable for the asset or liability, either directly or indirectly.
Level 3: Inputs for the asset or liability that are not based on observable market data (unobservable inputs).
(1) The following table presents all assets and liabilities that have been measured and recognised at fair values:
2016
Recurring fair value measurements
Investment propertiesInvestment propertiesTotal investment properties
Infrastructure, property, plant and equipmentOperational LandCommunity LandLand Under RoadsLand Improvements DepreciableStormwater DrainageStructure (Car Parks)Buildings - Non SpecialisedBuildings - SpecialisedFurniture & FittingsLibrary BooksOffice EquipmentPlant & Equipment (e.g. Fleet & Small Plant)Other (Artworks, Sculptures)RoadsBridgesFootpathsKerb & GutterRoad Structure & Street FurnitureRecreational FacilitiesSwimming Pools
Total infrastructure, property, plant and equipment
30/06/13 – – 66,525 66,52530/06/13 – – 20,651 20,651
1,379 1,379– – 238,552 238,552– – 6,386 6,386– –
–
3,583
– – 1,163,842 1,163,842
30/06/15 – – 973 97330/06/15 – – 6,052 6,052
30/06/1530/06/1530/06/15 31,066 31,06630/06/15 – – 67,979 67,97930/06/15 – – 3,583
30/06/16 –
30/06/13 – –30/06/15 – – 193 19330/06/15 – –
30/06/16 – – 2,195 2,19530/06/15 – – 161,750 161,75030/06/15 – – 7,662 7,66230/06/13 – – 48,142 48,142
30/06/14 – – 66 66
– – 19,056 19,056
inputsprices in observable
13,183
– 428,406
13,183
2,807 2,807
inputs
Fair value measurement hierarchyLevel 1 Level 2
SignificantLevel 3 Total
Date Quoted Significant
valuation active mktsof latest unobservable
30/06/13 – – 19,056 19,056
30/06/13 – – 56,292 56,29230/06/16 – 428,406
Note 27 Fair Value MeasurementFOR THE FINANCIAL YEAR ENDED 30 JUNE 2016
FINA
NC
IALS
KU-RING-GAI COUNCIL ANNUAL REPORT 2015 - 2016 169

Financial Statements 2016
page 62
Ku-ring-gai Council
Notes to the Financial Statementsfor the year ended 30 June 2016
Note 27. Fair Value Measurement (continued)
$ ’000
(1) The following table presents all assets and liabilities that have been measured and recognised at fair values (continued):
2015
Recurring fair value measurements
Infrastructure, property, plant and equipmentOperational LandCommunity LandLand Under RoadsLand Improvements DepreciableStormwater DrainageStructure (Car Parks)Buildings - Non SpecialisedBuildings - SpecialisedFurniture & FittingsLibrary BooksOffice EquipmentPlant & Equipment (e.g. Fleet & Small Plant)Other (Artworks, Sculptures)RoadsBridgesFootpathsKerb & GutterRoad Structure & Street FurnitureRecreational FacilitiesSwimming Pools
Total infrastructure, property, plant and equipment
Non-recurring fair value measurements
Non-current assets classified as ‘held for sale’Community Land
Total NCA’s classified as ‘held for sale’
(2) Transfers between level 1 and level 2 fair value hierarchies
During the year, there were no transfers between level 1 and level 2 fair value hierarchies for recurring fairvalue measurements.
– 46,098 46,098
Significant Significantof latest prices in observable
Date Quoted
valuation active mkts
Level 1 Level 2 Level 3 Total
– 1,067,513
30/06/13 52,632 52,63230/06/11 – – 326,775 326,77530/06/14 – – 66 6630/06/11 – – 16,930 16,93030/06/15
Fair value measurement hierarchy
– –
inputsunobservable
inputs
– – 163,119 163,11930/06/15 – – 7,901 7,90130/06/13 – – 66,280 66,28030/06/13 – – 10,832 10,83230/06/15 – – 214 21430/06/15 – – 2,739 2,739
30/06/15 – – 6,549 6,54930/06/15 – – 31,347 31,34730/06/15 –
30/06/13 – – 19,888 19,88830/06/11 –
30/06/15 – – 1,164 1,16430/06/15 – – 6,030 6,03030/06/11 – – 536 53630/06/15 – – 233,162 233,162
– 69,303 69,30330/06/15 – – 5,948 5,948
– 1,067,513
– – 1,040 1,040
– – 1,040 1,04030/06/11
Note 27 Fair Value Measurement (continued)FOR THE FINANCIAL YEAR ENDED 30 JUNE 2016
170 DELIVERING OUR COMMUNITY'S VISION

Financial Statements 2016
page 63
Ku-ring-gai Council
Notes to the Financial Statementsfor the year ended 30 June 2016
Note 27. Fair Value Measurement (continued)
$ ’000
(3) Valuation techniques used to derive level 2 and level 3 fair values
Where Council is unable to derive fair valuations using quoted market prices of identical assets(i.e. level 1 inputs) Council instead utilises a spread of both observable inputs (level 2 inputs) andunobservable inputs (level 3 inputs).
The fair valuation techniques Council has employed while utilising level 2 and level 3 inputs are as follows:
Investment properties
Council obtains independent valuations of its investment property on a regular basis to ensure the financial statements reflect the most up-to-date valuation. The investment property valuation is included in level 3 of the hierarchy. The key unobservable input to the valuation is the price per square metre. The fair value of the investment property is determined by an independent and qualified valuer. The Council reviews the valuation and discusses significant movements with the valuer. Council will revalue its Investment Property to make sureit reflects the most up-to-date value at the end of the reporting period.
Infrastructure, property, plant and equipment (IPP&E)
Community Land
Assets within the “Community Land” class are Council owned Community Land Council’s community land is valued on the Unimproved Capital Value (UCV), provided by the Valuer General.
Currently all Council assets in this asset class are based on UCV, however, should Council have an asset in future for which an UCV is not provided, the replacement cost will be used. Replacement cost will be based on average unit rates for similar properties, land use, dimensions, land size and shape, which are not considered observable based on market evidence, therefore, placing the whole asset class in Level 3. Valuation techniques remained the same for this reporting period.
The last revaluation of Community Land was performed in June 2016
Operational Land
Council’s operational land includes all of Council's land classified as operational land under Local Government Act1993. The total area of land at the time of the last valuation was 42,713m2. Council’s operational land is valued onan annual basis with a comprehensive valuation completed and revalued every five years. Liquid Pacific Holdings Pty Ltd completed the last valuation in June 2013. Council's operational land was valued at market value (highest and best use) after identifying all elements that would be taken into account by buyers and sellers in setting the price, including but not limited to zoning, topography, location, size, shape, access, exposure to traffic and businesses. Remaining useful life, condition of asset, future cash flow from the use of asset are also considered when determining the fair value.
This asset class is categorised as Level 3 as some of the above-mentioned inputs used in the valuation of theseassets require significant professional judgement and are therefore unobservable.
Valuation techniques remained the same for this reporting period.
FINA
NC
IALS
Note 27 Fair Value Measurement (continued)FOR THE FINANCIAL YEAR ENDED 30 JUNE 2016
KU-RING-GAI COUNCIL ANNUAL REPORT 2015 - 2016 171

Financial Statements 2016
page 64
Ku-ring-gai Council
Notes to the Financial Statementsfor the year ended 30 June 2016
Note 27. Fair Value Measurement (continued)
$ ’000
(3) Valuation techniques used to derive level 2 and level 3 fair values (continued)
Land Under Roads
Land under roads is land under roadways and road reserves including land under footpaths, nature strips andmedian strips. Council has elected not to recognise land under roads acquired before 1 July 2008 in accordance withAASB 1051. Land under roads acquired after 1 July 2008 is recognised in accordance with AASB 116 – Property,Plant and Equipment and Council recognised this asset for the first time in financial year 2010/11.One locationwas included in the valuation. The Land under Roads was valued in accordance with the Australian AccountingStandard AASB 116 Property, Plant and Equipment, the Code of Accounting Practice and Financial ReportingJune 2014, and completed by Council’s Strategic Asset Coordinator. Values were determined using the Englobomethodology derived from the Code of Accounting Practice and Financial Reporting. This asset class is classifiedas Level 3 asset as significant inputs used in the Englobo valuation methodology are unobservable.
There are no changes in valuation techniques from prior years.
Land Improvements Depreciable
The land improvements asset class consists of bus shelters, North Turramurra Recreation Area assets and landimprovement assets surrounding Council buildings. Council values these land improvements internally using costapproach. Replacement costs (unit rates) and useful lives of Council's land improvement assets were determinedusing technical knowledge from council staff (engineers and asset management) and contractor information. Othersignificant inputs considered in the valuation of these assets are asset condition, remaining useful life, pattern ofconsumption, dimensions and residual value. The condition of each asset was determined by completing fieldinspections using the ratings 1 (Excellent) to 5 (Very Poor). This asset class is categorised as Level 3 as someof the above-mentioned inputs used in the valuation of these assets require significant professional judgement andare therefore unobservable. Valuation techniques remained the same for this reporting period.
Stormwater Drainage
The Stormwater Drainage asset class consists of Council’s pits and pipes. Council staff completed the valuationof these assets internally using replacement cost approach and the last valuation was completed in June 2015.
Replacement costs (unit rates) and useful lives for Stormwater Drainage assets were determined through acombination of historic subdivision data and technical knowledge of Council staff, which incorporated standard unitrates applied to the dimensions of the asset and considered environmental factors based on asset location. Othersignificant inputs considered in the valuation of these assets are asset condition, remaining useful life, pattern ofconsumption, and residual value. The asset condition of 1 (Excellent) to 5 (Very Poor) was determined byassumptions based on age and CCTV investigations undertaken across a representative selection of Council’sdrainage network. This asset class is categorised as Level 3 as some of the above-mentioned inputs used in thevaluation of these assets require significant professional judgement and are therefore unobservable. Valuationtechniques remained the same for this reporting period.
Note 27 Fair Value Measurement (continued)FOR THE FINANCIAL YEAR ENDED 30 JUNE 2016
172 DELIVERING OUR COMMUNITY'S VISION

Financial Statements 2016
page 65
Ku-ring-gai Council
Notes to the Financial Statementsfor the year ended 30 June 2016
Note 27. Fair Value Measurement (continued)
$ ’000
(3) Valuation techniques used to derive level 2 and level 3 fair values (continued)
Other Structure
Council’s car park assets are separated into two registers: the car park surface and pavement register and thecar park structures register which consists of all road structures and furniture within the car park location.Replacement costs (unit rate) were determined using technical knowledge from council staff (engineers and assetmanagement) and contractor information. The useful lives were determined using SSROC useful life as a guide.Other significant inputs considered in the valuation of these assets are condition rating, remaining useful life, pattern of consumption, dimensions, components and residual value.
The condition of each asset was determined by completing field inspections using the 1 (Excellent) to 5 (Very Poor).
This asset class is categorised as Level 3 as some of the above-mentioned inputs used in the valuation of theseassets require significant professional judgement and are therefore unobservable. Valuation techniques remainedthe same for this reporting period.
Buildings - Non specialised and Specialised
Council engaged Liquid Pacific Holdings Pty Ltd to value all buildings and shelters in 2013. The valuation methodology adopted was dependent on whether a market exists to substantiate the value of the asset. Council’s buildings are separated into commercial, community and operational assets.
If there are changes in valuation techniques from prior years, these and the reasons for change also need to be listed.
Non Specialised Buildings
The market sale approach to the valuation of assets comprises reference to market evidence of the sale of theidentical and or similar assets. The valuation aspects are generally, but not limited to the location, size, condition,style and utility of the asset. Replacement cost, asset condition, remaining useful life and building components aresome of the inputs used in fair value determination. Since most of these inputs require judgement and areunobservable, the asset class has been classified as Level 3.
There are no changes in valuation techniques from prior years.
Specialised Buildings
The market buying approach is estimated by the sum of the current market prices for one or more purchasetransactions required to reproduce or replace the asset, less accumulated depreciation. In determining the current cost of a specialised asset, reference is made to the cost of replacing the assets servicepotential and in doing so the Modern Equivalent Replacement Cost (MERC) is adopted. The other significant inputsconsidered in the valuation are remaining useful life of the asset, condition, pattern of consumption and residual value.
In 2012/13 financial year Council completed construction of Council's Depot at Suakin Street, Pymble which was classified as a specialised building.
This asset class is categorised as Level 3 as some of the above-mentioned inputs used in the valuation of theseassets require significant professional judgement and are therefore unobservable.
There are no changes in valuation techniques from prior years.
FINA
NC
IALS
Note 27 Fair Value Measurement (continued)FOR THE FINANCIAL YEAR ENDED 30 JUNE 2016
KU-RING-GAI COUNCIL ANNUAL REPORT 2015 - 2016 173

Financial Statements 2016
page 66
Ku-ring-gai Council
Notes to the Financial Statementsfor the year ended 30 June 2016
Note 27. Fair Value Measurement (continued)
$ ’000
(3) Valuation techniques used to derive level 2 and level 3 fair values (continued)
Roads
Council’s roads are componentised into the pavement, surface and formation and further separated into segmentsfor inspection and valuation. The full revaluation of road assets is undertaken on a 5 year cycle. The valuation, which is completed by Council’s asset and pavement engineers, was completed in June 2015. The Cost approach was adopted to value Council roads. The replacement costs (basedon unit rates), useful lives and conditions were determined by extracting technical information contained inCouncil’s pavement management system (SMEC) and the updated road condition spread sheet provided by theasset and pavement engineer (based on invoices and contracts). Useful lives were reviewed based on SSROCguide. This year all the road assets data stored in the Pavement Management System (SMEC) has been importedinto the new corporate system. Roads due for renewal are assessed by pavement engineers and the entire road network is assessed by an independent consultant (every 2-3 years). The last independent assessment was completed in 2013. An updated assessment of Council road conditions were carried out in the 2015/2016financial year. Some of the other significant inputs considered in the valuation of these assets are remaininguseful life, inspections and pattern of consumption, dimensions, components, residual value and type of road. Apavement condition index (PCI) is used in SMEC and determined by field. This PCI is converted into road technicalratings condition 1 (Excellent) to 5 (Very Poor).This asset class is categorised as Level 3 as some of the abovementioned inputs used in the valuation of these assets require significant professional judgement and are thereforeunobservable.
Bridges
Council’s bridges register consists of all pedestrian and vehicle access bridges. The bridges were inspected andvalued by an independent consultant (Asset Val) in June 2015. In order to apply fair valuation and condition based depreciation, the following information was determined by the consultant for each component:
· The replacement cost was based on the cost to replace a component to a current day equivalent. Published available market data for recent projects and published cost guides are utilised to determine the estimated replacement cost.· The useful life and remaining useful life - Where the site inspections were done, a condition assessment was allocated to all the assets and that was used to estimate useful and remaining useful life of an asset.· Condition assessment - is based on factors such as age of the asset, overall condition, economic & functional obsolescence.· Residual value – The estimated amount that an entity would currently obtain from disposal of the asset· Pattern of Consumption – straight line pattern of consumption
This asset class is categorised as Level 3 as some of the above-mentioned inputs used in the valuation of theseassets require significant professional judgement and are therefore unobservable.
There are no changes in valuation techniques from prior years.
Note 27 Fair Value Measurement (continued)FOR THE FINANCIAL YEAR ENDED 30 JUNE 2016
174 DELIVERING OUR COMMUNITY'S VISION

Financial Statements 2016
page 67
Ku-ring-gai Council
Notes to the Financial Statementsfor the year ended 30 June 2016
Note 27. Fair Value Measurement (continued)
$ ’000
(3) Valuation techniques used to derive level 2 and level 3 fair values (continued)
Footpaths
Council’s footpath register consists of all pedestrian walkways and cycleways within the Council area. Council staffcompleted the valuation of the Footpath assets internally and the valuation was completed in June 2015.Replacement costs (unit rates) and useful lives of Council's footpaths were determined using technical knowledgeand Contractor information. Some of the other significant inputs considered in the valuation of these assets areremaining useful life, pattern of consumption, dimensions, components and residual value.
The condition of each asset was determined using the ratings 1 (Excellent) to 5 (Very Poor).
This asset class is categorised as Level 3 as some of the above-mentioned inputs used in the valuation of theseassets require significant professional judgement and are therefore unobservable. Valuation techniques remainedthe same for this reporting period.
Kerb & Gutter
Council's kerb and gutter register consists of all kerb and gutter within Council's road network. Council staffperformed the valuation of the assets internally and the valuation was completed in June 2015.
Replacement costs (unit rates) and useful lives of Council's kerb and gutter were determined using technicalknowledge, Contractor information and SSROC Guide. Some of the other significant inputs considered in the valuation of these assets are remaining useful life, pattern of consumption, dimensions, components and residualvalue.
The condition of each asset was determined using the ratings 1 (Excellent) to 5 (Very Poor).
This asset class is categorised as Level 3 as some of the above-mentioned inputs used in the valuation of theseassets require significant professional judgement and are therefore unobservable. Valuation techniques remainedthe same for this reporting period.
Road Structure and Street Furniture
The Road Structures and Street Furniture register comprises of all structures (traffic islands, guardrails) andfurniture (bollards, signs) within Council's road network. Council staff completed the valuation of the assets internallyand the valuation was completed in June 2015. Replacement costs (unit rates) and useful lives of Council'sroad structures and street furniture were determined using technical knowledge from Council staff (engineers andasset management), Contractor information, current invoices and SSROC guide. Some of the other significant inputs considered in the valuation of these assets are remaining useful life, pattern of consumption, dimensions,components and residual value.The condition of each asset was determined using the ratings 1 (Excellent) to 5 (Very Poor).
This asset class is categorised as Level 3 as some of the above-mentioned inputs used in the valuation of theseassets require significant professional judgement and are therefore unobservable. Valuation techniques remainedthe same for this reporting period.
Note 27 Fair Value Measurement (continued)FOR THE FINANCIAL YEAR ENDED 30 JUNE 2016
KU-RING-GAI COUNCIL ANNUAL REPORT 2015 - 2016 175

Financial Statements 2016
page 68
Ku-ring-gai Council
Notes to the Financial Statementsfor the year ended 30 June 2016
Note 27. Fair Value Measurement (continued)
$ ’000
(3) Valuation techniques used to derive level 2 and level 3 fair values (continued)
Open Space / Recreational Assets
Council's recreational facilities register includes all assets within our sports fields, bushland and park locations.This includes but is not limited to ovals, playing courts, playgrounds, fences and fire trails. Council staff completesthe valuation of these assets internally. Replacement costs (unit rates) and useful lives of Council's recreationalfacilities were determined using technical knowledge from Council staff (engineers and asset management) andContractor information. Some of the other significant inputs considered in the valuation of these assets areremaining useful life, pattern of consumption, dimensions, components and residual value.
The condition of these assets was determined by field inspections using the ratings 1 (Excellent) to 5 (Very Poor).
This asset class is categorised as Level 3 as some of the above-mentioned inputs used in the valuation of theseassets require significant professional judgement and are therefore unobservable. Valuation techniques remainedthe same for this reporting period.
Swimming Pool
The swimming pool includes all assets located within the facility.
Liquid Pacific Pty Ltd valued the building components of the swimming pool in June 2013 as part of the buildingrevaluation and other substantial components of the pool are valued using replacement cost method. Replacementcosts were determined using square metre rates and other significant inputs considered in the valuation of theseassets are asset condition, remaining useful life, components, dimensions and residual value.
This asset class is categorised as Level 3 as some of the above-mentioned inputs used in the valuation of theseassets require significant professional judgement and are therefore unobservable. Valuation techniques remainedthe same for this reporting period.
Plant & Equipment, Office Equipment, and Furniture & Fittings
This asset category includes:
Plant & Equipment – Motor vehicles, trucks, mowers, buses, earthmoving equipmentOffice Equipment – Computer equipmentFurniture & Fittings – Chairs, desks, cabinets, display systems
These assets are valued at cost in Council’s books and reported at Fair value in the notes due to the nature of theitems. The cost of these assets are based on current invoices and contracts, which are based on observable inputs,however the remaining useful life and residual value is based on internal factors which are unobservable in themarket therefore placing these assets in Level 3. Valuation techniques remained the same for this reporting period.
Library Books
This asset category comprises of assets such as library books, journals, magazines, CDs and DVDs.
The library books are reported at Fair value in the notes however, due to the nature of these items they are valuedat cost. There are no major variances between the fair value and carrying amount of these assets. The cost of theseassets are based on current invoices and contracts, which are based on observable inputs, however the remaininguseful life and residual value is based on internal factors which are unobservable in the market making it a Level 3asset. Valuation techniques remain the same for this reporting period.
Note 27 Fair Value Measurement (continued)FOR THE FINANCIAL YEAR ENDED 30 JUNE 2016
176 DELIVERING OUR COMMUNITY'S VISION

Financial Statements 2016
page 69
Ku-ring-gai Council
Notes to the Financial Statementsfor the year ended 30 June 2016
Note 27. Fair Value Measurement (continued)
$ ’000
(3) Valuation techniques used to derive level 2 and level 3 fair values (continued)
Others (Artwork, Sculptures)
Council engaged McWilliam and Associates Pty Ltd to value all artwork, memorabilia and monuments in June 2016. This information was updated into Council's public art register.
The valuation was completed using the replacement cost approach and market value in accordance with AASB 116.
The replacement value for artworks and memorabilia was determined by the price at which the items could bepurchased from a reputable dealer, gallery or retail outlet.
The replacement value for monuments was determined as the cost of replacing an asset with a similar object in acondition equal to, but not better than its condition when new. An estimate of associated costs includingconsultancy and site management is included in the determination of the replacement value.
Where the fair value of an asset could not be determined by sale on the open market, a depreciable replacementcost has been adopted. Other significant inputs considered in the valuation are the condition of the asset, patternof consumption and remaining useful life. This asset class is categorised as Level 3 as some of the abovementioned inputs used in the valuation of these assets require significant professional judgement and are thereforeunobservable.
There are no changes in valuation techniques from prior years.
(4). Fair value measurements using significant unobservable inputs (level 3)
a. The following tables present the changes in level 3 fair value asset classes.
Opening balance – 1/7/14
Transfers from/(to) another asset classPurchases (GBV)Disposals (WDV)Depreciation and impairmentReval Inc\ Dec to Equity (ARR)
Closing balance – 30/6/15
Transfers from/(to) another asset classPurchases (GBV)Disposals (WDV)Depreciation and impairmentReval Inc\ Dec to Equity (ARR)
Closing balance – 30/6/16
93,114
(19,745)
428,406 66
–
2,195
– –
163,119
284 5,506–
161,750
– (334)–
334,736 515,528
(1,653) (1,987)
66
––
(1,145) – (18,600) –
– –1,700 – 3,522
17,607
– 646
–
–
– – –3,651
– 28,127 28,127
4,856
Total
336,311 66 13,761
Land Roads Depreciable
486,321
Improvements StormwaterLand Land
DrainageCommunity Under
499–
– – (451)(1,428)
–
136,183
592,417
(147)
93,114
–(2,396) (2,847)
(1,428)1,205
FINA
NC
IALS
Note 27 Fair Value Measurement (continued)FOR THE FINANCIAL YEAR ENDED 30 JUNE 2016
KU-RING-GAI COUNCIL ANNUAL REPORT 2015 - 2016 177

Financial Statements 2016
page 70
Ku-ring-gai Council
Notes to the Financial Statementsfor the year ended 30 June 2016
Note 27. Fair Value Measurement (continued)
$ ’000
(4). Fair value measurements using significant unobservable inputs (level 3) (continued)
a. The following tables present the changes in level 3 fair value asset classes. (continued)
Opening balance – 1/7/14
Transfers from/(to) another asset classPurchases (GBV)Depreciation and impairmentReval Inc / Dec to Equity (ARR)Transfer from WIP
Closing balance – 30/6/15
Transfers from/(to) another asset classPurchases (GBV)Depreciation and impairmentReval Inc / Dec to Equity (ARR)Transfer from WIP
Closing balance – 30/6/16
Opening balance – 1/7/14
Transfers from/(to) another asset classPurchases (GBV)Depreciation and impairmentReval Inc / Dec to Equity (ARR)
Closing balance – 30/6/15
Purchases (GBV)Depreciation and impairment
Closing balance – 30/6/16
and and Street
(5,214)–
254,664
– – 854
–
92– 15,349 21,877
–
–
109,0153,583
5,646
–
603
–
Buildings
439 – 439– –
Structure
9,555 9,555
–
(53)
1,276
354 –
1,379 238,552 260,777
994 235,300
7(750)
6,386 31,066
(2,459)469
67,979
(1,331) (215)
Structure
10,156
(272)
214,992
Roads
(402) (7,992)(54)
6,528
(Car Parks)
–
Total
– – 207
3,100
207 –
(4,688)
110,98831,347
Specialised
43,590
9 485
(162) (1,235)
6,549
7,901 10,469
3,70333 17 – 8,637
(163)
7,662
228,1471,197 10,911
(438)
Kerb
(31) (442)
1,047
Other
854
–
35,384
5,911
––
Bridges Footpaths
(345)
1,276
1,238 1,592
(3,394)
21,218 35,571
FurnitureGutter
Road
–
Total
(1,652)(1,512)
69,303
–
13,184
92
68,346
3,789
–
(7,264)8,687
–
Note 27 Fair Value Measurement (continued)FOR THE FINANCIAL YEAR ENDED 30 JUNE 2016
178 DELIVERING OUR COMMUNITY'S VISION

Financial Statements 2016
page 71
Ku-ring-gai Council
Notes to the Financial Statementsfor the year ended 30 June 2016
Note 27. Fair Value Measurement (continued)
$ ’000
(4). Fair value measurements using significant unobservable inputs (level 3) (continued)
a. The following tables present the changes in level 3 fair value asset classes. (continued)
Opening balance – 1/7/14
Transfers from/(to) another asset classPurchases (GBV)Disposals (WDV)Depreciation and impairmentTransfers from WIP
Closing balance – 30/6/15
Transfers from/(to) another asset classPurchases (GBV)Disposals (WDV)Depreciation and impairmentTransfers from WIPReval Inc / Dec to Equity (ARR)
Closing balance – 30/6/16
Opening balance – 1/7/14
Transfers from/(to) another asset classPurchases (GBV)Disposals (WDV)Depreciation and impairmentTransfers from WIP
Closing balance – 30/6/15
Transfers from/(to) another asset classPurchases (GBV)Disposals (WDV)Depreciation and impairmentTransfers from WIP
Closing balance – 30/6/16 48,142 193 973 6,050 55,358
140 – – – 140
(19,056) – (50) – (19,106)2,677 6 65 1,781 4,529
– – (43) (865) (908)(1,899) (27) (191) (895) (3,012)
402 – – – 402
66,280 214 1,192 6,029 73,715
(2,494) (21) (144) (894) (3,553)
208 (220) 191,925 66 275 1,614 3,880(970) – – (712) (1,682)
Furniture Office andSpecialised and Fittings Equipment Equipment Total
74,649
Swimming (Assets (Assets
66,525
Held for Sale) Held for Sale)
20,651 –
4
Land (Oper. Land
–
67,390 165 853 6,241
27
2,080–2,080
(353) –
47,303
and Comm) Improvements
5,003 2,287
Facilities Pools
(3,556)
Total
(1,371)
2,606
– 3,534
17,479
(2,853)
–
–
–
(3,963) (2,287)(2,931) (625)
45,806
– –(6,250)–
672 2,862
72,072
66,734
2,445 161 –
(1,683) 11 – –
Recreational
3,034
–
– – 4,150(331)
3,892 – – –– (3,206)–
(1,672)
–
19,888 1,040 –
87,176
– – – 14,897
– (1,040)
14,8971,116
3,892
Buildings Plant Non
FINA
NC
IALS
Note 27 Fair Value Measurement (continued)FOR THE FINANCIAL YEAR ENDED 30 JUNE 2016
KU-RING-GAI COUNCIL ANNUAL REPORT 2015 - 2016 179

Financial Statements 2016
page 72
Ku-ring-gai Council
Notes to the Financial Statementsfor the year ended 30 June 2016
Note 27. Fair Value Measurement (continued)
$ ’000
(4). Fair value measurements using significant unobservable inputs (level 3) (continued)
a. The following tables present the changes in level 3 fair value asset classes. (continued)
Opening balance – 1/7/14
Purchases (GBV)Disposals (WDV)Reval Inc / Dec to Equity (ARR)
Closing balance – 30/6/15
Transfers from/(to) another asset classPurchases (GBV)Disposals (WDV)Depreciation and impairmentTransfers from WIP
Closing balance – 30/6/16
b. Information relating to the transfers into and out of the level 3 fair valuation hierarchy (as disclosed in the table above):
During the year, there were no transfers into and out of the Level 3 Fair Valuation hierarchy
19,056 56,292 2,807 78,155
– – (530) (530)– – 16 16
19,056 1,145 – 20,201– 2,515 582 3,097– – – –
– – – –
52,632 2,739 55,371
– 238 584 822– (539) (512) (1,051)
Investment Operational LibraryProperties Land Books Total
– 52,933 2,667 55,600
Note 27 Fair Value Measurement (continued)FOR THE FINANCIAL YEAR ENDED 30 JUNE 2016
180 DELIVERING OUR COMMUNITY'S VISION
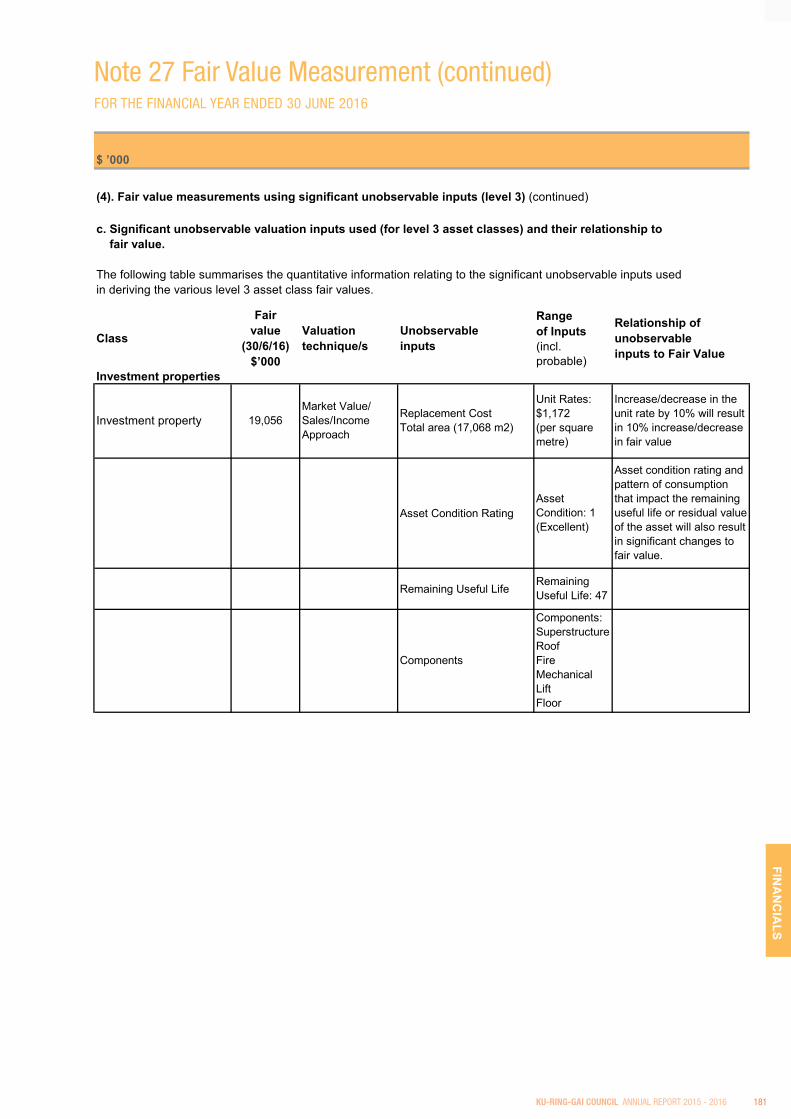
Financial Statements 2016
page 73
Ku-ring-gai Council
Notes to the Financial Statementsfor the year ended 30 June 2016
Note 27. Fair Value Measurement (continued)
$ ’000
(4). Fair value measurements using significant unobservable inputs (level 3) (continued)
c. Significant unobservable valuation inputs used (for level 3 asset classes) and their relationship to fair value.
The following table summarises the quantitative information relating to the significant unobservable inputs usedin deriving the various level 3 asset class fair values.
Investment properties
Asset Condition Rating
Remaining Useful Life
Investment property
Increase/decrease in the unit rate by 10% will result in 10% increase/decrease in fair value
Replacement Cost Total area (17,068 m2)
Unit Rates:$1,172(per square metre)
Components
Components: Superstructure RoofFire Mechanical LiftFloor
Market Value/ Sales/Income Approach
Asset condition rating and pattern of consumption that impact the remaining useful life or residual value of the asset will also result in significant changes to fair value.
19,056
Valuationtechnique/s
Unobservableinputs
Rangeof Inputs(incl. probable)
Relationship of unobservableinputs to Fair Value
Class
Fairvalue
(30/6/16)$’000
Asset Condition: 1(Excellent)
Remaining Useful Life: 47
FINA
NC
IALS
Note 27 Fair Value Measurement (continued)FOR THE FINANCIAL YEAR ENDED 30 JUNE 2016
KU-RING-GAI COUNCIL ANNUAL REPORT 2015 - 2016 181

Financial Statements 2016
page 74
Ku-ring-gai Council
Notes to the Financial Statementsfor the year ended 30 June 2016
Note 27. Fair Value Measurement (continued)
$ ’000
(4). Fair value measurements using significant unobservable inputs (level 3) (continued)
c. Significant unobservable valuation inputs used (for level 3 asset classes) and their relationship to fair value (continued).
I,PP&E
Remaining Useful life Remaining Useful Life20 yrs
2,195
Land Under Roads
Community Land
Land ImprovementsDepreciable
Replacement CostUnit Rates - vary from asset to asset
Asset Condition rating
Cost Approach
Increase/decrease in the price per square metre based on the unimproved capital value will result in changes in fair value
Cost Approach
Increase/decrease in the price per square metre will result in changes in fair value
Increase/decrease in the unit rates by 10% will result in 10% increase/decrease in fair value
Asset condition rating and pattern of consumption that impact the remaining useful life or residual value of the asset will also result in significant changes to fair value.
Cost Approach
Unimproved Capital Value provided by Valuer General
Total area (6,986,004 m2)
Unit Rates:$1 - $2,384(per square metre)
Total area (85,374,620m2)
Total Value of land ($24,944,545,350)
Total area LUR (2245m2)
Englobo valuation basis (AASB116)
$29.22 (per square metre)
Asset Condition 1 - 5 representingExcellent to Very poor
Class
Fairvalue
(30/6/16)$’000
Valuationtechnique/s
428,406
Unobservableinputs
Rangeof Inputs(incl. probable)
Relationship of unobservableinputs to Fair Value
66
Note 27 Fair Value Measurement (continued)FOR THE FINANCIAL YEAR ENDED 30 JUNE 2016
182 DELIVERING OUR COMMUNITY'S VISION

Financial Statements 2016
page 75
Ku-ring-gai Council
Notes to the Financial Statementsfor the year ended 30 June 2016
Note 27. Fair Value Measurement (continued)
$ ’000
(4). Fair value measurements using significant unobservable inputs (level 3) (continued)
c. Significant unobservable valuation inputs used (for level 3 asset classes) and their relationship to fair value (continued).
I,PP&E
Replacement Cost
Unobservableinputs
Rangeof Inputs(incl. probable)
Stormwater Drainage
Buildings - Specialised
161,750
48,142
Cost Approach
Cost Approach
Class
Fairvalue
(30/6/16)$’000
Valuationtechnique/s
Modern Equivalent Replacement Cost (MERC)
Unit Rates: vary from asset to asset
Increase/decrease in the unit rates by 10% will result in 10% increase/decrease in fair value
Asset Condition rating
Asset Condition: 1-5(Excellent to Very poor)
Asset condition rating and pattern of consumption that impact the remaining useful life or residual value of the asset will also result in significant changes to fair value.
Remaining Useful lifeRemaining Useful Life:4 - 95yrs
Components
Components:SuperstructureRoofFloorMechanical Fire
Remaining Useful lifeRemaining Useful Life:15 - 135 yrs
Residual ValueResidual Value: 0% to 10%
Unit Rates:$92 - $5,567 vary from asset to asset
Relationship of unobservableinputs to Fair Value
Increase/decrease in the unit rates by 10% will result in 10% increase/decrease in fair value
Asset condition rating and pattern of consumption that impact the remaining useful life or residual value of the asset will also result in significant changes to fair value.
Asset Condition rating
Asset Condition: 1-5 (Excellent to Very poor)
FINA
NC
IALS
Note 27 Fair Value Measurement (continued)FOR THE FINANCIAL YEAR ENDED 30 JUNE 2016
KU-RING-GAI COUNCIL ANNUAL REPORT 2015 - 2016 183

Financial Statements 2016
page 76
Ku-ring-gai Council
Notes to the Financial Statementsfor the year ended 30 June 2016
Note 27. Fair Value Measurement (continued)
$ ’000
(4). Fair value measurements using significant unobservable inputs (level 3) (continued)
c. Significant unobservable valuation inputs used (for level 3 asset classes) and their relationship to fair value (continued).
I,PP&E
Increase/decrease in the unit rates by 10% will result in 10% increase/decrease in fair value
Asset Condition rating
Asset Condition: 1-5(Excellent to Very poor)
Asset condition rating and pattern of consumption that impact the remaining useful life or residual value of the asset will also result in significant changes to fair value.
Remaining Useful life
Remaining Useful Life:
2.5yrs to 100 yrs
Class
Residual Value
Residual Value:Pavement:0% to 10%
Other(Artworks, Sculptures) 1,379 Cost Approach
Replacement costs
In the absence of replacement cost, depreciable replacement (DRC) cost is adopted
Replacement cost vary from asset to asset
Increases (decreases) in replacement cost or condition of the asset would result in a higher (lower) fair value measurement
Fairvalue
(30/6/16)$’000
Valuationtechnique/s
Unobservableinputs
Rangeof Inputs(incl. probable)
Relationship of unobservableinputs to Fair Value
Structure (Car Parks) 7,662 Cost Approach
Replacement Cost
Unit Rates:Surface:$25
Pavement:$50
Formation$15
Note 27 Fair Value Measurement (continued)FOR THE FINANCIAL YEAR ENDED 30 JUNE 2016
184 DELIVERING OUR COMMUNITY'S VISION

Financial Statements 2016
page 77
Ku-ring-gai Council
Notes to the Financial Statementsfor the year ended 30 June 2016
Note 27. Fair Value Measurement (continued)
$ ’000
(4). Fair value measurements using significant unobservable inputs (level 3) (continued)
c. Significant unobservable valuation inputs used (for level 3 asset classes) and their relationship to fair value (continued).
I,PP&E
Roads
Bridges
238,552 Cost Approach
6,386
Unobservableinputs
Rangeof Inputs(incl. probable)
Relationship of unobservableinputs to Fair Value
Asset Condition: 1-5(Excellent to Very poor)
Asset condition rating and pattern of consumption that impact the remaining useful life or residual value of the asset will also result in significant changes to Fair value.
Remaining Useful lifeRemaining Useful Life:3 - 85 yrs
Replacement Cost
Asset Condition- Surface- Pavement- FormationAssessed as 1 - 5: Excellent to Very poor
Asset condition rating and pattern of consumption that impact the remaining useful life or residual value of the asset will also result in significant changes to fair value.
Remaining Useful life
Remaining Useful Life- Surface: 30yrs- Pavement: 80 yrs- Formation 120 yrs
Residual Value Residual Value: 0%
Unit Rates- Surface:$25-$32- Pavement:$50-$100- Formation:$15-$20(Unit rates vary from asset to asset)
Increase/decrease in the unit rates by 10% will result in 10% increase/decrease in fair value
Replacement CostUnit Rates - vary from asset to asset
Increase/decrease in the unit rates by 10% will result in 10% increase/decrease in fair value
Asset Condition rating
Fairvalue
(30/6/16)$’000
Valuationtechnique/s
Asset Condition rating
Class
Cost Approach FINA
NC
IALS
Note 27 Fair Value Measurement (continued)FOR THE FINANCIAL YEAR ENDED 30 JUNE 2016
KU-RING-GAI COUNCIL ANNUAL REPORT 2015 - 2016 185
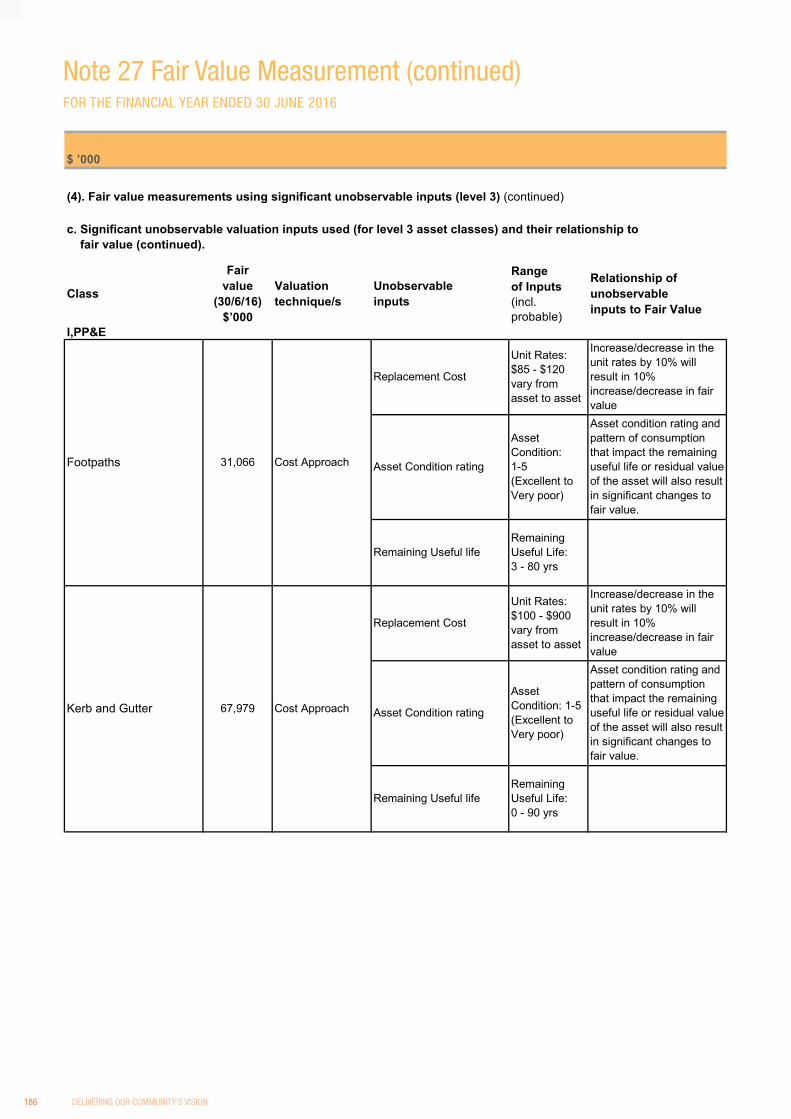
Financial Statements 2016
page 78
Ku-ring-gai Council
Notes to the Financial Statementsfor the year ended 30 June 2016
Note 27. Fair Value Measurement (continued)
$ ’000
(4). Fair value measurements using significant unobservable inputs (level 3) (continued)
c. Significant unobservable valuation inputs used (for level 3 asset classes) and their relationship to fair value (continued).
I,PP&E
Kerb and Gutter 67,979 Cost Approach
Replacement Cost
Unit Rates:$100 - $900vary from asset to asset
Increase/decrease in the unit rates by 10% will result in 10% increase/decrease in fair value
Asset Condition rating
Asset Condition: 1-5(Excellent to Very poor)
Footpaths 31,066 Cost Approach
Remaining Useful lifeRemaining Useful Life:3 - 80 yrs
Replacement Cost
Unit Rates:$85 - $120vary from asset to asset
Asset Condition rating
Asset Condition:1-5(Excellent to Very poor)
Fairvalue
(30/6/16)$’000
Valuationtechnique/s
Unobservableinputs
Rangeof Inputs(incl. probable)
Increase/decrease in the unit rates by 10% will result in 10% increase/decrease in fair valueAsset condition rating and pattern of consumption that impact the remaining useful life or residual value of the asset will also result in significant changes to fair value.
Relationship of unobservableinputs to Fair Value
Asset condition rating and pattern of consumption that impact the remaining useful life or residual value of the asset will also result in significant changes to fair value.
Remaining Useful lifeRemaining Useful Life:0 - 90 yrs
Class
Note 27 Fair Value Measurement (continued)FOR THE FINANCIAL YEAR ENDED 30 JUNE 2016
186 DELIVERING OUR COMMUNITY'S VISION

Financial Statements 2016
page 79
Ku-ring-gai Council
Notes to the Financial Statementsfor the year ended 30 June 2016
Note 27. Fair Value Measurement (continued)
$ ’000
(4). Fair value measurements using significant unobservable inputs (level 3) (continued)
c. Significant unobservable valuation inputs used (for level 3 asset classes) and their relationship to fair value (continued).
I,PP&E
Replacement Cost
Asset Condition rating
Asset Condition: 1-5(Excellent to Very poor)
Asset condition rating and pattern of consumption that impact the remaining useful life or residual value of the asset will also result in significant changes to fair value.
Replacement CostUnit Rates: vary from asset to asset
Increase/decrease in the unit rates by 10% will result in 10% increase/decrease in fair value
Unit Rates: vary from asset to asset
Increase/decrease in the unit rates by 10% will result in 10% increase/decrease in fair value
Road Structure andStreet Furniture 3,583 Cost Approach
Recreational Facilities 66,525
Remaining Useful Life:60 yrs
Swimming Pools 20,651 Cost Approach
Replacement Cost
Remaining Useful lifeRemaining Useful Life:18 - 90 yrs
Remaining Useful life
Unit Rates: vary from asset to asset
Asset Condition rating
Asset Condition: 1-5(Excellent to Very poor)
Cost Approach
Class
Fairvalue
(30/6/16)$’000
Valuationtechnique/s
Unobservableinputs
Rangeof Inputs(incl. probable)
Relationship of unobservableinputs to Fair Value
Asset condition rating and pattern of consumption that impact the remaining useful life or residual value of the asset will also result in significant changes to fair value.
Increase/decrease in the unit rates by 10% will result in 10% increase/decrease in fair value
Asset Condition rating
Asset Condition: 1-5(Excellent to Very poor)
Asset condition rating and pattern of consumption that impact the remaining useful life or residual value of the asset will also result in significant changes to fair value.
Remaining Useful lifeRemaining Useful Life:0 - 100 yrs
FINA
NC
IALS
Note 27 Fair Value Measurement (continued)FOR THE FINANCIAL YEAR ENDED 30 JUNE 2016
KU-RING-GAI COUNCIL ANNUAL REPORT 2015 - 2016 187

Financial Statements 2016
page 80
Ku-ring-gai Council
Notes to the Financial Statementsfor the year ended 30 June 2016
Note 27. Fair Value Measurement (continued)
$ ’000
(4). Fair value measurements using significant unobservable inputs (level 3) (continued)
c. Significant unobservable valuation inputs used (for level 3 asset classes) and their relationship to fair value (continued).
I,PP&E
Asset Condition rating
Asset Condition: 1-5(Excellent to Very poor)
Asset condition rating and pattern of consumption that impact the remaining useful life or residual value of the asset will also result in significant changes to fair value.
Remaining Useful life
BuildingsNon Specialised
Replacement CostUnit Rates: vary from asset to asset
Increase/decrease in the unit rates by 10% will result in 10% increase/decrease in fair value
Residual Value Residual Value: 0-5%
Operational Land 56,292 Market Value / Cost Approach
Total area (42,713m2)
Total Value of land ($49,810,000)
Unit Rates:$1 - $1170(per square metre)
Increase/decrease in the price per square metre will result in changes in fair value
Furniture and Fittings, Office Equipment and Plant and Equipment (e.g. Fleet and Small Plant)
193 Cost Approach
Replacement Cost
Class
Fairvalue
(30/6/16)$’000
Valuationtechnique/s
Unobservableinputs
Rangeof Inputs(incl. probable)
Components
ComponentsSuperstructureRoofFloorMechanicalFire
Remaining Useful Life:2 - 60yrs
48,142 Cost Approach
Relationship of unobservableinputs to Fair Value
Cost vary from asset to asset
Increase/decrease in the cost of the asset by 10% will result in 10% increase/decrease in fair value
Remaining Useful lifeRemaining Useful Life:0 - 10yrs
Asset condition rating and pattern of consumption that impact the remaining useful life or residual value of the asset will also result in significant changes to fair value.
Note 27 Fair Value Measurement (continued)FOR THE FINANCIAL YEAR ENDED 30 JUNE 2016
188 DELIVERING OUR COMMUNITY'S VISION

Financial Statements 2016
page 81
Ku-ring-gai Council
Notes to the Financial Statementsfor the year ended 30 June 2016
Note 27. Fair Value Measurement (continued)
$ ’000
(4). Fair value measurements using significant unobservable inputs (level 3) (continued)
c. Significant unobservable valuation inputs used (for level 3 asset classes) and their relationship to fair value (continued).
I,PP&E
(5). Highest and best use
All of Council’s non-financial assets are considered as being utilised for their highest and best use.
Class
Fairvalue
(30/6/16)$’000
Valuationtechnique/s
Relationship of unobservableinputs to Fair Value
Asset Condition ratingLibrary Books 2,807 Cost Approach
Replacement CostUnit Rates: vary from asset to asset
Increase/decrease in the cost of the asset by 10% will result in 10% increase/decrease in fair value
Residual ValueResidual Value:0% to 10%
Remaining Useful lifeRemaining Useful Life:0 - 10 yrs
Asset Condition: 1-5(Excellent to Very poor)
Asset condition rating and pattern of consumption that impact the remaining useful life or residual value of the asset will also result in significant changes to fair value.
Unobservableinputs
Rangeof Inputs(incl. probable)
FINA
NC
IALS
Note 27 Fair Value Measurement (continued)FOR THE FINANCIAL YEAR ENDED 30 JUNE 2016
KU-RING-GAI COUNCIL ANNUAL REPORT 2015 - 2016 189

Level 11 | 1 York Street | Sydney | NSW | 2000 GPO Box 4137 | Sydney | NSW | 2001
t: +61 2 9256 6600 | f: +61 2 9256 [email protected]
www.uhyhnsydney.com.au
An association of independent fi rms in Australia and New Zealand and a member of UHY International, a network of independent accounting and consulting fi rms.
UHY Haines Norton—ABN 85 140 758 156 NSWBN 98 133 826
Liability limited by a scheme approved under Professional Standards Legislation.
Passion beyond numbers
Ku-ring-gai Council General Purpose Financial Report
Independent Auditor’s Report We have audited the accompanying financial report of Ku-ring-gai Council (the Council), which comprises the statement of financial position as at 30 June 2016, the income statement, the statement of comprehensive income, the statement of changes in equity and the statement of cash flows for the year ended on that date, notes comprising a summary of significant accounting policies and other explanatory information, and the Statement by Councillors and Management in the approved form as required by Section 413(2) of the Local Government Act 1993. Councillor’s Responsibility for the Financial Report The Councillors of the Council are responsible for the preparation and fair presentation of the financial report in accordance with Australian Accounting Standards (including the Australian Accounting Interpretations) and the Local Government Act 1993 and for such internal controls as the Councillors determine are necessary to enable the preparation and fair presentation of the financial report that is free from material misstatement, whether due to fraud or error. Auditor’s Responsibility Our responsibility is to express an opinion on the financial report based on our audit. We conducted our audit in accordance with Australian Auditing Standards. Those standards require that we comply with the relevant ethical requirements relating to audit engagements and plan and perform the audit to obtain reasonable assurance whether the financial report is free from material misstatement. An audit involves performing procedures to obtain audit evidence about the amounts and disclosures in the financial report. The procedures selected depend on the auditor’s judgement, including the assessment of the risks of material misstatement of the financial report, whether due to fraud or error. In making those risk assessments, the auditor considers internal control relevant to the Council’s preparation and fair presentation of the financial report in order to design audit procedures that are appropriate in the circumstances, but not for the purpose of expressing an opinion on the effectiveness of the Council’s internal control. An audit also includes evaluating the appropriateness of accounting policies used and the reasonableness of accounting estimates made by Council, as well as evaluating the overall presentation of the financial report. Our audit responsibility does not extend to the original budget information disclosed in the income statement, statement of cash flows, original budget disclosures in Notes 2(a) and 16 and the Projects disclosed in Note 17 to the financial statements, nor the attached Special Schedules and accordingly, we express no opinion on them.
page 82
190 DELIVERING OUR COMMUNITY'S VISION

An association of independent fi rms in Australia and New Zealand and a member of UHY International, a network of independent accounting and consulting fi rms.
UHY Haines Norton—ABN 85 140 758 156 NSWBN 98 133 826
Liability limited by a scheme approved under Professional Standards Legislation.
Passion beyond numbers
We believe that the audit evidence we have obtained is sufficient and appropriate to provide a basis for our audit opinion. Auditor’s Opinion
In our opinion, (a) the Council’s accounting records have been kept in accordance with the requirements of
the Local Government Act 1993, Chapter 13 part 3 Division 2;
(b) the financial report:
(i) has been presented, in all material respects, in accordance with the requirements of this Division; (ii) is consistent with the Council’s accounting records; (iii) presents fairly, in all material respects, the Council’s financial position as at 30 June
2016 and the results of its operations and its cash flows for the year then ended in accordance with applicable Australian Accounting Standards;
(c) all information relevant to the conduct of the audit has been obtained; and (d) there are no material deficiencies in the accounting records or financial report that have
come to light during the course of the audit.
M.D. Nicholaeff UHY Haines Norton Partner Chartered Accountants Signed in Sydney on 20 September 2016
page 83
FINA
NC
IALS
KU-RING-GAI COUNCIL ANNUAL REPORT 2015 - 2016 191

Level 11 | 1 York Street | Sydney | NSW | 2000 GPO Box 4137 | Sydney | NSW | 2001
t: +61 2 9256 6600 | f: +61 2 9256 [email protected]
www.uhyhnsydney.com.au
An association of independent fi rms in Australia and New Zealand and a member of UHY International, a network of independent accounting and consulting fi rms.
UHY Haines Norton—ABN 85 140 758 156 NSWBN 98 133 826
Liability limited by a scheme approved under Professional Standards Legislation.
Passion beyond numbers
20 September 2016 The Mayor Ku-ring-gai Council 818 Pacific Highway GORDON NSW 2072 Dear Mayor,
Report on the Conduct of the Audit Year Ended 30 June 2016
We are pleased to advise completion of our audit of the General and Special Purpose Financial Statements for Ku-ring-gai Council for the year ended 30 June 2016, in accordance with Section 415 of the Local Government Act, 1993 (“the Act”); and that our audit opinion provided under Section 417(2) of the Act has been issued to Council. The following report on the conduct of the audit is issued in compliance with Section 417(3) of the Act. The Councillors and Council Management are responsible for the preparation and true and fair presentation of the financial reports, which includes responsibility for the maintenance of adequate accounting records and internal controls that are designed to prevent and detect fraud and error, and for the accounting policies and accounting estimates inherent in the financial reports. While we considered the effectiveness of management’s internal controls over financial reporting when determining the nature and extent of our procedures, our audit was not designed to provide assurance on internal controls. We have conducted our audit in accordance with Australian Auditing Standards in order to provide reasonable assurance as to whether the Council’s financial reports are free of material misstatement. An audit is influenced by factors such as professional judgement, selective testing, the inherent limitations of internal control and the availability of persuasive rather than conclusive evidence. Therefore, an audit cannot guarantee that all material misstatements have been detected. We have reviewed that the accounts have been prepared in accordance with Australian equivalents to International Financial Reporting Standards (AIFRS) and the Local Government Code of Accounting Practice and Financial Reporting. We offer the following comments on the financial statements and the audit:
page 84
192 DELIVERING OUR COMMUNITY'S VISION

An association of independent fi rms in Australia and New Zealand and a member of UHY International, a network of independent accounting and consulting fi rms.
UHY Haines Norton—ABN 85 140 758 156 NSWBN 98 133 826
Liability limited by a scheme approved under Professional Standards Legislation.
Passion beyond numbers
STATEMENT OF COMPREHENSIVE INCOME MOVEMENT IN RESULTS OVER PRIOR YEAR Council’s Net Operating Result before Grants and Contributions provided for capital purposes indicates a surplus of $6.820 million for the year ended 30 June 2016 compared to a surplus of $13.460 million for the year ended 30 June 2015. The Net Operating Result after Grants and Contributions for capital purposes has increased by $19.384 million to a surplus of $41.971 million (2015: surplus of $22.586 million). Commentary on the major movements within the income and expense categories within the income statement is detailed below: MOVEMENT IN REVENUE ITEMS 2015-2016
2016 2015 Increase
(Decrease)
$'000 $'000 $'000Rates and Annual Charges 78,537 76,370 2,167User Charges and Fees 18,003 13,683 4,320Grants & Contributions Provided for Operating Purposes 8,295 7,728 567
Grants & Contributions Provided for Capital Purposes 35,151 9,126 26,025Net Gains from the Disposal of Assets - 12,852 (12,852)
RATES AND ANNUAL CHARGES Rates and annual charges have increased by $2.167 million (3%). The increase in rate income is in line with the permissible rate increase granted by the Minister for Local Government and in line with the changes to supplementary valuations in the Ku-ring-gai area. USER CHARGES AND FEES User fees & charges have increased this year by $4.320 million (32%).This increase is as a result of the full year income received from Council’s Fitness and Aquatic Centre which officially opened in October 2014. There were notable increases also in fees and charges for building regulations, golf courses and restoration charges. GRANTS AND CONTRIBUTIONS PROVIDED FOR OPERATING PURPOSES Grants and contributions provided for operating purposes has increased by $0.567 million (7.3%) to $8.295 million. The increase was largely due to the full receipt of the Transport Grant.
page 85
FINA
NC
IALS
KU-RING-GAI COUNCIL ANNUAL REPORT 2015 - 2016 193

An association of independent fi rms in Australia and New Zealand and a member of UHY International, a network of independent accounting and consulting fi rms.
UHY Haines Norton—ABN 85 140 758 156 NSWBN 98 133 826
Liability limited by a scheme approved under Professional Standards Legislation.
Passion beyond numbers
GRANTS AND CONTRIBUTIONS PROVIDED FOR CAPITAL PURPOSES Grants and contributions provided for capital purposes has increased by $26.025 million (285%) to $35.151 million. The main reason for the increase in Capital Grant income is due to increased Section 94 contributions from developers. NET GAINS FROM THE DISPOSAL OF ASSETS Net gains from the disposal of assets is nil in 2016 compared to $12.852 million. The prior year balance relates to the sale of the Culworth Avenue carpark and twenty-four (24) lots from the B2 Land Subdivision project with the NSW Department of Planning. MOVEMENT IN EXPENSE ITEMS 2015-2016
2016 2015 Increase
(Decrease)
$'000 $'000 $'000Employee Benefits and On-costs 37,447 36,127 1,320Materials and Contracts 39,539 38,390 1,149Depreciation and Amortisation 19,476 19,349 127Other Expenses 16,242 15,306 936
EMPLOYEE BENEFITS & ON-COSTS Employee benefits and on-costs expense has increased by $1.320 million (4%) to $37.447 million. The increase is broadly consistent with the increases to the award. MATERIALS AND CONTRACTS Materials and contracts expense has increased by $1.149 million (3%) to $39.539 million. The increase can mainly be attributed to various contractor expenses and consultancy costs. DEPRECIATION AND AMORTISATION Depreciation and amortisation expense has increased by $127,000 (0.7%) to $19.476 million. The increase was due to the recognition of additional assets recognised in the infrastructure asset class. OTHER EXPENSES Other expenses have increased by $936,000 (6%) to $16.242 million. This was largely a result of increased costs for contributions/levies to other levels of government, insurance, telephone and communications and computer software charges.
page 86
194 DELIVERING OUR COMMUNITY'S VISION
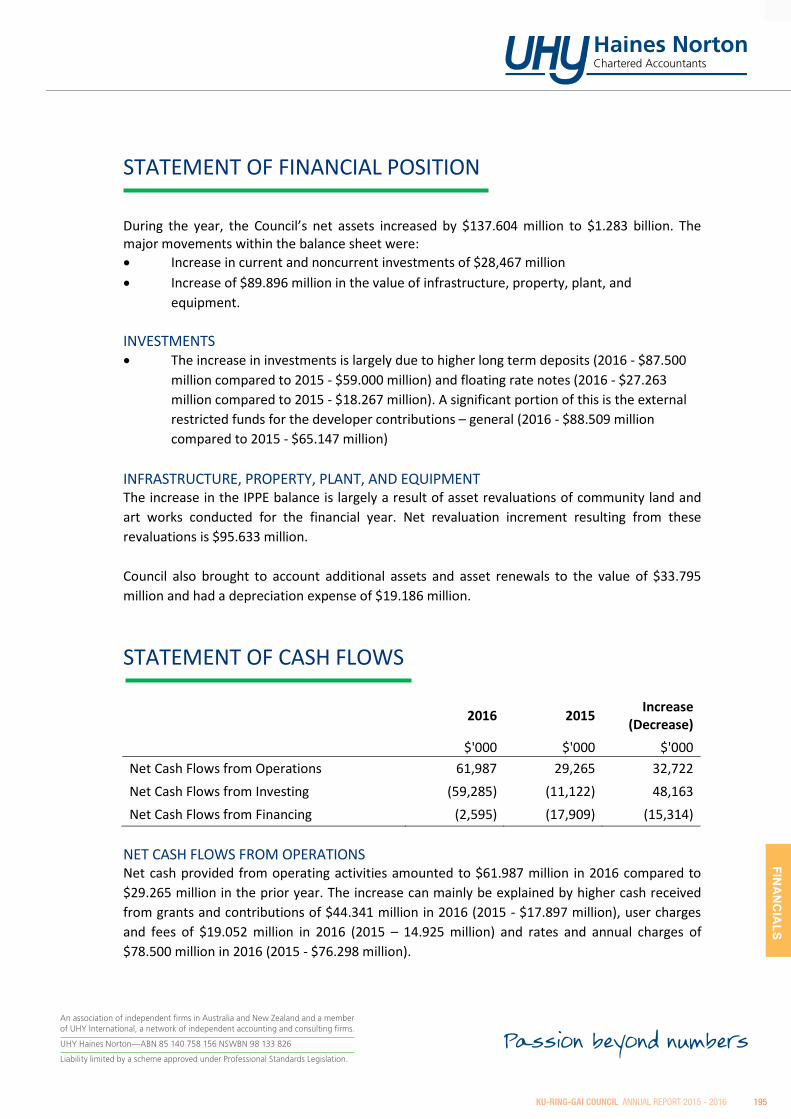
An association of independent fi rms in Australia and New Zealand and a member of UHY International, a network of independent accounting and consulting fi rms.
UHY Haines Norton—ABN 85 140 758 156 NSWBN 98 133 826
Liability limited by a scheme approved under Professional Standards Legislation.
Passion beyond numbers
STATEMENT OF FINANCIAL POSITION During the year, the Council’s net assets increased by $137.604 million to $1.283 billion. The major movements within the balance sheet were: • Increase in current and noncurrent investments of $28,467 million • Increase of $89.896 million in the value of infrastructure, property, plant, and
equipment. INVESTMENTS • The increase in investments is largely due to higher long term deposits (2016 - $87.500
million compared to 2015 - $59.000 million) and floating rate notes (2016 - $27.263 million compared to 2015 - $18.267 million). A significant portion of this is the external restricted funds for the developer contributions – general (2016 - $88.509 million compared to 2015 - $65.147 million)
INFRASTRUCTURE, PROPERTY, PLANT, AND EQUIPMENT The increase in the IPPE balance is largely a result of asset revaluations of community land and art works conducted for the financial year. Net revaluation increment resulting from these revaluations is $95.633 million.
Council also brought to account additional assets and asset renewals to the value of $33.795 million and had a depreciation expense of $19.186 million.
STATEMENT OF CASH FLOWS
2016 2015 Increase
(Decrease) $'000 $'000 $'000Net Cash Flows from Operations 61,987 29,265 32,722 Net Cash Flows from Investing (59,285) (11,122) 48,163 Net Cash Flows from Financing (2,595) (17,909) (15,314)
NET CASH FLOWS FROM OPERATIONS Net cash provided from operating activities amounted to $61.987 million in 2016 compared to $29.265 million in the prior year. The increase can mainly be explained by higher cash received from grants and contributions of $44.341 million in 2016 (2015 - $17.897 million), user charges and fees of $19.052 million in 2016 (2015 – 14.925 million) and rates and annual charges of $78.500 million in 2016 (2015 - $76.298 million).
page 87
FINA
NC
IALS
KU-RING-GAI COUNCIL ANNUAL REPORT 2015 - 2016 195

An association of independent fi rms in Australia and New Zealand and a member of UHY International, a network of independent accounting and consulting fi rms.
UHY Haines Norton—ABN 85 140 758 156 NSWBN 98 133 826
Liability limited by a scheme approved under Professional Standards Legislation.
Passion beyond numbers
NET CASH FLOWS FROM INVESTING Net cash used in investing activities amounted to $59.285 million for the year ended 30 June 2016 compared to $11.122 million for the prior year. This is largely due to net cash outflows for the sale and purchase of investment securities of $28.506 million in 2016 (2015 - $4.597 million) and net purchase of infrastructure, plant and equipment of $31.555 million (2015 - $19.132 million). NET CASH FLOWS FROM FINANCING Net cash used in financing activities amount to $2.595 million for the year ended 30 June 2016 compared to $17.909 million in 2015. The current year cash outflows relate to the net repayment of borrowings while the prior year balance can be attributed to the voluntary repayment of the loan associated with the Council Administration Building and repayment of other loans of $18.192 million offset by loan proceeds of $283,000.
TOTAL INVESTMENTS AND CASH BALANCES
2016 2015 Increase
(Decrease)
$'000 $'000 $'000Externally Restricted Cash 98,769 73,554 25,215Internally Restricted Cash 23,256 20,701 2,555Unrestricted Cash 3,833 3,029 804 Total Cash, Cash Equivalents and Investments 125,858 97,284 28,574
EXTERNALLY RESTRICTED CASH Externally restricted cash and investments are restricted in their use by externally imposed requirements. The movement in externally restricted cash balances included the net increase of $23.262 million in developer contributions – general and $2.930 million domestic waste management. INTERNALLY RESTRICTED CASH Internally restricted cash and investments have been restricted in their use by resolution or policy of Council to reflect identified programs of works and any forward plans identified by Council. The movement in internally restricted cash balances included the net increase of $850,000 in infrastructure and facilities and $825,000 in carry over works. UNRESTRICTED CASH Unrestricted cash and investments are those funds available to provide liquidity for day to day operations.
page 88
196 DELIVERING OUR COMMUNITY'S VISION

An association of independent fi rms in Australia and New Zealand and a member of UHY International, a network of independent accounting and consulting fi rms.
UHY Haines Norton—ABN 85 140 758 156 NSWBN 98 133 826
Liability limited by a scheme approved under Professional Standards Legislation.
Passion beyond numbers
WORKING CAPITAL (NET CURRENT ASSETS)
2016 2015 Increase
(Decrease)
$'000 $'000 $'000Current Assets 68,108 45,686 22,422
Current Liabilities (24,608) (23,445) (1,163)
Net Current Assets 43,500 22,241 21,259
Add: Current Liabilities not anticipated to be settled within the next 12 months
10,039 9,696 343
Adjusted Net Current Assets 53,539 31,937 21,602
Add: Current Liabilities expected to be settled within the next 12 months
- Borrowings 1,584 2,536 (952)
- Provisions 3,244 3,090 154
- Security Bonds, Deposits and Retentions 100 135 (35)
Less: Externally Restricted Assets (30,515) (11,280) (19,235)
Less: Internally Restricted Assets including Current Assets Classified as Held for Sale
(23,256) (21,741) (1,515)
Working Capital as at 30 June 4,696 4,677 19 Council’s balance of working capital has had a slight increase of $19 thousand to $4.696 million for the 2016 financial year.
PERFORMANCE INDICATORS AND TRENDS Our comments in regard to Council’s performance for the 2016 year are based on those performance indicators that are considered meaningful. The indicators we have reviewed are as follows:
2016 2015
Unrestricted Current Ratio 2.58 : 1 2.50 : 1 Debt Service Cover Ratio 6.58 : 1 1.09 : 1 Operating Performance Ratio 5.98% 0.55% Own Source Operating Revenue Ratio 72.15% 86.01% Rates and Annual Charges Outstanding Percentage 3.16% 3.18% Cash Expense Cover Ratio 10.51 6.08
page 89
FINA
NC
IALS
KU-RING-GAI COUNCIL ANNUAL REPORT 2015 - 2016 197

An association of independent fi rms in Australia and New Zealand and a member of UHY International, a network of independent accounting and consulting fi rms.
UHY Haines Norton—ABN 85 140 758 156 NSWBN 98 133 826
Liability limited by a scheme approved under Professional Standards Legislation.
Passion beyond numbers
UNRESTRICTED CURRENT RATIO The unrestricted current ratio is used to assess the adequacy of available current assets and Council’s ability to satisfy its obligations in the short term after taking into account any external restrictions over the use of the current assets. The ratio of 2.58 has increased from the prior year’s ratio of 2.50 and this is an indicator of Council’s ability to effectively meet their current liabilities. DEBT SERVICE COVER RATIO At 30 June 2016 Council had outstanding borrowings of $23.298 million compared with $26.523 million as at 30 June 2015. The debt service cover ratio measures the availability of operating cash to service debt repayments. For the 2016 financial year the ratio indicated that operating results before capital, interest, depreciation and amortisation covered payments required to service debt by 6.58 to 1. The ratio has increased mainly due to lower payments for borrowings during the year compared to last year. OPERATING PERFORMANCE RATIO This ratio is measures Council’s ability to contain operating expenditure within its operating revenue, excluding capital grants and contributions. For the 2016 financial year, this indicator was 5.98%, which exceeded the benchmark of 0%. OWN SOURCE OPERATING REVENUE RATIO The own source operating revenue ratio measures Council’s fiscal flexibility and their degree of reliance on external funding sources such as grants and contributions. For the 2016 financial year, this indicator was 72.15% and exceeded the benchmark of 60%. RATES AND ANNUAL CHARGES OUTSTANDING PERCENTAGE The rates and annual charges outstanding percentage is used to assess the impact of uncollected rates and annual charges on liquidity and the adequacy of debt recovery efforts. The percentage of rates and annual charges outstanding has decreased from 3.18% to 3.16% in the current year. This indicates that debtors are being collected at a faster rate than in the prior year. CASH EXPENSE COVER RATIO This liquidity ratio indicates the number of months that Council can continue to pay its immediate expenditure items with available cash and term deposit balances, without the need for additional cash inflow. For 2016, this ratio stood at 10.51 months compared to the benchmark of greater than 3 months.
page 90
198 DELIVERING OUR COMMUNITY'S VISION
An association of independent fi rms in Australia and New Zealand and a member of UHY International, a network of independent accounting and consulting fi rms.
UHY Haines Norton—ABN 85 140 758 156 NSWBN 98 133 826
Liability limited by a scheme approved under Professional Standards Legislation.
Passion beyond numbers
REPORTING TO MANAGEMENT A management letter highlighting matters arising from our interim audit has been prepared and issued where considered necessary or appropriate. Matters raised in the letter included suggestions for improvement and management’s comments and proposed actions. We wish to record our appreciation to your General Manager, Director Corporate, Finance Manager and their staff for the co-operation and courtesy extended to us during the course of our audit and commend their efforts in the early completion of the financial reports.
M.D. Nicholaeff UHY Haines Norton Partner Chartered Accountants Signed at Sydney on 20 September 2016
page 91
FINA
NC
IALS
KU-RING-GAI COUNCIL ANNUAL REPORT 2015 - 2016 199

1. Statement by Councillors and Management ...............................................................................................................201
2. Special Purpose Financial Statements:
- Income Statement of Other Business Activities ..........................................................................................................202
- Statement of Financial Position - Other Business Activities .......................................................................................207
3. Notes to the Special Purpose Financial Statements ..................................................................................................213
4. Auditor's Report ..............................................................................................................................................................215
Contents
SPECIAL PURPOSE FINANCIAL STATEMENTS
SPFS 2016
page 1
Ku-ring-gai Council
Special Purpose Financial Statementsfor the year ended 30 June 2016
Contents
1. Statement by Councillors and Management
2. Special Purpose Financial Statements:
Income Statement – Other Business Activities
Statement of Financial Position – Other Business Activities
3. Notes to the Special Purpose Financial Statements
4. Auditor’s Report
Background
These Special Purpose Financial Statements have been prepared for the use by both Council and the Office ofLocal Government in fulfilling their requirements under National Competition Policy.
The principle of competitive neutrality is based on the concept of a ‘level playing field’ between persons/entitiescompeting in a market place, particularly between private and public sector competitors.
Essentially, the principle is that government businesses, whether Commonwealth, state or local, should operatewithout net competitive advantages over other businesses as a result of their public ownership.
For Council, the principle of competitive neutrality and public reporting applies only to declared business activities.
These include (a) those activities classified by the Australian Bureau of Statistics as business activities beingwater supply, sewerage services, abattoirs, gas production and reticulation, (b) those activities with a turnoverof more than $2 million that Council has formally declared as a business activity (defined as Category 1 activities), and (c ) those activities with a turnover of less than $2 million that Council has formally declared as a Business Activity (defined as Category 2 activities).
In preparing these financial statements for Council’s self-classified Category 1 businesses and ABS-definedactivities, councils must (a) adopt a corporatisation model and (b) apply full cost attribution including tax-equivalentregime payments and debt guarantee fees (where the business benefits from Council's borrowing position bycomparison with commercial rates).
Page
3
2
(iv)
14
8
(i)
(ii)
17
(iii)
FOR THE FINANCIAL YEAR ENDED 30 JUNE 2016
200 DELIVERING OUR COMMUNITY'S VISION

Statement by Councillors and Management
FOR THE FINANCIAL YEAR ENDED 30 JUNE 2016
MADE PURSUANT TO THE LOCAL GOVERNMENT CODE OF ACCOUNTING PRACTICE AND FINANCIAL REPORTING
FINA
NC
IALS
KU-RING-GAI COUNCIL ANNUAL REPORT 2015 - 2016 201

Income Statement of Council's Other Business ActivitiesFOR THE FINANCIAL YEAR ENDED 30 JUNE 2016
SPFS 2016
page 3
Ku-ring-gai Council
Income Statement of Council's Other Business Activitiesfor the year ended 30 June 2016
$ ’000
Income from continuing operationsUser chargesGrants and contributions provided for non-capital purposes
Total income from continuing operations
Expenses from continuing operationsEmployee benefits and on-costsMaterials and contractsDepreciation and impairmentOther expenses
Total expenses from continuing operations
Surplus (deficit) from continuing operations before capital amounts
Less: corporate taxation equivalent (30%) [based on result before capital]
SURPLUS (DEFICIT) AFTER TAX
Plus opening retained profitsPlus adjustments for amounts unpaid:– Corporate taxation equivalentAdd:– Subsidy paid/contribution to operationsLess:– Dividend paid
Closing retained profits
Return on capital %Subsidy from Council
Actual
452
648
5046
706
–
(124)(72)
12.2%
516
(190) (196)
554
986
22.5%
Thomas Carlyle Childrens Centre Art Centre
968
–
–
820
2016Actual
2015Actual Actual
20152016
––
452
1,111385
1,047127
516
384
1,01143
523
3223
113
18147 81
25
1,257
76
1,370
66
220
820
1,496
154
(66)
1,276
84
–
79
(34)
–
(196)
––
–34
544–
3,8474,196831
(190)
-4.5%
4,006
-4.6%329
4,195
279
––
202 DELIVERING OUR COMMUNITY'S VISION

Income Statement of Council's Other Business ActivitiesFOR THE FINANCIAL YEAR ENDED 30 JUNE 2016
SPFS 2016
page 4
Ku-ring-gai Council
Income Statement of Council's Other Business Activitiesfor the year ended 30 June 2016
$ ’000
Income from continuing operationsUser chargesOther income
Total income from continuing operations
Expenses from continuing operationsEmployee benefits and on-costsMaterials and contractsDepreciation and impairmentOther expenses
Total expenses from continuing operations
Surplus (deficit) from continuing operations before capital amounts
Less: corporate taxation equivalent (30%) [based on result before capital]
SURPLUS (DEFICIT) AFTER TAX
Plus opening retained profitsPlus adjustments for amounts unpaid:– Corporate taxation equivalentAdd:– Subsidy paid/contribution to operationsLess:– Dividend paid
Closing retained profits
Return on capital %Subsidy from Council
-5.3%
129
758
2,187
371
6,292
549n/a n/a -7.7%
–
9061,150
(592) (348)
– –
–
(185)
(175)
––
(592)
6,073
558
– –
124161
2016
1,671
2015Actual
1,779
Trade Waste
Actual
558
2015Actual Actual
558
2016
Gordon Golf Course
118
274421,475 286
375
87
43
5581,763
92
347
1,866
1,203
–
(74)
–
185 74
432
(335)
245
1,249 1,518
3
617
1
172
7,668
(405)
–
(348)
6,073
– –
–
(512)
(230) (335)
FINA
NC
IALS
KU-RING-GAI COUNCIL ANNUAL REPORT 2015 - 2016 203

SPFS 2016
page 5
Ku-ring-gai Council
Income Statement of Council's Other Business Activitiesfor the year ended 30 June 2016
$ ’000
Income from continuing operationsUser charges
Total income from continuing operations
Expenses from continuing operationsEmployee benefits and on-costsMaterials and contractsDepreciation and impairmentOther expenses
Total expenses from continuing operations
Surplus (deficit) from continuing operations before capital amounts
SURPLUS (DEFICIT) AFTER TAX
Plus opening retained profitsAdd:– Subsidy paid/contribution to operationsLess:– Dividend paid
Closing retained profits
Return on capital %Subsidy from Council
1,218 1,019
223 191
(510)
855
14,342
(377)
5,993
(336)
5,381
18,013 17,668
-2.8% -4.0%432
-7.6% -7.0%
4,051
(641) (235)
17,668
– –
– –
543
639
(336) (377)
658
26
675
26233 242 612
2
298
344
322294
321418 265 18 8
(510)
2016
294 298322708
2015
Tennis Courts
2015Actual Actual Actual Actual
(725)
2016
708
Turramurra Golf Course
2
(725)
5,3814,404
903 1,288
Income Statement of Council's Other Business Activities FOR THE FINANCIAL YEAR ENDED 30 JUNE 2016
204 DELIVERING OUR COMMUNITY'S VISION

SPFS 2016
page 6
Ku-ring-gai Council
Income Statement of Council's Other Business Activitiesfor the year ended 30 June 2016
$ ’000
Income from continuing operationsUser chargesOther income
Total income from continuing operations
Expenses from continuing operationsEmployee benefits and on-costsMaterials and contractsDepreciation and impairmentOther expenses
Total expenses from continuing operations
Surplus (deficit) from continuing operations before capital amounts
SURPLUS (DEFICIT) AFTER TAX
Plus opening retained profitsAdd:– Subsidy paid/contribution to operations
Closing retained profits
Return on capital %Subsidy from Council 163
32
1,789-522.6%
125
-1.3% -5.9%
1,152
3,413
384
207
(162)
167
811
11
4,008
19,755
16,926
(1,179)
19,755
1211
69
(162)
(127)
142––
2,234 45
2015Actual
2016Actual
42
(1,179)
20152016
720
332,2344,197
Nursery
41
Swimming Pool
Actual Actual
(272)
395
4,469
– –
2,404374 625
4,197
3,700
(272)
20,635
137
40
69
74
130
83
(127)
-135.1%
113
FINA
NC
IALS
Income Statement of Council's Other Business Activities FOR THE FINANCIAL YEAR ENDED 30 JUNE 2016
KU-RING-GAI COUNCIL ANNUAL REPORT 2015 - 2016 205

SPFS 2016
page 7
Ku-ring-gai Council
Income Statement of Council's Other Business Activitiesfor the year ended 30 June 2016
$ ’000
Income from continuing operationsUser chargesOther income
Total income from continuing operations
Expenses from continuing operationsEmployee benefits and on-costsMaterials and contractsDepreciation and impairmentOther expenses
Total expenses from continuing operations
Surplus (deficit) from continuing operations before capital amounts
Less: corporate taxation equivalent (30%) [based on result before capital]
SURPLUS (DEFICIT) AFTER TAX
Plus opening retained profitsPlus adjustments for amounts unpaid:– Corporate taxation equivalentAdd:– Subsidy paid/contribution to operations
Closing retained profits
Return on capital %Subsidy from Council
Commercial Leasing
2016 2015Actual
198 195
2,063 1,653
208 1581,855
456 565636 504
450 84
1,613 1,569
323 305
(135) (25)
315
21,036
25
272
21,392
5730.4%
21,39222,081
2.0%28
135
239
Actual
59
1,495
Income Statement of Council's Other Business Activities FOR THE FINANCIAL YEAR ENDED 30 JUNE 2016
206 DELIVERING OUR COMMUNITY'S VISION

Statement of Financial Position - Council's Other Business Activities
SPFS 2016
page 8
Ku-ring-gai Council
Statement of Financial Position – Council's Other Business Activities as at 30 June 2016
$ ’000
ASSETSCurrent assetsCash and cash equivalentsInvestmentsReceivablesInventoriesOtherNon-current assets classified as held for sale
Total Current Assets
Non-current assetsInvestmentsReceivablesInventoriesInfrastructure, property, plant and equipmentInvestments accounted for using equity methodIntangible assetsOther
Total non-current assets
TOTAL ASSETS
LIABILITIESCurrent liabilitiesBank overdraftPayablesBorrowingsProvisions
Total current liabilities
Non-current liabilitiesPayablesBorrowingsProvisionsOther Liabilities
Total non-current liabilities
TOTAL LIABILITIES
NET ASSETS
EQUITYRetained earningsRevaluation reserves
TOTAL EQUITY
– – – ––
–
–
–
–977
–
–
–
25
–
–
––
Actual 2016
– –
–
–
––
19
–
–
130
4,195
–
16
––––
130
4,325
–
Actual
––
–
114
–
4,323
2
–
–34
924977
1,002
–
70
–
–
–
116
820
–
824968
19
–
4,323
–
–
–
––
–
2
4,122
–
–
–
924
943
– – –4,122
––
4,006
–
Thomas CarlyleChildrens Centre
–
–
34
–
–
–
Actual
–25
Art Centre
–
2016
–
2015
–
Actual 2015
824
4,122
968
968
4
–
–
–
–
–
119
–
34
–
4,006
–
119
49
–
4,1954,006
–
116
–
116
––
4,195
FINA
NC
IALS
FOR THE FINANCIAL YEAR ENDED 30 JUNE 2016
KU-RING-GAI COUNCIL ANNUAL REPORT 2015 - 2016 207

SPFS 2016
page 9
Ku-ring-gai Council
Statement of Financial Position – Council's Other Business Activities as at 30 June 2016
$ ’000
ASSETSCurrent assetsCash and cash equivalentsInvestmentsReceivablesInventoriesOtherNon-current assets classified as held for sale
Total Current Assets
Non-current assetsInvestmentsReceivablesInventoriesInfrastructure, property, plant and equipmentInvestments accounted for using equity methodIntangible assetsOther
Total non-current assets
TOTAL ASSETS
LIABILITIESCurrent liabilitiesBank overdraftPayablesBorrowingsProvisions
Total current liabilities
Non-current liabilitiesPayablesBorrowingsProvisionsOther Liabilities
Total non-current liabilities
TOTAL LIABILITIES
NET ASSETS
EQUITYRetained earningsRevaluation reserves
TOTAL EQUITY
– – – –
6,562
–
–
–
6,073441
6,514
–
7,670
–
–
– –
– –
–
–
Actual Actual
–
–
–
––
Gordon Golf Course
–––
––
Actual
–
Actual 2016 2015
–
Trade Waste
–
2015
6,562
–––
–
–
–
––
––
– –
–
110 195
–
– –120 140
– – 7,670
–
–
– – – –
2016
–7,670
–
6,562
–
––
––
–
– –
–– –
–– –
12
––
– ––
– ––
48
– –– 47
2335230
–
230
(230)
–
48
(230) (335)
––
2335
7,668
7,668(335)–
6,514(335) 7,668(230)
– – – –
Statement of Financial Position - Council's Other Business ActivitiesFOR THE FINANCIAL YEAR ENDED 30 JUNE 2016
208 DELIVERING OUR COMMUNITY'S VISION

SPFS 2016
page 10
Ku-ring-gai Council
Statement of Financial Position – Council's Other Business Activities as at 30 June 2016
$ ’000
ASSETSCurrent assetsCash and cash equivalentsInvestmentsReceivablesInventoriesOtherNon-current assets classified as held for sale
Total Current Assets
Non-current assetsInvestmentsReceivablesInventoriesInfrastructure, property, plant and equipmentInvestments accounted for using equity methodIntangible assetsOther
Total non-current assets
TOTAL ASSETS
LIABILITIESCurrent liabilitiesBank overdraftPayablesBorrowingsProvisions
Total current liabilities
Non-current liabilitiesPayablesBorrowingsProvisionsOther Liabilities
Total non-current liabilities
TOTAL LIABILITIES
NET ASSETS
EQUITYRetained earningsRevaluation reserves
TOTAL EQUITY
– – – –
–
2015Actual Actual
– –– –– –
– –
– –
– –– 27 – –
2016Actual Actual
Tennis CourtsTurramurra Golf Course
– – –
2016 2015
– – – –– – – –– –
– –
– 27
– –
– –
– –
18,113 18,330
18,113 18,357 4,407 5,396
4,407 5,396
– –18,113 18,330 4,407 5,396
– – –– – –
–
–
100 107 3 15
100 107 – –
3 15– – – –– –
– –
3 15100 107
18,013 18,250
– –– 58218,013 17,668 4,404 5,381
–
4,404 5,381
– – – –
– –
–– –
4,404 5,38118,25018,013
– –
– –
– –
– –
– –
Statement of Financial Position - Council's Other Business Activities
FINA
NC
IALS
FOR THE FINANCIAL YEAR ENDED 30 JUNE 2016
KU-RING-GAI COUNCIL ANNUAL REPORT 2015 - 2016 209

SPFS 2016
page 11
Ku-ring-gai Council
Statement of Financial Position – Council's Other Business Activities as at 30 June 2016
$ ’000
ASSETSCurrent assetsCash and cash equivalentsInvestmentsReceivablesInventoriesOtherNon-current assets classified as held for sale
Total Current Assets
Non-current assetsInvestmentsReceivablesInventoriesInfrastructure, property, plant and equipmentInvestments accounted for using equity methodIntangible assetsOther
Total non-current assets
TOTAL ASSETS
LIABILITIESCurrent liabilitiesBank overdraftPayablesBorrowingsProvisions
Total current liabilities
Non-current liabilitiesPayablesBorrowingsProvisionsOther Liabilities
Total non-current liabilities
TOTAL LIABILITIES
NET ASSETS
EQUITYRetained earningsRevaluation reserves
TOTAL EQUITY
– – – –
20,635 19,821 32 73
– 4
– –– –
– – – –
– – – –
16 321
– 6620,635 19,755
20,635 19,821
– 21
32 69
32 73
– – – –– – – 21
16 321 – 21
– – – –– – – –
– – – –
20,651 19,880 31 94
20,651 20,142 32 94
16 321 – –– –
– –– – – –– – – –
20,651 19,880 31 94– – – –
Nursery
Actual Actual Actual Actual
Swimming Pool
2016 2015
–– – – –
– – –
– 262
– –
2016 2015
– 262 1 –– – –
– – – –
–
1 –
– –
– –
– –
Statement of Financial Position - Council's Other Business ActivitiesFOR THE FINANCIAL YEAR ENDED 30 JUNE 2016
210 DELIVERING OUR COMMUNITY'S VISION

SPFS 2016
page 12
Ku-ring-gai Council
Statement of Financial Position – Council's Other Business Activities as at 30 June 2016
$ ’000
ASSETSCurrent assetsCash and cash equivalentsInvestmentsReceivablesInventoriesOtherNon-current assets classified as held for sale
Total Current Assets
Non-current assetsInvestmentsReceivablesInventoriesInfrastructure, property, plant and equipmentInvestments accounted for using equity methodIntangible assetsOther
Total non-current assets
TOTAL ASSETS
LIABILITIESCurrent liabilitiesBank overdraftPayablesBorrowingsProvisions
Total current liabilities
Non-current liabilitiesPayablesBorrowingsProvisionsOther Liabilities
Total non-current liabilities
TOTAL LIABILITIES
NET ASSETS
EQUITYRetained earningsRevaluation reserves
TOTAL EQUITY
Actual Actual
– –
Commercial Leasing
2016 2015
– –
37 37– –
– –
22,046 21,394– –
– –
– –
37 37
– –
22,046 21,394
22,083 21,431
– –
– –– –
– –
2 39
– 36– –2 3
2 39
– –
– –– –– –
– –
22,081 21,392
22,081 21,392
22,081 21,392
– –
Statement of Financial Position - Council's Other Business Activities
FINA
NC
IALS
FOR THE FINANCIAL YEAR ENDED 30 JUNE 2016
KU-RING-GAI COUNCIL ANNUAL REPORT 2015 - 2016 211

1. Summary of Significant Accounting Policies .......................................................................................................................213
Contents
SPECIAL PURPOSE FINANCIAL STATEMENTSFOR THE FINANCIAL YEAR ENDED 30 JUNE 2016
212 DELIVERING OUR COMMUNITY'S VISION

SPFS 2016_
Ku-ring-gai Council
Notes to the Special Purpose Financial Statementsfor the year ended 30 June 2016
Note 1. Summary of Significant Accounting Policies
page 14
These financial statements are a Special Purpose Financial Statements (SPFS) prepared for use by Council and the Office of Local Government.
For the purposes of these statements, the Council is not a reporting not-for-profit entity.
The figures presented in the SPFS, unless otherwise stated, have been prepared in accordance with:
the recognition and measurement criteria of relevant Australian Accounting Standards,
other authoritative pronouncements of the Australian Accounting Standards Board (AASB), and
Australian Accounting Interpretations.
The disclosures in the SPFS have been prepared in accordance with:
the Local Government Act (1993) NSW,
the Local Government (General) Regulation, and
the Local Government Code of Accounting Practice and Financial Reporting.
The statements are also prepared on an accruals basis, based on historic costs and do not take into account changing money values nor current values of non-current assets (except where specifically stated).
Certain taxes and other costs (appropriately described) have been imputed for the purposes of the National Competition Policy.
National Competition Policy
Council has adopted the principle of ‘competitive neutrality’ to its business activities as part of the national competition policy which is being applied throughout Australia at all levels of government.
The framework for its application is set out in the June 1996 government policy statement, “Application of National Competition Policy to Local Government”.
The “Pricing and Costing for Council Businesses, A Guide to Competitive Neutrality”, issued by the Office of Local Government in July 1997, has also been adopted.
The pricing and costing guidelines outline the process for identifying and allocating costs to activities and provide standards for disclosure. These disclosures are reflected in Council’s pricing and/or financial reporting systems and include taxation equivalents, Council subsidies, return on investments (rate of return), and dividends paid.
Declared business activities
In accordance with Pricing and Costing for Council Businesses – A Guide to Competitive Neutrality, Council has declared that the following are to be considered as business activities:
Category 1
(where gross operating turnover is over $2 million)
a. Swimming Pool Comprising the whole of the operations and assets of Councils Swimming Pool
Category 2
(where gross operating turnover is less than $2 million)
a. Thomas Carlyle Children Centre Comprising the whole of the operations and assets of Thomas Carlyle Children Centre.
b. Art Centre Comprising the whole of the operations and assets of the Art Centre.
c. Trade Waste Comprising the whole of the operations and assets of Trade Waste.
d. Gordon Golf Course Comprising the whole of the operations and assets of the Gordon Golf Course.
e. Turramurra Golf Course Comprising the whole of the operations and assets of Turramurra Golf Course.
f. Tennis Courts Comprising the whole of the operations and assets of Council’s Tennis Courts.
g. Plant Nursery Comprising the whole of the operations and assets of Council’s Plant Nursery.
FOR THE FINANCIAL YEAR ENDED 30 JUNE 2016
Note 1 Significant Accounting Policies
KU-RING-GAI COUNCIL ANNUAL REPORT 2015 - 2016 213

SPFS 2016_
Ku-ring-gai Council
Notes to the Special Purpose Financial Statementsfor the year ended 30 June 2016
Note 1. Summary of Significant Accounting Policies (continued)
page 15
h. Commercial Leasing Comprising the whole of the operations and assets of Commercial Leasing.
Monetary amounts
Amounts shown in the financial statements are in Australian currency and rounded to the nearest thousand dollars.
(i) Taxation-equivalent charges
Council is liable to pay various taxes and financial duties in undertaking its business activities. Where this is the case, they are disclosed in these statements as a cost of operations just like all other costs.
However, where Council is exempt from paying taxes which are generally paid by private sector businesses (such as income tax), equivalent tax payments have been applied to all Council-nominated business activities and are reflected in these financial statements.
For the purposes of disclosing comparative information relevant to the private sector equivalent, the following taxation equivalents have been applied to all Council-nominated business activities (this does not include Council’s non-business activities):
Income tax
An income tax equivalent has been applied on the profits of each reported business activity.
While income tax is not a specific cost for the purpose of pricing a good or service, it needs to be taken into account in terms of assessing the rate of return required on capital invested.
Accordingly, the return on capital invested is set at a pre-tax level (gain or loss from ordinary activities before capital amounts) as would be applied by a private sector competitor – that is, it should include a provision equivalent to the corporate income tax rate, currently 30%.
Income tax is only applied where a positive gain/ (loss) from ordinary activities before capital amounts has been achieved.
Since this taxation equivalent is notional – that is, it is payable to Council as the ‘owner’ of business operations, it represents an internal payment and has no effect on the operations of the Council. Accordingly, there is no need for disclosure of internal charges in Council’s General Purpose Financial Statements.
The 30% rate applied is the equivalent company tax rate prevalent as at balance date.
Loan and debt guarantee fees
There are no loans applicable to the business activities in the operating statement.
(ii) Subsidies
Government policy requires that subsidies provided to customers, and the funding of those subsidies, must be explicitly disclosed.
Subsidies occur when Council provides services on a less-than-cost-recovery basis. This option is exercised on a range of services in order for Council to meet its community service obligations.
Accordingly, ‘subsidies disclosed’ (in relation to National Competition Policy) represents the difference between revenue generated from ‘rate of return’ pricing and revenue generated from prices set by Council in any given financial year.
The overall effect of subsidies is contained within the Income Statement of each reported business activity.
(iii) Return on investments (rate of return)
The policy statement requires that councils with category 1 businesses ‘would be expected to generate a return on capital funds employed that is comparable to rates of return for private businesses operating in a similar field’.
Such funds are subsequently available for meeting commitments or financing future investment strategies.
The rate of return on capital is calculated as follows:
Operating result before capital income + interest expense
Written down value of I,PP&E as at 30 June
FOR THE FINANCIAL YEAR ENDED 30 JUNE 2016
Note 1 (continued)
SPFS 2016_
Ku-ring-gai Council
Notes to the Special Purpose Financial Statementsfor the year ended 30 June 2016
Note 1. Summary of Significant Accounting Policies (continued)
page 16
As a minimum, business activities should generate a return equal to the Commonwealth 10 year bond rate which is 2.17% at 30/6/16.
(iv) Dividends
Council is not required to pay dividends to either itself (as owner of a range of businesses) or to any external entities.
214 DELIVERING OUR COMMUNITY'S VISION

SPFS 2016_
Ku-ring-gai Council
Notes to the Special Purpose Financial Statementsfor the year ended 30 June 2016
Note 1. Summary of Significant Accounting Policies (continued)
page 16
As a minimum, business activities should generate a return equal to the Commonwealth 10 year bond rate which is 2.17% at 30/6/16.
(iv) Dividends
Council is not required to pay dividends to either itself (as owner of a range of businesses) or to any external entities.
FINA
NC
IALS
Level 11 | 1 York Street | Sydney | NSW | 2000 GPO Box 4137 | Sydney | NSW | 2001
t: +61 2 9256 6600 | f: +61 2 9256 [email protected]
www.uhyhnsydney.com.au
An association of independent fi rms in Australia and New Zealand and a member of UHY International, a network of independent accounting and consulting fi rms.
UHY Haines Norton—ABN 85 140 758 156 NSWBN 98 133 826
Liability limited by a scheme approved under Professional Standards Legislation.
Passion beyond numbers
Ku-ring-gai Council Special Purpose Financial Report
Independent Auditor’s Report We have audited the accompanying financial report, being the special purpose financial report, of Ku-ring-gai Council (the Council), which comprises the statement of financial position by Business Activity as at 30 June 2016, the income statement by Business Activity for the year then ended, the notes to the financial report for the Business Activities identified by Council and the statement by Councillors and Management made pursuant to the Local Government Code of Accounting Practice and Financial Reporting for the year ended 30 June 2016. Councillor's Responsibility for the Financial Report The Councillors of the Council are responsible for the preparation and fair presentation of the financial report and have determined that the accounting policies described in note 1 to the financial report which form part of the financial report, are appropriate to meet the requirements of the Local Government Code of Accounting Practice and Financial Reporting. The Councillors’ responsibility also includes such internal control as the Councillors determine is necessary to enable the preparation of the financial report that is free from material misstatement, whether due to error or fraud. Auditor’s Responsibility Our responsibility is to express an opinion on the financial report based on our audit. We conducted our audit in accordance with Australian Auditing Standards. Those standards require that we comply with relevant ethical requirements relating to audit engagements and plan and perform the audit to obtain reasonable assurance whether the financial report is free from material misstatement. An audit involves performing procedures to obtain audit evidence about the amounts and disclosures in the financial report. The procedures selected depend on the auditor’s judgment, including the assessment of the risks of material misstatement of the financial report, whether due to fraud or error. In making those risk assessments, the auditor considers internal control relevant to the Council’s preparation and fair presentation of the financial report in order to design audit procedures that are appropriate in the circumstances, but not for the purpose of expressing an opinion on the effectiveness of the Council’s internal control. An audit also includes evaluating the appropriateness of accounting policies used and the reasonableness of accounting estimates made by Council, as well as evaluating the overall presentation of the financial report. We believe that the audit evidence we have obtained is sufficient and appropriate to provide a basis for our audit opinion.
page 17
KU-RING-GAI COUNCIL ANNUAL REPORT 2015 - 2016 215

An association of independent fi rms in Australia and New Zealand and a member of UHY International, a network of independent accounting and consulting fi rms.
UHY Haines Norton—ABN 85 140 758 156 NSWBN 98 133 826
Liability limited by a scheme approved under Professional Standards Legislation.
Passion beyond numbers
Auditor's Opinion In our opinion, the financial report presents fairly, in all material respects, the financial position by Business Activity of the Ku-ring-gai Council as of 30 June 2016 and its financial performance by Business Activity for the year then ended in accordance with the requirements of those applicable Accounting Standards detailed in Note 1 to the financial report, and the Local Government Code of Accounting Practice and Financial Reporting. Basis of Accounting and Restriction on Distribution and Use Without modifying our opinion, we draw attention to Note 1 to the financial report, which describe the basis of accounting. The financial report has been prepared for the purpose of fulfilling the Council’s financial reporting responsibilities under the Local Government Code of Accounting Practice and Financial Reporting. As a result, the financial report may not be suitable for another purpose. Our report is intended solely for the Council.
M.D. Nicholaeff UHY Haines Norton Partner Chartered Accountants Signed in Sydney on 20 September 2016
page 18
216 DELIVERING OUR COMMUNITY'S VISION
Special Schedules 2016
page 1
Ku-ring-gai Council
Special Schedules for the year ended 30 June 2016
Contents
Special Schedules1
Net Cost of Services
Statement of Long Term Debt (all purposes)
Report on Infrastructure Assets (as at 30 June 2016)
Permissible Income Calculation
1 Special Schedules are not audited (with the exception of Special Schedule 8).
Background
These Special Schedules have been designed to meet the requirements of special purpose users such as;
the NSW Grants Commissionthe Australian Bureau of Statistics (ABS),the NSW Office of Water (NOW), andthe Office of Local Government (OLG).
The financial data is collected for various uses including;
the allocation of Financial Assistance Grants,the incorporation of Local Government financial figures in national statistics,the monitoring of loan approvals,the allocation of borrowing rights, andthe monitoring of the financial activities of specific services.
Page
2
4
Special Schedule 1
Special Schedule 2(a)
5Special Schedule 7
(ii)
(i)
Special Schedule 8 9
Special Schedules No. 1 Net Cost of Services ................................................................................................ 218
Special Schedule No. 2(a) Statement of Long-term Debt (all purposes) ........................................................ 220
Special Schedule No. 7 Report on Infrastructure Assets (as at 30 June 2016)......................................... 223
Special Schedule No. 9 Permissible Income Calculation ............................................................................ 225
Contents
SPECIAL SCHEDULES1
FOR THE FINANCIAL YEAR ENDED 30 JUNE 2016
1. Special Schedules are not audited (with the exception of Special Schedule 9)
KU-RING-GAI COUNCIL ANNUAL REPORT 2015 - 2016 217
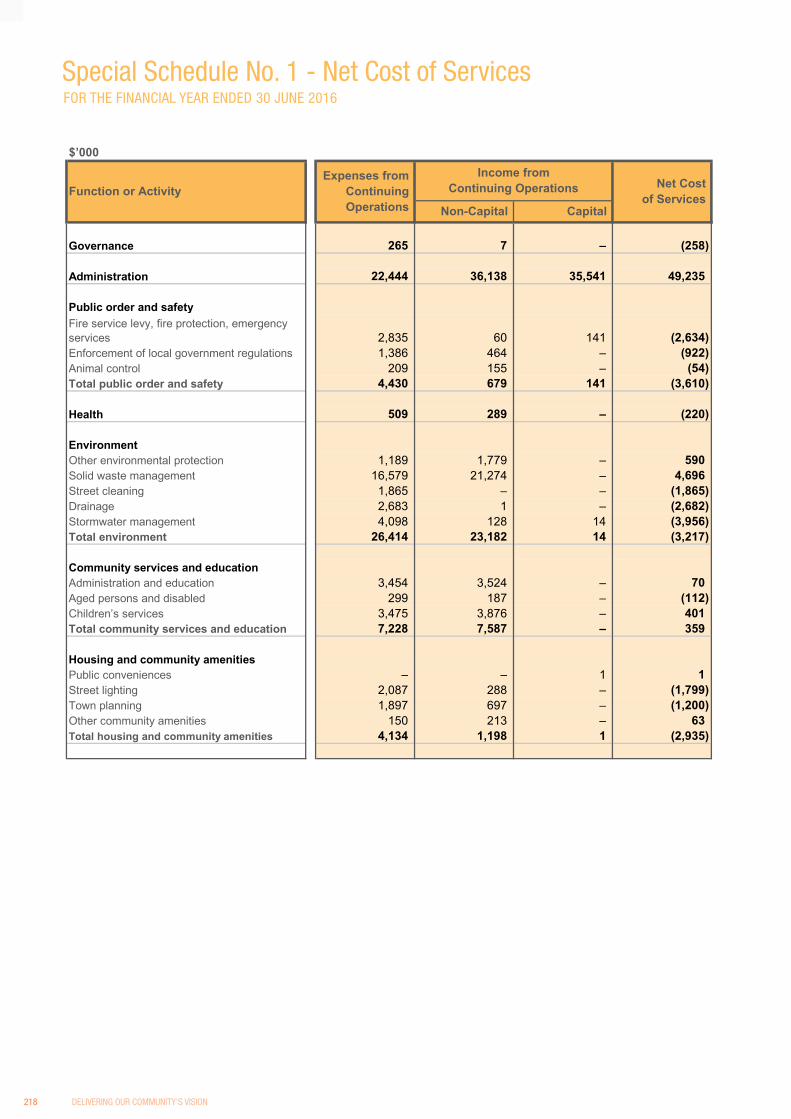
Special Schedules 2016
page 2
Ku-ring-gai Council
Special Schedule 1 – Net Cost of Services for the year ended 30 June 2016
$’000
Governance
Administration
Public order and safety
Enforcement of local government regulationsAnimal controlTotal public order and safety
Health
EnvironmentOther environmental protectionSolid waste managementStreet cleaningDrainageStormwater managementTotal environment
Community services and educationAdministration and educationAged persons and disabledChildren’s servicesTotal community services and education
Housing and community amenitiesPublic conveniencesStreet lightingTown planningOther community amenitiesTotal housing and community amenities
4,696––
590
(1,865)
–
70–(112)
3,524
(2,935)
359
3,454
1,8652,683
16,579
26,4144,098
–
299
7,228
–
187–
1–
4,134
Net Cost.of Services.
(922)(2,634)
(2,682)
(3,217)(3,956)
265 7 – (258)
(54)––
49,235
155
Function or Activity
Fire service levy, fire protection, emergency services
3,475
2,0871,897
22,444
2,835
36,138
(3,610)
– (220)
141
509
2094,430
35,541
60
1,198
–
63
1
(1,200)(1,799)
401–
1
141
–
213150
–
697
7,5873,876
288
14
–14
Expenses from.Continuing.Operations. Non-Capital.
1,386
–
1281
Capital.
Income fromContinuing Operations
464
289
1,77921,274
679
23,182
1,189
FOR THE FINANCIAL YEAR ENDED 30 JUNE 2016
Special Schedule No. 1 - Net Cost of Services
218 DELIVERING OUR COMMUNITY'S VISION

FINA
NC
IALS
Special Schedules 2016
page 3
Ku-ring-gai Council
Special Schedule 1 – Net Cost of Services (continued) for the year ended 30 June 2016
$’000
Recreation and culturePublic librariesArt galleriesCommunity centres and hallsOther cultural servicesSporting grounds and venuesSwimming poolsParks and gardens (lakes)Other sport and recreationTotal recreation and culture
Mining, manufacturing and constructionBuilding controlTotal mining, manufacturing and const.
Transport and communicationUrban roads (UR) – localParking areasFootpathsTotal transport and communication
Economic affairsOther economic affairsTotal economic affairs
Totals – functions
General purpose revenues (1)
NET OPERATING RESULT (2)
(1) Includes: rates and annual charges (including ex gratia, excluding water and sewer), non-capital general purpose grants, interest on investments
(excluding externally restricted assets) and interest on overdue rates and annual charges(2) As reported in the Income Statement
1,890(190)
(4,435)
(5,142)
(1,045)
Net Cost.of Services.
(4,435)
(9,479)
(468)(8,308)
36,262
4,432 (4,018)
35,151 41,970
5,708308
(9,780)
308
1,169
–
–(1,470)
(205)
(362)
(19,738)
197192
–
Capital.
–
–
–
12,256 3,548
2,463
558
6,8986,898
706
Non-Capital.
Expenses from.Continuing.Operations.
8,697
5,7174,469
437845
75
–21426,816
468 –6,864
Function or Activity
2,463 –
(771)
–
17
–
35,151
1,90698
7371,579 11
(760)
114,057
14,572 5,552
347347
120,876
655
36,262
114,057
655
84,614
4,264
414516
Income fromContinuing Operations
–
FOR THE FINANCIAL YEAR ENDED 30 JUNE 2016
Special Schedule No. 1 - Net Cost of Services (continued)
KU-RING-GAI COUNCIL ANNUAL REPORT 2015 - 2016 219

Ku-
ring-
gai C
ounc
il
Spe
cial
Sch
edul
e 2(
a) –
Sta
tem
ent o
f Lon
g Te
rm D
ebt (
all p
urpo
se)
for t
he y
ear e
nded
30
June
201
6
$’00
0
Not
es: e
xclu
des
(i) in
tern
al lo
ans
and
(ii) p
rinci
pal i
nflo
ws/
outfl
ows
rela
ting
to lo
an re
-fina
ncin
g.
Thi
s sc
hedu
le is
pre
pare
d us
ing
the
face
val
ue o
f deb
t obl
igat
ions
, rat
her t
han
fair
valu
e (w
hich
are
repo
rted
in th
e G
PFS
).
Loan
s (b
y so
urce
)C
omm
onw
ealth
gov
ernm
ent
Cur
rent
––
––
––
–
Tran
sfer
s to
sin
king
fu
nds
Prin
cipa
l out
stan
ding
Inte
rest
ap
plic
able
fo
r yea
rTo
tal
Non
-cu
rren
t
at th
e en
d of
the
year
––
Prin
cipa
l out
stan
ding
New
loan
s ra
ised
du
ring
the
year
at b
egin
ning
of t
he y
ear
Cla
ssifi
catio
n of
deb
tC
urre
ntN
on-
curr
ent
Tota
l
–
––
–––
–– –
––
––
–
23,9
28–
23,9
28––
––
Deb
t red
empt
ion
durin
g th
e ye
ar
From
re
venu
eSi
nkin
g fu
nds
–
1,58
4––
948–
948
22,3
44
–
–
–
–
1,58
422
,344
––––
–– –
Oth
er s
tate
gov
ernm
ent
––
––
––
––
––
Trea
sury
cor
pora
tion
–P
ublic
sub
scrip
tion
––
––
–––
–
Fina
ncia
l ins
titut
ions
2,53
623
,987
26,5
23–
656
––65
6
– –3,
251
––
–3,
251
2,53
623
,987
Tota
l loa
ns–
26,5
23O
ther
––
–O
ther
long
term
deb
tR
atep
ayer
s ad
vanc
es–
––
–G
over
nmen
t adv
ance
s–
Fina
nce
leas
es––
––
––
––
––
––
––
–
1,58
4
––
–
23,9
28
––
–
22,3
44
–
948
––
page 4
Special Schedules 2016
––D
efer
red
paym
ents
––
2,53
6–
23,9
87
––
––
Tota
l lon
g te
rm d
ebt
––
Tota
l deb
t
–
26,5
23–
656
3,25
1
FOR
THE
FINA
NCIA
L YE
AR E
NDED
30
JUNE
201
6
Spec
ial S
ched
ule
No. 2
(a) -
Sta
tem
ent o
f Lon
g Te
rm D
ebt (
all p
urpo
se)
220 DELIVERING OUR COMMUNITY'S VISION

FINA
NC
IALS
Ku-
ring-
gai C
ounc
il
Spe
cial
Sch
edul
e 7
– R
epor
t on
Infra
stru
ctur
e A
sset
s a
s at
30
June
201
6
$’00
0
23%
3.1%
7.1%
110,
087
84%
recr
eatio
nal
6,41
313
5,18
2
1,30
0
400
– 0%4%
20,6
5166
,525
1,70
025
,095
0%83
%
68.4
%17
,863
14,5
762,
100
13%
1%6,
413
3,28
7
236,
521
1.0%
12.0
%73
.0%
617
0%16
1,75
01%
522,
242
1%2%
45,8
8211
,418
32.0
%
10%
8%3%
0%21
.6%
Oth
er s
truc
ture
s40
2
31,0
66
Roa
ds
2%20
013
,064
5%46
%70
3
32%
0.0%1%
325,
795
16%
2,20
0B
ridge
s6,
386
1,69
853
.0%
402
Oth
er s
truct
ures
Sub-
tota
l
Sub-
tota
l
0% 12%
3% 17.9
%0.
7%3.
2%9.
8%87
,176
14.0
%16
1,75
023
6,52
112
%1,
300
497
73%
14%
617
24,3
0856
,777
Sub-
tota
l287,840
Bui
ldin
gs
2%24
1,69
87,
662
60.0
%60
%12
4,82
125
%12
%2% 2.0%
12.0
%1%
Ass
et c
lass
All
Cou
ncil
Bui
ldin
gs
to b
ring
asse
tsEs
timat
ed c
ost
2015
/16
to b
ring
to th
e20
15/1
6G
ross
stan
dard
mai
nten
ance
Asse
t cat
egor
y
2,08
22,
600
124,
821
7,66
2
61,3
25
24
Asse
ts in
con
ditio
n as
a p
erce
ntag
e of
gro
ss
repl
acem
ent c
ost
Car
ryin
gva
lue
61,3
25
Req
uire
dAc
tual
repl
acem
ent
cost
(GR
C)
mai
nten
ance
ato
sat
isfa
ctor
y
Estim
ated
cos
t
agre
ed le
vel o
fse
rvic
e se
t by
Cou
ncil
1,63
728
6
53%
5
2,60
0
200
32
14
1,63
72,
082
25.0
%
39%
155
1.0%
2.0%
11%
2.0%
286
13,0
64
52%
21%
0%26
%
2,96
973
23,
583
700
38%
Roa
ds23
,424
52,9
02
171
819
Roa
d Fu
rnitu
re13
3,07
46,
073
67,9
79
1,93
0
1%
4,00
0
43%
178,
826
11.0
%
35%
37%
0%5%
14.7
%53
.4%
900
100
– 94
0
88%
19–
Foot
path
sK
erb
and
Gut
ter
4 10
012
80%
49 497
Rec
reat
iona
l Ass
ets
Sw
imm
ing
pool
s
Pits
and
Pip
es
575
asse
tsSu
b-to
tal
Sub-
tota
l
Ope
n sp
ace/
8,45
07,
875
Dra
inag
e
page 5
Special Schedules 2016
2,83
82,
838
FOR
THE
FINA
NCIA
L YE
AR E
NDED
30
JUNE
201
6
Spec
ial S
ched
ule
No. 7
- R
epor
t on
Infra
stru
ctur
e As
sets
KU-RING-GAI COUNCIL ANNUAL REPORT 2015 - 2016 221
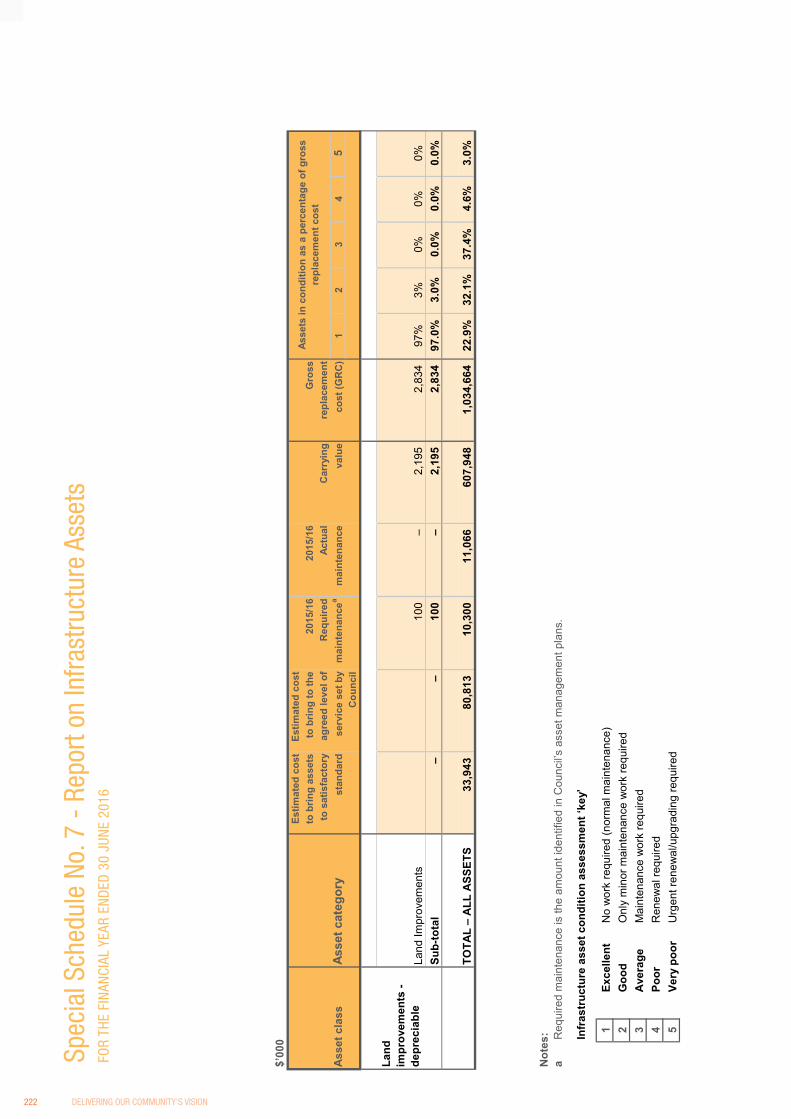
Ku-
ring-
gai C
ounc
il
Spe
cial
Sch
edul
e 7
– R
epor
t on
Infra
stru
ctur
e A
sset
s (c
ontin
ued)
as
at 3
0 Ju
ne 2
016
$’00
0
Not
es:
aR
equi
red
mai
nten
ance
is th
e am
ount
iden
tifie
d in
Cou
ncil’
s as
set m
anag
emen
t pla
ns.
Infr
astr
uctu
re a
sset
con
ditio
n as
sess
men
t ‘ke
y’
Exce
llent
No
wor
k re
quire
d (n
orm
al m
aint
enan
ce)
Goo
dO
nly
min
or m
aint
enan
ce w
ork
requ
ired
Ave
rage
Mai
nten
ance
wor
k re
quire
dPo
orR
enew
al re
quire
dVe
ry p
oor
Urg
ent r
enew
al/u
pgra
ding
requ
ired
607,948
22.9
%32
.1%
37.4
%
4321
Land
im
prov
emen
ts -
depr
ecia
ble
80,8
13TO
TAL
– A
LL A
SSET
S33
,943
1,03
4,66
44.
6%
0%
Ass
et c
lass
Asse
t cat
egor
yst
anda
rdm
aint
enan
cea
to s
atis
fact
ory
Req
uire
dAc
tual
3.0%
10,3
0011
,066
100
– 2,
195
0.0%
0.0%
– 2,
834
97.0
%3.
0%0.
0%La
nd Im
prov
emen
ts10
0–
2,83
497
%3%
0%0%
mai
nten
ance
2,19
5
cost
(GR
C)
12
34
valu
e
2015
/16
Gro
ssto
brin
g to
the
agre
ed le
vel o
fse
rvic
e se
t by
Cou
ncil
2015
/16
Estim
ated
cos
tAs
sets
in c
ondi
tion
as a
per
cent
age
of g
ross
re
plac
emen
t cos
tre
plac
emen
tC
arry
ing
5
Estim
ated
cos
t
5
Sub-
tota
l–
to b
ring
asse
ts
page 6
Special Schedules 2016
FOR
THE
FINA
NCIA
L YE
AR E
NDED
30
JUNE
201
6
Spec
ial S
ched
ule
No. 7
- R
epor
t on
Infra
stru
ctur
e As
sets
222 DELIVERING OUR COMMUNITY'S VISION

FINA
NC
IALS
Special Schedules 2016
page 7
Ku-ring-gai Council
Special Schedule 7 – Report on Infrastructure Assets (continued) for the year ended 30 June 2016
$ ’000
Infrastructure asset performance indicators * consolidated
1. Infrastructure renewals ratioAsset renewals (1)
Depreciation, amortisation and impairment
2. Infrastructure backlog ratioEstimated cost to bring assets to a satisfactory standardCarrying value of infrastructure assets
3. Asset maintenance ratioActual asset maintenanceRequired asset maintenance
Notes
* All asset performance indicators are calculated using the asset classes identified in the previous table.
(1) Asset renewals represent the replacement and/or refurbishment of existing assets to an equivalent capacity/performance as opposed to the acquisition of new assets (or the refurbishment of old assets) that
increases capacity/performance.
1.07 1.01 0.9510,300
Indicator Prior periods
33,943 5.58% 4.36% 31.91%607,948
2016 2016 2015 2014
14,049 81.89% 100.01% 104.35%17,155
Amounts
11,066
FOR THE FINANCIAL YEAR ENDED 30 JUNE 2016
Special Schedule No. 7 - Report on Infrastructure Assets
KU-RING-GAI COUNCIL ANNUAL REPORT 2015 - 2016 223

Special Schedules 2016
page 8
Ku-ring-gai Council
Special Schedule 7 – Report on Infrastructure Assets (continued) for the year ended 30 June 2016
Benchmark: ――― Minimum >=100.00% Ratio achieves benchmarkSource for benchmark: Code of Accounting Practice and Financial Reporting #24 Ratio is outside benchmark
Benchmark: ――― Maximum <2.00% Ratio achieves benchmarkSource for benchmark: Code of Accounting Practice and Financial Reporting #24 Ratio is outside benchmark
Benchmark: ――― Minimum >1.00 Ratio achieves benchmarkSource for benchmark: Code of Accounting Practice and Financial Reporting #24 Ratio is outside benchmark
A ratio of above 1.0x indicates that the Council is investing enough funds within the year to ensure assets reach their useful lives. The benchmark is
greater than 1.0x. Council is committed to increase expenditure on
asset maintenance in future to maintain its infrastructure assets in satisfactory condition in
the long term.
Commentary on 2015/16 result
2015/16 Ratio 81.89%
Compares actual vs. required annual asset maintenance. A ratio above 1.0 indicates Council is investing
enough funds to stop the infrastructure backlog growing.
Purpose of asset renewals ratio
This ratio showswhat proportion the backlog is against
the total valueof a Council’s infrastructure.
To assess the rate at which these assets are being renewed
relative to the rate at which they are depreciating.
Purpose of infrastructure backlog ratio
Purpose of asset maintenance ratio
A ratio of 82% indicates that the amount spent on renewing infrastructure assets is lower than
the amount of depreciation on those assets. While Council’s long term financial plan provides for infrastructure renewal to meet the benchmark
of 100% in all years, in 2015/16 there were delays in obtaining funding for planned asset renewal that will be caught up in future years. Council will continue to focus on appropriate
asset standards for renewal and maintenance of its assets and prioritise renewal capital works
programs.
Commentary on 2015/16 result
2015/16 Ratio 5.58%
Council achieved a backlog ratio of 5.6% at the end of 2015/16 financial year, which is an
increase from the last financial year. The ratio indicates that Council still has an infrastructure
backlog. Council is continuing to focus on appropriate asset standards for renewal and
maintenance of its assets.
Commentary on 2015/16 result
2015/16 Ratio 1.07 x
104.35% 100.01%94.06%
81.89%
0%
20%
40%
60%
80%
100%
120%
2013 2014 2015 2016
Rat
io %
1. Infrastructure renewals ratio
29.79%31.91%
4.36% 5.58%
0.0%
5.0%
10.0%
15.0%
20.0%
25.0%
30.0%
35.0%
40.0%
2013 2014 2015 2016
Rat
io %
2. Infrastructure backlog ratio
1.01 1.07
0.810.95
0.00
0.20
0.40
0.60
0.80
1.00
1.20
1.40
2013 2014 2015 2016
Rat
io (
x)
3. Asset maintenance ratio
FOR THE FINANCIAL YEAR ENDED 30 JUNE 2016
Special Schedule No. 7 - Report on Infrastructure Assets
224 DELIVERING OUR COMMUNITY'S VISION
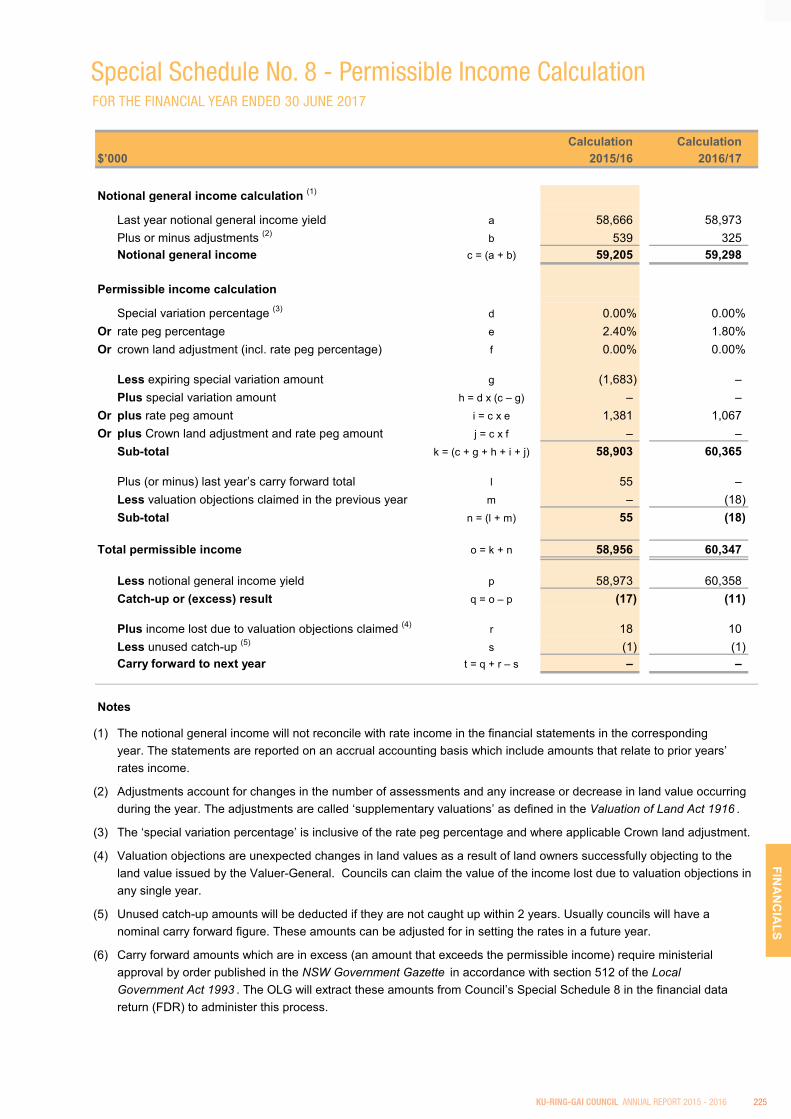
FINA
NC
IALS
Special Schedules 2016
page 9
Ku-ring-gai Council
Special Schedule 8 – Permissible Income Calculation for the year ended 30 June 2017
$’000
Notional general income calculation (1)
Last year notional general income yieldPlus or minus adjustments (2)
Notional general income
Permissible income calculation
Special variation percentage (3)
Or rate peg percentageOr crown land adjustment (incl. rate peg percentage)
Less expiring special variation amountPlus special variation amount
Or plus rate peg amountOr plus Crown land adjustment and rate peg amount
Sub-total
Plus (or minus) last year’s carry forward totalLess valuation objections claimed in the previous yearSub-total
Total permissible income
Less notional general income yieldCatch-up or (excess) result
Plus income lost due to valuation objections claimed (4)
Less unused catch-up (5)
Carry forward to next year
Notes
(1) The notional general income will not reconcile with rate income in the financial statements in the correspondingyear. The statements are reported on an accrual accounting basis which include amounts that relate to prior years’rates income.
(2) Adjustments account for changes in the number of assessments and any increase or decrease in land value occurringduring the year. The adjustments are called ‘supplementary valuations’ as defined in the Valuation of Land Act 1916 .
(3) The ‘special variation percentage’ is inclusive of the rate peg percentage and where applicable Crown land adjustment.
(4) Valuation objections are unexpected changes in land values as a result of land owners successfully objecting to theland value issued by the Valuer-General. Councils can claim the value of the income lost due to valuation objections inany single year.
(5) Unused catch-up amounts will be deducted if they are not caught up within 2 years. Usually councils will have anominal carry forward figure. These amounts can be adjusted for in setting the rates in a future year.
(6) Carry forward amounts which are in excess (an amount that exceeds the permissible income) require ministerial approval by order published in the NSW Government Gazette in accordance with section 512 of the Local Government Act 1993 . The OLG will extract these amounts from Council’s Special Schedule 8 in the financial data return (FDR) to administer this process.
539 32559,205 59,298
58,666 58,973
0.00% 0.00%2.40% 1.80%0.00% 0.00%
(1,683) –– –
55 –
1,381 1,067– –
58,903 60,365
– (18)55 (18)
60,347
58,973 60,358
a
– –
Calculation Calculation2015/16 2016/17
(1) (1)
(17) (11)
18 10
58,956
l
m
n = (l + m)
o = k + n
g
k = (c + g + h + i + j)
b
d
e
f
j = c x f
i = c x e
h = d x (c – g)
c = (a + b)
p
q = o – p
r
st = q + r – s
FOR THE FINANCIAL YEAR ENDED 30 JUNE 2017
Special Schedule No. 8 - Permissible Income Calculation
KU-RING-GAI COUNCIL ANNUAL REPORT 2015 - 2016 225

Level 11 | 1 York Street | Sydney | NSW | 2000 GPO Box 4137 | Sydney | NSW | 2001
t: +61 2 9256 6600 | f: +61 2 9256 [email protected]
www.uhyhnsydney.com.au
An association of independent fi rms in Australia and New Zealand and a member of UHY International, a network of independent accounting and consulting fi rms.
UHY Haines Norton—ABN 85 140 758 156 NSWBN 98 133 826
Liability limited by a scheme approved under Professional Standards Legislation.
Passion beyond numbers
Ku-ring-gai Council
Report on Special Schedule No. 8 Scope We have audited the accompanying special purpose financial report comprising the reconciliation of total permissible general income (Special Schedule No. 8) of Ku-ring-gai Council for the year ending 30 June 2016. Councillor’s Responsibility for Special Schedule No. 8 The Councillors of the Council are responsible for the preparation and fair presentation of Special Schedule No.8 in accordance with the Local Government Code of Accounting Practice and Financial Reporting (Guidelines) Update No. 24. This responsibility includes the maintenance of adequate accounting records and internal controls designed to prevent and detect fraud and error; designing, implementing and maintaining internal controls relevant to the preparation and fair presentation of Special Schedule No. 8 that is free from material misstatement, whether due to fraud or error; selecting and applying appropriate accounting policies; and making accounting estimates that are reasonable in the circumstances. Auditors’ Responsibility Our responsibility is to express an opinion on Special Schedule No. 8 based on our audit. We conducted our audit in accordance with Australian Auditing Standards. These Auditing Standards require that we comply with relevant ethical requirements relating to audit engagements and plan and perform the audit to obtain reasonable assurance as to whether Special Schedule No.8 is free from material misstatement. An audit involves performing procedures to obtain audit evidence about the amounts and disclosures in Special Schedule No.8. The procedures selected depend on the auditor’s judgment, including the assessment of the risks of material misstatement of Special Schedule No.8, whether due to fraud or error. An audit also includes evaluating the appropriateness of accounting policies used and the reasonableness of accounting estimates made by management, as well as evaluating the overall presentation of Special Schedule No. 8. Because of the inherent limitations of an audit, together with the inherent limitations of internal controls, there is an unavoidable risk that some material misstatements may not be detected, even though the audit is properly planned and performed in accordance with Australian Auditing Standards. In making our risk assessments, we consider internal controls relevant to the entity’s preparation of Special Schedule No. 8 in order to design audit procedures that are appropriate in the circumstances, but not for the purpose of expressing an opinion on the effectiveness of the entity’s internal control. We believe that the audit evidence we have obtained is sufficient and appropriate to provide a basis for our audit opinion.
page 10
226 DELIVERING OUR COMMUNITY'S VISION

FINA
NC
IALS
An association of independent fi rms in Australia and New Zealand and a member of UHY International, a network of independent accounting and consulting fi rms.
UHY Haines Norton—ABN 85 140 758 156 NSWBN 98 133 826
Liability limited by a scheme approved under Professional Standards Legislation.
Passion beyond numbers
Independence In conducting our audit, we followed applicable independence requirements of Australian professional ethical pronouncements. Audit Opinion In our opinion, Special Schedule No. 8 of Ku-ring-gai Council for the year ending 30 June 2016 is properly drawn up in accordance with the requirements of the Office of Local Government and in accordance with the books and records of the Council. Basis of Accounting Without modifying our opinion, we advise that this schedule has been prepared for distribution to the Office of Local Government for the purposes of confirming that Council’s reconciliation of the total permissible general income is presented fairly. As a result, the schedule may not be suitable for another purpose. Our report is intended solely for the council and the Office of Local Government.
M.D. Nicholaeff UHY Haines Norton Partner Chartered Accountants Signed in Sydney on 20 September 2016
page 11
KU-RING-GAI COUNCIL ANNUAL REPORT 2015 - 2016 227