Embed Size (px)
Citation preview

Financial Highlightsand Strategy
Financial Highlightsand Strategy
Rick Gunst
Senior Vice President andChief Financial Officer
Rick Gunst
Senior Vice President andChief Financial Officer

$296$341
$406
$491
$568
$648$680
$785 $781
$843
$0
$300
$600
$900
FY1997
FY1998
FY1999
FY2000
FY2001
FY2002
FY2003
FY2004
FY2005
FY2006
RevenueFiscal Years 1997-2006RevenueFiscal Years 1997-2006
In Millions

$24
$31
$39
$48
$58
$67
$61$58
$18
$43
$0
$20
$40
$60
$80
FY1997
FY1998
FY1999
FY2000
FY2001
FY2002
FY2003
FY2004
FY2005
FY2006
Net IncomeFiscal Years 1997-2006Net IncomeFiscal Years 1997-2006
In Millions

$626.9$706.0
$0
$200
$400
$600
$800
FY 2006 FY 2007
RevenueFirst Nine MonthsRevenueFirst Nine Months
In Millions
+12.6%+12.6%

$0.44
$0.85
$0.00
$0.30
$0.60
$0.90
FY 2006 FY 2007
Net Income and EPSFirst Nine MonthsNet Income and EPSFirst Nine Months
$31.2
$60.2
$0
$20
$40
$60
$80
FY 2006 FY 2007
+92.8%+92.8%
Net Income Earnings Per Share
+93.2%+93.2%
*Includes $12.4 million after-tax gains from DeVry University facility sales and $0.7 million in severance charges.
$48.5
$11.7*
$0.68
$0.17*
$M

Segment Results DeVry UniversityFirst Nine Months
Segment Results DeVry UniversityFirst Nine Months
*Includes $20.9 million pre-tax gains from DeVry University facility sales and $1.1 million in severance charges.
+8.9%+8.9%
Revenue Operating Income
+63.5%+63.5%
$506.9$552.1
$0
$200
$400
$600
FY 2006 FY 2007
$15.2
$39.9*
$0
$10
$20
$30
$40
$50
FY 2006 FY 2007
$20.1
$19.8*
$M $M

Segment Results Medical and HealthcareFirst Nine Months
Segment Results Medical and HealthcareFirst Nine Months
+27.2%+27.2%
Revenue Operating Income
+28.3%+28.3%
$82.7
$105.1
$0
$20
$40
$60
$80
$100
$120
FY 2006 FY 2007
$30.6
$39.3
$0$5
$10$15$20$25$30$35$40$45
FY 2006 FY 2007
$30.6
$39.3
$0$5
$10$15$20$25$30$35$40$45
FY 2006 FY 2007
$M $M

Segment Results Professional and TrainingFirst Nine Months
Segment Results Professional and TrainingFirst Nine Months
+30.7%+30.7%
Revenue Operating Income
+39.3%+39.3%
$37.3
$48.7
$0
$20
$40
$60
FY 2006 FY 2007
$12.6
$17.6
$0
$5
$10
$15
$20
FY 2006 FY 2007
$12.6
$17.6
$0
$5
$10
$15
$20
FY 2006 FY 2007
$M $M

Opportunities for Margin ExpansionPre-Tax IncomeOpportunities for Margin ExpansionPre-Tax Income
16.9% 17.1%
12.7%
9.5%
2.8%
6.8% 6.7%
12.0%*
0.0%
3.0%
6.0%
9.0%
12.0%
15.0%
18.0%
FY 2001 FY 2002 FY 2003 FY 2004 FY 2005 FY 2006 3Q YTDFY 2006
3Q YTDFY 2007
In Millions
3.8%
9.2%
*Includes $20.9 million pre-tax gains from DeVry University facility sales and $1.1 million in severance charges.

DeVry University 12.5% 3.7%*(8.8) pts
Medical & Healthcare - 37.4% +37.4 pts
Professional & Training 28.6% 36.1% +7.5 pts
Interest/Amort./Depr. (0.3)% (1.7)% (1.4) pts
Total DeVry Inc. 13.2% 9.2% (4.0) pts
DeVry University 12.5% 3.7%*(8.8) pts
Medical & Healthcare - 37.4% +37.4 pts
Professional & Training 28.6% 36.1% +7.5 pts
Interest/Amort./Depr. (0.3)% (1.7)% (1.4) pts
Total DeVry Inc. 13.2% 9.2% (4.0) pts
Pre-Tax Operating Margin (%)
YTD Q3FY’03
YTD Q3FY’07
B(W)
*FY’07 results exclude facility sale gains and severance charge.
Opportunities for Margin Expansion FY’03-FY’07 Opportunities for Margin Expansion FY’03-FY’07

Workforce ReductionsFY 2007Workforce ReductionsFY 2007
Voluntary Separation 70 $1.1 $2.6 $3.7
Involuntary Separation 145 - $2.6 $2.6
215 $1.1 $5.2 $6.3
Voluntary Separation 70 $1.1 $2.6 $3.7
Involuntary Separation 145 - $2.6 $2.6
215 $1.1 $5.2 $6.3
# ofEmployees
Cost Reductions of $10 Million Per Year in FY 2008 and Beyond
Severance ($M)Q3 Q4 Total

Real Estate StrategyOptimizing Large CampusesReal Estate StrategyOptimizing Large Campuses
We are committed to every market we serve.
Category 1 Category 2 Category 3
Enrollment growth Lower enrollments Lower enrollments
Desirable location Near term leases or high property values
Longer term leases or lower property values
Strategy:
Retain facility
Strategy:
Sell and relocate or leaseback space
Strategy:
Reconfigure/co-locate

Substantial Debt ReductionSubstantial Debt Reduction
$93
$290
$146
$250
$162
$225
$131$125
$169
$85
$171
$50
$136
$0
$0
$50
$100
$150
$200
$250
$300
FY 2003 FY 2004 FY 2005 FY 2006 Q1 FY2007
Q2 FY2007
Q3 FY2007
Cash Funded Debt
In Millions

Financial StrategyFinancial Strategy
Reduced debt levels Amended credit agreement Declared first dividend Initiated stock repurchase program
– Repurchased 194,000 shares for $5.3 million in Q3 FY 2007
Reduced debt levels Amended credit agreement Declared first dividend Initiated stock repurchase program
– Repurchased 194,000 shares for $5.3 million in Q3 FY 2007
Building Value for Our Shareholders
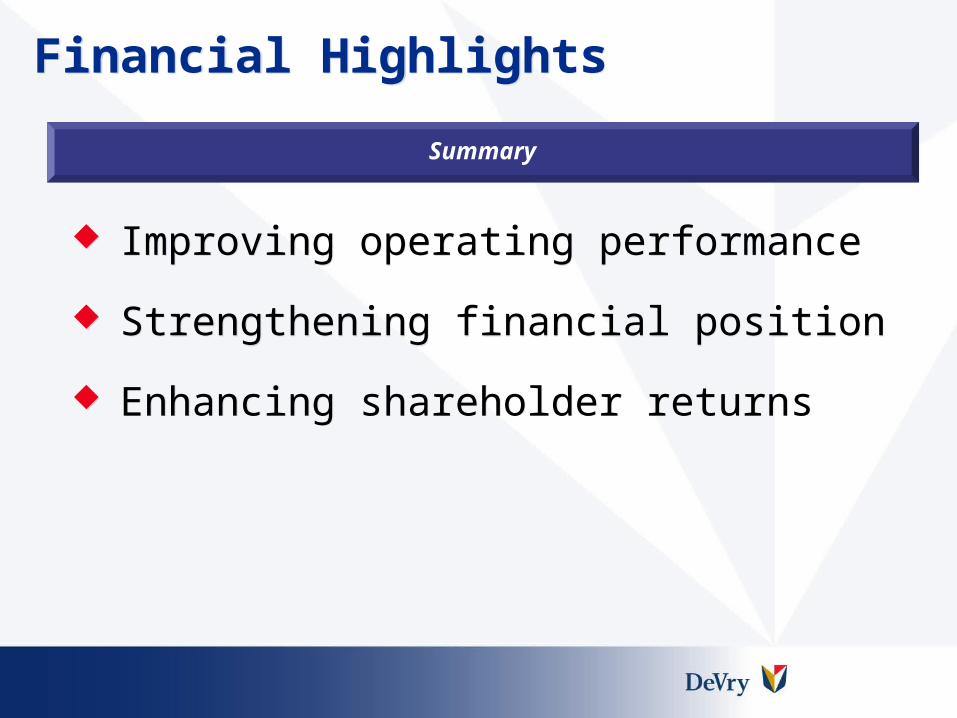
Financial HighlightsFinancial Highlights
Improving operating performance
Strengthening financial position
Enhancing shareholder returns
Improving operating performance
Strengthening financial position
Enhancing shareholder returns
Summary