Embed Size (px)
Citation preview
© HEFCE 2016
This publication is available under the Open Government Licence 3.0.
www.nationalarchives.gov.uk/doc/open-government-licence/version/3/
www.hefce.ac.uk
Subscribe to email alerts
@hefce
Data analysis
November 2016/34
This report provides an overview of the forecast financial health of the
HEFCE-funded higher education sector in England. The analysis covers
the financial forecasts for the period 2015-16 to 2018-19, based on
information submitted by higher education institutions to HEFCE in July
2016. This does not include further education or sixth-form colleges, or
alternative providers of higher education.
Financial health of the higher education sector
2015-16 to 2018-19 forecasts
2
Contents
Executive summary ....................................................................................................................... 3
European Union ............................................................................................................................. 7
Non-EU students ........................................................................................................................... 8
Undergraduate student recruitment (home and EU) ..................................................................... 9
Capital investment ......................................................................................................................... 9
Pensions and reserves ................................................................................................................ 10
Financial stability ......................................................................................................................... 11
Further information ...................................................................................................................... 11
Annex A: Detailed analysis of financial forecasts ....................................................................... 13
Annex B: Changes to 2014-15 following FRS 102 conversion ................................................... 34
Annex C: Sensitivity of financial forecasts to changes in key assumptions................................ 35
List of abbreviations ..................................................................................................................... 37

3
Financial health of the higher education sector: 2015-16 to 2018-19 forecasts
To Heads of HEFCE-funded higher education institutions
Of interest to those
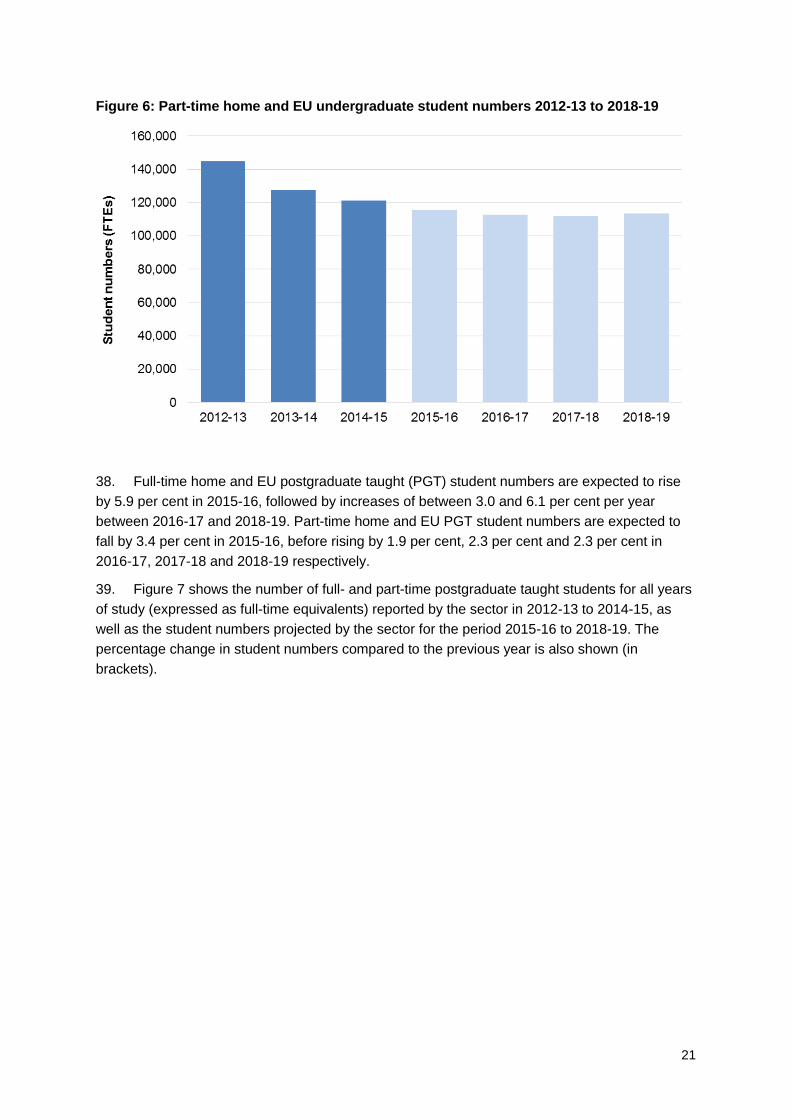
responsible for
Audit, Estates, Finance, Governance, Management, Planning
Reference 2016/34
Publication date November 2016
Enquiries to Will Dent, tel 0117 931 7437, email [email protected] or Annette Wynne, tel
0117 931 7377, email [email protected].
Executive summary
Purpose
1. This report provides an overview of the forecast financial health of the HEFCE-funded
higher education (HE) sector in England. The analysis covers the financial forecasts for the
period 2015-16 to 2018-19, based on information submitted by higher education institutions
(HEIs) to HEFCE in July 2016. This does not include further education or sixth-form colleges, or
alternative providers of higher education.
Key points
2. Financial Reporting Standard (FRS) 102 is the new financial reporting framework for higher
and further education (FE) providers for reporting periods starting on or after 1 January 2015,
and introduces some significant changes in the way financial performance is reported.
3. Financial forecasts for the period 2015-16 to 2018-19 are consistent with the new standard
and are presented alongside 2014-15 financial data restated under FRS102. The new reporting
framework makes comparison difficult between forecast performance and historical trends.
4. The accuracy and reliability of the sector’s forecasts depends on the assumptions made by
HEIs in response to the latest higher education reforms and prevailing market conditions.
5. Most HEIs indicated that their forecasts were prepared ahead of the European Union (EU)
referendum vote. While they knew the outcome at the time they submitted their forecasts to
HEFCE, HEIs did not adjust them to reflect potential impacts of Brexit, because of the level of
uncertainty existing at the time. As a result, the projected financial performance summarised in
this report does not reflect a sector-wide view of the potential impacts following the UK’s exit from
the EU.
6. Overall, the forecasts demonstrate a continuation of the themes raised in previous
analysis. The main outcomes are as follows:
a. The latest forecasts, for the period 2015-16 to 2018-19, show a widening gap
between the lowest- and highest-performing institutions and increasing volatility of
forecasts in the sector.
4
b. Sector surpluses are projected to be between 2.3 per cent and 4.3 per cent of total
income in the forecast period; these are relatively small margins in which to operate.
However, at institutional level, these range from a deficit of 28.6 per cent to a surplus of
21.5 per cent in 2017-18, equivalent to a range of 50.1 per cent (compared with 30.4 per
cent in 2014-15).
c. The trend of falling liquidity (cash) and increasing sector borrowing continues in this
forecast period. Borrowing levels are expected to exceed liquidity levels in all forecast
years, by £49 million at 31 July 2016, increasing to £3.9 billion at 31 July 2019. This trend
of increasing borrowing and reducing liquidity is unsustainable in the long term.
d. The sector is projecting fee income from non-EU students to rise from £3.7 billion in
2015-16 to £4.8 billion in 2018-19 (equivalent to 14.9 per cent of total income). Increasing
competition from other countries and proposed changes to student immigration rules
suggest these projections may be difficult to achieve. This would have a significant
adverse impact on the sector’s financial projections. However, the weaker pound may
assist the recruitment of overseas students.
e. The sector is projecting high levels of growth in numbers of total home and EU
students (10.3 per cent over the forecast period). This level of growth may be a challenge
given the decline in the 18 year-old English population, uncertainties over the impacts of
Brexit and increases in alternatives to undergraduate courses, such as degree
apprenticeships.
f. Significant increases in capital investment are projected. At over £17.8 billion, this
represents an average annual investment of £4.5 billion (2015-16 to 2018-19), 51 per cent
higher than the previous four-year average. Despite this, nearly a quarter of HEIs in the
sector are planning to reduce capital expenditure over the forecast period.
g. Investment in infrastructure is particularly important given that, in July 2015, the
sector estimated that it still needed to invest £3.6 billion into its non-residential estate to
upgrade it to a sound baseline condition.
h. The uncertainties faced by the sector as a result of the UK’s decision to leave the
EU, coinciding with increasing competition in the global HE market, will lead to a greater
focus from investors on the underlying financial strength of HEIs. Consequently, any fall in
confidence levels could restrict the availability of finance in the sector and put significant
elements of the investment programme at risk. Falling confidence levels are also likely to
lead to a rise in the cost of borrowing.
i. Aside from the challenges associated with income generation, the sector will face
inflationary pressures on costs, particularly staff costs, operating costs and capital
investment costs.
j. Pension liabilities are expected to increase from £4.9 billion at 31 July 15 to £7.2
billion at 31 July 2016; an increase of 45.8 per cent. This is due to FRS102 which requires
liabilities relating to the deficit recovery plans for multi-employer pension schemes to be
reflected in institutional balance sheets. However, the latest estimated valuation of the
sector’s largest pension scheme, the Universities Superannuation Scheme (USS),
indicates a significant worsening of the deficit, implying further increases in liabilities are
likely.

5
Action required
7. No action is required: this report is for information.

6
Analysis
8. The sector’s financial results for 2014-15 showed a sound financial position overall.
However, there was an increasingly significant variation in the financial performance of individual
higher education institutions (HEIs) across the sector.
9. The latest forecasts, for the period 2015-16 to 2018-19, show a continuation of this trend,
with a widening gap between the lowest- and highest-performing institutions and increasing
variation of forecasts in the sector. Some of the variation, however, is due to the change to
Financial Reporting Standard 102 (FRS 102), which was introduced during the forecast period.
This change also make comparisons with past performance and between HEIs more difficult.
10. Table 1 provides the key headline data from the financial information submitted by HEFCE-
funded HEIs in July 2016.
Table 1: Summary of key financial indicators for publicly funded English HEIs
Actual Forecast
2014-15
Restated*
2015-16 2016-17 2017-18 2018-19
Total income £27,973M £28,569M £29,507M £30,857M £31,917M
Surplus
as a % of total income
£902M
3.2%
£1,216
4.3%
£687M
2.3%
£1,031M
3.3%
£1,081M
3.4%
Earnings before interest, tax,
depreciation and amortisation
(EBITDA)
£3,747M £3,416M £2,981M £3,495M £3,659M
as % of total income 13.4% 12.0% 10.1% 11.3% 11.5%
Cash flow from operating
activities, as % of total income
9.1% 8.6% 7.3% 8.3% 9.1%
Net liquidity, as number of
days’ expenditure
131 127 102 88 83
External borrowings, as % of
total income
29.6% 31.3% 33.3% 33.1% 32.8%
Unrestricted reserves, as % of
total income
81.0% 84.3% 85.0% 85.8% 87.2%
* Restated data submitted by HEIs is an estimate of the 2014-15 financial position under the new
financial reporting standards (FRS 102). Figures are unaudited and are subject to change.
11. Further detail and analysis of the sector’s financial performance, as reported by HEIs in
their 2014-15 financial statements (under the previous financial reporting standard), can be found

7
in HEFCE 2016/041. Annex B compares key financial data for 2014-15 (as per financial
statements) with the restated financial data (following conversion to FRS 102).
12. Unless specified otherwise, all 2014-15 data quoted in this report is restated under
FRS102. However, it is important to note that these restated figures are unaudited and so are
subject to change. Audited data on the sector’s restated 2014-15 financial position will be
submitted by HEIs in December 2016 and will be incorporated into our spring 2017 financial
health report.
13. Projections show that the sector is expecting to report surpluses of 4.3 per cent of total
income in 2015-16 compared with a surplus of 3.2 per cent of total income in 2014-15.
Thereafter, surpluses are expected to fall to 2.3 per cent of income in 2016-17, before rising to
3.3 per cent of income in 2017-18 and 3.4 per cent of income in 2018-19. These are relatively
small margins in which to operate, and mean that even small changes in income or costs could
have a material impact on the financial performance of institutions and the sector.
14. Although sector surplus levels are low overall, the range of surpluses forecast by HEIs
across the sector is expected to be much wider in the forecast period than previously reported: at
50.1 per cent in 2017-18 compared to 30.4 per cent in 2014-15.
15. In analysing the forecasts we have attempted to highlight the limited margins in which the
sector operates by modelling the impact of changes in what HEIs are forecasting for the years
2016-17 to 2018-19. This modelling shows how relatively small changes in key assumptions can
have a significant impact on an HEI’s ability to generate surpluses. Annex C shows a summary of
the results of our modelling.
16. The trend of falling liquidity (cash) and increasing sector borrowing reported previously is
set to continue in the forecast period. The sector expects its liquid funds to fall from £9.1 billion
as at 31 July 2015 to £6.5 billion as at 31 July 2019, equivalent to 83 days of expenditure. At the
same time, the sector expects borrowing to increase from £8.3 billion at the end of July 2015 to
£10.5 billion at the end of July 2019. Borrowing levels are expected to exceed liquidity levels in
all forecast years, with the sector expecting to be in a net debt position of £49 million at 31 July
2016, increasing to £3.9 billion at 31 July 2019. The trend of increasing borrowing and reducing
liquidity is unsustainable in the long term.
17. As charities, HEIs are obligated to ensure that they remain sustainable and do not expose
themselves to undue risk. Strong liquidity is particularly important given the growing level of
uncertainty and risk in the sector and wider economy. We continue to monitor liquidity levels to
assess whether HEIs are able to maintain sufficient cash levels to manage their risks effectively.
European Union
18. Due to the timing of financial forecast submissions to HEFCE, financial projections were
developed by HEIs ahead of the UK’s referendum on its membership of the EU. While the vote to
leave the EU was known by HEIs at the time forecasts were submitted, the majority were not
able to adjust their financial projections to take into account the uncertainty about the outlook for
the UK economy and how they might be affected post-Brexit. As a result, the projected financial
1 Available online at www.hefce.ac.uk/pubs/year/2016/201604/.

8
performance summarised in this report and in Annex A does not reflect the sector’s view of the
potential impacts following the UK’s exit from the EU (which will depend on the outcome of exit
negotiations).
19. In 2014-15, the Higher Education Statistics Agency recorded 83,809 full-time equivalent
(FTE) students in the English HE sector who were categorised as European Union (EU)-
domiciled students whose normal residence prior to commencing their programme of study was
in countries which were EU members. This accounted for 6.5 per cent of total Home and EU
students.
20. In 2014-15 there were 27,005 EU staff FTE, academic and non-academic, working at
HEFCE-funded HEIs. This is equivalent to 10.8 per cent of the total workforce. Of these 19,940
were academic staff, 16.8 per cent of the total academic workforce, Ten institutions reported that
over 25 per cent of their academic workforce were EU nationals. There remains strong
uncertainty around changes to visa requirements for EU migrant workers post-Brexit.
21. Research specific income from the EU to English HEIs in 2014-15 was reported as £688
million, which was 2.5 per cent of total income. In 2014-15 six institutions reported that EU
research income made up over 50 per cent of their total research income. The impact of Brexit
on the non-financial elements of EU research partnerships for English HEIs was also noted as
significant by institutions.
Non-EU students
22. Projections show that the sector expects overseas (non-EU) student numbers to grow
between 1.8 and 5.8 per cent per year over the next four years, with overseas fee income
projected to rise by 33.7 per cent: from £3,555 million in 2014-15 (12.7 per cent of total income)
to £4,754 million in 2018-19 (14.9 per cent of total income). This represents an average annual
increase of 7.5 per cent over the forecast period. This overall figure, however, masks significant
variation in the assumptions used by institutions in predicting their future overseas income levels.
23. Institutions are becoming increasingly reliant on overseas fee income to contribute to the
full economic costs of their teaching and research operations (for the benefit of all students) and
to ensure that they can continue to be financially sustainable. By 2018-19, income generated
through tuition fees from non-EU students is expected to represent 27.5 per cent of all tuition fee
and education contract income.
24. Recruitment of international students is becoming more competitive, both between
institutions and across the global HE market. This is happening at the same time as changes are
introduced to the UK’s immigration regulations; the uncertainty of the impact of the UK’s exit from
the EU increases the risk of a downturn in overseas student recruitment. UCAS data highlights
that 2016-17 overseas acceptances are 1.1 per cent lower than at the same point in the previous
year’s cycle. These facts, taken together, suggest an over-confidence by the sector in student
number forecasts. However, the weaker pound, relative to international currencies, may act as
an incentive to international students and boost overseas student fee income.
25. The new government policy proposals around immigration rules, in particular how they
relate to students recruited from overseas, pose uncertainties which could impact the sector’s
ability to achieve overseas recruitment targets and the financial contribution that this makes.

9
26. A downturn in overseas recruitment would have a significant adverse impact on the
sector’s income and surplus projections. While the sector has been successful in recent years in
attracting more overseas students, future projected growth may not be achieved.
27. Our financial modelling shows that removal of projected growth in overseas fee income
over the next three years (2016-17 to 2018-19) would all but wipe out sector surpluses by 2018-
19, with projected surpluses falling from £1,081 million (3.4 per cent of total income) to £56
million (just 0.2 per cent of total income). Annex C shows a summary of the results of our
modelling.
Undergraduate student recruitment (home and EU)
28. The sector is forecasting a 12.1 per cent growth in full-time home and EU undergraduate
recruitment over the forecast period (comparing 2018-19 with 2014-15), which is an increased
growth expectation on the previous forecast submitted in July 2015 (8.5 per cent comparing
2017-18 with 2013-14). Within this total there are a large number of institutions which expect to
grow significantly more than this. However, there are risks relating to the realistic achievement of
these forecasts. These include whether there will be sufficient growth in demand for
undergraduate courses to overcome the decline in the 18 year-old English population numbers;
any negative impact of Brexit on EU student recruitment; and increases in alternatives to
undergraduate courses.
29. Recent government policy, including the introduction of the apprenticeship levy,
encourages forms of training which offer an alternative to undergraduate courses. These include
higher and degree apprenticeships, and other forms of employer-led apprenticeships and
vocational training. These represent opportunities to HEIs but also may challenge traditional
undergraduate provision, and potentially change the way that employers might approach their
recruitment needs.
30. HEIs expecting growth in home and EU undergraduate recruitment will need to be aware
of these challenges and develop appropriate mitigating plans if planned growth does not
materialise.
Capital investment
31. The latest financial forecasts show that the sector is planning on delivering a substantial
increase in capital investment over the forecast period (2015-16 to 2018-19). At £17.8 billion, this
represents an average annual investment of £4,458 million, 51 per cent higher than the previous
four-year average (2011-12 to 2014-15).
32. Despite this increase, forecasts show that nearly a quarter of HEIs in the sector are
planning to reduce capital expenditure over the forecast period.
33. Investment in infrastructure is particularly important given that the Estates Management
Statistics show that, as at 31 July 2015, the sector still needed to invest £3.6 billion into its non-
residential estate to upgrade its estate. This cost reflects the investment required to restore the
estate to a sound baseline condition, and is not the same as the investment required to bring the
estate up to the standard required to satisfy rising student expectations.
34. At a time of lower public capital funding, institutions must deploy more of their own
resources or raise finance through external borrowing in order to maintain and enhance their

10
infrastructure. This places greater pressure on HEIs to generate higher surpluses to maintain
their sustainability.
35. The latest projections show that the sector is expecting to use £10.8 billion from its own
cash reserves (equivalent to 8.9 per cent of total income) and borrow an additional £3.5 billion to
help fund its capital investment plans in the forecast period.
36. HEIs will inevitably reassess their capital investment plans in light of economic uncertainty,
changing build costs (occurring as a result of currency fluctuations) and their ability to fund
investment levels (by generating additional cash or increasing borrowing). A reduction in capital
investment could lead to significant under-investment in the sector, with institutions that fail to
invest sufficiently in infrastructure finding themselves in a weaker market position and at higher
risk of financial instability.
37. It is also important to recognise that the forecasts assume that the capital markets continue
to have confidence in the sector, which depends upon their risk assessment of the sector and
individual HEIs.
38. Strong surpluses and liquidity help to mitigate risks and raise confidence levels. However,
the growing uncertainties faced by the sector as a result of the UK’s decision to leave the EU,
coinciding with increasing competition in the global HE market, will lead to a greater focus from
investors on the underlying financial strength of HEIs. Consequently, any fall in confidence levels
could restrict the availability of finance in the sector and put significant elements of the
investment programme at risk. Falling confidence levels could also lead to a rise in the costs of
borrowing.
Pensions and reserves
39. Under the new financial reporting standard pension deficits are much higher, with liabilities
relating to the deficit recovery plans for the sector’s multi-employer pension schemes (the largest
of which is the Universities Superannuation Scheme (USS)) now being reflected in institutional
balance sheets. As a result, projected pension liabilities are expected to increase from £4.9
billion at 31 July 15 (under the old financial reporting standards) to £7.2 billion at 31 July 2016
(under FRS 102); an increase of 45.8 per cent.
40. The last formal actuarial valuation for the USS scheme (as at March 2014) confirmed that,
after taking into account the revised benefit structure effective from 1 April 2016, the actuarial
deficit stood at £5.3 billion. However, the indicative valuation based on the 2016 report and
accounts of USS (at 31 March 2016) is reported to be £10 billion2. This not only demonstrates
the significant level of volatility and uncertainty in these valuations but indicates that the sector
will have to take further action to provide for increasing pension deficits, resulting in further
increases in pension costs over the forecast period. The USS scheme is scheduled for a formal
valuation in 2017. In addition, the revaluation of Local Government Pension Schemes (LGPS) as
at 31 March 2016, due to be reported in the near future, is likely to show an increase in the LGPS
deficit which will put further pressures on members to address increasing funding shortfalls.
2 https://www.uss.co.uk/how-uss-is-run/running-uss/annual-reports-and-accounts.

11
41. Reserves are an HEI’s assets less its liabilities and, in very broad terms, can be used as a
proxy of the overall value of an institution. These are the accumulated surpluses of an institution
over its lifetime and are not the same as cash, although an institution could dispose of an asset if
it was surplus to operational requirements (thereby converting it to cash). Until recently, the main
indicator used to assess reserves was the amount of ‘discretionary reserves’ held on an
institution’s balance sheet. Under the new financial reporting framework, this has been replaced
by ‘unrestricted reserves’. Changes introduced under FRS 102 have meant that at sector level,
reserves recognised in financial statements are significantly higher.
42. Before projections for pension deficits are taken into account, unrestricted reserves are
estimated to be £29.7 billion at 31 July 2015, equivalent to 106.2 per cent of total income. This
compares to discretionary reserves under the previous financial reporting arrangements of £18.6
billion at 31 July 2015.
43. After taking into account projections for pension deficits, restated data for 2014-15 show
that the sector expects to report unrestricted reserves of £22.7 billion as at 31 July 2015
(equivalent to 81.0 per cent of total income). This compares to reserves, under the previous
financial reporting arrangements, of £13.6 billion, with much of this increase relating to changes
in the accounting treatment of deferred government capital grants and fixed asset revaluations.
44. Projections show that the sector’s unrestricted reserves will rise to £27.8 billion as at 31
July 2019 (equivalent to 87.2 per cent of total income). Although, as reported in the past, the
sector position masks a significant spread of financial strength, with a concentration of large
reserves in a small number of universities.
Financial stability
45. Following our assessment of the financial outturn for 2014-15, we concluded that the
sector’s financial position is currently stable overall. This is supported by the evidence attained
as part of our annual accountability process. The evidence indicated that short-term viability of
HEIs is not a concern presently, and no institutions are forecast to be close to the risk of
insolvency. This opinion has been supported by independent institutional audits and the sector’s
own projected continuation of positive cash in-flows and healthy cash-backed reserves.
However, the latest projections from HEIs indicate that forecasts are reliant on institutions
achieving home, EU and overseas student recruitment targets, and on the level of government
and EU funding not deteriorating.
46. While currently stable overall, reducing surpluses and cash levels and a rise in borrowing,
signal a general weakening of financial performance and a trajectory that is not sustainable in the
long term. The significant level of uncertainty in the HE sector and UK economy, as well as the
need to sustain a higher level of capital investment to respond to growing competition, will
require institutions to aim for higher surpluses in future.
47. This uncertainty is likely to lead to continued volatility and growing variability in the financial
performance of institutions, together with a widening gap between the lowest and highest
performing HEIs.
Further information
48. Annex A provides further analysis from our review of the sector’s financial forecasts and
supporting information. Annex B summarises the key headline data for 2014-15 from the
12
sector’s financial results (reported by HEIs in March 2016) alongside the sector’s estimated
2014-15 financial position following conversion to FRS102. Annex C summarises the outputs
from our financial modelling, demonstrating the sensitivity of financial forecasts to changes in
key assumptions.

13
Annex A: Detailed analysis of financial forecasts
1. This annex provides an overview and analysis of the forecast financial health of the
HEFCE-funded higher education (HE) sector in England.
Data sources
2. The data used comes from two main sources:
a. Where available, all data up to and including 2013-14 and actual 2014-15 data are
from the Higher Education Statistics Agency’s Finance Statistics Record, which is
completed by higher education institutions (HEIs) each year and is derived from audited
financial statements.
b. 2014-15 data restated under the new financial reporting standard (FRS 102) and
data covering the forecast period 2015-16 to 2018-19 are from HEIs’ financial returns
submitted to HEFCE in July 2016.
All financial information is presented in academic years (ending 31 July). For references to real-
terms changes in performance we have used HM Treasury’s gross domestic product deflator
announced in July 20163, with the base year set as 2015-16.
3. Unless specified otherwise, all 2014-15 data quoted in this report is restated under
FRS102. It is important to note that that these restated figures are unaudited and represent an
estimate of the financial position under FRS102. Audited data on the sector’s restated 2014-
15 financial position will be submitted by HEIs in December 2016 and will be incorporated into
our spring 2017 financial health report.
4. The analysis provided in this report is based on financial forecasts submitted by HEIs to
HEFCE. The accuracy and reliability of these forecasts depends on the assumptions and
strategies adopted by individual HEIs in response to the latest higher education reforms and
prevailing market conditions, as well as the HEI’s interpretation of FRS102 which came into force
during the financial forecast period.
5. These new standards present difficulties in comparing forecast performance with historical
trends, because the new rules have introduced significant changes in the way financial
performance is reported.
6. Financial forecasts were prepared by HEIs prior to the UK’s referendum on its membership
of the European Union (EU). While the referendum result was known at the time forecasts were
submitted to HEFCE, there was, and still is, much uncertainty about the UK’s economic outlook
and how HEIs will be affected post-Brexit. As a result, the majority of HEIs chose not to adjust
their financial projections and so, on the whole, the financial forecasts summarised in this report
do not reflect the sector’s view of the potential impacts following the UK’s exit from the EU.
Key risks
7. In preparing their financial forecasts, institutions identified a number of risks that could
adversely affect their financial performance and sustainability. The most significant risk areas
relate to:
3 See https://www.gov.uk/government/statistics.
14
fall in home and EU student recruitment and retention
failure to achieve overseas student recruitment targets
failure to meet academic quality standards or meet student expectations
failure to recruit and retain key staff
further unanticipated public spending cuts in research or teaching income
rise in the cost of borrowing and availability of lending
rise in staff and pension costs
non-compliance with visa regulations
failure to invest sufficiently in IT and estates
failures or breaches of IT security
8. The accuracy and reliability of the financial forecasts relies on what assumptions HEIs
have made and to what extent they have taken the risks above into account, as well as the
strategies adopted by individual HEIs in response to the latest higher education reforms and
prevailing market conditions.
9. Uncertainties over future student recruitment (home, EU and overseas), government and
EU funding levels and future pension costs are unknown factors that will inevitably reduce the
reliability and increase the volatility of forecasts in the sector.
10. It is important to note that HEIs continue to undertake their own scenario planning and
sensitivity analysis to assist them in developing their financial forecasts. We encourage
institutions to continue to assess the potential impacts of future changes on their operations and,
where necessary, to identify mitigating actions. This scenario planning will need to consider
potential impacts of changes in student recruitment levels, the availability of government and EU
funding, student fee levels, and pay and pensions costs.
11. HEFCE institutional teams, in their regular engagement with HEIs, will continue to discuss
the actions being taken by the sector to mitigate adverse impacts.
Forecast performance 2015-16 to 2018-19
12. Overall, the forecasts show that the sector is projecting total income to rise by 14.1 per
cent, from £27,973 million in 2014-15 to £31,917 million in 2018-19. Surpluses are projected to
rise from 3.2 per cent in 2014-15 to 4.3 per cent of income in 2015-16. However, increases in
staff costs will cause sector surpluses to fall to 2.3 per cent of income in 2016-17, before rising
again the in 2017-18 and 2018-19 (to 3.3 per cent and 3.4 per cent of income).
13. Cash flow from operating activities is expected to be lower between 2015-16 and 2017-18,
ranging from 7.3 per cent to 8.6 per cent of total income, compared with 9.1 per cent of income in
2014-15; however this is projected to rise to 2014-15 levels by 2018-19.
14. The trend of falling liquidity and increasing sector borrowing continues in the forecast
period, with the sector expecting its liquid funds to fall from £9.1 billion as at 31 July 2015
(equivalent to 131 days of expenditure) to £6.5 billion as at 31 July 2019 (equivalent to 83 days
of expenditure). At the same time, the sector expects borrowing to increase from £8.3 billion at
the end of July 2015 to £10.5 billion at the end of July 2019.
15
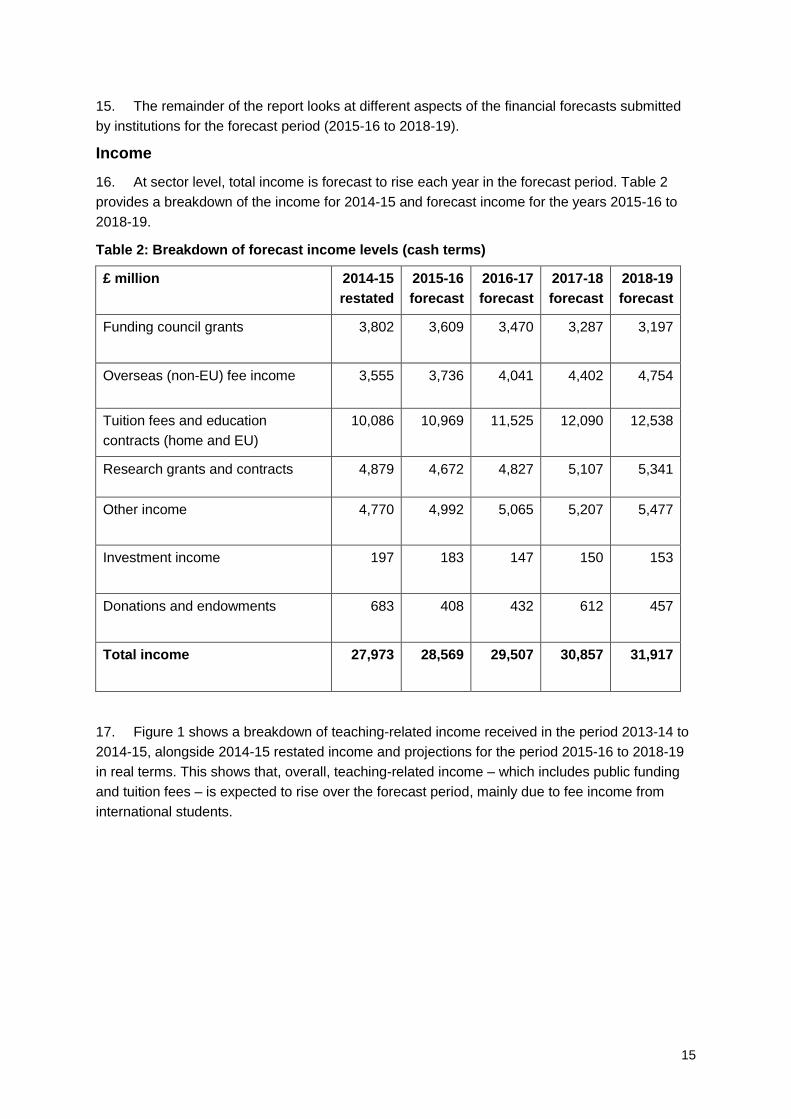
15. The remainder of the report looks at different aspects of the financial forecasts submitted
by institutions for the forecast period (2015-16 to 2018-19).
Income
16. At sector level, total income is forecast to rise each year in the forecast period. Table 2
provides a breakdown of the income for 2014-15 and forecast income for the years 2015-16 to
2018-19.
Table 2: Breakdown of forecast income levels (cash terms)
£ million 2014-15
restated
2015-16
forecast
2016-17
forecast
2017-18
forecast
2018-19
forecast
Funding council grants 3,802 3,609 3,470 3,287 3,197
Overseas (non-EU) fee income 3,555 3,736 4,041 4,402 4,754
Tuition fees and education
contracts (home and EU)
10,086 10,969 11,525 12,090 12,538
Research grants and contracts 4,879 4,672 4,827 5,107 5,341
Other income 4,770 4,992 5,065 5,207 5,477
Investment income 197 183 147 150 153
Donations and endowments 683 408 432 612 457
Total income 27,973 28,569 29,507 30,857 31,917
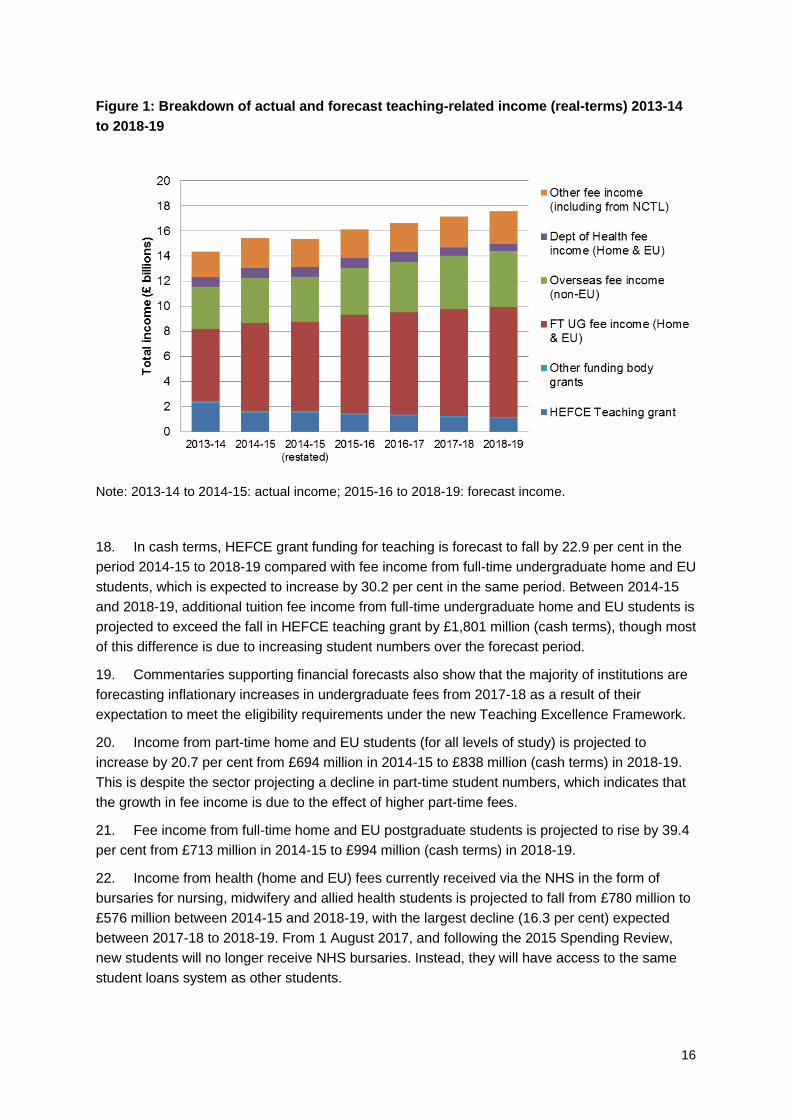
17. Figure 1 shows a breakdown of teaching-related income received in the period 2013-14 to
2014-15, alongside 2014-15 restated income and projections for the period 2015-16 to 2018-19
in real terms. This shows that, overall, teaching-related income – which includes public funding
and tuition fees – is expected to rise over the forecast period, mainly due to fee income from
international students.
16
Figure 1: Breakdown of actual and forecast teaching-related income (real-terms) 2013-14
to 2018-19
Note: 2013-14 to 2014-15: actual income; 2015-16 to 2018-19: forecast income.
18. In cash terms, HEFCE grant funding for teaching is forecast to fall by 22.9 per cent in the
period 2014-15 to 2018-19 compared with fee income from full-time undergraduate home and EU
students, which is expected to increase by 30.2 per cent in the same period. Between 2014-15
and 2018-19, additional tuition fee income from full-time undergraduate home and EU students is
projected to exceed the fall in HEFCE teaching grant by £1,801 million (cash terms), though most
of this difference is due to increasing student numbers over the forecast period.
19. Commentaries supporting financial forecasts also show that the majority of institutions are
forecasting inflationary increases in undergraduate fees from 2017-18 as a result of their
expectation to meet the eligibility requirements under the new Teaching Excellence Framework.
20. Income from part-time home and EU students (for all levels of study) is projected to
increase by 20.7 per cent from £694 million in 2014-15 to £838 million (cash terms) in 2018-19.
This is despite the sector projecting a decline in part-time student numbers, which indicates that
the growth in fee income is due to the effect of higher part-time fees.
21. Fee income from full-time home and EU postgraduate students is projected to rise by 39.4
per cent from £713 million in 2014-15 to £994 million (cash terms) in 2018-19.
22. Income from health (home and EU) fees currently received via the NHS in the form of
bursaries for nursing, midwifery and allied health students is projected to fall from £780 million to
£576 million between 2014-15 and 2018-19, with the largest decline (16.3 per cent) expected
between 2017-18 to 2018-19. From 1 August 2017, and following the 2015 Spending Review,
new students will no longer receive NHS bursaries. Instead, they will have access to the same
student loans system as other students.
17
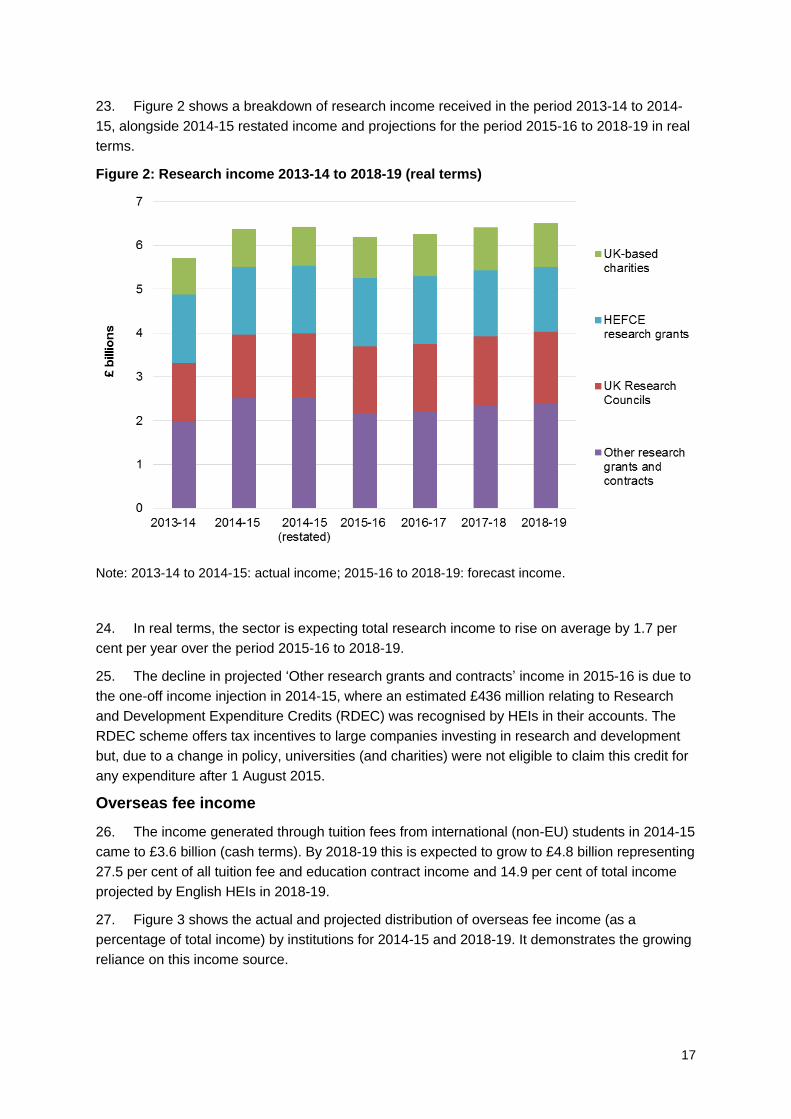
23. Figure 2 shows a breakdown of research income received in the period 2013-14 to 2014-
15, alongside 2014-15 restated income and projections for the period 2015-16 to 2018-19 in real
terms.
Figure 2: Research income 2013-14 to 2018-19 (real terms)
Note: 2013-14 to 2014-15: actual income; 2015-16 to 2018-19: forecast income.
24. In real terms, the sector is expecting total research income to rise on average by 1.7 per
cent per year over the period 2015-16 to 2018-19.
25. The decline in projected ‘Other research grants and contracts’ income in 2015-16 is due to
the one-off income injection in 2014-15, where an estimated £436 million relating to Research
and Development Expenditure Credits (RDEC) was recognised by HEIs in their accounts. The
RDEC scheme offers tax incentives to large companies investing in research and development
but, due to a change in policy, universities (and charities) were not eligible to claim this credit for
any expenditure after 1 August 2015.
Overseas fee income
26. The income generated through tuition fees from international (non-EU) students in 2014-15
came to £3.6 billion (cash terms). By 2018-19 this is expected to grow to £4.8 billion representing
27.5 per cent of all tuition fee and education contract income and 14.9 per cent of total income
projected by English HEIs in 2018-19.
27. Figure 3 shows the actual and projected distribution of overseas fee income (as a
percentage of total income) by institutions for 2014-15 and 2018-19. It demonstrates the growing
reliance on this income source.

18
Figure 3: Distribution of overseas fee income as a percentage of total income by number
of HEIs, 2014-15 vs 2018-19 forecast
28. Overall, the sector is projecting a real-terms rise in overseas income of 25.9 per cent
(comparing 2018-19 with 2014-15), equivalent to an average annual increase of 5.9 per cent –
though this disguises significant variation in assumptions used by institutions in predicting their
future overseas income levels. This variation can be seen in Figure 4, which shows the projected
changes in overseas fee income by institution between 2014-15 and 2018-19.
Figure 4: Forecast real-terms change in overseas fee income between 2014-15 and 2018-19
Note: Excludes three outliers.
Sector average 25.9%

19
Student recruitment
29. As part of the financial forecasts, institutions were asked to send us student number
projections for each of the forecast periods (2014-15 to 2018-19). These forecasts show total
projected student numbers for all years of study broken down by mode and level of study.
30. Further analysis of student number projections for home, EU and overseas (non-EU) is
shown below. Also included is UCAS data, which provides early indications of student
recruitment for 2016-17.
Home and EU
31. Full-time home and EU undergraduate student number projections show an increase
(across all years of study) in 2015-16 and each year to 2018-19. There is, however, a great deal
of variability between institutional projections, heightened by the uncertainty following the EU
referendum result.
32. Figure 5 shows the forecast changes in full-time home and EU undergraduate student
numbers (expressed as full-time equivalents) between 2014-15 and 2018-19 for all institutions
and across all years of study. This gives an indication of the variation in assumptions used by
institutions in developing their financial forecasts.
Figure 5: Forecast change in full-time home and EU undergraduate student numbers
between 2014-15 and 2018-9
Note: Excludes one outlier.
Sector average 12.1%
20
33. At an aggregate level, full-time home and EU undergraduate student numbers (across all
years of study) are expected to rise by 12.1 per cent by the end of the forecast period (comparing
2018-19 with 2014-15). This represents an increased growth expectation on previous forecasts
submitted by HEIs in July 2015, which projected an 8.5 per cent rise (comparing 2017-18 with
2014-15). There are risks relating to the realistic achievement of this growth, however. These
include:
whether there will be sufficient growth in demand for undergraduate courses to
overcome the declining population of 18 year-olds (ONS data projects a decline in the
18 year-old English population of 9.1 per cent (or, taken together, an English and EU
decline of 1.8 per cent) over the forecast period
any negative impact of Brexit on EU student recruitment
increases in alternative training routes to undergraduate courses.
34. Recent government policy, including the introduction of the apprenticeship levy,
encourages forms of training which offer an alternative to undergraduate courses at HEIs. These
include higher and degree apprenticeships, and other forms of employer-led apprenticeships and
vocational training. These represent opportunities to HEIs, but also challenge traditional
undergraduate provision and potentially change the way that employers might approach their
recruitment needs. A recent survey of 86 large businesses by the Association of Graduate
Recruiters (AGR) indicated that apprenticeship opportunities offered by these firms has
increased by 24 per cent year-on-year, while graduate vacancies grew by just 2 per cent.
35. HEIs expecting growth in full-time undergraduate recruitment will need to be aware of
these challenges and develop appropriate mitigating plans should planned growth not
materialise.
36. Despite a projected increase in numbers of full-time undergraduate students, the sector
expects the decline in part-time undergraduate student numbers to continue, with home and EU
part-time student numbers expected to be 7.7 per cent lower in 2017-18 compared with 2014-15
before recovering slightly (1.2 per cent) in 2018-19.
37. Figure 6 shows the number of part-time undergraduate students for all years of study
(expressed as full-time equivalents) reported or projected by the sector for the period 2012-13 to
2018-19.
21
Figure 6: Part-time home and EU undergraduate student numbers 2012-13 to 2018-19
38. Full-time home and EU postgraduate taught (PGT) student numbers are expected to rise
by 5.9 per cent in 2015-16, followed by increases of between 3.0 and 6.1 per cent per year
between 2016-17 and 2018-19. Part-time home and EU PGT student numbers are expected to
fall by 3.4 per cent in 2015-16, before rising by 1.9 per cent, 2.3 per cent and 2.3 per cent in
2016-17, 2017-18 and 2018-19 respectively.
39. Figure 7 shows the number of full- and part-time postgraduate taught students for all years
of study (expressed as full-time equivalents) reported by the sector in 2012-13 to 2014-15, as
well as the student numbers projected by the sector for the period 2015-16 to 2018-19. The
percentage change in student numbers compared to the previous year is also shown (in
brackets).

22
Figure 7: Postgraduate taught home and EU taught student numbers 2012-13 to 2018-19
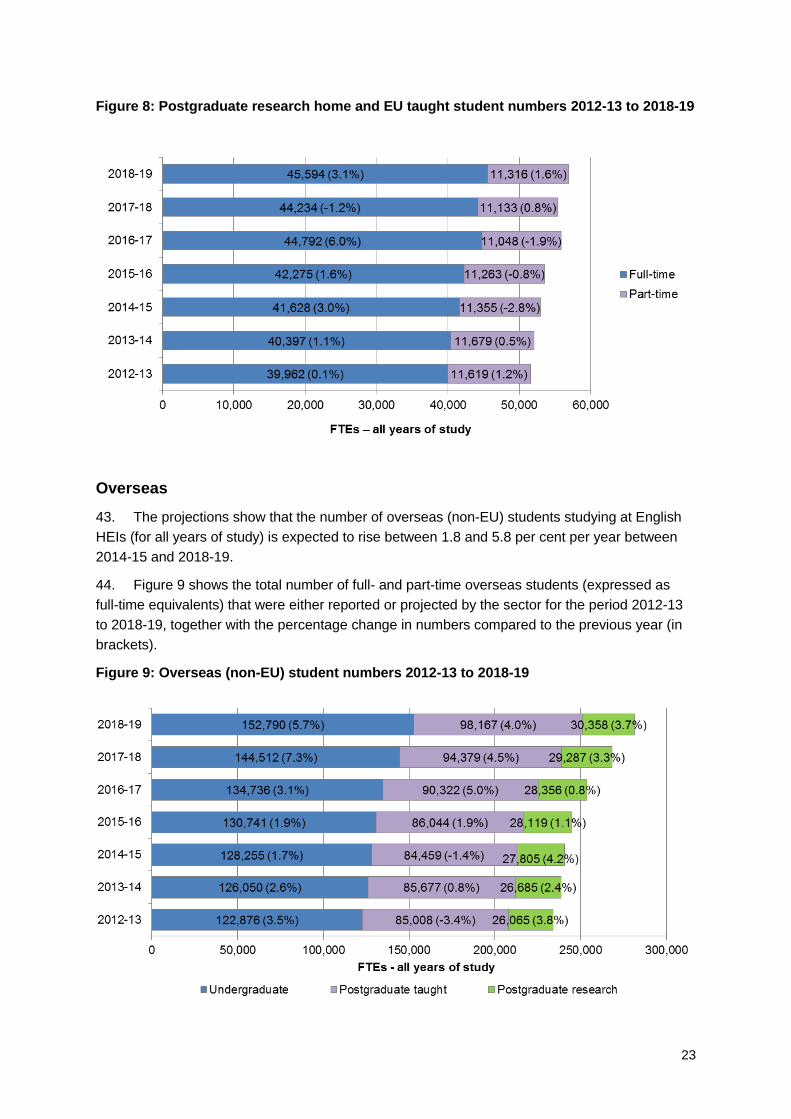
40. Projections for postgraduate research (PGR) study show that the sector is expecting full-
time home and EU student numbers to increase by 1.6 per cent in 2015-16 and 6.0 per cent in
2016-17 before declining slightly (1.2 per cent) in 2017-18. Student numbers are then expected
to begin to recover in 2018-19, with an increase of 3.1 per cent on the previous year.
41. Part-time PGR student numbers are expected to fall by 0.8 per cent in 2015-16 and 1.9 per
cent in 2016-17, before increasing in 2017-18 and 2018-19 by 0.8 and 1.6 per cent respectively.
42. Figure 8 shows the number of full- and part-time postgraduate research students
(expressed as full-time equivalents) reported or projected by the sector for the period 2011-12 to
2017-18, together with the percentage change in numbers compared to the previous year (in
brackets).
23
Figure 8: Postgraduate research home and EU taught student numbers 2012-13 to 2018-19
Overseas
43. The projections show that the number of overseas (non-EU) students studying at English
HEIs (for all years of study) is expected to rise between 1.8 and 5.8 per cent per year between
2014-15 and 2018-19.
44. Figure 9 shows the total number of full- and part-time overseas students (expressed as
full-time equivalents) that were either reported or projected by the sector for the period 2012-13
to 2018-19, together with the percentage change in numbers compared to the previous year (in
brackets).
Figure 9: Overseas (non-EU) student numbers 2012-13 to 2018-19

24
45. While total non-EU student numbers are expected to rise, forecasts show that the sector is
expecting part-time non-EU students numbers to fall in 2015-16 and 2016-17 (by 10.9 per cent
and 0.8 per cent respectively) before rising by 1.0 per cent and 9.1 per cent in 2017-18 and
2018-19.
46. Recruitment of international students is becoming increasingly competitive, which
increases the risk of a downturn in non-EU students coming to the UK to study. Countries such
as Australia, New Zealand and Canada are increasing their market share following strong
recruitment campaigns and government-supported international student recruitment strategies.
This is happening at the same time as changes are introduced to the UK’s immigration
regulations, including reductions in post-study work opportunities.
47. Overall, there is a growing risk that the sector will be unable to deliver the level of growth of
non-EU student numbers projected in their forecasts. This would have a significant adverse
impact on the sector’s income and surplus projections. However, the weaker pound, relative to
international currencies, may assist the recruitment of overseas students.
UCAS
48. UCAS data only partially reflects trends in student numbers, as data is restricted to those
students applying to study full-time undergraduate courses through the UCAS system. Final
numbers of home and EU student new entrants in 2016-17 will not be known until the HEFCE
aggregate student number surveys are available later this year. However, the interim UCAS
figures published in September 20164 revealed an overall 1.1 per cent increase in acceptances
to English institutions for the 2016-17 entry year compared to the equivalent point in the 2015
cycle. EU acceptances have increased by 7.3 per cent in comparison to the previous year and
home by 0.7 per cent over the same period.
49. 2016-17 data suggests a decline of 1.1 per cent in overseas (non-EU) acceptances in
comparison to 2015-16. This is below forecasts made by institutions for 2016-17, and suggests a
degree of over-confidence.
Expenditure
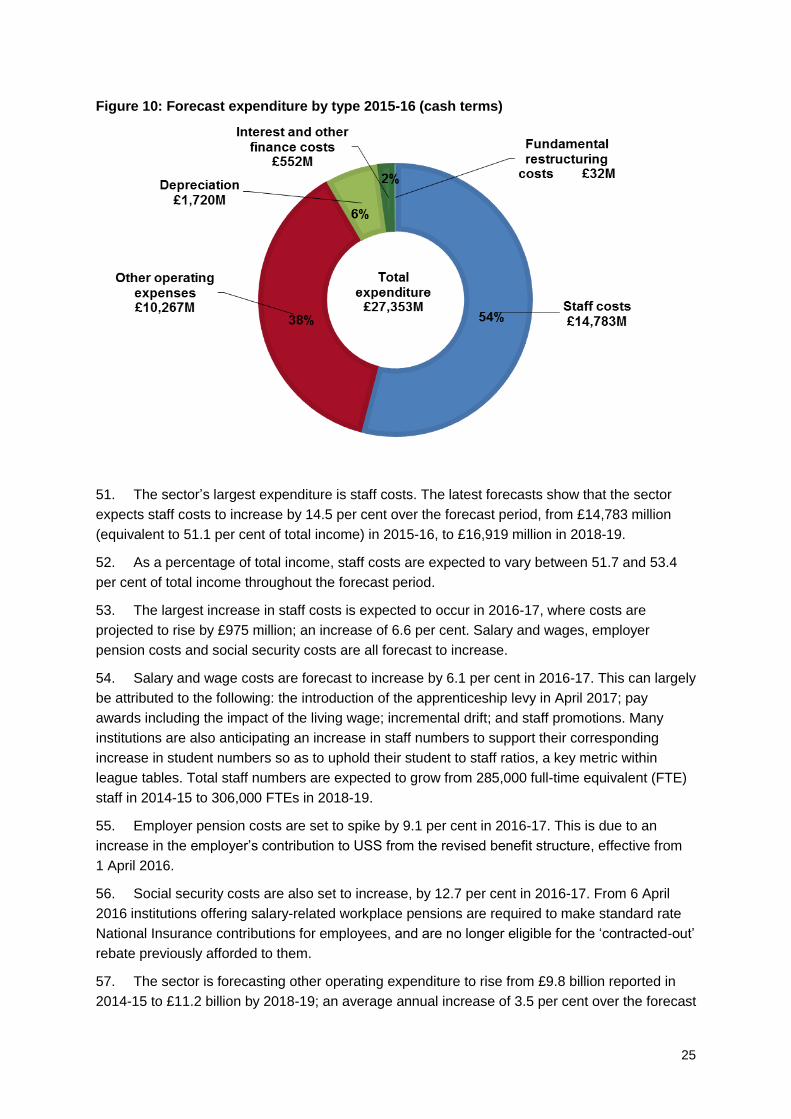
50. Forecasts for 2015-16 show that the sector is projecting total expenditure to rise by 1.0 per
cent, from £27,071 million in 2014-15 (restated) to £27,353 million in 2015-16. However, larger
rises are expected over the remainder of the forecast period, with expenditure projected to reach
£30,837 million by 2018-19. Figure 10 shows the breakdown of projected expenditure (in cash
terms) in 2015-16.
4 See ‘Interim assessment of UCAS acceptances by intended entry year, country of institution and
qualifications held’ https://www.ucas.com/corporate/data-and-analysis/ucas-undergraduate-
releases/ucas-undergraduate-analysis-reports.
25
Figure 10: Forecast expenditure by type 2015-16 (cash terms)
51. The sector’s largest expenditure is staff costs. The latest forecasts show that the sector
expects staff costs to increase by 14.5 per cent over the forecast period, from £14,783 million
(equivalent to 51.1 per cent of total income) in 2015-16, to £16,919 million in 2018-19.
52. As a percentage of total income, staff costs are expected to vary between 51.7 and 53.4
per cent of total income throughout the forecast period.
53. The largest increase in staff costs is expected to occur in 2016-17, where costs are
projected to rise by £975 million; an increase of 6.6 per cent. Salary and wages, employer
pension costs and social security costs are all forecast to increase.
54. Salary and wage costs are forecast to increase by 6.1 per cent in 2016-17. This can largely
be attributed to the following: the introduction of the apprenticeship levy in April 2017; pay
awards including the impact of the living wage; incremental drift; and staff promotions. Many
institutions are also anticipating an increase in staff numbers to support their corresponding
increase in student numbers so as to uphold their student to staff ratios, a key metric within
league tables. Total staff numbers are expected to grow from 285,000 full-time equivalent (FTE)
staff in 2014-15 to 306,000 FTEs in 2018-19.
55. Employer pension costs are set to spike by 9.1 per cent in 2016-17. This is due to an
increase in the employer’s contribution to USS from the revised benefit structure, effective from
1 April 2016.
56. Social security costs are also set to increase, by 12.7 per cent in 2016-17. From 6 April
2016 institutions offering salary-related workplace pensions are required to make standard rate
National Insurance contributions for employees, and are no longer eligible for the ‘contracted-out’
rebate previously afforded to them.
57. The sector is forecasting other operating expenditure to rise from £9.8 billion reported in
2014-15 to £11.2 billion by 2018-19; an average annual increase of 3.5 per cent over the forecast
26
period. Depreciation is expected to rise annually between 3.5 per cent and 8.2 per cent between
2015-16 and 2018-19.
58. Financial projections show much higher interest and finance costs in the forecast period,
with interest costs expected to rise from £358 million in 2014-15 (as reported in December 2015)
to £601 million by 2018-19. Much of this increase is due to the change to Financial Reporting
Standard 102, which requires institutions to report the interest element of liabilities relating to
deficit recovery plans for their multi-employer pension schemes (such as the USS) and the
financial commitments relating to finance leases and service concession arrangements (such as
contracts with private operators to maintain an institution’s student accommodation). Increases
also reflect the sector’s rising investment in physical infrastructure and increasing levels of
external borrowing.
Surpluses
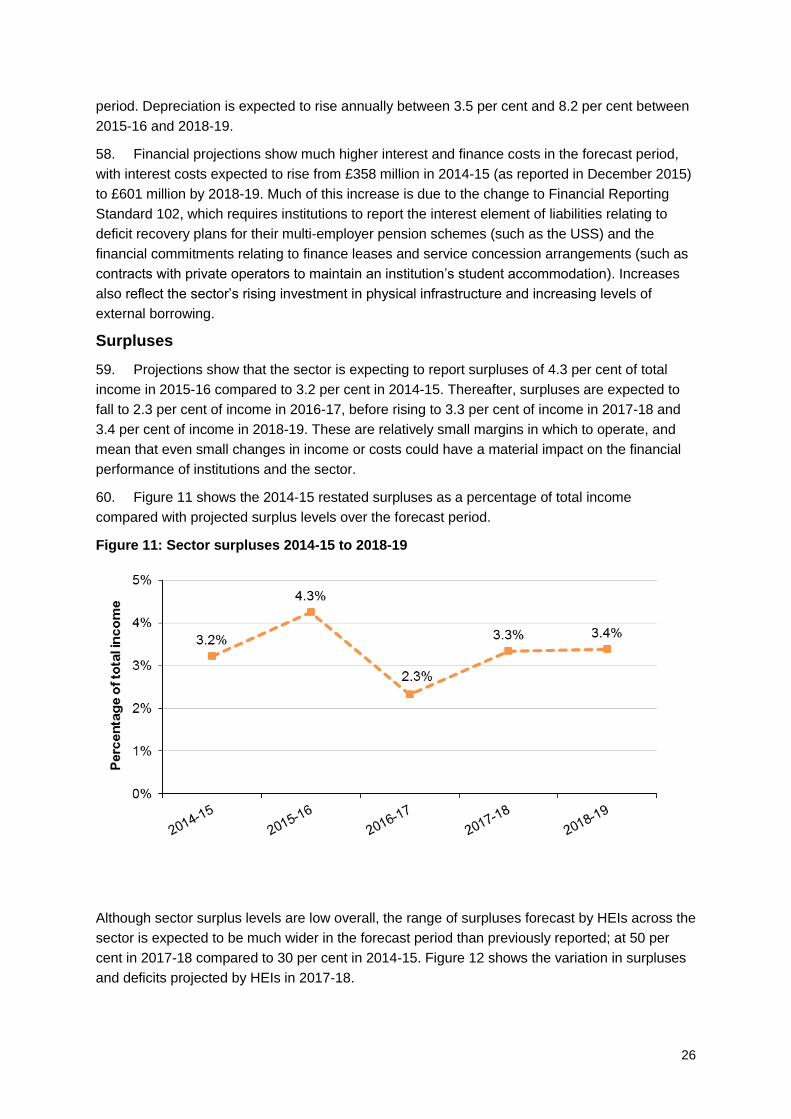
59. Projections show that the sector is expecting to report surpluses of 4.3 per cent of total
income in 2015-16 compared to 3.2 per cent in 2014-15. Thereafter, surpluses are expected to
fall to 2.3 per cent of income in 2016-17, before rising to 3.3 per cent of income in 2017-18 and
3.4 per cent of income in 2018-19. These are relatively small margins in which to operate, and
mean that even small changes in income or costs could have a material impact on the financial
performance of institutions and the sector.
60. Figure 11 shows the 2014-15 restated surpluses as a percentage of total income
compared with projected surplus levels over the forecast period.
Figure 11: Sector surpluses 2014-15 to 2018-19
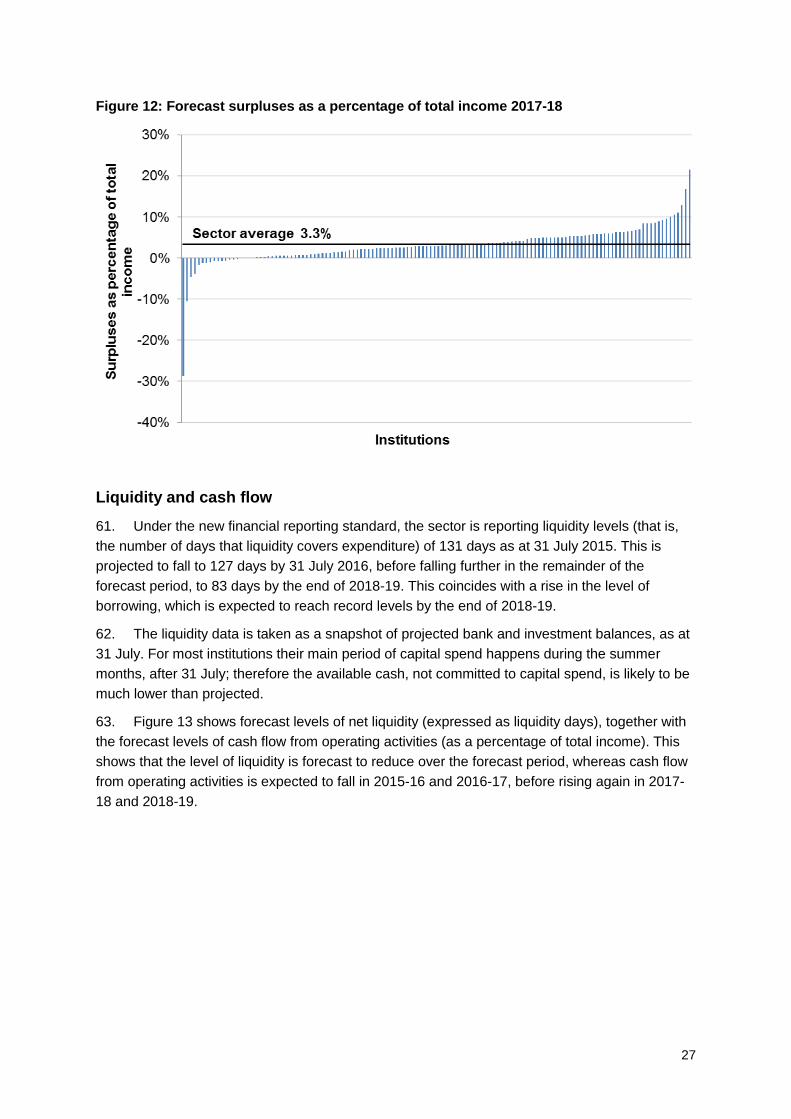
Although sector surplus levels are low overall, the range of surpluses forecast by HEIs across the
sector is expected to be much wider in the forecast period than previously reported; at 50 per
cent in 2017-18 compared to 30 per cent in 2014-15. Figure 12 shows the variation in surpluses
and deficits projected by HEIs in 2017-18.
27
Figure 12: Forecast surpluses as a percentage of total income 2017-18
Liquidity and cash flow
61. Under the new financial reporting standard, the sector is reporting liquidity levels (that is,
the number of days that liquidity covers expenditure) of 131 days as at 31 July 2015. This is
projected to fall to 127 days by 31 July 2016, before falling further in the remainder of the
forecast period, to 83 days by the end of 2018-19. This coincides with a rise in the level of
borrowing, which is expected to reach record levels by the end of 2018-19.
62. The liquidity data is taken as a snapshot of projected bank and investment balances, as at
31 July. For most institutions their main period of capital spend happens during the summer
months, after 31 July; therefore the available cash, not committed to capital spend, is likely to be
much lower than projected.
63. Figure 13 shows forecast levels of net liquidity (expressed as liquidity days), together with
the forecast levels of cash flow from operating activities (as a percentage of total income). This
shows that the level of liquidity is forecast to reduce over the forecast period, whereas cash flow
from operating activities is expected to fall in 2015-16 and 2016-17, before rising again in 2017-
18 and 2018-19.

28
Figure 13: Net liquidity and cash flow 2014-15 to 2018-19
64. Eleven institutions are expecting to report negative cash flows in 2015-16 (compared with
seven institutions in 2014-15). This number is expected to rise to 12 in 2016-17 and fall to four by
2018-19. In 2015-16, the range of cash flows across the sector is projected to be 46.0 per cent,
although this increases to 56.5 per cent by 2018-19.
65. Three institutions are expecting to report liquidity of less than 20 days in 2015-16
(compared with two HEIs in 2014-15). This number is expected to rise to ten by 2017-18 before
dropping to eight in 2018-19, although the risk of solvency problems in the sector remains low.
66. While liquidity is not a concern at this time, as charities HEIs are obligated to ensure that
they remain sustainable and do not expose themselves to undue risk. Strong liquidity is
particularly important given the level of uncertainty and risk that currently exist in the sector, and
we continue to monitor liquidity levels to assess whether HEIs are able to maintain sufficient cash
levels to manage their risks effectively and to finance investment in infrastructure.
Capital expenditure and borrowing
67. Since 2005 the sector has spent £26.5 billion on improving its physical infrastructure,
excluding expenditure on general day-to-day maintenance.
68. Despite this, Estate Management Statistics data, as at 31 July 2015, showed that the
sector still needed to invest £3.6 billion to bring its non-residential estate up to a sound and
operationally safe condition. This cost reflects the investment required to restore the estate to a
sound baseline condition, and is not the same as the investment required to bring the estate up
to the standard required to satisfy rising student expectations. This latter investment is essential
for enabling HEIs to compete in the increasingly competitive global market.
69. These latest forecasts show that the sector is expecting to significantly increase
investment in its estate, with projections showing capital expenditure in excess of £17.8 billion
(2015-16 and 2018-19). This is equivalent to an average of £4,458 million per annum; a 51 per
cent rise on the previous four-year average, which was £2,957 million (2011-12 to 2014-15).

29
However, nearly a quarter of HEIs in the sector are forecasting lower capital expenditure over the
forecast period.
70. Figure 14 provides an indication of how the sector expects to fund capital expenditure over
the forecast period. This shows the largest capital investment is expected in 2016-17, totalling
£5,287 million, with the increase in investment funded primarily through its own cash reserves.
Figure 14: Capital expenditure funding projections 2015-16 to 2018-19
71. Cash inflows from operating activities projected by the sector for 2015-16 are sufficient to
finance any expenditure plans not financed by capital grants or borrowings. However,
expenditure projections in the following two years will require close cash flow management, as
forecasts indicate that the sector requires another £1.5 billion from its own cash reserves (in
excess to the projected surpluses and cash inflows) to fund the capital expenditure shortfall for
those years. In the absence of alternative financing, this will result in the sector’s projected cash
levels to fall further.
72. HEIs will inevitably reassess their capital investment plans in light of economic uncertainty,
changing build costs (occurring as a result of currency fluctuations) and their ability to fund
planned investment levels (by generating additional cash or increasing borrowing). A reduction in
capital investment could lead to significant under-investment in the sector, with institutions that
fail to invest sufficiently in infrastructure finding themselves in a weaker market position and at
higher risk of financial instability.
73. With significantly reduced levels of publicly funded capital grants, HEIs will need to
generate surpluses and operating cash inflows to sustain the level of capital investment needed
to attract students and staff, and ensure their long-term sustainability. In the short term this level
of capital investment is affordable given the cash reserves held by the sector; however, the
sector will be unable to sustain it unless institutions generate increased surpluses.

30
Borrowing
74. Forecasts show that the sector expects its borrowings to rise over the forecast period, from
£8.3 billion at the end of 2014-15 to £10.5 billion by the end of 2018-19.
75. As part of the Memorandum of Assurance and Accountability (MAA) between HEFCE and
institutions, we introduced an approval process to assess whether increases in financial
commitments by an HEI above a threshold would increase the risk to its future financial
sustainability, and therefore to the public and collective student interests. This approval process,
which uses a threshold based on an HEI’s earnings before interest, tax, depreciation and
amortisation (EBITDA), has been operating since 1 August 2014.
76. The adoption of the new financial reporting standard has implications for the financial
commitment threshold, and we are undertaking modelling to assess whether a revised approach
using adjusted operating cash flow would be more appropriate when assessing financial
commitments. We expect to introduce a new approach to financial commitments from 1 August
2017.
77. Availability of finance has not been an issue for the HE sector over recent years. The
changes in the financial markets in 2012 led to lenders reducing the repayment periods on new
loans, though there are now signs that repayment periods are increasing. The sector continues
to look at different options for financial investment, including private and public bonds. The
number of financial covenants attached to borrowing agreements appears to be increasing, with
covenants covering both financial performance and balance sheet strength. Interest rates overall
remain low for the sector, reflecting the confidence of lenders to the sector, but the spread in
margins between different types of institution has increased considerably.
78. The average level of borrowing has been rising within the sector for some time. In 2001-02,
the level of borrowing was 19.6 per cent of total income, and by the end of 2014-15 this had risen
to 29.6 per cent. This is projected to rise further to a high of 33.3 per cent by the end of 2016-17,
before falling to 32.8 per cent by the end of 2018-19.
79. Figure 15 shows the forecast level of external borrowing as a percentage of total income
as at 31 July 2019.

31
Figure 15: Forecast external borrowing as a percentage of total income 2018-19
Note: Excludes one outlier.
80. Some of this rise is a result of the new financial reporting rules, which introduced new
criteria for an institution to assess and recognise financial commitments relating to its service
concession arrangements (in which an institution contracts with a private operator to develop,
operate and maintain its infrastructure assets, such as student accommodation). This means that
financial commitments are being recognised on an institution’s balance sheet which might
previously have been treated ‘off balance sheet’. Although not new borrowing, this may impact
on the perceived indebtedness of the sector.
81. As borrowing rises in the sector, interest payments are expected to increase. The increase
in payments to service borrowing costs (interest and capital payments) will be affordable as long
as income and cash projections are as currently forecast. However, this rise in ‘fixed costs’ could
put pressure on any institution that fails to constrain other costs or to increase income.
Pensions and reserves
82. Under the new financial reporting standard, pension deficits are much higher, with liabilities
relating to the deficit recovery plans for the sector’s multi-employer pension schemes (the largest
of which is the Universities Superannuation Scheme (USS)) now being reflected in institutional
balance sheets. As a result, pension liabilities at 31 July 2015 are expected to increase from £4.9
billion (under the old financial reporting standard) to £7.0 billion (restated under FRS102); an
increase of 42.8 per cent.
The formal actuarial valuation for the USS scheme (as at March 2014) confirmed that, after
taking into account the revised benefit structure effective from 1 April 2016, the actuarial deficit
stood at £5.3 billion. This compares with the previous full triennial assessment, which valued the
deficit at £2.9 billion as at the end of March 2011, and demonstrates the significant level of
32
volatility in these valuations. The next formal valuation of USS will be in 2017; however, the
indicative valuation based on the 2016 report and accounts of USS (at 31 March 2016) is
reported to be £10 billion5. In addition, the revaluation of Local Government Pension Schemes
(LGPS) as at 31 March 2016, due to be reported in the near future, is likely to show an increase
in the LGPS deficit which will put further pressures on members to address increasing funding
shortfalls.
83. A complex mix of factors is contributing to the growing pension’s deficit across the sector,
not least the prevailing economic conditions and the performance of asset investments. Further
action is likely to be taken on those areas which are within the control of the sector, to revaluate
pension provision and provide for increasing pension deficits. This will likely result in further
increases in pension costs over the forecast period.
84. Reserves are an HEI’s assets less its liabilities and, in very broad terms, can be used as a
proxy of the overall value of an institution. These are the accumulated surpluses of an institution
over its lifetime and are not the same as cash, although an institution could dispose of an asset if
it was surplus to operational requirements (thereby converting it to cash). Until recently, the main
indicator used to assess reserves was the amount of ‘discretionary reserves’ held on an
institutions balance sheet. Under the new financial reporting framework, this has been replaced
by ‘unrestricted reserves’.
85. Changes introduced under FRS 102 have also meant that reserves reported at sector level
are much higher. This increase is primarily due to changes in the accounting treatment of
deferred government capital grants and fixed asset revaluations.
86. Before projections for pension deficits are taken into account, unrestricted reserves under
FRS102 are estimated to be £29.7 billion at 31 July 2015, equivalent to 106.2 per cent of total
income. This compares to discretionary reserves under the previous financial reporting
arrangements of £18.6 billion at 31 July 2015.
87. After taking into account projections for pension deficits, unrestricted reserves under
FRS102 are expected to total £22.7 billion at 31 July 2015 (equivalent to 81.0 per cent of total
income) and to rise to £27.8 billion as at 31 July 2019 (equivalent to 87.2 per cent of total
income). However, the aggregate sector position masks a significant spread of financial strength:
there is a concentration of large unrestricted reserves in a small number of institutions, and this
concentration is likely to continue throughout the forecast period.
88. Figure 16 shows the forecast level of unrestricted reserves including pension liabilities as a
percentage of total income for 2015-16.
5 https://www.uss.co.uk/how-uss-is-run/running-uss/annual-reports-and-accounts.

33
Figure 16: Forecast unrestricted reserves including pension liabilities as a percentage of
total income 2015-16
Note: Excludes one outlier.
Disclaimer
89. This report, which is based on information provided by HEFCE-funded higher education
institutions, has been prepared for the benefit of HEIs and their stakeholders in general terms.
HEFCE cannot reasonably foresee the various specific uses that may be made of this report, and
therefore no responsibility is accepted for any reliance any third party may place upon it.
34
Annex B: Changes to 2014-15 following FRS 102 conversion
1. Financial Reporting Standard (FRS) 102 is the new financial reporting framework
applicable for higher and further education providers for reporting periods starting on or after 1
January 2015, and introduces some significant changes in the way financial performance is
reported.
2. Financial forecasts submitted to HEFCE for the period 2015-16 to 2018-19 have been
prepared in accordance with the new framework. Higher education institutions (HEIs) were also
required to submit restated 2014-15 audited financial statements (and the opening balance sheet
for that year) under FRS 102. These restated figures are unaudited and so are subject to
change. Audited data on the sector’s restated 2014-15 financial position under FRS 102 will be
submitted by HEIs in December 2016.
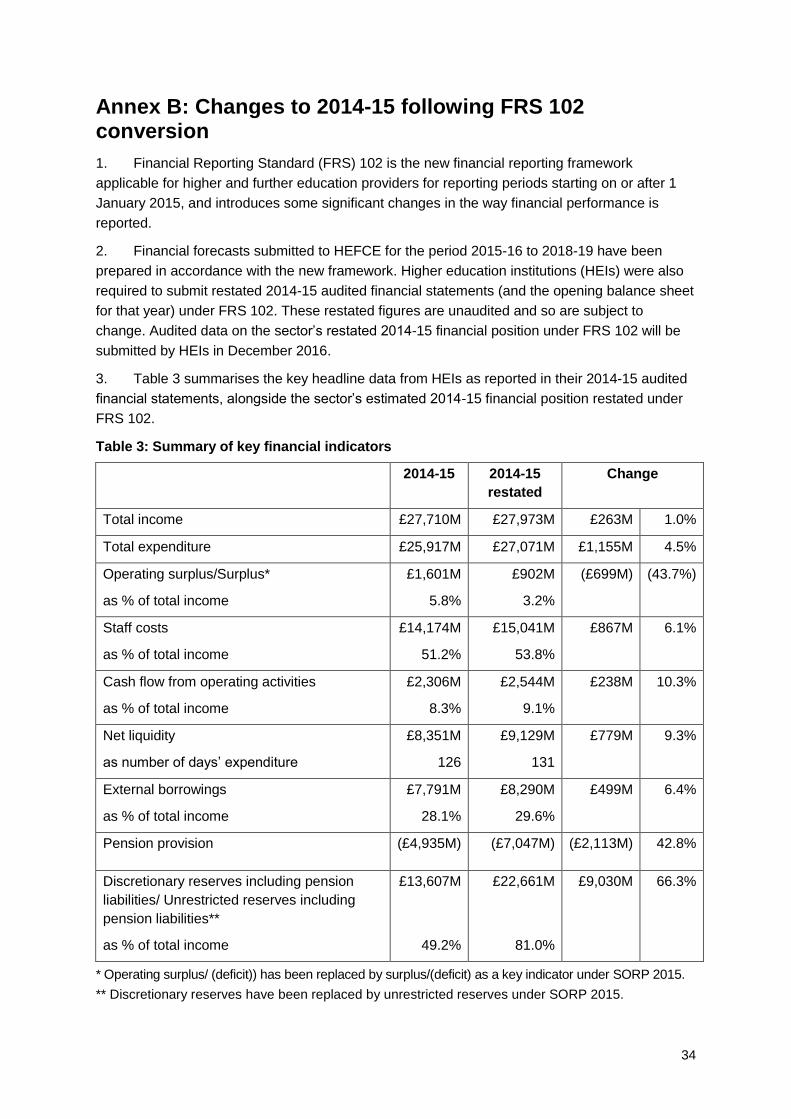
3. Table 3 summarises the key headline data from HEIs as reported in their 2014-15 audited
financial statements, alongside the sector’s estimated 2014-15 financial position restated under
FRS 102.
Table 3: Summary of key financial indicators
2014-15 2014-15
restated
Change
Total income £27,710M £27,973M £263M 1.0%
Total expenditure £25,917M £27,071M £1,155M 4.5%
Operating surplus/Surplus*
as % of total income
£1,601M
5.8%
£902M
3.2%
(£699M)
(43.7%)
Staff costs
as % of total income
£14,174M
51.2%
£15,041M
53.8%
£867M
6.1%
Cash flow from operating activities
as % of total income
£2,306M
8.3%
£2,544M
9.1%
£238M
10.3%
Net liquidity
as number of days’ expenditure
£8,351M
126
£9,129M
131
£779M 9.3%
External borrowings
as % of total income
£7,791M
28.1%
£8,290M
29.6%
£499M 6.4%
Pension provision (£4,935M) (£7,047M) (£2,113M) 42.8%
Discretionary reserves including pension
liabilities/ Unrestricted reserves including
pension liabilities**
as % of total income
£13,607M
49.2%
£22,661M
81.0%
£9,030M 66.3%
* Operating surplus/ (deficit)) has been replaced by surplus/(deficit) as a key indicator under SORP 2015.
** Discretionary reserves have been replaced by unrestricted reserves under SORP 2015.
35
Annex C: Sensitivity of financial forecasts to changes in key assumptions
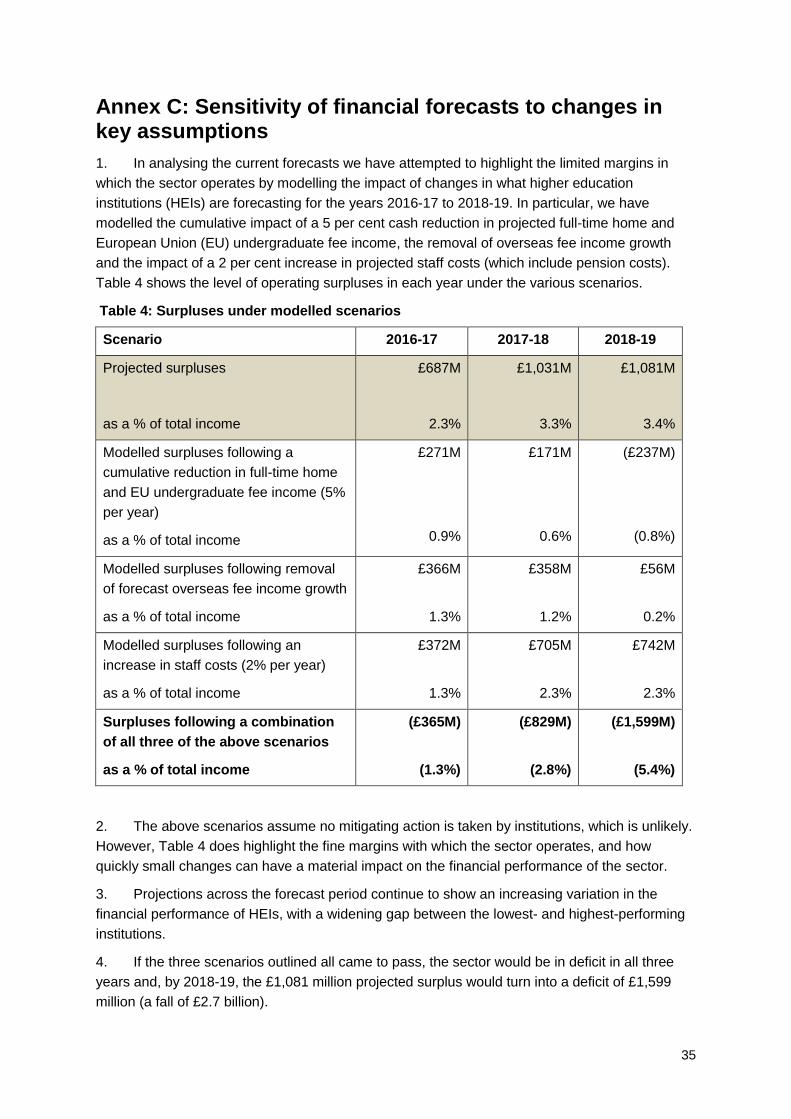
1. In analysing the current forecasts we have attempted to highlight the limited margins in
which the sector operates by modelling the impact of changes in what higher education
institutions (HEIs) are forecasting for the years 2016-17 to 2018-19. In particular, we have
modelled the cumulative impact of a 5 per cent cash reduction in projected full-time home and
European Union (EU) undergraduate fee income, the removal of overseas fee income growth
and the impact of a 2 per cent increase in projected staff costs (which include pension costs).
Table 4 shows the level of operating surpluses in each year under the various scenarios.
Table 4: Surpluses under modelled scenarios
Scenario 2016-17 2017-18 2018-19
Projected surpluses
as a % of total income
£687M
2.3%
£1,031M
3.3%
£1,081M
3.4%
Modelled surpluses following a
cumulative reduction in full-time home
and EU undergraduate fee income (5%
per year)
as a % of total income
£271M
0.9%
£171M
0.6%
(£237M)
(0.8%)
Modelled surpluses following removal
of forecast overseas fee income growth
as a % of total income
£366M
1.3%
£358M
1.2%
£56M
0.2%
Modelled surpluses following an
increase in staff costs (2% per year)
as a % of total income
£372M
1.3%
£705M
2.3%
£742M
2.3%
Surpluses following a combination
of all three of the above scenarios
as a % of total income
(£365M)
(1.3%)
(£829M)
(2.8%)
(£1,599M)
(5.4%)
2. The above scenarios assume no mitigating action is taken by institutions, which is unlikely.
However, Table 4 does highlight the fine margins with which the sector operates, and how
quickly small changes can have a material impact on the financial performance of the sector.
3. Projections across the forecast period continue to show an increasing variation in the
financial performance of HEIs, with a widening gap between the lowest- and highest-performing
institutions.
4. If the three scenarios outlined all came to pass, the sector would be in deficit in all three
years and, by 2018-19, the £1,081 million projected surplus would turn into a deficit of £1,599
million (a fall of £2.7 billion).

36
5. HEIs need to generate surpluses to provide the positive cash flow to fund future
investment in infrastructure, to the extent that these are not met from capital funding. The actual
levels of surplus needed will vary, depending on the circumstances of individual HEIs. Overall the
sector is in a financially sustainable position in the short term. However, the above analysis
highlights the tight margins in which HEIs are operating, and mean that small changes in income
or costs could have a material impact on financial performance of institutions and the sector.

37
List of abbreviations
EBITDA Earnings before interest, tax, depreciation and amortisation
EU European Union
FRS Financial Reporting Standard
FTE Full-time equivalent or equivalence
HEFCE Higher Education Funding Council for England
HEI Higher education institution
LGPS Local Government Pension Scheme
PGR Postgraduate research
PGT Postgraduate taught
RDEC Research and Development Expenditure Credits
SORP Statement of recommended accounting practice
USS Universities Superannuation Scheme