Embed Size (px)
Citation preview

Financial Development & Corporate GrowthIN DIRECT INTERSECTORAL COMPARISONS
Jan Bena and Štěpán JurajdaLSE and CERGE-EI
LSENovember, 2006

MOTIVATION
• There is positive cross-country correlation between financial development and economic activity (Goldsmith, 1969; King & Levine, 1993).
• Size of finance-growth effect?
• Finance-growth effect on particular firm types?
• But how can we disentangle two-way causality? –Supply → Firms need external finance to reap growth opportunities.–Demand ← Financial development reflects future growth opportunities.–Growth opportunities are unobservable.–No episodes of exogenous changes in financial development.–Identification relies on strong assumptions.

DEALING WITH REVERSE CAUSALITY: Literature
• Cross-country studies–Initial period indicators of country financial development
(King and Levine, 1993; Levine and Zervos, 1998) –Instrumental variables, mostly legal origin
(La Porta et al., 1998; Levine et al., 2000)
• Regional differences within a single country –Controls for unobservable country-level growth determinants
(Jayarante and Strahan, 1996; Bertrand et al., 2004)
• Experience of specific industries across countries –Quantify industry need of external finance
(Rajan and Zingales, 1998; Beck et al., 2004; Guiso et al., 2004)

THE RAJAN-ZINGALES STRATEGY: Assumptions
(A1) Industry growth opportunity shocks are global = the same need to expand production
(A2) Industry technology is also constant across countries = the same $ of external finance to expand production by a unit
→ Cross-industry differences in the need for external finance are the same across countries.
(A3) U.S. listed firms face a perfectly elastic supply of external finance.
→ Observed industry external finance dependence in the U.S. (US_EFD) serves as counterfactual for outside financing need in other countries.

THE RAJAN-ZINGALES STRATEGY: Implementation
• Regress industry growth on–country and global industry fixed effects–interaction term US_EFDINDUSTRY * Financial_DevelopmentCOUNTRY
to ask whether industries more dependent on outside finance grow faster in financially more developed countries.
• STRONG: Reverse causality endogeneity at country level.
• WEAK: Constant industry differences in demand for external finance across countries such as U.S., Finland, Philippines, Zimbabwe, ...–Direct tests of assumptions are not available.–Similarity of technological content of industries across development
levels threatened by empirical trade research (Schott, 2003).

AN ALTERNATIVE STRATEGY: Assumptions
(A1) Industry growth opportunity shocks are global.
(A4) Corporate growth in a given industry would be the same in absence of differences in country financial development.
+ Apply both assumptions in a more appropriate context:
• EU-15 ‘single market’,1995-2003 (harmonized product market regulation)• Industry growth is verifiably highly synchronized• Comparable firms: Age, Size, Leverage, Tangibility, Quoted, Ownership, ...
→ Do two comparable EU-15 firms in the same industry but facing different financial system grow at different rates?

AN ALTERNATIVE STRATEGY: Cost and Benefits
Benefits of (A4)
– Avoid quantification of industry EFD– Obtain economically measurable estimates
Costs of (A4)
– Heterogeneity in financial development in EU-15 assumed orthogonal to other country-level determinants affecting growth.
→ Control for initial-period GDP to capture ‘convergence’ effects.
– Use initial-period (predetermined) indicators of country financial development. What if markets are forward looking?
→ Control for country-level future growth opportunities

BASIC SPECIFICATION
Gijkt = α + βFDi + γGDPi + δtj + Xk′ζ + εijkt
Gijkt Annual growth rate of firm k in industry j in country i in year t during 1995-2003.
FDi Financial development indicators: Private credit , Stock market capitalization, Total capitalization, Stock market value traded, Accounting standards, Control premium, 1990-1994 average.
δtj Industry-year dummies, corresponding to synchronized time path of industry growth across the EU-15.
Xk Firm-specific initial-period characteristics: Age, Size, Leverage, Tangibility, Collateral, Legal form, Quotation, Ownership, ...
GDPi Real GDP per capita in 1990.
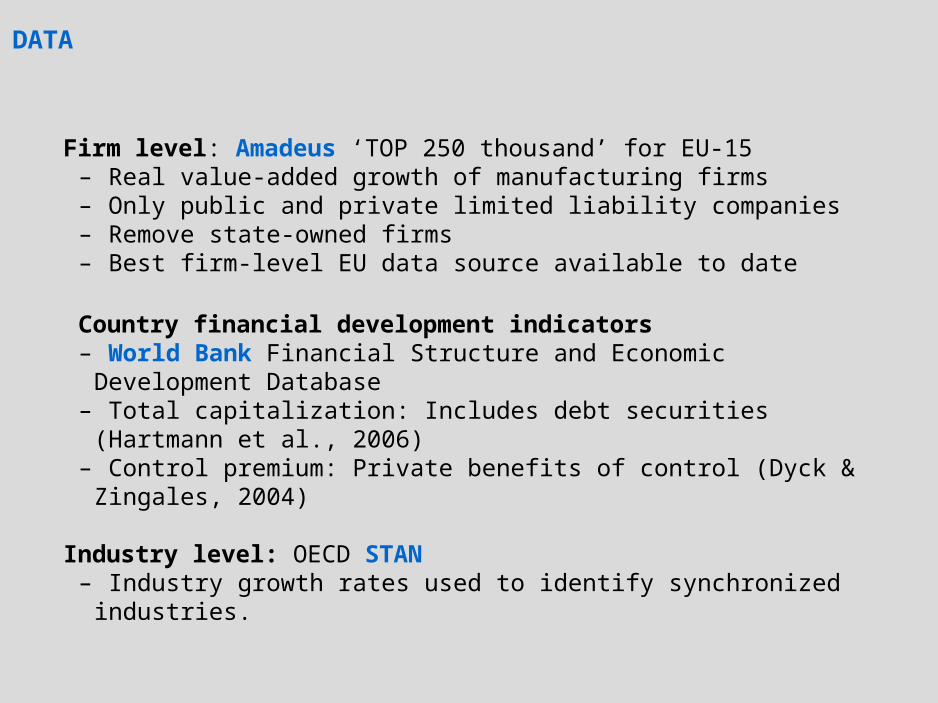
DATA
Firm level: Amadeus ‘TOP 250 thousand’ for EU-15– Real value-added growth of manufacturing firms– Only public and private limited liability companies– Remove state-owned firms– Best firm-level EU data source available to date
Country financial development indicators– World Bank Financial Structure and Economic Development Database– Total capitalization: Includes debt securities (Hartmann et al., 2006)– Control premium: Private benefits of control (Dyck & Zingales, 2004)
Industry level: OECD STAN– Industry growth rates used to identify synchronized industries.

CORPORATE DESCRIPTIVE STATISTICS: Firm-Year Data over 1995-2003
Size Growth Age LeverageN
QuotedN
Mean Median Mean Median Mean Median Mean Median
Austria 81.3 41.7 0.050 0.041 18.9 11.0 0.51 0.53 28 942
Belgium 47.2 15.9 0.023 0.014 22.6 17.0 0.63 0.66 145 9,792
Denmark 52.1 20.7 0.077 0.075 26.8 19.0 0.56 0.58 43 777
Finland 48.2 14.8 0.048 0.040 20.2 10.0 0.54 0.55 248 3,666
France 59.5 19.8 0.029 0.019 29.9 23.0 0.54 0.55 463 10,768
Germany 125.6 48.8 0.039 0.030 29.2 16.0 0.48 0.47 640 4,309
Greece 24.6 10.3 0.066 0.056 16.3 13.0 0.58 0.59 1,004 5,470
Italy 39.7 18.4 0.035 0.025 20.8 17.0 0.59 0.59 306 34,042
Netherlands 53.7 26.9 0.014 0.008 35.9 28.0 0.52 0.52 0 1,138
Portugal 38.8 17.8 0.010 0.000 27.7 22.0 0.59 0.61 82 1,452
Spain 40.2 17.0 0.061 0.051 21.3 18.0 0.59 0.61 336 18,596
Sweden 39.6 12.0 0.054 0.050 34.1 29.0 0.49 0.48 47 4,707
UK 62.9 20.1 0.069 0.066 29.0 21.0 0.63 0.65 50 14,971
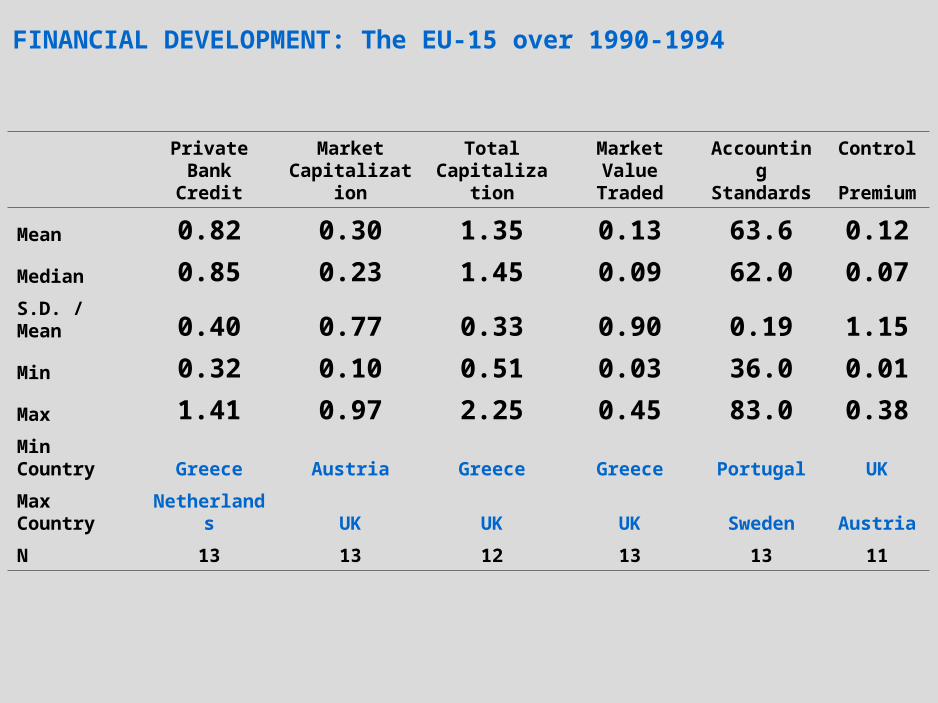
FINANCIAL DEVELOPMENT: The EU-15 over 1990-1994
Private Bank
CreditMarket
Capitalization
Total Capitalizatio
n
Market Value Traded
Accounting Standards
Control Premium
Mean 0.82 0.30 1.35 0.13 63.6 0.12
Median 0.85 0.23 1.45 0.09 62.0 0.07
S.D. / Mean 0.40 0.77 0.33 0.90 0.19 1.15
Min 0.32 0.10 0.51 0.03 36.0 0.01
Max 1.41 0.97 2.25 0.45 83.0 0.38Min Country Greece Austria Greece Greece Portugal UK
Max Country Netherlands UK UK UK Sweden Austria
N 13 13 12 13 13 11

FINANCIAL DEVELOPMENT AND CORPORATE GROWTH: Basic Estimates
Private
Bank CreditMarket
CapitalizationTotal
CapitalizationMarket Value
TradedAccounting Standards
Control Premium
Financial Development 0.028*** 0.032*** 0.020*** 0.067*** 0.121*** 0.020***(0.009) (0.004) (0.004) (0.007) (0.025) (0.005)
Age -0.050*** -0.050*** -0.051*** -0.051*** -0.050*** -0.049***(0.007) (0.007) (0.008) (0.007) (0.007) (0.007)
Size -0.117*** -0.117*** -0.119*** -0.121*** -0.113*** -0.119***(0.024) (0.025) (0.025) (0.023) (0.026) (0.027)
Leverage 0.065*** 0.059*** 0.060*** 0.061*** 0.064*** 0.068***(0.012) (0.014) (0.014) (0.013) (0.012) (0.013)
Tangibility 0.020*** 0.019*** 0.018** 0.019*** 0.020*** 0.020**(0.006) (0.006) (0.007) (0.006) (0.006) (0.008)
Collateralization -0.032* -0.030* -0.03 -0.028 -0.031* -0.033*(0.016) (0.017) (0.017) (0.017) (0.016) (0.018)
Quoted 0.016*** 0.016*** 0.016*** 0.014*** 0.016*** 0.013*(0.004) (0.004) (0.004) (0.004) (0.004) (0.006)
Private Limited Company 0.012*** 0.011*** 0.013*** 0.009*** 0.010*** 0.013***(0.003) (0.003) (0.003) (0.002) (0.002) (0.004)
Real GDP -4.777*** -4.665*** -5.752*** -4.619*** -5.184*** -4.285***(0.603) (0.930) (0.761) (0.864) (0.465) (1.150)
N 109,500 109,500 108,741 109,500 109,498 94,497R2 0.15 0.15 0.15 0.15 0.15 0.15

FINANCIAL DEVELOPMENT AND CORPORATE GROWTH: Basic Estimates
Private
Bank CreditMarket
CapitalizationTotal
CapitalizationMarket Value
TradedAccounting Standards
Control Premium
Financial Development 3.1% 2.8% 3.5% 2.8% 5.7%(0.009) (0.004) (0.004) (0.007) (0.025) (0.005)
Age -0.050*** -0.050*** -0.051*** -0.051*** -0.050*** -0.049***(0.007) (0.007) (0.008) (0.007) (0.007) (0.007)
Size -0.117*** -0.117*** -0.119*** -0.121*** -0.113*** -0.119***(0.024) (0.025) (0.025) (0.023) (0.026) (0.027)
Leverage 0.065*** 0.059*** 0.060*** 0.061*** 0.064*** 0.068***(0.012) (0.014) (0.014) (0.013) (0.012) (0.013)
Tangibility 0.020*** 0.019*** 0.018** 0.019*** 0.020*** 0.020**(0.006) (0.006) (0.007) (0.006) (0.006) (0.008)
Collateralization -0.032* -0.030* -0.03 -0.028 -0.031* -0.033*(0.016) (0.017) (0.017) (0.017) (0.016) (0.018)
Quoted 0.016*** 0.016*** 0.016*** 0.014*** 0.016*** 0.013*(0.004) (0.004) (0.004) (0.004) (0.004) (0.006)
Private Limited Company 0.012*** 0.011*** 0.013*** 0.009*** 0.010*** 0.013***(0.003) (0.003) (0.003) (0.002) (0.002) (0.004)
Real GDP -4.777*** -4.665*** -5.752*** -4.619*** -5.184*** -4.285***(0.603) (0.930) (0.761) (0.864) (0.465) (1.150)
N 109,500 109,500 108,741 109,500 109,498 94,497R2 0.15 0.15 0.15 0.15 0.15 0.15

FOCUS ON SYNCHRONIZED INDUSTRIES
Our strategy is based on (A1) synchronization of industry growth shocks, so it will fail where industry growth is driven by local regulation.
Hence, we identify synchronized industries using ANOVAs of industry growth with YEAR and COUNTRY factors.
Synchronization corresponds to strong YEAR factors.– Differentiate Low-, Medium-, and High-synchronization industry groups.– Or use continuous synchronization measure.

DEVELOPMENT AND GROWTH: Industry Synchronization Groups
Private Bank
CreditMarket
CapitalizationTotal
Capitalization
Market Value
Traded
Accounting Standards
Control Premium
Low-synchronization based on ANOVA: Year factor WEAK
Financial Development 0.017 0.017 0.009 0.039 0.087** 0.001(0.015) (0.010) (0.008) (0.024) (0.035) (0.007)
N 6,896 6,896 6,832 6,896 6,896 6,498R2 0.12 0.12 0.12 0.12 0.12 0.12
Medium-synchronization based on ANOVA: Year factor STRONG; Country factor STRONG
Financial Development 0.031*** 0.035*** 0.023*** 0.073***0.141*** 0.024***
(0.009) (0.004) (0.005) (0.006) (0.028) (0.006)
N 59,310 59,310 58,927 59,310 59,309 49,447R2 0.16 0.16 0.16 0.16 0.16 0.15
High-synchronization based on ANOVA: Year factor STRONG; Country factor WEAK
Financial Development 0.028*** 0.030*** 0.019*** 0.063***0.097*** 0.018***
(0.008) (0.003) (0.003) (0.005) (0.023) (0.004)
N 43,294 43,294 42,982 43,294 43,293 38,552R2 0.14 0.14 0.14 0.14 0.14 0.14
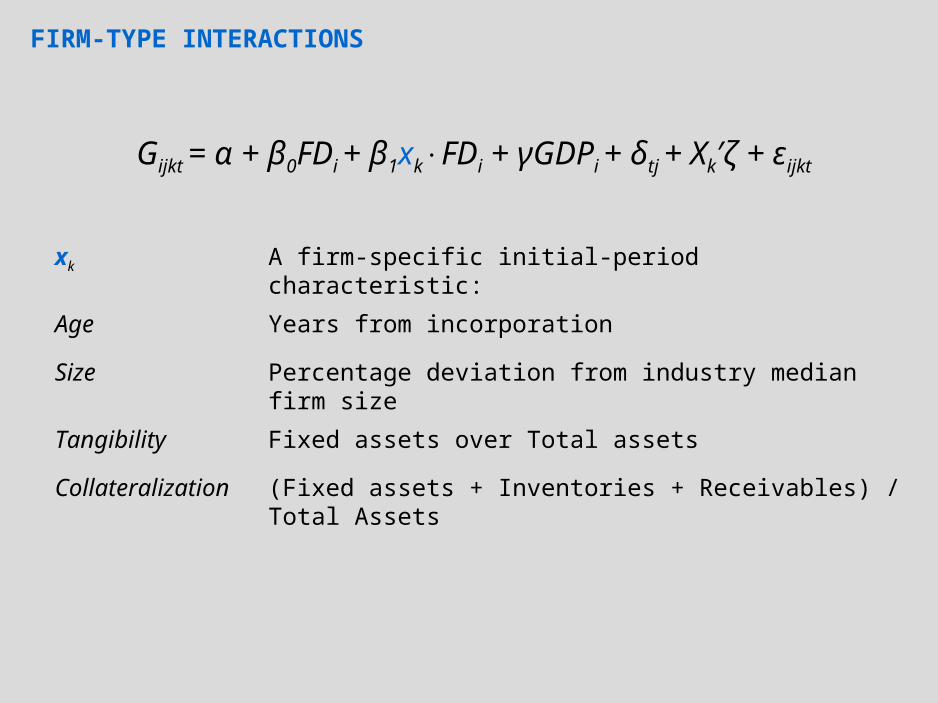
FIRM-TYPE INTERACTIONS
Gijkt = α + β0FDi + β1xk FD⋅ i + γGDPi + δtj + Xk′ζ + εijkt
xk A firm-specific initial-period characteristic:
Age Years from incorporation
Size Percentage deviation from industry median firm size
Tangibility Fixed assets over Total assets
Collateralization (Fixed assets + Inventories + Receivables) / Total Assets

AGE Interaction
Private Bank Credit
Market Capitalization
Total Capitalization
Market Value Traded
Accounting Standards
Control Premium
Full SampleFinancial Development 0.015*** 0.025*** 0.010*** 0.053*** 0.082*** 0.016***
(0.004) (0.004) (0.002) (0.008) (0.013) (0.003)
Financial Development × Age 0.054*** 0.027*** 0.043*** 0.057*** 0.150*** 0.016**(0.011) (0.009) (0.006) (0.019) (0.032) (0.008)
Age -0.097*** -0.061*** -0.117*** -0.061*** -0.152*** -0.056***(0.010) (0.004) (0.010) (0.004) (0.022) (0.005)
N 109,500 109,500 108,741 109,500 109,498 94,497
Young Firms (Below Median Age)Financial Development 0.008 0.010 0.002 0.028* 0.033 0.000
(0.009) (0.008) (0.005) (0.015) (0.027) (0.006)
Financial Development × Age 0.199** 0.260*** 0.185*** 0.506*** 0.763*** 0.227***(0.079) (0.075) (0.044) (0.151) (0.255) (0.060)
Age -0.283*** -0.214*** -0.372*** -0.200*** -0.635*** -0.225***(0.062) (0.029) (0.060) (0.026) (0.167) (0.028)
N 53,552 53,552 53,202 53,552 53,552 45,491
Old Firms (Above Median Age)
Financial Development 0.029*** 0.032*** 0.018*** 0.061*** 0.139*** 0.019***(0.007) (0.007) (0.004) (0.014) (0.023) (0.005)
Financial Development × Age 0.004 0.01 0.018** 0.022 0.003 0.003(0.015) (0.014) (0.009) (0.028) (0.045) (0.011)
Age -0.041*** -0.040*** -0.065*** -0.041*** -0.039 -0.037***(0.014) (0.006) (0.014) (0.006) (0.030) (0.006)
N 53,530 53,530 53,139 53,530 53,528 46,844
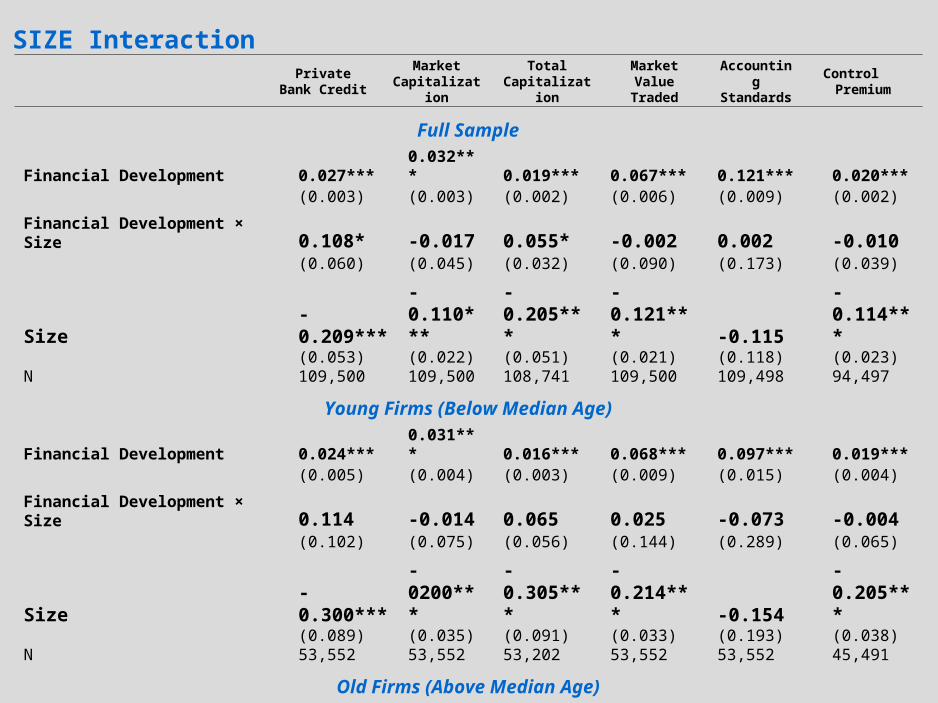
SIZE Interaction
Private Bank Credit
Market Capitalization
Total Capitalization
Market Value Traded
Accounting Standards
Control Premium
Full SampleFinancial Development 0.027*** 0.032*** 0.019*** 0.067*** 0.121*** 0.020***
(0.003) (0.003) (0.002) (0.006) (0.009) (0.002)
Financial Development × Size 0.108* -0.017 0.055* -0.002 0.002 -0.010(0.060) (0.045) (0.032) (0.090) (0.173) (0.039)
Size -0.209*** -0.110*** -0.205*** -0.121*** -0.115 -0.114***(0.053) (0.022) (0.051) (0.021) (0.118) (0.023)
N 109,500 109,500 108,741 109,500 109,498 94,497
Young Firms (Below Median Age)Financial Development 0.024*** 0.031*** 0.016*** 0.068*** 0.097*** 0.019***
(0.005) (0.004) (0.003) (0.009) (0.015) (0.004)
Financial Development × Size 0.114 -0.014 0.065 0.025 -0.073 -0.004(0.102) (0.075) (0.056) (0.144) (0.289) (0.065)
Size -0.300*** -0200*** -0.305*** -0.214*** -0.154 -0.205***(0.089) (0.035) (0.091) (0.033) (0.193) (0.038)
N 53,552 53,552 53,202 53,552 53,552 45,491
Old Firms (Above Median Age)
Financial Development 0.032*** 0.038*** 0.025*** 0.074*** 0.146*** 0.022***(0.004) (0.004) (0.002) (0.008) (0.012) (0.003)
Financial Development × Size -0.059 -0.077 -0.028 -0.146 -0.290 -0.055(0.072) (0.056) (0.038) (0.115) (0.210) (0.048)
Size 0.013 -0.008 0.003 -0.016 0.162 -0.021(0.065) (0.028) (0.062) (0.027) (0.144) (0.030)
N 53,530 53,530 53,139 53,530 53,528 46,844
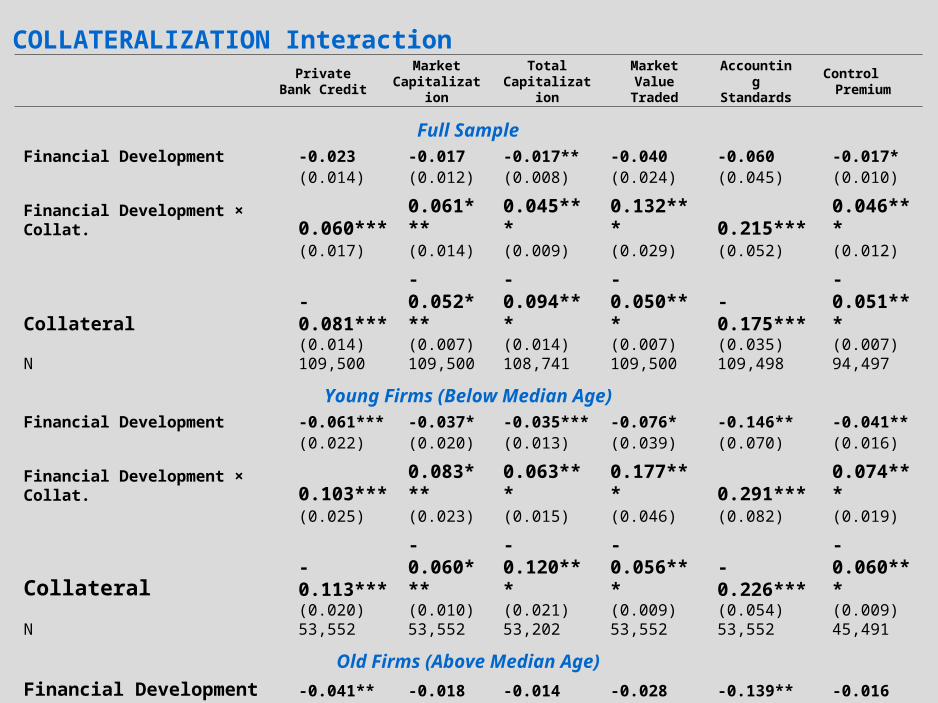
COLLATERALIZATION Interaction
Private Bank Credit
Market Capitalization
Total Capitalization
Market Value Traded
Accounting Standards
Control Premium
Full SampleFinancial Development -0.023 -0.017 -0.017** -0.040 -0.060 -0.017*
(0.014) (0.012) (0.008) (0.024) (0.045) (0.010)
Financial Development × Collat. 0.060*** 0.061*** 0.045*** 0.132*** 0.215*** 0.046***(0.017) (0.014) (0.009) (0.029) (0.052) (0.012)
Collateral -0.081*** -0.052*** -0.094*** -0.050*** -0.175*** -0.051***(0.014) (0.007) (0.014) (0.007) (0.035) (0.007)
N 109,500 109,500 108,741 109,500 109,498 94,497
Young Firms (Below Median Age)Financial Development -0.061*** -0.037* -0.035*** -0.076* -0.146** -0.041**
(0.022) (0.020) (0.013) (0.039) (0.070) (0.016)
Financial Development × Collat. 0.103*** 0.083*** 0.063*** 0.177*** 0.291*** 0.074***(0.025) (0.023) (0.015) (0.046) (0.082) (0.019)
Collateral -0.113*** -0.060*** -0.120*** -0.056*** -0.226*** -0.060***(0.020) (0.010) (0.021) (0.009) (0.054) (0.009)
N 53,552 53,552 53,202 53,552 53,552 45,491
Old Firms (Above Median Age)
Financial Development -0.041** -0.018 -0.014 -0.028 -0.139** -0.016(0.020) (0.019) (0.012) (0.038) (0.067) (0.015)
Financial Development × Collat. 0.084*** 0.066*** 0.043*** 0.146*** 0.292*** 0.045**(0.023) (0.022) (0.014) (0.043) (0.076) (0.018)
Collateral -0.098*** -0.053*** -0.091*** -0.051*** -0.226*** -0.045***(0.019) (0.010) (0.020) (0.009) (0.051) (0.009)
N 55,275 55,275 54,942 55,275 55,274 46,348
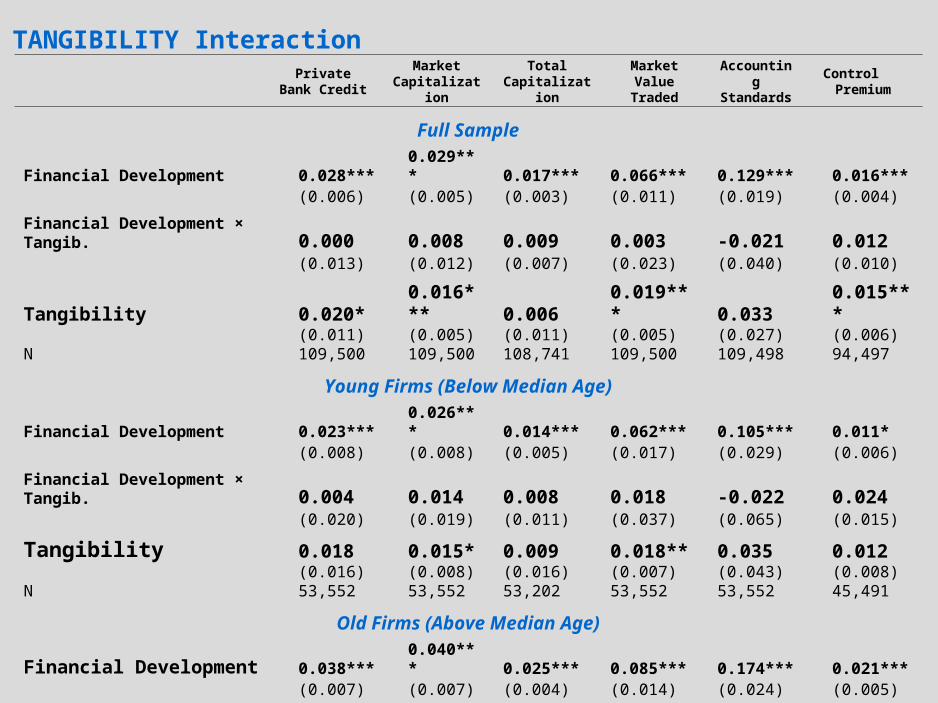
TANGIBILITY Interaction
Private Bank Credit
Market Capitalization
Total Capitalization
Market Value Traded
Accounting Standards
Control Premium
Full SampleFinancial Development 0.028*** 0.029*** 0.017*** 0.066*** 0.129*** 0.016***
(0.006) (0.005) (0.003) (0.011) (0.019) (0.004)
Financial Development × Tangib. 0.000 0.008 0.009 0.003 -0.021 0.012(0.013) (0.012) (0.007) (0.023) (0.040) (0.010)
Tangibility 0.020* 0.016*** 0.006 0.019*** 0.033 0.015***(0.011) (0.005) (0.011) (0.005) (0.027) (0.006)
N 109,500 109,500 108,741 109,500 109,498 94,497
Young Firms (Below Median Age)Financial Development 0.023*** 0.026*** 0.014*** 0.062*** 0.105*** 0.011*
(0.008) (0.008) (0.005) (0.017) (0.029) (0.006)
Financial Development × Tangib. 0.004 0.014 0.008 0.018 -0.022 0.024(0.020) (0.019) (0.011) (0.037) (0.065) (0.015)
Tangibility 0.018 0.015* 0.009 0.018** 0.035 0.012(0.016) (0.008) (0.016) (0.007) (0.043) (0.008)
N 53,552 53,552 53,202 53,552 53,552 45,491
Old Firms (Above Median Age)
Financial Development 0.038*** 0.040*** 0.025*** 0.085*** 0.174*** 0.021***(0.007) (0.007) (0.004) (0.014) (0.024) (0.005)
Financial Development × Tangib. -0.022 -0.010 -0.001 -0.038 -0.083* -0.003(0.017) (0.015) (0.010) (0.030) (0.050) (0.012)
Tangibility 0.032** 0.015** 0.012 0.018*** 0.068** 0.014*(0.015) (0.007) (0.015) (0.007) (0.033) (0.008)
N 53,530 53,530 53,139 53,530 53,528 46,844

ROBUSTNESS CHECKS
• Financial development measures misleading– if they reflect not only differences in available supply of finance,– but also demand for finance driven by future country growth
opportunities.
→ Control for predicted future country growth:Take industry averages of EU-15 realized growth over 1995-2003, and
weight them by initial-period country-level shares of each industry.
• Robustness to removing UK and Greece
• Median Regressions

Robustness to AGGREGATE GROWTH OPPORTUNITIES
Private
Bank CreditMarket
CapitalizationTotal
CapitalizationMarket Value
TradedAccounting Standards
Control Premium
Financial Development 0.018 0.027*** 0.016*** 0.058*** 0.110*** 0.020***(0.012) (0.004) (0.005) (0.007) (0.032) (0.004)
Growth Opportunities 4.206 4.965** 4.699** 4.808** 1.474 8.614***(2.954) (1.770) (1.812) (1.709) (2.340) (2.523)
Age -0.050*** -0.051*** -0.051*** -0.052*** -0.050*** -0.051***(0.007) (0.007) (0.007) (0.007) (0.007) (0.007)
Size -0.118*** -0.117*** -0.119*** -0.121*** -0.114*** -0.118***(0.024) (0.025) (0.025) (0.023) (0.026) (0.026)
Leverage 0.065*** 0.060*** 0.061*** 0.061*** 0.064*** 0.069***(0.012) (0.013) (0.013) (0.013) (0.012) (0.013)
Tangibility 0.020*** 0.018** 0.017** 0.019** 0.019*** 0.019**(0.006) (0.006) (0.007) (0.006) (0.006) (0.007)
Collateralization -0.032* -0.030* -0.030 -0.028 -0.031* -0.031(0.016) (0.017) (0.017) (0.017) (0.016) (0.018)
Quoted 0.017*** 0.018*** 0.017*** 0.016*** 0.016*** 0.012**(0.004) (0.003) (0.004) (0.004) (0.004) (0.005)
Private Limited Company 0.012*** 0.010*** 0.011*** 0.008*** 0.010*** 0.009***(0.003) (0.002) (0.002) (0.002) (0.002) (0.002)
Real GDP -5.231*** -5.314*** -6.199*** -5.253*** -5.323*** -4.339***(0.526) (0.636) (0.634) (0.511) (0.391) (0.647)
N 109,500 109,500 108,741 109,500 109,498 94,497
R2 0.15 0.15 0.15 0.15 0.15 0.15

Robustness to Removing UNITED KINGDOM and GREECE
Private Bank
CreditMarket
CapitalizationTotal
Capitalization
Market Value
Traded
Accounting Standards
Control Premium
Basic Estimates
Financial Development 0.028*** 0.032*** 0.020*** 0.067*** 0.121*** 0.020***(0.009) (0.004) (0.004) (0.007) (0.025) (0.005)
N 109,500 109,500 108,741 109,500 109,498 94,497R2 0.15 0.15 0.15 0.15 0.15 0.15
Robustness to Removing United Kingdom
Financial Development 0.017** 0.025 0.012* 0.045 0.089*** 0.010(0.006) (0.023) (0.006) (0.051) (0.025) (0.006)
N 94,529 94,529 93,770 94,529 94,527 79,526R2 0.18 0.18 0.18 0.18 0.18 0.18
Robustness to Removing Greece
Financial Development 0.028** 0.031*** 0.020*** 0.065*** 0.117*** 0.020***(0.012) (0.004) (0.005) (0.007) (0.026) (0.005)
N 104,278 104,278 103,519 104,278 104,276 94,497R2 0.15 0.15 0.15 0.15 0.15 0.15
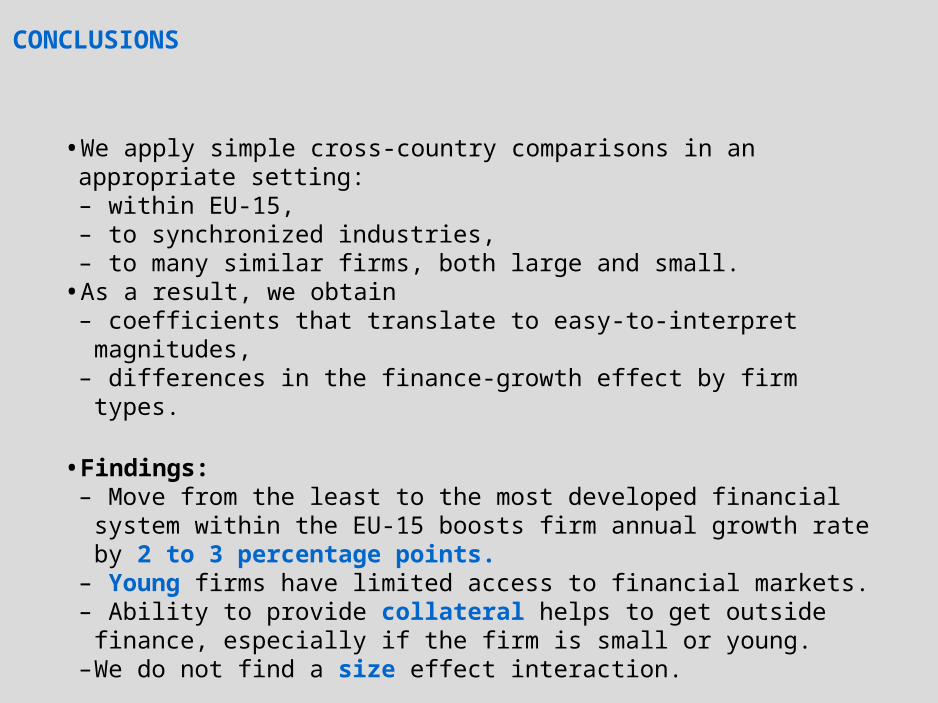
CONCLUSIONS
• We apply simple cross-country comparisons in an appropriate setting:– within EU-15,– to synchronized industries,– to many similar firms, both large and small.
• As a result, we obtain– coefficients that translate to easy-to-interpret magnitudes,– differences in the finance-growth effect by firm types.
• Findings:– Move from the least to the most developed financial system within the
EU-15 boosts firm annual growth rate by 2 to 3 percentage points.– Young firms have limited access to financial markets.– Ability to provide collateral helps to get outside finance, especially if the
firm is small or young.–We do not find a size effect interaction.