Embed Size (px)
Citation preview
INFORMING TODAY’S INVESTORS
Financial Capability in the United StatesReport on the National Survey Component of the National
Financial Capability Study – December 2009

Presenters
John Gannon
President, FINRA
Investor Education Foundation
Annamaria Lusardi
Dartmouth College, Financial Literacy Center, and U.S. Treasury
Copyright 2007, FINRA Investor Education Foundation
Objective
Annamaria Lusardi (Dartmouth College)
Applied Research & Consulting LLC (ARC)
FINRA Investor Education Foundation
Office of Financial Education, U.S. Treasury Department
Additional input from:
– Craig Copeland, Employee Benefit Research Institute (EBRI)
– American Institute of Certified Public Accountants (AICPA)
– Bob Willis, Univ. of Michigan, past PI of U.S. Health and Retirement Study
Establish a baseline measure of the ability of
Americans to manage their money.
Multi-Disciplinary Team:
Copyright 2007, FINRA Investor Education Foundation

Study Methodology
National Financial Capability Study includes three
linked surveys:
1. National Survey: Nationally-projectable telephone
survey of 1,488 American adults
2. State-by-State Survey: Online survey of
approximately 25,000 respondents (roughly 500 per
state + DC)
3. Military Survey: Online survey of 800 military
personnel and spouses
Copyright 2007, FINRA Investor Education Foundation
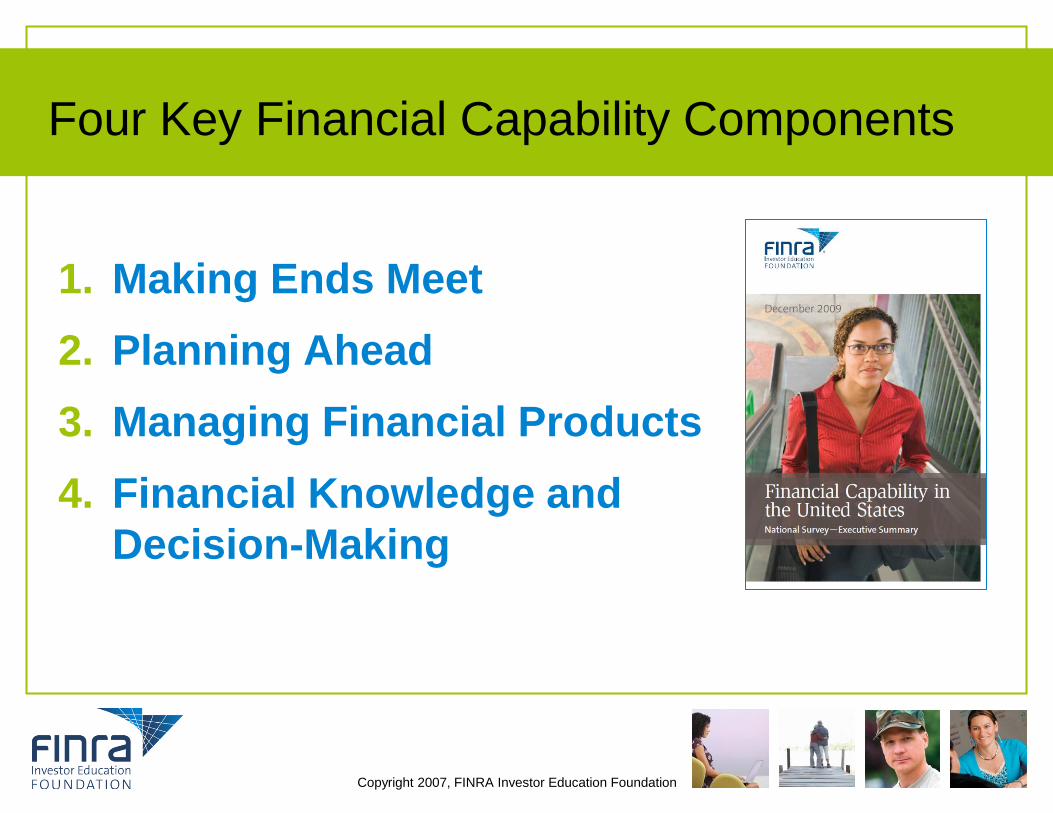
Four Key Financial Capability Components
1. Making Ends Meet
2. Planning Ahead
3. Managing Financial Products
4. Financial Knowledge and
Decision-Making
Copyright 2007, FINRA Investor Education Foundation
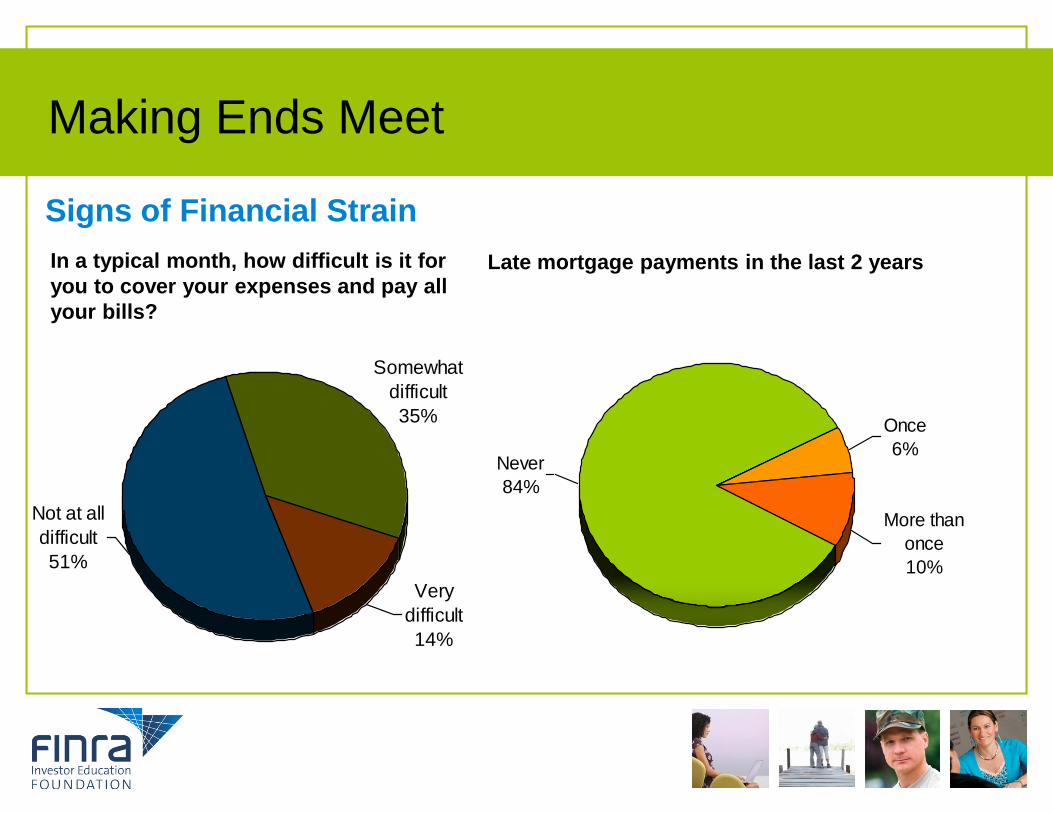
Making Ends Meet
Very
difficult
14%
Not at all
difficult
51%
Somewhat
difficult
35%
In a typical month, how difficult is it for
you to cover your expenses and pay all
your bills?
Signs of Financial Strain
More than
once
10%
Never
84%
Once
6%
Late mortgage payments in the last 2 years

Making Ends Meet
28%
53%
79%
27%
9%
18%
38%
45%
3%
0%
25%
50%
75%
100%
<$25K $25-75K $75K+
% R
espondents
Very
difficult
Somewhat
difficult
Not at all
difficult
In a typical month, how difficult is it for
you to cover your expenses and pay all
your bills?
41%
33%
23%
0%
10%
20%
30%
40%
50%
<$25K $25-75K $75K+
% R
espondents
Respondents with unexpected large drop
in income in past 12 months
Copyright 2007, FINRA Investor Education Foundation
Low Income Households Under Greatest Strain
Second Component of Financial Capability
Making Ends Meet
2. Planning Ahead
Copyright 2007, FINRA Investor Education Foundation

Many Americans Don’t Plan Ahead
Yes: Other
Savings
26%
Yes: Tax-
Advantaged
Account
14%
No
58%
Don't
know
2%
Are you setting aside any money for
your children's college education?
No
51%
Yes
49%
Have you set aside an emergency or
rainy day fund??
Yes
42%No
58%
Have you ever tried to figure out how much
you need to save for retirement?
Copyright 2007, FINRA Investor Education Foundation

Those Most at Risk Are Least Prepared for Emergencies...
49%45%
31%26%
31% 31%23%
44%
0%
20%
40%
60%
80%
100%
Total Female 18-29 <$25K Black Hispanic Less
than HS
HS grad
% R
espo
nden
ts
Respondents with emergency or rainy day funds that would cover
expenses for 3 months
Copyright 2007, FINRA Investor Education Foundation

...And Least Likely to Plan for Retirement
42% 39%
23%17%
38%
20%
41%
22%28%
0%
20%
40%
60%
80%
100%
Total Female 18-29 <$25K Black Hispanic Asian Less
than HS
HS grad
% R
espondents
Respondents who have tried to figure out how much to save for retirement
Copyright 2007, FINRA Investor Education Foundation
Third Component of Financial Capability
Making Ends Meet
Planning Ahead
3. Managing Financial Products
Copyright 2007, FINRA Investor Education Foundation

Lack of Assets
Respondent has… Total African-
Americans
Hispanics
No bank accounts (neither checking nor saving) 12% 28% 30%
No credit cards 31% 49% 42%
No retirement accounts 38% 53% 55%
No home that they own 39% 59% 58%
No stocks, bonds or mutual funds outside of
retirement accounts
53% 72% 73%
Copyright 2007, FINRA Investor Education Foundation

No Bank Accounts
Unbanked respondents (no checking or savings accounts)
12% 14%22%
31% 28% 30%36%
15%
0%
20%
40%
60%
80%
100%
Total Female 18-29 <$25K Black Hispanic Less
than HS
HS grad
% R
espo
nden
ts
Copyright 2007, FINRA Investor Education Foundation
Profile of the Unbanked

Reasons for Not Having a Bank Account
Which of the following are reasons why you do not have a checking or
savings account?
72%
35%
35%
34%
0% 20% 40% 60% 80% 100%
Do not have
enough money to
make it worthwhile
Do not want to
share my personal
information
Bank fees are too
high
Do not like dealing
with banks
% Yes
Copyright 2007, FINRA Investor Education Foundation
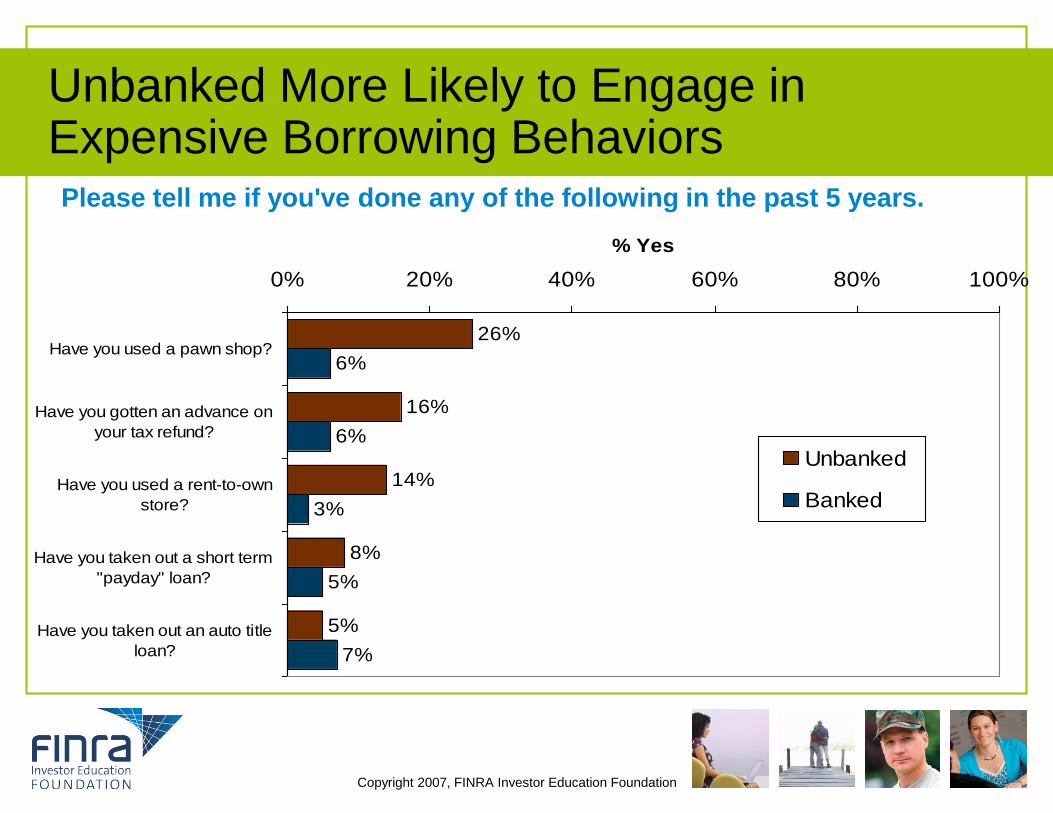
Unbanked More Likely to Engage inExpensive Borrowing BehaviorsPlease tell me if you've done any of the following in the past 5 years.
26%
16%
14%
8%
5%
6%
6%
3%
5%
7%
0% 20% 40% 60% 80% 100%
Have you used a pawn shop?
Have you gotten an advance on
your tax refund?
Have you used a rent-to-own
store?
Have you taken out a short term
"payday" loan?
Have you taken out an auto title
loan?
% Yes
Unbanked
Banked
Copyright 2007, FINRA Investor Education Foundation

Credit Cards
In the past 12 months… Total 18-29 30-44 45-59 60+
I always paid credit cards in full 54% 51% 45% 44% 75%
In some months, I carried over a balance
and was charged interest
51% 46% 62% 58% 33%
In some months, I paid the minimum
payment only
29% 41% 35% 31% 11%
In some months, I was charged a fee for
late payment
23% 24% 27% 29% 11%
In some months, I was charged a fee for
exceeding my credit line
8% 14% 8% 9% 2%
In some months, I used the cards for a
cash advance
8% 11% 10% 8% 5%
Copyright 2007, FINRA Investor Education Foundation
12% of respondents who do not pay in full each month do not know the interest
rate on their credit card.

Home Ownership and Mortgages
Homeowners that
stated
Total <$25K $25-$75K >$75K
Have a mortgage 61% 31% 61% 77%
Have line of credit 21% 11% 20% 27%
Copyright 2007, FINRA Investor Education Foundation
When asked whether they have a mortgage that is either an interest-only mortgage
or has an interest-only option, 20% responded they did not know the answer to this
question.
Moreover, 10% of mortgage borrowers did not know the interest rate they are
paying on their mortgage.

Retirement Accounts and Investments
Respondents
who…
Total <$25K $25-
$75K
>$75K Less
than
HS
HS Some
College
College
Have a retirement
plan via employer
51% 13% 61% 83% 22% 39% 54% 76%
Have other
retirement accounts
28% 4% 27% 57% 7% 14% 26% 55%
Have stocks, bonds
or mutual funds
outside of retirement
accounts
46% 17% 47% 72% N/A 34% 46% 66%
Copyright 2007, FINRA Investor Education Foundation
Note that about 9% of those with self directed retirement accounts have taken a loan from their
retirement accounts and 5% have taken a hardship withdrawal.
Moreover, 17% of those with self-directed accounts do not know how their wealth was allocated in
their accounts and 37% did not know whether they invested primarily in life-cycle funds,
Fourth Component of Financial Capability
Making Ends Meet
Planning Ahead
Managing Financial Products
4. Financial Knowledge and
Decision-Making
Copyright 2007, FINRA Investor Education Foundation

Highly Positive Self-Perceptions
6% 2% 4%12% 12%
17%
46%
0%
25%
50%
75%
100%
1 -
Strongly
Disagree
2 3 4 -
Neither
5 6 7 -
Strongly
Agree
% R
espondents
I am good at dealing with day-to-day
financial matters.
5% 3% 4%11% 13% 18%
46%
0%
25%
50%
75%
100%
1 -
Strongly
Disagree
2 3 4 -
Neither
5 6 7 -
Strongly
Agree
% R
espondents
I am pretty good at math.
5% 3% 6%
16%
32%
20% 17%
0%
25%
50%
75%
100%
1 - Very
Low
2 3 4 5 6 7 - Very
High
% R
espondents
How would you assess your overall financial knowledge?
Top 3 = 75% Top 3 = 77%
Top 3 = 70%
Copyright 2007, FINRA Investor Education Foundation

Financial Literacy
Count of correct and incorrect quiz answers (total 5 questions)
Number of correct answers Number of incorrect answers
2.722.46
2.16
2.69
2.022.28
2.07 2.032.29
1.14 1.14 1.451.02 1.38 1.61 1.52 1.28 1.32
00.5
11.5
22.5
33.5
4
4.55
Total Female 18-29 60+ <$25K Black Hispanic Less
than HS
HS grad
Mean
Copyright 2007, FINRA Investor Education Foundation

Self-Perception versus Financial Behavior
However, 24% who
strongly agreed and 40%
who agreed engaged in
behaviors that generated
fees or high costs.
Copyright 2007, FINRA Investor Education Foundation
“I am good at dealing with day-to-day financial matters”Respondents with credit cards and checking accounts
50%
Strongly
agreed
20%
13%
9%
Disagreed
9%
71-3
4
56
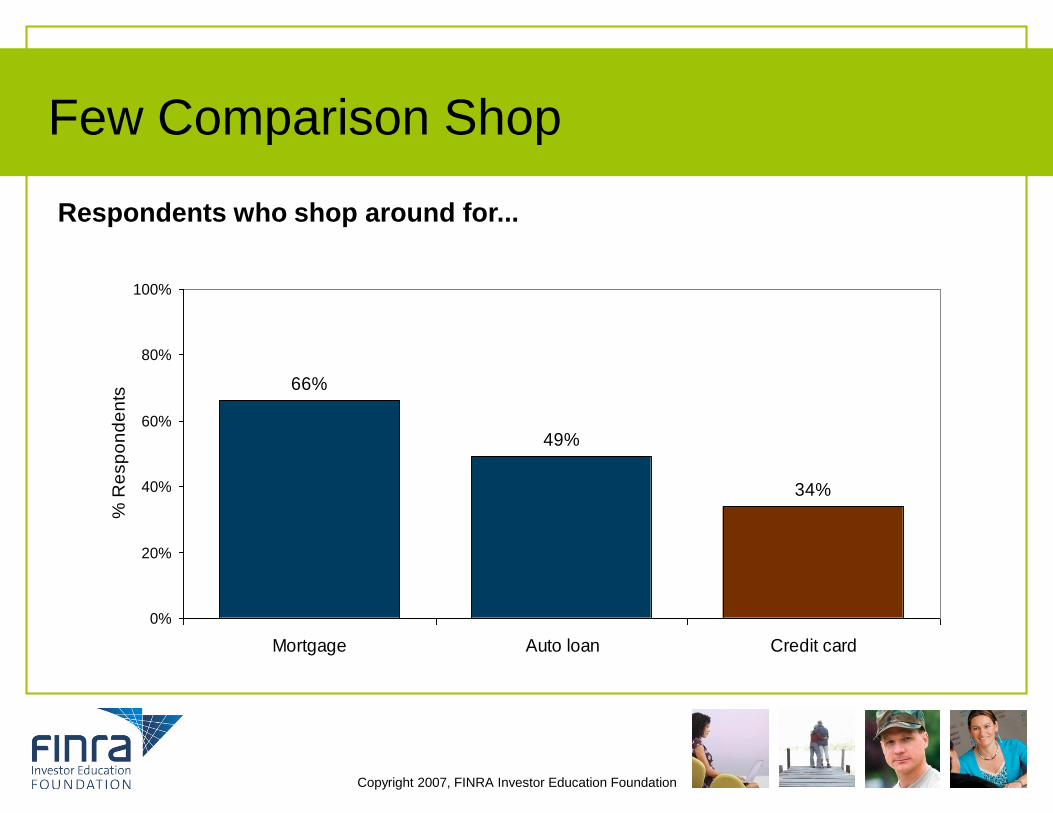
Few Comparison Shop
Respondents who shop around for...
66%
49%
34%
0%
20%
40%
60%
80%
100%
Mortgage Auto loan Credit card
% R
esp
on
de
nts
Copyright 2007, FINRA Investor Education Foundation

Few Obtain Credit Scores and Reports
Respondents
who, in the past
12 months,…
Total <$25K $25-
$75K
>$75K Less
than HS
HS Some
College
College
Obtained copy of
credit report
38% 18% 43% 56% 25% 30% 39% 53%
Checked credit
score
36% 15% 42% 55% 22% 29% 35% 53%
Copyright 2007, FINRA Investor Education Foundation

Summary
The survey provides evidence that:
People are not well equipped to make financial decision
People are not well informed about the terms of their financial
contracts and they do not shop around
The majority of Americans do not plan ahead for life-cycle
events and do not insure against unexpected ones
Many incur in behaviors that generate fees, interest payments,
and other costs
There are signs of financial distress
The groups displaying lower financial capability are those with
low income, low education, and minorities
Copyright 2007, FINRA Investor Education Foundation

Next Steps
National Survey
Analysis of open-ended numeric responses
Data will be made available to the public for independent analysis
State-By-State Survey
Preparation of report for public release (2010)
Large data set will enable much more detailed analysis of specific
demographic groups and opportunity for state-by-state comparison
Data will be made available to the public for independent analysis
Military Survey
Preparation of report for public release (2010)
Data will be made available to the public for independent analysis
Copyright 2007, FINRA Investor Education Foundation