Embed Size (px)
Citation preview

New Oriental Announces Unaudited Results for the First Fiscal Quarter
Ended August 31, 2013
Quarterly Net Revenues Increased by 15.7% Year-Over-Year
Quarterly Operating Income Increased by 33.4% Year-Over-Year
Quarterly Operating Margin Improved by 470 Basis Points Year-Over-Year to 34.9%
Quarterly Net Income Attributable to New Oriental Increased by 31.9% Year-Over-Year
Beijing, October 23, 2013 – New Oriental Education and Technology Group Inc. (the
“Company” or “New Oriental”) (NYSE:EDU), the largest provider of private educational
services in China, today announced its unaudited financial results for the fiscal quarter ended
August 31, 2013, which is the first quarter of New Oriental's fiscal year 2014.
Highlights for the Fiscal Quarter Ended August 31, 2013
Total net revenues increased by 15.7% year-over-year to US$388.7 million from
US$335.8 million in the same period of the prior fiscal year.
Net income attributable to New Oriental increased by 31.9% year-over-year to
US$126.5 million from US$95.9 million in the same period of the prior fiscal year.
Non-GAAP net income attributable to New Oriental, which excludes share-based
compensation expenses, increased by 28.5% year-over-year to US$131.9 million from
US$102.6 million in the same period of the prior fiscal year.
Operating income increased by 33.4% year-over-year to US$135.5 million from
US$101.6 million in the same period of the prior fiscal year.
Non-GAAP operating income, which excludes share-based compensation expenses,
increased by 30.1% year-over-year to US$140.8 million from US$108.3 million in the
same period of the prior fiscal year.
Basic and diluted net income attributable to New Oriental per ADS were US$0.82 and
US$0.81, respectively. Non-GAAP basic and diluted net income per ADS, which
excludes share-based compensation expenses, were US$0.85 and US$0.84,
respectively. Each ADS represents one common share of the Company.
Total student enrollments in academic subjects tutoring and test preparation courses
increased by 2.3% year-over-year to approximately 919,400 from approximately
898,900 in the same period of the prior fiscal year.
The total number of schools and learning centers was 713 as of August 31, 2013,
down from 726 as of August 31, 2012. The total number of schools was 57 as of
August 31, 2013. The number of schools and learning centers decreased by 13 in the
first quarter to 713 as of August 31, 2013, down from 726 as of May 31, 2013.
Financial and Student Enrollments Summary – First Fiscal Quarter 2014
(in thousands US$, except per ADS data, student enrollments and percentages)
Q1 of FY2014 Q1 of FY2013 Pct. Change
Net revenues 388,663 335,829 15.7%
Net income attributable to New Oriental 126,476 95,852 31.9%
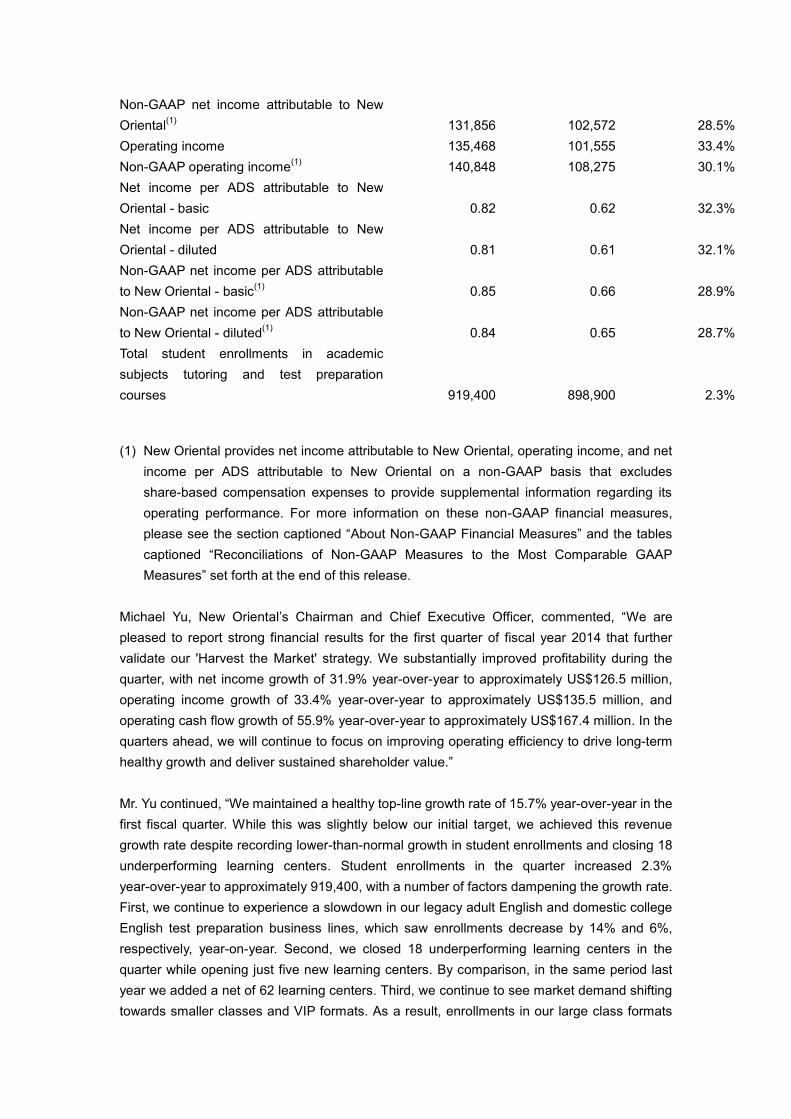
Non-GAAP net income attributable to New
Oriental(1)
131,856 102,572 28.5%
Operating income 135,468 101,555 33.4%
Non-GAAP operating income(1)
140,848 108,275 30.1%
Net income per ADS attributable to New
Oriental - basic 0.82 0.62 32.3%
Net income per ADS attributable to New
Oriental - diluted 0.81 0.61 32.1%
Non-GAAP net income per ADS attributable
to New Oriental - basic(1)
0.85 0.66 28.9%
Non-GAAP net income per ADS attributable
to New Oriental - diluted(1)
0.84 0.65 28.7%
Total student enrollments in academic
subjects tutoring and test preparation
courses 919,400 898,900 2.3%
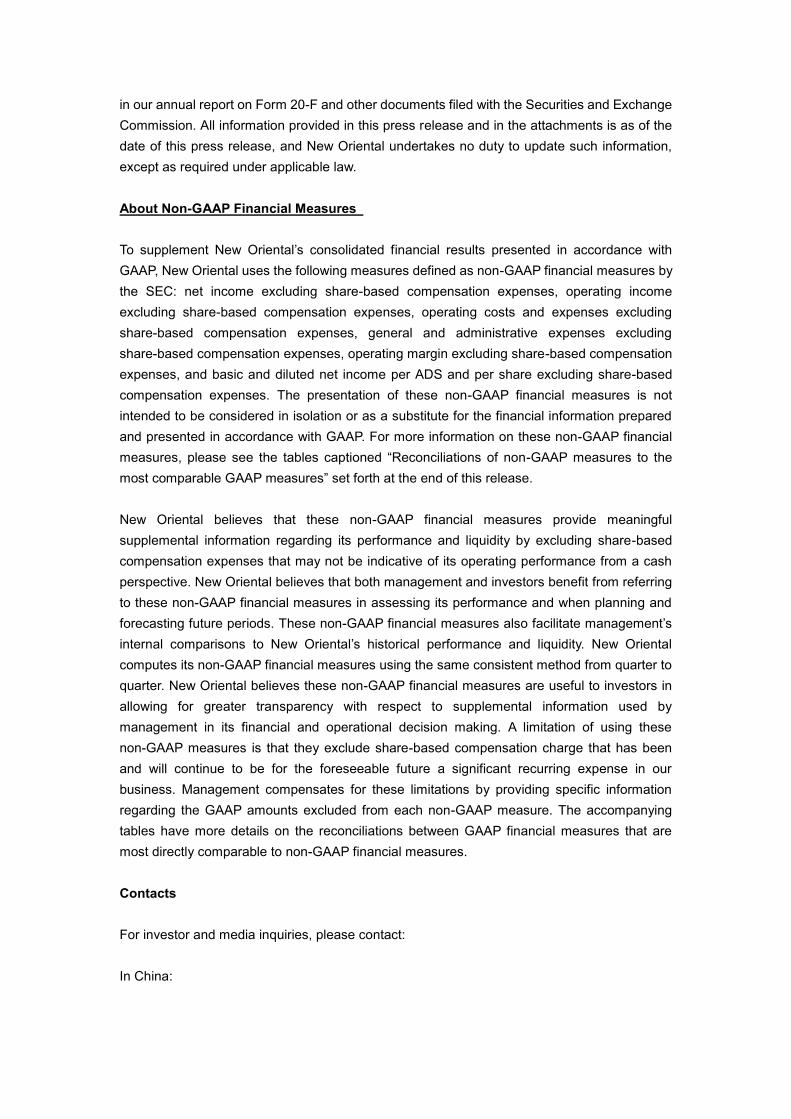
(1) New Oriental provides net income attributable to New Oriental, operating income, and net
income per ADS attributable to New Oriental on a non-GAAP basis that excludes
share-based compensation expenses to provide supplemental information regarding its
operating performance. For more information on these non-GAAP financial measures,
please see the section captioned “About Non-GAAP Financial Measures” and the tables
captioned “Reconciliations of Non-GAAP Measures to the Most Comparable GAAP
Measures” set forth at the end of this release.
Michael Yu, New Oriental’s Chairman and Chief Executive Officer, commented, “We are
pleased to report strong financial results for the first quarter of fiscal year 2014 that further
validate our 'Harvest the Market' strategy. We substantially improved profitability during the
quarter, with net income growth of 31.9% year-over-year to approximately US$126.5 million,
operating income growth of 33.4% year-over-year to approximately US$135.5 million, and
operating cash flow growth of 55.9% year-over-year to approximately US$167.4 million. In the
quarters ahead, we will continue to focus on improving operating efficiency to drive long-term
healthy growth and deliver sustained shareholder value.”
Mr. Yu continued, “We maintained a healthy top-line growth rate of 15.7% year-over-year in the
first fiscal quarter. While this was slightly below our initial target, we achieved this revenue
growth rate despite recording lower-than-normal growth in student enrollments and closing 18
underperforming learning centers. Student enrollments in the quarter increased 2.3%
year-over-year to approximately 919,400, with a number of factors dampening the growth rate.
First, we continue to experience a slowdown in our legacy adult English and domestic college
English test preparation business lines, which saw enrollments decrease by 14% and 6%,
respectively, year-on-year. Second, we closed 18 underperforming learning centers in the
quarter while opening just five new learning centers. By comparison, in the same period last
year we added a net of 62 learning centers. Third, we continue to see market demand shifting
towards smaller classes and VIP formats. As a result, enrollments in our large class formats

declined by about 80,600 from 429,900 (or approximately 45% of our total enrollments) in the
first fiscal quarter of 2013 to about 349,300 (or approximately 36% of our total enrollments) in
the first fiscal quarter of 2014. Finally, our Shanghai school continued to underperform during
the first quarter, with enrollments declining by about 12%.”
Mr. Yu added, “Our first fiscal quarter is the seasonally strongest quarter for our most profitable
overseas test preparation business but is not a peak quarter for our rapidly growing K-12
after-school tutoring business. Looking ahead, we expect revenues and enrollments to
improve considerably in the next several quarters driven by growth in K-12 after-school
tutoring enrollments as students prepare for final examinations at the end of the Autumn and
Spring semesters, and for the critical gaokao (college entrance examination) and zhongkao
(high school entrance examination) administered in early June of each year. Furthermore, we
expect to open a net of approximately 20 to 30 new learning centers for the remainder of this
fiscal year, starting from this month. These will be located in certain fast growing, high profit
markets and will enable us to cater to strong demand for our K-12 after-school tutoring classes
in these regions.”
Louis T. Hsieh, New Oriental’s President and Chief Financial Officer, commented, “We are very
pleased with the substantial operating efficiency gains achieved since our successful pivot
from our “Occupy the Market” to our “Harvest the Market” strategy last November, as we built
on our leading position as China’s preeminent language training and test preparation training
school for K-College students. While we recorded slower top line growth in June, we
experienced a nice rebound in demand in July and August. This has contributed to a strong
deferred revenue balance of US$323.7 million at the end of the first quarter of fiscal year 2014.
This represents an increase of 32.9% as compared to US$243.6 million at the end of the first
quarter of fiscal year 2013. This pick-up in demand has continued into September and the first
half of October where we have recorded a noticeable 8.3% increase in student enrollments
year-over-year and an approximately 23% increase year-over-year in cash receipts, or cash
collected in advance for enrollments, for this six-week period. As a result of this pick-up in
demand, we have raised our outlook for revenue growth for the second fiscal quarter 2014 to a
range of 22% to 27%.”
Mr. Hsieh continued, “In this first fiscal quarter of 2014 we also successfully improved gross
margins by 110 basis points to 65.9% from 64.8% in the year ago period, while achieving
operating income growth of 33.4% year-over-year and GAAP operating margin improvement
of 470 basis points year-over-year to 34.9%. As a result of this stronger-than-expected
performance, we have raised our GAAP operating margin target for this 2014 fiscal year to a
range of 16% to 17%, representing a 320 to 420 basis point improvement from the year ago
period. This compares to our previous target of 15% to 16%, or a 220 to 320 basis point
improvement.”
Financial Results for the Fiscal Quarter Ended August 31, 2013
For the first fiscal quarter of 2014, New Oriental reported net revenues of US$388.7 million,

representing a 15.7% increase year-over-year.
Net revenues from educational programs and services for the first fiscal quarter were
US$353.3 million, representing a 14.8% increase year-over-year. The growth was mainly
driven by an increase in student enrollments in academic subjects tutoring and test preparation
courses, as well as an increase in average selling prices resulting from price increases and an
increase in the number of students selecting more expensive, smaller class options. Total
student enrollments in academic subjects tutoring and test preparation courses in the first
quarter of fiscal year 2014 increased by 2.3% year-over-year to approximately 919,400 from
approximately 898,900 in the same period of the prior fiscal year.
Operating costs and expenses for the quarter were US$253.2 million, an 8.1% increase
year-over-year. Non-GAAP operating costs and expenses, which exclude share-based
compensation expenses, for the quarter were US$247.8 million, an 8.9% increase
year-over-year.
Cost of revenues increased by 12.2% year-over-year to US$132.6 million, primarily due to
increases in teachers’ compensation.
Selling and marketing expenses increased by 8.2% year-over-year to US$42.7 million. Actual
brand and market promotion expenses declined approximately 3% year-over-year to
approximately US$19.8 million.
General and administrative expenses for the quarter increased by 1.7% year-over-year to
US$77.9 million. Non-GAAP general and administrative expenses, which excludes
share-based compensation expenses, were US$72.5 million, a 3.8% increase year-over-year.
Total share-based compensation expenses, which were allocated to related operating costs
and expenses, decreased by 19.9% to US$5.4 million in the first quarter of fiscal year 2014
from US$6.7 million in the same period of the prior fiscal year.
Operating income for the quarter was US$135.5 million, a 33.4% increase from US$101.6
million in the same period of the prior fiscal year. Non-GAAP operating income, which excludes
share-based compensation expenses, for the quarter was US$140.8 million, a 30.1% increase
from US$108.3 million in the same period of the prior fiscal year.
Operating margin for the quarter was 34.9%, compared to 30.2% in the same period of the
prior fiscal year. Non-GAAP operating margin, which excludes share-based compensation
expenses, for the quarter was 36.2%, compared to 32.2% in the same period of the prior fiscal
year.
Net income attributable to New Oriental for the quarter was US$126.5 million, representing a
31.9% increase from the same period of the prior fiscal year. Basic and diluted earnings per
ADS attributable to New Oriental were US$0.82 and US$0.81, respectively.

Non-GAAP net income attributable to New Oriental for the quarter was US$131.9 million,
representing a 28.5% increase from the same period of the prior fiscal year. Non-GAAP basic
and diluted earnings per ADS attributable to New Oriental were US$0.85 and US$0.84,
respectively.
Capital expenditures for the quarter were US$8.6 million, which were primarily attributable to
the opening of five new learning centers and renovations at older, existing learning centers.
As of August 31, 2013, New Oriental had cash and cash equivalents of US$480.6 million, as
compared to US$417.2 million as of May 31, 2013. In addition, the Company had US$587.4
million in short-term investment at the end of the quarter. Net operating cash flow for the first
quarter of fiscal year 2014 was approximately US$167.4 million.
New Oriental's deferred revenue balance, which is cash collected from registered students for
courses and recognized proportionally as revenue as the instructions are delivered, at the end
of the first quarter of fiscal year 2014 was US$323.7 million, an increase of 32.9% as
compared to US$243.6 million at the end of the first quarter of fiscal year 2013.
Outlook for Second Quarter of Fiscal Year 2014
New Oriental expects its total net revenues in the second quarter of fiscal year 2014
(September 1, 2013, to November 30, 2013) to be in the range of US$202.4 million to
US$210.7 million, representing year-over-year growth in the range of 22% to 27%. This
forecast reflects New Oriental's current and preliminary view, which is subject to change.
Conference Call Information
New Oriental’s management will host an earnings conference call at 8 AM on October 23,
2013, U.S. Eastern Time (8 PM on October 23, 2013, Beijing/Hong Kong Time).
Dial-in details for the earnings conference call are as follows:
US: +1-845-675-0437
Hong Kong: +852-2475-0994 UK: +44-20-3059-8139
Please dial in 10 minutes before the call is scheduled to begin and provide the passcode to join
the call. The passcode is “New Oriental Earnings Call.”
A replay of the conference call may be accessed by phone at the following number until
October 30, 2013:
International: +61-2-8199-0299
Passcode: 72021893

Additionally, a live and archived webcast of the conference call will be available at
http://investor.neworiental.org.
About New Oriental
New Oriental is the largest provider of private educational services in China based on the
number of program offerings, total student enrollments and geographic presence. New
Oriental offers a wide range of educational programs, services and products consisting
primarily of English and other foreign language training, test preparation courses for major
admissions and assessment tests in the United States, the PRC and Commonwealth countries,
primary and secondary school education, development and distribution of educational content,
software and other technology, and online education. New Oriental's ADSs, each of which
represents one common share, currently trade on the New York Stock Exchange under the
symbol ''EDU.''
For more information about New Oriental, please visit http://english.neworiental.org.
Safe Harbor Statement
This announcement contains forward-looking statements. These statements are made under
the “safe harbor” provisions of the U.S. Private Securities Litigation Reform Act of 1995. These
forward-looking statements can be identified by terminology such as “will,” “expects,”
“anticipates,” “future,” “intends,” “plans,” “believes,” “estimates” and similar statements. Among
other things, the outlook for the second quarter of fiscal year 2014 and quotations from
management in this announcement, as well as New Oriental’s strategic and operational plans,
contain forward-looking statements. New Oriental may also make written or oral
forward-looking statements in its reports filed or furnished to the U.S. Securities and Exchange
Commission, in its annual reports to shareholders, in press releases and other written
materials and in oral statements made by its officers, directors or employees to third parties.
Statements that are not historical facts, including statements about New Oriental’s beliefs and
expectations, are forward-looking statements. Forward-looking statements involve inherent
risks and uncertainties. A number of factors could cause actual results to differ materially from
those contained in any forward-looking statement, including but not limited to the following: our
ability to attract students without a significant decrease in course fees; our ability to continue to
hire, train and retain qualified teachers; our ability to maintain and enhance our “New Oriental”
brand; our ability to effectively and efficiently manage the expansion of our school network and
successfully execute our growth strategy; the outcome of ongoing, or any future, litigation or
arbitration, including those relating to copyright and other intellectual property rights;
competition in the private education sector in China; changes in our revenues and certain cost
or expense items as a percentage of our revenues; the expected growth of the Chinese private
education market; Chinese governmental policies relating to private educational services and
providers of such services; health epidemics and other outbreaks in China; and general
economic conditions in China. Further information regarding these and other risks is included
in our annual report on Form 20-F and other documents filed with the Securities and Exchange
Commission. All information provided in this press release and in the attachments is as of the
date of this press release, and New Oriental undertakes no duty to update such information,
except as required under applicable law.
About Non-GAAP Financial Measures
To supplement New Oriental’s consolidated financial results presented in accordance with
GAAP, New Oriental uses the following measures defined as non-GAAP financial measures by
the SEC: net income excluding share-based compensation expenses, operating income
excluding share-based compensation expenses, operating costs and expenses excluding
share-based compensation expenses, general and administrative expenses excluding
share-based compensation expenses, operating margin excluding share-based compensation
expenses, and basic and diluted net income per ADS and per share excluding share-based
compensation expenses. The presentation of these non-GAAP financial measures is not
intended to be considered in isolation or as a substitute for the financial information prepared
and presented in accordance with GAAP. For more information on these non-GAAP financial
measures, please see the tables captioned “Reconciliations of non-GAAP measures to the
most comparable GAAP measures” set forth at the end of this release.
New Oriental believes that these non-GAAP financial measures provide meaningful
supplemental information regarding its performance and liquidity by excluding share-based
compensation expenses that may not be indicative of its operating performance from a cash
perspective. New Oriental believes that both management and investors benefit from referring
to these non-GAAP financial measures in assessing its performance and when planning and
forecasting future periods. These non-GAAP financial measures also facilitate management’s
internal comparisons to New Oriental’s historical performance and liquidity. New Oriental
computes its non-GAAP financial measures using the same consistent method from quarter to
quarter. New Oriental believes these non-GAAP financial measures are useful to investors in
allowing for greater transparency with respect to supplemental information used by
management in its financial and operational decision making. A limitation of using these
non-GAAP measures is that they exclude share-based compensation charge that has been
and will continue to be for the foreseeable future a significant recurring expense in our
business. Management compensates for these limitations by providing specific information
regarding the GAAP amounts excluded from each non-GAAP measure. The accompanying
tables have more details on the reconciliations between GAAP financial measures that are
most directly comparable to non-GAAP financial measures.
Contacts
For investor and media inquiries, please contact:
In China:

Mr. Martin Reidy
FTI Consulting
Tel: +86 10 8591 1060
Email: [email protected]
Ms. Sisi Zhao
New Oriental Education and Technology Group Inc.
Tel: +86-10-6260-5568
Email: [email protected]

NEW ORIENTAL EDUCATION & TECHNOLOGY GROUP INC.
CONDENSED CONSOLIDATED BALANCE SHEETS
(In thousands)
As of August 31
As of May 31
2013
2013
(Unaudited)
(Unaudited)
USD
USD
ASSETS:
Current assets:
Cash and cash equivalents 480,618
417,166
Restricted cash 2,539
1,626
Term deposits 50,366
50,035
Short term investments 587,431
504,952
Accounts receivable, net 4,225
3,530
Inventory 21,936
22,540
Deferred tax assets, current 7,153
9,025
Prepaid expenses and other current assets 73,286
59,586
Amounts due from related parties, current 2,599
2,372
Total current assets 1,230,153
1,070,832
Property, plant and equipment, net 242,732
247,262
Land use right, net 4,523
4,542
Amounts due from related party, non-current 1,001
904
Deferred tax assets, non-current 1,291
3,153
Long term deposit 12,655
12,600
Long term prepaid rent 1,040
1,259
Intangible assets 833
862
Goodwill 3,769
3,760
Long term investments 7,823
8,267
Total assets 1,505,820
1,353,441
LIABILITIES AND EQUITY
Current liabilities:
Accounts payable (including accounts payable of the consolidated
VIEs without recourse to New Oriental of US$8,553 and US$13,417
as of May 31, 2013 and August 31, 2013, respectively) 13,910
8,569
Accrued expenses and other current liabilities (including accrued
expenses and other current liabilities of the consolidated VIEs
without recourse to New Oriental of US$109,707 and US$121,068
as of May 31, 2013 and August 31, 2013, respectively) 150,751
131,499
Dividend payable (including dividend payable of the consolidated
VIEs without recourse to New Oriental of nil and nil as of May 31,
2013 and August 31, 2013, respectively) 53,966
-
Income tax payable (including income tax payable of the consolidated

VIEs without recourse to New Oriental of US$16,315 and
US$26,183 as of May 31, 2013 and August 31, 2013, respectively)
29,001
16,472
Amounts due to related parties (including amounts due to related
parties of the consolidated VIEs without recourse to New Oriental of
US$13 and nil as of May 31, 2013 and August 31, 2013, respectively) 1,121
1,101
Deferred revenue (including deferred revenue of the consolidated
VIEs without recourse to New Oriental of US$327,443 and
US$317,984 as of May 31, 2013 and August 31, 2013, respectively) 323,745
332,194
Total current liabilities 572,494
489,835
Deferred tax liabilities (including deferred tax liablities of the
consolidated VIEs without recourse to New Oriental of US$1,836
and US$1,817 as of May 31, 2013 and August 31, 2013, respectively) 1,817
1,836
Acquisition payable (including acquisition payables of the
consolidated VIEs without recourse to New Oriental of US$4,518
and US$4,601 as of May 31, 2013 and August 31, 2013, respectively) 4,601
4,518
Total long-term liabilities 6,418
6,354
Total liabilities 578,912
496,189
Total shareholder's equity 926,908
857,252
Total liabilities and shareholder's equity 1,505,820
1,353,441

NEW ORIENTAL EDUCATION & TECHNOLOGY GROUP INC.
CONDENSED CONSOLIDATED STATEMENTS OF OPERATIONS
(In thousands except for per share and per ADS amounts)
For the Three Months Ended August 31
2013
2012
(Unaudited)
(Unaudited)
USD
USD
Net Revenues:
Educational Programs and services 353,285
307,855
Books and others 35,378
27,974
Total net revenues 388,663
335,829
Operating costs and expenses (note 1):
Cost of revenues 132,609
118,216
Selling and marketing 42,692
39,470
General and administrative 77,894
76,588
Total operating costs and expenses 253,195
234,274
Operating income 135,468
101,555
Other income, net 10,228
7,739
Provision for income taxes (18,760)
(13,035)
Loss from equity method investment (460)
-
Income from continuing operations 126,476
96,259
Loss on discontinued operations, net of tax -
(407)
Net income attributable to New Oriental Education &
Technology Group Inc. 126,476
95,852
Net income (loss) per share attributable to New Oriental-
Basic
Income from continuing operations 0.82
0.62
Loss on discontinued operations -
(0.00)
Net income (loss) per share attributable to New Oriental-
Diluted
Income from continuing operations 0.81
0.61
Loss on discontinued operations -
(0.00)
Net income (loss) per ADS attributable to New Oriental-
Basic (note 2)
Income from continuing operations 0.82
0.62
Loss on discontinued operations -
(0.00)
Net income (loss) per ADS attributable to New Oriental-
Diluted (note 2)
Income from continuing operations 0.81
0.61
Loss on discontinued operations -
(0.00)
Other comprehensive income, net of tax 1,369
243
Comprehensive income 127,845
96,095

Comprehensive income attributable to New Oriental
Education & Technology Group Inc. 127,845
96,095
Notes:
Note 1: Share-based compensation expenses (in thousands) are included in the operating costs and expenses as
follows:
For the Three Months Ended August 31
2013
2012
(Unaudited)
(Unaudited)
USD
USD
Cost of revenues -
-
Selling and marketing -
-
General and administrative 5,380
6,720
Total 5,380
6,720
Note 2: Each ADS represents one common share.

NEW ORIENTAL EDUCATION & TECHNOLOGY GROUP INC.
RECONCILIATION OF NON-GAAP MEASURES TO THE MOST COMPARABLE GAAP MEASURES
(In thousands except for per share and per ADS amounts)
For the Three Months Ended August 31
2013
2012
(Unaudited)
(Unaudited)
USD
USD
General and administrative expenses 77,894
76,588
Share-based compensation expense in general
and administrative expenses 5,380
6,720
Non-GAAP general and administrative expenses 72,514
69,868
Total operating costs and expenses 253,195
234,274
Share-based compensation expenses 5,380
6,720
Non-GAAP operating costs and expenses 247,815
227,554
Operating income 135,468
101,555
Share-based compensation expenses 5,380
6,720
Non-GAAP operating income 140,848
108,275
Operating margin 34.9%
30.2%
Non-GAAP operating margin 36.2%
32.2%
Net income attributable to New Oriental 126,476
95,852
Share-based compensation expense 5,380
6,720
Non-GAAP net income 131,856
102,572
Net income per ADS attributable to New
Oriental - Basic (note 1) 0.82
0.62
Net income per ADS attributable to New
Oriental - Diluted (note 1) 0.81
0.61
Non-GAAP net income per ADS attributable to
New Oriental - Basic (note 1) 0.85
0.66
Non-GAAP net income per ADS attributable to
New Oriental - Diluted (note 1) 0.84
0.65
Weighted average shares used in calculating
basic net income per ADS (note 1) 155,136,247
155,577,054
Weighted average shares used in calculating
diluted net income per ADS (note 1) 157,108,421
157,249,683
Non-GAAP Income per share - basic 0.85
0.66
Non-GAAP Income per share - diluted 0.84
0.65
Note 1: Each ADS represents one common share.