Embed Size (px)
Citation preview

Q4 2017 AT&T EARNINGS
JANUARY 31, 2018
Financial and Operational TrendsIncome Statements, Cash Flows, Segment Results, Revenue Details and Operating Volumes

Consolidated Statements of IncomeAT&T Inc.
Dollars in millions except per share amountsUnaudited 3/31/16 6/30/16 9/30/16 12/31/16 2016 3/31/17 6/30/17 9/30/17 12/31/17 2017
Operating Revenues 40,535$ 40,520$ 40,890$ 41,841$ 163,786$ 39,365$ 39,837$ 39,668$ 41,676$ 160,546$
Operating Expenses
Cost of services and salesEquipment 4,375 4,260 4,455 5,667 18,757 3,848 4,138 4,191 6,532 18,709
Broadcast, programming and operations 4,629 4,701 4,909 5,612 19,851 4,974 4,898 5,284 6,003 21,159
Other cost of services and sales 9,396 9,514 9,526 9,840 38,276 9,065 9,218 9,431 9,797 37,511
Selling, general and administrative 8,441 8,909 9,013 9,984 36,347 8,487 8,113 8,317 10,000 34,917
Asset abandonments and impairments - - - 361 361 - - - 2,914 2,914
Depreciation and amortization 6,563 6,576 6,579 6,129 25,847 6,127 6,147 6,042 6,071 24,387
Total Operating Expenses 33,404 33,960 34,482 37,593 139,439 32,501 32,514 33,265 41,317 139,597
Operating Income 7,131 6,560 6,408 4,248 24,347 6,864 7,323 6,403 359 20,949
Interest Expense 1,207 1,258 1,224 1,221 4,910 1,293 1,395 1,686 1,926 6,300
Equity in Net Income (Loss) of Affiliates 13 28 16 41 98 (173) 14 11 20 (128)
Other Income (Expense) – Net 70 91 (7) 123 277 (20) 128 246 264 618
Income (Loss) Before Income Taxes 6,007 5,421 5,193 3,191 19,812 5,378 6,070 4,974 (1,283) 15,139
Income Tax Expense (Benefit) 2,122 1,906 1,775 676 6,479 1,804 2,056 1,851 (20,419) (14,708)
Net Income 3,885 3,515 3,418 2,515 13,333 3,574 4,014 3,123 19,136 29,847
Less: Net Income Attributable to Noncontrolling Interest (82) (107) (90) (78) (357) (105) (99) (94) (99) (397)
Net Income Attributable to AT&T 3,803$ 3,408$ 3,328$ 2,437$ 12,976$ 3,469$ 3,915$ 3,029$ 19,037$ 29,450$
Diluted Earnings Per Share Attributable to AT&T 0.61$ 0.55$ 0.54$ 0.39$ 2.10$ 0.56$ 0.63$ 0.49$ 3.08$ 4.76$
AT&T Inc.
Dollars in millions except per share amounts Unaudited 3/31/16 6/30/16 9/30/16 12/31/16 2016 3/31/17 6/30/17 9/30/17 12/31/17 2017
Capital Expenditures: Purchase of property and equipment 4,451$ 5,251$ 5,581$ 6,233$ 21,516$ 5,784$ 4,966$ 5,006$ 4,891$ 20,647$
Interest during construction 218 219 232 223 892 231 242 245 185 903
Dividends Declared Per Share 0.48$ 0.48$ 0.48$ 0.49$ 1.93$ 0.49$ 0.49$ 0.49$ 0.50$ 1.97$
Annual Dividend Per Share Growth 2.1% 2.1% 2.1% 2.1% 2.1% 2.1% 2.1% 2.0%
End of Period Common Shares Outstanding (000,000) 6,156 6,152 6,141 6,139 6,147 6,140 6,139 6,139
Debt Ratio 51.2% 50.5% 50.1% 49.9% 51.6% 53.3% 56.4% 53.6%
Total Employees 280,870 277,200 273,140 268,540 264,530 260,480 256,800 254,000
See Notes to Financial and Operational Trends on page 14.
Financial and Operating Statistics Summary
Page 2

AT&T Inc.
Dollars in millionsUnaudited 12/31/16 3/31/17 6/30/17 9/30/17 12/31/17
Operating Activities
Net income $ 2,515 $ 3,574 $ 4,014 $ 3,123 $ 19,136
Adjustments to reconcile net income to net cash provided by operating activities:Depreciation and amortization 6,129 6,127 6,147 6,042 6,071
Undistributed earnings from investments in equity affiliates (15) 182 (15) 4 3
Provision for uncollectible accounts 438 393 402 421 426
Deferred income tax (benefit) expense (64) 480 484 2,290 (19,194)
Net (gain) loss from sale of investments, net of impairments (81) 61 (49) (126) (168)
Actuarial loss (gain) on pension and postretirement benefits 1,024 - (259) - 1,517
Asset abandonments and impairments 361 - - - 2,914
Changes in operating assets and liabilities: Accounts receivable 105 445 (326) (771) (334)
Other current assets (97) 228 243 (577) (671)
Accounts payable and other accrued liabilities 1,291 (1,582) (1,179) 1,324 2,253
Equipment installment receivables and related sales (783) 579 328 209 (1,379)
Deferred fulfillment costs (476) (436) (360) (306) (320)
Retirement benefit funding (140) (140) (140) (140) (646)
Other - net (65) (693) (348) (379) 269
Total adjustments 7,627 5,644 4,928 7,991 (9,259)
Net Cash Provided by Operating Activities 10,142 9,218 8,942 11,114 9,877
Investing Activities
Capital expenditures: Purchase of property and equipment (6,233) (5,784) (4,966) (5,006) (4,891)
Interest during construction (223) (231) (242) (245) (185)
Acquisitions, net of cash acquired (37) (162) 1,386 (70) (31)
Dispositions 462 6 45 5 3
(Purchases) sales of securities, net 5 - - (2) (2)
Other - - - - 1
Net Cash Used in Investing Activities (6,026) (6,171) (3,777) (5,318) (5,105)
Financing Activities
Issuance of long-term debt - 12,440 11,675 22,646 2,032
Repayment of long-term debt (135) (3,053) (3,065) (4,191) (2,030)
Purchase of treasury stock (68) (177) (281) (2) (3)
Issuance of treasury stock 9 21 3 2 7
Dividends paid (2,947) (3,009) (3,012) (3,009) (3,008)
Other (1,082) (173) 248 1,640 229
Net Cash Provided by (Used in) Financing Activities (4,223) 6,049 5,568 17,086 (2,773)
Net increase (decrease) in cash and cash equivalents (107) 9,096 10,733 22,882 1,999
Cash and cash equivalents beginning of period 5,895 5,788 14,884 25,617 48,499
Cash and Cash Equivalents End of Period $ 5,788 $ 14,884 $ 25,617 $ 48,499 $ 50,498
Cash paid for interest $ 1,266 $ 1,643 $ 1,452 $ 1,936 $ 1,591
Consolidated Statements of Cash Flows1
Three Months Ended
See Notes to Financial and Operational Trends on page 14.Page 3

Statement of Segment Income
Dollars in millionsUnaudited 12/31/15 3/31/16 6/30/16 9/30/16 12/31/16 3/31/17 6/30/17 9/30/17 12/31/17
Segment Operating Revenues
Wireless Service 7,684$ 7,855$ 7,963$ 8,050$ 7,983$ 7,929$ 8,006$ 8,034$ 7,933$
Wireless Equipment 2,454 1,771 1,775 1,876 2,348 1,498 1,721 1,654 3,022
Total Wireless Revenues 10,138 9,626 9,738 9,926 10,331 9,427 9,727 9,688 10,955
Fixed Strategic Services2 2,704 2,751 2,805 2,913 2,962 2,974 3,028 3,087 3,138
Legacy Voice and Data Services 4,399 4,373 4,162 4,042 3,793 3,630 3,508 3,434 3,359
Other Service and Equipment 973 859 874 886 947 817 844 852 938
Total Fixed Revenues 8,076 7,983 7,841 7,841 7,702 7,421 7,380 7,373 7,435
Total Segment Operating Revenues 18,214$ 17,609$ 17,579$ 17,767$ 18,033$ 16,848$ 17,107$ 17,061$ 18,390$
Segment Operating Expenses
Operations and support 11,980 10,802 10,857 10,925 11,746 10,176 10,313 10,233 12,207
Depreciation and amortization 2,513 2,508 2,521 2,539 2,264 2,312 2,335 2,325 2,354
Total Segment Operating Expenses 14,493 13,310 13,378 13,464 14,010 12,488 12,648 12,558 14,561
Segment Operating Income 3,721 4,299 4,201 4,303 4,023 4,360 4,459 4,503 3,829
Equity in Net Income (Loss) of Affiliates - - - - - - - - (1)
Segment Contribution 3,721$ 4,299$ 4,201$ 4,303$ 4,023$ 4,360$ 4,459$ 4,503$ 3,828$
Segment Operating Income Margin 20.4% 24.4% 23.9% 24.2% 22.3% 25.9% 26.1% 26.4% 20.8%
EBITDA3 6,234 6,807 6,722 6,842 6,287 6,672 6,794 6,828 6,183
EBITDA Margin3 34.2% 38.7% 38.2% 38.5% 34.9% 39.6% 39.7% 40.0% 33.6%
Supplemental Business Solutions Results
Dollars in millionsUnaudited 12/31/15 3/31/16 6/30/16 9/30/16 12/31/16 3/31/17 6/30/17 9/30/17 12/31/17
Business Wireless EBITDA3 3,327$ 3,914$ 3,917$ 3,980$ 3,583$ 3,957$ 4,050$ 4,126$ 3,375$
Business Wireless EBITDA Margin3 32.8% 40.7% 40.2% 40.1% 34.7% 42.0% 41.6% 42.6% 30.8%
Business Fixed EBITDA3 2,907$ 2,893$ 2,805$ 2,862$ 2,704$ 2,715$ 2,744$ 2,702$ 2,808$
Business Fixed EBITDA Margin3 36.0% 36.2% 35.8% 36.5% 35.1% 36.6% 37.2% 36.6% 37.8%
See Notes to Financial and Operational Trends on page 14.
Business Solutions
Three Months Ended
Business Solutions
Three Months Ended
Page 4

Revenues by Customer Type4
Dollars in millionsUnaudited 12/31/15 3/31/16 6/30/16 9/30/16 12/31/16 3/31/17 6/30/17 9/30/17 12/31/17
Segment Operating Revenues
Wireless 5,682$ 5,162$ 5,184$ 5,275$ 5,522$ 4,963$ 5,078$ 5,055$ 5,735$
Fixed 3,788 3,736 3,664 3,652 3,545 3,392 3,394 3,424 3,476
Global Business 9,470 8,898 8,848 8,927 9,067 8,355 8,472 8,479 9,211
Wireless 1,739 1,928 2,012 2,062 2,133 1,993 2,097 2,077 2,353
Fixed 1,792 1,801 1,765 1,758 1,729 1,665 1,641 1,651 1,632
National Business 3,531 3,729 3,777 3,820 3,862 3,658 3,738 3,728 3,985
Wireless 2,642 2,462 2,467 2,509 2,589 2,388 2,467 2,470 2,772
Fixed 997 954 964 993 994 929 941 915 964
Global Public Sector 3,639 3,416 3,431 3,502 3,583 3,317 3,408 3,385 3,736
Wireless 75 74 75 80 87 83 85 86 95
Fixed 1,499 1,492 1,448 1,438 1,434 1,435 1,404 1,383 1,363
Partner Solutions 1,574 1,566 1,523 1,518 1,521 1,518 1,489 1,469 1,458
Wireless 10,138 9,626 9,738 9,926 10,331 9,427 9,727 9,688 10,955
Fixed 8,076 7,983 7,841 7,841 7,702 7,421 7,380 7,373 7,435
Total Segment Operating Revenues 18,214$ 17,609$ 17,579$ 17,767$ 18,033$ 16,848$ 17,107$ 17,061$ 18,390$
Operating Volumes
Volumes in thousandsUnaudited 12/31/15 3/31/16 6/30/16 9/30/16 12/31/16 3/31/17 6/30/17 9/30/17 12/31/17
Wireless Subscribers and Connections5,6
Total Subscribers and Connections 73,659 75,771 77,545 79,427 81,402 82,354 84,794 87,398 90,432
Postpaid 48,290 48,844 49,433 50,014 50,688 50,839 51,111 51,412 51,811
Connected Devices 25,284 26,863 28,061 29,355 30,649 31,439 33,611 35,909 38,534
Wireless Net Add Detail (Adjusted for M&A)5,6,7
Net Customer Additions 1,563 1,689 1,371 1,482 1,514 2,434 2,201 2,309 2,849
Postpaid Net Adds 353 133 185 191 250 (125) 36 15 221
Connected Devices Net Adds 1,211 1,578 1,199 1,290 1,263 2,553 2,170 2,292 2,624
Wireless Churn Detail
Postpaid Churn6,7,8 1.10% 1.02% 0.91% 0.97% 1.11% 1.07% 0.97% 1.01% 1.08%
Broadband Connections
IP 911 928 948 963 977 980 992 1,017 1,025
DSL 581 545 512 479 449 421 392 367 344
Total Broadband Connections 1,492 1,473 1,460 1,442 1,426 1,401 1,384 1,384 1,369
Voice Connections
Total Wired Voice Connections9 9,485 9,212 8,933 8,653 8,376 8,104 7,839 7,585 7,337
See Notes to Financial and Operational Trends on page 14.
Business Solutions
Three Months Ended
Three Months Ended
Business Solutions
Page 5

Statement of Segment Income
Dollars in millionsUnaudited 12/31/15 3/31/16 6/30/16 9/30/16 12/31/16 3/31/17 6/30/17 9/30/17 12/31/17
Segment Operating Revenues
Video Entertainment 9,247$ 8,904$ 8,963$ 9,026$ 9,567$ 9,020$ 9,153$ 9,200$ 9,355$
High-Speed Internet 1,740 1,803 1,867 1,892 1,910 1,941 1,927 1,916 1,890
Legacy Voice and Data Services 1,367 1,313 1,244 1,168 1,104 1,056 1,005 949 910
Other Service and Equipment 640 638 637 634 625 606 597 583 590
Total Segment Operating Revenues 12,994$ 12,658$ 12,711$ 12,720$ 13,206$ 12,623$ 12,682$ 12,648$ 12,745$
Segment Operating Expenses
Operations and support 10,123 9,578 9,569 9,728 10,463 9,601 9,558 9,953 10,308
Depreciation and amortization 1,426 1,488 1,489 1,504 1,381 1,419 1,458 1,379 1,367
Total Segment Operating Expenses 11,549 11,066 11,058 11,232 11,844 11,020 11,016 11,332 11,675
Segment Operating Income 1,445 1,592 1,653 1,488 1,362 1,603 1,666 1,316 1,070
Equity in Net Income (Loss) of Affiliates 12 3 (2) - 8 (6) (11) (6) (7)
Segment Contribution 1,457$ 1,595$ 1,651$ 1,488$ 1,370$ 1,597$ 1,655$ 1,310$ 1,063$
Segment Operating Income Margin 11.1% 12.6% 13.0% 11.7% 10.3% 12.7% 13.1% 10.4% 8.4%
EBITDA3 2,871$ 3,080$ 3,142$ 2,992$ 2,743$ 3,022$ 3,124$ 2,695$ 2,437$
EBITDA Margin3 22.1% 24.3% 24.7% 23.5% 20.8% 23.9% 24.6% 21.3% 19.1%
See Notes to Financial and Operational Trends on page 14.
Entertainment Group
Three Months Ended
Page 6

Volumes in thousandsUnaudited 12/31/15 3/31/16 6/30/16 9/30/16 12/31/16 3/31/17 6/30/17 9/30/17 12/31/17
Video Connections
Satellite 19,784 20,112 20,454 20,777 21,012 21,012 20,856 20,605 20,458
U-verse 5,614 5,232 4,841 4,515 4,253 4,020 3,825 3,691 3,631
DIRECTV NOW17 267 339 491 787 1,155
Total Video Connections 25,398 25,344 25,295 25,292 25,532 25,371 25,172 25,083 25,244
Broadband Connections
IP 12,356 12,542 12,596 12,752 12,888 13,130 13,242 13,367 13,462
DSL 1,930 1,749 1,585 1,424 1,291 1,164 1,060 964 888
Total Broadband Connections 14,286 14,291 14,181 14,176 14,179 14,294 14,302 14,331 14,350
Voice Connections
Total Wired Voice Connections9 12,498 12,113 11,815 11,533 11,278 11,003 10,696 10,333 9,996
Net Adds
Satellite 214 328 342 323 235 - (156) (251) (147)
U-verse (240) (382) (391) (326) (262) (233) (195) (134) (60)
DIRECTV NOW 267 72 152 296 368
Total Video (26) (54) (49) (3) 240 (161) (199) (89) 161
IP 171 186 54 156 136 242 112 125 95
DSL (208) (181) (164) (161) (133) (127) (104) (96) (76)
Broadband (37) 5 (110) (5) 3 115 8 29 19
Total Entertainment Group Revenue Connections 52,182 51,748 51,291 51,001 50,989 50,668 50,170 49,747 49,590
Net Change (455) (434) (457) (290) (12) (321) (498) (423) (157)
Linear Video ARPU10 120.59$ 116.12$ 117.01$ 118.09$ 125.25$ 118.23$ 121.16$ 123.45$ 126.65$
IP Broadband ARPU10 47.22$ 48.22$ 49.52$ 49.82$ 49.69$ 49.81$ 48.70$ 48.00$ 46.94$
Entertainment Group
Three Months Ended
See Notes to Financial and Operational Trends on page 14.
Operating Volumes and Statistics
Page 7

Statement of Segment Income
Dollars in millions
Unaudited 12/31/15 3/31/16 6/30/16 9/30/16 12/31/16 3/31/17 6/30/17 9/30/17 12/31/17
Segment Operating Revenues
Service 7,131$ 6,943$ 6,948$ 6,914$ 6,731$ 6,609$ 6,528$ 6,507$ 6,409$
Equipment 1,618 1,385 1,238 1,353 1,688 1,131 1,263 1,241 1,864
Total Segment Operating Revenues 8,749$ 8,328$ 8,186$ 8,267$ 8,419$ 7,740$ 7,791$ 7,748$ 8,273$
Segment Operating Expenses
Operations and support 5,669 4,912 4,680 4,751 5,316 4,528 4,520 4,551 5,367
Depreciation and amortization 939 922 932 944 918 873 871 877 886
Total Segment Operating Expenses 6,608 5,834 5,612 5,695 6,234 5,401 5,391 5,428 6,253
Segment Operating Income 2,141 2,494 2,574 2,572 2,185 2,339 2,400 2,320 2,020
Equity in Net Income of Affiliates - - - - - - - - -
Segment Contribution 2,141$ 2,494$ 2,574$ 2,572$ 2,185$ 2,339$ 2,400$ 2,320$ 2,020$
Segment Operating Income Margin 24.5% 29.9% 31.4% 31.1% 26.0% 30.2% 30.8% 29.9% 24.4%
EBITDA3 3,080$ 3,416$ 3,506$ 3,516$ 3,103$ 3,212$ 3,271$ 3,197$ 2,906$
EBITDA Margin3 35.2% 41.0% 42.8% 42.5% 36.9% 41.5% 42.0% 41.3% 35.1%
EBITDA Service Margin3 43.2% 49.2% 50.5% 50.9% 46.1% 48.6% 50.1% 49.1% 45.3%
Operating Volumes6
Volumes in thousandsUnaudited 12/31/15 3/31/16 6/30/16 9/30/16 12/31/16 3/31/17 6/30/17 9/30/17 12/31/17
Wireless Subscribers and Connections
Total Subscribers and Connections 54,981 54,674 54,260 53,911 53,457 51,864 51,706 51,428 51,135
Postpaid 28,814 28,294 27,862 27,374 27,095 26,510 26,290 26,003 26,064
Prepaid18 11,548 12,171 12,633 13,035 13,536 13,844 14,187 15,136 15,335
Branded Connections18 40,362 40,465 40,495 40,409 40,631 40,354 40,477 41,139 41,399
Reseller & Connected Devices11, 18 14,619 14,209 13,765 13,502 12,826 11,510 11,229 10,289 9,736
Net Add Detail (Adjusted for M&A)7
Net Customer Additions 671 92 (10) 50 8 (353) 81 14 (108)
Postpaid Net Adds 174 (4) 72 21 270 (66) 91 102 320
Prepaid Net Adds18 469 500 365 304 406 282 267 324 140
Branded Net Adds18 643 496 437 325 676 216 358 426 460
Reseller & Connected Devices Net Adds18 28 (404) (447) (275) (668) (569) (277) (412) (568)
Churn Detail
Total Churn7, 8 1.97% 2.11% 1.96% 2.11% 2.43% 2.42% 2.15% 2.37% 2.48%
Postpaid Churn7, 8 1.31% 1.24% 1.09% 1.19% 1.25% 1.22% 1.09% 1.17% 1.18%
Consumer Mobility
Three Months Ended
Consumer Mobility
Three Months Ended
See Notes to Financial and Operational Trends on page 14.
Page 8
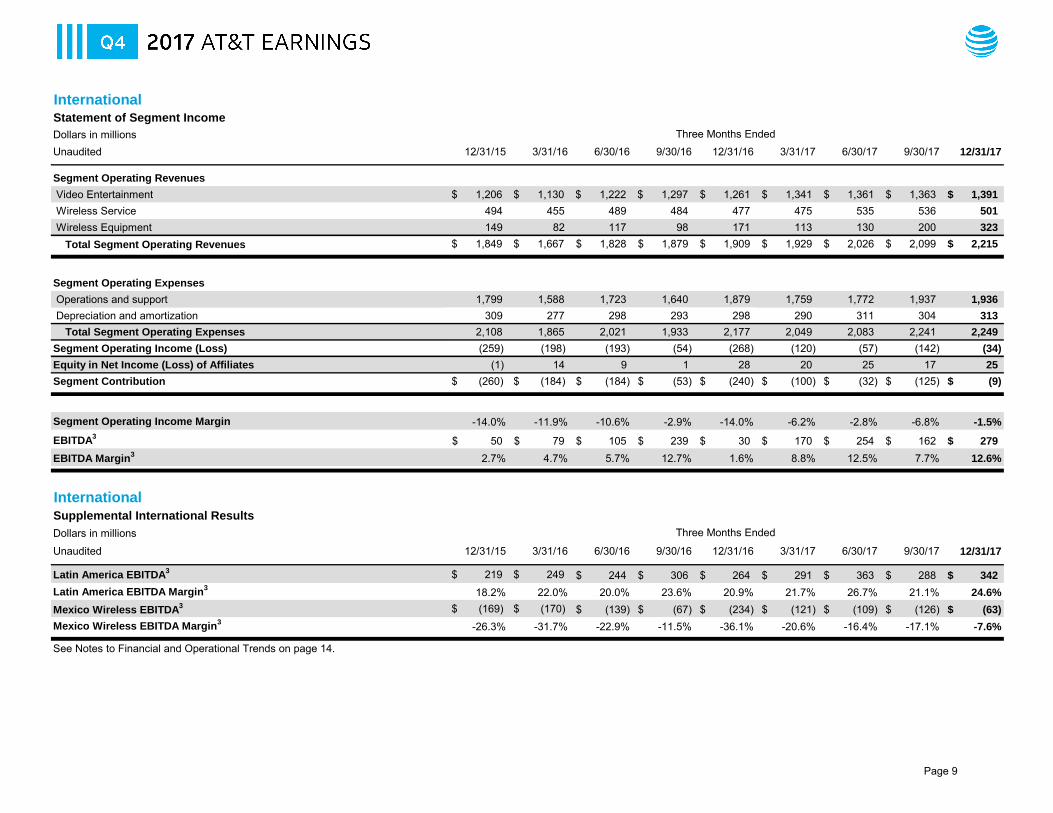
Statement of Segment Income
Dollars in millionsUnaudited 12/31/15 3/31/16 6/30/16 9/30/16 12/31/16 3/31/17 6/30/17 9/30/17 12/31/17
Segment Operating Revenues
Video Entertainment $ 1,206 $ 1,130 $ 1,222 $ 1,297 1,261$ 1,341$ 1,361$ 1,363$ 1,391$
Wireless Service 494 455 489 484 477 475 535 536 501
Wireless Equipment 149 82 117 98 171 113 130 200 323
Total Segment Operating Revenues $ 1,849 $ 1,667 1,828$ 1,879$ 1,909$ 1,929$ 2,026$ 2,099$ 2,215$
Segment Operating Expenses
Operations and support 1,799 1,588 1,723 1,640 1,879 1,759 1,772 1,937 1,936
Depreciation and amortization 309 277 298 293 298 290 311 304 313
Total Segment Operating Expenses 2,108 1,865 2,021 1,933 2,177 2,049 2,083 2,241 2,249
Segment Operating Income (Loss) (259) (198) (193) (54) (268) (120) (57) (142) (34)
Equity in Net Income (Loss) of Affiliates (1) 14 9 1 28 20 25 17 25
Segment Contribution $ (260) $ (184) (184)$ (53)$ (240)$ (100)$ (32)$ (125)$ (9)$
Segment Operating Income Margin -14.0% -11.9% -10.6% -2.9% -14.0% -6.2% -2.8% -6.8% -1.5%
EBITDA3 50$ 79$ 105$ 239$ 30$ 170$ 254$ 162$ 279$
EBITDA Margin3 2.7% 4.7% 5.7% 12.7% 1.6% 8.8% 12.5% 7.7% 12.6%
Supplemental International Results
Dollars in millions
Unaudited 12/31/15 3/31/16 6/30/16 9/30/16 12/31/16 3/31/17 6/30/17 9/30/17 12/31/17
Latin America EBITDA3 $ 219 $ 249 244$ 306$ 264$ 291$ 363$ 288$ 342$
Latin America EBITDA Margin3 18.2% 22.0% 20.0% 23.6% 20.9% 21.7% 26.7% 21.1% 24.6%
Mexico Wireless EBITDA3 $ (169) $ (170) (139)$ (67)$ (234)$ (121)$ (109)$ (126)$ (63)$
Mexico Wireless EBITDA Margin3 -26.3% -31.7% -22.9% -11.5% -36.1% -20.6% -16.4% -17.1% -7.6%
International
Three Months Ended
See Notes to Financial and Operational Trends on page 14.
International
Three Months Ended
Page 9
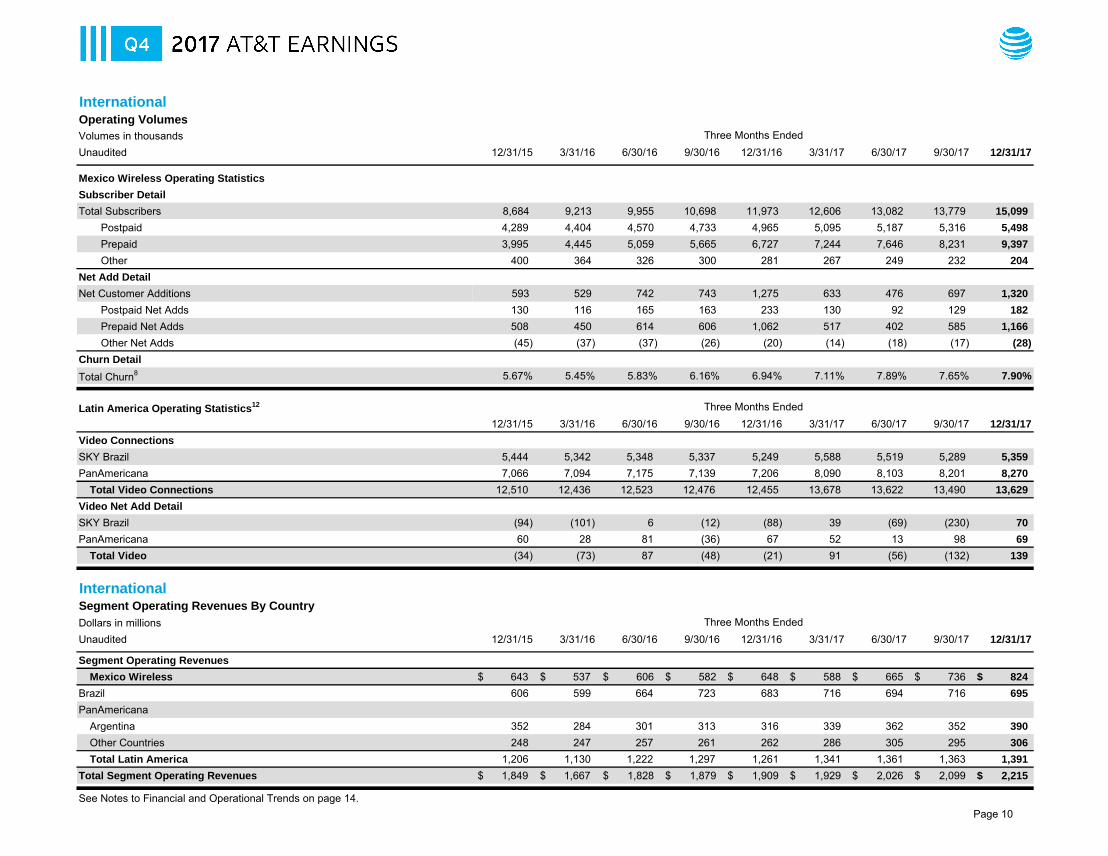
Operating Volumes
Volumes in thousandsUnaudited 12/31/15 3/31/16 6/30/16 9/30/16 12/31/16 3/31/17 6/30/17 9/30/17 12/31/17
Mexico Wireless Operating Statistics
Subscriber Detail
Total Subscribers 8,684 9,213 9,955 10,698 11,973 12,606 13,082 13,779 15,099
Postpaid 4,289 4,404 4,570 4,733 4,965 5,095 5,187 5,316 5,498
Prepaid 3,995 4,445 5,059 5,665 6,727 7,244 7,646 8,231 9,397
Other 400 364 326 300 281 267 249 232 204
Net Add Detail
Net Customer Additions 593 529 742 743 1,275 633 476 697 1,320
Postpaid Net Adds 130 116 165 163 233 130 92 129 182
Prepaid Net Adds 508 450 614 606 1,062 517 402 585 1,166
Other Net Adds (45) (37) (37) (26) (20) (14) (18) (17) (28)
Churn Detail
Total Churn8 5.67% 5.45% 5.83% 6.16% 6.94% 7.11% 7.89% 7.65% 7.90%
Latin America Operating Statistics12
12/31/15 3/31/16 6/30/16 9/30/16 12/31/16 3/31/17 6/30/17 9/30/17 12/31/17
Video Connections
SKY Brazil 5,444 5,342 5,348 5,337 5,249 5,588 5,519 5,289 5,359
PanAmericana 7,066 7,094 7,175 7,139 7,206 8,090 8,103 8,201 8,270
Total Video Connections 12,510 12,436 12,523 12,476 12,455 13,678 13,622 13,490 13,629
Video Net Add Detail
SKY Brazil (94) (101) 6 (12) (88) 39 (69) (230) 70
PanAmericana 60 28 81 (36) 67 52 13 98 69
Total Video (34) (73) 87 (48) (21) 91 (56) (132) 139
Dollars in millionsUnaudited 12/31/15 3/31/16 6/30/16 9/30/16 12/31/16 3/31/17 6/30/17 9/30/17 12/31/17
Segment Operating Revenues
Mexico Wireless $ 643 $ 537 606$ 582$ 648$ 588$ 665$ 736$ 824$
Brazil 606 599 664 723 683 716 694 716 695
PanAmericanaArgentina 352 284 301 313 316 339 362 352 390
Other Countries 248 247 257 261 262 286 305 295 306
Total Latin America 1,206 1,130 1,222 1,297 1,261 1,341 1,361 1,363 1,391
Total Segment Operating Revenues $ 1,849 $ 1,667 1,828$ 1,879$ 1,909$ 1,929$ 2,026$ 2,099$ 2,215$
See Notes to Financial and Operational Trends on page 14.
Three Months Ended
International
Three Months Ended
InternationalSegment Operating Revenues By Country
Three Months Ended
Page 10
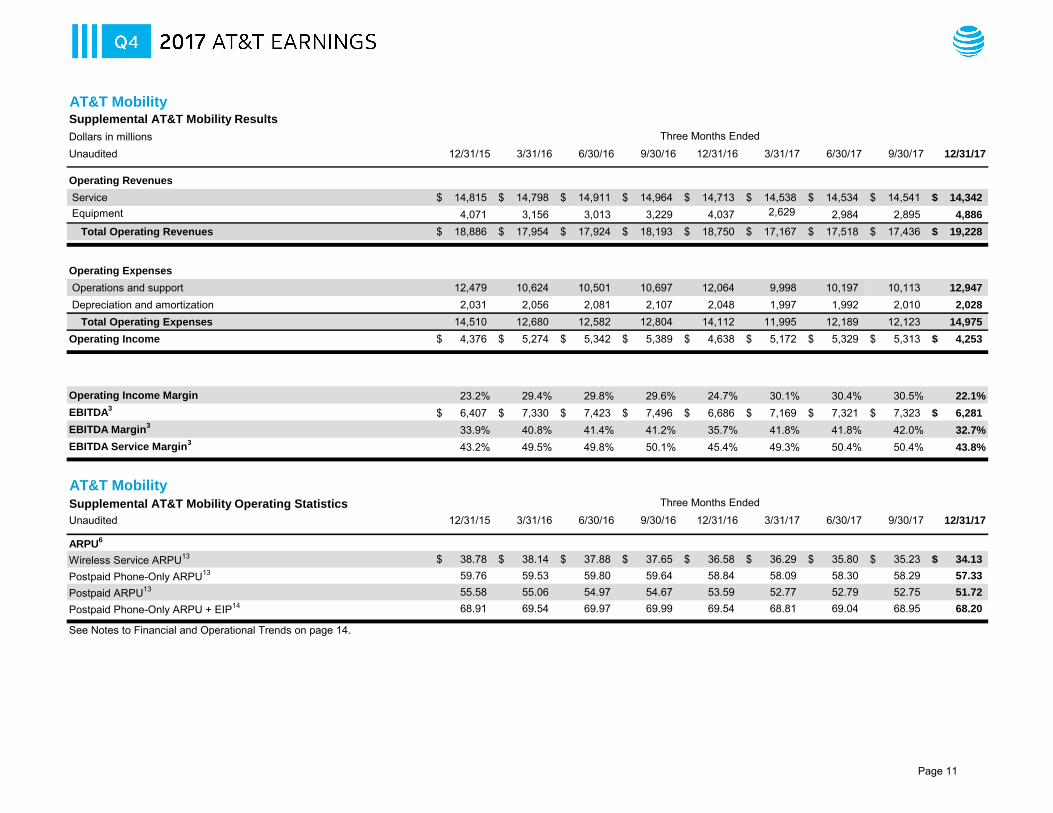
Dollars in millionsUnaudited 12/31/15 3/31/16 6/30/16 9/30/16 12/31/16 3/31/17 6/30/17 9/30/17 12/31/17
Operating Revenues
Service 14,815$ 14,798$ 14,911$ 14,964$ 14,713$ 14,538$ 14,534$ 14,541$ 14,342$
Equipment 4,071 3,156 3,013 3,229 4,037 2,629 2,984 2,895 4,886
Total Operating Revenues 18,886$ 17,954$ 17,924$ 18,193$ 18,750$ 17,167$ 17,518$ 17,436$ 19,228$
Operating Expenses
Operations and support 12,479 10,624 10,501 10,697 12,064 9,998 10,197 10,113 12,947
Depreciation and amortization 2,031 2,056 2,081 2,107 2,048 1,997 1,992 2,010 2,028
Total Operating Expenses 14,510 12,680 12,582 12,804 14,112 11,995 12,189 12,123 14,975
Operating Income 4,376$ 5,274$ 5,342$ 5,389$ 4,638$ 5,172$ 5,329$ 5,313$ 4,253$
Operating Income Margin 23.2% 29.4% 29.8% 29.6% 24.7% 30.1% 30.4% 30.5% 22.1%
EBITDA3 6,407$ 7,330$ 7,423$ 7,496$ 6,686$ 7,169$ 7,321$ 7,323$ 6,281$
EBITDA Margin3 33.9% 40.8% 41.4% 41.2% 35.7% 41.8% 41.8% 42.0% 32.7%
EBITDA Service Margin3 43.2% 49.5% 49.8% 50.1% 45.4% 49.3% 50.4% 50.4% 43.8%
Supplemental AT&T Mobility Operating Statistics
Unaudited 12/31/15 3/31/16 6/30/16 9/30/16 12/31/16 3/31/17 6/30/17 9/30/17 12/31/17
ARPU6
Wireless Service ARPU13 38.78$ 38.14$ 37.88$ 37.65$ 36.58$ 36.29$ 35.80$ 35.23$ 34.13$
Postpaid Phone-Only ARPU13 59.76 59.53 59.80 59.64 58.84 58.09 58.30 58.29 57.33
Postpaid ARPU13 55.58 55.06 54.97 54.67 53.59 52.77 52.79 52.75 51.72
Postpaid Phone-Only ARPU + EIP14 68.91 69.54 69.97 69.99 69.54 68.81 69.04 68.95 68.20
AT&T Mobility
See Notes to Financial and Operational Trends on page 14.
Supplemental AT&T Mobility Results
AT&T Mobility
Three Months Ended
Three Months Ended
Page 11
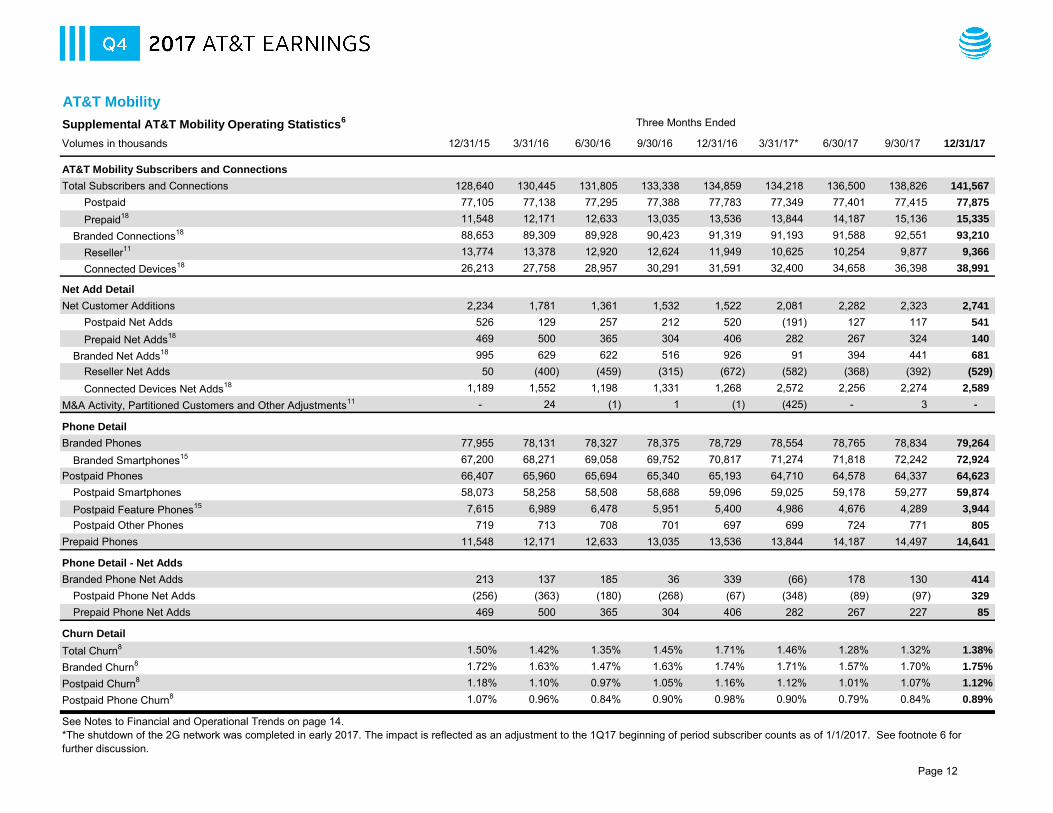
Supplemental AT&T Mobility Operating Statistics6
Volumes in thousands 12/31/15 3/31/16 6/30/16 9/30/16 12/31/16 3/31/17* 6/30/17 9/30/17 12/31/17
AT&T Mobility Subscribers and Connections
Total Subscribers and Connections 128,640 130,445 131,805 133,338 134,859 134,218 136,500 138,826 141,567
Postpaid 77,105 77,138 77,295 77,388 77,783 77,349 77,401 77,415 77,875
Prepaid18 11,548 12,171 12,633 13,035 13,536 13,844 14,187 15,136 15,335
Branded Connections18 88,653 89,309 89,928 90,423 91,319 91,193 91,588 92,551 93,210
Reseller11 13,774 13,378 12,920 12,624 11,949 10,625 10,254 9,877 9,366
Connected Devices18 26,213 27,758 28,957 30,291 31,591 32,400 34,658 36,398 38,991
Net Add Detail
Net Customer Additions 2,234 1,781 1,361 1,532 1,522 2,081 2,282 2,323 2,741
Postpaid Net Adds 526 129 257 212 520 (191) 127 117 541
Prepaid Net Adds18 469 500 365 304 406 282 267 324 140
Branded Net Adds18 995 629 622 516 926 91 394 441 681
Reseller Net Adds 50 (400) (459) (315) (672) (582) (368) (392) (529)
Connected Devices Net Adds18 1,189 1,552 1,198 1,331 1,268 2,572 2,256 2,274 2,589
M&A Activity, Partitioned Customers and Other Adjustments11 - 24 (1) 1 (1) (425) - 3 -
Phone Detail
Branded Phones 77,955 78,131 78,327 78,375 78,729 78,554 78,765 78,834 79,264
Branded Smartphones15 67,200 68,271 69,058 69,752 70,817 71,274 71,818 72,242 72,924
Postpaid Phones 66,407 65,960 65,694 65,340 65,193 64,710 64,578 64,337 64,623
Postpaid Smartphones 58,073 58,258 58,508 58,688 59,096 59,025 59,178 59,277 59,874
Postpaid Feature Phones15 7,615 6,989 6,478 5,951 5,400 4,986 4,676 4,289 3,944
Postpaid Other Phones 719 713 708 701 697 699 724 771 805
Prepaid Phones 11,548 12,171 12,633 13,035 13,536 13,844 14,187 14,497 14,641
Phone Detail - Net Adds
Branded Phone Net Adds 213 137 185 36 339 (66) 178 130 414
Postpaid Phone Net Adds (256) (363) (180) (268) (67) (348) (89) (97) 329
Prepaid Phone Net Adds 469 500 365 304 406 282 267 227 85
Churn Detail
Total Churn8 1.50% 1.42% 1.35% 1.45% 1.71% 1.46% 1.28% 1.32% 1.38%
Branded Churn8 1.72% 1.63% 1.47% 1.63% 1.74% 1.71% 1.57% 1.70% 1.75%
Postpaid Churn8 1.18% 1.10% 0.97% 1.05% 1.16% 1.12% 1.01% 1.07% 1.12%
Postpaid Phone Churn8 1.07% 0.96% 0.84% 0.90% 0.98% 0.90% 0.79% 0.84% 0.89%
AT&T Mobility
See Notes to Financial and Operational Trends on page 14.*The shutdown of the 2G network was completed in early 2017. The impact is reflected as an adjustment to the 1Q17 beginning of period subscriber counts as of 1/1/2017. See footnote 6 forfurther discussion.
Three Months Ended
Page 12

Dollars in millionsUnaudited 12/31/15 3/31/16 6/30/16 9/30/16 12/31/16 3/31/17 6/30/17 9/30/17 12/31/17
Operating Revenues
National Mass Markets 92$ 87$ 84$ 81$ 78$ 72$ 69$ 67$ 63$
Other Wholesale and Global Hubbing 100 93 40 94 78 62 59 56 47
Customer Information Services 37 35 31 30 29 28 27 26 24
Other 84 58 61 65 99 63 76 52 73
Total Operating Revenues 313$ 273$ 216$ 270$ 284$ 225$ 231$ 201$ 207$
Operating Expenses
Operations and support 272 377 293 270 233 221 87 89 157
Depreciation and amortization 17 17 20 17 11 31 2 21 18
Total Operating Expenses 289 394 313 287 244 252 89 110 175
Operating Income (Loss) 24$ (121)$ (97)$ (17)$ 40$ (27)$ 142$ 91$ 32$
Corporate & Other16
Three Months Ended
See Notes to Financial and Operational Trends on page 14.
Supplemental Results - Corporate & Other
Page 13

AT&T Inc.
Notes to Financial and Operational Trends
1 Prior-period amounts restated to conform to current-period reporting methodology.2 Fixed Strategic Services are the next generation wireline capabilities that lead AT&T’s most advanced business solutions — including VPNs, Ethernet, cloud, hosting,
IP conferencing, voice over IP, dedicated internet, IP Broadband and security services.3 See Discussion and Reconciliation of Non-GAAP Measures in the Investor Briefing.4 The Business Solutions Segment provides both wireless and fixed services to business customers and individual subscribers who purchase wireless services through employer-sponsored plans. Global Business primarily consists of large business customers, including multi-national corporations. National Business primarily consists of small business, government and education accounts. Global Public Sector primarily consists of government and education. Partner Solutions primarily consists of Wholesale.5 Business Mobility includes reseller subscribers, which are not significant.6 Net Add, churn, and ARPU calculations exclude the impact of the shutdown of our U.S. 2G network. Adjustments to beginning subscriber counts as of 1/1/2017 are as follows (in thousands): Total Mobility: 2,298 Total, 85 Postpaid (primarily Business), 66 Prepaid (Consumer), 339 Reseller (Consumer), 1,808 Connected Devices (Business).7 Excludes migrations between AT&T segments and/or subscriber categories and acquisition-related additions during the period.8 Churn is calculated by dividing the aggregate number of wireless subscribers who canceled service during a month by the total number of wireless subscribers at the beginning of that month. The churn rate for the period is equal to the average of the churn rate for each month of that period.9 Total Wired Voice Connections includes switched access lines served by AT&T's incumbent local exchange carriers and affiliates, switched access lines served by AT&T Corp and Voice over Internet Protocol connections. Includes both primary and additional lines. Connections for Entertainment Group include consumer Voice over Internet Protocol connections of 5,222 thousand as of December 31, 2017.10 Linear Video ARPU is defined as Video Entertainment revenues, excluding regional TV sports networks and DIRECTV NOW revenues, during the period divided by average linear video connections during the period. IP Broadband ARPU is defined as High-Speed Internet revenues during the period divided by average IP Broadband connections during the period.11 1Q17 subscriber count includes 413 thousand reduction to true-up reseller customer base. Prior periods not restated.12 Effective 1/1/17, DIRECTV Latin America changed its methodology for counting prepaid video connections to align with other AT&T prepaid business practices. This change increased the total number of DIRECTV Latin America video connections by 1.1 million in 1Q17.13 ARPU is defined as wireless service revenues during the period divided by average wireless subscribers during the period.14 ARPU + EIP is defined as wireless service revenues and billings from equipment installment plans during the period divided by average wireless subscribers during the period.15 Branded smartphones include postpaid and prepaid smartphones. Feature phones are basic phones that are primarily used for voice and text services.16 Corporate and Other includes: (1) operations that are not considered reportable segments and that are no longer integral to our operations or which we no longer actively market, and (2) impacts of corporate-wide decisions for which the individual operating segments are not being evaluated, including interest costs and expected return on plan assets for our pension and postretirement benefit plans.17 DIRECTV NOW connections include 40 thousand trial-period subscribers for 4Q16, 22 thousand for 1Q17, 94 thousand for 2Q17, 67 thousand for 3Q17, and 73 thousand for 4Q17. AT&T has successfully retained many subscribers after the expiration of their trial period.18 Effective 7/1/17, prepaid internet of things (IoT) connections are presented within the prepaid category. These connections primarily relate to customers that actively subscribe for vehicle connectivity. This resulted in 97 thousand additional prepaid net adds in 3Q17 with a corresponding decline in connected device net adds. The 3Q17 prepaid subscriber base was adjusted by 543 thousand connections with a corresponding decline in the connected device subscriber base to reflect subscriber activity prior to 3Q17. Prior periods not restated.
Page 14