Embed Size (px)
Citation preview

Financial and market performance 2Q 2009August 13, 2009
21.5
62.030.2
313.5
259.649.510.9
343.7
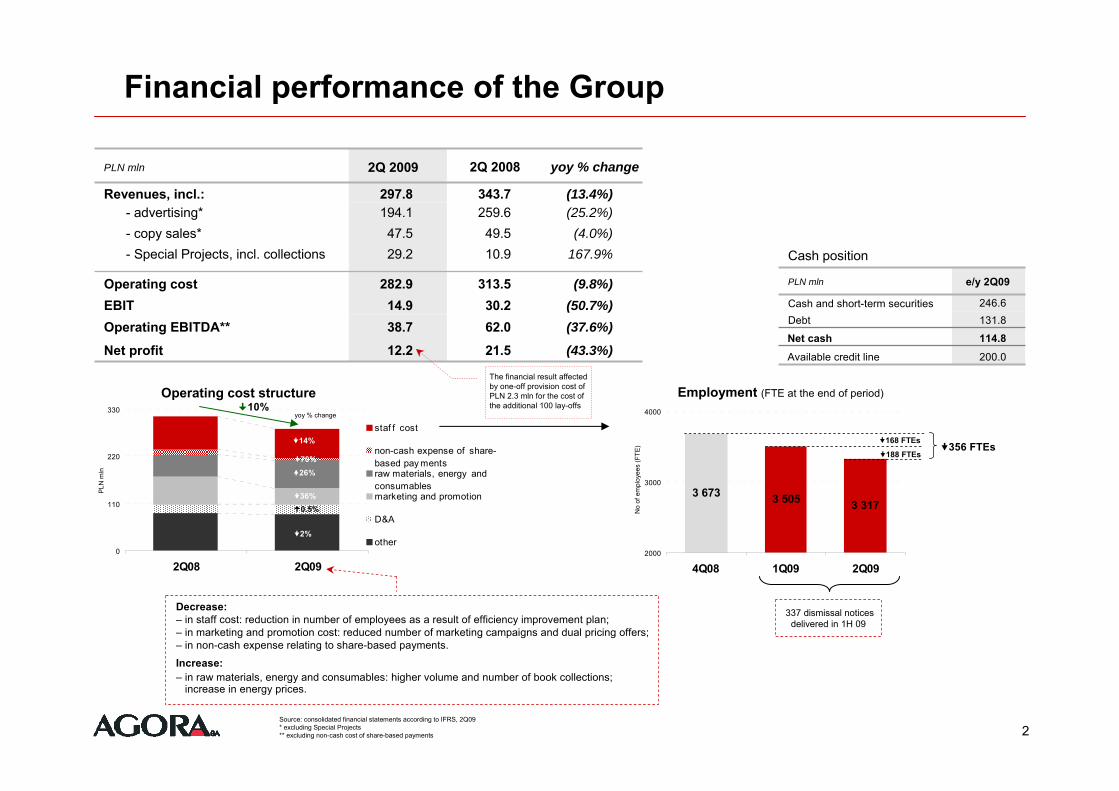
2Q 2008PLN mln 2Q 2009 yoy % change
Revenues, incl.: 297.8 (13.4%)- advertising*- copy sales*- Special Projects, incl. collections
194.147.529.2
(25.2%)(4.0%)
167.9%
Operating cost 282.9 (9.8%)EBIT 14.9 (50.7%)Operating EBITDA** 38.7 (37.6%)
Net profit 12.2 (43.3%)
Financial performance of the Group
Source: consolidated financial statements according to IFRS, 2Q09* excluding Special Projects** excluding non-cash cost of share-based payments 2
114.8Net cash 131.8Debt
200.0Available credit line
PLN mln e/y 2Q09
Cash and short-term securities 246.6
Cash position
0
110
220
330
2Q08 2Q09
staf f cost
non-cash expense of share-based pay mentsraw materials, energy andconsumables marketing and promotion
D&A
other
Operating cost structure
PLN
mln
10%
14%
70%
36%
26%
0.5%
2%
Decrease:– in staff cost: reduction in number of employees as a result of efficiency improvement plan;– in marketing and promotion cost: reduced number of marketing campaigns and dual pricing offers;– in non-cash expense relating to share-based payments.
Increase:– in raw materials, energy and consumables: higher volume and number of book collections;
increase in energy prices.
yoy % change
3 673 3 505 3 317
2000
3000
4000
4Q08 1Q09 2Q09
Employment (FTE at the end of period)
No
of e
mpl
oyee
s (F
TE)
188 FTEs
168 FTEs356 FTEs
337 dismissal noticesdelivered in 1H 09
The financial result affected by one-off provision cost of PLN 2.3 mln for the cost of the additional 100 lay-offs
-40%
-30%
-20%
-10%
0%
10%
20%
30%
40%
1Q08 2Q08 3Q08 4Q08 1Q09 2Q09
Internet* Television Radio
Outdoor** Magazines Dailies
3
Ad market performance
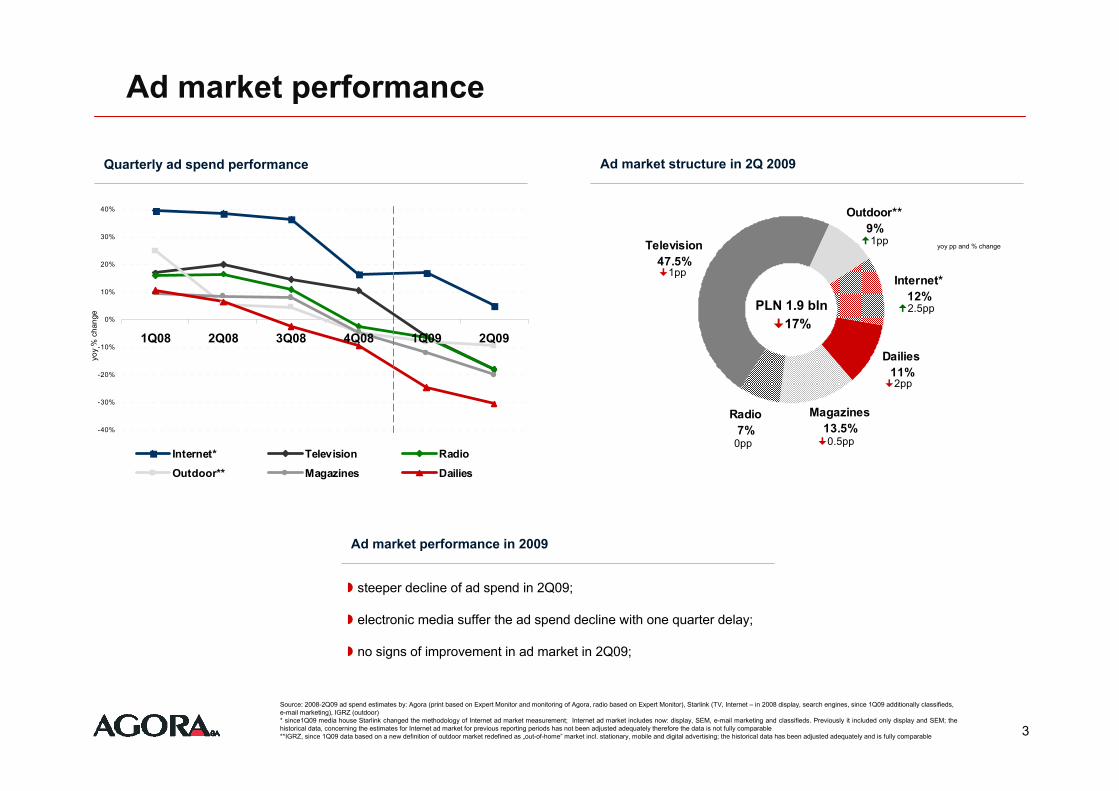
Radio7%
Magazines13.5%
Dailies11%
Internet*12%
Outdoor**9%
Television47.5%
Quarterly ad spend performance
PLN 1.9 bln
yoy
% c
hang
e
17%
0.5pp
1pp
0pp
2.5pp
1pp
2pp
yoy pp and % change
Ad market structure in 2Q 2009
Source: 2008-2Q09 ad spend estimates by: Agora (print based on Expert Monitor and monitoring of Agora, radio based on Expert Monitor), Starlink (TV, Internet – in 2008 display, search engines, since 1Q09 additionally classifieds, e-mail marketing), IGRZ (outdoor)* since1Q09 media house Starlink changed the methodology of Internet ad market measurement; Internet ad market includes now: display, SEM, e-mail marketing and classifieds. Previously it included only display and SEM; the historical data, concerning the estimates for Internet ad market for previous reporting periods has not been adjusted adequately therefore the data is not fully comparable**IGRZ, since 1Q09 data based on a new definition of outdoor market redefined as „out-of-home” market incl. stationary, mobile and digital advertising; the historical data has been adjusted adequately and is fully comparable
steeper decline of ad spend in 2Q09;
electronic media suffer the ad spend decline with one quarter delay;
no signs of improvement in ad market in 2Q09;
Ad market performance in 2009
-70%
-35%
0%
35%
70%
1Q08 2Q08 3Q08 4Q08 1Q09 2Q09
recruitment real-estate automotive announcementsfinancial products retail chains entertainment
4
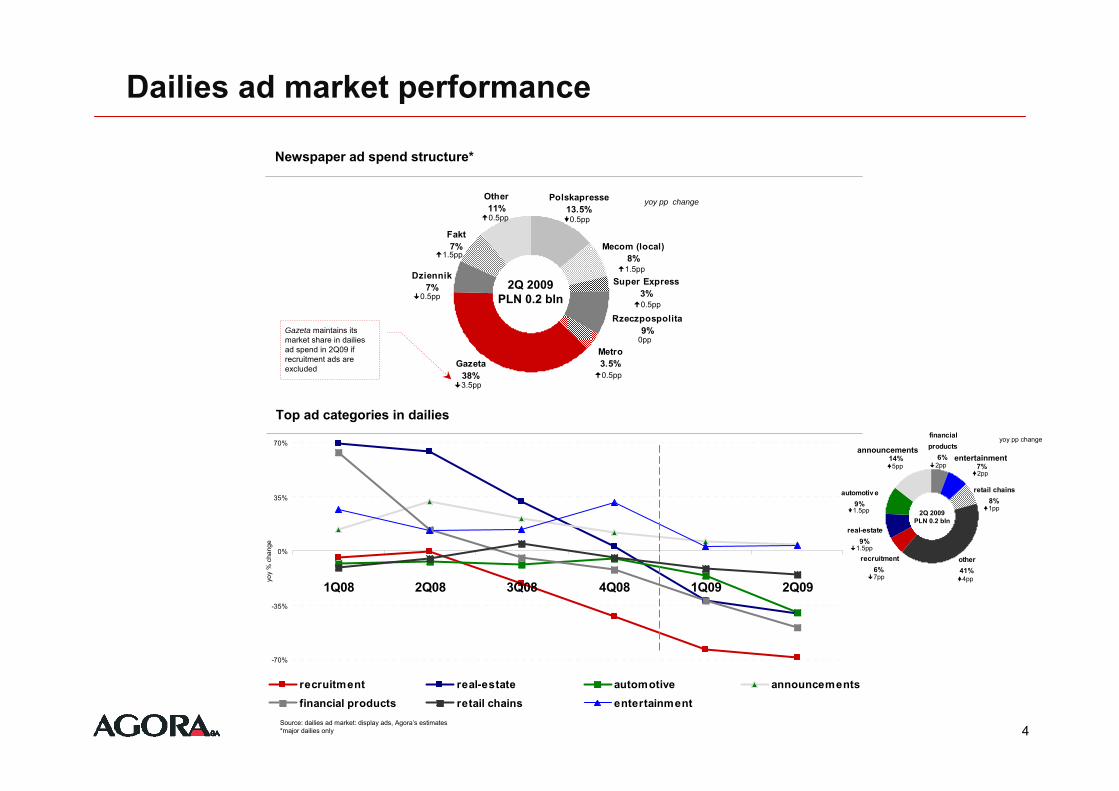
Newspaper ad spend structure*
Mecom (local)8%
Super Express3%
Rzeczpospolita9%
Metro3.5%Gazeta
38%
Dziennik7%
Fakt7%
Other11%
Polskapresse13.5%
2Q 2009PLN 0.2 bln
3.5pp0.5pp
Source: dailies ad market: display ads, Agora’s estimates*major dailies only
Top ad categories in dailies
yoy
% c
hang
e
recruitment6%
real-estate9%
automotiv e9%
14%
financial products
6%7%
retail chains8%
other41%
2Q 2009PLN 0.2 bln
announcements
0pp
0.5pp0.5pp
1.5pp
0.5pp
1.5pp
0.5pp
yoy pp change
Dailies ad market performance
yoy pp change
7pp
1.5pp
1.5pp
5pp
1pp
4pp
2pp
Gazeta maintains its market share in dailies ad spend in 2Q09 if recruitment ads are excluded
entertainment
2pp
Source: financials: consolidated financial statements according to IFRS, 2Q 09; recruitment ads: display ads, Agora, 2Q09 vs 2Q08** excluding allocations of general overhead costs of Agora SA*** excluding non-cash cost of share-based payments and allocations of general overhead cost of Agora SA
38.2
139.5
218.9
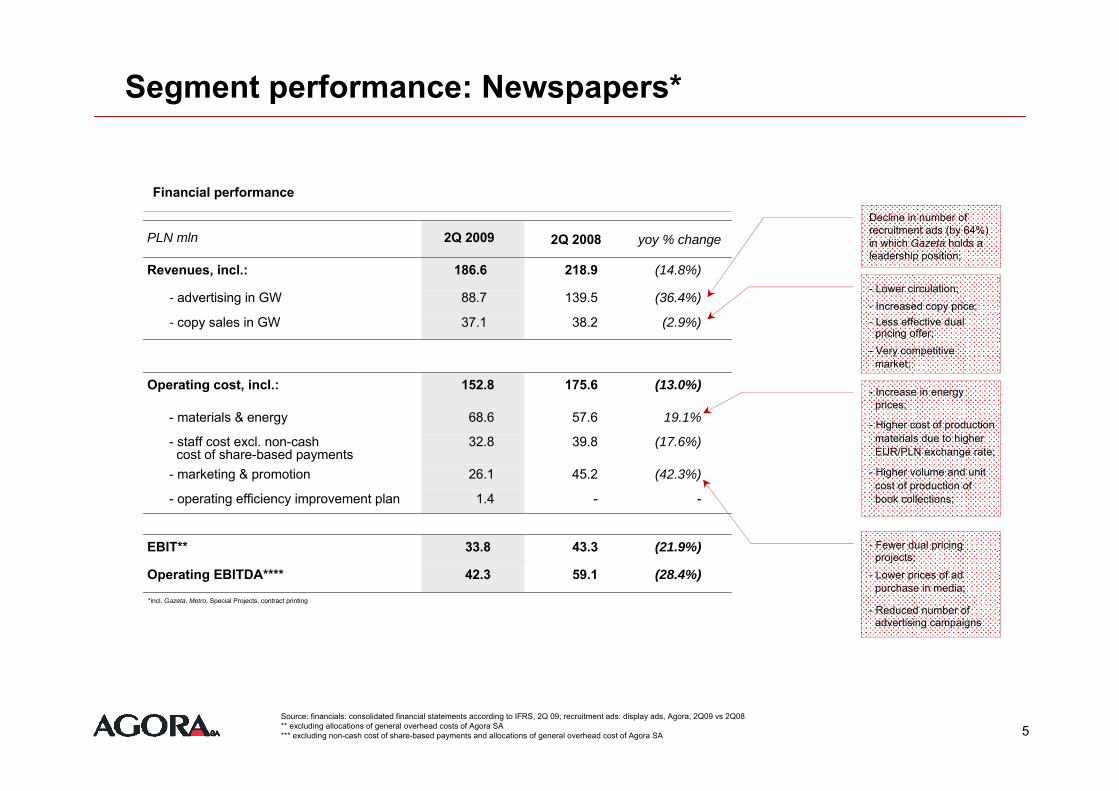
2Q 2008PLN mln 2Q 2009 yoy % change
Revenues, incl.: 186.6 (14.8%)
- advertising in GW 88.7 (36.4%)
- copy sales in GW 37.1 (2.9%)
Financial performance
5
*incl. Gazeta, Metro, Special Projects, contract printing
(42.3%)45.226.1- marketing & promotion
-
39.8
57.6
175.6Operating cost, incl.: 152.8 (13.0%)
- materials & energy 68.6 19.1%
- staff cost excl. non-cash cost of share-based payments
32.8 (17.6%)
- operating efficiency improvement plan 1.4 -
59.1
43.3EBIT** 33.8 (21.9%)
Operating EBITDA**** 42.3 (28.4%)
Decline in number of recruitment ads (by 64%) in which Gazeta holds a leadership position;
- Lower circulation;- Increased copy price;- Less effective dual
pricing offer;- Very competitive
market;
- Increase in energy prices;
- Higher cost of productionmaterials due to higher EUR/PLN exchange rate;
- Higher volume and unit cost of production of book collections;
- Fewer dual pricingprojects;
- Lower prices of ad purchase in media;
- Reduced number of advertising campaigns
Segment performance: Newspapers*
0%
25%
50%
75%
100%
Gazeta Rzeczpospolita Dziennik
Other paid-f or distribution methods Total sales (incl. subscription)
6
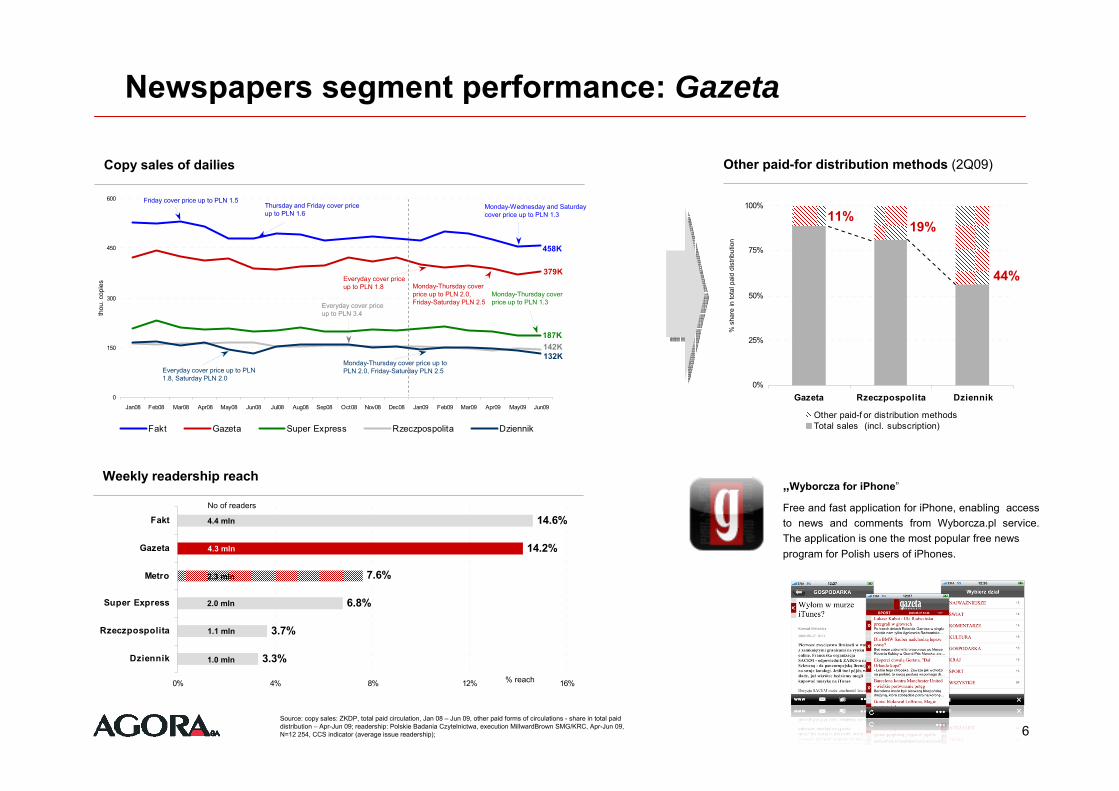
Other paid-for distribution methods (2Q09)Copy sales of dailies
% s
hare
in to
tal p
aid
dist
ribut
ion
Newspapers segment performance: Gazeta
Weekly readership reach
3.3%
3.7%
6.8%
7.6%
14.2%
14.6%
0% 4% 8% 12% 16%
Dziennik
Rzeczpospolita
Super Express
Metro
Gazeta
Fakt
% reach
4.3 mln
2.3 mln
No of readers
4.4 mln
1.1 mln
1.0 mln
2.0 mln
44%
19%11%
Source: copy sales: ZKDP, total paid circulation, Jan 08 – Jun 09, other paid forms of circulations - share in total paid distribution – Apr-Jun 09; readership: Polskie Badania Czytelnictwa, execution MillwardBrown SMG/KRC, Apr-Jun 09, N=12 254, CCS indicator (average issue readership);
„Wyborcza for iPhone”
Free and fast application for iPhone, enabling access to news and comments from Wyborcza.pl service. The application is one the most popular free news program for Polish users of iPhones.
0
150
300
450
600
Jan08 Feb08 Mar08 Apr08 May08 Jun08 Jul08 Aug08 Sep08 Oct08 Nov08 Dec08 Jan09 Feb09 Mar09 Apr09 May09 Jun09
Fakt Gazeta Super Express Rzeczpospolita Dziennik
Everyday cover price up to PLN 1.8, Saturday PLN 2.0
Friday cover price up to PLN 1.5Thursday and Friday cover price up to PLN 1.6
Everyday cover price up to PLN 3.4
Everyday cover price up to PLN 1.8
Monday-Thursday cover price up to PLN 2.0, Friday-Saturday PLN 2.5
thou
. cop
ies
Monday-Thursday cover price up to PLN 2.0, Friday-Saturday PLN 2.5
Monday-Wednesday and Saturdaycover price up to PLN 1.3
187K
379K
458K
142K132K
Monday-Thursday cover price up to PLN 1.3
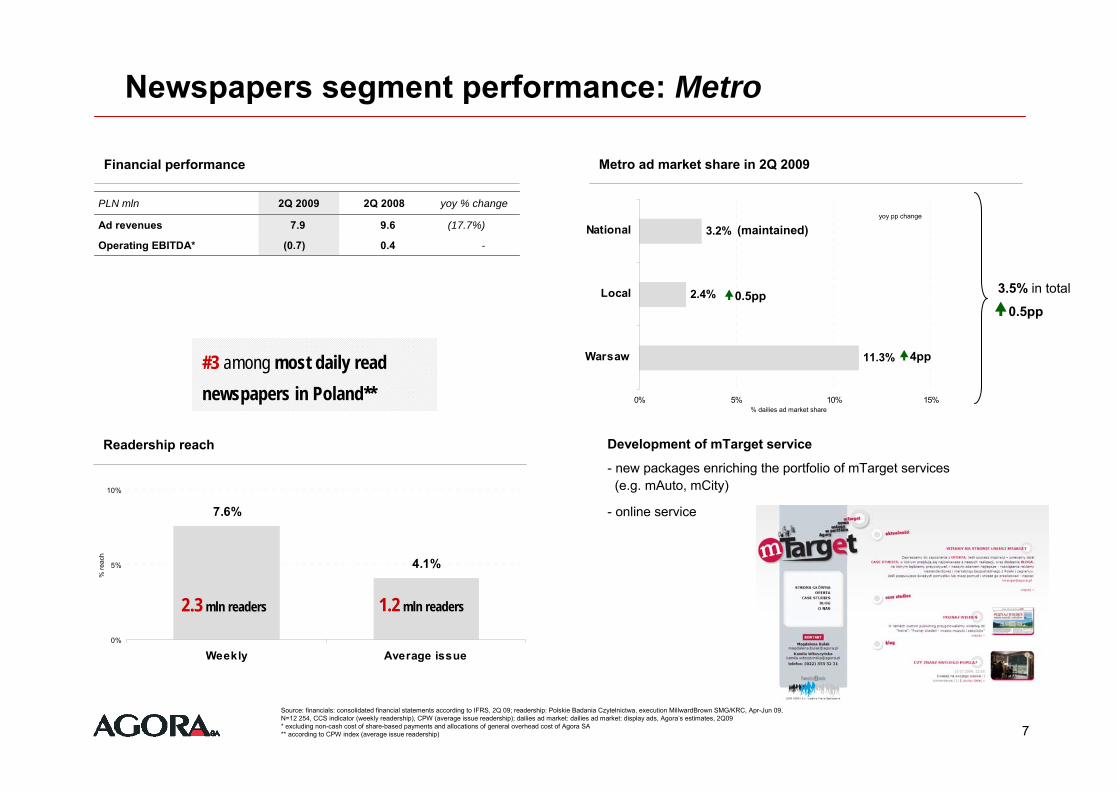
11.3%
2.4%
3.2%
0% 5% 10% 15%
Warsaw
Local
National
4.1%
7.6%
0%
5%
10%
Weekly Average issue
7
0.4
9.6
2Q 2008PLN mln 2Q 2009 yoy % change
Ad revenues 7.9 (17.7%)
Operating EBITDA* (0.7) -
Financial performance Metro ad market share in 2Q 2009
Readership reach
% re
ach
Newspapers segment performance: Metro
2.3 mln readers 1.2 mln readers
#3 among most daily readnewspapers in Poland**
Source: financials: consolidated financial statements according to IFRS, 2Q 09; readership: Polskie Badania Czytelnictwa, execution MillwardBrown SMG/KRC, Apr-Jun 09, N=12 254, CCS indicator (weekly readership), CPW (average issue readership); dailies ad market: dailies ad market: display ads, Agora’s estimates, 2Q09* excluding non-cash cost of share-based payments and allocations of general overhead cost of Agora SA** according to CPW index (average issue readership)
0.5pp
% dailies ad market share
4pp
(maintained)
3.5% in total
0.5pp
Development of mTarget service
- new packages enriching the portfolio of mTarget services(e.g. mAuto, mCity)
- online service
yoy pp change
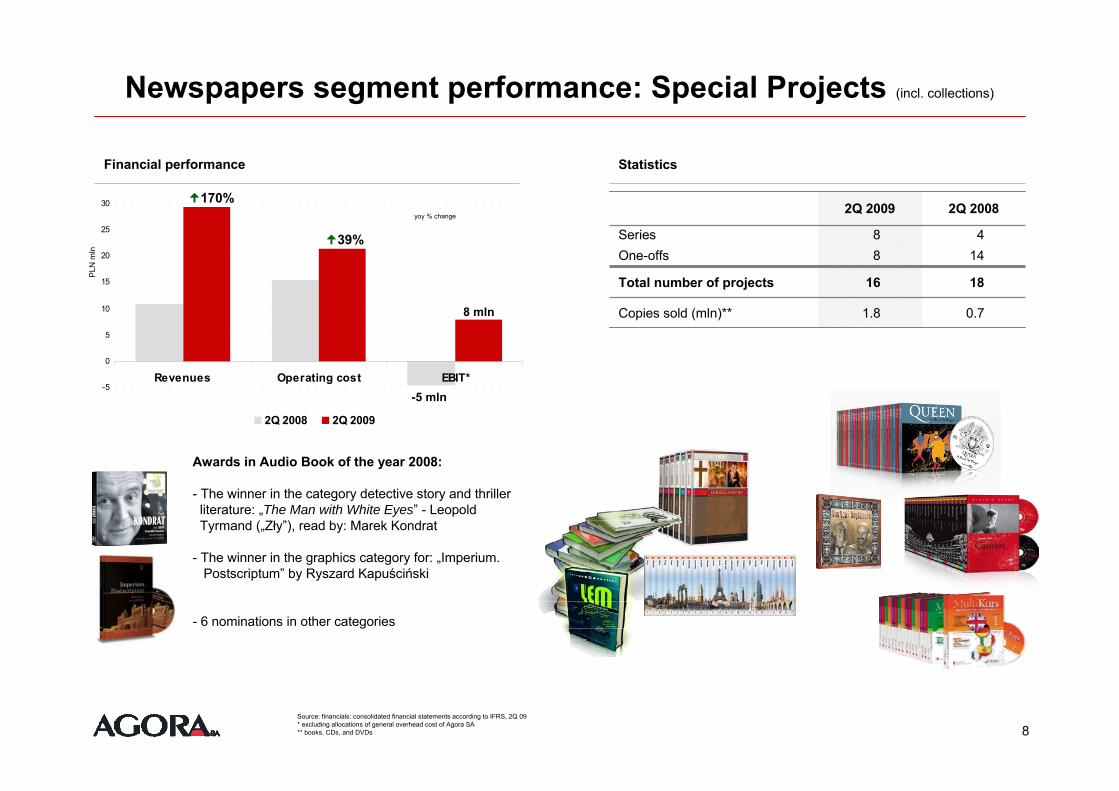
-5
0
5
10
15
20
25
30
Revenues Operating cost EBIT*
2Q 2008 2Q 2009
8
Financial performance
1.8
16
88
2Q 2009 2Q 2008
Series 4One-offs 14
Total number of projects 18
Copies sold (mln)** 0.7
Statistics
Newspapers segment performance: Special Projects (incl. collections)
170%
PLN
mln
yoy % change
Source: financials: consolidated financial statements according to IFRS, 2Q 09 * excluding allocations of general overhead cost of Agora SA** books, CDs, and DVDs
Awards in Audio Book of the year 2008:
- The winner in the category detective story and thrillerliterature: „The Man with White Eyes” - Leopold Tyrmand („Zły”), read by: Marek Kondrat
- The winner in the graphics category for: „Imperium. Postscriptum” by Ryszard Kapuściński
- 6 nominations in other categories
-5 mln
8 mln
39%
20%
40%
60%
80%
Jan0
6
Mar
06
May
06
Jul0
6
Sep0
6
Nov0
6
Jan0
7
Mar
07
May
07
Jul0
7
Sep0
7
Nov0
7
Jan0
8
Mar
08
May
08
Jul0
8
Sep0
8
Nov0
8
Jan0
9
Mar
09
May
09
9
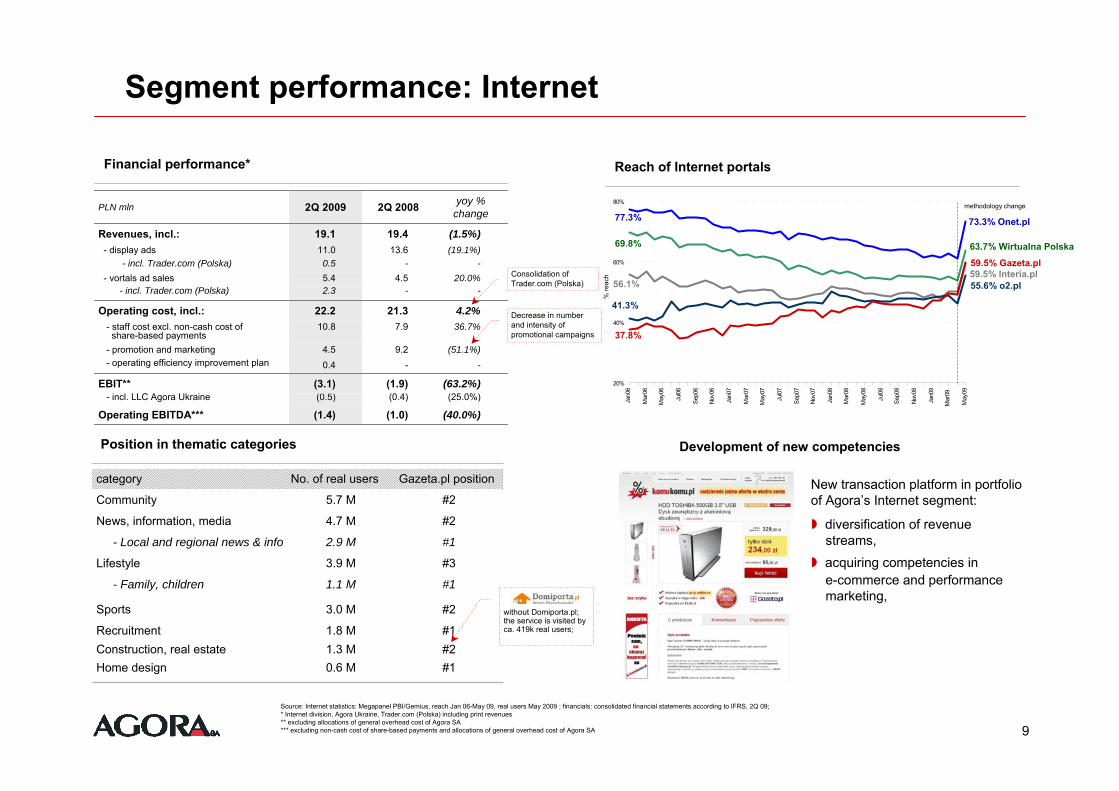
Reach of Internet portals
% re
ach
77.3%
69.8%
56.1%
41.3%
37.8%
Financial performance*
Segment performance: Internet
(25.0%)(0.4)(0.5)- incl. LLC Agora Ukraine
--0.5- incl. Trader.com (Polska) (19.1%)13.611.0- display ads
(1.0)
(1.9)
9.2-
7.921.3
-4.5
19.4
2Q 2008PLN mln 2Q 2009 yoy % change
Revenues, incl.: 19.1 (1.5%)
- vortals ad sales 5.4 20.0%- incl. Trader.com (Polska) 2.3 -
Operating cost, incl.: 22.2 4.2%- staff cost excl. non-cash cost of
share-based payments10.8 36.7%
- promotion and marketing- operating efficiency improvement plan
4.50.4
(51.1%)
-
EBIT** (3.1) (63.2%)
Operating EBITDA*** (1.4) (40.0%)
Consolidation of Trader.com (Polska)
73.3% Onet.pl
63.7% Wirtualna Polska
59.5% Interia.pl55.6% o2.pl
59.5% Gazeta.pl
methodology change
Position in thematic categories
Decrease in number and intensity of promotional campaigns
0.6 M1.3 M1.8 M
3.0 M
1.1 M
3.9 M
2.9 M
4.7 M
5.7 M
No. of real users
#1 Recruitment
#2News, information, media
#1- Family, children
#2Community
#2Construction, real estate#1Home design
#2Sports
#3Lifestyle
#1- Local and regional news & info
Gazeta.pl positioncategory
Source: Internet statistics: Megapanel PBI/Gemius, reach Jan 06-May 09, real users May 2009 ; financials: consolidated financial statements according to IFRS, 2Q 09; * Internet division, Agora Ukraine, Trader.com (Polska) including print revenues** excluding allocations of general overhead cost of Agora SA*** excluding non-cash cost of share-based payments and allocations of general overhead cost of Agora SA
New transaction platform in portfolio of Agora’s Internet segment:
diversification of revenue streams,acquiring competencies in e-commerce and performancemarketing,
Development of new competencies
without Domiporta.pl; the service is visited by ca. 419k real users;

10
12.4
7.1
1.34.6
5.318.112.846.4
52.953.5
2Q 2008PLN mln 2Q 2009 yoy % change
Revenues, incl.: 48.0 (10.3%)- ad revenues 47.0 (11.2%)
Operating cost, incl.: 46.1 (0.7%)- execution of campaigns 9.2 (27.8%)- maintenance cost 20.0 10.9%- staff cost excl. non-cash
cost of share-based payments4.8 (10.2%)
- D&A 6.0 31.0%- promotion & marketing 0.8 (40.9%)
EBIT 1.9 (73.5%)
Operating EBITDA* 8.0 (35.1%)
AMS ad market share**
Source: financials: consolidated financial statements according to IFRS, 2Q 09; * excluding non-cash cost of share-based payments** IGRZ, 2Q 09, data based on a new definition of outdoor market redefined as „out-of-home” market incl. stationary, mobile and digital advertising; excluding cross-promotion of Agora’s other media on AMS panels if such promotion was executed without prior reservation*** Expert Monitor, 2Q 09, rate card data, including cross-promotion of Agora’s other media on AMS panels if such promotion was executed without prior reservation
yoy pp change
Financial performance
AMS26%0.6pp
2Q 2009outdoor
ad spend10%
Segment performance: Outdoor
Competition in outdoor market (rate card data)***
News Outdoor
12%
Cityboard15%
Stroer19%
AMS30%
Other14%
CPP10%
2Q 2009
Large partnership agreements with Neste PolskaSp. z o.o. and Inter IKEA Centre Polska SA in 2Q09
- Using the areas of IKEA shopping malls for investment into new panels and their management
- Using the areas of self-service petrol stations to build a net of billboard panels 18 square metre and backlights
Playboy21% CKM
32%
Logo23%
Men's Health24%
11
Edipresse6.9%
Axel Springer2.9%
Media Point Group3.8%
Gruner+Jahr12.7%
Bauer14.1%
Other14.7% Murator
7.8%
Burda Media Polska 10.6%
Marquard13.6%
Agora12.9%
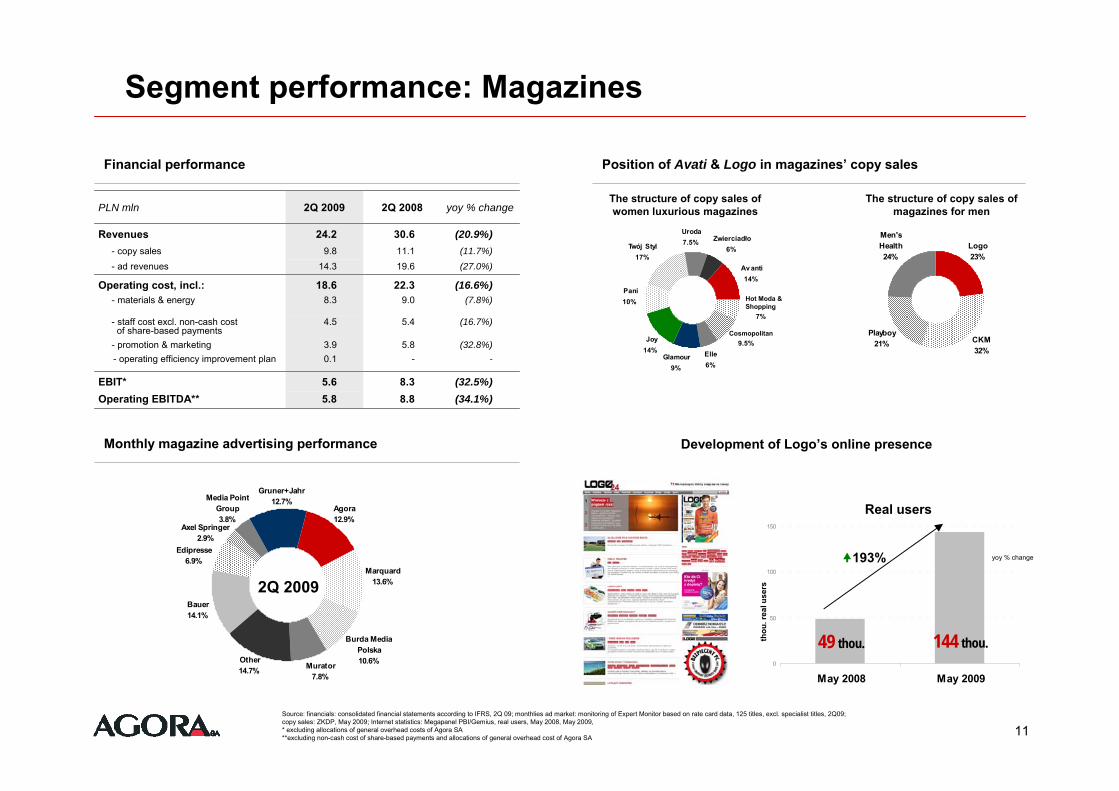
Monthly magazine advertising performance
2Q 2009
(16.7%)5.44.5- staff cost excl. non-cash cost of share-based payments
8.88.3
-5.8
9.022.3
19.611.1
30.6
2Q 2008PLN mln 2Q 2009 yoy % change
Revenues 24.2 (20.9%)- copy sales 9.8 (11.7%)- ad revenues 14.3 (27.0%)
Operating cost, incl.: 18.6 (16.6%)- materials & energy 8.3 (7.8%)
- promotion & marketing 3.9 (32.8%)- operating efficiency improvement plan 0.1 -
EBIT* 5.6 (32.5%)Operating EBITDA** 5.8 (34.1%)
Financial performance
Segment performance: Magazines
Joy14%
Pani10%
Twój Styl17%
Zwierciadło6%
Uroda7.5%
Av anti14%
Glamour9%
Elle6%
9.5%
7%
Position of Avati & Logo in magazines’ copy sales
Hot Moda & Shopping
The structure of copy sales of women luxurious magazines
The structure of copy sales of magazines for men
0
50
100
150
May 2008 May 2009
193%
144 thou.
Real users
yoy % change
49 thou.
Source: financials: consolidated financial statements according to IFRS, 2Q 09; monthlies ad market: monitoring of Expert Monitor based on rate card data, 125 titles, excl. specialist titles, 2Q09; copy sales: ZKDP, May 2009; Internet statistics: Megapanel PBI/Gemius, real users, May 2008, May 2009,* excluding allocations of general overhead costs of Agora SA **excluding non-cash cost of share-based payments and allocations of general overhead cost of Agora SA
thou
. rea
l use
rs
Development of Logo’s online presence
Cosmopolitan
12
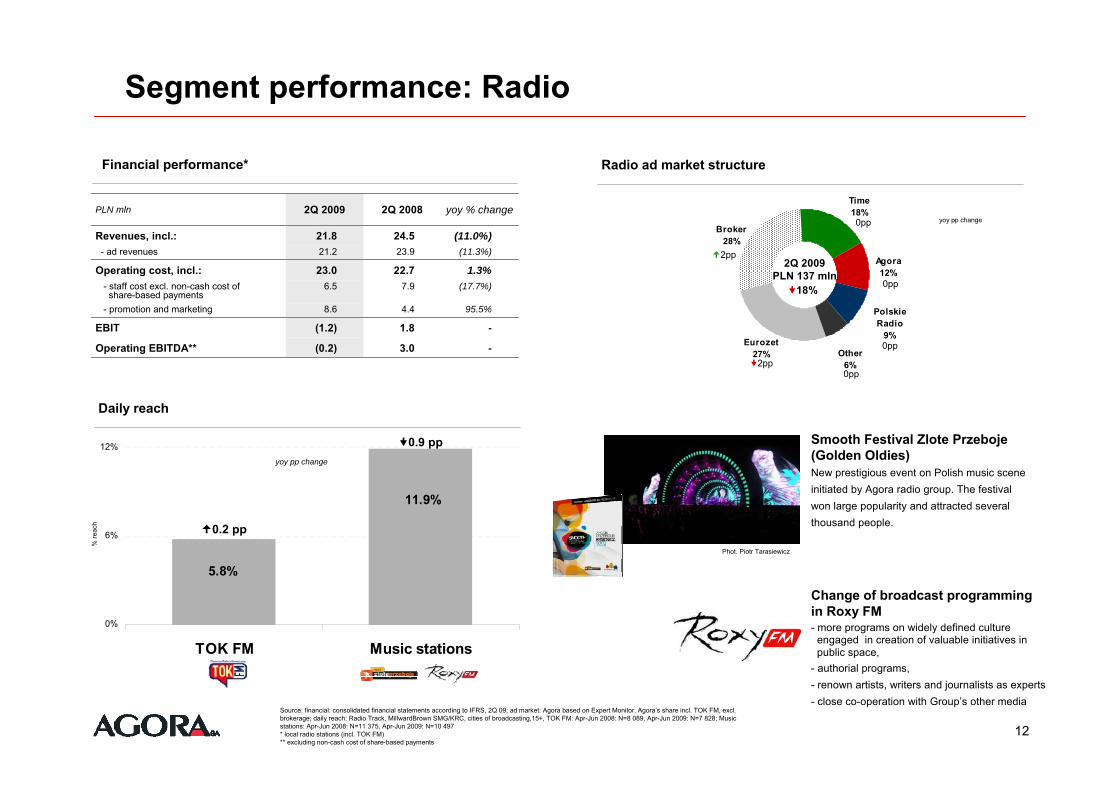
Radio ad market structure Financial performance*
Segment performance: Radio
Smooth Festival Zlote Przeboje(Golden Oldies)New prestigious event on Polish music scene initiated by Agora radio group. The festival won large popularity and attracted several thousand people.
Phot. Piotr Tarasiewicz
Change of broadcast programming in Roxy FM- more programs on widely defined culture
engaged in creation of valuable initiatives in public space,
- authorial programs,- renown artists, writers and journalists as experts- close co-operation with Group’s other media
Source: financial: consolidated financial statements according to IFRS, 2Q 09; ad market: Agora based on Expert Monitor, Agora’s share incl. TOK FM, excl. brokerage; daily reach: Radio Track, MillwardBrown SMG/KRC, cities of broadcasting,15+, TOK FM: Apr-Jun 2008: N=8 089, Apr-Jun 2009: N=7 828; Music stations: Apr-Jun 2008: N=11 375, Apr-Jun 2009: N=10 497* local radio stations (incl. TOK FM) ** excluding non-cash cost of share-based payments
11.9%
5.8%
0%
6%
12%
TOK FM Music stations
% re
ach 0.2 pp
0.9 ppyoy pp change
Daily reach
Other6%
Polskie Radio
9%
Agora12%
Time18%
Eurozet27%
Broker28%2pp
2Q 2009PLN 137 mln
18%
yoy pp change
0pp
0pp2pp
0pp
0pp
3.0
1.8
4.4
7.922.7
23.924.5
2Q 2008PLN mln 2Q 2009 yoy % change
Revenues, incl.: 21.8 (11.0%)- ad revenues 21.2 (11.3%)
Operating cost, incl.: 23.0 1.3%- staff cost excl. non-cash cost of
share-based payments6.5 (17.7%)
- promotion and marketing 8.6 95.5%
EBIT (1.2) -
Operating EBITDA** (0.2) -
13
Execution of our main goals:
Operating efficiency improvement plan;
Development and restructuring of existing business areas;
Taking advantage of current market conditions to enrich portfolio of Group’s assets if available.
Summary: our objectives

14
Appendix: Changes in reporting of Group’s operating segments
- Gazeta- Metro- Collections - Print- Internet (incl. Trader.com
(Polska)* and LLC Agora Ukraine)
- Corporate Sales - Management Board
cost and the overheadcost of support divisions
Newspapers Newspapers and Internetand Internet
- magazines- Agora Press Ltd
(Company in Ukraine)
MagazinesMagazines
- AMS Group
OutdoorOutdoor
- local stations (excl. superregional TOK FM)
RadioRadio
* incl. publishing activities of Trader.com (Polska) Sp. z o.o. since June 30, 2008
- Gazeta- Metro- Special Projects
(incl. collections)
NewspapersNewspapers
- magazines - Agora Press Ltd
(Company in Ukraine)
MagazinesMagazines
- AMS Group
OutdoorOutdoor
- Internet (incl. Trader.com (Polska)* and LLC Agora Ukraine)
InternetInternet
- local stations - superregionalTOK FM
RadioRadio
- Headquarters andNew Business Development
- Corporate Sales - Management Board and
Support Divisions overhead cost of Agora SA
- Matching adjustments andintercompany eliminations
Matching Matching positionspositions
OLD
NEW
- +no changes no changes
Headquarters andHeadquarters andNew Business New Business DevelopmentDevelopment
Internet segment separated
Corporate Sales, Management Board and Support Divisions overhead costof Agora SA presented in matching positions
Change of name from Collections to Special Projects
-Superregional TOK FM added
15
This presentation has been prepared by Agora SA (the "Company"). The data and information contained on the individual slides do not show a complete or coherent financial analysis, nor present the commercial offer of the Company and serve for information purposes only. A detailed description of the business and financial affairs of Agora SA is presented on www.agora.pl website. All data therein are based on sources which the Companyregards as credible. The Company reserves the right to amend data and information at any time, without prior notice. This presentation was not verified by an independent auditor. This presentation may contain slides containing statements related to the future. Such statements cannot be interpreted as forecasts or other assurances in respect of future Company's financial results. The expectations of the Company's management are based on their knowledge, experience and individual views and are dependent on many factors which may cause that the actual results may differ from statements contained in this document. The Company recommends that professional investment advice is sought in case any investment in the Company's securities is considered.