Embed Size (px)
Citation preview
THE JOURNAL OF FINANCE • VOL. LX, NO. 1 • FEBRUARY 2005
Financial and Legal Constraints to Growth:Does Firm Size Matter?
THORSTEN BECK, ASLI DEMIRGUC-KUNT,and VOJISLAV MAKSIMOVIC∗
ABSTRACT
Using a unique firm-level survey database covering 54 countries, we investigate theeffect of financial, legal, and corruption problems on firms’ growth rates. Whetherthese factors constrain growth depends on firm size. It is consistently the smallestfirms that are most constrained. Financial and institutional development weakensthe constraining effects of financial, legal, and corruption obstacles and it is againthe small firms that benefit the most. There is only a weak relation between firms’perception of the quality of the courts in their country and firm growth. We also provideevidence that the corruption of bank officials constrains firm growth.
CORPORATE FINANCE THEORY SUGGESTS that market imperfections, such as thosecaused by underdeveloped financial and legal systems, constrain firms’ abilityto fund investment projects. Using firm-level data, Demirguc-Kunt and Maksi-movic (1998) show that firms in countries with developed financial institutionsand efficient legal systems obtain more external financing than firms in coun-tries with less-developed institutions. Although these findings show a strongeffect of financial institutions and the legal system on firm growth, their con-clusions are based on a sample of the largest firms in each of the economiesthey study. Their study relies on inferring firms’ demand for external financingfrom a financial model of the firm.
In this paper, we use a size-stratified survey of over 4,000 firms in 54 coun-tries to assess (1) whether financial, legal, and corruption obstacles affect firms’growth; (2) whether this effect varies across firms of different sizes; (3) whethersmall, medium-sized, and large firms are constrained differently in countrieswith different levels of financial and institutional development; (4) the spe-cific characteristics of the legal system that facilitate firm growth; and (5) theimportance of corruption in financial intermediaries to firm growth.
∗Beck and Demirguc-Kunt are at the World Bank. Maksimovic is at the Robert H. Smith Schoolof Business at the University of Maryland. This paper’s findings, interpretations, and conclusionsare entirely those of the authors and do not necessarily represent the views of the World Bank, itsexecutive directors, or the countries they represent. We would like to thank Jerry Caprio, GeorgeClarke, Simeon Djankov, Jack Glen, Richard Green, the editor, Luc Laeven, Florencio Lopez-de-Silanez, Inessa Love, Maria Soledad Martinez Peria, Raghuram Rajan, and seminar participantsat the World Bank, American University, Case Western Reserve, Georgetown University, OxfordUniversity, the University of Minnesota and Yale University, and an anonymous referee for helpfulcomments.
137
138 The Journal of Finance
There is considerable evidence that firm size is related to a firm’s productiv-ity, survival, and profitability. As a result, understanding how financial, legal,and corruption obstacles affect firms of different sizes has policy implications.Significant resources are channeled into the promotion of small and medium-sized enterprises (SMEs). The World Bank alone has approved more than$10 billion in SME support programs in the past 5 years, $1.5 billion of itin the last year alone (World Bank Group Review of Small Business Activities(2002)).
A priori, it is not clear whether weak financial and legal institutions creategreater obstacles to the growth of large or small firms. Large firms internal-ize many of the capital allocation functions carried out by financial marketsand financial intermediaries. Thus, the development of financial markets andinstitutions should disproportionately benefit small firms. On the other hand,large firms are most likely to tax the resources of an underdeveloped financialor legal system, since they are more likely than small firms to depend on long-term financing and on larger loans. It is possible that financial developmentcan disproportionately reduce the effect of institutional obstacles on the largestfirms.
Our paper provides evidence relevant to reforming legal systems in develop-ing countries. Although recent studies in international corporate finance pre-dict a positive relation between the quality of the legal system and access toexternal financing, we actually know very little about how firms’ perceptionsconform to the conventional notions of what makes a legal system efficient(such as the impartiality of courts and whether court decisions are enforced).Moreover, we do not know whether these conventional notions help predict theeffect of the legal system on firm growth. In this paper, we address both of theseissues.
Our paper also provides evidence about the potential costs of monitoringby financial intermediaries. Several influential theoretical models and publicpolicy prescriptions rely on monitoring by financial intermediaries to reducemisallocation of investment in economies with underdeveloped financial mar-kets. Although the reduction of agency costs caused by firms’ insiders is a majormotivation for this monitoring, the models on which the policies are based typ-ically do not consider the possibility of agency costs within banks. We examineevidence indicating that corrupt officials in financial intermediaries retard theefficient allocation of capital to smaller firms by relating firms’ reports of bankcorruption to the firms’ growth rates.
Our paper builds on earlier studies, starting with La Porta et al. (1998),who argue that differences in legal and financial systems can explain muchof the variation across countries in firms’ financial policies and performance.Recent empirical evidence supports the view that the development of a country’sfinancial system affects firm growth and financing. In addition to Demirguc-Kunt and Maksimovic’s (1998) firm-level results, Rajan and Zingales (1998a)show that industries that are dependent on external finance grow faster incountries with better developed financial systems.1 Wurgler (2000) shows that
1 In addition, Carlin and Mayer (2003) also argue that there exists a relation between a country’sfinancial system and the characteristics of industries that prosper in the country. Demirguc-Kunt
Financial and Legal Constraints to Growth 139
the rate at which resources are allocated to productive industries depends onthe development of the financial system. Love (2003) shows that the sensitivityof investment to cash flow depends negatively on financial development. 2
The richness of the survey’s database allows us to go beyond earlier papersthat infer the presence of institutional failures from past growth performance.3
The firms that were surveyed reported whether specific features of the finan-cial and legal systems in their countries and the corruption they faced wereobstacles to their growth. Thus, we are able to analyze how firms in differentfinancial and legal systems perceive obstacles to growth, and whether in factthere is a relation between these perceptions and firm growth. Our paper dif-fers from earlier work in that we also examine the effect of corruption on firmgrowth.4
Second, the literature has less to say about how the state of a country’s fi-nancial and legal institutions affects firms of different sizes.5 We know that indeveloping economies, there are advantages in belonging to a business group(see Khanna and Palepu’s (2000) study of India and Rajan and Zingales’ (1998b)review of evidence on Asian capitalism). This finding contrasts with the pre-vailing view in the United States that the ability to escape market monitoringby recourse to internal capital markets makes large diversified firms inefficient(Scharfstein and Stein (2000), Rajan, Servaes, and Zingales (2000)).6 However,studies of business groups in the emerging economies are limited to firms thatchoose to belong to such groups, and the extent to which these results general-ize to other firms and to other institutional settings is unclear. Cross-countrystudies of financing choices have found different financing patterns for smalland large firms, in the use of long-term financing and trade credit (Demirguc-Kunt and Maksimovic (1999, 2001)). However, these studies rely on commer-cial databases of listed firms, so that even the “small” firms are relativelylarge.
The paper is organized as follows. Section I presents the data and summarystatistics. Section II presents our main results. Section III presents conclusionsand policy implications.
and Maksimovic (1999) show that the origin and efficiency of a legal system facilitates firms’ ac-cess to external finance, particularly long-term finance. At the country level, King and Levine(1993), Levine and Zervos (1998), and Beck, Levine, and Loayza (2000) show that financial de-velopment promotes growth and that differences in legal origins explain differences in financialdevelopment.
2 Rajan and Zingales (1998a) use the external financing by U.S. firms as a benchmark, underthe assumption that firms in the same industries in other countries depend on similar amounts ofexternal financing. Demirguc-Kunt and Maksimovic (1998) rely on a financial planning model toidentify firms that have access to long-term external financing.
3 Exceptions are Schiffer and Weder (2001) who investigate different obstacles using WBES dataand Clarke, Cull, and Peria (2003) who assess the impact of foreign bank entry on these obstacles.
4 Empirical evidence based on cross-country comparisons does suggest that corruption has amajor adverse effect on private investment and economic growth (Mauro (1996)). We look at whethercorruption also has a significant impact in constraining firm growth.
5 Except to study determinants of firm size by looking at the largest firms around the world (seeBeck, Demirguc-Kunt, and Maksimovic (2001b)).
6 For evidence that large diversified firms in the U.S. economy do allocate resources efficiently,see Maksimovic and Phillips (2002).
140 The Journal of Finance
I. Data and Summary Statistics
Our data set consists of firm survey responses from over 4,000 firms in54 countries.7 The main purpose of the survey is to identify obstacles to firmperformance and growth around the world. Thus, the survey includes manyquestions on the nature of financing and legal obstacles to growth, as well asquestions on corruption issues. General information on firms is more limited,but the survey includes data on numbers of employees, sales, industry, growth,and number of competitors. The survey also gives information on ownership,whether the firm is an exporter, and if it has been receiving subsidies fromnational or local authorities.
In addition to the detail on the obstacles, one of the greatest values of thissurvey is its wide coverage of SMEs. The survey covers three groups of firms. Itdefines small firms as those with 5–50 employees. Medium-sized firms are thosethat employ 51–500 employees, and large firms are those that employ morethan 500 employees. Forty percent of our observations are from small firms,another 40% are from medium firms, and the remaining 20% are from largefirms. Table AI in the Appendix reports the number of firms for each countryin the sample. For each of the countries, we also use data on GDP per capita,GDP in U.S. dollars, growth rate of GDP, and inflation. We also use informationon financial system development, legal development, and corruption. Country-level variables are 1995–1999 averages. To compile these averages, we followBeck, Demirguc-Kunt, and Levine (2000).
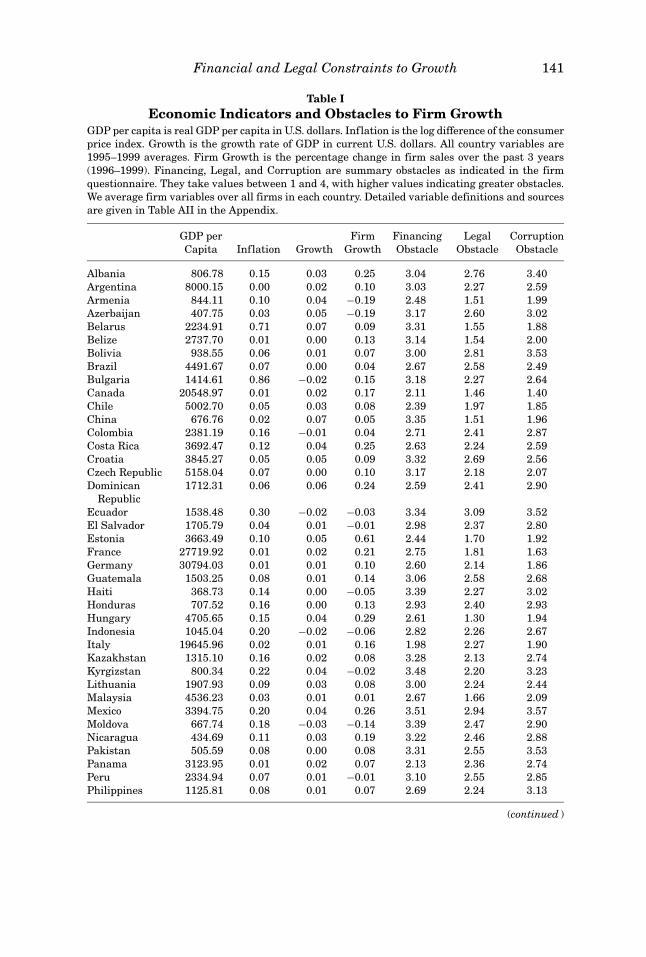
In Table I we summarize relevant facts about the level of economic develop-ment, firm growth, and firm-level obstacles in the sample countries. We providedetails on our sources in Table AII in the Appendix. The countries in the sam-ple show considerable variation in per-capita income. They range from Haiti,with an average GDP per capita of $369, to the United States and Germany,with per-capita incomes of around $30,000. We also provide the average annualgrowth rate of per-capita GDP as a control variable. If investment opportunitiesin an economy are correlated, there should be a relation between the growthrate of individual firms and the growth rate of the economy. The average infla-tion rate also provides an important control, since it is an indicator of whetherlocal currency provides a stable measure of value in contracts between firms.The countries also vary significantly in their rates of inflation, from a low of0% in Sweden and Argentina to 86% in Bulgaria.
In Table I, the column titled Firm Growth reports firm growth rates, whichare sales growth rates for individual firms averaged over all sampled firms ineach country. Firm growth rates also show a wide dispersion, from negativerates of −19% for Armenia and Azerbaijan to a positive 34% for Poland.
Table I also shows firm-level financing, legal, and corruption obstacles re-ported by firms averaged over all firms in each country. The World BusinessEnvironment Survey (WBES) asked enterprise managers to rate the extent to
7 The WBES covers 80 economies. However, the sample is reduced because most firm-level orcountry-level variables are missing for 26 countries.
Financial and Legal Constraints to Growth 141
Table IEconomic Indicators and Obstacles to Firm Growth
GDP per capita is real GDP per capita in U.S. dollars. Inflation is the log difference of the consumerprice index. Growth is the growth rate of GDP in current U.S. dollars. All country variables are1995–1999 averages. Firm Growth is the percentage change in firm sales over the past 3 years(1996–1999). Financing, Legal, and Corruption are summary obstacles as indicated in the firmquestionnaire. They take values between 1 and 4, with higher values indicating greater obstacles.We average firm variables over all firms in each country. Detailed variable definitions and sourcesare given in Table AII in the Appendix.
GDP per Firm Financing Legal CorruptionCapita Inflation Growth Growth Obstacle Obstacle Obstacle
Albania 806.78 0.15 0.03 0.25 3.04 2.76 3.40Argentina 8000.15 0.00 0.02 0.10 3.03 2.27 2.59Armenia 844.11 0.10 0.04 −0.19 2.48 1.51 1.99Azerbaijan 407.75 0.03 0.05 −0.19 3.17 2.60 3.02Belarus 2234.91 0.71 0.07 0.09 3.31 1.55 1.88Belize 2737.70 0.01 0.00 0.13 3.14 1.54 2.00Bolivia 938.55 0.06 0.01 0.07 3.00 2.81 3.53Brazil 4491.67 0.07 0.00 0.04 2.67 2.58 2.49Bulgaria 1414.61 0.86 −0.02 0.15 3.18 2.27 2.64Canada 20548.97 0.01 0.02 0.17 2.11 1.46 1.40Chile 5002.70 0.05 0.03 0.08 2.39 1.97 1.85China 676.76 0.02 0.07 0.05 3.35 1.51 1.96Colombia 2381.19 0.16 −0.01 0.04 2.71 2.41 2.87Costa Rica 3692.47 0.12 0.04 0.25 2.63 2.24 2.59Croatia 3845.27 0.05 0.05 0.09 3.32 2.69 2.56Czech Republic 5158.04 0.07 0.00 0.10 3.17 2.18 2.07Dominican 1712.31 0.06 0.06 0.24 2.59 2.41 2.90
RepublicEcuador 1538.48 0.30 −0.02 −0.03 3.34 3.09 3.52El Salvador 1705.79 0.04 0.01 −0.01 2.98 2.37 2.80Estonia 3663.49 0.10 0.05 0.61 2.44 1.70 1.92France 27719.92 0.01 0.02 0.21 2.75 1.81 1.63Germany 30794.03 0.01 0.01 0.10 2.60 2.14 1.86Guatemala 1503.25 0.08 0.01 0.14 3.06 2.58 2.68Haiti 368.73 0.14 0.00 −0.05 3.39 2.27 3.02Honduras 707.52 0.16 0.00 0.13 2.93 2.40 2.93Hungary 4705.65 0.15 0.04 0.29 2.61 1.30 1.94Indonesia 1045.04 0.20 −0.02 −0.06 2.82 2.26 2.67Italy 19645.96 0.02 0.01 0.16 1.98 2.27 1.90Kazakhstan 1315.10 0.16 0.02 0.08 3.28 2.13 2.74Kyrgizstan 800.34 0.22 0.04 −0.02 3.48 2.20 3.23Lithuania 1907.93 0.09 0.03 0.08 3.00 2.24 2.44Malaysia 4536.23 0.03 0.01 0.01 2.67 1.66 2.09Mexico 3394.75 0.20 0.04 0.26 3.51 2.94 3.57Moldova 667.74 0.18 −0.03 −0.14 3.39 2.47 2.90Nicaragua 434.69 0.11 0.03 0.19 3.22 2.46 2.88Pakistan 505.59 0.08 0.00 0.08 3.31 2.55 3.53Panama 3123.95 0.01 0.02 0.07 2.13 2.36 2.74Peru 2334.94 0.07 0.01 −0.01 3.10 2.55 2.85Philippines 1125.81 0.08 0.01 0.07 2.69 2.24 3.13
(continued )
142 The Journal of Finance
Table I—Continued
GDP per Firm Financing Legal CorruptionCapita Inflation Growth Growth Obstacle Obstacle Obstacle
Poland 3216.04 0.13 0.05 0.34 2.48 2.32 2.28Portugal 11582.33 0.03 0.03 0.12 1.82 1.86 1.77Romania 1372.02 0.53 −0.02 0.07 3.28 2.60 2.88Russia 2223.57 0.35 0.00 0.28 3.21 2.18 2.62Singapore 24948.09 0.01 0.02 0.11 1.96 1.33 1.29Slovakia 3805.41 0.07 0.04 0.11 3.38 2.08 2.44Slovenia 10232.73 0.08 0.04 0.29 2.30 2.29 1.64Spain 15858.03 0.02 0.03 0.26 2.22 1.97 2.08Sweden 28258.28 0.00 0.02 0.23 1.85 1.49 1.19Trinidad 4526.28 0.04 0.04 0.20 2.93 1.44 1.66
& TobagoTurkey 2993.89 0.58 0.01 0.10 3.11 2.28 2.86Ukraine 866.52 0.26 −0.03 0.03 3.46 2.18 2.54United Kingdom 20186.56 0.03 0.02 0.31 2.21 1.51 1.24United States 29250.32 0.02 0.03 0.14 2.39 1.79 1.86Uruguay 6113.60 0.15 0.02 0.03 2.70 1.87 1.84Venezuela 3482.51 0.40 −0.02 −0.02 2.57 2.65 2.98
which financing, legal, and corruption problems presented obstacles to the op-eration and growth of their businesses. A rating of 1 denotes no obstacle; 2, aminor obstacle; 3, a moderate obstacle; and 4, a major obstacle. These ratingsprovide a summary measure of the extent to which financing, legal systems, andcorruption create obstacles to growth, and we refer to them below as “summary”obstacles.
Table I shows that in the large majority of countries, firms report that thefinancing obstacle is the most important summary obstacle to growth.8 Also,in general, the reported obstacles tend to be lower in developed countries suchas the United Kingdom and the United States compared to those in developingcountries.
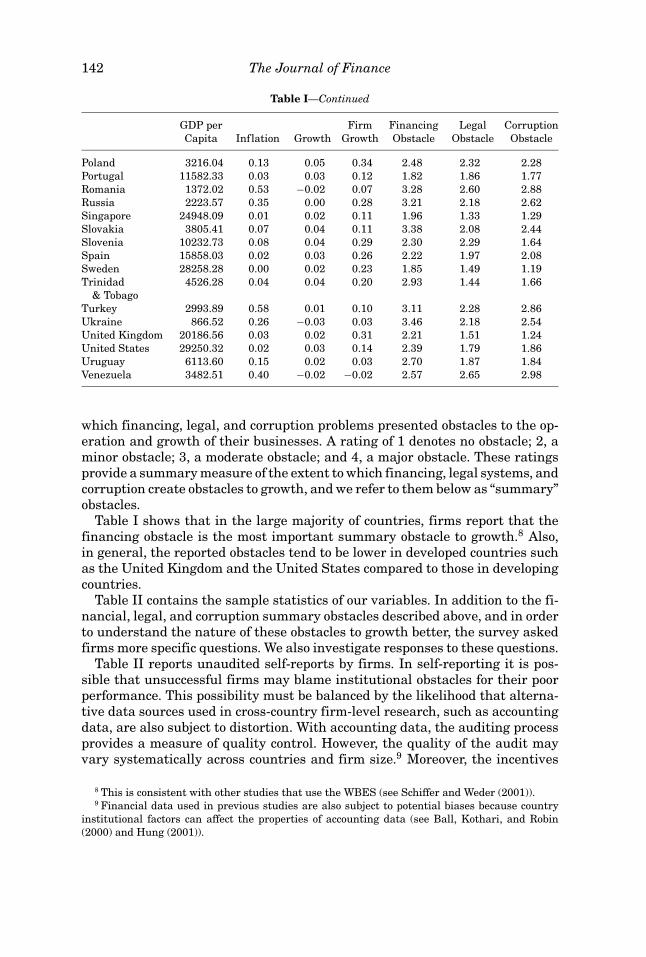
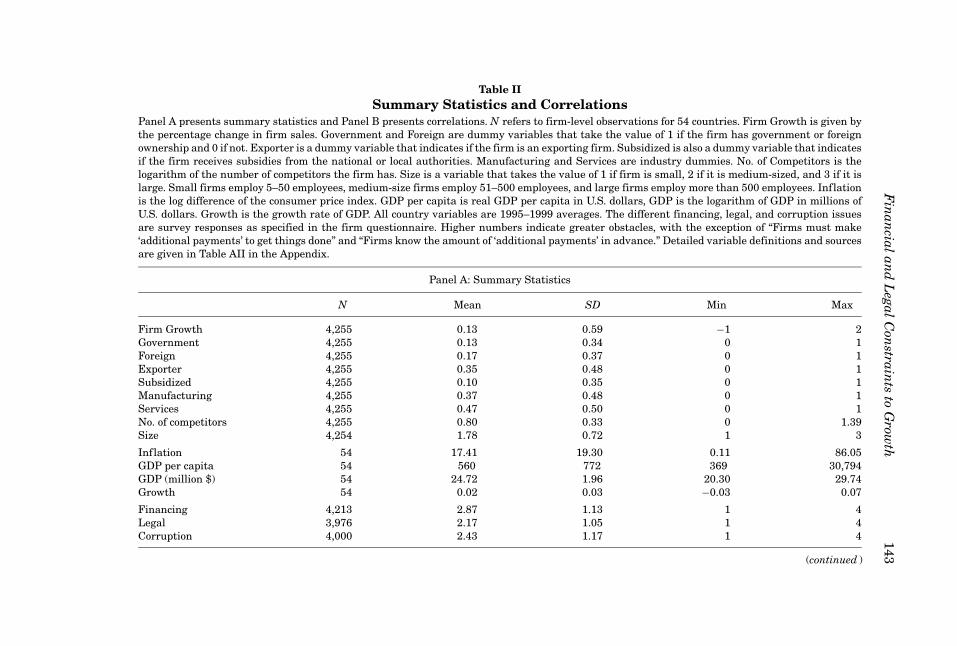
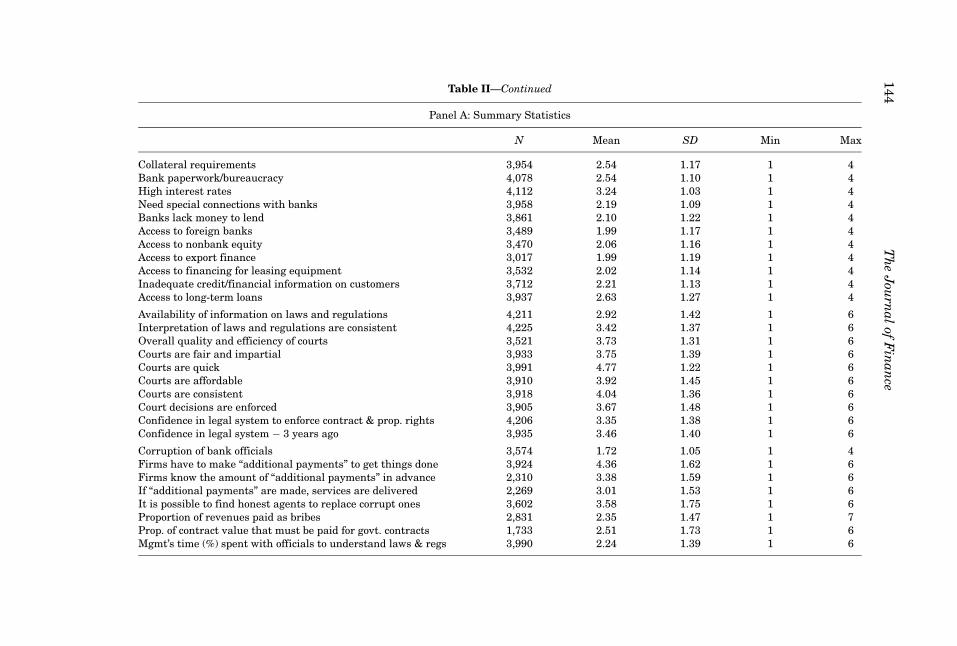
Table II contains the sample statistics of our variables. In addition to the fi-nancial, legal, and corruption summary obstacles described above, and in orderto understand the nature of these obstacles to growth better, the survey askedfirms more specific questions. We also investigate responses to these questions.
Table II reports unaudited self-reports by firms. In self-reporting it is pos-sible that unsuccessful firms may blame institutional obstacles for their poorperformance. This possibility must be balanced by the likelihood that alterna-tive data sources used in cross-country firm-level research, such as accountingdata, are also subject to distortion. With accounting data, the auditing processprovides a measure of quality control. However, the quality of the audit mayvary systematically across countries and firm size.9 Moreover, the incentives
8 This is consistent with other studies that use the WBES (see Schiffer and Weder (2001)).9 Financial data used in previous studies are also subject to potential biases because country
institutional factors can affect the properties of accounting data (see Ball, Kothari, and Robin(2000) and Hung (2001)).
Fin
ancial
and
Legal
Con
straints
toG
rowth
143
Table IISummary Statistics and Correlations
Panel A presents summary statistics and Panel B presents correlations. N refers to firm-level observations for 54 countries. Firm Growth is given bythe percentage change in firm sales. Government and Foreign are dummy variables that take the value of 1 if the firm has government or foreignownership and 0 if not. Exporter is a dummy variable that indicates if the firm is an exporting firm. Subsidized is also a dummy variable that indicatesif the firm receives subsidies from the national or local authorities. Manufacturing and Services are industry dummies. No. of Competitors is thelogarithm of the number of competitors the firm has. Size is a variable that takes the value of 1 if firm is small, 2 if it is medium-sized, and 3 if it islarge. Small firms employ 5–50 employees, medium-size firms employ 51–500 employees, and large firms employ more than 500 employees. Inflationis the log difference of the consumer price index. GDP per capita is real GDP per capita in U.S. dollars, GDP is the logarithm of GDP in millions ofU.S. dollars. Growth is the growth rate of GDP. All country variables are 1995–1999 averages. The different financing, legal, and corruption issuesare survey responses as specified in the firm questionnaire. Higher numbers indicate greater obstacles, with the exception of “Firms must make‘additional payments’ to get things done” and “Firms know the amount of ‘additional payments’ in advance.” Detailed variable definitions and sourcesare given in Table AII in the Appendix.
Panel A: Summary Statistics
N Mean SD Min Max
Firm Growth 4,255 0.13 0.59 −1 2Government 4,255 0.13 0.34 0 1Foreign 4,255 0.17 0.37 0 1Exporter 4,255 0.35 0.48 0 1Subsidized 4,255 0.10 0.35 0 1Manufacturing 4,255 0.37 0.48 0 1Services 4,255 0.47 0.50 0 1No. of competitors 4,255 0.80 0.33 0 1.39Size 4,254 1.78 0.72 1 3
Inflation 54 17.41 19.30 0.11 86.05GDP per capita 54 560 772 369 30,794GDP (million $) 54 24.72 1.96 20.30 29.74Growth 54 0.02 0.03 −0.03 0.07
Financing 4,213 2.87 1.13 1 4Legal 3,976 2.17 1.05 1 4Corruption 4,000 2.43 1.17 1 4
(continued )
144T
he
Journ
alof
Fin
ance
Table II—Continued
Panel A: Summary Statistics
N Mean SD Min Max
Collateral requirements 3,954 2.54 1.17 1 4Bank paperwork/bureaucracy 4,078 2.54 1.10 1 4High interest rates 4,112 3.24 1.03 1 4Need special connections with banks 3,958 2.19 1.09 1 4Banks lack money to lend 3,861 2.10 1.22 1 4Access to foreign banks 3,489 1.99 1.17 1 4Access to nonbank equity 3,470 2.06 1.16 1 4Access to export finance 3,017 1.99 1.19 1 4Access to financing for leasing equipment 3,532 2.02 1.14 1 4Inadequate credit/financial information on customers 3,712 2.21 1.13 1 4Access to long-term loans 3,937 2.63 1.27 1 4
Availability of information on laws and regulations 4,211 2.92 1.42 1 6Interpretation of laws and regulations are consistent 4,225 3.42 1.37 1 6Overall quality and efficiency of courts 3,521 3.73 1.31 1 6Courts are fair and impartial 3,933 3.75 1.39 1 6Courts are quick 3,991 4.77 1.22 1 6Courts are affordable 3,910 3.92 1.45 1 6Courts are consistent 3,918 4.04 1.36 1 6Court decisions are enforced 3,905 3.67 1.48 1 6Confidence in legal system to enforce contract & prop. rights 4,206 3.35 1.38 1 6Confidence in legal system − 3 years ago 3,935 3.46 1.40 1 6
Corruption of bank officials 3,574 1.72 1.05 1 4Firms have to make “additional payments” to get things done 3,924 4.36 1.62 1 6Firms know the amount of “additional payments” in advance 2,310 3.38 1.59 1 6If “additional payments” are made, services are delivered 2,269 3.01 1.53 1 6It is possible to find honest agents to replace corrupt ones 3,602 3.58 1.75 1 6Proportion of revenues paid as bribes 2,831 2.35 1.47 1 7Prop. of contract value that must be paid for govt. contracts 1,733 2.51 1.73 1 6Mgmt’s time (%) spent with officials to understand laws & regs 3,990 2.24 1.39 1 6
Fin
ancial
and
Legal
Con
straints
toG
rowth
145
Panel B: Correlation Matrix of Variables
Firm No. of GDP/Growth Govt Foreign Exporter Subsidized Manuf. Services Comp. Size Inflation Capita GDP($) Growth Financing Legal
Govt. −0.0245∗
Foreign 0.0390∗∗ −0.0258∗
Exporter 0.0844∗∗∗ 0.1001∗∗∗ 0.2368∗∗∗
Subsidized −0.0049 0.1472∗∗∗ 0.0006 0.081∗∗∗
Manuf. −0.0180 0.0855∗∗∗ 0.1165∗∗∗ 0.3448∗∗∗ 0.0219Services 0.0210 −0.0846∗∗∗ −0.0312∗∗ −0.2465∗∗∗ −0.0759∗∗∗ −0.7302∗∗∗
No. of Co. 0.0148 −0.0057 −0.1788∗∗∗ −0.1211∗∗∗ −0.0285∗ −0.117∗∗∗ 0.0334∗∗
Size 0.0224 −0.0245∗ 0.0390∗∗∗ 0.0844∗∗∗ 0.0049 −0.0180 0.0210 0.0148Inflation 0.0010 0.1335∗∗∗ −0.1231∗∗∗ −0.1024∗∗∗ 0.0049 0.0280∗ −0.1262∗∗∗ 0.2640∗∗∗ 0.0010GDP/Cap 0.0489∗∗∗ −0.0808∗∗∗ 0.1262∗∗∗ 0.1223∗∗∗ 0.0675∗∗∗ −0.0460∗∗∗ 0.0739∗∗∗ −0.2228∗∗∗ 0.0489∗∗∗ −0.3655∗∗∗
GDP($) 0.0551∗∗∗ −0.0960∗∗∗ 0.0799∗∗∗ 0.0058 0.0625∗∗∗ −0.0391∗∗∗ 0.0559∗∗∗ −0.1178∗∗∗ 0.0551∗∗∗ −0.0789∗∗∗ 0.5666∗∗∗
Growth 0.0751∗∗∗ 0.0673∗∗∗ 0.0237 0.1275∗∗∗ 0.0404∗∗∗ 0.0000 0.021 0.0281∗ 0.0751∗∗∗ −0.3608∗∗∗ 0.1308∗∗∗ −0.1007∗∗∗
Fin. Obst. −0.0821∗∗∗ 0.0723∗∗∗ −0.1732∗∗∗ −0.052∗∗∗ 0.0231 0.0426∗∗∗ −0.1317∗∗∗ 0.1039∗∗∗ −0.0821∗∗∗ 0.1784∗∗∗ −0.2518∗∗∗ −0.1114∗∗∗ −0.1226∗∗∗
Leg Obst. −0.0676∗∗∗ −0.0084 −0.0158 −0.0095 −0.0303∗∗ 0.0198 −0.0378∗∗ 0.0167 −0.0676∗∗∗ 0.0531∗∗∗ −0.1737∗∗∗ −0.0682∗∗∗ −0.1411∗∗∗ 0.1901∗∗∗
Corruption −0.0695∗∗∗ −0.0713∗∗∗ −0.0733∗∗∗ −0.1025∗∗∗ −0.0759∗∗∗ −0.001 −0.0338∗∗ 0.0479∗∗∗ −0.0695∗∗∗ 0.1314∗∗∗ −0.3322∗∗∗ −0.1635∗∗∗ −0.1815∗∗∗ 0.2809∗∗∗ 0.5754∗∗∗
∗ , ∗∗ , ∗∗∗ indicate significance levels of 10%, 5%, and 1%, respectively.
146 The Journal of Finance
to distort data are likely to be much higher in financial statements than insurvey responses, since financial statements affect operational and financingdecisions.
Although the possibility of data bias due to unaudited self-reporting can neverbe totally eliminated, we believe that it is unlikely to be a significant source ofbias in this study. The stated purpose of the WBES survey is to evaluate thebusiness environment, not firm performance. Firms were asked few specificquestions about their performance and such questions were asked only at theend of the interview. This sequencing reduces the respondents’ need to justifytheir own performance when answering the earlier questions about the busi-ness environment. Respondents were asked about a large range of businessconditions and government policies. Thus, to the extent that firms need to shiftblame for poor performance to outside forces, an unsuccessful firm that is notfinancially constrained is likely to find other, more immediate excuses for itsinternal failures.
To assess the importance of financing obstacles, the firms were asked to rate,again on a scale of 1–4, how problematic specific financing issues are for theoperation and growth of their business. These are (1) collateral requirements ofbanks and financial institutions; (2) bank paperwork and bureaucracy; (3) highinterest rates; (4) need for special connections with banks and financial institu-tions; (5) banks lacking money to lend; (6) access to foreign banks; (7) access tononbank equity; (8) access to export finance; (9) access to financing for leasingequipment; (10) inadequate credit and financial information on customers; and(11) access to long-term loans.
Among the specific financial obstacles to growth, high interest rates stand outwith a value of 3.24, which should be a constraint for all firms in all countries.Access to long-term loans, and bank collateral and paperwork requirements,also appear to be among the greater of the reported obstacles to growth.
The survey also included specific questions on the legal system. Businesseswere asked if (1) information on laws and regulations was available; (2) if theinterpretation of laws and regulations was consistent; and (3) if they were confi-dent that the legal system upheld their contract and property rights in businessdisputes 3 years ago, and continues to do so now. These answers were rated be-tween 1, fully agree, to 6, fully disagree.
The survey also asked businesses to evaluate whether their country’scourts are (1) fair and impartial, (2) quick, (3) affordable, (4) consistent, and(5) enforced decisions. These are rated thus: 1 equals always, 2 equals usually,3 equals frequently, 4 equals sometimes, 5 equals seldom, and 6 equals never.Finally, businesses were asked to rate the overall quality and efficiency of courtsbetween 1, very good, to 6, very bad.
Looking at these legal obstacles to growth, speed of courts, which has a valueof 4.77, seems to be one of the important perceived obstacles. Other impor-tant obstacles include the consistency and affordability of the courts. Below weexamine whether in fact growth is related to the firms’ perceptions of theseobstacles.
The final set of questions we investigate relate to the level of corruptionthat firms must deal with. The questions are (1) whether corruption of bank
Financial and Legal Constraints to Growth 147
officials creates a problem (rated from 1 to 4 as described above); (2) if firmshave to make “additional payments” to get things done; (3) if firms generallyknow what the amount of these “additional payments” are; (4) if services aredelivered when the “additional payments” are made as required; and (5) if itis possible to find honest agents to circumvent corrupt ones without recourseto unofficial payments. Other questions include (6) the proportion of revenuespaid as bribes (increasing in payment ranked from 1 to 7);10 (7) the proportion ofcontract value that must be paid as “unofficial payments” to secure governmentcontracts (increasing in payment ranked from 1 to 6);11 and (8) the proportion ofmanagement’s time in dealing with government officials about the applicationand interpretation of laws and regulations (increasing in time from 1 to 6).Unless specified, answers are ranked from 1 (always) to 6 (never).
Of the specific corruption obstacles reported, the need to make additionalpayments is the highest at 4.36. The second highest rated obstacle is firms’inability to have recourse to honest officials at 3.58.
One potential problem with using survey data is that enterprise managersmay identify several operational problems, only some of which are constrain-ing, while others can be circumvented. For this reason, we examine the ex-tent to which the reported obstacles affect the growth rates of firms. To dothis, we obtain benchmark growth rates by controlling for firm and countrycharacteristics. We then assess whether the level of a reported obstacle af-fects growth relative to this benchmark. However, note that since many firmsin our sample are not publicly traded, we do not have firm-level measures ofinvestment opportunities, such as Tobin’s Q. We use indicators of firm owner-ship, industry, market structure, and size as firm-level controls. Since the sam-ple includes firms from manufacturing, services, construction, agriculture, andother industries, we control for industry effects by including industry dummyvariables.
We also include dummy variables that identify firms as government-ownedor foreign-controlled. Government-owned firms might grow at different ratesbecause their objectives or their exposure to obstacles might differ from thoseof other firms. For example, they can have advantages in dealing with theregulatory system, and they could be less subject to crime or corruption byfinancial intermediaries and more exposed to political influences. The growthrate of foreign institutions can also be different because foreign entities mightfind it more difficult to deal with local judiciary or corruption. However, foreigninstitutions might be less affected by financing obstacles, since they could haveeasier access to the international financial system.
The growth rate of firms can also depend on the market structure in whichthey operate. Therefore, we also include dummy variables to capture whetherthe firm is an exporting firm, whether it receives subsidies from local andnational governments, and the number of competitors it faces in its market.
10 On the scale 1 equals 0%, 2 equals less than 1%, 3 equals 1–1.9%, 4 equals 2–9.99%, 5 equals10–12%, 6 equals 13–25%, and 7 equals more than 25%.
11 On the scale, 1 equals 0%, 2 equals less than 5%, 3 equals 6–10%, 4 equals 11–15%, 5 equals16–20%, 6 equals more than 20%.
148 The Journal of Finance
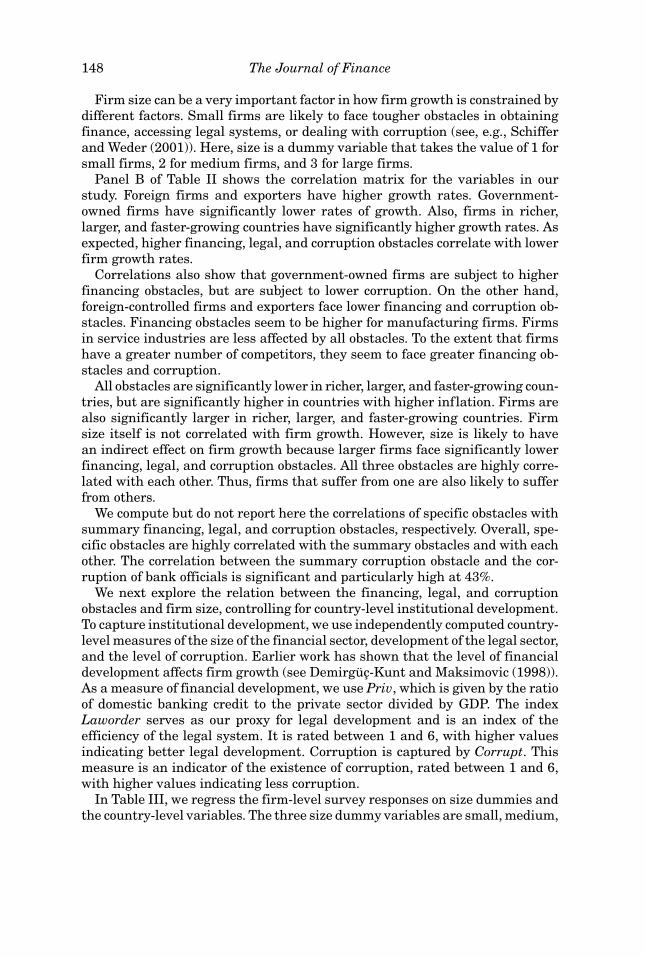
Firm size can be a very important factor in how firm growth is constrained bydifferent factors. Small firms are likely to face tougher obstacles in obtainingfinance, accessing legal systems, or dealing with corruption (see, e.g., Schifferand Weder (2001)). Here, size is a dummy variable that takes the value of 1 forsmall firms, 2 for medium firms, and 3 for large firms.
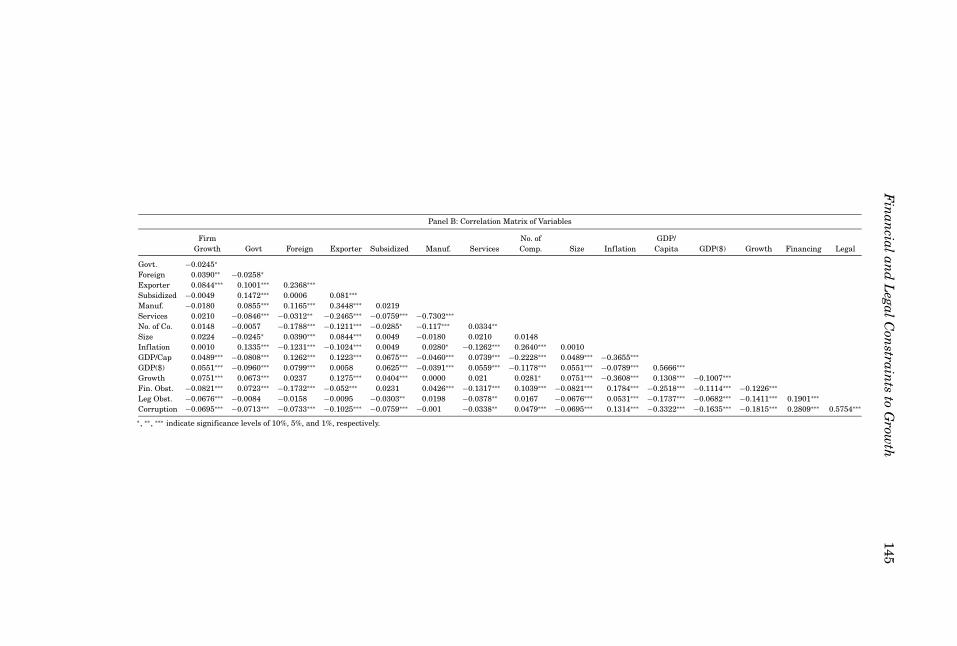
Panel B of Table II shows the correlation matrix for the variables in ourstudy. Foreign firms and exporters have higher growth rates. Government-owned firms have significantly lower rates of growth. Also, firms in richer,larger, and faster-growing countries have significantly higher growth rates. Asexpected, higher financing, legal, and corruption obstacles correlate with lowerfirm growth rates.
Correlations also show that government-owned firms are subject to higherfinancing obstacles, but are subject to lower corruption. On the other hand,foreign-controlled firms and exporters face lower financing and corruption ob-stacles. Financing obstacles seem to be higher for manufacturing firms. Firmsin service industries are less affected by all obstacles. To the extent that firmshave a greater number of competitors, they seem to face greater financing ob-stacles and corruption.
All obstacles are significantly lower in richer, larger, and faster-growing coun-tries, but are significantly higher in countries with higher inflation. Firms arealso significantly larger in richer, larger, and faster-growing countries. Firmsize itself is not correlated with firm growth. However, size is likely to havean indirect effect on firm growth because larger firms face significantly lowerfinancing, legal, and corruption obstacles. All three obstacles are highly corre-lated with each other. Thus, firms that suffer from one are also likely to sufferfrom others.
We compute but do not report here the correlations of specific obstacles withsummary financing, legal, and corruption obstacles, respectively. Overall, spe-cific obstacles are highly correlated with the summary obstacles and with eachother. The correlation between the summary corruption obstacle and the cor-ruption of bank officials is significant and particularly high at 43%.
We next explore the relation between the financing, legal, and corruptionobstacles and firm size, controlling for country-level institutional development.To capture institutional development, we use independently computed country-level measures of the size of the financial sector, development of the legal sector,and the level of corruption. Earlier work has shown that the level of financialdevelopment affects firm growth (see Demirguc-Kunt and Maksimovic (1998)).As a measure of financial development, we use Priv, which is given by the ratioof domestic banking credit to the private sector divided by GDP. The indexLaworder serves as our proxy for legal development and is an index of theefficiency of the legal system. It is rated between 1 and 6, with higher valuesindicating better legal development. Corruption is captured by Corrupt. Thismeasure is an indicator of the existence of corruption, rated between 1 and 6,with higher values indicating less corruption.
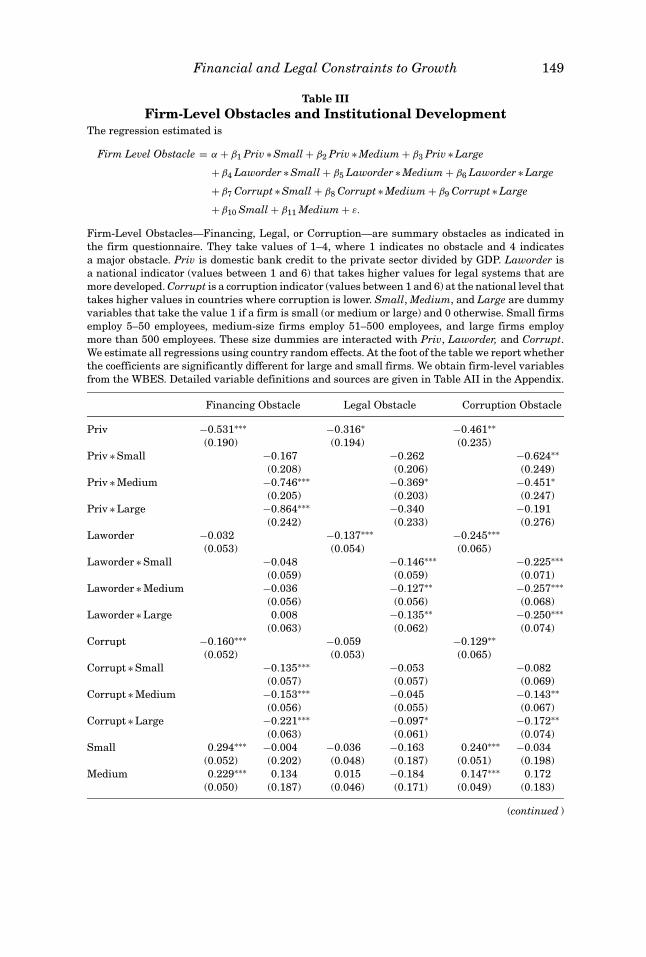
In Table III, we regress the firm-level survey responses on size dummies andthe country-level variables. The three size dummy variables are small, medium,
Financial and Legal Constraints to Growth 149
Table IIIFirm-Level Obstacles and Institutional Development
The regression estimated is
Firm Level Obstacle = α + β1 Priv ∗ Small + β2 Priv ∗ Medium + β3 Priv ∗ Large
+ β4 Laworder ∗ Small + β5 Laworder ∗ Medium + β6 Laworder ∗ Large
+ β7 Corrupt ∗ Small + β8 Corrupt ∗ Medium + β9 Corrupt ∗ Large
+ β10 Small + β11 Medium + ε.
Firm-Level Obstacles—Financing, Legal, or Corruption—are summary obstacles as indicated inthe firm questionnaire. They take values of 1–4, where 1 indicates no obstacle and 4 indicatesa major obstacle. Priv is domestic bank credit to the private sector divided by GDP. Laworder isa national indicator (values between 1 and 6) that takes higher values for legal systems that aremore developed. Corrupt is a corruption indicator (values between 1 and 6) at the national level thattakes higher values in countries where corruption is lower. Small, Medium, and Large are dummyvariables that take the value 1 if a firm is small (or medium or large) and 0 otherwise. Small firmsemploy 5–50 employees, medium-size firms employ 51–500 employees, and large firms employmore than 500 employees. These size dummies are interacted with Priv, Laworder, and Corrupt.We estimate all regressions using country random effects. At the foot of the table we report whetherthe coefficients are significantly different for large and small firms. We obtain firm-level variablesfrom the WBES. Detailed variable definitions and sources are given in Table AII in the Appendix.
Financing Obstacle Legal Obstacle Corruption Obstacle
Priv −0.531∗∗∗ −0.316∗ −0.461∗∗(0.190) (0.194) (0.235)
Priv ∗ Small −0.167 −0.262 −0.624∗∗(0.208) (0.206) (0.249)
Priv ∗ Medium −0.746∗∗∗ −0.369∗ −0.451∗(0.205) (0.203) (0.247)
Priv ∗ Large −0.864∗∗∗ −0.340 −0.191(0.242) (0.233) (0.276)
Laworder −0.032 −0.137∗∗∗ −0.245∗∗∗(0.053) (0.054) (0.065)
Laworder ∗ Small −0.048 −0.146∗∗∗ −0.225∗∗∗(0.059) (0.059) (0.071)
Laworder ∗ Medium −0.036 −0.127∗∗ −0.257∗∗∗(0.056) (0.056) (0.068)
Laworder ∗ Large 0.008 −0.135∗∗ −0.250∗∗∗(0.063) (0.062) (0.074)
Corrupt −0.160∗∗∗ −0.059 −0.129∗∗(0.052) (0.053) (0.065)
Corrupt ∗ Small −0.135∗∗∗ −0.053 −0.082(0.057) (0.057) (0.069)
Corrupt ∗ Medium −0.153∗∗∗ −0.045 −0.143∗∗(0.056) (0.055) (0.067)
Corrupt ∗ Large −0.221∗∗∗ −0.097∗ −0.172∗∗(0.063) (0.061) (0.074)
Small 0.294∗∗∗ −0.004 −0.036 −0.163 0.240∗∗∗ −0.034(0.052) (0.202) (0.048) (0.187) (0.051) (0.198)
Medium 0.229∗∗∗ 0.134 0.015 −0.184 0.147∗∗∗ 0.172(0.050) (0.187) (0.046) (0.171) (0.049) (0.183)
(continued )
150 The Journal of Finance
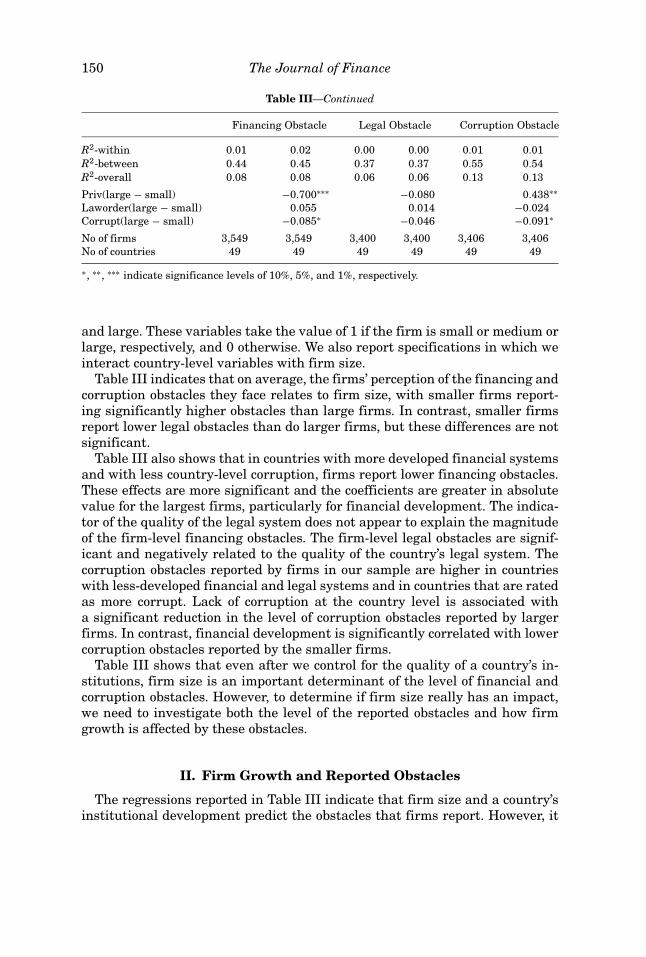
Table III—Continued
Financing Obstacle Legal Obstacle Corruption Obstacle
R2-within 0.01 0.02 0.00 0.00 0.01 0.01R2-between 0.44 0.45 0.37 0.37 0.55 0.54R2-overall 0.08 0.08 0.06 0.06 0.13 0.13
Priv(large − small) −0.700∗∗∗ −0.080 0.438∗∗Laworder(large − small) 0.055 0.014 −0.024Corrupt(large − small) −0.085∗ −0.046 −0.091∗
No of firms 3,549 3,549 3,400 3,400 3,406 3,406No of countries 49 49 49 49 49 49
∗, ∗∗, ∗∗∗ indicate significance levels of 10%, 5%, and 1%, respectively.
and large. These variables take the value of 1 if the firm is small or medium orlarge, respectively, and 0 otherwise. We also report specifications in which weinteract country-level variables with firm size.
Table III indicates that on average, the firms’ perception of the financing andcorruption obstacles they face relates to firm size, with smaller firms report-ing significantly higher obstacles than large firms. In contrast, smaller firmsreport lower legal obstacles than do larger firms, but these differences are notsignificant.
Table III also shows that in countries with more developed financial systemsand with less country-level corruption, firms report lower financing obstacles.These effects are more significant and the coefficients are greater in absolutevalue for the largest firms, particularly for financial development. The indica-tor of the quality of the legal system does not appear to explain the magnitudeof the firm-level financing obstacles. The firm-level legal obstacles are signif-icant and negatively related to the quality of the country’s legal system. Thecorruption obstacles reported by firms in our sample are higher in countrieswith less-developed financial and legal systems and in countries that are ratedas more corrupt. Lack of corruption at the country level is associated witha significant reduction in the level of corruption obstacles reported by largerfirms. In contrast, financial development is significantly correlated with lowercorruption obstacles reported by the smaller firms.
Table III shows that even after we control for the quality of a country’s in-stitutions, firm size is an important determinant of the level of financial andcorruption obstacles. However, to determine if firm size really has an impact,we need to investigate both the level of the reported obstacles and how firmgrowth is affected by these obstacles.
II. Firm Growth and Reported Obstacles
The regressions reported in Table III indicate that firm size and a country’sinstitutional development predict the obstacles that firms report. However, it
Financial and Legal Constraints to Growth 151
does not follow that they also predict the effect of these obstacles on firm growth.A firm’s report that an existing economy-wide institutional obstacle constrainsits growth might be accurate, but may not take into account the possibilitythat the obstacle may also benefit it by affecting its rivals. Obstacles mightaffect large and small firms differently. Table II also indicates that there is ahigh degree of correlation between variables of interest and other firm- andcountry-level controls that affect growth. Thus, we clarify the relation betweenfirm-level characteristics and firm growth using multivariate regression.
We regress firms’ growth rates on the obstacles they report. We initially in-troduce financial, legal, and corruption summary obstacles one at a time, andfinally all together. In subsequent regressions, we substitute specific obstaclesfor these summary obstacles and introduce interaction terms. All regressionsare estimated using firm-level data across 54 countries and country random ef-fects. The regressions are estimated with controls for country and firm-specificvariables discussed in Section II. The country controls are GDP per capita,GDP, country growth, and the inflation rate. Firm-specific controls are the log-arithm of the number of competitors the firm has, and indicator variables forownership of the firm (separate indicators for government- and foreign-ownedfirms), industry classification (separate indicators for manufacturing and ser-vice industries), and indicators for whether the firm is an exporter and whetherit receives government subsidies. Specifically, the regression equations we es-timate take the form
Firm Growth = α + β1 Government + β2 Foreign + β3 Exporter
+ β4 Subsidized + β5 No. of Competitors
+ β6 Manufacturing + β7 Services + β8 Inflation
+ β9 GDP per capita + β10 GDP
+ β11 Growth + β12 Obstacle + ε. (1)
To test the hypothesis that an obstacle is related to firm growth, we testwhether its coefficient β12 is significantly different from zero. We also obtainan estimate of the economic impact of the obstacle at the sample mean bymultiplying its coefficient β12 by the sample mean of the obstacle. This impactvariable measures the total effect of the obstacle on growth, taking into accountboth the level of the mean reported obstacle and the estimated relation betweenthe reported obstacle and observed growth.
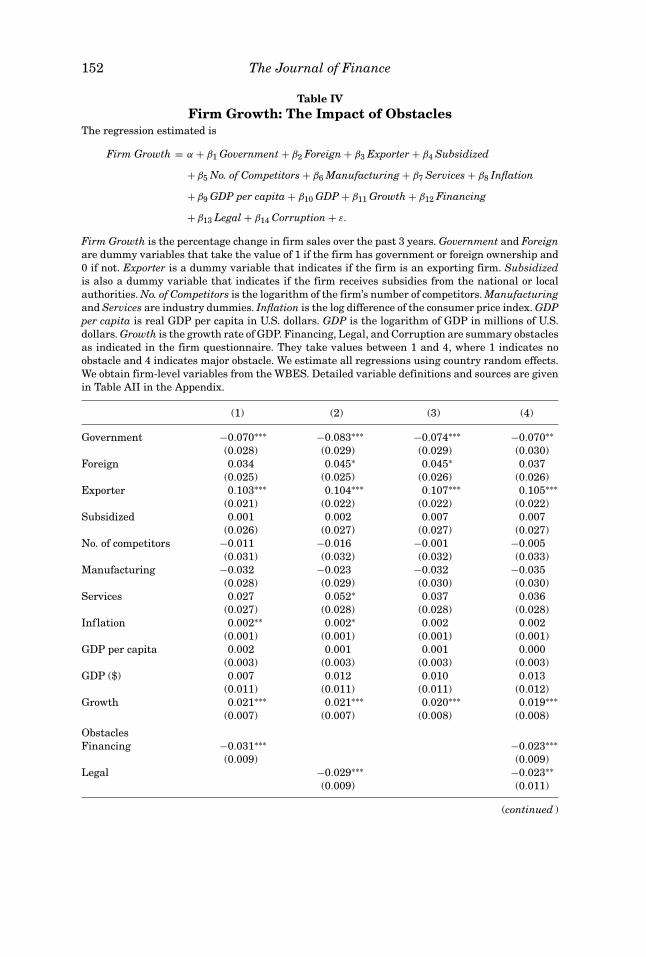
Table IV shows how firm growth is related to the financing, legal, and cor-ruption obstacles reported by firms. When entered individually, all reportedobstacles have a negative and significant effect on firm growth, as expected.The impact of the obstacles on firm growth evaluated at the sample mean isnegative, and in all cases, substantial.
Column 4 shows that financing and legal obstacles are both significant andnegative, but corruption loses its significance in the presence of these two vari-ables. This suggests that the impact of corruption on firm growth is captured
152 The Journal of Finance
Table IVFirm Growth: The Impact of Obstacles
The regression estimated is
Firm Growth = α + β1 Government + β2 Foreign + β3 Exporter + β4 Subsidized
+ β5 No. of Competitors + β6 Manufacturing + β7 Services + β8 Inflation
+ β9 GDP per capita + β10 GDP + β11 Growth + β12 Financing
+ β13 Legal + β14 Corruption + ε.
Firm Growth is the percentage change in firm sales over the past 3 years. Government and Foreignare dummy variables that take the value of 1 if the firm has government or foreign ownership and0 if not. Exporter is a dummy variable that indicates if the firm is an exporting firm. Subsidizedis also a dummy variable that indicates if the firm receives subsidies from the national or localauthorities. No. of Competitors is the logarithm of the firm’s number of competitors. Manufacturingand Services are industry dummies. Inflation is the log difference of the consumer price index. GDPper capita is real GDP per capita in U.S. dollars. GDP is the logarithm of GDP in millions of U.S.dollars. Growth is the growth rate of GDP. Financing, Legal, and Corruption are summary obstaclesas indicated in the firm questionnaire. They take values between 1 and 4, where 1 indicates noobstacle and 4 indicates major obstacle. We estimate all regressions using country random effects.We obtain firm-level variables from the WBES. Detailed variable definitions and sources are givenin Table AII in the Appendix.
(1) (2) (3) (4)
Government −0.070∗∗∗ −0.083∗∗∗ −0.074∗∗∗ −0.070∗∗(0.028) (0.029) (0.029) (0.030)
Foreign 0.034 0.045∗ 0.045∗ 0.037(0.025) (0.025) (0.026) (0.026)
Exporter 0.103∗∗∗ 0.104∗∗∗ 0.107∗∗∗ 0.105∗∗∗(0.021) (0.022) (0.022) (0.022)
Subsidized 0.001 0.002 0.007 0.007(0.026) (0.027) (0.027) (0.027)
No. of competitors −0.011 −0.016 −0.001 −0.005(0.031) (0.032) (0.032) (0.033)
Manufacturing −0.032 −0.023 −0.032 −0.035(0.028) (0.029) (0.030) (0.030)
Services 0.027 0.052∗ 0.037 0.036(0.027) (0.028) (0.028) (0.028)
Inflation 0.002∗∗ 0.002∗ 0.002 0.002(0.001) (0.001) (0.001) (0.001)
GDP per capita 0.002 0.001 0.001 0.000(0.003) (0.003) (0.003) (0.003)
GDP ($) 0.007 0.012 0.010 0.013(0.011) (0.011) (0.011) (0.012)
Growth 0.021∗∗∗ 0.021∗∗∗ 0.020∗∗∗ 0.019∗∗∗(0.007) (0.007) (0.008) (0.008)
ObstaclesFinancing −0.031∗∗∗ −0.023∗∗∗
(0.009) (0.009)Legal −0.029∗∗∗ −0.023∗∗
(0.009) (0.011)
(continued )
Financial and Legal Constraints to Growth 153
Table IV—Continued
(1) (2) (3) (4)
Corruption −0.021∗∗∗ −0.007(0.009) (0.011)
Impact on growth evaluatedat sample mean
−0.087∗∗∗ −0.063∗∗∗ −0.052∗∗∗ −0.134∗∗∗
R2-with. 0.01 0.01 0.01 0.02R2-between 0.28 0.27 0.25 0.26R2-overall 0.02 0.03 0.02 0.03No. of firms 4,204 3,968 3,991 3,800No. of countries 54 54 54 54
∗, ∗∗, ∗∗∗ indicate significance levels of 10, 5, and 1%, respectively.
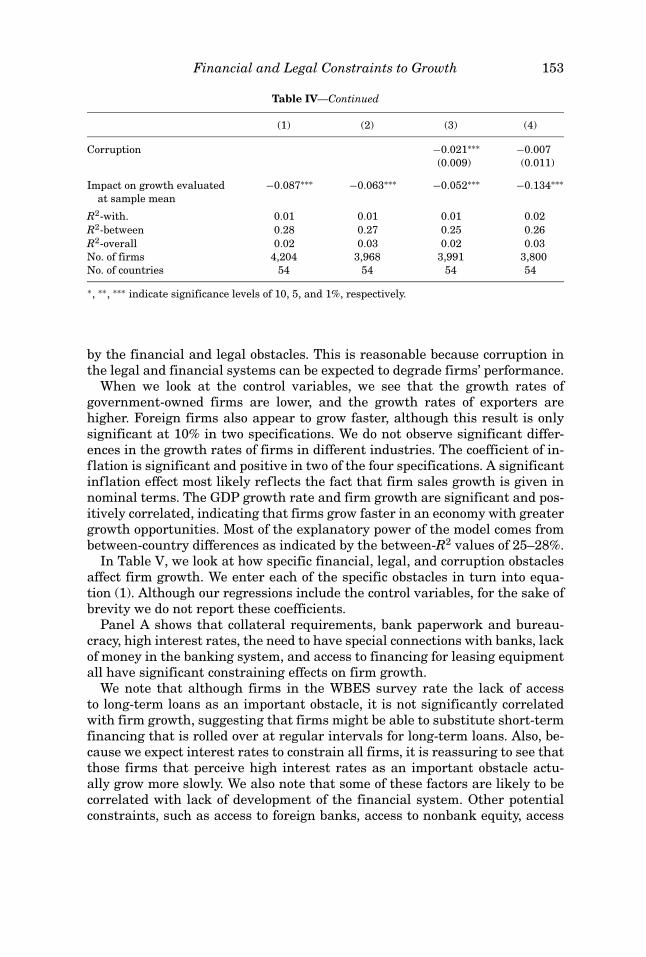
by the financial and legal obstacles. This is reasonable because corruption inthe legal and financial systems can be expected to degrade firms’ performance.
When we look at the control variables, we see that the growth rates ofgovernment-owned firms are lower, and the growth rates of exporters arehigher. Foreign firms also appear to grow faster, although this result is onlysignificant at 10% in two specifications. We do not observe significant differ-ences in the growth rates of firms in different industries. The coefficient of in-flation is significant and positive in two of the four specifications. A significantinflation effect most likely reflects the fact that firm sales growth is given innominal terms. The GDP growth rate and firm growth are significant and pos-itively correlated, indicating that firms grow faster in an economy with greatergrowth opportunities. Most of the explanatory power of the model comes frombetween-country differences as indicated by the between-R2 values of 25–28%.
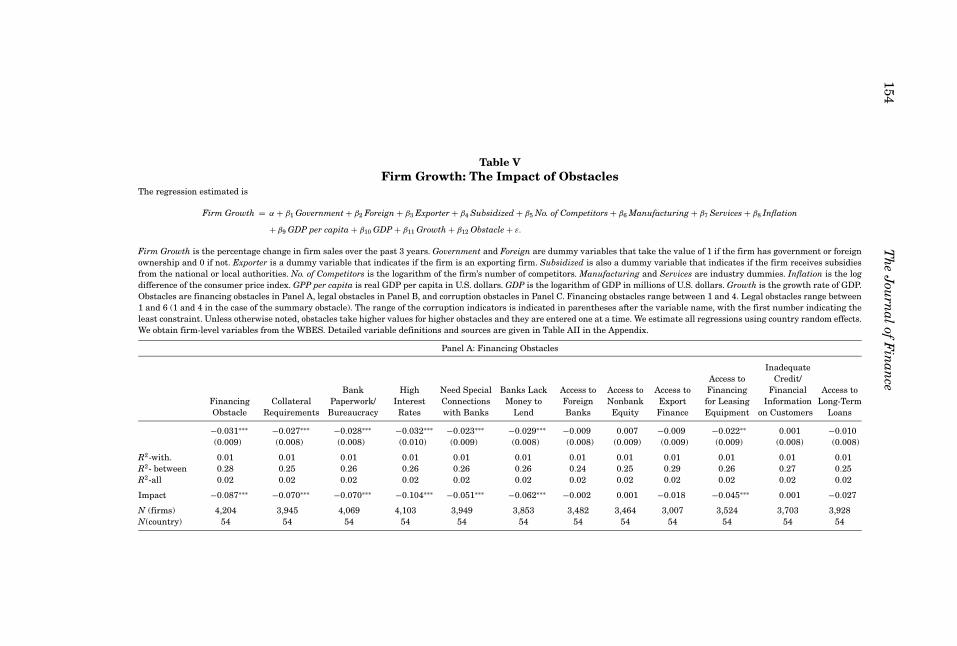
In Table V, we look at how specific financial, legal, and corruption obstaclesaffect firm growth. We enter each of the specific obstacles in turn into equa-tion (1). Although our regressions include the control variables, for the sake ofbrevity we do not report these coefficients.
Panel A shows that collateral requirements, bank paperwork and bureau-cracy, high interest rates, the need to have special connections with banks, lackof money in the banking system, and access to financing for leasing equipmentall have significant constraining effects on firm growth.
We note that although firms in the WBES survey rate the lack of accessto long-term loans as an important obstacle, it is not significantly correlatedwith firm growth, suggesting that firms might be able to substitute short-termfinancing that is rolled over at regular intervals for long-term loans. Also, be-cause we expect interest rates to constrain all firms, it is reassuring to see thatthose firms that perceive high interest rates as an important obstacle actu-ally grow more slowly. We also note that some of these factors are likely to becorrelated with lack of development of the financial system. Other potentialconstraints, such as access to foreign banks, access to nonbank equity, access
154T
he
Journ
alof
Fin
ance
Table VFirm Growth: The Impact of Obstacles
The regression estimated is
Firm Growth = α + β1 Government + β2 Foreign + β3 Exporter + β4 Subsidized + β5 No. of Competitors + β6 Manufacturing + β7 Services + β8 Inflation
+ β9 GDP per capita + β10 GDP + β11 Growth + β12 Obstacle + ε.
Firm Growth is the percentage change in firm sales over the past 3 years. Government and Foreign are dummy variables that take the value of 1 if the firm has government or foreignownership and 0 if not. Exporter is a dummy variable that indicates if the firm is an exporting firm. Subsidized is also a dummy variable that indicates if the firm receives subsidiesfrom the national or local authorities. No. of Competitors is the logarithm of the firm’s number of competitors. Manufacturing and Services are industry dummies. Inflation is the logdifference of the consumer price index. GPP per capita is real GDP per capita in U.S. dollars. GDP is the logarithm of GDP in millions of U.S. dollars. Growth is the growth rate of GDP.Obstacles are financing obstacles in Panel A, legal obstacles in Panel B, and corruption obstacles in Panel C. Financing obstacles range between 1 and 4. Legal obstacles range between1 and 6 (1 and 4 in the case of the summary obstacle). The range of the corruption indicators is indicated in parentheses after the variable name, with the first number indicating theleast constraint. Unless otherwise noted, obstacles take higher values for higher obstacles and they are entered one at a time. We estimate all regressions using country random effects.We obtain firm-level variables from the WBES. Detailed variable definitions and sources are given in Table AII in the Appendix.
Panel A: Financing Obstacles
InadequateAccess to Credit/
Bank High Need Special Banks Lack Access to Access to Access to Financing Financial Access toFinancing Collateral Paperwork/ Interest Connections Money to Foreign Nonbank Export for Leasing Information Long-TermObstacle Requirements Bureaucracy Rates with Banks Lend Banks Equity Finance Equipment on Customers Loans
−0.031∗∗∗ −0.027∗∗∗ −0.028∗∗∗ −0.032∗∗∗ −0.023∗∗∗ −0.029∗∗∗ −0.009 0.007 −0.009 −0.022∗∗ 0.001 −0.010(0.009) (0.008) (0.008) (0.010) (0.009) (0.008) (0.008) (0.009) (0.009) (0.009) (0.008) (0.008)
R2-with. 0.01 0.01 0.01 0.01 0.01 0.01 0.01 0.01 0.01 0.01 0.01 0.01R2- between 0.28 0.25 0.26 0.26 0.26 0.26 0.24 0.25 0.29 0.26 0.27 0.25R2-all 0.02 0.02 0.02 0.02 0.02 0.02 0.02 0.02 0.02 0.02 0.02 0.02
Impact −0.087∗∗∗ −0.070∗∗∗ −0.070∗∗∗ −0.104∗∗∗ −0.051∗∗∗ −0.062∗∗∗ −0.002 0.001 −0.018 −0.045∗∗∗ 0.001 −0.027
N (firms) 4,204 3,945 4,069 4,103 3,949 3,853 3,482 3,464 3,007 3,524 3,703 3,928N(country) 54 54 54 54 54 54 54 54 54 54 54 54
Fin
ancial
and
Legal
Con
straints
toG
rowth
155
Panel B: Legal Obstacles
Availability Interpretation Overall Court Confidence in Confidenceof Info. on of Laws and Quality and Courts Are Decisions Legal System to in Legal
Legal Laws and Regulations Efficiency Fair and Courts Are Courts Are Courts Are Are Enforce Contract System—Constraint Regulations Is Consistent of Courts Impartial Quick Affordable Consistent Enforced and Property Rights 3 Years Ago
−0.029∗∗∗ 0.002 −0.003 −0.003 −0.004 0.005 −0.009 0.002 0.011 −0.005 0.004(0.009) (0.006) (0.007) (0.008) (0.007) (0.008) (0.007) (0.007) (0.007) (0.007) (0.007)
R2-with. 0.01 0.01 0.01 0.01 0.01 0.01 0.01 0.01 0.01 0.01 0.01R2-between 0.27 0.27 0.26 0.27 0.27 0.28 0.30 0.27 0.31 0.28 0.32R2-all 0.03 0.02 0.02 0.02 0.02 0.02 0.02 0.02 0.03 0.02 0.02
Impact −0.063∗∗∗ 0.006 −0.011 −0.014 −0.013 0.026 −0.035 0.007 0.039 −0.015 0.014
N (firms) 3,968 4,202 4,216 3,513 3,924 3,982 3,901 3,909 3,896 4,197 3,926N(country) 54 54 54 54 54 54 54 54 54 54 54
Panel C: Corruption Obstacles
If One Agent Proportion of PercentageAsks for Payments Contract Value of Senior
It Is Possible Proportion of That Must Management’sFirms Have Firms Know If “Additional to Find Others Revenues Paid be Paid as Time Spent with
to Make in Advance Payments” to Get the as Bribes— “Payment” to GovernmentCorruption “Additional the Amount Are Made, Correct Annual Do Business Officials to
Corruption of Bank Payments” to of “Additional Services Are Treatment Figure for with the UnderstandObstacle Officials Get Things Payments” Delivered as without Each Firm Government Laws and
(1-4) (1-4) Done (6-1) (6-1) Agreed (1-6) Payment (1-6) (1-7) (1-6) Regulations (1-6)
−0.021∗∗∗ −0.017∗ −0.003 −0.002 −0.012 −0.002 −0.037∗∗∗ 0.004 −0.012∗
(0.009) (0.010) (0.006) (0.008) (0.009) (0.006) (0.008) (0.007) (0.007)
R2-with. 0.01 0.01 0.01 0.01 0.02 0.01 0.03 0.02 0.01R2-between 0.25 0.26 0.28 0.19 0.20 0.28 0.16 0.21 0.24R2-all 0.02 0.02 0.02 0.02 0.02 0.02 0.03 0.04 0.02
Impact −0.052∗∗∗ −0.030∗ −0.014 −0.007 0.035 −0.006 0.087∗∗∗ 0.011 −0.027∗
N (firms) 3,991 3,566 3,916 2,306 2,266 3,595 2,824 1,734 3,981N(country) 54 54 54 53 53 53 53 52 54
∗, ∗∗, ∗∗∗ indicate significance levels of 10%, 5%, and 1%, respectively.
156 The Journal of Finance
to export finance, or inadequate information on customers are not significantlycorrelated with firm growth. Tests of the economic impact of the obstacles atthe sample means indicate that the estimated coefficients, when significant,are sufficiently large to impact growth rates materially.
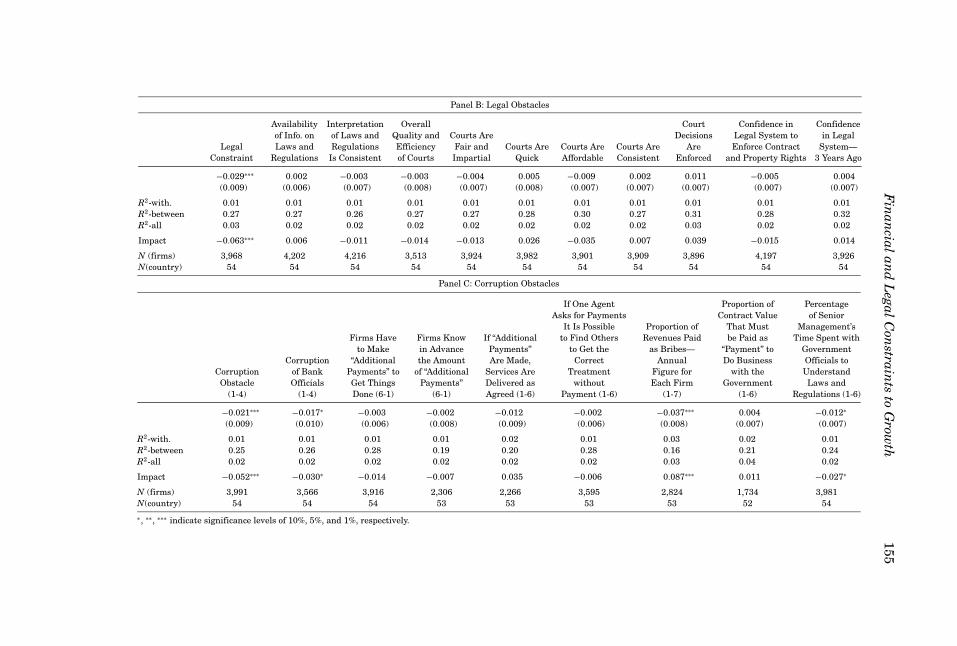
Panel B shows a significant and negative relation between the summary legalobstacle and firm growth. None of the specific legal obstacles has a significantcoefficient. It appears that firms are able to work around these specific le-gal obstacles, although they find them annoying. Nevertheless, regressing thesummary legal obstacle on the quality of the courts (i.e., their fairness, hon-esty, quickness, affordability, consistency, enforcement capacity, and confidencein the legal system), we find that these factors can explain 46% of the cross-country variation in the legal obstacle.12 To further examine the importance ofthe specific legal obstacles taken together, we compute the predicted summarylegal obstacle from this regression and introduce it as an independent variablein the firm growth equation in place of the actual summary legal obstacle. Thecoefficient of the predicted summary legal obstacle is positive yet insignificant,suggesting that the specific obstacles are at most weakly related to firm growth.This is also true if we run the regressions only for the sample of small firms. Ifwe split the sample based on legal origin, the explanatory power of the specificdescriptors is not significantly different in the common law countries comparedto the civil law countries.13
Thus, although specific obstacles relate to the summary obstacle, they playa minor role in affecting growth. This finding suggests that the usual intuitivedescriptors of how a good legal system operates predict survey responses well,but do not capture the effect of the legal system on firm growth.
Panel C of Table V shows that in addition to the summary corruption obstacle,the proportion of revenues paid as bribes has a negative and highly significantcoefficient, indicating that it is a good indicator of corruption. Corruption ofbank officials and the percentage of senior management’s time spent with gov-ernment officials also reduce firm growth significantly, but only at the 10%level. Again, the need to make payments or the absence of recourse to honestofficials are not significant in regressions, despite their high levels as obstacles.
To investigate the relation between growth and reported obstacles fordifferent-size firms, we next introduce firm size as an explanatory variable andinteract the size dummies with individual obstacles. This specification positsthat a firm might be affected by an obstacle, such as corruption, at three dif-ferent levels: (1) at the country level, in that the general level of corruptionmay affect all the firms in the country; (2) at the “firm category” level, in thatsome firms (in our case different sized firms) might be affected differently;and (3) at the firm-specific level, in that firms have idiosyncratic exposuresto corruption, depending on their business or financing needs. The equationsare also estimated using random effects. Thus, the influence of the general
12 If we use firm-level data and include random country effects, the between-R2 is 41%.13 We are only able to do this using firm-level observations, since there are not enough degrees
of freedom at the country level.
Financial and Legal Constraints to Growth 157
level of corruption in each country on firm growth is captured by the countryrandom effects. The size variable picks up any systematic effects of exposureto corruption by firms of different sizes. The effect of firm-specific exposure tocorruption is picked up by interacting the obstacles reported by each firm witha size dummy.
More generally, for each reported obstacle of interest, we regress firm growthon the control variables, firm size, the reported obstacle, and the interaction ofthe reported obstacle with three size dummies. These three variables, Small,Medium, and Large, take on the value 1 when the firm is small, medium-sized,and large, respectively, and 0 otherwise. The coefficients of interactions of thesize dummies with an obstacle may differ because the impact of an obstacle candepend on firm size.
We also compute an economic impact variable for each firm size by multi-plying the coefficients of the interacted variables by the mean level of reportedobstacle for the subsample of firms of the corresponding firm size. To determinewhether an obstacle affects the growth of large and small firms differently, wereport and test the significance of the difference in the economic impacts ofthe obstacle for large and small firms. Thus, our reported impact variable,Impact(L − S), measures the difference between the total effect of the obstacleon large and small firms at their respective population means.
Our impact measure, Impact(L − S), also controls to a certain extent for a po-tential bias that could arise if some firms misestimate the effect of the obstacleson their growth, and if this misestimate is related to firm size. For example, ifsmall firms systematically do not appreciate the real cost of the reported obsta-cles, they may, on average, underreport (relative to large firms) the magnitudeof the obstacle. In that case, small firms might report, on average, λ times thetrue obstacle, where λ < 1. This in turn would bias upward the estimate of theinteraction between Small and Obstacle. However, since the impact measure isdefined as the difference of the products of the estimated coefficients and sam-ple means of reported obstacles for large and small firms, it would thereforealso not be affected by such scaling.14
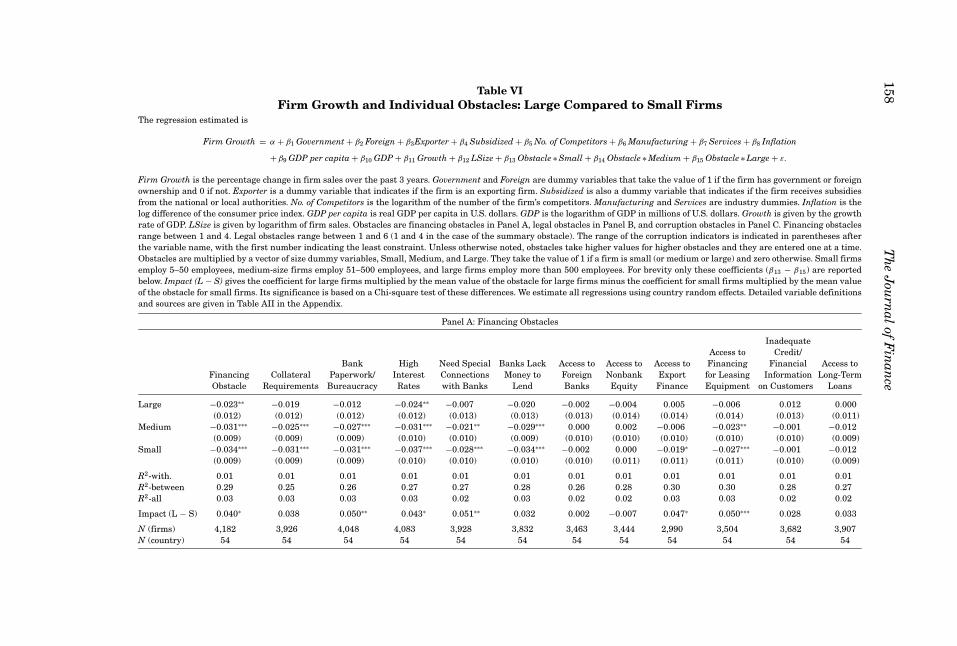
In Table VI, we investigate whether financial, legal, and corruption obstaclesaffect firms differently based on their size. Panel A shows that financial obsta-cles affect firms differently, based on their size. The column titled ‘FinancialObstacle’ shows that the financing obstacle constrains the smallest firms themost and the largest ones the least. Multiplying the coefficients with the meanlevel of the summary financial obstacle for each respective subsample showsthat the hypothesis that the economic impact of financing obstacles is the samefor large and small firms can be rejected at the 10% level.
These differences become even clearer when we look at specific financingobstacles: The largest firms are barely affected. The only obstacle that affectsthese firms is that caused by high interest rates, which is different from 0 at
14 As shown in the tables below, for almost all the regressions reported below, the conclusions wedraw by testing for the differences of the economic impact variables match those drawn by simplytesting for the differences in the coefficients.
158T
he
Journ
alof
Fin
ance
Table VIFirm Growth and Individual Obstacles: Large Compared to Small Firms
The regression estimated is
Firm Growth = α + β1 Government + β2 Foreign + β3Exporter + β4 Subsidized + β5 No. of Competitors + β6 Manufacturing + β7 Services + β8 Inflation
+ β9 GDP per capita + β10 GDP + β11 Growth + β12 LSize + β13 Obstacle ∗ Small + β14 Obstacle ∗ Medium + β15 Obstacle ∗ Large + ε.
Firm Growth is the percentage change in firm sales over the past 3 years. Government and Foreign are dummy variables that take the value of 1 if the firm has government or foreignownership and 0 if not. Exporter is a dummy variable that indicates if the firm is an exporting firm. Subsidized is also a dummy variable that indicates if the firm receives subsidiesfrom the national or local authorities. No. of Competitors is the logarithm of the number of the firm’s competitors. Manufacturing and Services are industry dummies. Inflation is thelog difference of the consumer price index. GDP per capita is real GDP per capita in U.S. dollars. GDP is the logarithm of GDP in millions of U.S. dollars. Growth is given by the growthrate of GDP. LSize is given by logarithm of firm sales. Obstacles are financing obstacles in Panel A, legal obstacles in Panel B, and corruption obstacles in Panel C. Financing obstaclesrange between 1 and 4. Legal obstacles range between 1 and 6 (1 and 4 in the case of the summary obstacle). The range of the corruption indicators is indicated in parentheses afterthe variable name, with the first number indicating the least constraint. Unless otherwise noted, obstacles take higher values for higher obstacles and they are entered one at a time.Obstacles are multiplied by a vector of size dummy variables, Small, Medium, and Large. They take the value of 1 if a firm is small (or medium or large) and zero otherwise. Small firmsemploy 5–50 employees, medium-size firms employ 51–500 employees, and large firms employ more than 500 employees. For brevity only these coefficients (β13 − β15) are reportedbelow. Impact (L − S) gives the coefficient for large firms multiplied by the mean value of the obstacle for large firms minus the coefficient for small firms multiplied by the mean valueof the obstacle for small firms. Its significance is based on a Chi-square test of these differences. We estimate all regressions using country random effects. Detailed variable definitionsand sources are given in Table AII in the Appendix.
Panel A: Financing Obstacles
InadequateAccess to Credit/
Bank High Need Special Banks Lack Access to Access to Access to Financing Financial Access toFinancing Collateral Paperwork/ Interest Connections Money to Foreign Nonbank Export for Leasing Information Long-TermObstacle Requirements Bureaucracy Rates with Banks Lend Banks Equity Finance Equipment on Customers Loans
Large −0.023∗∗ −0.019 −0.012 −0.024∗∗ −0.007 −0.020 −0.002 −0.004 0.005 −0.006 0.012 0.000(0.012) (0.012) (0.012) (0.012) (0.013) (0.013) (0.013) (0.014) (0.014) (0.014) (0.013) (0.011)
Medium −0.031∗∗∗ −0.025∗∗∗ −0.027∗∗∗ −0.031∗∗∗ −0.021∗∗ −0.029∗∗∗ 0.000 0.002 −0.006 −0.023∗∗ −0.001 −0.012(0.009) (0.009) (0.009) (0.010) (0.010) (0.009) (0.010) (0.010) (0.010) (0.010) (0.010) (0.009)
Small −0.034∗∗∗ −0.031∗∗∗ −0.031∗∗∗ −0.037∗∗∗ −0.028∗∗∗ −0.034∗∗∗ −0.002 0.000 −0.019∗ −0.027∗∗∗ −0.001 −0.012(0.009) (0.009) (0.009) (0.010) (0.010) (0.010) (0.010) (0.011) (0.011) (0.011) (0.010) (0.009)
R2-with. 0.01 0.01 0.01 0.01 0.01 0.01 0.01 0.01 0.01 0.01 0.01 0.01R2-between 0.29 0.25 0.26 0.27 0.27 0.28 0.26 0.28 0.30 0.30 0.28 0.27R2-all 0.03 0.03 0.03 0.03 0.02 0.03 0.02 0.02 0.03 0.03 0.02 0.02
Impact (L − S) 0.040∗ 0.038 0.050∗∗ 0.043∗ 0.051∗∗ 0.032 0.002 −0.007 0.047∗ 0.050∗∗∗ 0.028 0.033
N (firms) 4,182 3,926 4,048 4,083 3,928 3,832 3,463 3,444 2,990 3,504 3,682 3,907N (country) 54 54 54 54 54 54 54 54 54 54 54 54
Fin
ancial
and
Legal
Con
straints
toG
rowth
159
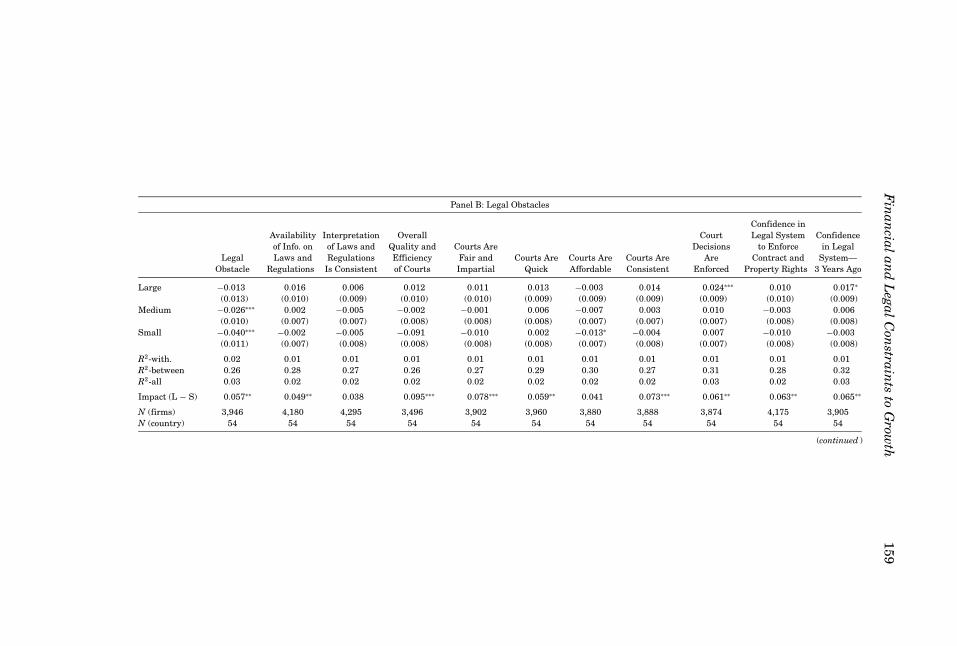
Panel B: Legal Obstacles
Confidence inAvailability Interpretation Overall Court Legal System Confidenceof Info. on of Laws and Quality and Courts Are Decisions to Enforce in Legal
Legal Laws and Regulations Efficiency Fair and Courts Are Courts Are Courts Are Are Contract and System—Obstacle Regulations Is Consistent of Courts Impartial Quick Affordable Consistent Enforced Property Rights 3 Years Ago
Large −0.013 0.016 0.006 0.012 0.011 0.013 −0.003 0.014 0.024∗∗∗ 0.010 0.017∗
(0.013) (0.010) (0.009) (0.010) (0.010) (0.009) (0.009) (0.009) (0.009) (0.010) (0.009)Medium −0.026∗∗∗ 0.002 −0.005 −0.002 −0.001 0.006 −0.007 0.003 0.010 −0.003 0.006
(0.010) (0.007) (0.007) (0.008) (0.008) (0.008) (0.007) (0.007) (0.007) (0.008) (0.008)Small −0.040∗∗∗ −0.002 −0.005 −0.091 −0.010 0.002 −0.013∗ −0.004 0.007 −0.010 −0.003
(0.011) (0.007) (0.008) (0.008) (0.008) (0.008) (0.007) (0.008) (0.007) (0.008) (0.008)
R2-with. 0.02 0.01 0.01 0.01 0.01 0.01 0.01 0.01 0.01 0.01 0.01R2-between 0.26 0.28 0.27 0.26 0.27 0.29 0.30 0.27 0.31 0.28 0.32R2-all 0.03 0.02 0.02 0.02 0.02 0.02 0.02 0.02 0.03 0.02 0.03
Impact (L − S) 0.057∗∗ 0.049∗∗ 0.038 0.095∗∗∗ 0.078∗∗∗ 0.059∗∗ 0.041 0.073∗∗∗ 0.061∗∗ 0.063∗∗ 0.065∗∗
N (firms) 3,946 4,180 4,295 3,496 3,902 3,960 3,880 3,888 3,874 4,175 3,905N (country) 54 54 54 54 54 54 54 54 54 54 54
(continued )
160T
he
Journ
alof
Fin
ance
Table VI—Continued
Panel C: Corruption Obstacles
If One Agent Proportion of PercentageAsks for Payments Contract Value of Senior
It Is Possible Proportion of That Must Management’sFirms Have Firms Know If “Additional to Find Others Revenues Paid Be Paid as Time Spent with
to Make in Advance Payments” to Get the as Bribes— “Payment” to GovernmentCorruption “Additional the Amount Are Made, Correct Annual Do Business Officials to
Corruption of Bank Payments” to of “Additional Services Are Treatment Figure for with the UnderstandObstacle Officials Get Things Payments” Delivered as without Each Firm Government Laws and
(1-4) (1-4) Done (6-1) (6-1) Agreed (1-6) Payment (1-6) (1-7) (1-6) Regulations (1-6)
Large −0.007 −0.007 0.017 0.018 0.004 0.011 −0.013 0.020 −0.003(0.012) (0.016) (0.011) (0.014) (0.014) (0.009) (0.015) (0.014) (0.011)
Medium −0.017∗ −0.012 −0.001 −0.002 −0.005 −0.001 −0.033∗∗∗ 0.006 −0.014∗
(0.010) (0.012) (0.007) (0.009) (0.011) (0.007) (0.010) (0.009) (0.008)Small −0.030∗∗∗ −0.024∗∗ −0.011 −0.009 −0.018∗ −0.009 −0.053∗∗∗ −0.001 −0.017∗
(0.010) (0.011) (0.007) (0.009) (0.011) (0.007) (0.009) (0.009) (0.009)
R2-with. 0.01 0.01 0.01 0.02 0.02 0.01 0.03 0.02 0.01R2-between 0.25 0.28 0.28 0.20 0.21 0.29 0.23 0.21 0.26R2-all 0.03 0.03 0.03 0.03 0.03 0.03 0.04 0.05 0.02
Impact (L − S) 0.060∗∗ 0.034 0.128∗∗∗ 0.084∗∗ 0.067∗ 0.052∗∗ 0.117∗∗∗ 0.047 0.029
N (firms) 3,969 3,545 3,896 2,293 2,255 3,581 2,805 1,712 3,963N (country) 54 54 53 53 53 53 53 52 54
∗, ∗∗, ∗∗∗ indicate significance levels of 10%, 5%, and 1%, respectively.
Financial and Legal Constraints to Growth 161
the 5% significance level. Largest firms are completely unaffected by collateralrequirements, bank bureaucracies, the need for special connections (probablybecause they already have them), banks’ lack of money, or any of the access is-sues. In contrast, medium-sized firms, and particularly small firms, are signifi-cantly and negatively affected by collateral requirements, bank paperwork andbureaucracy, high interest rates, the need for special connections with banks,banks’ lack of money to lend, and access to financing for leasing equipment.The smallest firms are also negatively affected by obstacles to gaining accessto export finance. The tests for the difference in the economic impact of specificfinancing obstacles on the largest and smallest firms confirm significant dif-ferences for most of the obstacles that significantly affect the growth of smallfirms. These results provide evidence that financial obstacles have a muchgreater impact on the operation and growth of small firms than on that of largefirms.15
Panel B of Table VI shows that the summary legal obstacle leaves large firmgrowth unaffected, but has a significant, negative impact on the growth rates ofmedium-sized and especially small firms. The effect on the growth rate of largefirms is insignificant, despite the fact that large firms report a higher level ofthe legal obstacle (Table III).
To evaluate the economic impact of each obstacle for each subsample of firmsby size, we multiply the estimated coefficient by the mean reported level ofthe obstacle. At the subsample means, the predicted effect of the summarylegal obstacle on annual firm growth is 2.8% for large firms, whereas it is5.7% for medium firms and 8.5% for small firms. The difference between thepredicted effects on large and small firms is statistically significant.16 Theseresults indicate that large firms are able to adjust to the inefficiencies of thelegal system. However, the same does not seem to be the case for small andmedium enterprises, which end up paying for the legal systems’ shortcomings interms of slower growth. Even looking at specific obstacles, which do not capturerelevant differences as well as the summary obstacles, there is an indicationthat large firms may be using legal inefficiencies to their advantage becausepoor enforcement of court decisions appears to contribute to large firm growthrates. However, looking at the other specific obstacles, we do not see such aneffect. For small firms, the affordability of the court system emerges as anobstacle, although the coefficient is significant only at 10%. The coefficients ofthe other more specific legal obstacles are not significantly different from 0.When we investigate whether this finding might be explained by the nonlinearcoding of the responses to the questions on specific features of the legal systemby rescaling the responses, the results are unchanged.
15 Firm size itself never has a significant coefficient in the regressions, consistent with simplecorrelations reported in Table II.
16 It is interesting to note that the estimates of the difference in the economic impact of specificlegal obstacles on large and small firms are generally statistically significant, even in cases wherethe coefficients of the specific obstacle are not statistically different from zero. That can occur if thecoefficients for large and small firms are of different sign or if the subsample means of the obstaclefor large and small firms differs sufficiently.
162 The Journal of Finance
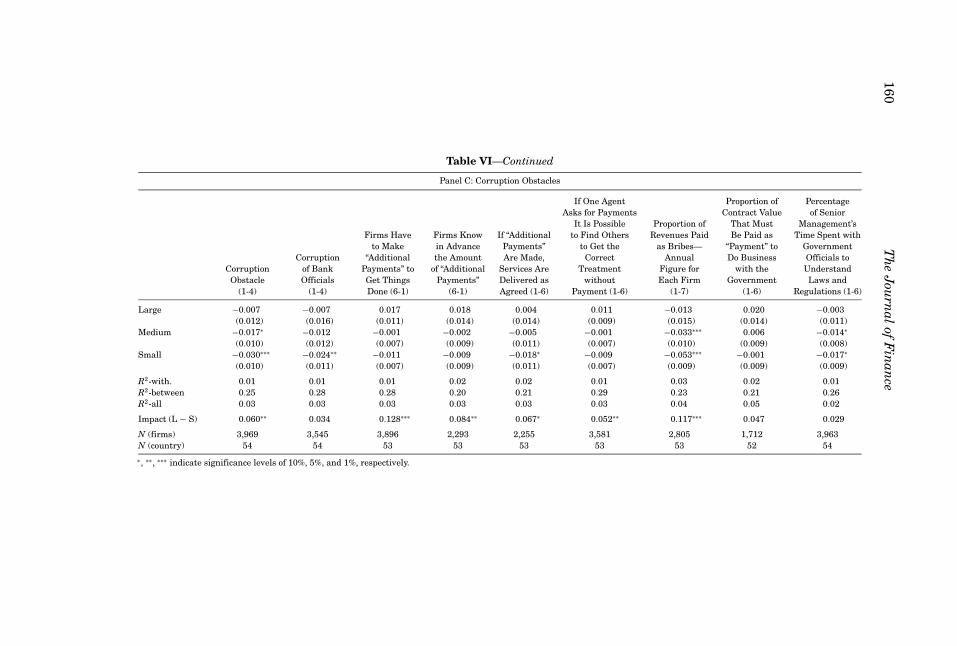
Panel C shows that again, it is the small and medium-sized firms that are neg-atively affected by corruption. The mean effects on firm growth are 1.6%, 4.1%,and 7.5% for large, medium-sized, and small firms, respectively. The differencebetween the economic impact of corruption for large and small firms at the sub-sample mean is statistically significant at the 5% level. None of the corruptionobstacles is significant for large firms. The corruption obstacle is negative butsignificant at 10% for medium-sized firms and negative and highly significantfor small firms.
When we look at specific obstacles, we again see that it is the small andmedium enterprises that are affected by bribes. Both coefficients are highly sig-nificant, although the impact on small firm growth is larger in magnitude. Thepercentage of a senior manager’s time spent with officials to understand regu-lations reduces the growth rates of both small and medium-sized enterprises,but only at a 10% level of significance. In addition, small firms are significantlyand negatively affected by variables that capture the corruption of bank offi-cials and uncertainty that services will be delivered even after bribes are paid.We do not find a significant relation between firms’ growth rates and the needto make bribe payments or the absence of recourse to honest officials, despitethese variables’ high reported ratings as obstacles. The tests of economic impactat the subsample means support the hypothesis that there is a more adverseeffect of corruption on small firms than on large firms.
Next, we address the issue of whether obstacles affect firms similarly in allcountries, or if their impact depends on the country’s level of financial andlegal development and corruption. To examine this issue, we focus on our threesummary obstacles and introduce into our regressions a term for the interactionof the summary obstacle with a variable proxying for institutional development.The institutional variable is Priv when financial obstacles are being analyzed,Laworder when the legal obstacle is entered, and Corrupt when the corruptionobstacle is entered. The coefficient of the interaction term measures whetherthe financial development of the economy has an effect on the relation betweenreported financial obstacles and firm growth. Thus, our specification is
Firm Growth = α + β1 Government + β2 Foreign + β3 Exporter
+ β4 Subsidized + β5 No. of Competitors
+ β6 Manufacturing + β7 Services + β8 Inflation
+ β9 GDP per capita + β10 GDP + β11 Growth
+ β12 Institution + β13 Obstacle
+ β14 Obstacle ∗ Institution + ε. (2)
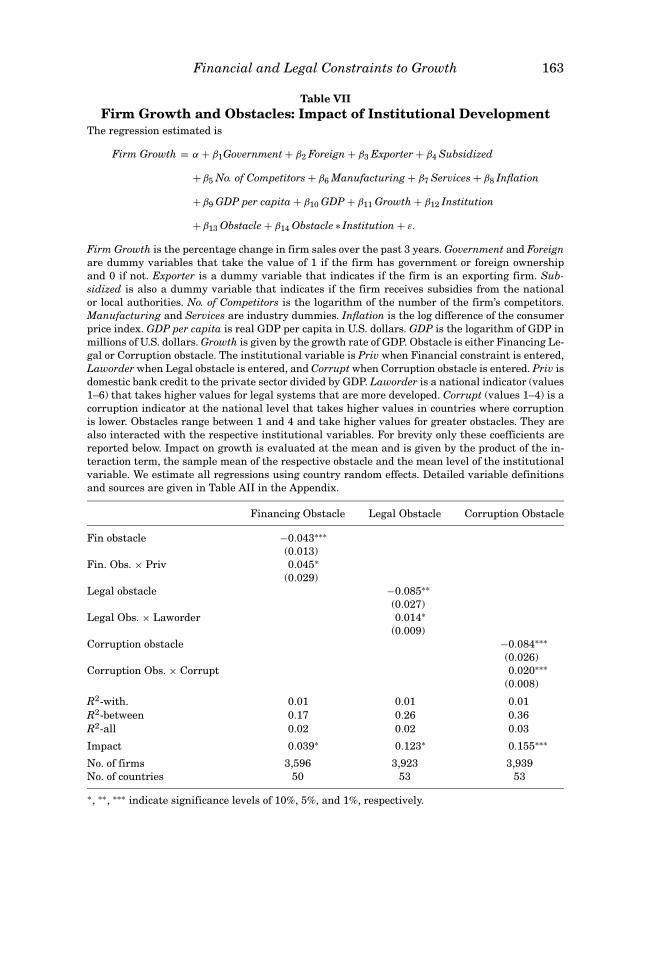
Table VII presents estimates of equation (2) for the summary financing, le-gal, and corruption obstacles. The results indicate that firms in financially andlegally developed countries with lower levels of corruption are less affectedby firm-level obstacles. In all three cases, the coefficient of the obstacle re-mains negative and significant, and the coefficient of the obstacle interacted
Financial and Legal Constraints to Growth 163
Table VIIFirm Growth and Obstacles: Impact of Institutional Development
The regression estimated is
Firm Growth = α + β1Government + β2 Foreign + β3 Exporter + β4 Subsidized
+ β5 No. of Competitors + β6 Manufacturing + β7 Services + β8 Inflation
+ β9 GDP per capita + β10 GDP + β11 Growth + β12 Institution
+ β13 Obstacle + β14 Obstacle ∗ Institution + ε.
Firm Growth is the percentage change in firm sales over the past 3 years. Government and Foreignare dummy variables that take the value of 1 if the firm has government or foreign ownershipand 0 if not. Exporter is a dummy variable that indicates if the firm is an exporting firm. Sub-sidized is also a dummy variable that indicates if the firm receives subsidies from the nationalor local authorities. No. of Competitors is the logarithm of the number of the firm’s competitors.Manufacturing and Services are industry dummies. Inflation is the log difference of the consumerprice index. GDP per capita is real GDP per capita in U.S. dollars. GDP is the logarithm of GDP inmillions of U.S. dollars. Growth is given by the growth rate of GDP. Obstacle is either Financing Le-gal or Corruption obstacle. The institutional variable is Priv when Financial constraint is entered,Laworder when Legal obstacle is entered, and Corrupt when Corruption obstacle is entered. Priv isdomestic bank credit to the private sector divided by GDP. Laworder is a national indicator (values1–6) that takes higher values for legal systems that are more developed. Corrupt (values 1–4) is acorruption indicator at the national level that takes higher values in countries where corruptionis lower. Obstacles range between 1 and 4 and take higher values for greater obstacles. They arealso interacted with the respective institutional variables. For brevity only these coefficients arereported below. Impact on growth is evaluated at the mean and is given by the product of the in-teraction term, the sample mean of the respective obstacle and the mean level of the institutionalvariable. We estimate all regressions using country random effects. Detailed variable definitionsand sources are given in Table AII in the Appendix.
Financing Obstacle Legal Obstacle Corruption Obstacle
Fin obstacle −0.043∗∗∗(0.013)
Fin. Obs. × Priv 0.045∗(0.029)
Legal obstacle −0.085∗∗(0.027)
Legal Obs. × Laworder 0.014∗(0.009)
Corruption obstacle −0.084∗∗∗(0.026)
Corruption Obs. × Corrupt 0.020∗∗∗(0.008)
R2-with. 0.01 0.01 0.01R2-between 0.17 0.26 0.36R2-all 0.02 0.02 0.03
Impact 0.039∗ 0.123∗ 0.155∗∗∗
No. of firms 3,596 3,923 3,939No. of countries 50 53 53
∗, ∗∗, ∗∗∗ indicate significance levels of 10%, 5%, and 1%, respectively.
164 The Journal of Finance
with the relevant development variable is positive and significantly differentfrom zero.17 Evaluating the coefficients at different levels of institutional de-velopment shows that in developed countries with Priv levels of 95% or higher,Laworder values of 6 and Corrupt values of 4 or higher, the impact of finan-cial, legal, or corruption obstacles on firm growth is not significantly differentfrom 0. In unreported regressions, we estimate equation (2) with each specificobstacle in turn. In separate regressions, we find positive and significant co-efficients for the interaction between the level of development and the lack ofmoney in the banking system, a consistent interpretation of laws, the amountof bribes to be paid, and the fraction of the contract value that must be paidto a government to secure the contract. These results also support the hy-pothesis that in countries where there is less corruption and better-developedfinancial and legal systems, firm growth is less constrained by the factors weexamine.
We next investigate whether the effect of financial and institutional de-velopment on growth varies with firm size. For each summary obstacle, weaugment our regression equations by interacting the summary obstacle witha measure of institutional development and with the firm-size dummies,Small, Medium, and Large. This gives us three triple interaction coefficientscorresponding to the three triple interactions, Obstacle ∗ Small ∗ Institution,Obstacle ∗ Medium ∗ Institution, and Obstacle ∗ Large ∗ Institution.
Significance tests of the coefficient of the triple interactions show whether amarginal change in institutional development affects the relation between thesummary obstacles and growth for small, medium, and large firms, respectively.We also test whether the marginal effect of a change in the country’s financialsystem affects the sensitivity of the firm’s growth to the financing obstacleequally for large and small firms. This difference in impact, Impact(L − S),is computed as the coefficient of the triple interaction term for large firmsevaluated at the mean level of Obstacle for the subsample of large firms minusthe coefficient of the triple interaction term for small firms evaluated at themean level of Obstacle for small firms.
Taking into account firm sizes reinforces the results reported in Table VII.Table VIII shows that the relation between financing, legal, and corruptionobstacles and the growth of firms of different sizes depends on the institutionalsetting.
The first column of Table VIII shows that small firms are again the mostseverely affected by financing obstacles. However, the interaction term of thefinancing obstacle with Priv and the small firm dummy variable has a positivesign and is significant, suggesting that a marginal development in a country’sfinancial system relaxes the financial constraints on small firms.
In column 2 of the table, we see that marginal improvements in legal effi-ciency translate into a relaxing of legal constraints for small and medium-sized
17 The variables Priv and Laworder are not significant when entered together with financingand legal obstacles. On the other hand, corruption enters positively and significantly in some spec-ifications, even when entered together with firm-level corruption obstacles. This result indicatesthat lack of corruption is associated with higher firm growth.
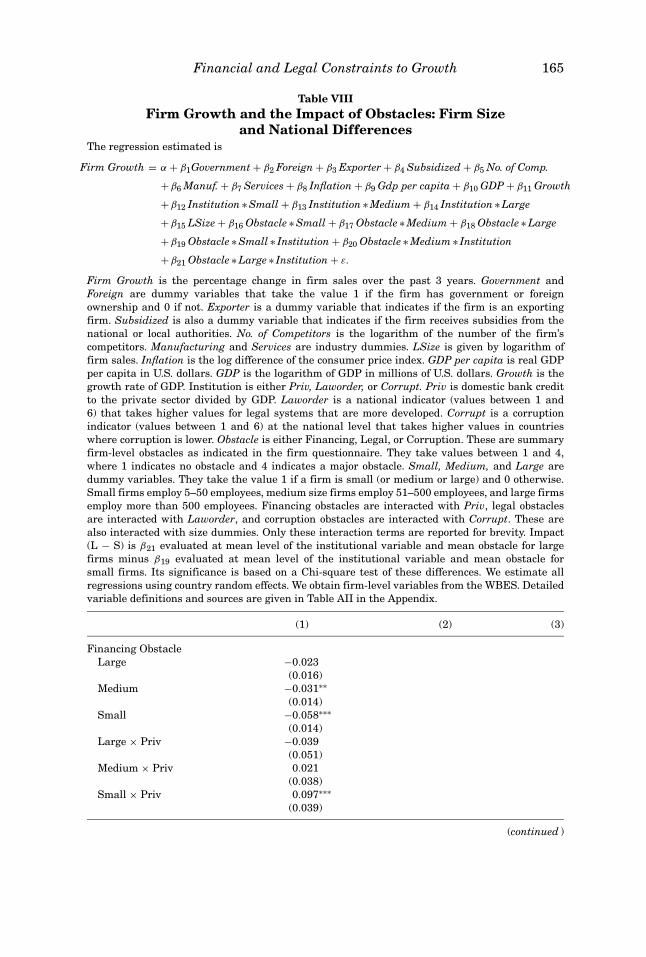
Financial and Legal Constraints to Growth 165
Table VIIIFirm Growth and the Impact of Obstacles: Firm Size
and National DifferencesThe regression estimated is
Firm Growth = α + β1Government + β2 Foreign + β3 Exporter + β4 Subsidized + β5 No. of Comp.
+ β6 Manuf. + β7 Services + β8 Inflation + β9 Gdp per capita + β10 GDP + β11 Growth
+ β12 Institution ∗ Small + β13 Institution ∗ Medium + β14 Institution ∗ Large
+ β15 LSize + β16 Obstacle ∗ Small + β17 Obstacle ∗ Medium + β18 Obstacle ∗ Large
+ β19 Obstacle ∗ Small ∗ Institution + β20 Obstacle ∗ Medium ∗ Institution
+ β21 Obstacle ∗ Large ∗ Institution + ε.
Firm Growth is the percentage change in firm sales over the past 3 years. Government andForeign are dummy variables that take the value 1 if the firm has government or foreignownership and 0 if not. Exporter is a dummy variable that indicates if the firm is an exportingfirm. Subsidized is also a dummy variable that indicates if the firm receives subsidies from thenational or local authorities. No. of Competitors is the logarithm of the number of the firm’scompetitors. Manufacturing and Services are industry dummies. LSize is given by logarithm offirm sales. Inflation is the log difference of the consumer price index. GDP per capita is real GDPper capita in U.S. dollars. GDP is the logarithm of GDP in millions of U.S. dollars. Growth is thegrowth rate of GDP. Institution is either Priv, Laworder, or Corrupt. Priv is domestic bank creditto the private sector divided by GDP. Laworder is a national indicator (values between 1 and6) that takes higher values for legal systems that are more developed. Corrupt is a corruptionindicator (values between 1 and 6) at the national level that takes higher values in countrieswhere corruption is lower. Obstacle is either Financing, Legal, or Corruption. These are summaryfirm-level obstacles as indicated in the firm questionnaire. They take values between 1 and 4,where 1 indicates no obstacle and 4 indicates a major obstacle. Small, Medium, and Large aredummy variables. They take the value 1 if a firm is small (or medium or large) and 0 otherwise.Small firms employ 5–50 employees, medium size firms employ 51–500 employees, and large firmsemploy more than 500 employees. Financing obstacles are interacted with Priv, legal obstaclesare interacted with Laworder, and corruption obstacles are interacted with Corrupt. These arealso interacted with size dummies. Only these interaction terms are reported for brevity. Impact(L − S) is β21 evaluated at mean level of the institutional variable and mean obstacle for largefirms minus β19 evaluated at mean level of the institutional variable and mean obstacle forsmall firms. Its significance is based on a Chi-square test of these differences. We estimate allregressions using country random effects. We obtain firm-level variables from the WBES. Detailedvariable definitions and sources are given in Table AII in the Appendix.
(1) (2) (3)
Financing ObstacleLarge −0.023
(0.016)Medium −0.031∗∗
(0.014)Small −0.058∗∗∗
(0.014)Large × Priv −0.039
(0.051)Medium × Priv 0.021
(0.038)Small × Priv 0.097∗∗∗
(0.039)
(continued )
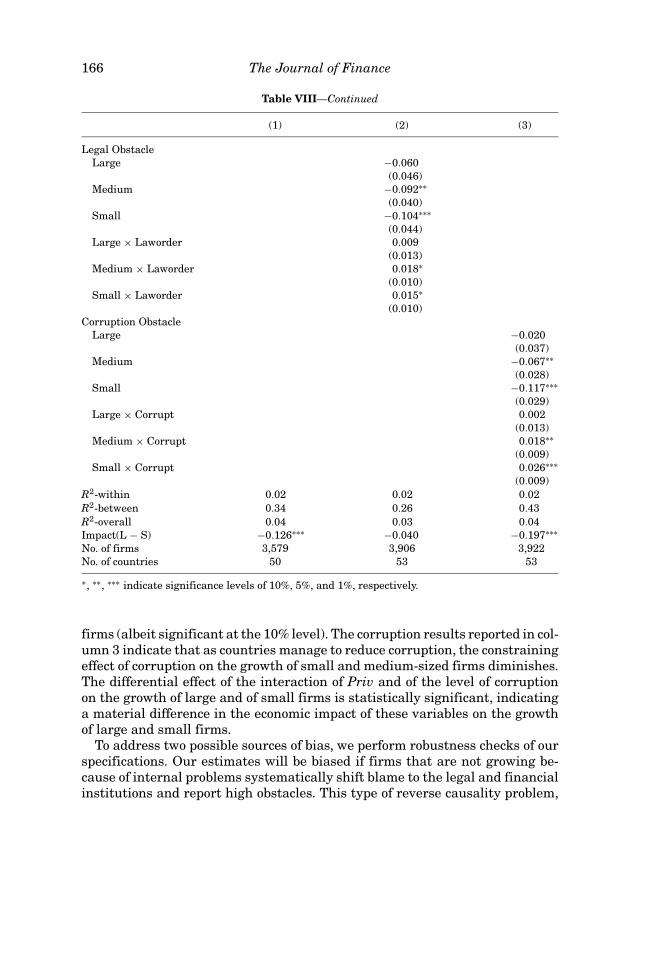
166 The Journal of Finance
Table VIII—Continued
(1) (2) (3)
Legal ObstacleLarge −0.060
(0.046)Medium −0.092∗∗
(0.040)Small −0.104∗∗∗
(0.044)Large × Laworder 0.009
(0.013)Medium × Laworder 0.018∗
(0.010)Small × Laworder 0.015∗
(0.010)Corruption Obstacle
Large −0.020(0.037)
Medium −0.067∗∗(0.028)
Small −0.117∗∗∗(0.029)
Large × Corrupt 0.002(0.013)
Medium × Corrupt 0.018∗∗(0.009)
Small × Corrupt 0.026∗∗∗(0.009)
R2-within 0.02 0.02 0.02R2-between 0.34 0.26 0.43R2-overall 0.04 0.03 0.04Impact(L − S) −0.126∗∗∗ −0.040 −0.197∗∗∗No. of firms 3,579 3,906 3,922No. of countries 50 53 53
∗, ∗∗, ∗∗∗ indicate significance levels of 10%, 5%, and 1%, respectively.
firms (albeit significant at the 10% level). The corruption results reported in col-umn 3 indicate that as countries manage to reduce corruption, the constrainingeffect of corruption on the growth of small and medium-sized firms diminishes.The differential effect of the interaction of Priv and of the level of corruptionon the growth of large and of small firms is statistically significant, indicatinga material difference in the economic impact of these variables on the growthof large and small firms.
To address two possible sources of bias, we perform robustness checks of ourspecifications. Our estimates will be biased if firms that are not growing be-cause of internal problems systematically shift blame to the legal and financialinstitutions and report high obstacles. This type of reverse causality problem,
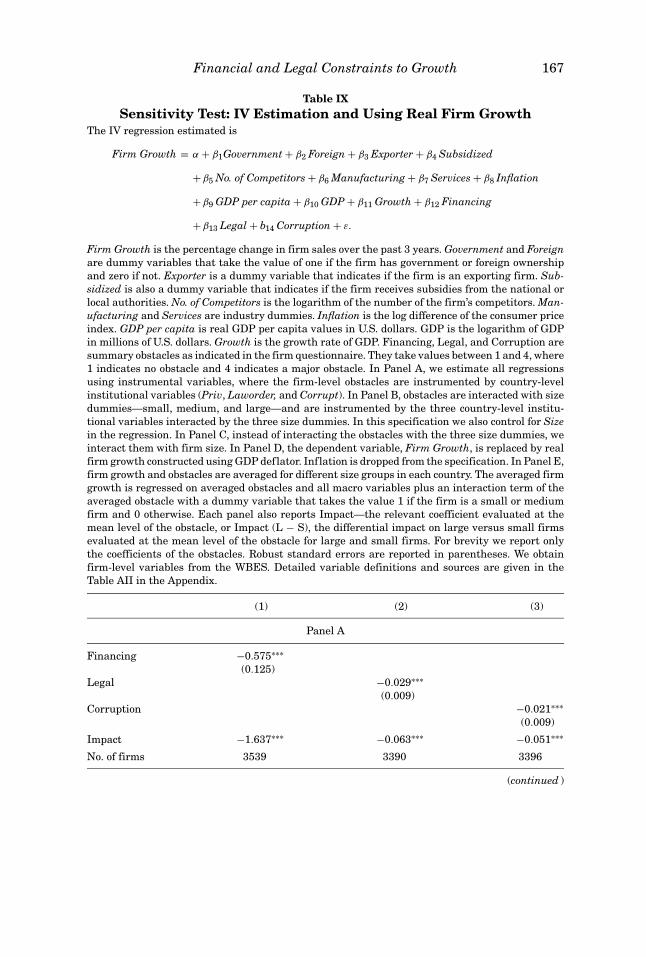
Financial and Legal Constraints to Growth 167
Table IXSensitivity Test: IV Estimation and Using Real Firm Growth
The IV regression estimated is
Firm Growth = α + β1Government + β2 Foreign + β3 Exporter + β4 Subsidized
+ β5 No. of Competitors + β6 Manufacturing + β7 Services + β8 Inflation
+ β9 GDP per capita + β10 GDP + β11 Growth + β12 Financing
+ β13 Legal + b14 Corruption + ε.
Firm Growth is the percentage change in firm sales over the past 3 years. Government and Foreignare dummy variables that take the value of one if the firm has government or foreign ownershipand zero if not. Exporter is a dummy variable that indicates if the firm is an exporting firm. Sub-sidized is also a dummy variable that indicates if the firm receives subsidies from the national orlocal authorities. No. of Competitors is the logarithm of the number of the firm’s competitors. Man-ufacturing and Services are industry dummies. Inflation is the log difference of the consumer priceindex. GDP per capita is real GDP per capita values in U.S. dollars. GDP is the logarithm of GDPin millions of U.S. dollars. Growth is the growth rate of GDP. Financing, Legal, and Corruption aresummary obstacles as indicated in the firm questionnaire. They take values between 1 and 4, where1 indicates no obstacle and 4 indicates a major obstacle. In Panel A, we estimate all regressionsusing instrumental variables, where the firm-level obstacles are instrumented by country-levelinstitutional variables (Priv, Laworder, and Corrupt). In Panel B, obstacles are interacted with sizedummies—small, medium, and large—and are instrumented by the three country-level institu-tional variables interacted by the three size dummies. In this specification we also control for Sizein the regression. In Panel C, instead of interacting the obstacles with the three size dummies, weinteract them with firm size. In Panel D, the dependent variable, Firm Growth, is replaced by realfirm growth constructed using GDP deflator. Inflation is dropped from the specification. In Panel E,firm growth and obstacles are averaged for different size groups in each country. The averaged firmgrowth is regressed on averaged obstacles and all macro variables plus an interaction term of theaveraged obstacle with a dummy variable that takes the value 1 if the firm is a small or mediumfirm and 0 otherwise. Each panel also reports Impact—the relevant coefficient evaluated at themean level of the obstacle, or Impact (L − S), the differential impact on large versus small firmsevaluated at the mean level of the obstacle for large and small firms. For brevity we report onlythe coefficients of the obstacles. Robust standard errors are reported in parentheses. We obtainfirm-level variables from the WBES. Detailed variable definitions and sources are given in theTable AII in the Appendix.
(1) (2) (3)
Panel A
Financing −0.575∗∗∗(0.125)
Legal −0.029∗∗∗(0.009)
Corruption −0.021∗∗∗(0.009)
Impact −1.637∗∗∗ −0.063∗∗∗ −0.051∗∗∗
No. of firms 3539 3390 3396
(continued )
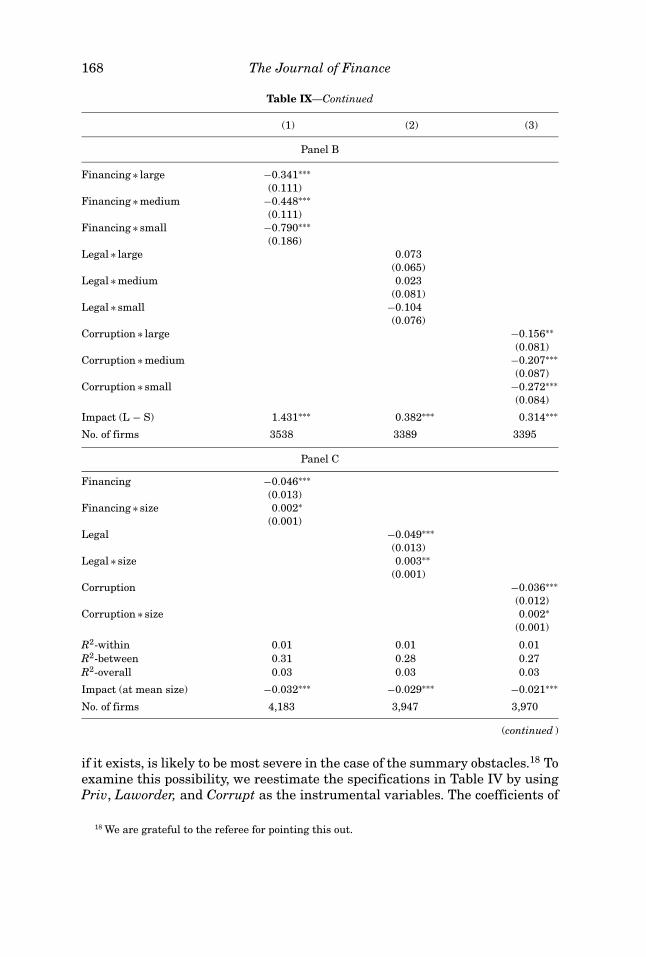
168 The Journal of Finance
Table IX—Continued
(1) (2) (3)
Panel B
Financing ∗ large −0.341∗∗∗(0.111)
Financing ∗ medium −0.448∗∗∗(0.111)
Financing ∗ small −0.790∗∗∗(0.186)
Legal ∗ large 0.073(0.065)
Legal ∗ medium 0.023(0.081)
Legal ∗ small −0.104(0.076)
Corruption ∗ large −0.156∗∗(0.081)
Corruption ∗ medium −0.207∗∗∗(0.087)
Corruption ∗ small −0.272∗∗∗(0.084)
Impact (L − S) 1.431∗∗∗ 0.382∗∗∗ 0.314∗∗∗
No. of firms 3538 3389 3395
Panel C
Financing −0.046∗∗∗(0.013)
Financing ∗ size 0.002∗(0.001)
Legal −0.049∗∗∗(0.013)
Legal ∗ size 0.003∗∗(0.001)
Corruption −0.036∗∗∗(0.012)
Corruption ∗ size 0.002∗(0.001)
R2-within 0.01 0.01 0.01R2-between 0.31 0.28 0.27R2-overall 0.03 0.03 0.03
Impact (at mean size) −0.032∗∗∗ −0.029∗∗∗ −0.021∗∗∗
No. of firms 4,183 3,947 3,970
(continued )
if it exists, is likely to be most severe in the case of the summary obstacles.18 Toexamine this possibility, we reestimate the specifications in Table IV by usingPriv, Laworder, and Corrupt as the instrumental variables. The coefficients of
18 We are grateful to the referee for pointing this out.
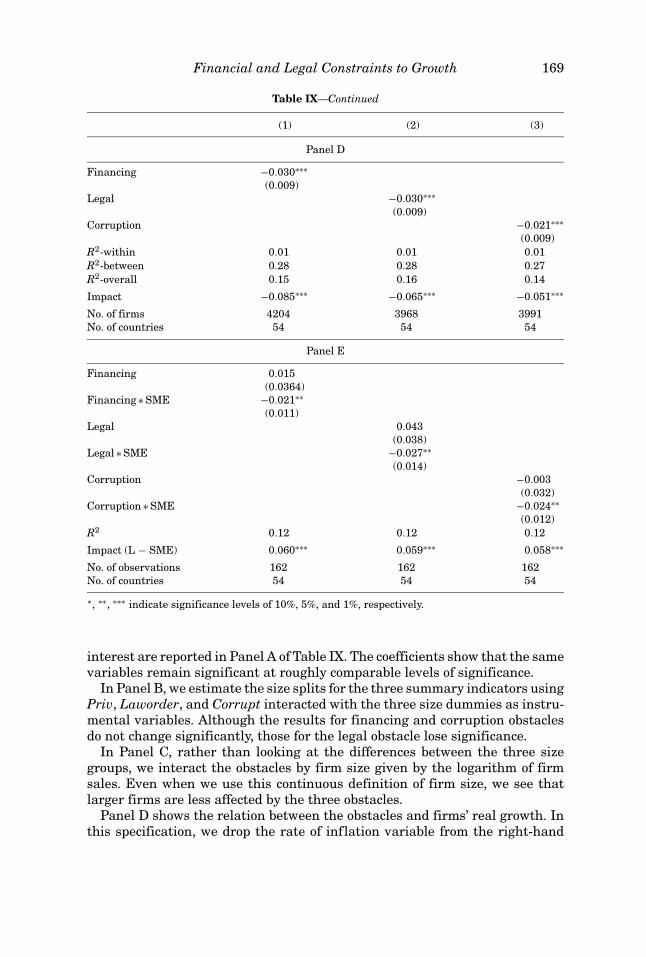
Financial and Legal Constraints to Growth 169
Table IX—Continued
(1) (2) (3)
Panel D
Financing −0.030∗∗∗(0.009)
Legal −0.030∗∗∗(0.009)
Corruption −0.021∗∗∗(0.009)
R2-within 0.01 0.01 0.01R2-between 0.28 0.28 0.27R2-overall 0.15 0.16 0.14
Impact −0.085∗∗∗ −0.065∗∗∗ −0.051∗∗∗
No. of firms 4204 3968 3991No. of countries 54 54 54
Panel E
Financing 0.015(0.0364)
Financing ∗ SME −0.021∗∗(0.011)
Legal 0.043(0.038)
Legal ∗ SME −0.027∗∗(0.014)
Corruption −0.003(0.032)
Corruption ∗ SME −0.024∗∗(0.012)
R2 0.12 0.12 0.12
Impact (L − SME) 0.060∗∗∗ 0.059∗∗∗ 0.058∗∗∗
No. of observations 162 162 162No. of countries 54 54 54
∗, ∗∗, ∗∗∗ indicate significance levels of 10%, 5%, and 1%, respectively.
interest are reported in Panel A of Table IX. The coefficients show that the samevariables remain significant at roughly comparable levels of significance.
In Panel B, we estimate the size splits for the three summary indicators usingPriv, Laworder, and Corrupt interacted with the three size dummies as instru-mental variables. Although the results for financing and corruption obstaclesdo not change significantly, those for the legal obstacle lose significance.
In Panel C, rather than looking at the differences between the three sizegroups, we interact the obstacles by firm size given by the logarithm of firmsales. Even when we use this continuous definition of firm size, we see thatlarger firms are less affected by the three obstacles.
Panel D shows the relation between the obstacles and firms’ real growth. Inthis specification, we drop the rate of inflation variable from the right-hand
170 The Journal of Finance
side. Inspection of Panel D shows that adjusting the dependent variable forinflation does not alter the results.
In Panel E, we examine the robustness of our findings when we averagethe variables by country for different firm sizes. This procedure provides analternative and more stringent test of the relation between firm growth andobstacles because it ignores the firm-level heterogeneity across firms in thesame country belonging to the same size classification. Because this aggrega-tion procedure reduces the degrees of freedom, in Panel D, we also reduce thenumber of independent variables and focus on the differences between SMEsand large firms. The results reported in Panel E are consistent with the firm-level results reported in earlier tables. There exist significant differences in theimpact of financial, legal, and corruption obstacles on SMEs and large firms.
III. Conclusions
In this paper, we investigate whether the financial, legal, and corruptionobstacles that firms report actually affect their growth rates. By making useof a unique survey database, we investigate a rich set of obstacles reported byfirms and directly test whether any of these reported obstacles are significantlycorrelated with firm growth rates. The database also allows us to focus ondifferences in firm size, since it has good coverage of small and medium-sizedenterprises in 54 countries. We investigate if the extent to which the firmsare constrained by different obstacles depends on the level of development ofthe financial and legal systems. We are particularly interested in investigatingthe previously unexamined national level of corruption and its impact on firmgrowth.
Our results indicate that the extent to which financial and legal underde-velopment and corruption constrain a firm’s growth depends very much on afirm’s size. We show that it is the smallest firms that are consistently the mostadversely affected by all obstacles.
Taking into account national differences between financial and legal devel-opment and corruption, we see that firms that operate in underdeveloped sys-tems with higher levels of corruption are affected by all obstacles to a greaterextent than firms operating in countries with less corruption. We also see thata marginal development in the financial and legal system and a reduction incorruption helps relax the constraints for the small and medium-sized firms,which are the most constrained.
All three obstacles—financial, legal, and corruption—do affect firm growthrates adversely. But not all specific obstacles are equally important, and theones that affect firm growth are not necessarily the ones rated highest by thefirms themselves. When we look at individual financing obstacles, we see thatdifficulties in dealing with banks, such as bank paperwork and bureaucracies,and the need to have special connections with banks, do constrain firm growth.Collateral requirements and certain access issues—such as financing for leas-ing equipment—also turn out to be significantly constraining. Macroeconomicissues captured by high interest rates and lack of money in the banking sys-tem also significantly reduce firm growth rates. Further, these effects remain
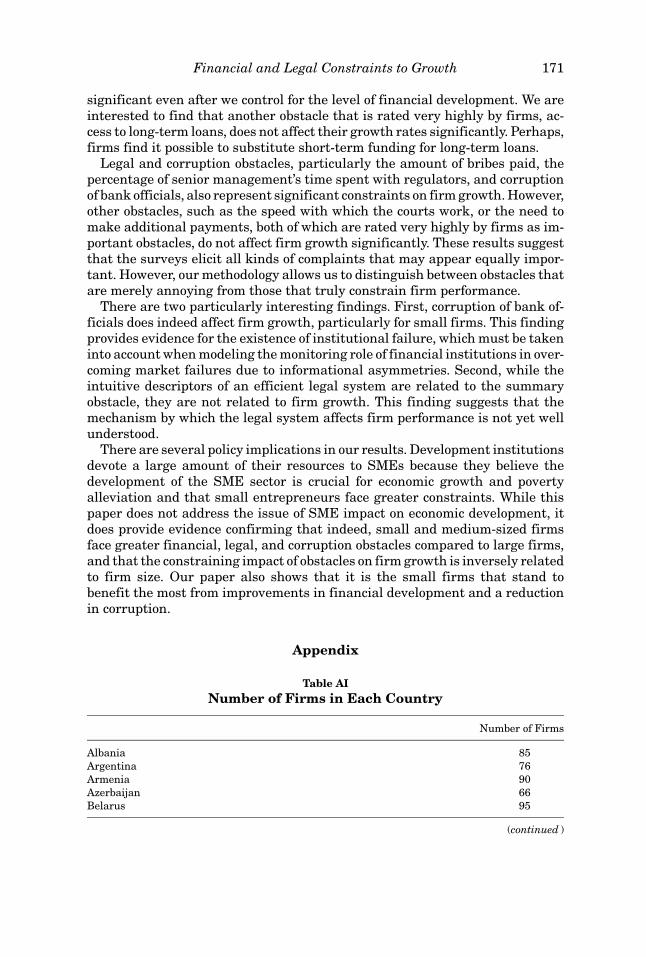
Financial and Legal Constraints to Growth 171
significant even after we control for the level of financial development. We areinterested to find that another obstacle that is rated very highly by firms, ac-cess to long-term loans, does not affect their growth rates significantly. Perhaps,firms find it possible to substitute short-term funding for long-term loans.
Legal and corruption obstacles, particularly the amount of bribes paid, thepercentage of senior management’s time spent with regulators, and corruptionof bank officials, also represent significant constraints on firm growth. However,other obstacles, such as the speed with which the courts work, or the need tomake additional payments, both of which are rated very highly by firms as im-portant obstacles, do not affect firm growth significantly. These results suggestthat the surveys elicit all kinds of complaints that may appear equally impor-tant. However, our methodology allows us to distinguish between obstacles thatare merely annoying from those that truly constrain firm performance.
There are two particularly interesting findings. First, corruption of bank of-ficials does indeed affect firm growth, particularly for small firms. This findingprovides evidence for the existence of institutional failure, which must be takeninto account when modeling the monitoring role of financial institutions in over-coming market failures due to informational asymmetries. Second, while theintuitive descriptors of an efficient legal system are related to the summaryobstacle, they are not related to firm growth. This finding suggests that themechanism by which the legal system affects firm performance is not yet wellunderstood.
There are several policy implications in our results. Development institutionsdevote a large amount of their resources to SMEs because they believe thedevelopment of the SME sector is crucial for economic growth and povertyalleviation and that small entrepreneurs face greater constraints. While thispaper does not address the issue of SME impact on economic development, itdoes provide evidence confirming that indeed, small and medium-sized firmsface greater financial, legal, and corruption obstacles compared to large firms,and that the constraining impact of obstacles on firm growth is inversely relatedto firm size. Our paper also shows that it is the small firms that stand tobenefit the most from improvements in financial development and a reductionin corruption.
Appendix
Table AINumber of Firms in Each Country
Number of Firms
Albania 85Argentina 76Armenia 90Azerbaijan 66Belarus 95
(continued )
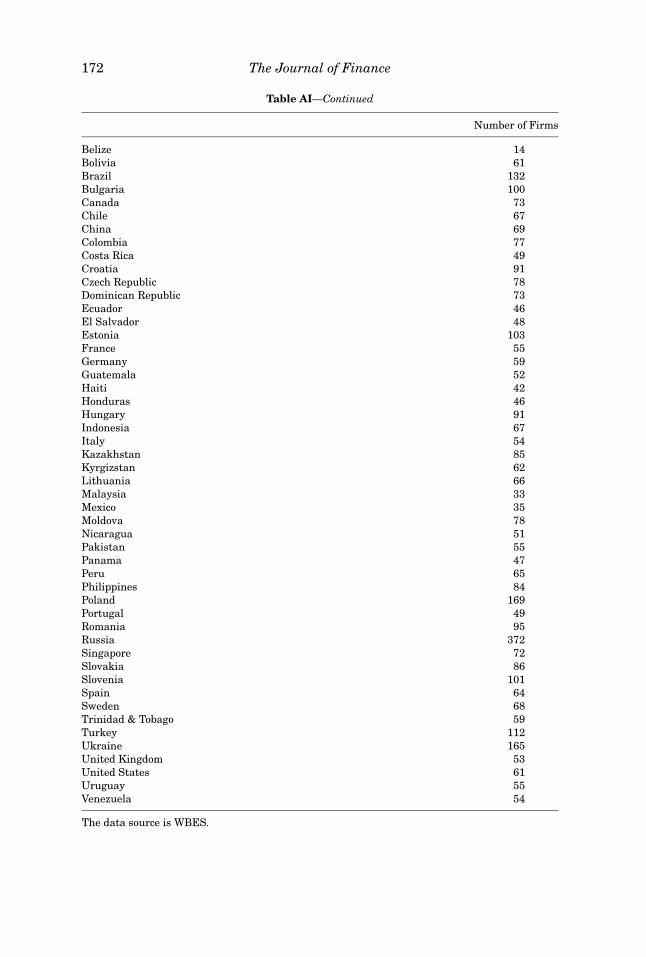
172 The Journal of Finance
Table AI—Continued
Number of Firms
Belize 14Bolivia 61Brazil 132Bulgaria 100Canada 73Chile 67China 69Colombia 77Costa Rica 49Croatia 91Czech Republic 78Dominican Republic 73Ecuador 46El Salvador 48Estonia 103France 55Germany 59Guatemala 52Haiti 42Honduras 46Hungary 91Indonesia 67Italy 54Kazakhstan 85Kyrgizstan 62Lithuania 66Malaysia 33Mexico 35Moldova 78Nicaragua 51Pakistan 55Panama 47Peru 65Philippines 84Poland 169Portugal 49Romania 95Russia 372Singapore 72Slovakia 86Slovenia 101Spain 64Sweden 68Trinidad & Tobago 59Turkey 112Ukraine 165United Kingdom 53United States 61Uruguay 55Venezuela 54
The data source is WBES.
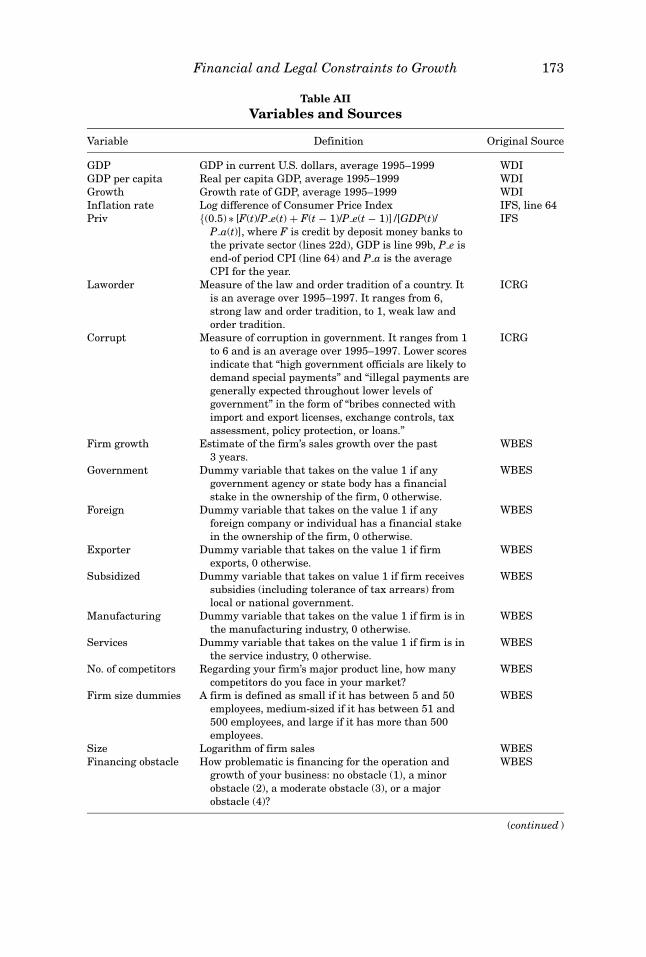
Financial and Legal Constraints to Growth 173
Table AIIVariables and Sources
Variable Definition Original Source
GDP GDP in current U.S. dollars, average 1995–1999 WDIGDP per capita Real per capita GDP, average 1995–1999 WDIGrowth Growth rate of GDP, average 1995–1999 WDIInflation rate Log difference of Consumer Price Index IFS, line 64Priv {(0.5) ∗ [F(t)/P e(t) + F(t − 1)/P e(t − 1)] /[GDP(t)/
P a(t)], where F is credit by deposit money banks tothe private sector (lines 22d), GDP is line 99b, P e isend-of period CPI (line 64) and P a is the averageCPI for the year.
IFS
Laworder Measure of the law and order tradition of a country. Itis an average over 1995–1997. It ranges from 6,strong law and order tradition, to 1, weak law andorder tradition.
ICRG
Corrupt Measure of corruption in government. It ranges from 1to 6 and is an average over 1995–1997. Lower scoresindicate that “high government officials are likely todemand special payments” and “illegal payments aregenerally expected throughout lower levels ofgovernment” in the form of “bribes connected withimport and export licenses, exchange controls, taxassessment, policy protection, or loans.”
ICRG
Firm growth Estimate of the firm’s sales growth over the past3 years.
WBES
Government Dummy variable that takes on the value 1 if anygovernment agency or state body has a financialstake in the ownership of the firm, 0 otherwise.
WBES
Foreign Dummy variable that takes on the value 1 if anyforeign company or individual has a financial stakein the ownership of the firm, 0 otherwise.
WBES
Exporter Dummy variable that takes on the value 1 if firmexports, 0 otherwise.
WBES
Subsidized Dummy variable that takes on value 1 if firm receivessubsidies (including tolerance of tax arrears) fromlocal or national government.
WBES
Manufacturing Dummy variable that takes on the value 1 if firm is inthe manufacturing industry, 0 otherwise.
WBES
Services Dummy variable that takes on the value 1 if firm is inthe service industry, 0 otherwise.
WBES
No. of competitors Regarding your firm’s major product line, how manycompetitors do you face in your market?
WBES
Firm size dummies A firm is defined as small if it has between 5 and 50employees, medium-sized if it has between 51 and500 employees, and large if it has more than 500employees.
WBES
Size Logarithm of firm sales WBESFinancing obstacle How problematic is financing for the operation and
growth of your business: no obstacle (1), a minorobstacle (2), a moderate obstacle (3), or a majorobstacle (4)?
WBES
(continued )
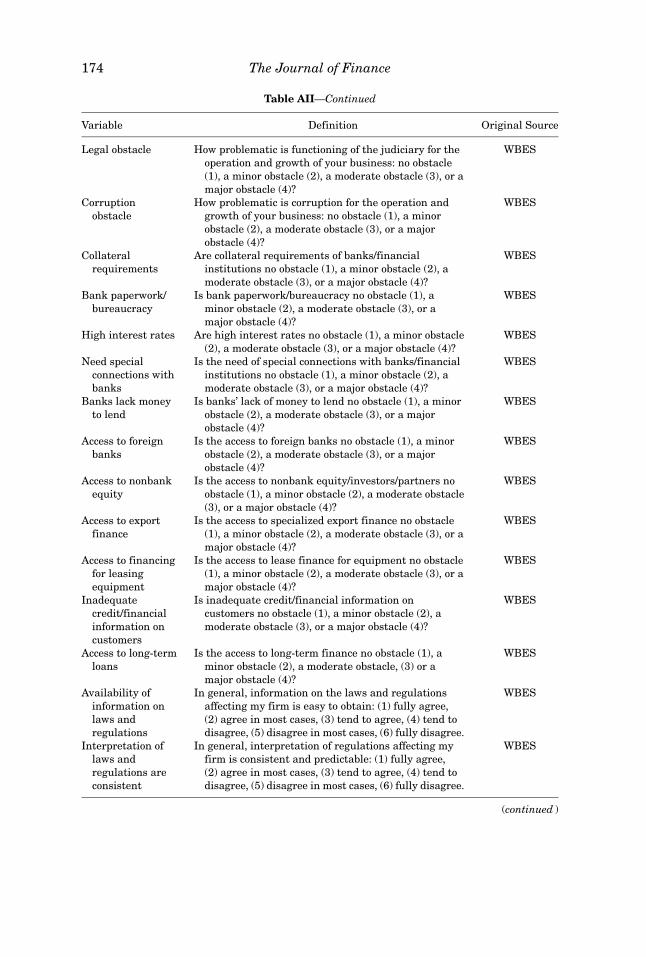
174 The Journal of Finance
Table AII—Continued
Variable Definition Original Source
Legal obstacle How problematic is functioning of the judiciary for theoperation and growth of your business: no obstacle(1), a minor obstacle (2), a moderate obstacle (3), or amajor obstacle (4)?
WBES
Corruptionobstacle
How problematic is corruption for the operation andgrowth of your business: no obstacle (1), a minorobstacle (2), a moderate obstacle (3), or a majorobstacle (4)?
WBES
Collateralrequirements
Are collateral requirements of banks/financialinstitutions no obstacle (1), a minor obstacle (2), amoderate obstacle (3), or a major obstacle (4)?
WBES
Bank paperwork/bureaucracy
Is bank paperwork/bureaucracy no obstacle (1), aminor obstacle (2), a moderate obstacle (3), or amajor obstacle (4)?
WBES
High interest rates Are high interest rates no obstacle (1), a minor obstacle(2), a moderate obstacle (3), or a major obstacle (4)?
WBES
Need specialconnections withbanks
Is the need of special connections with banks/financialinstitutions no obstacle (1), a minor obstacle (2), amoderate obstacle (3), or a major obstacle (4)?
WBES
Banks lack moneyto lend
Is banks’ lack of money to lend no obstacle (1), a minorobstacle (2), a moderate obstacle (3), or a majorobstacle (4)?
WBES
Access to foreignbanks
Is the access to foreign banks no obstacle (1), a minorobstacle (2), a moderate obstacle (3), or a majorobstacle (4)?
WBES
Access to nonbankequity
Is the access to nonbank equity/investors/partners noobstacle (1), a minor obstacle (2), a moderate obstacle(3), or a major obstacle (4)?
WBES
Access to exportfinance
Is the access to specialized export finance no obstacle(1), a minor obstacle (2), a moderate obstacle (3), or amajor obstacle (4)?
WBES
Access to financingfor leasingequipment
Is the access to lease finance for equipment no obstacle(1), a minor obstacle (2), a moderate obstacle (3), or amajor obstacle (4)?
WBES
Inadequatecredit/financialinformation oncustomers
Is inadequate credit/financial information oncustomers no obstacle (1), a minor obstacle (2), amoderate obstacle (3), or a major obstacle (4)?
WBES
Access to long-termloans
Is the access to long-term finance no obstacle (1), aminor obstacle (2), a moderate obstacle, (3) or amajor obstacle (4)?
WBES
Availability ofinformation onlaws andregulations
In general, information on the laws and regulationsaffecting my firm is easy to obtain: (1) fully agree,(2) agree in most cases, (3) tend to agree, (4) tend todisagree, (5) disagree in most cases, (6) fully disagree.
WBES
Interpretation oflaws andregulations areconsistent
In general, interpretation of regulations affecting myfirm is consistent and predictable: (1) fully agree,(2) agree in most cases, (3) tend to agree, (4) tend todisagree, (5) disagree in most cases, (6) fully disagree.
WBES
(continued )
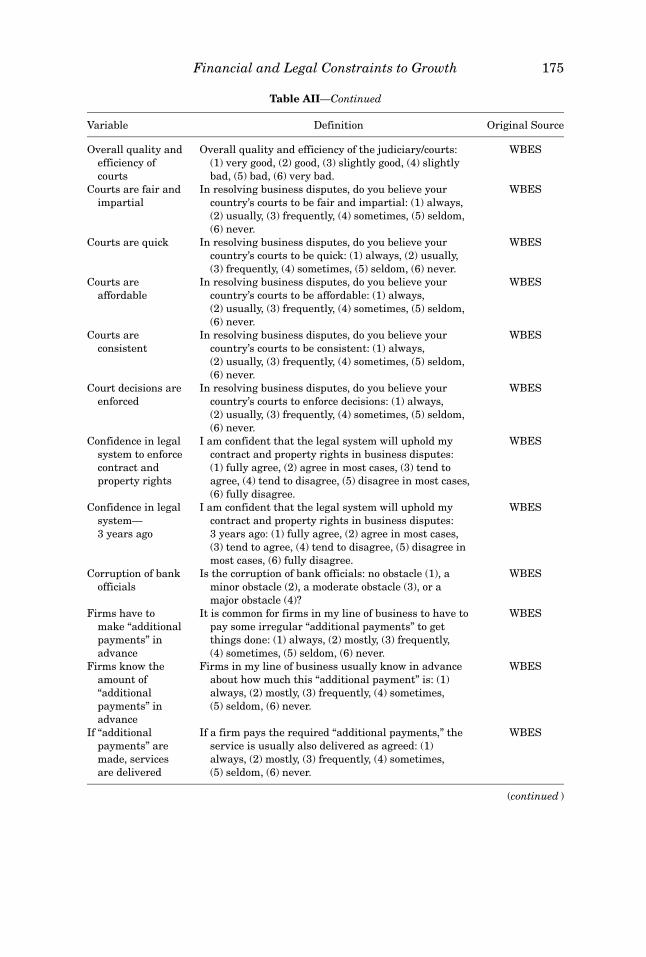
Financial and Legal Constraints to Growth 175
Table AII—Continued
Variable Definition Original Source
Overall quality andefficiency ofcourts
Overall quality and efficiency of the judiciary/courts:(1) very good, (2) good, (3) slightly good, (4) slightlybad, (5) bad, (6) very bad.
WBES
Courts are fair andimpartial
In resolving business disputes, do you believe yourcountry’s courts to be fair and impartial: (1) always,(2) usually, (3) frequently, (4) sometimes, (5) seldom,(6) never.
WBES
Courts are quick In resolving business disputes, do you believe yourcountry’s courts to be quick: (1) always, (2) usually,(3) frequently, (4) sometimes, (5) seldom, (6) never.
WBES
Courts areaffordable
In resolving business disputes, do you believe yourcountry’s courts to be affordable: (1) always,(2) usually, (3) frequently, (4) sometimes, (5) seldom,(6) never.
WBES
Courts areconsistent
In resolving business disputes, do you believe yourcountry’s courts to be consistent: (1) always,(2) usually, (3) frequently, (4) sometimes, (5) seldom,(6) never.
WBES
Court decisions areenforced
In resolving business disputes, do you believe yourcountry’s courts to enforce decisions: (1) always,(2) usually, (3) frequently, (4) sometimes, (5) seldom,(6) never.
WBES
Confidence in legalsystem to enforcecontract andproperty rights
I am confident that the legal system will uphold mycontract and property rights in business disputes:(1) fully agree, (2) agree in most cases, (3) tend toagree, (4) tend to disagree, (5) disagree in most cases,(6) fully disagree.
WBES
Confidence in legalsystem—3 years ago
I am confident that the legal system will uphold mycontract and property rights in business disputes:3 years ago: (1) fully agree, (2) agree in most cases,(3) tend to agree, (4) tend to disagree, (5) disagree inmost cases, (6) fully disagree.
WBES
Corruption of bankofficials
Is the corruption of bank officials: no obstacle (1), aminor obstacle (2), a moderate obstacle (3), or amajor obstacle (4)?
WBES
Firms have tomake “additionalpayments” inadvance
It is common for firms in my line of business to have topay some irregular “additional payments” to getthings done: (1) always, (2) mostly, (3) frequently,(4) sometimes, (5) seldom, (6) never.
WBES
Firms know theamount of“additionalpayments” inadvance
Firms in my line of business usually know in advanceabout how much this “additional payment” is: (1)always, (2) mostly, (3) frequently, (4) sometimes,(5) seldom, (6) never.
WBES
If “additionalpayments” aremade, servicesare delivered
If a firm pays the required “additional payments,” theservice is usually also delivered as agreed: (1)always, (2) mostly, (3) frequently, (4) sometimes,(5) seldom, (6) never.
WBES
(continued )
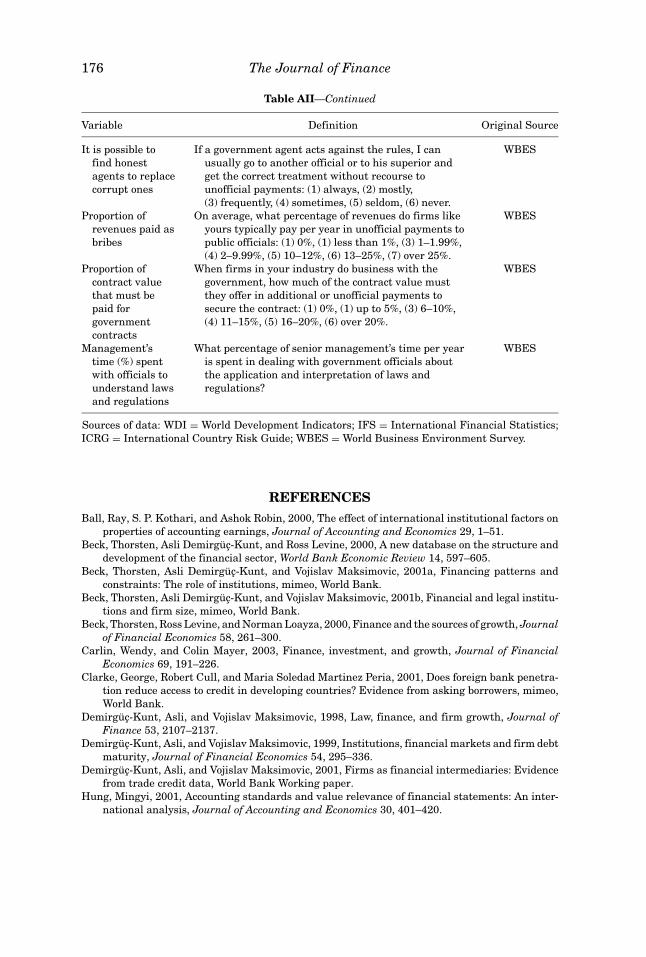
176 The Journal of Finance
Table AII—Continued
Variable Definition Original Source
It is possible tofind honestagents to replacecorrupt ones
If a government agent acts against the rules, I canusually go to another official or to his superior andget the correct treatment without recourse tounofficial payments: (1) always, (2) mostly,(3) frequently, (4) sometimes, (5) seldom, (6) never.
WBES
Proportion ofrevenues paid asbribes
On average, what percentage of revenues do firms likeyours typically pay per year in unofficial payments topublic officials: (1) 0%, (1) less than 1%, (3) 1–1.99%,(4) 2–9.99%, (5) 10–12%, (6) 13–25%, (7) over 25%.
WBES
Proportion ofcontract valuethat must bepaid forgovernmentcontracts
When firms in your industry do business with thegovernment, how much of the contract value mustthey offer in additional or unofficial payments tosecure the contract: (1) 0%, (1) up to 5%, (3) 6–10%,(4) 11–15%, (5) 16–20%, (6) over 20%.
WBES
Management’stime (%) spentwith officials tounderstand lawsand regulations
What percentage of senior management’s time per yearis spent in dealing with government officials aboutthe application and interpretation of laws andregulations?
WBES
Sources of data: WDI = World Development Indicators; IFS = International Financial Statistics;ICRG = International Country Risk Guide; WBES = World Business Environment Survey.
REFERENCESBall, Ray, S. P. Kothari, and Ashok Robin, 2000, The effect of international institutional factors on
properties of accounting earnings, Journal of Accounting and Economics 29, 1–51.Beck, Thorsten, Asli Demirguc-Kunt, and Ross Levine, 2000, A new database on the structure and
development of the financial sector, World Bank Economic Review 14, 597–605.Beck, Thorsten, Asli Demirguc-Kunt, and Vojislav Maksimovic, 2001a, Financing patterns and
constraints: The role of institutions, mimeo, World Bank.Beck, Thorsten, Asli Demirguc-Kunt, and Vojislav Maksimovic, 2001b, Financial and legal institu-
tions and firm size, mimeo, World Bank.Beck, Thorsten, Ross Levine, and Norman Loayza, 2000, Finance and the sources of growth, Journal
of Financial Economics 58, 261–300.Carlin, Wendy, and Colin Mayer, 2003, Finance, investment, and growth, Journal of Financial
Economics 69, 191–226.Clarke, George, Robert Cull, and Maria Soledad Martinez Peria, 2001, Does foreign bank penetra-
tion reduce access to credit in developing countries? Evidence from asking borrowers, mimeo,World Bank.
Demirguc-Kunt, Asli, and Vojislav Maksimovic, 1998, Law, finance, and firm growth, Journal ofFinance 53, 2107–2137.
Demirguc-Kunt, Asli, and Vojislav Maksimovic, 1999, Institutions, financial markets and firm debtmaturity, Journal of Financial Economics 54, 295–336.
Demirguc-Kunt, Asli, and Vojislav Maksimovic, 2001, Firms as financial intermediaries: Evidencefrom trade credit data, World Bank Working paper.
Hung, Mingyi, 2001, Accounting standards and value relevance of financial statements: An inter-national analysis, Journal of Accounting and Economics 30, 401–420.
Financial and Legal Constraints to Growth 177
Khanna, Tarun, and Krishna Palepu, 2000, Is group affiliation profitable in emerging markets?An analysis of diversified Indian business groups, Journal of Finance 55, 867–891.
King, Robert G., and Ross Levine, 1993, Finance and growth: Schumpeter might be right, QuarterlyJournal of Economics 108, 717–738.
La Porta, Rafael, Florencio Lopez-de-Silanes, Andrei Shleifer, and Robert W. Vishny, 1998, Lawand finance, Journal of Political Economy 106, 1113–1155.
Levine, Ross, and Sara Zervos, 1998, Stock markets, banks, and economic growth, American Eco-nomic Review 88, 537–558.
Love, Inessa, 2001, Financial development and financing constraints: International evidence fromthe structural investment model, World Bank Working paper No. 2694.
Maksimovic, Vojislav, and Gordon Phillips, 2002, Do conglomerate firms allocate resources ineffi-ciently? Evidence from plant-level data, Journal of Finance 57, 721–767
Mauro, Paolo, 1996, The effects of corruption on growth, investment and government expenditure,IMF Working paper 96/98.
Rajan, Raghuram G., Henri Servaes, and Luigi Zingales, 2000, The cost of diversity: The diversifi-cation discount and inefficient investment, Journal of Finance 55, 35–80.
Rajan, Raghuram G., and Luigi Zingales, 1998a, Financial dependence and growth, AmericanEconomic Review 88, 559–587.
Rajan, Raghuram G., and Luigi Zingales, 1998b, Which capitalism? Lessons from the East Asiancrisis, Journal of Applied Corporate Finance 11, 40–48.
Scharfstein, David S., and Jeremy C. Stein, 2000, The dark side of internal capital markets: Divi-sional rent-seeking and inefficient investment, Journal of Finance 55, 2537–2564.
Schiffer, Mirjam, and Beatrice Weder, 2001, Firm size and the business environment: Worldwidesurvey results, IFC Discussion Paper number 43.
World Bank, 2002, SME. World Bank Froup Review of Small Business Activities. Washington, DC:World Bank.
Wurgler, Jeffrey, 2000, Financial markets and the allocation of capital, Journal of Financial Eco-nomics 58, 187–214.