Embed Size (px)
Citation preview
Copyright 2005. Tellus Venture Associates. All Rights Reserved.
Financial Analysis of FTTH System Proposals: An Operations-Based Approach
Presented to the Fiber to the Home Council
5 October 2005
By Stephen A. Blum Tellus Venture Associates
Stephen A. Blum President Tellus Venture Associates 5100 Coe Avenue #186 Seaside, California 93955 Phone: 1-831-582-0700 Email: [email protected] Web: www.tellusventure.com
Page 1 Tellus Venture Associates 5 October 2005
Introduction The first definitive step usually taken by a community, whether it is a new development, municipality, homeowners association, condominium or utility district, when it seeks to build a fiber to the home (FTTH) system is to issue a request to potential vendors. Typically, a communications engineering and construction firm will then put together a team of network equipment manufacturers, video and data system suppliers and other vendors to present a proposal. These bids come with varying degrees of detail, but a common feature is that the only figures presented are capital construction costs, and not ongoing operational expenses. Some proposals may discuss operating costs and, particularly in the case of IP video providers, even offer outsourced operational solutions. Maintenance agreements are sometimes discussed as well. Nevertheless, the amount of the actual bid will almost always reflect the system construction cost alone. The resulting due diligence and evaluation conducted by the community will focus on those bids, and on the quality and applicability of the solutions and equipment proposed. Then, pricing and items will be analyzed, in order to get a true, "apples to apples" comparison of the bids. But if the analysis stops there, the choice of bidder will be made on false assumptions that could have significant negative effects on the future financial viability of the FTTH system. Different FTTH network, video and data solutions from different manufacturers have different operating characteristics, capabilities and costs. Bids typically do not include information about those costs because the proposers are in the business of manufacturing equipment and constructing networks. Even when the companies involved have sister divisions that provide ongoing services, the focus is on capital construction because it is what request for proposals generally require and what the people who respond to such proposals do for a living. In this paper, we will show how to extend the analysis of bids to include operating costs and revenue projections, to gain not just an apples to apples picture, but a complete apple pie shop to apple pie shop comparison. Methodology The six hypothetical proposals evaluated in this paper are derived from quotes provided by bidders on actual projects. Significant changes were made to preserve confidentiality. Some bids were combined into hybrids, by mixing and matching elements from various proposals and projects. Others are structured largely as proposed, but with actual bid amounts and system parameters changed significantly. It is not the purpose of this paper to present an analysis of any particular project, bid or proposed FTTH solution, but rather to illustrate a methodology for doing so.
Page 2 Tellus Venture Associates 5 October 2005
The financial analysis began by creating a business model that incorporated the capital and operating expenses associated with each of the six hypothetical proposals, as well as subscriber revenue, current and anticipated operator-specific costs, historical industry data, and additional research conducted by the author. In estimating costs and revenue, this fiber-to-the-home business model made a number of assumptions, with the objective of producing a conservative analysis:
• The subscription rates for optional television services are based on industry figures and actual experience. Growth rates of up to 5% were assumed in the base case, which is lower than industry experience. Revenue figures were based on current experience and low-end industry figures.
• The Internet subscription rate of 55% is based on current market data, as well as an
assessment of incumbent telephone companies' current offerings. • The telephone service subscription rate of 36% is based on conservative industry
figures. Long-distance service can be offered to customers whether or not they subscribe to a system-provided telephone line.
• All figures are in constant dollars, except programming costs, which are assumed to
grow 4% faster than inflation. • An interest rate of 7% is assumed.
Any given assumption is certainly open to discussion and debate. However, since the purpose of the model is to compare the relative financial performance of various proposals, it is sufficient at this stage if these assumptions fall within a general, plausible range of alternatives. It is important to keep the cost of conducting this sort of analysis in line with the value of the benefit produced, and to ensure the results cut through the clutter of information, rather than add to it. Once the relative merits of the proposals have been evaluated, assumptions can be developed that better fit the specific parameters of the preferred solution, for the purposes of further financial analysis. Although it is tempting to try to be as detailed as possible from the very beginning, and to consider as many scenarios and options as possible, models can quickly become overwhelmingly complex and prohibitively expensive for the client. The goal is to break "analysis paralysis," not feed it. The model first calculates projected revenue in a given year, then subtracts the wholesale cost of services, such as programming, that is resold to subscribers. The costs of running the system are then subtracted from this net revenue figure to calculate operating income (or loss, as the case may be).
Page 3 Tellus Venture Associates 5 October 2005
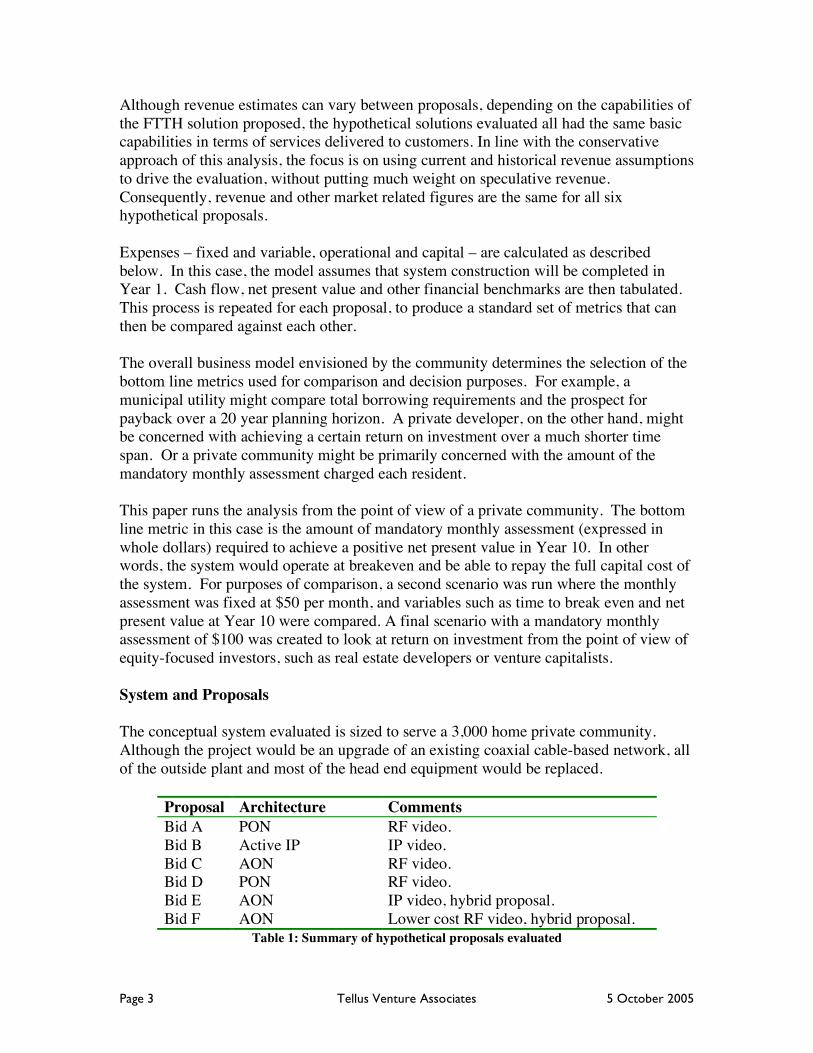
Although revenue estimates can vary between proposals, depending on the capabilities of the FTTH solution proposed, the hypothetical solutions evaluated all had the same basic capabilities in terms of services delivered to customers. In line with the conservative approach of this analysis, the focus is on using current and historical revenue assumptions to drive the evaluation, without putting much weight on speculative revenue. Consequently, revenue and other market related figures are the same for all six hypothetical proposals. Expenses – fixed and variable, operational and capital – are calculated as described below. In this case, the model assumes that system construction will be completed in Year 1. Cash flow, net present value and other financial benchmarks are then tabulated. This process is repeated for each proposal, to produce a standard set of metrics that can then be compared against each other. The overall business model envisioned by the community determines the selection of the bottom line metrics used for comparison and decision purposes. For example, a municipal utility might compare total borrowing requirements and the prospect for payback over a 20 year planning horizon. A private developer, on the other hand, might be concerned with achieving a certain return on investment over a much shorter time span. Or a private community might be primarily concerned with the amount of the mandatory monthly assessment charged each resident. This paper runs the analysis from the point of view of a private community. The bottom line metric in this case is the amount of mandatory monthly assessment (expressed in whole dollars) required to achieve a positive net present value in Year 10. In other words, the system would operate at breakeven and be able to repay the full capital cost of the system. For purposes of comparison, a second scenario was run where the monthly assessment was fixed at $50 per month, and variables such as time to break even and net present value at Year 10 were compared. A final scenario with a mandatory monthly assessment of $100 was created to look at return on investment from the point of view of equity-focused investors, such as real estate developers or venture capitalists. System and Proposals The conceptual system evaluated is sized to serve a 3,000 home private community. Although the project would be an upgrade of an existing coaxial cable-based network, all of the outside plant and most of the head end equipment would be replaced.
Proposal Architecture Comments
Bid A PON RF video. Bid B Active IP IP video. Bid C AON RF video. Bid D PON RF video. Bid E AON IP video, hybrid proposal. Bid F AON Lower cost RF video, hybrid proposal.
Table 1: Summary of hypothetical proposals evaluated
Page 4 Tellus Venture Associates 5 October 2005
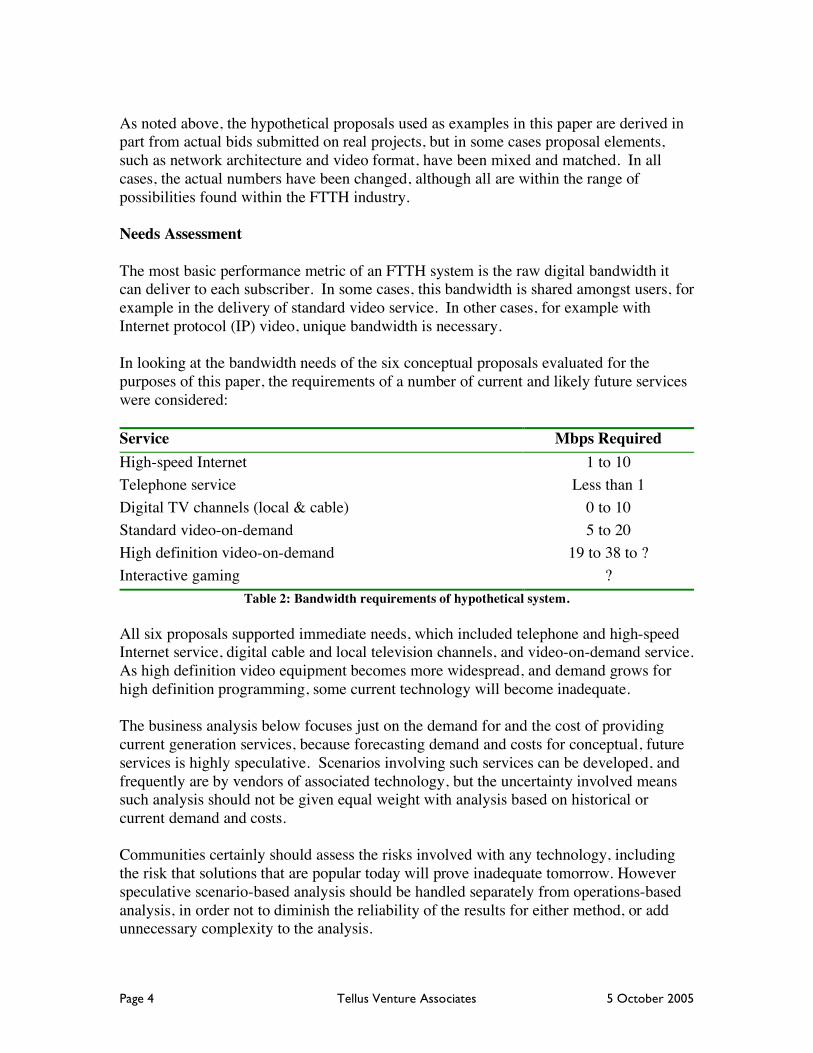
As noted above, the hypothetical proposals used as examples in this paper are derived in part from actual bids submitted on real projects, but in some cases proposal elements, such as network architecture and video format, have been mixed and matched. In all cases, the actual numbers have been changed, although all are within the range of possibilities found within the FTTH industry. Needs Assessment The most basic performance metric of an FTTH system is the raw digital bandwidth it can deliver to each subscriber. In some cases, this bandwidth is shared amongst users, for example in the delivery of standard video service. In other cases, for example with Internet protocol (IP) video, unique bandwidth is necessary. In looking at the bandwidth needs of the six conceptual proposals evaluated for the purposes of this paper, the requirements of a number of current and likely future services were considered:
Service Mbps Required
High-speed Internet 1 to 10
Telephone service Less than 1
Digital TV channels (local & cable) 0 to 10
Standard video-on-demand 5 to 20
High definition video-on-demand 19 to 38 to ?
Interactive gaming ?
Table 2: Bandwidth requirements of hypothetical system.
All six proposals supported immediate needs, which included telephone and high-speed Internet service, digital cable and local television channels, and video-on-demand service. As high definition video equipment becomes more widespread, and demand grows for high definition programming, some current technology will become inadequate. The business analysis below focuses just on the demand for and the cost of providing current generation services, because forecasting demand and costs for conceptual, future services is highly speculative. Scenarios involving such services can be developed, and frequently are by vendors of associated technology, but the uncertainty involved means such analysis should not be given equal weight with analysis based on historical or current demand and costs. Communities certainly should assess the risks involved with any technology, including the risk that solutions that are popular today will prove inadequate tomorrow. However speculative scenario-based analysis should be handled separately from operations-based analysis, in order not to diminish the reliability of the results for either method, or add unnecessary complexity to the analysis.
Page 5 Tellus Venture Associates 5 October 2005
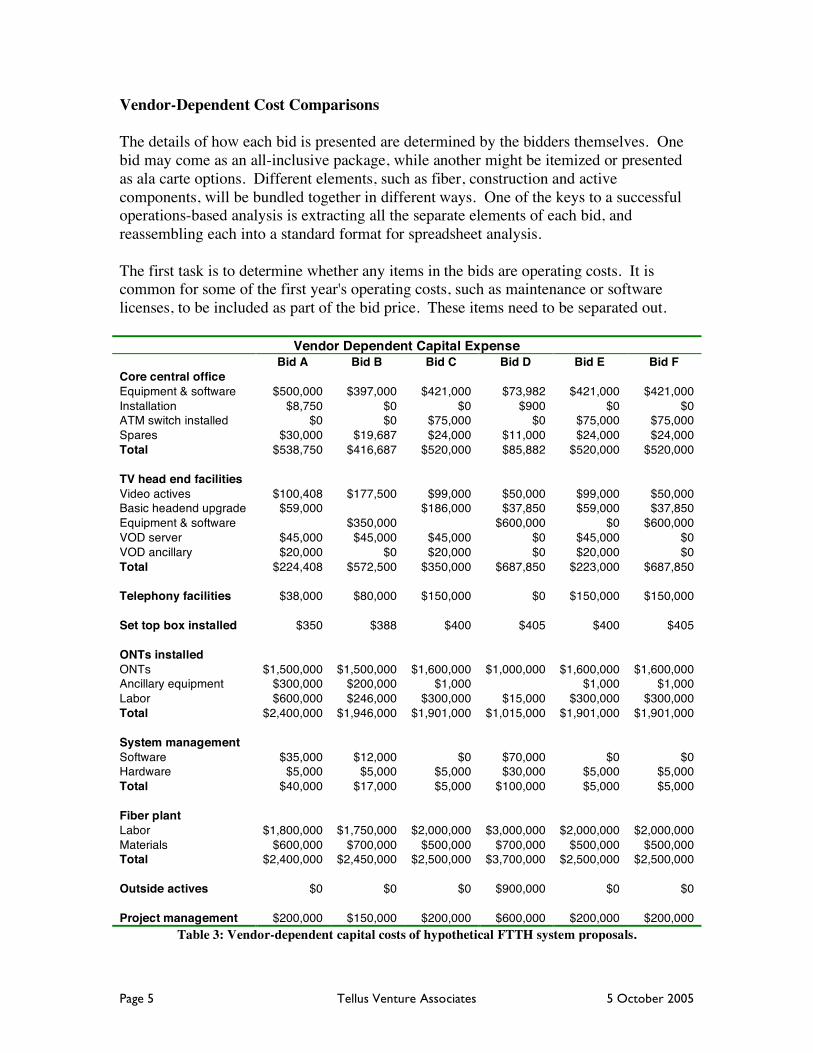
Vendor-Dependent Cost Comparisons The details of how each bid is presented are determined by the bidders themselves. One bid may come as an all-inclusive package, while another might be itemized or presented as ala carte options. Different elements, such as fiber, construction and active components, will be bundled together in different ways. One of the keys to a successful operations-based analysis is extracting all the separate elements of each bid, and reassembling each into a standard format for spreadsheet analysis. The first task is to determine whether any items in the bids are operating costs. It is common for some of the first year's operating costs, such as maintenance or software licenses, to be included as part of the bid price. These items need to be separated out.
Vendor Dependent Capital Expense
Bid A Bid B Bid C Bid D Bid E Bid F
Core central office Equipment & software $500,000 $397,000 $421,000 $73,982 $421,000 $421,000 Installation $8,750 $0 $0 $900 $0 $0 ATM switch installed $0 $0 $75,000 $0 $75,000 $75,000 Spares $30,000 $19,687 $24,000 $11,000 $24,000 $24,000 Total $538,750 $416,687 $520,000 $85,882 $520,000 $520,000 TV head end facilities Video actives $100,408 $177,500 $99,000 $50,000 $99,000 $50,000 Basic headend upgrade $59,000 $186,000 $37,850 $59,000 $37,850 Equipment & software $350,000 $600,000 $0 $600,000 VOD server $45,000 $45,000 $45,000 $0 $45,000 $0 VOD ancillary $20,000 $0 $20,000 $0 $20,000 $0 Total $224,408 $572,500 $350,000 $687,850 $223,000 $687,850 Telephony facilities $38,000 $80,000 $150,000 $0 $150,000 $150,000 Set top box installed $350 $388 $400 $405 $400 $405 ONTs installed ONTs $1,500,000 $1,500,000 $1,600,000 $1,000,000 $1,600,000 $1,600,000 Ancillary equipment $300,000 $200,000 $1,000 $1,000 $1,000 Labor $600,000 $246,000 $300,000 $15,000 $300,000 $300,000 Total $2,400,000 $1,946,000 $1,901,000 $1,015,000 $1,901,000 $1,901,000 System management Software $35,000 $12,000 $0 $70,000 $0 $0 Hardware $5,000 $5,000 $5,000 $30,000 $5,000 $5,000 Total $40,000 $17,000 $5,000 $100,000 $5,000 $5,000 Fiber plant Labor $1,800,000 $1,750,000 $2,000,000 $3,000,000 $2,000,000 $2,000,000 Materials $600,000 $700,000 $500,000 $700,000 $500,000 $500,000 Total $2,400,000 $2,450,000 $2,500,000 $3,700,000 $2,500,000 $2,500,000 Outside actives $0 $0 $0 $900,000 $0 $0 Project management $200,000 $150,000 $200,000 $600,000 $200,000 $200,000
Table 3: Vendor-dependent capital costs of hypothetical FTTH system proposals.
Page 6 Tellus Venture Associates 5 October 2005
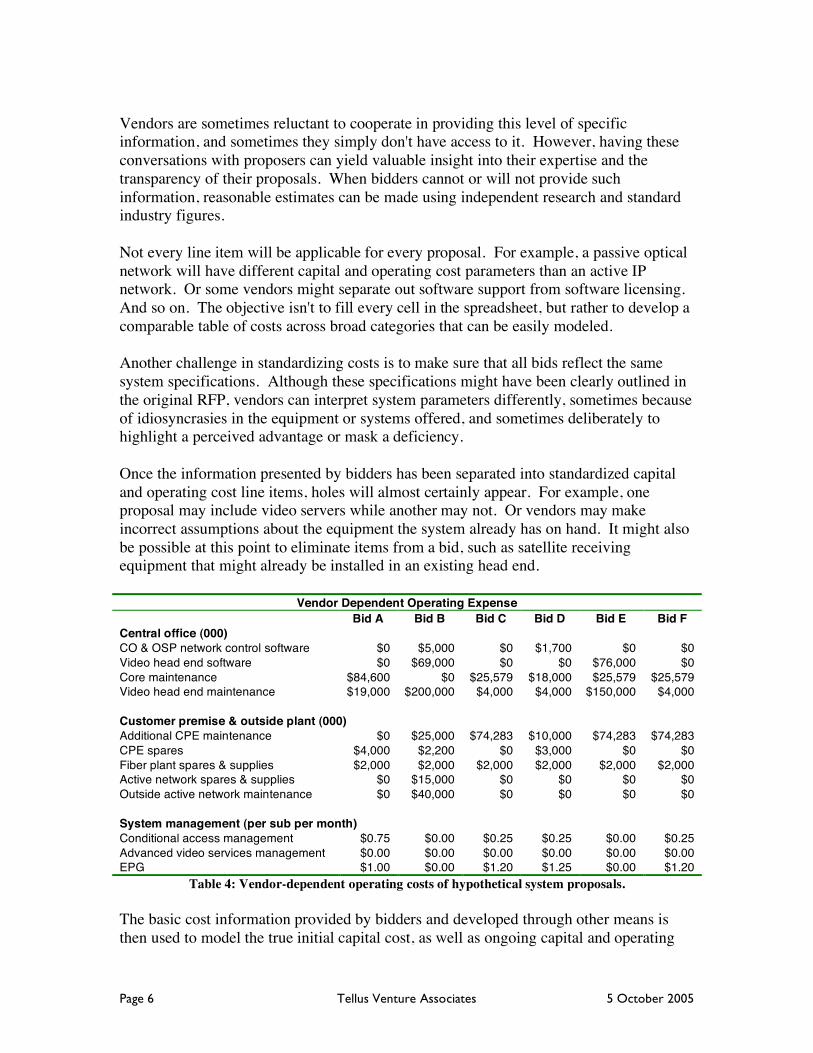
Vendors are sometimes reluctant to cooperate in providing this level of specific information, and sometimes they simply don't have access to it. However, having these conversations with proposers can yield valuable insight into their expertise and the transparency of their proposals. When bidders cannot or will not provide such information, reasonable estimates can be made using independent research and standard industry figures. Not every line item will be applicable for every proposal. For example, a passive optical network will have different capital and operating cost parameters than an active IP network. Or some vendors might separate out software support from software licensing. And so on. The objective isn't to fill every cell in the spreadsheet, but rather to develop a comparable table of costs across broad categories that can be easily modeled. Another challenge in standardizing costs is to make sure that all bids reflect the same system specifications. Although these specifications might have been clearly outlined in the original RFP, vendors can interpret system parameters differently, sometimes because of idiosyncrasies in the equipment or systems offered, and sometimes deliberately to highlight a perceived advantage or mask a deficiency. Once the information presented by bidders has been separated into standardized capital and operating cost line items, holes will almost certainly appear. For example, one proposal may include video servers while another may not. Or vendors may make incorrect assumptions about the equipment the system already has on hand. It might also be possible at this point to eliminate items from a bid, such as satellite receiving equipment that might already be installed in an existing head end.
Vendor Dependent Operating Expense
Bid A Bid B Bid C Bid D Bid E Bid F
Central office (000) CO & OSP network control software $0 $5,000 $0 $1,700 $0 $0 Video head end software $0 $69,000 $0 $0 $76,000 $0 Core maintenance $84,600 $0 $25,579 $18,000 $25,579 $25,579 Video head end maintenance $19,000 $200,000 $4,000 $4,000 $150,000 $4,000 Customer premise & outside plant (000) Additional CPE maintenance $0 $25,000 $74,283 $10,000 $74,283 $74,283 CPE spares $4,000 $2,200 $0 $3,000 $0 $0 Fiber plant spares & supplies $2,000 $2,000 $2,000 $2,000 $2,000 $2,000 Active network spares & supplies $0 $15,000 $0 $0 $0 $0 Outside active network maintenance $0 $40,000 $0 $0 $0 $0 System management (per sub per month) Conditional access management $0.75 $0.00 $0.25 $0.25 $0.00 $0.25 Advanced video services management $0.00 $0.00 $0.00 $0.00 $0.00 $0.00 EPG $1.00 $0.00 $1.20 $1.25 $0.00 $1.20
Table 4: Vendor-dependent operating costs of hypothetical system proposals.
The basic cost information provided by bidders and developed through other means is then used to model the true initial capital cost, as well as ongoing capital and operating
Page 7 Tellus Venture Associates 5 October 2005
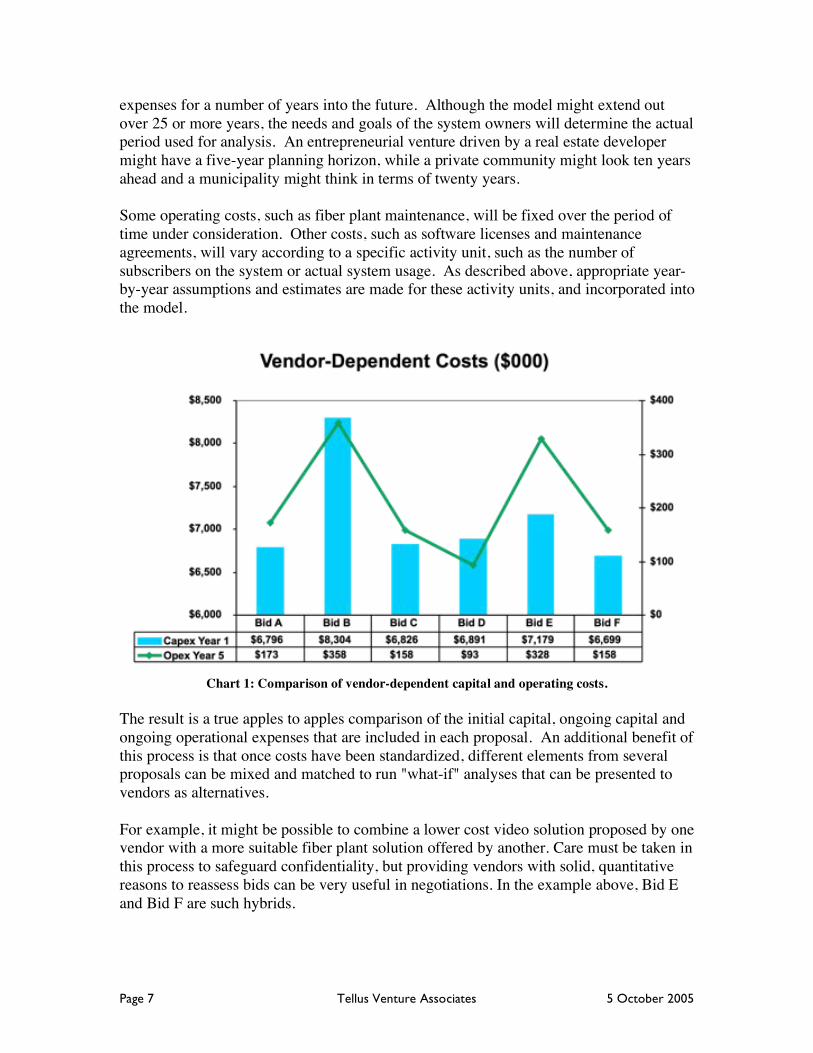
expenses for a number of years into the future. Although the model might extend out over 25 or more years, the needs and goals of the system owners will determine the actual period used for analysis. An entrepreneurial venture driven by a real estate developer might have a five-year planning horizon, while a private community might look ten years ahead and a municipality might think in terms of twenty years. Some operating costs, such as fiber plant maintenance, will be fixed over the period of time under consideration. Other costs, such as software licenses and maintenance agreements, will vary according to a specific activity unit, such as the number of subscribers on the system or actual system usage. As described above, appropriate year-by-year assumptions and estimates are made for these activity units, and incorporated into the model.
Chart 1: Comparison of vendor-dependent capital and operating costs.
The result is a true apples to apples comparison of the initial capital, ongoing capital and ongoing operational expenses that are included in each proposal. An additional benefit of this process is that once costs have been standardized, different elements from several proposals can be mixed and matched to run "what-if" analyses that can be presented to vendors as alternatives. For example, it might be possible to combine a lower cost video solution proposed by one vendor with a more suitable fiber plant solution offered by another. Care must be taken in this process to safeguard confidentiality, but providing vendors with solid, quantitative reasons to reassess bids can be very useful in negotiations. In the example above, Bid E and Bid F are such hybrids.
Page 8 Tellus Venture Associates 5 October 2005
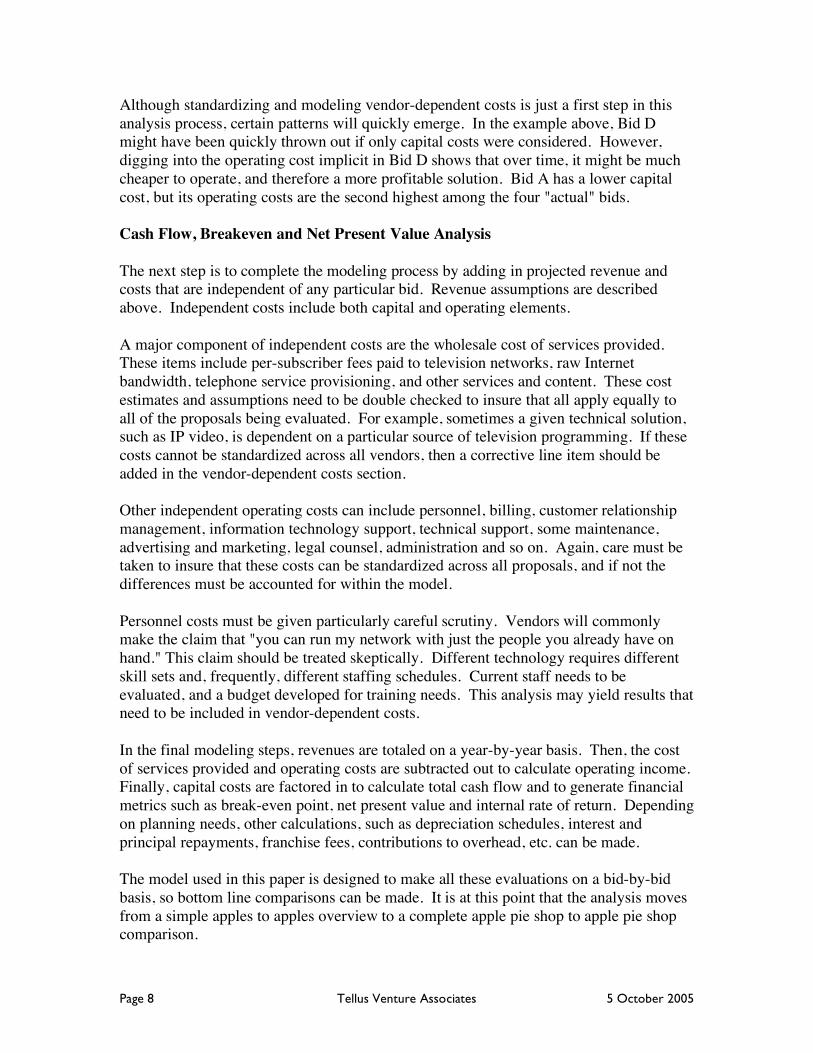
Although standardizing and modeling vendor-dependent costs is just a first step in this analysis process, certain patterns will quickly emerge. In the example above, Bid D might have been quickly thrown out if only capital costs were considered. However, digging into the operating cost implicit in Bid D shows that over time, it might be much cheaper to operate, and therefore a more profitable solution. Bid A has a lower capital cost, but its operating costs are the second highest among the four "actual" bids. Cash Flow, Breakeven and Net Present Value Analysis The next step is to complete the modeling process by adding in projected revenue and costs that are independent of any particular bid. Revenue assumptions are described above. Independent costs include both capital and operating elements. A major component of independent costs are the wholesale cost of services provided. These items include per-subscriber fees paid to television networks, raw Internet bandwidth, telephone service provisioning, and other services and content. These cost estimates and assumptions need to be double checked to insure that all apply equally to all of the proposals being evaluated. For example, sometimes a given technical solution, such as IP video, is dependent on a particular source of television programming. If these costs cannot be standardized across all vendors, then a corrective line item should be added in the vendor-dependent costs section. Other independent operating costs can include personnel, billing, customer relationship management, information technology support, technical support, some maintenance, advertising and marketing, legal counsel, administration and so on. Again, care must be taken to insure that these costs can be standardized across all proposals, and if not the differences must be accounted for within the model. Personnel costs must be given particularly careful scrutiny. Vendors will commonly make the claim that "you can run my network with just the people you already have on hand." This claim should be treated skeptically. Different technology requires different skill sets and, frequently, different staffing schedules. Current staff needs to be evaluated, and a budget developed for training needs. This analysis may yield results that need to be included in vendor-dependent costs. In the final modeling steps, revenues are totaled on a year-by-year basis. Then, the cost of services provided and operating costs are subtracted out to calculate operating income. Finally, capital costs are factored in to calculate total cash flow and to generate financial metrics such as break-even point, net present value and internal rate of return. Depending on planning needs, other calculations, such as depreciation schedules, interest and principal repayments, franchise fees, contributions to overhead, etc. can be made. The model used in this paper is designed to make all these evaluations on a bid-by-bid basis, so bottom line comparisons can be made. It is at this point that the analysis moves from a simple apples to apples overview to a complete apple pie shop to apple pie shop comparison.
Page 9 Tellus Venture Associates 5 October 2005
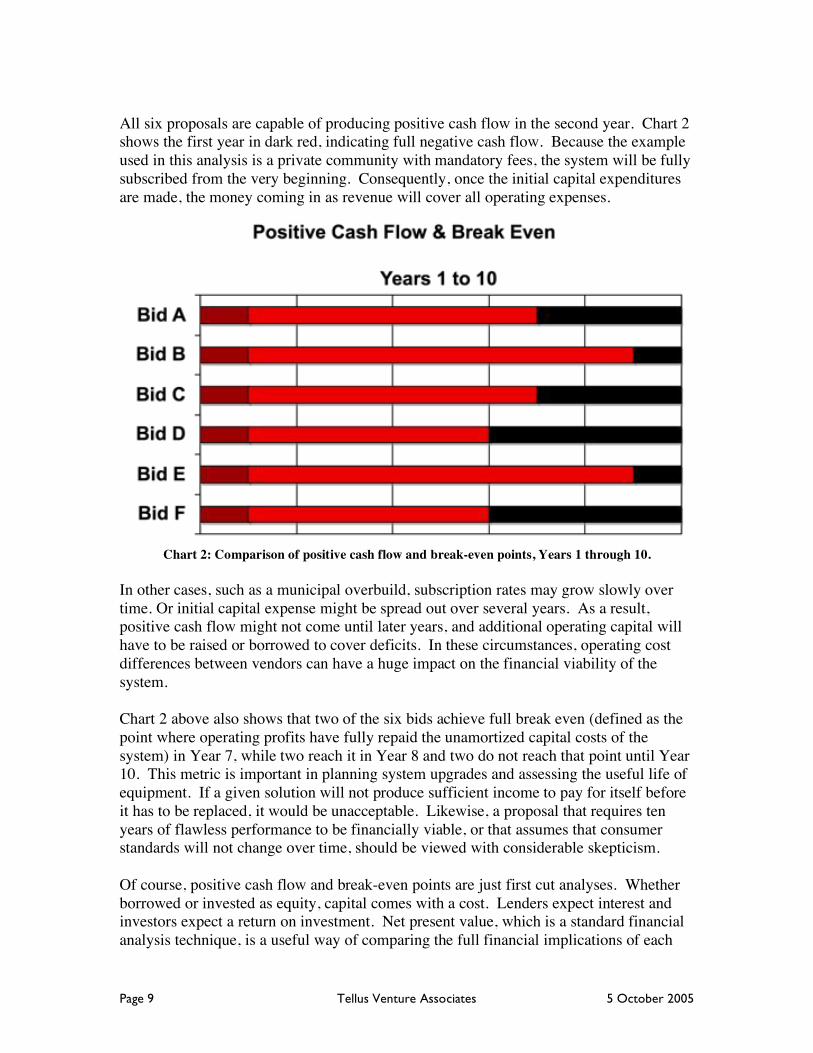
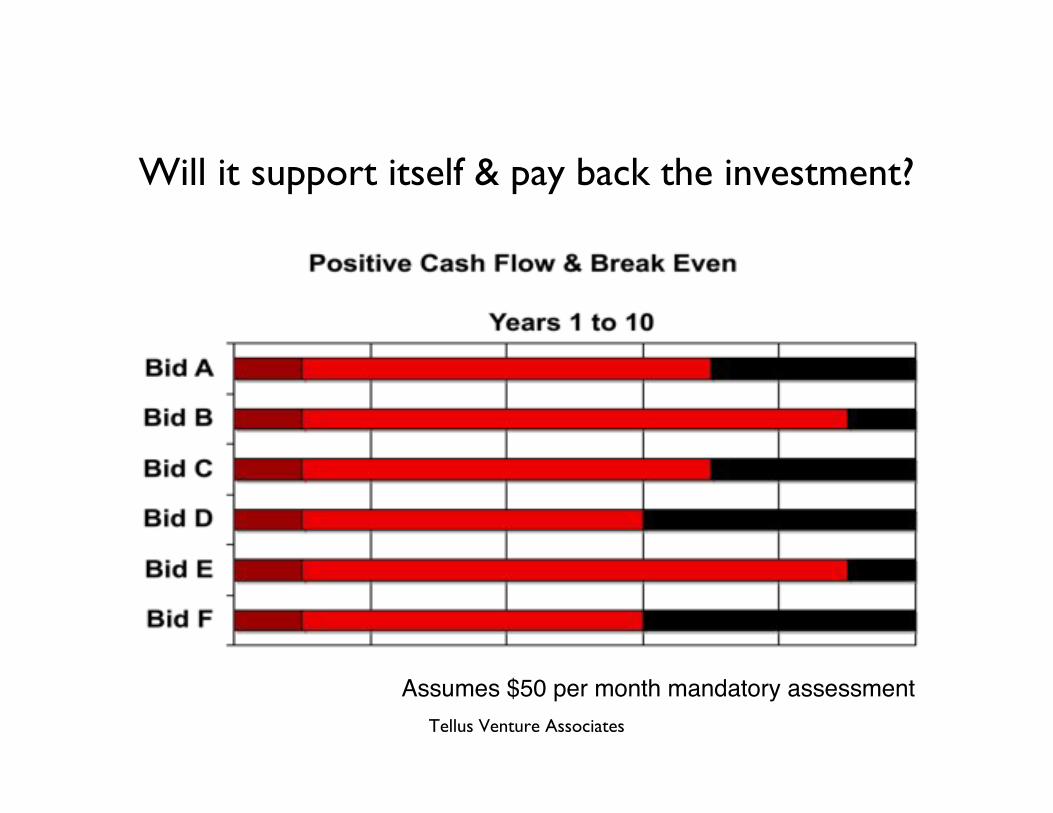
All six proposals are capable of producing positive cash flow in the second year. Chart 2 shows the first year in dark red, indicating full negative cash flow. Because the example used in this analysis is a private community with mandatory fees, the system will be fully subscribed from the very beginning. Consequently, once the initial capital expenditures are made, the money coming in as revenue will cover all operating expenses.
Chart 2: Comparison of positive cash flow and break-even points, Years 1 through 10.
In other cases, such as a municipal overbuild, subscription rates may grow slowly over time. Or initial capital expense might be spread out over several years. As a result, positive cash flow might not come until later years, and additional operating capital will have to be raised or borrowed to cover deficits. In these circumstances, operating cost differences between vendors can have a huge impact on the financial viability of the system. Chart 2 above also shows that two of the six bids achieve full break even (defined as the point where operating profits have fully repaid the unamortized capital costs of the system) in Year 7, while two reach it in Year 8 and two do not reach that point until Year 10. This metric is important in planning system upgrades and assessing the useful life of equipment. If a given solution will not produce sufficient income to pay for itself before it has to be replaced, it would be unacceptable. Likewise, a proposal that requires ten years of flawless performance to be financially viable, or that assumes that consumer standards will not change over time, should be viewed with considerable skepticism. Of course, positive cash flow and break-even points are just first cut analyses. Whether borrowed or invested as equity, capital comes with a cost. Lenders expect interest and investors expect a return on investment. Net present value, which is a standard financial analysis technique, is a useful way of comparing the full financial implications of each
Page 10 Tellus Venture Associates 5 October 2005
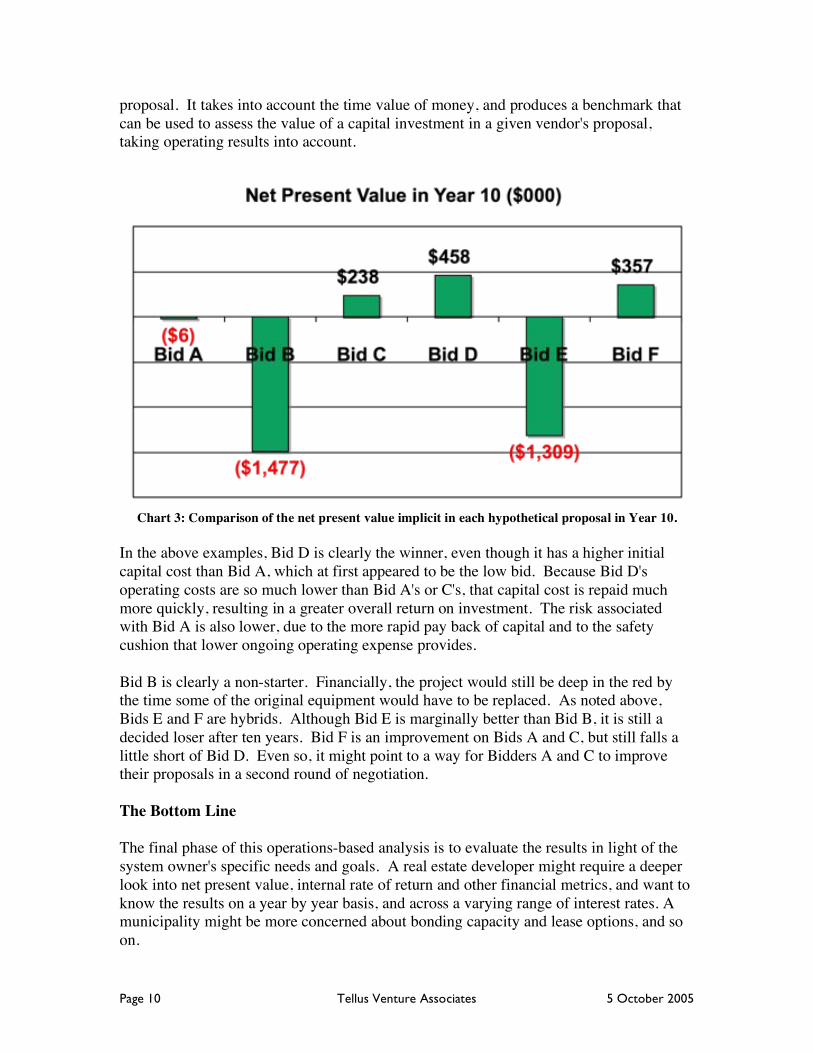
proposal. It takes into account the time value of money, and produces a benchmark that can be used to assess the value of a capital investment in a given vendor's proposal, taking operating results into account.
Chart 3: Comparison of the net present value implicit in each hypothetical proposal in Year 10.
In the above examples, Bid D is clearly the winner, even though it has a higher initial capital cost than Bid A, which at first appeared to be the low bid. Because Bid D's operating costs are so much lower than Bid A's or C's, that capital cost is repaid much more quickly, resulting in a greater overall return on investment. The risk associated with Bid A is also lower, due to the more rapid pay back of capital and to the safety cushion that lower ongoing operating expense provides. Bid B is clearly a non-starter. Financially, the project would still be deep in the red by the time some of the original equipment would have to be replaced. As noted above, Bids E and F are hybrids. Although Bid E is marginally better than Bid B, it is still a decided loser after ten years. Bid F is an improvement on Bids A and C, but still falls a little short of Bid D. Even so, it might point to a way for Bidders A and C to improve their proposals in a second round of negotiation. The Bottom Line The final phase of this operations-based analysis is to evaluate the results in light of the system owner's specific needs and goals. A real estate developer might require a deeper look into net present value, internal rate of return and other financial metrics, and want to know the results on a year by year basis, and across a varying range of interest rates. A municipality might be more concerned about bonding capacity and lease options, and so on.
Page 11 Tellus Venture Associates 5 October 2005
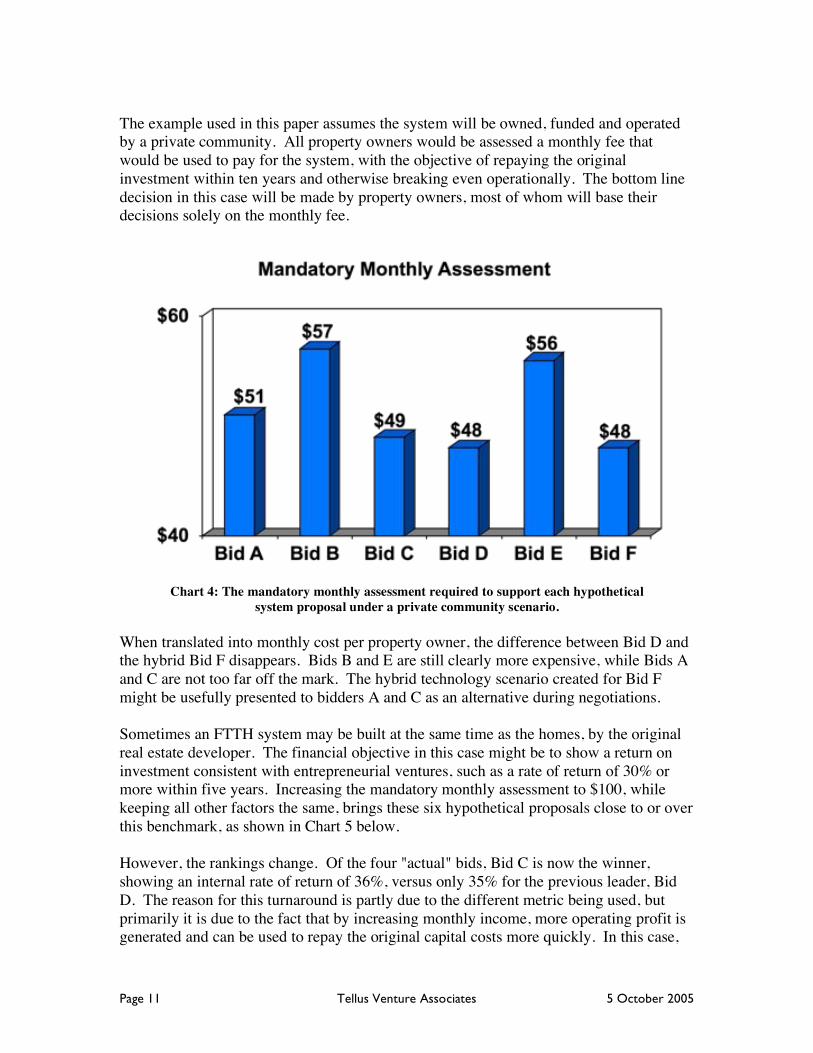
The example used in this paper assumes the system will be owned, funded and operated by a private community. All property owners would be assessed a monthly fee that would be used to pay for the system, with the objective of repaying the original investment within ten years and otherwise breaking even operationally. The bottom line decision in this case will be made by property owners, most of whom will base their decisions solely on the monthly fee.
Chart 4: The mandatory monthly assessment required to support each hypothetical system proposal under a private community scenario.
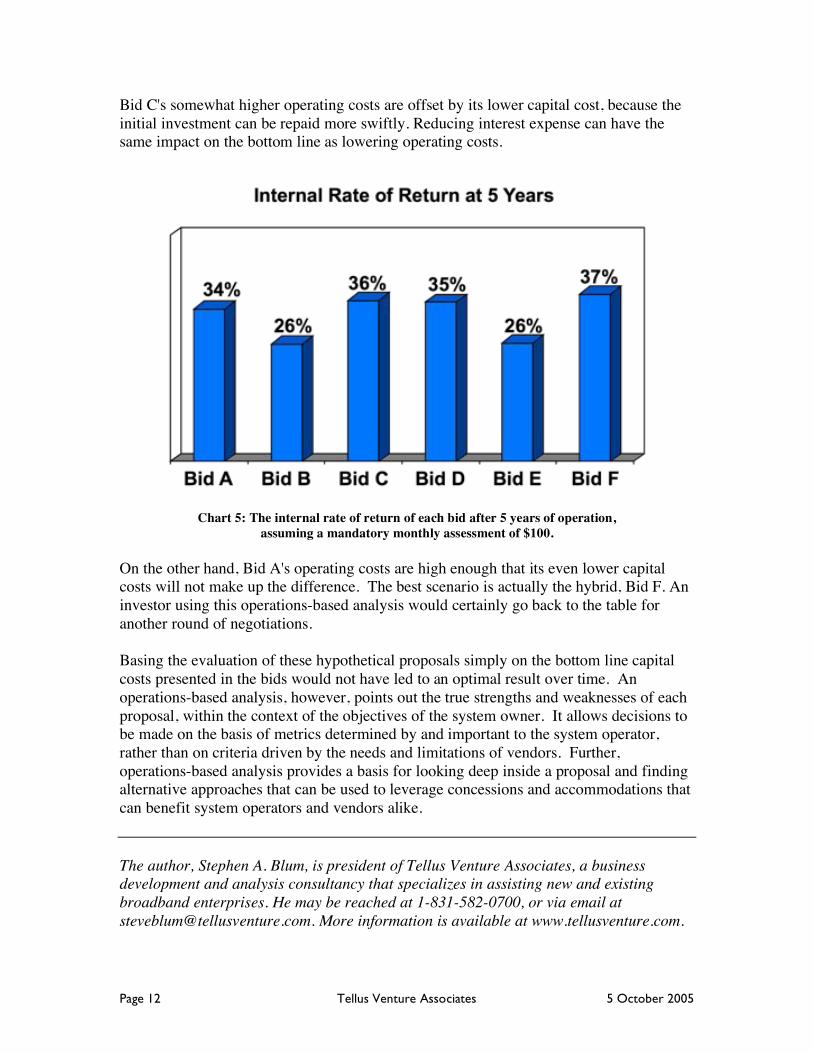
When translated into monthly cost per property owner, the difference between Bid D and the hybrid Bid F disappears. Bids B and E are still clearly more expensive, while Bids A and C are not too far off the mark. The hybrid technology scenario created for Bid F might be usefully presented to bidders A and C as an alternative during negotiations. Sometimes an FTTH system may be built at the same time as the homes, by the original real estate developer. The financial objective in this case might be to show a return on investment consistent with entrepreneurial ventures, such as a rate of return of 30% or more within five years. Increasing the mandatory monthly assessment to $100, while keeping all other factors the same, brings these six hypothetical proposals close to or over this benchmark, as shown in Chart 5 below. However, the rankings change. Of the four "actual" bids, Bid C is now the winner, showing an internal rate of return of 36%, versus only 35% for the previous leader, Bid D. The reason for this turnaround is partly due to the different metric being used, but primarily it is due to the fact that by increasing monthly income, more operating profit is generated and can be used to repay the original capital costs more quickly. In this case,
Page 12 Tellus Venture Associates 5 October 2005
Bid C's somewhat higher operating costs are offset by its lower capital cost, because the initial investment can be repaid more swiftly. Reducing interest expense can have the same impact on the bottom line as lowering operating costs.
Chart 5: The internal rate of return of each bid after 5 years of operation,
assuming a mandatory monthly assessment of $100. On the other hand, Bid A's operating costs are high enough that its even lower capital costs will not make up the difference. The best scenario is actually the hybrid, Bid F. An investor using this operations-based analysis would certainly go back to the table for another round of negotiations. Basing the evaluation of these hypothetical proposals simply on the bottom line capital costs presented in the bids would not have led to an optimal result over time. An operations-based analysis, however, points out the true strengths and weaknesses of each proposal, within the context of the objectives of the system owner. It allows decisions to be made on the basis of metrics determined by and important to the system operator, rather than on criteria driven by the needs and limitations of vendors. Further, operations-based analysis provides a basis for looking deep inside a proposal and finding alternative approaches that can be used to leverage concessions and accommodations that can benefit system operators and vendors alike.
The author, Stephen A. Blum, is president of Tellus Venture Associates, a business
development and analysis consultancy that specializes in assisting new and existing
broadband enterprises. He may be reached at 1-831-582-0700, or via email at
[email protected]. More information is available at www.tellusventure.com.
Financial Analysis of FTTH System Proposals:An Operations-Based Approach
Presented to the
Fiber to the Home Council
5 October 2005 by
Stephen A. Blum
President, Tellus Venture Associates
Copyright 2005. Tellus Venture Associates. All Rights Reserved.
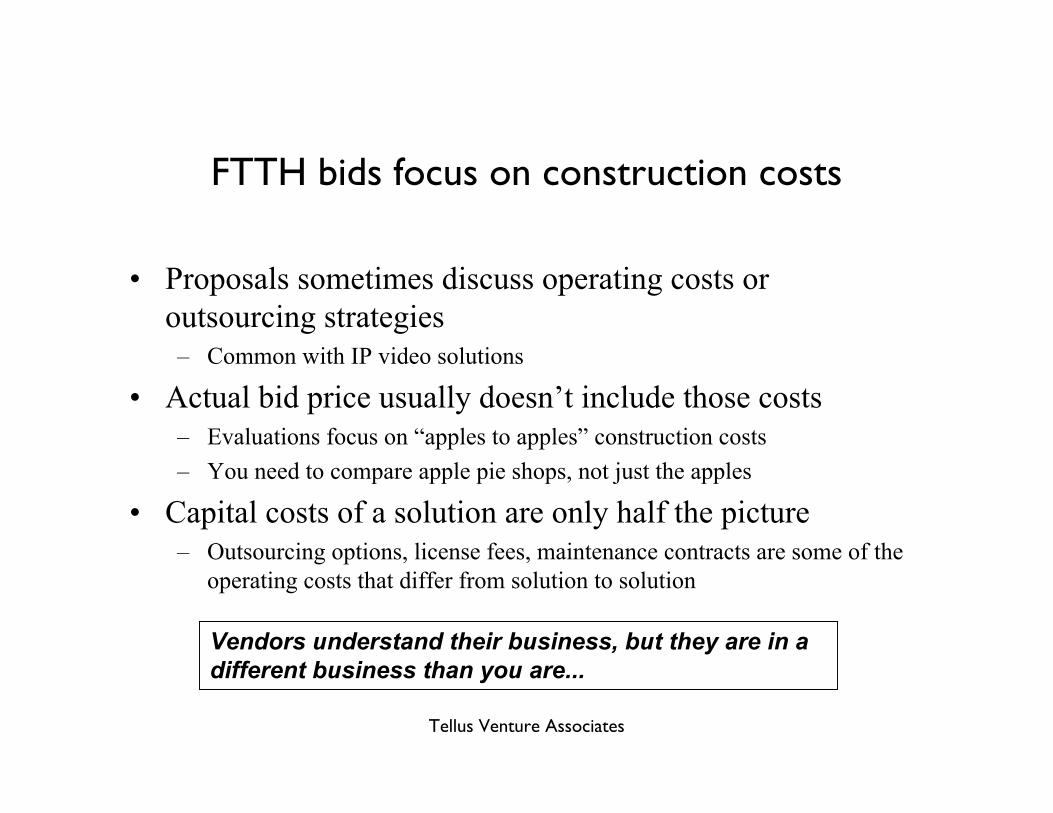
FTTH bids focus on construction costs
• Proposals sometimes discuss operating costs or
outsourcing strategies
– Common with IP video solutions
• Actual bid price usually doesn’t include those costs
– Evaluations focus on “apples to apples” construction costs
– You need to compare apple pie shops, not just the apples
• Capital costs of a solution are only half the picture
– Outsourcing options, license fees, maintenance contracts are some of the
operating costs that differ from solution to solution
Vendors understand their business, but they are in a
different business than you are...
Tellus Venture Associates
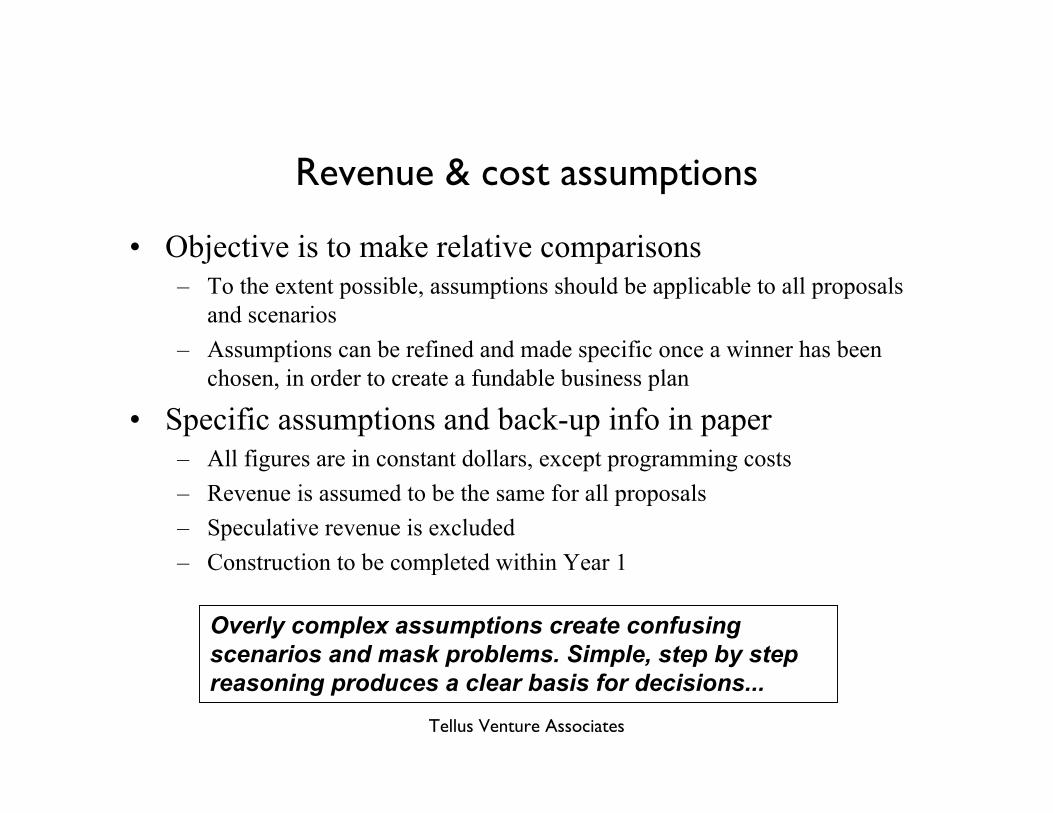
Revenue & cost assumptions
• Objective is to make relative comparisons
– To the extent possible, assumptions should be applicable to all proposals
and scenarios
– Assumptions can be refined and made specific once a winner has been
chosen, in order to create a fundable business plan
• Specific assumptions and back-up info in paper
– All figures are in constant dollars, except programming costs
– Revenue is assumed to be the same for all proposals
– Speculative revenue is excluded
– Construction to be completed within Year 1
Overly complex assumptions create confusing
scenarios and mask problems. Simple, step by step
reasoning produces a clear basis for decisions...
Tellus Venture Associates
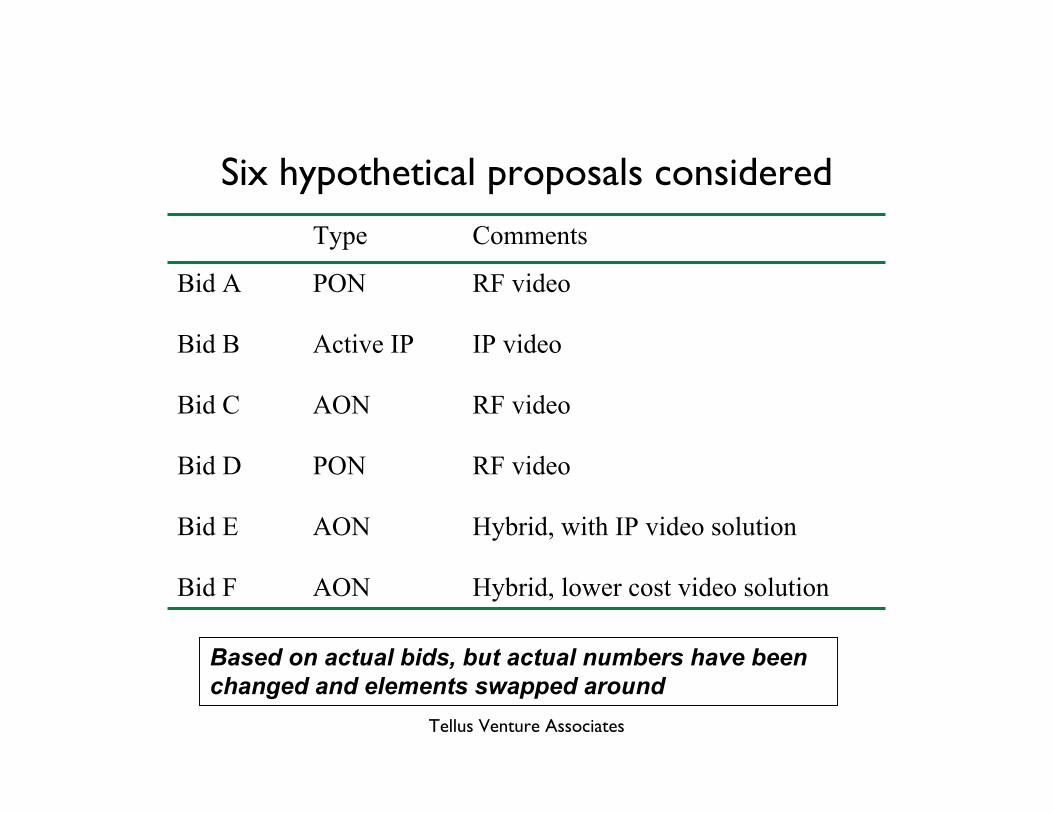
Six hypothetical proposals considered
Hybrid, lower cost video solutionAONBid F
Hybrid, with IP video solutionAONBid E
RF videoPONBid D
RF videoAONBid C
IP videoActive IPBid B
RF videoPONBid A
CommentsType
Based on actual bids, but actual numbers have been
changed and elements swapped around
Tellus Venture Associates
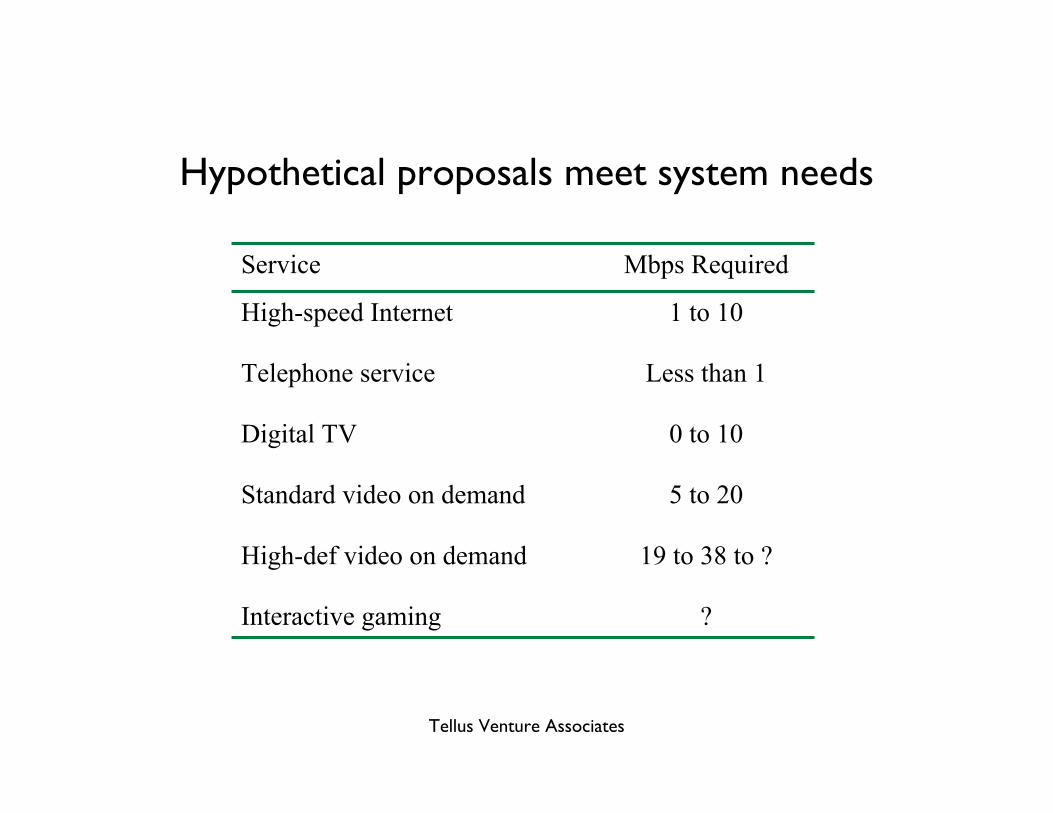
Hypothetical proposals meet system needs
?Interactive gaming
19 to 38 to ?High-def video on demand
5 to 20Standard video on demand
0 to 10Digital TV
Less than 1Telephone service
1 to 10High-speed Internet
Mbps RequiredService
Tellus Venture Associates
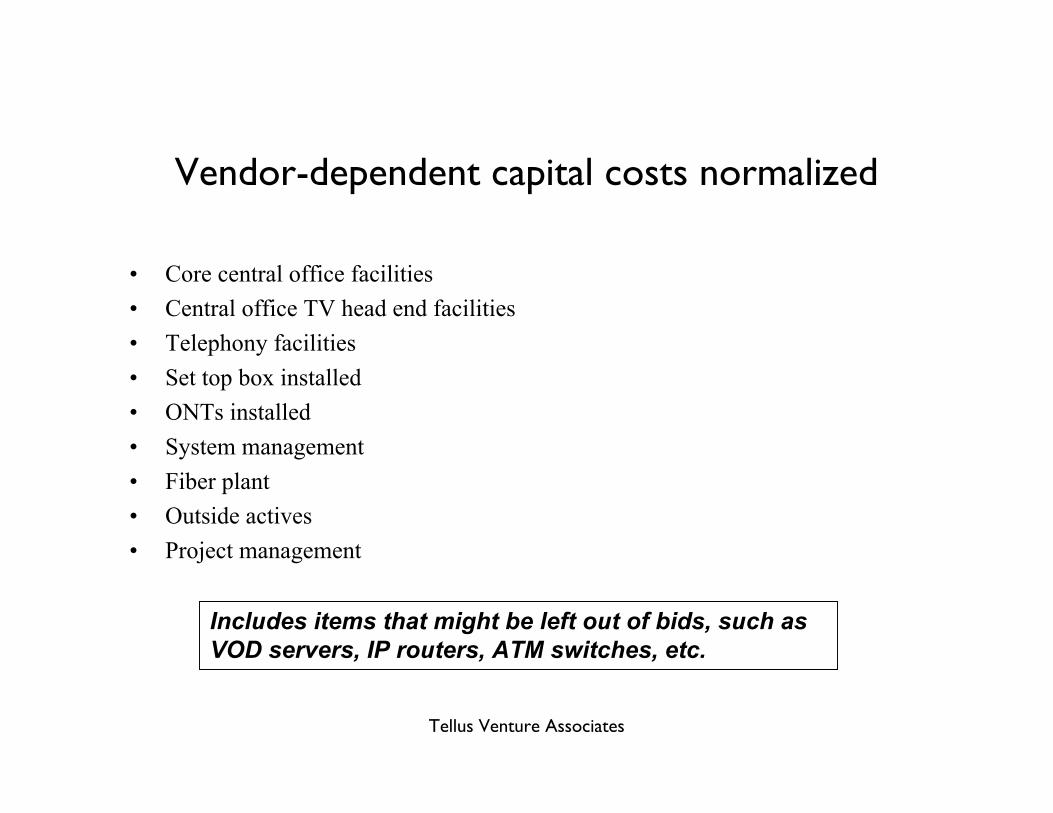
Vendor-dependent capital costs normalized
• Core central office facilities
• Central office TV head end facilities
• Telephony facilities
• Set top box installed
• ONTs installed
• System management
• Fiber plant
• Outside actives
• Project management
Includes items that might be left out of bids, such as
VOD servers, IP routers, ATM switches, etc.
Tellus Venture Associates
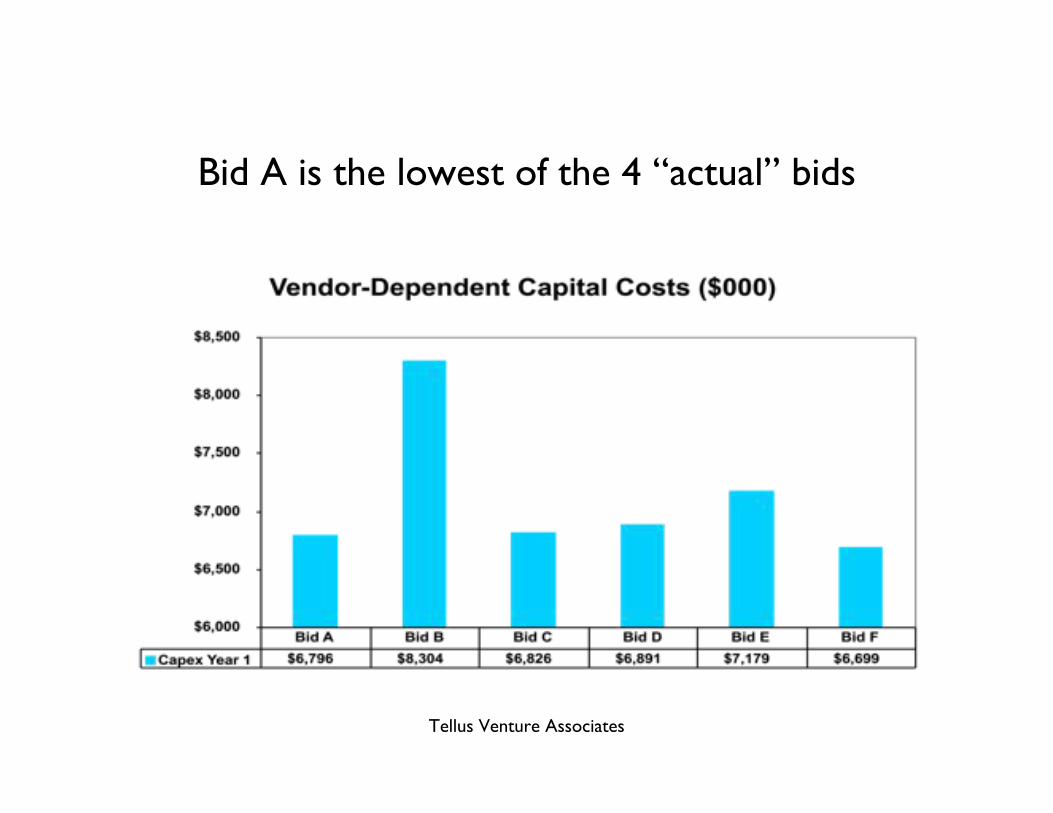
Bid A is the lowest of the 4 “actual” bids
Tellus Venture Associates
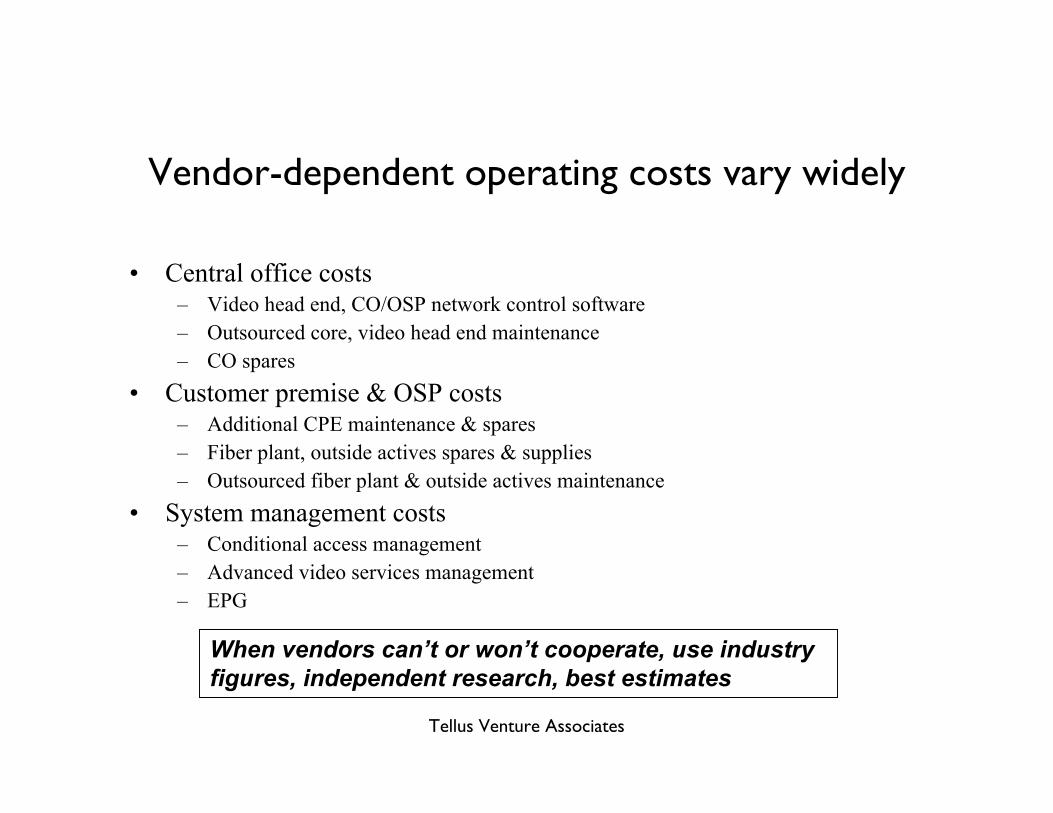
Vendor-dependent operating costs vary widely
• Central office costs– Video head end, CO/OSP network control software
– Outsourced core, video head end maintenance
– CO spares
• Customer premise & OSP costs– Additional CPE maintenance & spares
– Fiber plant, outside actives spares & supplies
– Outsourced fiber plant & outside actives maintenance
• System management costs– Conditional access management
– Advanced video services management
– EPG
When vendors can’t or won’t cooperate, use industry
figures, independent research, best estimates
Tellus Venture Associates
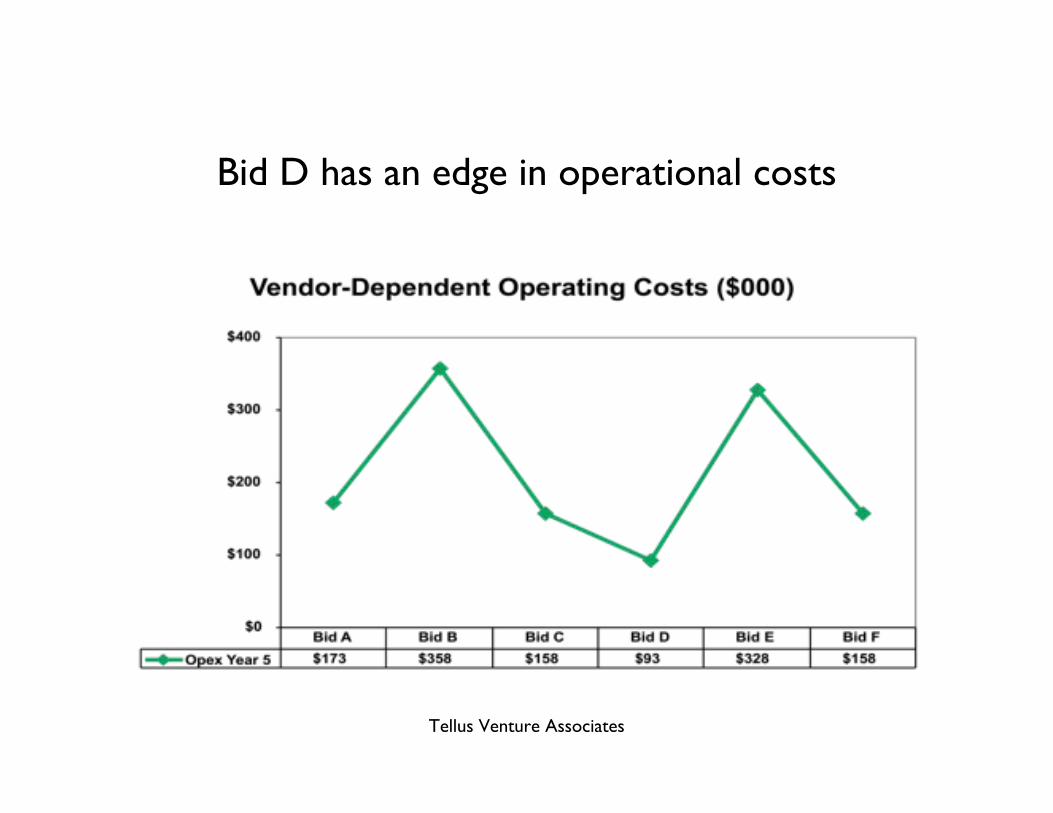
Bid D has an edge in operational costs
Tellus Venture Associates
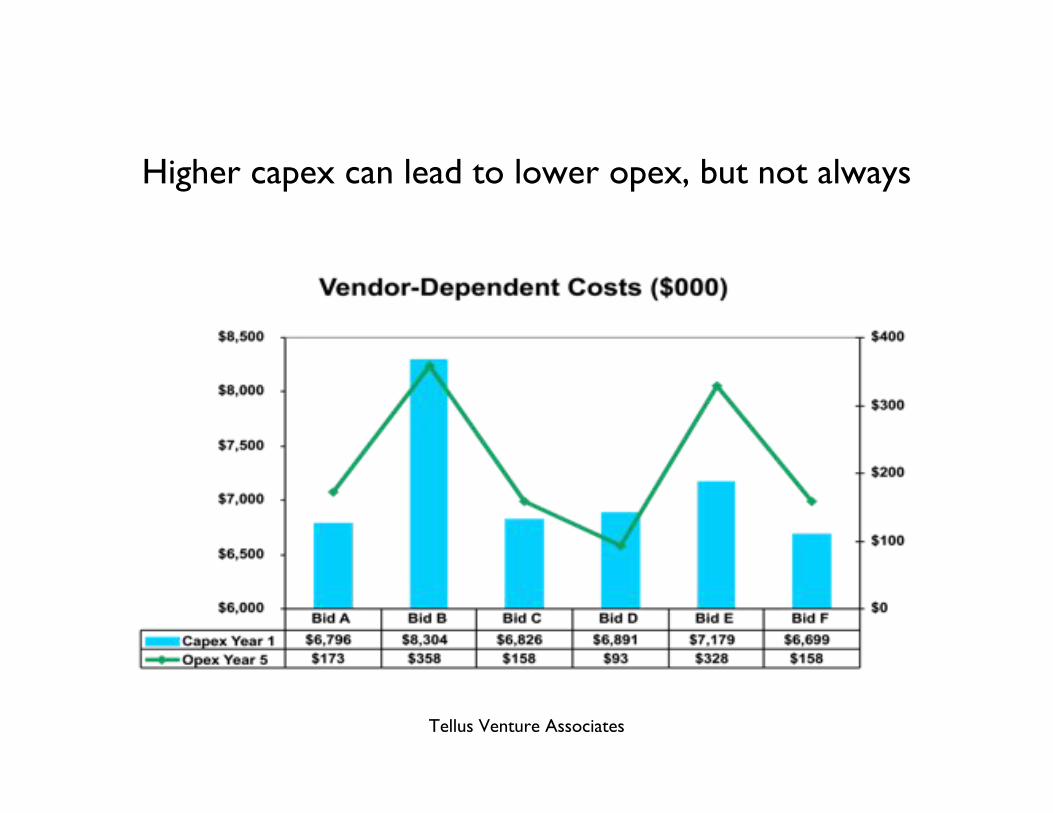
Higher capex can lead to lower opex, but not always
Tellus Venture Associates
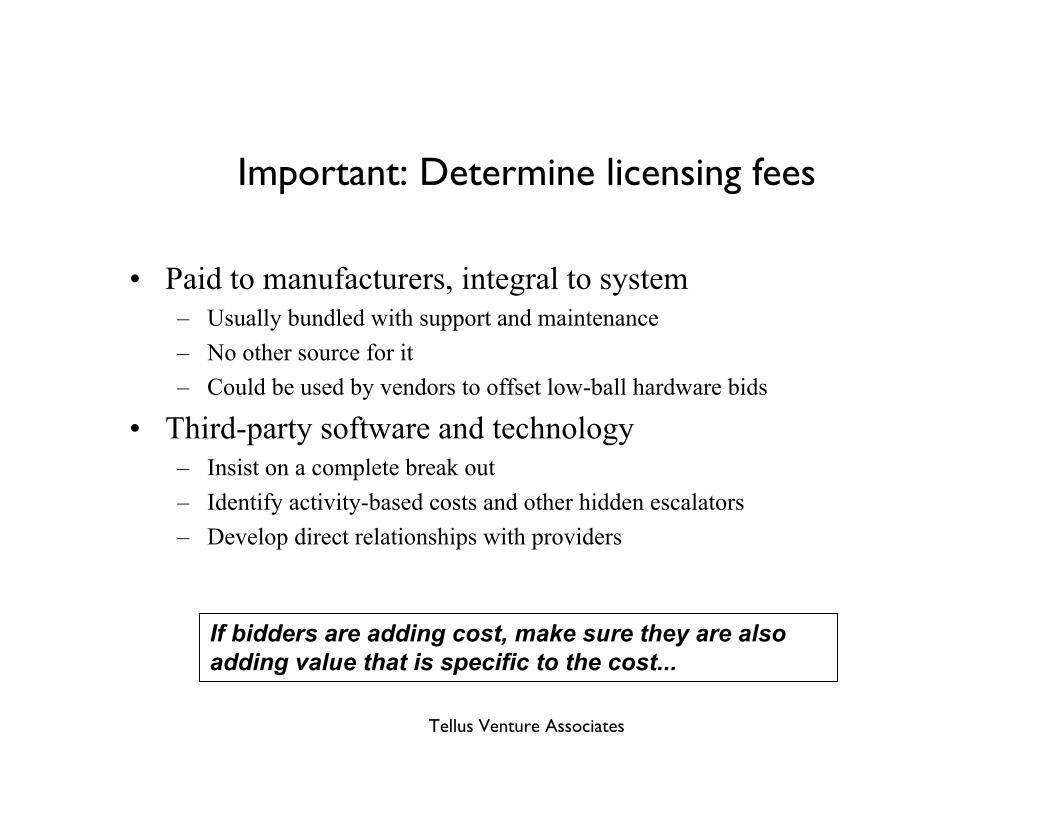
Important: Determine licensing fees
• Paid to manufacturers, integral to system
– Usually bundled with support and maintenance
– No other source for it
– Could be used by vendors to offset low-ball hardware bids
• Third-party software and technology
– Insist on a complete break out
– Identify activity-based costs and other hidden escalators
– Develop direct relationships with providers
If bidders are adding cost, make sure they are also
adding value that is specific to the cost...
Tellus Venture Associates
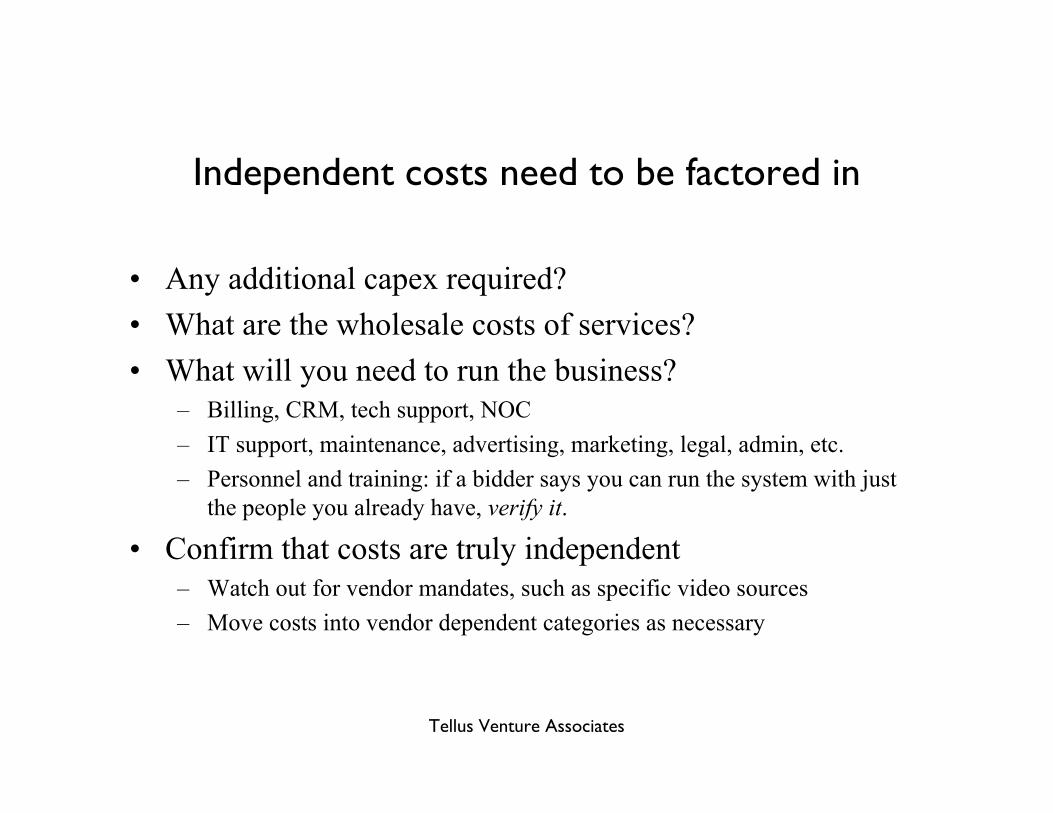
Independent costs need to be factored in
• Any additional capex required?
• What are the wholesale costs of services?
• What will you need to run the business?
– Billing, CRM, tech support, NOC
– IT support, maintenance, advertising, marketing, legal, admin, etc.
– Personnel and training: if a bidder says you can run the system with just
the people you already have, verify it.
• Confirm that costs are truly independent
– Watch out for vendor mandates, such as specific video sources
– Move costs into vendor dependent categories as necessary
Tellus Venture Associates
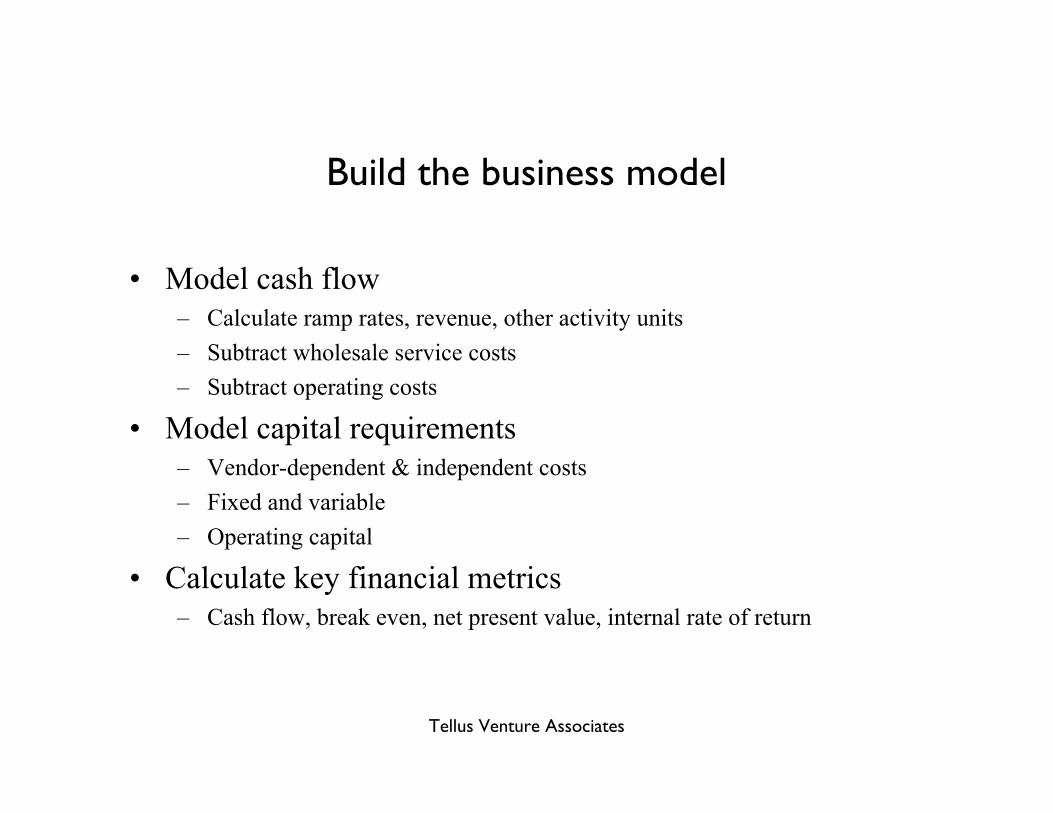
Build the business model
• Model cash flow
– Calculate ramp rates, revenue, other activity units
– Subtract wholesale service costs
– Subtract operating costs
• Model capital requirements
– Vendor-dependent & independent costs
– Fixed and variable
– Operating capital
• Calculate key financial metrics
– Cash flow, break even, net present value, internal rate of return
Tellus Venture Associates
Will it support itself & pay back the investment?
Assumes $50 per month mandatory assessment
Tellus Venture Associates
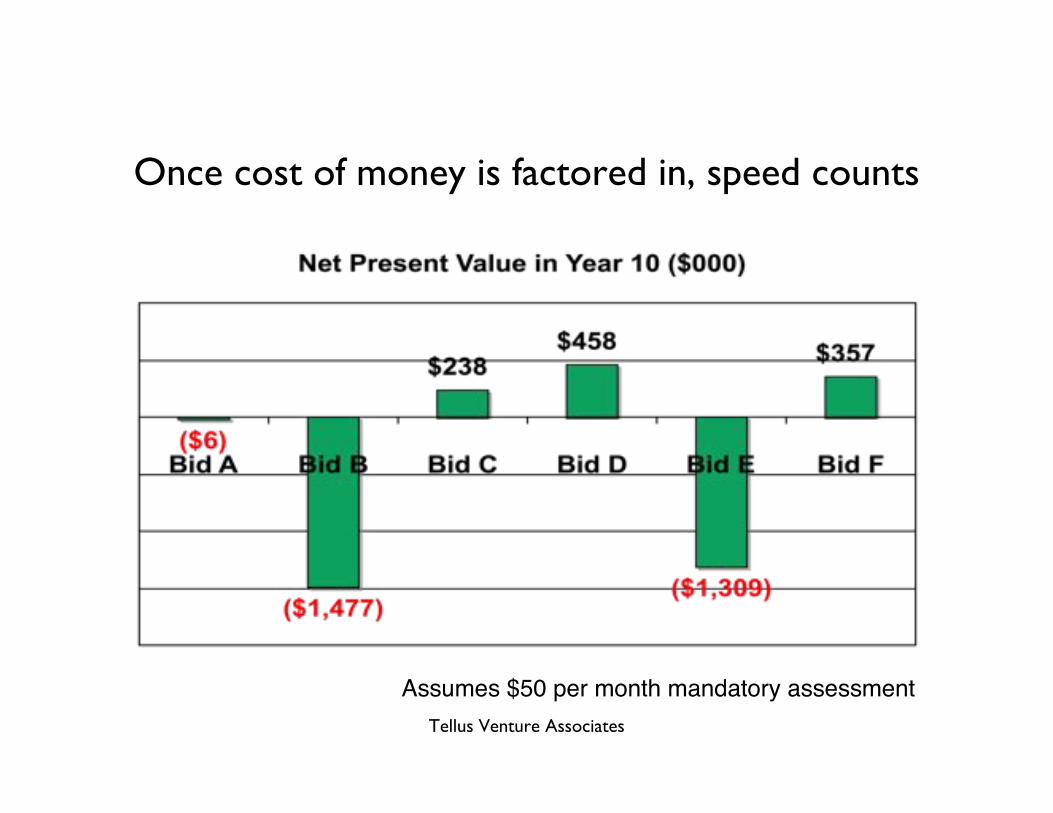
Once cost of money is factored in, speed counts
Assumes $50 per month mandatory assessment
Tellus Venture Associates
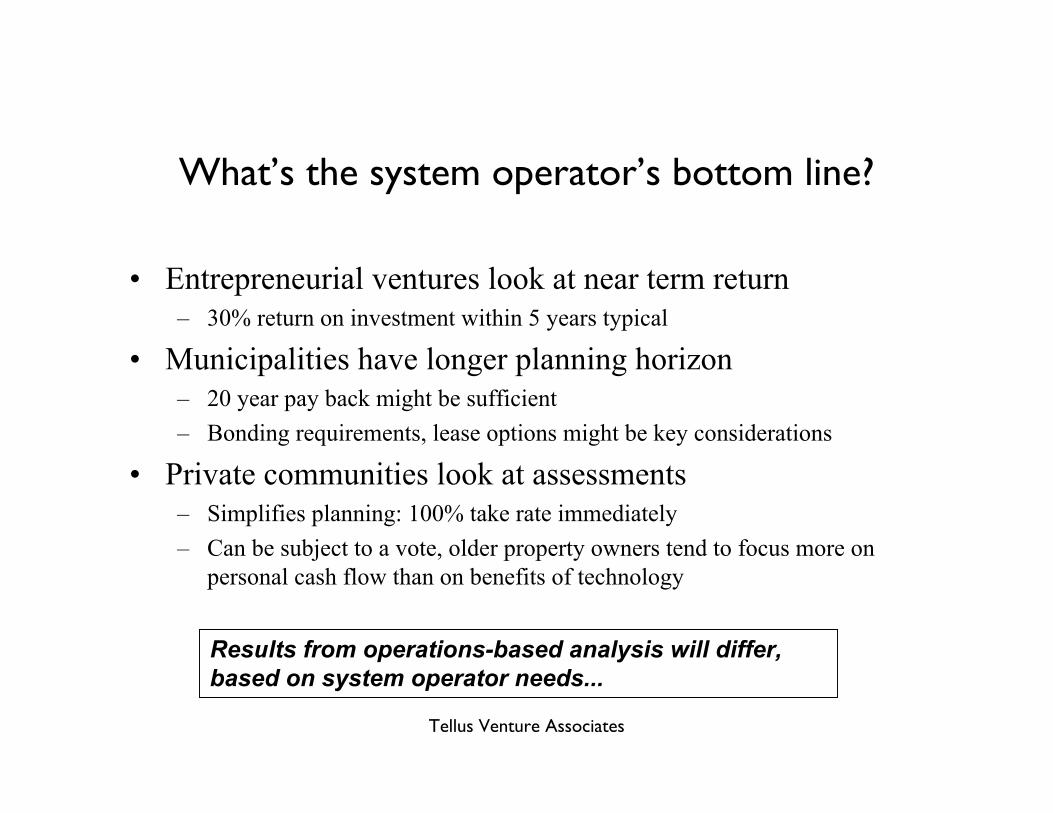
What’s the system operator’s bottom line?
• Entrepreneurial ventures look at near term return
– 30% return on investment within 5 years typical
• Municipalities have longer planning horizon
– 20 year pay back might be sufficient
– Bonding requirements, lease options might be key considerations
• Private communities look at assessments
– Simplifies planning: 100% take rate immediately
– Can be subject to a vote, older property owners tend to focus more on
personal cash flow than on benefits of technology
Results from operations-based analysis will differ,
based on system operator needs...
Tellus Venture Associates
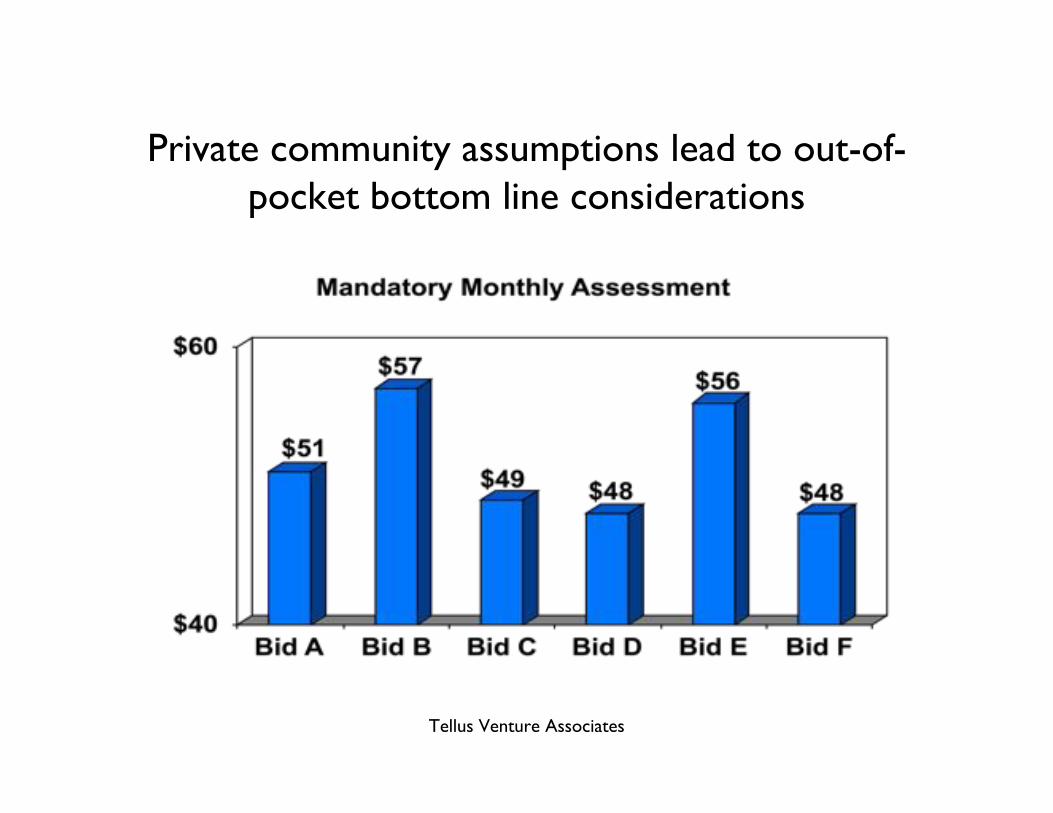
Private community assumptions lead to out-of-pocket bottom line considerations
Tellus Venture Associates
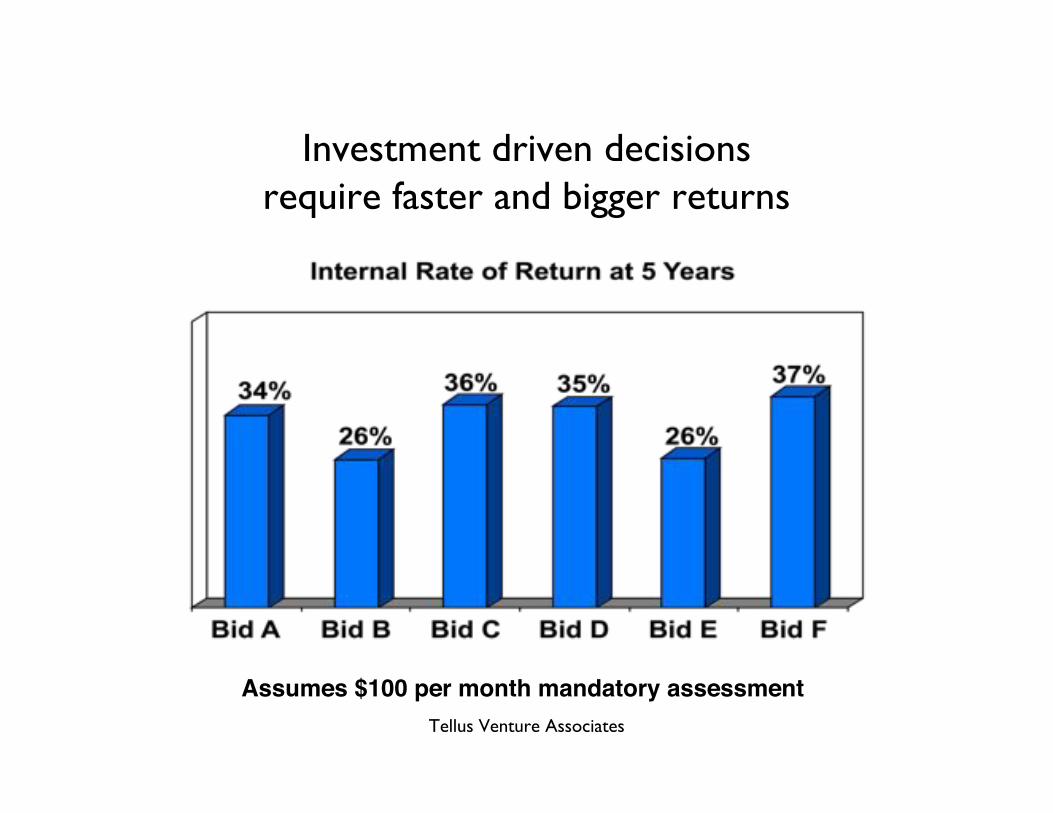
Investment driven decisionsrequire faster and bigger returns
Assumes $100 per month mandatory assessment
Tellus Venture Associates
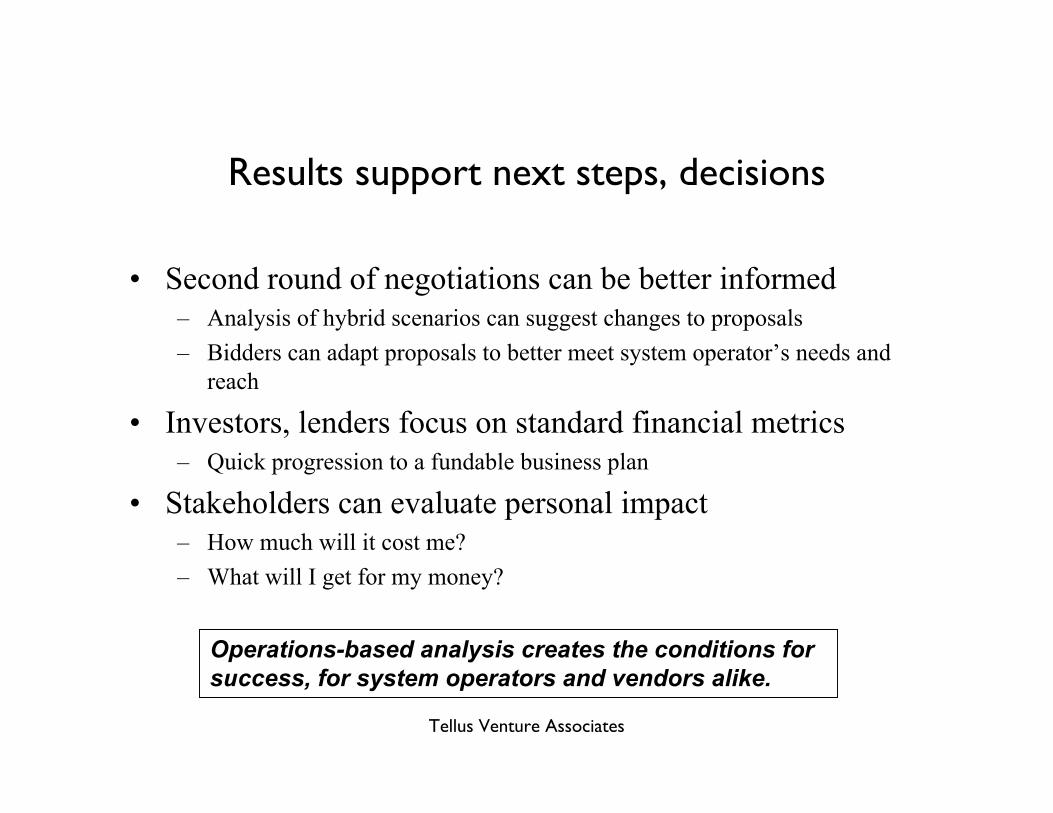
Results support next steps, decisions
• Second round of negotiations can be better informed
– Analysis of hybrid scenarios can suggest changes to proposals
– Bidders can adapt proposals to better meet system operator’s needs and
reach
• Investors, lenders focus on standard financial metrics
– Quick progression to a fundable business plan
• Stakeholders can evaluate personal impact
– How much will it cost me?
– What will I get for my money?
Operations-based analysis creates the conditions for
success, for system operators and vendors alike.
Tellus Venture Associates

Questions?
For more information...
Steve Blum
Tellus Venture Associates
1-831-582-0700
www.tellusventure.com