Embed Size (px)
Citation preview

Module - 2Finance & IT Applications
in a Distribution Utility

Module - 2Finance & IT Applications
in a Distribution Utility
HRD DepartmentCESC Limited

Module - 2Finance & IT Applications in aDistribution Utility
This 2013 FIRST EDITION publishedby Human Resource Department, CESC Limited
1st Printing March, 2013
Printed in India

Power Distribution business is undergoing significant changes with emergence of
market forces and growing customer expectations, introduction of legislative &
regulatory regimes and to keep pace with current economic development of our
country. Primary objective is to raise the bar to enhance performance level by way of bringing
competition. The key indicators are availability of power, reliability of T & D network, high
system efficiency and focused customer service.
In order to institutionalize the above journey and to trigger changing scenario of high
performance level and sustaining growth in power business, role of Human resources has
assumed paramount importance. CEA in their recently issued Regulations on “Measures
relating to Safety & Electric supply 2010” has also elaborated the need of specific training for
the personnel engaged in operation and maintenance of Transmission Distribution system,
electrical plants etc.
In its zeal to develop multi skilling and multi-functional competency & to improve efficiency,
BESCOM has reposed faith in the training methodology of CESC and has entrusted AIPM, the
external training arm of CESC Limited, to conduct programmes on different modules covering
the entire gamut of power distribution technology including change management. AIPM
conducted a series of visits to various BESCOM sites, interacted with a sample cross section of
people to identify the gaps for development of the training material. This Course Book, meant
for technical officers, has been cast as a study material to provide an insight into Financial
System of an Utility, IT applications in Distribution Management, Distribution Tariff principle
and basic concept of Smart Grid, considered essential in running a power distribution company.
However, we appreciate that this being a process of continuous development, there would be
scope for further improvement of the contents of the handbook.
I am confident that this booklet shall be a useful guide for the BESCOM engineers for refreshing
their knowledge and understanding. I am thankful to BESCOM for giving CESC an opportunity
to share its experience and thus enriching itself and all those who have directly contributed to
ensure timely compilation of this booklet.
Dated 18 , March, 2013th
Foreword
Sd/-
Gautam Ray
Executive Director (HR & Admn)


Unit - 2 : Distribution Tariff Calculation
Unit - 3 : IT applications in Distribution management
Unit - 4 : Communication System & SCADA 58 - 65
Unit - 1 : Finance
Chapter Page
1 – 43
44 - 48
49 - 57
TABLE OF CONTENTS
Finance & IT Applications in a Distribution Utility
Course Material : A2 Module

Note

Learning Objectives
MODULE : A2
UNIT-1
FINANCE
After studying this unit, you should
be able to understand:
Ø Fundamentals of Finance
Financial Statement – Preparation,
Analysis, Interpretation
Cost of Capital, Leverage, Trading
on Equity
Working Capital Management
Cost, Revenue & Capital
Expenditure Budget & Budgetary
Control
Financial Control & Risk, Fraud &
Window Dressing
Tariff Determination for Power
Distribution Companies
Corporate Governance and
Financial Reporting
Stock Market, Foreign Investment,
Dividend Policy
Ø
Ø
Ø
Ø
Ø
Ø
Ø
Ø

Note

1
The word “Finance” was originally a French word and interpreted as “management of money” in older
days. Today “Finance” has emerged as a subject of high degree of importance and significance and
regarded not only as an art but also a science of managing various resources like assets, investments,
securities, liquid cash, creditors and other liabilities, borrowed fund etc. as well as managing
procurement of funds at the most economic rate and the best utilisation of such fund for productive
activities and carrying business operations. Thus, “Finance” has become a branch of economics in
modern era concerning resource allocation and management, acquisition, investment and markets – both
commodity and securities. In lighter sense, when we talk about “Finance”, we automatically think about
money. The manner in which we handle our money can make the difference between being financially
stable or unstable. This is true both for personal finance, corporate finance and Government finance.
“Finance” is now the life lime of economic activities all over the world and managing finance is now
regarded as a very skilled function and a subject matter of academic discipline with high significance,
research and value added service to the society.
1.1 FUNDAMENTALS OF FINANCE
Simply, “Finance” deals with money matters.

2
1.1.1 Classification Of Finance
Framework
Functions & Relationship
Private Finance Public Finance
PersonalFinance
BusinessFinance
Govt.Finance
Economic Activities of PublicEnterprises
CORPORATE
FINANCE
1. Concerned with the acquisition, management andutilization of fund by business entities - both in Private
and Public sector
2. Boosts up county’s economic condition
3. Has relationship with marketing management
5. Has significant role in corporate sustainability
4. Influenced by macro-economic environment
CORPORATE
FINANCE
What is macro - economic environment ?
? Economic system of a country or world.
? Change in total output, employment, price index, effects of investments, tax policies,
government revenue and expenditure.
? County’s fiscal policies, capital and credit market structure, Govt. Regulations.
? Economic behaviour of individual and other business activities.

3
1.1.2 Features of Corporate Finance
Assets Creation
Earning decision & opportunities
Business Growth decision making / Project
Financing
Optimum utilisation of fund
Profit Maximisation
Financial solvency in long term operation
Working Capital Management
Loan Management
Corporate / Individual Taxation
Financial Internal Control Management
Investment Acquisition
Presentation of Financial Information
Accounting Policies decision
Regulatory / Statutory compliances of financials
Corporate Social Responsibility
Human Capital Creation
Building of stake holders’ confidence
Fe
atu
res
o
f C
orp
ora
te F
ina
nc
e

4
1.1.3 Traditional Management of Corporate Finance
1.1.4 Changing Role of Finance
Corporate Finance is managed by the Finance Dept. lead by Director (Finance).
Finance Dept. deals with all financial matters of a business / company and has a significant role
in business success and growth.
Maximising return on investment is the prime function of the Corporate Finance Dept.
Decision on financial strategy with the objectives of achieving healthy bottom lime is the focus
area of Corporate Finance Dept.
Raising money that the corporate needs to operate is the basic functions of Corporate Finance
Dept.
Corporate Finance Dept. is also responsible for controlling the fund raised by it and growing of
funds through investments.
Interaction of Corporate Finance Dept. with other departments of the Company is of utmost
importance for timely allocation of adequate funds to achieve business goals.
Presenting financial accounts and information through financial statements is a major function
of the Finance Dept.
Management of corporate finance is now moving away from traditional functions and
becoming a key element as strategic business partners, directly linked with decision making and
planning process.
Business partnering model looks finance as a value added functions with dual role - seeing
company as a holistic organisation and advising non-financial colleagues about sustainability,
growth, opportunities, threat and risk.
Finance Dept. now-a-day plays a pivotal proactive role in driving a business into the next
decade and formulating future road map for growth and diversification.
l
l
l
l
l
l
l
l
l
l
“Finance is the art of passing currency from handto hand until it finally disappears”

5
"Financial Statements are prepared for the purpose of presenting periodical view orreport on progress by management and deal with the status of the investment in thebusiness and results achieved during the period under view"-American Institute of Certified PublicAccountants
1.2 FINANCIALSTATEMENT - PREPARATION,ANALYSIS, INTERPRETATION
1.2.1Anatomyof Financial Statements
1.2.1.1 Definition & Meaning
1.2.1.2 Contents
1.2.1.3 Usefulness
1.2.1.4 Features
Financial Statement (FS) is a written report of the financial condition and health of a business concern. It
is a collection of reports consisting of Profit & Loss Account, Balance Sheet & Cash Flow Statement.
Simply, it provides a snapshot of the current financial standing of the business. It also furnishes useful
information to various interested parties like shareholders, creditors, stock exchange, bankers, lenders
etc. Hence it needs to be reliable and relevant. In order to be reliable and relevant, while preparing FS,
Generally Accepted Accounting Principles (GAAP) are followed to make them acceptable to layman.
Financial Statement contents :
Balance Sheet showing the entity's assets, liabilities and shareholders' equity as on the reporteddate.
Income Statement showing the results of the entity's operations and financial activities for theperiod under review.
Statement of cash flow showing the changes in the entity's cash flow during the period underreview.
Accounting notes mentioning various accounting policies, details of various broad expenses etc.
Auditors' Report.
Preparation of financial statement is the last step of accounting cycle.
FS is useful for the following reasons :
Determines the ability of an enterprise to generate cash and sources and uses of the cash.
Tracks trends of financial results.
Assesses whether a business has the capability to mitigate its debts.
Derives financial ratios indicating true business condition.
Investigates certain business transactions.
General Features
Reflects of business entity's progress - Net operating results and effect of various transactionsare reflected.
Records financial facts - Prepared from all sets of accounting records maintained throughoutthe year
Adheres to GAAP & AS - Accounting treatment requirements under GAAP and IndianAccounting Standards (AS) followed during preparation of FS.
l
l
l
l
l
l
l
l
l
l
l
l
l

6
Qualitative Features
l
l
l
l
l
l
l
l
l
l
l
l
l
l
l
l
l
l
l
l
l
Understandability - Information provided must be readily understandable to the users of the FS.
Relevance - Information furnished are to be relevant to the users for facilitating economic
decision.
Reliability - Accounting treatment requirements under GAAP and Indian Accounting Standards
followed during preparation of FS.
Comparability - Information must be comparable over the accounting period for trend analysis.
Prudence - Information must be based on prudent accounting treatment.
FS can be of the following class :
Comparative FS - Aset of FS showing the results of the current and previous period.
Consolidated FS - Financial Statement of a group of entities i.e. Parent Company with subsidiaries.
Proforma FS - Financial Statement incorporating assumptions and estimations that may occur in
future period of business operation, showing projected results of an entity.
Only monetary factors are considered.
Effects of inflation not reflected.
Window dressing possible.
Management - For framing policy, review decision, futuristic growth opportunity.
Investors - For assessing of earning capacity, solvency position and growth opportunities of the
entity as they are interested about risk and return on investment.
Creditors - For judging credit worthiness of the firm.
Lenders / Bankers - For determining debt-service coverage position, debt-equity relationship,
profitability etc.
Govt. / Regulators - For assessing tax liability, tariff control and determination
Employees - For getting clear ideas about the health of the Company.
Trade Unions - For addressing disputes over pay settlement / revision of wages.
Research Associations - For conducting industry-wise performance research.
As per Company's Act, 1956, FS of a company must be prepared in compliance with Schedule VI
and Accounting Standards.
General features of Schedule VI :
Mandatory in nature.
Stipulated minimum disclosure. Company may disclose more information.
Balance Sheet discloses stock of various assets and liabilities at a point of time and P/L A/c shows
the movement throughout the year. P/L A/c shows the net flow during a period. Effect of such flow
is reflected in the Balance Sheet.
Both are complimentary to each other. They alone cannot provide the information in meaningful
manner.
1.2.1.4 Classification
1.2.1.5 Limitation
1.2.1.6 Importance to various users
1.2.1.7 Financial Statement & Companies Act :
1.2.1.8 Relationship between Profit & Loss Account & Balance Sheet

7
1.2.2 Financial StatementAnalysis & Interpretation
What and why
Objectives & Needs
Limitations
Steps
Approach
Financial Statement records financial data. In order to make these financial information meaningful to
users, these data should be evaluated through financial statement analysis. Therefore FS analysis can be
defined as an evaluative method of determining the past, current and future projected performance of a
business entity. FS analysis helps business and professionals improve their financial information and
thus guides them to make more prudent and informed decision making.
To measure operational efficiency and any financial weakness of the firm.To obtain better understanding of the performance and position of the firm.To know business solvency position.To check movements of cash of the firm.To make inter-firm, intra-firm comparison and growth potential.
Ignore non-monetary factors.Ignore qualitative aspects of business.Analysis of historical data does not provide meaningful information.Does not provide information on cost accounting, human resources accounting and inflation.
Processing of financial data - furnished by P/L A/c and Balance Sheet are rearranged, restructuredfor analysis purpose.
Application of Analysis Tools Comparative financial Statement.Trend AnalysisRatio AnalysisFund & Cash Flow Analysis
Traditional Approach - Involving collection of data from P/L A/c and Balance Sheet and toevaluate the raw data to provide information to various users.
Modern Approach - Applying several tools and techniques to analyse FS more meaningfully,thus reflecting more reliable, dependable data and financial position of thefirm.
l
l
l
l
l
l
l
l
l
l
l
l
l
"Financial Statement Analysis is largely a study of relationships among the variousfinancial factors in a business, as disclosed by a simple set of statements, and a study oftrends of these factors, as shown in a series of statements" - Myer

8
1.2.3 Techniques orTools of Financial StatementAnalysis
1.2.4 Gaap,Accounting Conventions, Doctrines,Assumptions and Concepts
1.2.4.1Gaap
1.2.4.2Accounting Conventions & Doctrines
After generating data tools are applied for FS analysis, most commonly used tools are :-
- Meaningful comparison of financial position of one
accounting period to other.
- Inter-firm comparisons.
- Financial data are converted into percentage to some
common base e.g. % of net profit to sales.
- Past is analysed to forecast future.
- Data of past years are analysed for comparison.
- Reflects the direction of change of financial position.
- Future forecast is possible.
- Determinant of relationship of two data.
- Provides comparative study between the data.
- Presents the strength and weakness of business.
- Expressed in mathematical terms.
- Powerful tool of analyzing the performance of a
concern.
- Fund refers to working capital and flow refers to
movement.
- Primarily a statement showing the movement of
Working Capital (WC).
- Shows separately sources and application of WC.
- Analyses the reasons for various changes that have
taken place in the value of assets and liabilities during
the year.
Refers to the rules, regulations, conventions and principles accepted by the majority of the business
entity. That is GAAP is a common set of accounting principles, standards and procedures that business
entities use to compile their financial statements. GAAP are mandatory and thus investors will have a
level of consistency for financial statement analysis.
Refers to the set of rules followed for achieving objects of accounting - transparency, understand ability,
meaningful interpretation of financial data, comparative analysis, supportive to managerial decisions.
Doctrine of Disclosure - Disclosure of accounting policies, contingent liability, EPS.
Doctrine of Materiality - Not all, only very important and material information to be disclosed.
Doctrine of Conservatism - Anticipate no profit, but recognize all possible loss.
Doctrine of Historical Cost - Assets are recorded at its actual cost, not on fair value.
Doctrine of Reliability - Provides correct information for investors' accurate decision making.
Doctrine of objectivity - Portraying true and fair view of financial status.
l
l
l
l
l
l
l
l
l
l
l
Comparative Financial Statement
Common Size Statement
TrendAnalysis
RatioAnalysis
Fund Flow Statement

9
1.2.4.5 AccountingAssumptions & Concepts
1.2.5 Elements Of Balance Sheet & Profit / LossAccount
1.2.5.1 Balance Sheet (BS)
Refers to those basic rules which are universally followed by all entities in business in preparing financial
statements.
Fundamental accounting assumptions are :
Going concern : The enterprise is usually viewed as a going concern having continuous
operations in foreseeable future.
Consistency : Accounting policies are consistent from one period to another.
Accrual : Revenues and expenses are accrued and recognized as earned or incurred and not
money received or paid basis.
l
l
l
l
l
l
l
Every balance sheet must give a true and fair view of the state of affairs of the company and must be
in a prescribed form as set out by the Companies Act, 1956 (Sch. VI).
The three key components of BS are :
Assets
Liabilities
Owners' Equity (Shareholders' Fund
The BS equation is : Owners' Equity = Assets - Liabilities
(Shareholders’ Fund)
Example
` cr.
Current Assets 5.0
Non-current Assets 8.0
Total Assets 13.0
====
Current Liabilities 1.5
Non-current liabilities 2.1
Total liabilities 3.6
Net Assets 9.4
Owners’ Equity 9.4
? Assets - ? Represent expected future economic benefits.
? Measurable in terms of money.
? Has the capacity to exchange with other.
? Owned by the enterprise and has the legal right to use it.
? Has a cost that can be ascertained with reliability.
? On the basis of physical existence, it can be tangible and
intangible.
? Usually divided into two categories - Fixed (Non -current) and
current.

10
l l
l
l
l
l
l
l
l
l
- Represent expected future economic benefits.
Measurable in terms of money.
Has the capacity to exchange with other.
Owned by the enterprise and has the legal right to use it.
Has a cost that can be ascertained with reliability.
On the basis of physical existence, it can be tangible and intangible.
Usually divided into two categories - Fixed (Non-current) and current.
FixedAssets - Employed directly in the production / distribution process and held for long
period. Fixed assets are not held for resale. Deplete with the usage or passage of
time. Example : Land / Building, Plant / Machinery, Vehicles, Office Equipment
etc.
CurrentAssets - Temporary in nature and change their form during the accounting period.
Current Assets are maintained for smooth operation of business. Example -
Stock, Short-term investments, Cash / Bank balances, Debtors, Loans &
advances to employees etc.
Liabilities - Refer to a financial obligation to be discharged.
Must arise due to past transactions.
Once recognized, continues to remain as liability till discharged.
Measurable in terms of money.
Results in future outflow of resources.
Long-term liability - Not payable within a short period of time usually 12 months e.g. long term
borrowing, consumers' security Deposits.
Current liability - Payable within 12 months since recognized. e.g. short tem borrowings, trade
payable, Proposed dividend.
Contingent liability - May arise in future depending upon the happening /non-happening of an
uncertain event. Example : Disputed Income Tax Claim / Excise duty claim etc.
- Net worth of the business.
Equals the difference between assets and liabilities.
Represents the amount belongs to the shareholders after meeting all
financial obligations.
Owners' Equity (Shareholders' Fund) : Share Capital + Reserves & Surplus
Funds set aside for future use. Reserves are that funds which were withdrawn from general or specific
profit of business and kept it in safe custody of Company.
Reserves are classified as 'Capital Reserve' and 'Revenue Reserve'. Capital Reserve cannot be utilized
for distribution of dividend. However, dividend can be declared from revenue reserves.
When dividend proposed is more than 20% of the paid-up capital, at least 10% of the current profit is to
be transferred to ReserveAccount.
For any reserve, additions and withdrawals to / from the balance at the beginning of the year must be
shown.
Assets
Owners' Equity
Nature ofAssets
Nature of liabilities
Reserve & Surplus
Reserves

11
Example : General Reserve, Capital Redemption Reserve, Debenture Redemption Reserve, Securities
PremiumAccount, Revaluation Reserve etc.
It is the credit balance lying in the Profit & LossAccount of the Company.
Every Company's P & LAccount must give a true and fair view of the profit or loss of the Company for ayear.
Revenue (Meaning) - Means sale proceeds or other cash inflows of the firm arising dueto normal activities of the business. It is basically gross inflowsof cash bySale of goodsRendering of servicesUsing other resources of the business e.g. rent from property,interest from investment, royalty from trade mark etc.
Revenue -Refers to the appropriate time for considering and accounting of revenue for(Recognition) determination of Profit or Loss.
- Recognition of revenue depends on agreement between the parties involved inthe transaction.
Expenses - Refer to the cash outflow for transacting an service etc. in normal course of(Meaning) business e.g. rent, salaries, interest, repairs etc.
Any expense which does not generate revenue in turn is termed as loss e.g. loss on fire, baddebt etc.
Expenditure - Expenditure directly related to revenue generation of the firm - Direct(Recognition) Expenditure.
Expenditure indirectly related to revenue generation of the firm -Indirect Expenditure.
Surplus
l
l
l
l
1.2.5.2 Profit & LossAccount
? Loan
Loan
Secured Loan Unsecured Loan
Debenture, Loan from Financial Institutions (FIs) / Bank, Public Deposit, Short term Loan
Foreign Currency Loans, Bonds from banks
? Interest accrued and due on s ecured / unsecured loans should be included under the head
‘Secured Loan / Unsecured Loan’.
? Interest accrued but not due is shown under Current Liabilities.
? For Secured Loans, nature of Securities is to be disclosed in Annual Report.
Sale of assets are not revenue. It is termed as "Gain" because such benefitsarise out of transactions not linked with normal business activities.

12
l
l
l
l
l
Expenditure(Classification)Capital Expenditure - The cost, benefit of which does not exhaust in current accounting year.
It is recorded as "Asset" in Balance Sheet. It has the ability to generaterevenue in future.
Revenue Expenditure - The cost, benefit of which expires in the current accounting period.Such expenditure ceases to generate future benefits.
Income - Refers to the excess of revenue over expenditure.
"Income is generally conceived to be a residuum income which emerges out of matchingagainst revenue" - Harry Norris.
Expired cost : Basically revenue expenditure, benefit of which expires in the current accountingperiod.
expiredcost
Accounting Concept of Income
Depreciation
Bad Debt
Mandatory Disclosure of major Expenses
I = (R+G) - (E+L), where I = Income,R = Revenue,G = Gain,E = Revenue ExpenditureL= Loss
For accounting purpose, depreciation indicates how much of an asset's value has been used uptodate.Abusiness firm depreciates fixed assets for both tax and accounting purpose.It is charged to P/LAccount for the period in which the assets are used.Two major methods of computing depreciation expenses - Straight Line Method (SLM) andReducing Balance Method (RBM) .SLM = Rate of depreciation xActual cost of assetsRBM = Rate of depreciation x Book value at the beginning of the year.Rates of depreciation on % of WDV have been prescribed in Income TaxAct, 1961.Rates of depreciation as % of WDV and SLM have been prescribed in CompaniesAct, 1956.Rates of depreciation for power generating companies as % of actual cost have been prescribed inIncome Tax, 1961Mandatory for every company to disclose the amount provided for depreciation & amortisationActsas a tax shield and increases firm's cash flow.
Defined as that part of the accounts receivable that will likely remain uncollected.Appears as an expense on the company's income statement, thus reducing net income.Occurs when products / services are sold on credit.Amount of bad debt is based on "guesstimate".The ratio of bad debt losses and credit sales is an indicator of quality and efficiency of creditmonitoring process of a business firm.
Value of raw materials consumedRent, rates, taxes and insuranceRepairs to building / Plant & MachineryDepreciationProvisions of expensesPayment toAuditorsProfit / loss on sale of assets / investmentsDividend proposed
l
l
l
l
l
l
l
l
l
l
l
l
l
l
l
l
l
l
l
l
l

13
Classification of Profit
Definition & Meaning
Usefulness
CFS deals with cash collection and cash disbursement. That is CFS records the amount of cash and cashequivalent entering and leaving a company.
CFS helps investors to get an idea about how a company's operations are running, where from its moneyis coming and how it is being spent.
Cash flow is determined by taking into account three components by which cash enters and leaves acompany :
Operating activities
Investing activities
Financing activities
Opening and closing cash & bank balances are also shown in this statement.
Cash flow statement is prepared in compliance with the Accounting Standard on Cash Flow Statement(AS-3) as per The Companies (Accounting Standards) Rules, 2006.
Cash from operating activities is compared to the company's net income. If the former is greater than thenet income on consistence basis, the company's net income or earning are said to be of higher category.In reverse situation, a red flag is raised as to why the reported net income is not converting to cash.
If a company consistently generates more cash than it is using in a year, the company will be able toreduce debt burden, acquire another company etc. All these add to shareholder's value.
Useful for short term planning.
Helps management in formulating policies regarding internal financial management - repayment of longterm debt, dividend policies, capital expenditure planning etc.
Discloses success or failure of cash planning.
Basically, more cash available for business operation, the better. However, this is not a hardand fast rule. Sometimes a negative cash flow results from a company's growth strategy inthe form of expanding operations.
l
l
l
1.2.5.3 Cash Flow Statement (CFS)
Profit
Profit prior to Incorporation Profit after Incorporation
Capital Profit Revenue Profit
No dividend can be paid out of this profit Dividend can be paid out of this profit
14
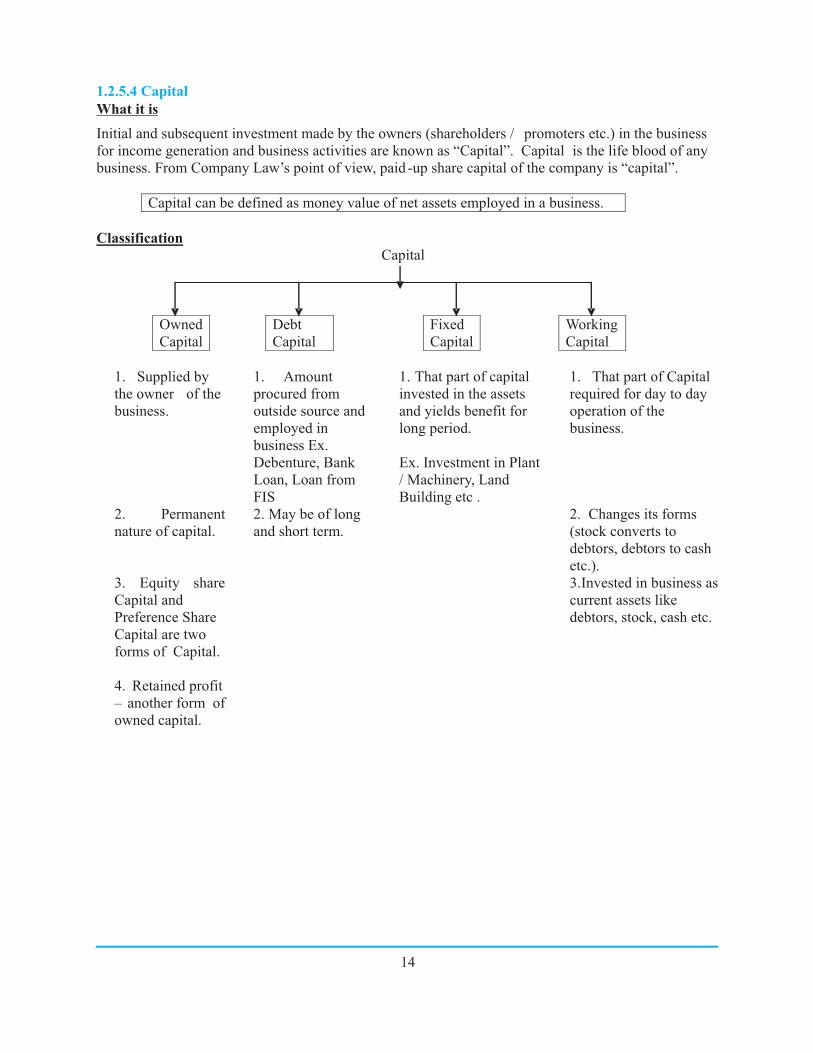
1.2.5.4 Capital
What it is
Initial and subsequent investment made by the owners (shareholders / promoters etc.) in the business
for income generation and business activities are known as “Capital”. Capital is the life blood of any
business. From Company Law’s point of view, paid -up share capital of the company is “capital”.
Capital can be defined as money value of net assets employed in a business.
Classification
Capital
Owned
Capital
Debt
Capital
Fixed
Capital
Working
Capital
1. Supplied by
the owner of the
business.
1. Amount
procured from
outside source and
employed in
business Ex.
Debenture, Bank
Loan, Loan from
FIS
1. That part of capital
invested in the assets
and yields benefit for
long period.
Ex. Investment in Plant
/ Machinery, Land
Building etc .
1. That part of Capital
required for day to day
operation of the
business.
2. Permanent
nature of capital.
2. May be of long
and short term.
2. Changes its forms
(stock converts to
debtors, debtors to cash
etc.).
3. Equity share
Capital and
Preference Share
Capital are two
forms of Capital.
3.Invested in business as
current assets like
debtors, stock, cash etc.
4. Retained profit
– another form of
owned capital.

15
Sources of Capital
Capital for corporate bodies is raised from various sources
Sources of Capital
? IDBI ? ADB ? Loan from Bank
? ICICI
? IFCI
? UTI
? LIC
? International
Finance
Corporation etc.
? Cash Credit
? Overdraft facility
? Public Deposit
? Intercorporate Deposit
? SIDBI ? Commercial Paper
? PFC ? Trade Creditors
etc. ? Lease Financing etc.
Sweat Equity Shares
? Issued to employees / directors of the company in lieu of their services at a discount or for
consideration other than cash.
? It is a new form of compensation to employees.
? SEBI has issued guidelines for Sweat Equity Shares.
? Amount of share capital increases due to issue of Sweat Equity Shares.
Employee Stock Option Plan (ESOP)
? It is a plan by which a company offers stock options to its employees for achieved
performance.
InternalSource
ExternalSource
1. Retained Earnings2. Provision for depreciation
Debt / BorrowedCapital
Owned Capital
EquityShare
PreferenceShare
Redeemable Convertible Cumulative
Debenture FinancialInstitutions
OtherSources
Redeemable Convertible Domestic International
Convertiblewarrants/
GDR/VentureCapital

16
? It is an option given to employees to buy shares of their own company on a predetermined
date and at a predetermined price.
? Employee gains due to price difference on investment - return criteria.
? SEBI has issued guidelines for ESOP.
? Amount of share capital increases for ESOP scheme exercise.
Provisions
? A provision is an amount set aside for the probable but uncertain economic obligation
of a business organisation and charged against P & L A/C.
? A provision is always made for a specific purpose.
? It is not for the distribution to the shareholders.
? The purpose of provision is to make current year’s profit / loss more accurate and to
cover a future liability.
? Under GAAP, a provision means expense .
Examples : ? Provisions for doubtful debt
? Provision for taxation
? Provision for proposed dividend
Provision reduces the Company’s equity.
1.2.6 Ratio Analysis
1.2.6.1 Meaning? A ratio is a mathematical derivative that provides a measure of relationship between two
financial figures.
? It is the most widely used technique for interpreting and comparing financial reports.
? Accounting ratios based on past performance is helpful in predicting the future
performances.
? Both internal and external groups use the ratios.
1.2.6.2 ClassificationClassification is based on the statement from which ratios are calculated. Thus there are :
(1) Balance Sheet Ratios based on Balance Sheet figure, (2) P & L Account Ratios based on P & L
Account, (3) Combined Statement Ratios, based on both Balance Sheet and P & L Account.
Balance Sheet Ratios P / L Ratios Combined Ratios
1. Current Ratio 1. Gross Profit Ratio 1. Return on Capital
Employed
2. Liquid Ratio 2. Operating Ratio 2. Fixed Asset Turnover
Ratio
3. Proprietary Ratio 3. Net Profit Ratio 3. Debtors’ Turnover Ratio
4. Asset -Proprietorship
Ratio
4. Stock Turnover
Ratio
4. Inventory Turnover Ratio
5. Debt – Equity Ratio 5. Interest Coverage
Ratio
5. Debt – Service Coverage
Ratio
? Ratios can further be
classified as:
Liquidity Ratio Solvency Ratio
Activity Ratio Profitability Ratio

17
Measurement
Liquidity Ratio - Current Ratio Liquid Ratio
- Measures the ability of a firm to meet its short term obligations.
Current Ratio = Current Assets_
Current Liabilities
Liquid Ratio = Quick Assets
Current Liabilities
(Quick assets = Cash + Bank + Debtors +
Receivables)
Solvency Ratio - Debt-equity Ratio, Proprietary Ratio, Interest Coverage
Ratio
-
Indicates the Company’s ability to pay its liabilities as they
become due
Interest Cove rage
Ratio
= Earning before
Interest & Tax (EBIT)
Interest
charge
Debt - Service
Coverage Ratio
= PAT + Interest +
Depreciation
Debt repayment +
Interest
Activity Ratio
-
Stock Turnover
Ratio
Debtors Turnover
Ratio
Total Assets Turnover Ratio
Shows the degree of fixed and current assets utilisation in a business
Gross Profit Ratio = Gross Profit x 100
Net Sales
[The more GP earned, better]
Debt - Equity Ratio = Long term Debt
Shareholders’ Fund
Proprietary Ratio = Shareholders’ Fund
Total Assets
Stock Turnover Ratio = Cost of Goods Sold
Average stock
[Indicates how quickly the inventory is sold]
Debtors Turnover Ratio = Credit Sales
Average Debtors
[Indicates the no. of times per year the
average balance of debtors are collected]
Total Assets Turnover Ratio
=
Net Sales
Total Assets
[A low ratio indicates that assets are
not being efficiently employed]
Profitability Ratio - Gross Profit Ratio Net Profit Ratio Operating Ratio
- Measures the returns achieved by the company through normal
business activities and management’s overall efficiency.

18
Operating Ratio
=
Cost of goods sold + operating expenses
x 100
Net Sales
[Lower the ratio, greater the
ability to carry a large burden of
fixed overhead]
Return on Capital Employed = EBIT
Capital Employed
[Measures how well the firm is using all of
its assets]
? Illustration – Ratio Analysis
The Balance Sheet of ABC Ltd. as on 31.12.2012 was as below:-
Liabilities Amount ( )̀ Assets Amount ( )`
Equity Share Capital 20,000 Goodwill 12,000
Capital Reserve 4,000 Plant & Machinery 28,000
Loan (Term) – 8% 16,000 Stock 6,000
Trade Payables 8,000 Debtors 6,000
Bank Overdraft 2,000 Investment 2,000
Taxation 4,000 Cash & Bank 6,000
P & L A/C : 12,000
Less : Transfer to Reserve 4,000
Less : Dividend 2,000
6,000
60,000
----------
60,000
Calculate ratio for testing liquidity, solvency and profitability.
Sol. Liquidity Ratios
Current Ratio =
=
Quick Ratio =
=
Current Assets =
Current Liabilities
20,000 = 5:3 (good)
12,000
Quick Assets =
Current Liabilities
14,000 = 7:6 (sound)
12,000
Stock + Debtors + Investment + Cash & Bank
Trade Payable + Taxation
Debtors + Investment + Cash & Bank
Current Liabilities
Solvency Ratios
Solvency Ratio = Total Assets =
Total outside liabilities
60,000 = 15:7 = 2.1:1 (Solvency certain)
28,000
Profitability Ratios
Return on Total Assets = EBIT =
Total Assets
11,280 x 100 =
60,000
18.8%
Return on Capital
Employed =
EBIT =
Shareholders’ Fund
+
Fixed Liabilities
11,280 =
48,000
23.5%
19
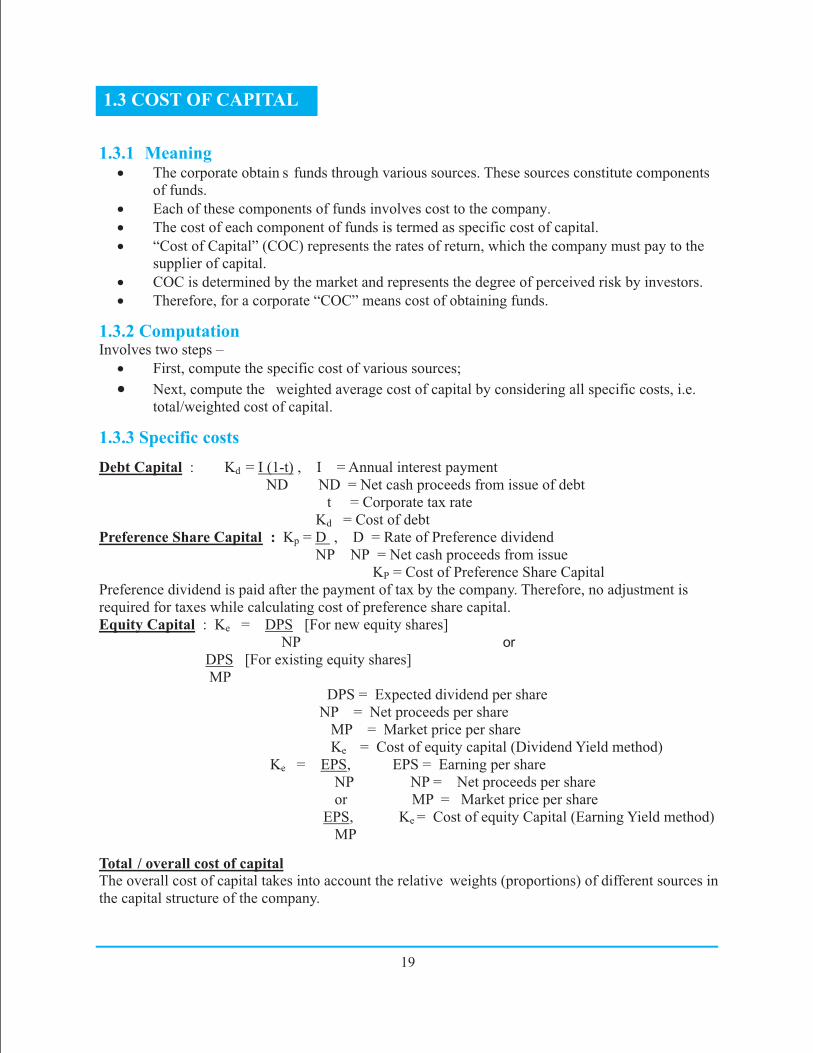
1.3.1 Meaning? The corporate obtain s funds through various sources. These sources constitute components
of funds.
? Each of these components of funds involves cost to the company.
? The cost of each component of funds is termed as specific cost of capital.
? “Cost of Capital” (COC) represents the rates of return, which the company must pay to the
supplier of capital.
? COC is determined by the market and represents the degree of perceived risk by investors.
? Therefore, for a corporate “COC” means cost of obtaining funds.
1.3.2 ComputationInvolves two steps –
? First, compute the specific cost of various sources;
? Next, compute the weighted average cost of capital by considering all specific costs, i.e.
total/weighted cost of capital.
1.3.3 Specific costs
Debt Capital : Kd = I (1-t) , I = Annual interest payment
ND ND = Net cash proceeds from issue of debt
t = Corporate tax rate
Kd = Cost of debt
Preference Share Capital : Kp = D , D = Rate of Preference dividend
NP NP = Net cash proceeds from issue
KP = Cost of Preference Share Capital
Preference dividend is paid after the payment of tax by the company. Therefore, no adjustment is
required for taxes while calculating cost of preference share capital.
Equity Capital : Ke = DPS [For new equity shares]
NP or
DPS [For existing equity shares]
MP
DPS = Expected dividend per share
NP = Net proceeds per share
MP = Market price per share
Ke = Cost of equity capital (Dividend Yield method)
Ke = EPS, EPS = Earning per share
NP NP = Net proceeds per share
or MP = Market price per share
EPS, Ke = Cost of equity Capital (Earning Yield method)
MP
Total / overall cost of capital
The overall cost of capital takes into account the relative weights (proportions) of different sources in
the capital structure of the company.
1.3 COST OF CAPITAL

20
Illustration
X Ltd. issues `20,00,000/- 11% debentures of `100/- each. The Company pays 35% tax.
What is debentures?the cost of
Kd = I (l – t) , I = ` 2,20,000/- , t - 0.35, ND = ` 20,00,000/-
ND
= 2,20,000 (1- 0.35) = 7.15%
20,00.000
X Ltd. issues `1,000/- 8% Pref. share capital of `100/- each at a discount of 5%. Determine
the cost of preference shares.
KP = D , D = 8% (1000 x 100) = ` 8,000/-
NP NP = (1,000 x 100) – 5% (1,00,000) = ` 95,000/-
= 8,000 = 8.42%
95,000
X Ltd. issues 9,000 equity shares of ` 100/- each at a premium of 10%. The equity
shareholders ectation of dividend is 20%. Calculate the cost of new equity share.exp
Ke = DPS , DPS = 20
NP NP = ` 100/- + 10% of `100/- = ` 110/-
= 20 = 18.18%
110
Find out the overall / total cost of capital of X Ltd.
Sources of Funds Amt ( )̀ Weights After Tax cost Wt. cost
Debentures 20,00,000/- 0.67 7.15 4.79
Pref. Shares 1,00,000/- 0.03 8.42 0.25
Equity Capital 9,00,000/- 0.30 18.18 5.71
---------------
30,00,000/-
=========
-------
1.00
==== =====
Wt. cost of capital 10.75%
1.3.4 Leverage
Meaning
? Leverage is the technique which projects the risk - return relationship of different
variables of capital structure,
? Primary aim of coverage testing is maximize the earning of shareholders and reduce
the risk of company.
? Leverage is a sensitive tool in the hands of finance managers.
Types
Two types of leverage - 1) Operating Leverage & 2) Financial Leverage
1.3.5 Operating Leverage? Refers to the use of fixed costs in operations.
? A firm with high operating leverage will have relatively high fixed operating cost in
comparison with a firm with low operating leverage.

21
1.3.7 TRADING ON EQUITY
Trading on equity indicates the utilisation of non-equity source of funds in the capital structure of an
enterprise. Trading on equity explains the impact on return on equity. The main objective of trading on
equity is to provide a high rate of return to the equity shareholders. In other words, it means borrowing
funds to increase capital investment with the hope that the business will generate returns in excess of
interest charges of the borrowed fund.
Degree of operating leverage (DOL) = % change in EBIT
% change in sales
DOL is the measure of the firm’s business risk which refers to the uncertainty of the firm’s EBIT.
1.3.6 Financial Leverage? Refers to the extent to which the firm has fixed financial cost, arising from the use of
debt capital.
? A firm with high financial leverage will have relatively high fixed financing cost.
? FL studies the sensitivity of EPS to EBIT.
Degree of Financial Leverage (DFL) = % change in EPS or EBIT
% change in EBIT EBT
? FL measures the financial risk of a company.
? Illustration
1. Determine the operating leverage for the two companies from the data gi ven below and also
comment on their operating risk.
X Co. Ltd. Y Co. Ltd.
( lac)`
Sales
Fixed
Cost
( lac)`
30 lac 40 lac
9 lac 20 lac
The variable costs are 40% of sales for X Co. Ltd and 20% for Y Co. Ltd.
Sol.
Sales X Co. Ltd.
( lac)`
Y Co. Ltd.
( lac)`
Sales
Less Variable cost
Contribution
Less Fixed cost
Operating Profit (EBIT)
30
12
18
9
9
40
8
32
20
12
Degree of operating leverage (DOL) = Contribution
EBIT
18 = 2.0
9
32 = 2.7
12
The operating or business risk of Y Co. Ltd. is greater as its DOL is higher than DOL of X Co. Ltd.

22
1.4 WORKING CAPITALMANAGEMENT
"He understands me," we say with elation when someone perceptively listens to us: "Oh, forget it," we
say in frustration when others don't listen or understand. How are you as a listener? What are your beliefs
about listening? Indicate whether you agree or disagree with the following:
"The financial highlights offered at thebeginning of the report tend to focus onwhat they want you to see--- but that's
just an appetizer, …. The second course--- the big plate of meat and potatoes---
is the financial statement"__ Richard Loth
? Meaning & Definition
? The primary objective of working capital management (WCM) is t o manage the firm’s
current assets and current liabilities in such a way that a satisfactory level of WC is
maintained. WCM is the functional area of finance.
“Working Capital is the amount of funds necessary to cover the cost of operating the enterprise ” –
Shubin
? WC is defined as the excess of Current Assets over Current Liabilities & Provisions.
WC = CA - CL.
? Components
Two components of WC are : Current Assets & Current Liabilities

23
Current Assets Current Liabilities
? Raw materials stock ? Creditors (Trade Payables)
? Work -in-Progress ? Short-term loans & advances
? Other inventories ? Outstanding Expenses
? Finished goods stock ? Provision for Taxation
? Debtors (Trade Receivables) ? Unclaimed Dividend / Public Deposit
? Cash / Bank balances ? Other Current obligations
? Short term loans & advances ? Retention money from contractors etc.
? Prepaid Expenses
? Deposits
? Claims receivables etc.
? Classification
? Gross Working Capital (GWC) - Refers to the Capital invested in total current assets of a firm.
GWC = Total Current Assets.
A firm should maintain optimum level of GWC in order to avoid interruption of production activity.
Net Working Capital (NWC) – Refers the excess of total current assets over total current liabilities.
NWC = Total current Assets - Total Current Liabilities
? Significance
? Both GWC and NWC are important from firm’s operation point of view. There is no
specific rule to determine the exact amount of gross or net working capital.
? Both inadequate or excess WC is dangerous from entity’s health point of view.
Maintaining adequate WC is important for - ? Regular supply of raw materials
? Regular payment of wages / overhead expenses
? Uninterrupted flow of Production
? Solvency of the firm
? Maintaining good Credit Standing
? Facing sudden market crisis
? Increasing profitability
1.4.1 Working Capital Cycle
Working Capital Cycle (WCC) is very significant in order to determine the WC requirement of a businessconcern. WCC is defined as the period that a business firm takes in converting cash back to cash.Simply, it refers the time duration that starts from procurement of raw materials through cash payments /credit term and ending with the realization of cash through sales.
Cash
Debtor
Finished Goods
Creditor/Supplier
Raw Materials/Labour

24
1.4.2 Working Capital Requirements
? Influenced by a number of factors – both internal and external, such as:-
? Nature and size of business
? Sales volume
? Production cycle
? Operating efficiency
? Credit Policy
? Credit accessibility
? Price level changes
? Degree of competition
? Sources
? May be internal or external
? Internal sources –
? Retained earnings
? Provision for depreciation
? Outstanding expenses
? External sources –
? Issue of share/debenture
? Loans from FIs/Banks
? Public Deposits
? Advance from customer
? Commercial papers
? Trade creditor
1.4.3 Management of WC? The main object of WC management is to manage the current assets and liabilities in such a
way that optimum level of WC is maintained.
? Significances of WC management are to ensure -
? Higher profitability
? Proper liquidity
? Sound health of the organization
? Management of current assets involve -
? Management of Inventory (i.e. optimum level of inventory of raw
materials/finished goods)
? Management of Receivables (i.e. allowance of credit to customer and
collection of debt)
? Management of cash (i.e. avoiding holding of excessive liquid cash or
excessive investment in short term fund)
? Management of current liabilities involve -
? Management of Creditors (i.e. bargaining with credit period without
unfavorable terms)

25
? Illustration
XYZ Ltd
Balance sheet as at 31.03.2012
Liabilities ` Assets `
Equity Share Capital 4,00,000 Fixed Assets 6,60,000
10% Debentures 2,20,000 Stocks/Inventory 1,60,000
Reserves & Surplus 1,00,000 S/Debtors (Trade
Receivables)
1,00,000
S/Creditors (Trade Payables) 3,00,000 Bills Receivable 80,000
Outstanding Expenses 40,000 Cash/Bank balances 1,60,000
Proposed Dividend 60,000
Provision for Taxation 40,000
11,60,000 11,60,000
Calculate Gross and Net working capital:
Sol. Total Current Assets ` `
Stocks/Inventory 1,60,000
S/Debtors (Trade Receivables) 1,00,000
Bills Receivable 80,000
Cash/Bank balances 1,60,000 5,00,000
Total Current Liabilities
S/Creditors (Trade Payables) 3,00,000
Outstanding Expenses 40,000
Proposed Dividend 60,000
Provision for Taxation 40,000 4,40,000
Gross Working Capital (GWC) `5,00,000
Net Working Capital (NWC) Total Current Assets – Total Current Liabilities
= `5,00,000 – 4,40,000
= `60,000 (Positive)
1.5.1 Cost
? In business and accounting, ‘cost’ is the monetary value that a company has spent in order to
produce something .It does not include mark-up for profit. In accounting, the term ‘cost’ refers
to the monetary value of expenditure for r aw materials, equipments, labour, services, rent,
taxes, electricity etc.
? The companies usually follow cost plus model to determine the sale price of a product. Price =
Cost + X % (X is the percentage to cover overhead or profit margin).
1.5.1.1 Elements of cost? Direct Material
1.5 COST, COST STATEMENT, CONTRIBUTION, COST-VOLUME-PROFIT RELATIONSHIP

26
? Direct labour
? Direct expenses
? Overhead expenses
1.5.1.2 Classification of Cost? Classification by division :
? Prime cost = Direct Material + Direct Labour + Direct Expenses
? Works Cost = Prime cost + Factory overhead
? Cost of production = Works cost + Administrative overhead
? Cost of sales = Cost of production + Distribution & Selling overhead
? Sale price = Cost of sales + Profit Margin
? Classification by relationship :
? Fixed cost (Does not directly vary with production volume)
? Variable cost (vary directly in proportion with production volume)
? Semi variable cost (fixed upto a certain level of production, then increases with the
increase in volume of production).
1.5.1.3 Cost Accounting (CA)
? A technique and process for ascertaining cost.
? Aims to capture company’s cost of production by assessing the input cost as well as fixed
cost.
? Serves three crucial functions of management
? As an aid to financial accounts
? As an aid to planning
? As a means of co-ordination and control
? Does not replace financial accounting; merely an extension into accounting fields.
1.5.1.4 Difference with Financial Accounting (FA)
? CA is used within the company as an aid in decision making, FA is analysed by outside
investors, lenders, bankers etc.
? CA is beneficial as a to ol for management in budgeting and cost control programme, FA is a
different representation of cost and tools for managerial performance analysis.
1.5.2 COST STATEMENT
? A general format :
Particulars Amount Amount
Opening Stock of Raw Material
Add: Purchase of Raw materials
Add: Purchase Expenses
Less: Closing stock of Raw Materials
Raw Materials Consumed
Direct Wages (Labour)
Direct Charges
***
***
***
***
***
***
***
Prime cost ***
Add :- Factory Over Heads:
Factory Rent ***

27
Add :- Factory Over Heads:
Factory Rent
Electricity
Indirect Material
Indirect Wages
Supervisor’s Salary
Factory Insurance
Depreciation (Factory Asset)
***
***
***
***
***
***
***
Works cost incurred ***
Add: Opening Stock of WIP
Less: Closing Stock of WIP
***
***
Works cost ***
Add:- Administration Over Heads:-
Office Rent
Depreciation (Office asset like Furniture
fixture)
General Charges
Audit Fees
Bank Charges
Back Office Salary
Other Office Expenses
***
***
***
***
***
***
***
Cost of Production ***
Add: Opening stock of Finished Goods
Less: Closing stock of Finished Goods
***
***
Cost of Goods Sold ***
Add:- Selling and Distribution OH:-
Sales man Commission
Sales man salary
Traveling Expenses
Advertisement
Delivery expenses
Sales Tax
Bad Debts
***
***
***
***
***
***
***
Cost of Sales ***
Profit (balancing figure) ***
Sales ***
? Cost Statements for electricity companies have been prescribed in Cost Accounting Records
(Electricity Industry) Rules, 2011.
1.5.2.1Marginal Cost
? Based on an economic concept.
? It is the addition / reduction to the total cost when one more / less unit is produced.
? Computed in situations where the break even point has been reached.
? Industries requiring heavy capital like power, marginal cost is comparatively very low.
? Concept of marginal cost is important for resource allocation.
28
1.5.4.1 Cost Control & Cost Reduction
l
l
Cost control primarily refers to monitoring and controlling those areas where “inputs” are applied
and their utilization in the production process. Control of costs consists in measuring performance
and comparing it with the standards. A major requirement of cost control is analysis and
investigation of variances and taking necessary corrective steps.
Cost reduction is a concurrent function of self evaluation and assessment of existing standards of
operation and performance. Cost reduction begins where cost control ends. In spite of high level of
cost control, there is always a room for reduction in operation cost and improvement in cost
standard. A firm's net income is increased when reduction in operating cost in materials, labour and
overhead occurs.
1.5.3 Contribution? It is the difference between sales revenue and variable cost .
? It can be expressed in two ways:
• Sales Revenue – Variable Cost
• Fixed Cost + Profit
? An important term used with break - even point or break - even analysis is contribution
margin. In equation format it is defined as follows:
The contribution margin for one unit of product or one unit of service is defined as:
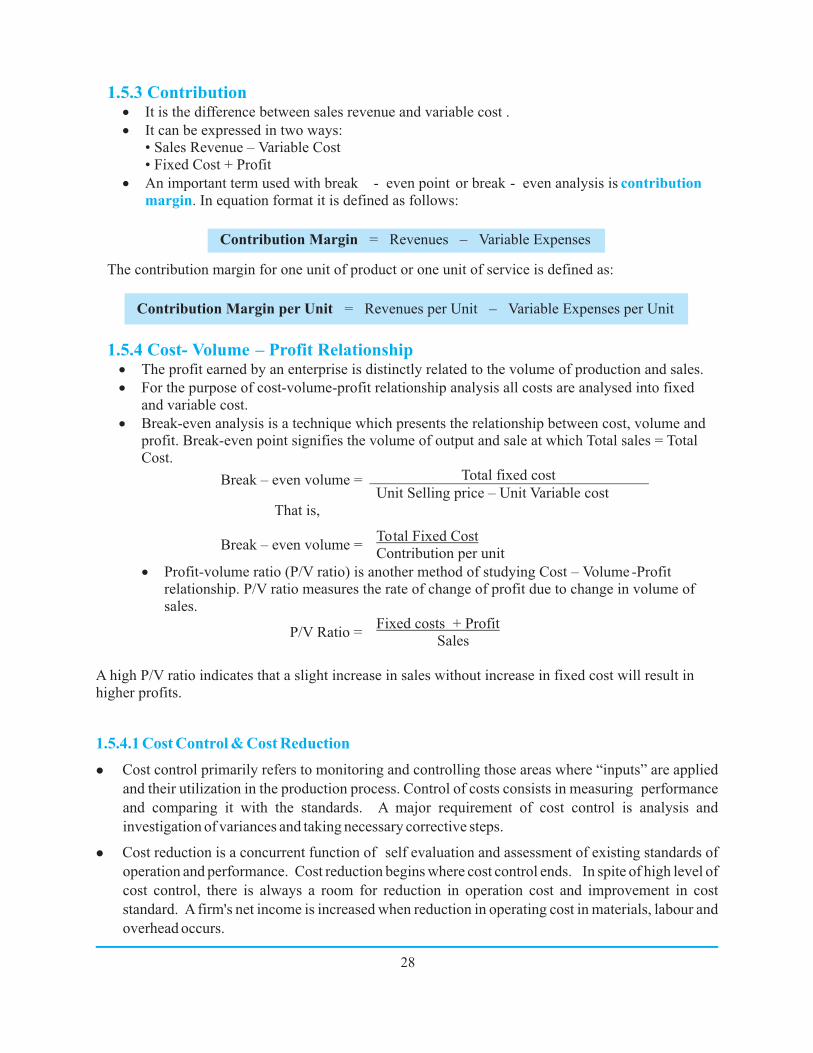
Contribution Margin per Unit = Revenues per Unit – Variable Expenses per Unit
1.5.4 Cost- Volume – Profit Relationship? The profit earned by an enterprise is distinctly related to the volume of production and sales.
? For the purpose of cost-volume-profit relationship analysis all costs are analysed into fixed
and variable cost.
? Break-even analysis is a technique which presents the relationship between cost, volume and
profit. Break-even point signifies the volume of output and sale at which Total sales = Total
Cost.
Break – even volume = Total fixed cost
Unit Selling price – Unit Variable cost
That is,
Break – even volume =Total Fixed Cost
Contribution per unit
? Profit-volume ratio (P/V ratio) is another method of studying Cost – Volume -Profit
relationship. P/V ratio measures the rate of change of profit due to change in volume of
sales.
P/V Ratio =Fixed costs + Profit
Sales
A high P/V ratio indicates that a slight increase in sales without increase in fixed cost will result in
higher profits.
Contribution Margin = Revenues – Variable Expenses

29
1.5.4.2 Cost centre
1.5.5 Revenue Expenditure BudgetAnd Budgetary Control
1.5.5.1 Meaning
1.5.5.2 Kinds of Budget
1.5.5.3 Functional Budget
l
l
l
l
l
l
l
l
l
l
l
l
l
l
l
l
The cost control and cost reduction mechanism demands that performance / efficiency of individual
or functional department should be assessed continuously. It is, therefore, necessary to define and
delimit the control functions, the area of control and responsibility. The concept of 'cost centre'
takes shape from the above philosophy.
Defined as “a location, person or item of equipment connected with an undertaking, in relation to
which costs may be ascertained and used for the purpose of cost control.”
Cost Centre must be a distinct, well defined unit for which various nature of costs are incurred.
In a power distribution company, transmission and distribution functions can be two separate cost
centres. Again, for distribution function, distribution of power at 33 Kv voltage, at 11 kv voltage
or at 6 kv voltage may be separate cost centres.
Budget is a financial plan of events during a specific future period.
Budget is influenced by management policies and prevailing market and operating conditions.
In case of commercial activities, budget is a monetary statement of targets intended to be achieved.
Budget can be viewed as a medium of planning, co-ordination, communication and control.
Budget can be divided into three groups :-
Functional Budget
Accountability Budget
Operating Budget
Sales Budget
Purchase Budget
Inventory Procurement Budget
R & D Budget

30
? Capacity Expansion Budget
1.5.5.4 Accountability Budget? Departmental Budget
? Cost Centre Budget
1.5.5.5 Operating Budget? Fixed Budget (For predetermined level of activity)
? Flexible Budget (For different volumes of activity / operation)
1.5.5.6 Ultimate advantage? The budget makes the people concerned at all levels alert and responsible. Fixing
responsibility is easier as performance is mapped and actuals are assessed against the
budgetary target.
1.5.5.7 Budgetary Control
? Implies continuous comparisons of actuals with the budgeted figures.
? Ensures that when plans are not achieved, corrective actions are taken.
? Provides basis for the comparison of actual vis -a-vis predetermined targets and investigates
the deviation.
? Focuses on the best uses of all available resources towards profit maximization and wealth
creation.
? Frames a basis for revision of current and future policies.
1.5.6 Capital Budgeting & Capital Rationing
1.5.6.1 What is Capital Budgeting
? A decision making process by which firms evaluate and rank the potential purchase of major
fixed assets, building, plant & machinery etc. which are not meant for sell.
? A process in which a business determines whether projects like construction of a new plant
or investing in a venture of a separate operation are worth considering.
? A project adds value to the company i f it earns a rate of return that exceeds the cost of
capital. However, capital budgeting is very challenging in practice. Determining company’s
appropriate cost of capital and forecast of incremental cash flow that results from taking of
the project are a difficult proposition.
? Capital budget also signifies the estimated amount planned to be expended for capital items
in a fiscal period.
“Capital budgeting involves the planning of expenditure for assets the returns from which
will be realized in future time period” – Milton H Spencer
1.5.6.2 Significance
? Necessary because capital for investment in long-term facilities is scarce.
? Maximises the wealth for shareholders.
? Has implications in social sector.? May result in substantial financial loss in future due to non-judicious decisions.
1.5.6.3 Techniques of evaluation
There are various methods to evaluate the profitability of capital investment proposals. The
major methods are :
? Average rate of return (ARR) method

31
ARR = Av. PAT x 100
Av. Investment
ARR is compared with a predetermined rate of return. An investment project is accepted if the
actual ARR is higher than the desired rate of return.
? Pay back Period (PB) method
PB = Initial Investment
Annual Cash Flow
PB indicates the number of years a firm expects to recover its original investment. Usually, firms
use the pay
back period method as an accept or reject criteria.
? Net Present Value (NPV) method
NPV
=
? Pv of cash inflows after
tax -
? Pv of all cash
outflows
NPV takes into account the time value of money while appraising investment proposals. If NPV > 0,
the project should be accepted and rejected if NPV < 0.
? Internal Rate of Return (IRR) method
IRR = ? Pv of all cash inflows after
tax
? Pv of all cash outflows
IRR of an investment project is that rate which equates the present value of all future cash inflows
from the project to the initial cost of the project.
1.5.6.4 Cost-overrun of Capital expenditure
When actual cost is more than the value of works completed upto a certain time period, there is said
to be a cost overrun.
Cost overrun = Actual cost – value of works completed x 100
Value of works completed
Value of works completed = (Budgeted cost ) x % of works completed.
1.5.6.5 Capital Rationing
? Capital Rationing (CR) means distribution of available capital amongst several acceptedinvestment proposals.
? It arises in a situation where a business entity is not in a position to invest and allot capital
fund in all profitable projects due to limited financial resources.
? Under such situation, a firm has to reject some viable projects and to select an optimum
combination of projects that will yield maximum return to the shareholders.

32
1.5.6.6 Capital Work-in-Progress (CWIP)
1.5.6.7 Capital Commitment
1.5.6.8 Interest during construction (IDC)
1.5.6.9 Bridge Finance
1.6.1 Meaning
1.6.1.1 Objectives
l
l
l
l
l
l
l
l
l
l
l
l
l
l
Refers to that part of capital expenditure work awaiting completion but expenditure incurred during
a financial year. CWIP is termed as "Assets under Construction" and shown separately in the
balance Sheet
Depreciation is not charged on CWIP.
On completion of construction for commercial use, CWIP is capitalized and transferred to Asset
Class concerned.
It is a possible liability and outflow of fund in future arising out of capital expenditure decision and
jobs in progress. A company has to disclose its capital commitments amount in the financial
account.
When an asset is constructed, the companies usually borrow funds from market to finance the
project. The interest so paid on such borrowed funds is capitalized during the assets construction phase.
When the asset is constructed fully and put into use, any additional interest expenses incurred , if any,
is not capitalized as part of the cost of asset. This interest is expensed on the income statement.
Financial Institutions provide loan for a big project. Financial closure for a project is a time
consuming exercise. For kicking off the project at a definite time, the company needs fund. To start
the project, company takes some loan from banks until the loan from FIs are finally disbursed. This
loan is termed as "Bridge Finance".
Financial Control (FC) is a process by which quantitative and qualitative aspects of different
investment planning is controlled in a business enterprise.
FC control process involves the procurement and control of fixed and working capital of the firm
through budgetary control, cost control, cash flow control etc.
Ensuring efficient and correct utilization of resources.
Maintaining a balance between cash inflow and outflow.
Identifying the scope of cost reduction for higher net income.
Adopting budgetary management and control.
· Planning for efficient use of financial resources.
1.6 FINANCIALCONTROL
33
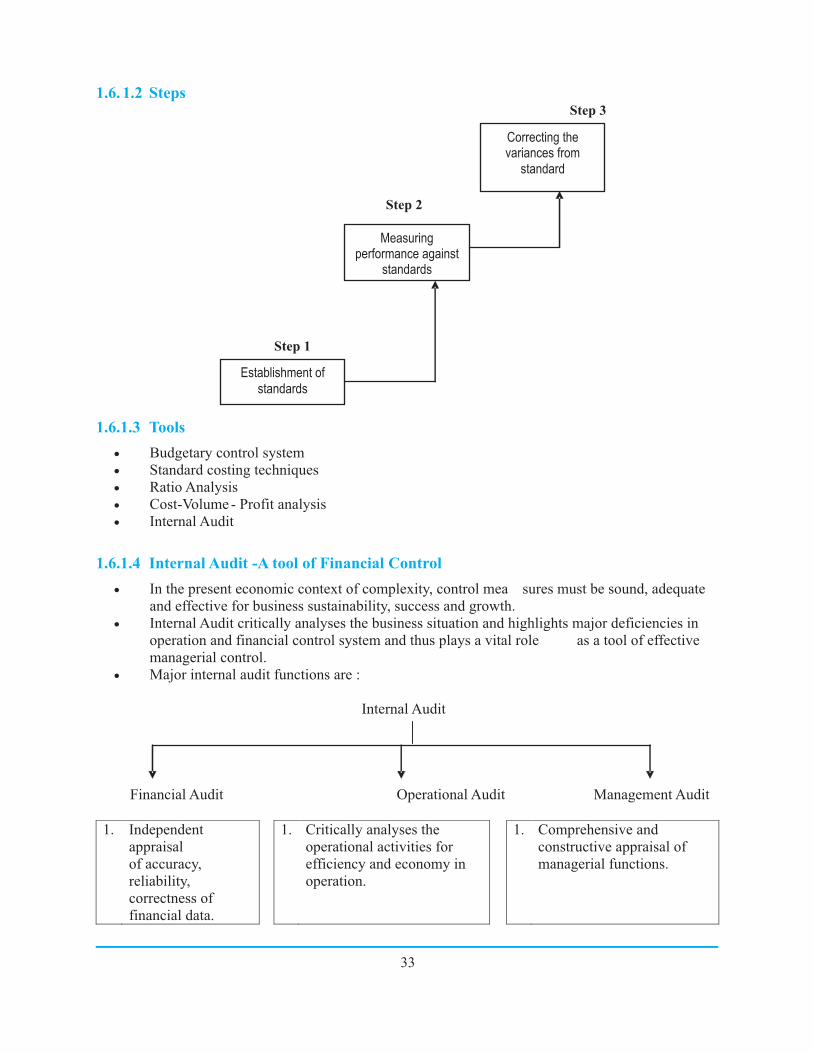
1.6. 1.2 StepsStep 3
Step 2
Step 1
1.6.1.3 Tools
? Budgetary control system
? Standard costing techniques
? Ratio Analysis
? Cost-Volume - Profit analysis
? Internal Audit
1.6.1.4 Internal Audit -A tool of Financial Control
? In the present economic context of complexity, control mea sures must be sound, adequate
and effective for business sustainability, success and growth.
? Internal Audit critically analyses the business situation and highlights major deficiencies in
operation and financial control system and thus plays a vital role as a tool of effective
managerial control.
? Major internal audit functions are :
Internal Audit
Financial Audit Operational Audit Management Audit
1. Independent
appraisal
of accuracy,
reliability,
correctness of
financial data.
1. Critically analyses the
operational activities for
efficiency and economy in
operation.
1. Comprehensive and
constructive appraisal of
managerial functions.
Measuringperformance against
standards
Establishment of
standards
Correcting thevariances from
standard

34
2. Evaluates the
adequacy of con trol
systems and
comments on its
function.
2. Emphasises on the core of
operation and minimization
of wastage.
2. Measures the performance
of business as a whole
towards the goal
achievement.
3. Ensures protection
of company’s
assets.
3. Reports on re source
utilisation scenario.
3. Evaluates the effectiveness
and efficacy of framed
systems, procedures and
methods in business
process.
4. Verifies compliances
of standards,
accounting prudence
and statutes.
4. Used to gather decisive
information for specific
business developments.
4. Focuses on results and cause
and effect analysis.
1.6.2 Financial Risk in Business
l
l
l
l
l
l
Financial risk refers to a situation when business's cash flow are not enough to pay creditors and
fulfill other financial obligations. The level of financial risk thus relates less to the business
operations and more to the amount of debt, business taken for carrying out the operation.
High level of debt or other financial liability increases a business's level of financial risk
A Company's financial risk is linked with the company's leverage. For a company with high degree
of leverage, the financial risk to stockholders is high if a company cannot cover its debt and faces
bankruptcy and thus sufficient return to shareholders are uncertain.
Financial risk can also relate to making investment in other companies within and outside the
country.
There are two types of financial risk broadly - 1) Risk of insolvency, and 2) Risk of variability in the
earnings available to equity shareholders.
Financial risk can also be categorized as systematic risk and non-systematic risk. Systematic risk
affects the whole economy and all business units within the economic spheres .e.g. losses due to
recession. Non-systematic risks are those risks that affect a group of industry / companies. These
non–systematic risks can be avoided completely through proper planning.
? Example of financial risk ? Interest rate risk on borrowing
? Amount of credit availability risk
? Sluggish sales and consequent cash flow
risk
? Market risk

35
1.6.3Accounting Fraud & Window Dressing
1.6.3.1Accounting Fraud
It is an intentional act of deception involving financial transactions for purpose of personal
gain. One of the biggest accounting frauds in history occurred during the Enron scandal
(2001), Global Trust Bank (2004) and Satyam Computers ( 2009).
It is intentional
Involves falsification of records
Misrepresents truth
Causes harm to its victims
Teeming and lading - also called lapping, it involves allocation of one customer's payment
to another to make books balance or to detract shortfall.
Asset misappropriation (theft) and embezzlement - employee takes cash or property from
business to cover their tracks.
Fraudulent disbursements - involves billing schemes, payroll frauds, cheque tampering
etc.
Corruption - employee disobeys company policies / business regulations for personal
gain.
Financial statement fraud - manipulating sales / accounts receivable / stock / cost of goods
sold, understating liabilities and expenses, overstating assets, window dressing etc.
l
l
l
l
l
l
l
l
l
l
l
l
l
What is it
Characteristics
Forms

36
1.6.3.2 Window dressing
1.6.4 Financial Controls, IfrsAnd ErpAs Enabler
1.6.4.1 Financial Controls
It is a set of actions or manipulations with financial or other information in financial
documents (financial statements, reports etc.) to make this information look more attractive
to its users. It is an assortment of alterations to make a financial statement so that it appears in
a favourable light. It is also known as creative accounting or financial statement fraud.
To borrow money.To reduce tax payments.To smoothen financial data.To hide problems / poor management decisions.To show good performance.To shoot up market price of shares.To show good return on investment.To display steady profitability.
Decrease profits by increasing expenses.Record sales or purchases in an inappropriate period.Increase cash account balance by increasing useful life of fixed assets.Changing depreciation method - increases expected life of assets to increase profits.Changing stock valuation method -increases closing stock value to elevate profits.Income smoothing - shows consistent income by shifting income from high income
period to low income period.Ambiguity in capital and revenue expenditure - revenue expenditure treated as capital
expenditure and vice versa to elevate profits.Sale and lease back - fixed assets are sold to third party but later each year a sum is paid
and asset is leased back. Company does not own the asset but still uses it.
Financial data analysis and interpretation are the first step of financial decision making process
by any investors, analysts and regulators anywhere in the globe. A meaningful decision making
exercise can be performed provided the presented financial data in a set of financial statements
are reliable, relevant, comparable and exhibit a true and fair view of the state of affairs of the
company. Internal financial control system is regarded as the foundation of ensuring data
integrity and transparency in reporting a company's financial health.
Internal financial controls review the practices, procedures and processes being applied to
control the financial transactions and safeguarding company's assets.
At present, CEO/CFO's certification to the Board in respect to submission of true financial
statements, compliances of accounting standards and occurrence of any financial fraud is
mandatory.
At present, CEO/CFO's certification to the Board in respect to submission of true financial
statements, compliances of accounting standards and occurrence of any financial fraud is
mandatory.
l
l
l
l
l
l
l
l
l
l
l
l
l
l
l
l
l
l
l
l
l
l
l
What is it
Why is it done
Forms

37
1.6.4.2 IFRS (International Financial Reporting Standards)
1.6.4.3 Financial Controls, IFRS and ERP
1.6.4.4 Features & Purpose of ERP
1.7.1Annual Revenue Requirement (ARR) for Distribution Business
l
l
l
l
l
l
l
l
l
l
l
l
l
l
l
l
l
l
l
l
l
l
l
l
IFRS is a new uniform accounting language designed to bring maximum clarity to financial
reporting on a global basis.
It's a global standard in context of preparation of financial statements.
It makes financial data analysis and interpretation easier to any investor of any part of the world.
Usage of one standardized format makes it easier for companies to raise capital via international
market, compete globally, entering in global contracts and provides comparable financial data.
Forward looking organisation always look for higher standard of governance and compliances to
control business and financial risks.
In this background, implementation of Enterprise Resource Planning (ERP) acts as a shield against
control lacuna and provides best business practices.
ERP technology acts as a key enabler in embracing IFRS and establishing error-free financial
reporting process through its control mechanisms.
With ERP, companies can automatically take advantage of embedded application tools towards risk
mitigation and control assurance.
On-line real time processing system enabling
Data validation before acceptance
System based control on transactions
Simultaneous updation of database.
Manual controls and preparation of MIS are history now. ERP is a strategic business solution
module, based on customized software aided system, that integrates all business functions and
allows flow of information across all the departments of the company.
The primary purpose of implementing ERP is to carry the business more efficiently in a very
competitive business environment.
It ensures high level of customer service, cost reduction, effective supply-chain management and e-
commerce.
Since ERP ensures total integration of operational data and financial data, it supports business
growth and helps in creating business innovations.
ARR is the revenue required by an utility, aggregating all operating expenses and return on equity at
a predetermined rate.
The major elements ofARR for a power distribution company are :-
Power Purchase Cost
O & M Expenses
Interest & Finance Charge
Interest on consumers' Security Deposits
Return on Equity (ROE), usually 16% post tax
Income-Tax
Non-tariff income and income from other business are deducted from total of ARR as calculated by the
utility.
1.7 TARIFFDETERMINATION FOR POWER DISTRIBUTION COMPANIES

38
1.7.1.1 Other General Conditions
1.7.1.2Accounting System
1.7.1.3 Efficiency in operation
1.7.1.4 EnergyAccounting &Auditing
1.7.2 Corporate GovernanceAnd Financial Reporting
l
l
l
l
l
l
l
l
l
l
l
l
l
l
l
l
State Commissions are required to specify the terms and conditions for determination of tariff (u/s
61 of EA, 2003) based on :
Commercial principles, ensuring recovery of reasonable cost of electricity.
Rewards for efficiency achieved.
Safeguarding consumers' interest.
In case of granting subsidy to any group of consumers the Govt. concerned should pay in advance to
the utility the amount of calculated subsidy. BPL category of subsidized consumer must be
consuming electricity <30 units / month and subsidized tariff should be at least 50% of the average
cost of supply.
Equity norms for tariff determination - Debt : Equity Ratio of 70:30
Operating norms are fixed on the basis of normative parameters as decided by the state commission.
Benefits under CDM to be taken into account for tariff determination.
The licensee should adopt a proper system of accounts and accounting procedure that would ensure
detailed and accurate financial cost, and consumption data on their operations.
Retail tariff should reflect the relative efficiency of distribution companies in processing power at
economic and competitive price, controlling theft / pilferage and reducing other distribution losses.
Present tariff determination system emphasizes on efficient energy accounting and auditing in order
to reduceAT & C losses to a very reasonable level.
According to Prof. Asish K. Bhattacharyya, transparent financial reporting is essential for sound
corporate governance; it is difficult to separate corporate financial reporting from Corporate
Governance.
The importance of Corporate Governance and financial reporting was highly felt all over the world
when corporate giants like Enron in UK and World Com in USA collapsed like a house of card in
2001 & 2002.
Agood corporate governance is a pillar of corporate set up projecting maximization of shareholder's
value legally, ethically and on a sustainable basis.
One of the main objectives of good corporate governance is to ensure that financial reporting
process and form is of the highest quality.
Financial reporting is the bridge that links company with the outside parties. The integrity and
quality of financial reporting are dependent on the performance and ethical conduct of people
involved in managerial functions.
"Corporate Governance is the procedures and processes according to which anorganisation is directed and controlled" - European Central Bank

39
l
l
l
l
l
l
l
l
l
l
l
l
l
l
l
l
l
l
l
l
l
l
Financial reporting is the bridge that links company with the outside parties. The integrity and
quality of financial reporting are dependent on the performance and ethical conduct of people
involved in managerial functions.
Failure in governance itself leads to false financial reporting mostly.
Research revealed that there has been a direct relationship between weakness in governance and
poor quality of financial reporting, manipulations in income statement, financial fraud and
ineffective internal control framework.
The Companies Act, 1956 has made clear legal framework for regulation of all companies in the
following areas towards ethical governance :-
Interested directors not to participate in voting / discussion.
Appointment of directors with the approval of shareholders.
Mandatory formation ofAudit Committee.
Contracts with parties having in house director's interest to be documented separately.
Central Govt's approval for loan to directors.
Power of the Central Govt. to prevent mismanagement of corporate affairs.
Listing Agreement under SEBI's direct supervision and various SEBI's Regulations have provided
specific compliance requirements by the companies towards achieving high standard of corporate
governance and financial reporting and protecting of shareholders' interest. The major
requirements are:-
Cl. 49 disclosure requirements relating to composition of board, code of conduct for board members,
role ofAudit Committee, CEO / CFO Certification of internal financial controls etc.
Disclosure of shareholding patterns.
Publication of Quarterly results.
Disclosure of price sensitive information.
Disclosure of pledged shares.
Disclosure of shareholding patterns.
Dealing of QualifiedAudit Reports.
Certification of share reconciliations etc.
Substantial acquisition of shares and takeovers procedures.
A stock market is a place where shares of companies are bought and sold. Indian stock market is
regulated by SEBI. Sensex and Nifty are two major stock market indexes. Bombay Stock Exchange
and National Stock Exchange are two major players in stock market.
Foreign Investments are classified into two categories - Foreign Direct Investment (FDI) and
Foreign Portfolio Investment (FPI).
FDI are those investments through which investor can take part in management and operational
function of a company. On the other hand, investment in shares without any control over
management and operations are treated as FPI.
1.7.2.1 Corporate GovernanceAnd India's Statutes
1.7.3 Stock Market, Foreign Investment, Dividend Policy
1.7.3.1 Stock Market
1.7.3.2 Foreign Investment

40
l
l
l
l
l
l
l
l
l
l
l
l
l
l
For making portfolio investment in India, the investors have to be registered as a foreign institutional
investor (FII) with SEBI.
Govt. of India prescribes the FDI limit and different ceilings have been prescribed for different
sectors.
Apolicy through which a company decides how much it will pay to shareholders as dividend.
Agood dividend policy aims at providing a regular and sizeable amount of dividend to shareholders
whilst allowing the company to maintain the financial stability and strength for future investment
opportunities.
A company earns profit. But all are not distributed to shareholders. Part of profit is ploughed back
as retained earnings. The ratio of actual distribution of dividend and the net distributable profits is
called 'Dividend Payout Ratio'.
Dividend Payout Ratio = Equity Dividend
Earning for Equity Shareholders
EPS is the net income of a company divided by no. of shares.
EPS = Net Earnings
No. of shares
Most significant variable in dictating a share's price in share market.
Basic EPS only takes into account the no. of shares outstanding at any point of time. Diluted EPS, on
the other hand, estimates how many shares could theoretically exist after exercising options
pertaining to warrants, convertible bonds etc.
Indicates the relationship between share price and the company's earnings.
PE ratio gives an idea of what the market is willing to pay for the Company's earnings.
PE Ratio = Market Price of shares
EPS
Asubsidiary company is a company having more than 50% of its shares owned by another company.
According to Sec. 4 of the Companies Act, 1956, if the composition of the Board of Directors of a
Company is controlled by another company, then the former company is a subsidiary of the latter
company.
If a company has subsidiary company(ies), the company shall present in the Annual Report, the
consolidated Financial Statement of holding Company and all subsidiaries, audited by its statutory
auditors.
The Consolidated FS must be prepared in strict compliance with applicableAccounting Standards.
1.7.3.3 Dividend Policy
1.7.3.4 Earning per Share (EPS)
1.7.3.5 Price Earning Ratio (PE Ratio)
1.7.4 Subsidiary & Holding Company
It's important to note that while resolving workplace conflicts, you need to consider your company's
regulations and policies. With the right conflict resolution approach and the proper tools and techniques
it will be easier to keep harmony among your team.
Conflicts can arise at any time. How you utilize conflict resolution strategies depends on both your
conflict style and your conflict resolution skills. There are many different ways to respond to conflict
situations; some conflict styles involve a considerate or cooperative approach while others involve either
a competitive or passive approach.
Those who have proper conflict resolution training understand how to diffuse the situation and reach an
agreement that satisfies all parties. The first step in conflict resolution is to understand the various styles
of conflict. The five styles of conflict include:
Avoiding or withdrawing from a conflict requires no courage or
consideration for the other party. By avoiding the conflict, you essentially pretend that it never
happened or doesn't exist. Some examples of avoidance or withdrawal include pretending there
is nothing wrong, stonewalling or completely shutting down.
in or accommodating the other party requires a lot of cooperation and little
courage. Basically, you agree to accommodate the other party by acknowledging and accepting
his point of view or suggestion. This style might be viewed as letting the other party have his
way. While this style can lead to making peace and moving forward, it can also lead to the
accommodator feeling resentment toward the other party
While standing your ground requires courage, it can also be
inconsiderate. By standing your ground, you are essentially competing with the other party;
you'll do anything to ensure that you win the battle. The fact is, a competitive approach offers
short term rewards, but in the long term effects can be detrimental to your business.
Compromising is a big step toward conflict resolution. Both courage and
consideration are used when both parties look for common ground. You agree to negotiate
larger points and let go of the smaller points; this style expedites the resolution process.
Occasionally, the person compromising might use passive-aggressive tactics to mislead the
other party, so beware.
Collaboration plays a major role within conflict resolution and requires great
courage and much consideration. Collaborating with the other party involves listening to their
side, discussing areas of agreement and goals, and ensuring that all parties understand each
other. Collaboration requires thinking creatively to resolve the problem without concessions.
Collaborators are usually admired and well-respected.
Assertiveness is the ability to honestly express your opinions, feelings, attitudes, and rights, without
undue anxiety, in a way that doesn't infringe on the rights of others.
Many of us are taught that we should always please and/or defer to others, that it is not nice to consider
our own needs above those of others, or that we shouldn't "make waves", that if someone says or does
something that we don't like, we should just be quiet and try to stay away from that person in the future.
l
l
l
l
l
5.2.8 The Five Styles of Conflict Resolution
Avoiding the Conflict
Giving In Giving
Standing your Ground
Compromising
Collaborating
5.3 ASSERTIVENESS SKILLS

41
l
l
l
l
l
l
l
l
l
l
l
l
The holding company shall disclose in the Consolidated Balance Sheet, the following information in
aggregate for each subsidiary :-
(a) Capital, (b) Reserves, (c ) Total assets, (d) Total liabilities, (e) Details of investment, (f) Turnover,
(g) PBT, (h) PAT, (i) Provision for taxation, (j) Proposed dividend.
In the case of subsidiary companies, the no. of shares held by the holding company must be
separately disclosed.
The amount of income for a period, determined in accordance with the tax laws, based upon which
income tax payable is determined.
In India, Companies pay income tax on previous year's income i.e. what the company earns in last
year, it has to pay tax on next year. But under the law of Income Tax, all Company have to pay tax in
advance. On the basis of this advance guess the company makes provisions for Income tax. Later on
when IT Dept, calculates the real income tax after assessing actual profit of the previous year, the
actual tax is adjusted with the provision of income tax.
" When the assessment for a particular year becomes complete, the assessed amount of tax no
longer remains a provision, it becomes a known liability. Thus, provision for taxation account carries
such an amount of estimated tax which has not been assessed finally.
Domestic companies tax rate is : 30%
Surcharge : 5% (if total income > 1 crore)
Ed. Cess : 2% on IT & Surcharge
Sec. Ed. Cess : 1% on IT & surcharge
Sec. 80-IA of the Income -Tax Act, 1961 provides a ten year tax holiday in respect of profits
derived by an undertaking engaged in power generation, transmission and distribution or set up
for reconstruction of power units or invested in substantial renovation of existing network.
Must be a new undertaking set up in any part of India.
Starts transmission / distribution by laying a new network or by undertaking substantial
renovation of existing network till 31.3.2013.
Deduction is allowed only in respect of profits derived from laying of such network or renovated
network.
For substantial renovation, at least 50% increase in plant and machinery value required.
Deductions must be claimed through Return of Income, submitted within the due date.
100% profit derived from laying of such transmission / distribution network or renovated
network.
Many big companies become zero tax companies due to various concessions provided in tax
laws. Therefore, to counter this, MAT was introduced.
`
Principle
Conditions for exemption for power distribution and transmission undertaking
Amount of deduction
1.7.5 Corporate Tax Liability
1.7.5.1 Taxable Income
1.7.5.2 Provision for Tax
1.7.5.3 Tax Rate
1.7.6 Tax Holiday for Power Generation & Distribution Company
1.7.6.1 Minimum Alternate Tax (Mat)

42
l
l
l
l
l
l
l
l
l
l
l
l
l
l
l
l
l
l
l
l
l
l
l
l
l
l
As per Sec.115JB of the IT Act, 1961, if a company's taxable income is less than a certain
percentage of the book profits, then that much of the book profit will be considered as taxable
income and tax has to be paid on that.
The current rate of MAT is 18.5%.
Dividend declared by a company is subject to DDT to be paid by the Company.
Tax on proposed dividend is appropriated from the current year's profit.
The current rate of DDT - 16.22%.
TDS is done at the time of payment of the following nature by any mode by a company
provided it exceeds a specified amount :
Salaries & wages
Interest on debentures, consumers' security deposits and public deposit etc.
Payment to contractors for carrying out any work
Brokerage to brokers
Rent to landlord / landlady
Professional / Technical fees to any person
Commission to Director
Tax is deducted at a prescribed rate under different sections of the ITAct.
Deducted tax must be deposited within the prescribed time.
Acertificate of Tax Deduction is to be given to the payee.
For TDS at lower rate, the recipient of payment must submit a certificate from
appropriate authority.
If recipient does not furnish his PAN to the Company, tax is deducted at 20% rate.
A company acting as a seller of scrap must collect tax from the buyer of goods at source at a
prescribed rate of 1%.
If goods are utilized for manufacturing or processing for producing any article, no TCS is to be
done.
Tax collected at source is to be deposited to the credit of the Central Govt. within 7 days of next
month.
TCS Certificate is to be issued to the buyer by the company.
Items of major non-recurring nature with significant impact and accrue during normal course of
business.
Segregating exceptional items allows investors to differentiate normal business operation
transactions from unusual ones.
Its disclosure improves an understanding of the performance of the company.
Example : Restructuring cost, Profit /Loss on disposal of one undertaking / unit.
1.7.7.1 Tax Collection at Source (TCS)
1.7.6.2 Tax On Dividend Distribution (Ddt)
1.7.6.3 DeductionAnd Collection Of TaxAt Source
1.7.7 Tax Deducted at Source (TDS)
1.7.8 Exceptional & Extraordinary Items
1.7.8.1 Exceptional Items

43
1.7.8.2 Extraordinary Items
l
l
l
l
l
Unusual and unexpected expenditure.
Do not accrue during the normal course of business or ordinary activities.
As perAccounting Standard 5, such items are rare.
Specific disclosure of such events / transactions is made in the financial statement.
Example : Employee fraud, loss due to natural disaster.
Financial Management Cycle
Planning andbudgeting
Evaluation andreporting
Operatingmonitoring
safeguarding
Resourceallocation

Note

Learning Objectives
MODULE : A2
UNIT-2
DISTRIBUTION TARIFF
CALCULATION
After studying this unit, you should
be able to understand:
Ø Regulatory framework
Framework & critical parameters
Options for tariff determination
Power purchase issues
Ø
Ø
Ø

Note

Electricity is a 115 year old commodity in India. In certain parts of the world - Europe and USA, it goes
back to 130 years. India was among the forerunners in recognizing the importance of electricity and its
development. Public supply in USA and Europe started in early 1880s. In India, supply began in late
1890s in Kolkata.
Legal framework for electricity supply evolved over time in our country. Since electricity was an
essential commodity affecting public life, it has all along been regulated. Indian Electricity Act, 1910
was the first comprehensive legislation. After independence, in view of the changed priorities,
electricity took a major developmental role. Electricity (Supply) Act, 1948 was enacted to suit the
emerging requirements. This Act conceived setting up of State Electricity Boards (SEBs) as also the
Central Electricity Authority. 1910 Act and 1948 Act were operative together and had provisions for
licensing and tariff regulation, although not in great detail. State Governments (and Central
Government) used to control tariff according to their own imperatives.
With passage of time and unhappy financial conditions of many SEBs, it was felt that independent
regulation was necessary in the power sector to attract funds from overseas and private sector. A major
remodeling of regulatory framework was done in 1998 with the enactment of Electricity Regulatory
CommissionsAct, 1998. ThisAct conceived independent State Regulatory Commissions at Central and
State levels. Central Regulatory Commission was given the jurisdiction for regulation of Inter-state
activities while independent State Regulatory Commissions were mooted for Intra-state activities. The
1998 Act made Central Commission mandatory, but formation of State Commissions was left to
individual State Governments.
At this point of time, all threeActs mentioned above were operating simultaneously.
In June 2003, a new Act came into force (The Electricity Act, 2003) repealing all the earlier Acts.
Important features of thisAct are as follows:
Generation segment was delicensed. No license was now required for setting up a new generation
facility. Only large hydro projects were required to obtain technical clearance.
Trading of electricity was recognized as a distinct licensed activity, in addition to transmission and
distribution.
It was mandatory for every state to either constitute an SERC or join another state in constituting a
Joint Electricity Regulation Commission.
The ambit of the Regulatory Commissions was expanded considerably. Under the new
dispensation, all the Regulatory Commissions were given functions of tariff-setting, licensing,
and laying down and enforcing the performance standards for licensees, among other powers.
Transmission licensees were mandated to provide non-discriminatory open access to their
transmission lines.
Load dispatch was functionally segregated from wire business at national, regional and state
levels.
l
l
l
l
l
l
2 DISTRIBUTION TARIFF PRINCIPLES AND DISTRIBUTIONTARIFF DETERMINATION
2.1 REGULATORY FRAMEWORK
44

45
l
l
l
l
l
l
l
l
l
l
l
l
Consumers were to be given the right to choose their suppliers. Such power would flow through
the incumbent distribution licensee's network through "open access". However, such consumers
were required to pay a surcharge to compensate the licensee for loss of cross-subsidy, if any.
A national level Appellate Tribunal was created to hear the appeals against the orders of the
Regulatory Commissions.
The regulators were mandated to rationalize tariff with reduction (and elimination) of cross-
subsidies.
Simultaneously, market was allowed to be developed. There was a provision mandating the
regulators to adopt the tariff if the same has been discovered through a competitive bidding
process.
Tariff for direct sale to a consumer by persons other than the incumbent distribution licensee were
to be mutually agreed and kept outside regulation.
There were penal provisions if licensees failed to meet the laid-down standards of performance.
Consumer protection was accorded special focus. In addition to statutory remedy under the
Consumer Protection Act, consumers were given the option to represent before Grievance
Redressal Forums.
Special Courts were to be set up for expeditious trial of offences related to theft of electricity.
Unbundling of SEBs was envisaged to segregate transmission from retail distribution. Time frame
for unbundling was kept flexible.
Regulatory Commissions were mandated to promote renewable sources of energy.
To facilitate supply in rural areas that were largely unserved, the law provided for exemption from
license for composite projects of generation and distribution.
The governments were entrusted the function of policymaking and powers for giving policy
directions for the guidance of Regulatory Commissions.
This Act crystallised the scope for tariff regulation and also its mechanism for implementation. While
the Act gave directions as to the mechanism for determination of tariff, it also carved out certain areas
where tariff would not be determined by the regulators - in such cases, market force and mechanism
would play.
Tariff regulation has principally two areas. There are certain transactions for which tariff will have to be
determined by the concerned regulators, and secondly, there are areas where light handed regulations
would apply, i.e., "adoption of tariff" or "setting caps" will be done by the regulators.
In cases where tariff is to be determined by the regulators, the regulators are to specify through
regulations, the detailed procedure for computation of tariff in almost formulaic manner covering issues
like "actual or normative" approach, "historic cost", "average cost" and "marginal cost".
Any decisions taken by the regulator will have to be through a consultative process. Suggestions and
objections are to be invited from the public after due notice of specific issues.
Apart from the electricity price determination, provisions are there for determining service tariff
(network charges) in the form of “wheeling charges” and “transmission charges”.
2.1.2 Regulation of Tariff

46
Generally speaking, tariff setting through regulations is based on allowing reasonable cost and
reasonable profit to the utilities after due consideration of efficiency of operation. In determining what is
reasonable for allowing costs, regulators often specify certain standards which are called norms for tariff
determination. Such norms typically include thermal efficiency, Aggregate Technical & Commercial
Losses (AT&C Loss), leveraging ratio (Debt: Equity) and cost of funds both for loans and equity.
Important issues like how much Depreciation is to be allowed each year are also spelt out. Norms are set
after consulting the stakeholders, licensees or the generating company as the case may be and public
consultations.
As indicated earlier, there are certain areas where price determination is left to the market forces,
When the consumer chooses his own supplier other than the Distribution licensee of his area,
Where a Distribution Company purchases electricity through competitive biddingSale to a Trader.
However, concepts of Trading Margin is there to guard against excessive profit by Traders.
Adistribution licensee has its major proportion of costs in the form of power purchase expenses. Being a
major cost item, this is highly relevant for retail tariff determination. Scrutiny of power purchase cost
invariably includes dealing with power purchase agreements (PPA). PPAis a contract between the buyer
and seller of electricity. Like any other contract, there is an offer and an acceptance mechanism. PPA
addresses the following issues.
Contract duration
Price / delivery point
Billing & Payment mechanism
Payment Security mechanism
Dispute Resolution mechanism
Force Majeure
Any special clause like 'Take or Pay'
Termination issues
Other risks
Depending on the nature of power, agreements vary - PPA for a thermal station would be different from
that of a hydel station which will again be different for solar or wind powered stations.
Expenses other than power purchase would be largely "Fixed Cost" in nature and would cover:Employee CostRepairs & Maintenance including Consumables
Insurance
OtherAdministrative & General Charges
Rent, Rates & Taxes
l
l
l
l
l
l
l
l
l
l
l
l
l
l
l
l
l
2.2 FRAMEWORKAND CRITICALPARAMETERS
2.3 OPTIONS FOR TARIFFDETERMINATION
2.4 POWER PURCHASE ISSUES
2.4.1 Other Expenses
47
l
l
l
l
l
l
l
l
l
l
l
l
Legal Charges
Auditors Fees
Interest
Foreign Exchange Rate Variation
Other Financing Charges
Interest on Consumers Security Deposits
Lease Rental
Depreciation
IntangibleAssets Write off
Bad Debts
Tax
Normative Return
Gross Expenses are usually reduced by Non-tariff Income/ Other Income.
In determining tariff, the regulators are obliged not to show any "undue preference" to any consumer ofelectricity. Tariff, however, may vary or technically may be "differentiated" according to consumer'sload factor, power factor, voltage, total consumption of electricity during any specified period or the timeat which the supply is required or the geographical position of any area, the nature of supply and thepurpose for which the supply is required.
Thus, each consumer may pay tariff different from the average tariff. In the Indian context, largeindustrial and commercial consumers, over the years have been paying much higher tariff with regard tothe average tariff. The difference is used to subsidise other classes of consumers like domestic andagriculture. This subsidy being available from within the sector or from with consumers themselves, istermed as 'cross subsidy' as opposed to any external subsidy which flows from a source other than thetariff revenue like Government subsidy, grants etc. Cross-subsidy in a contentious issue and variousconsumer groups have conflicting views. Electricity Act mandates rationalisation of tariff so that crosssubsidy reduces over time.
The Act also provides scope for Government subsidy, if the Government decides to provide relief to anyconsumer category's tariff determined by Regulators.
Tariff application is an elaborate process. This is governed by the regulations of respectiveCommissions. Utilities apply giving justification for the tariff enhancement it proposes. Also, it has tofurnish all the requisite data - information as mandated under the respective regulations. Tariff petitionsare large in volume and may run into thousands of pages. After filing of petition, Commissions checkwhether the petition contains all the requisite information and after such checking and satisfaction, apetition is "admitted". After admission of a petition, documents are thrown open for public scrutiny andcomments giving certain timeframe for response. On receipt of such comments, the regulators scrutinizethe petition in detail with specific reference to regulations and policy and suggestions/ objections.Normal time frame for tariff determination is about 120 days. However in actuality, such time framevaries.
After an order has been issued out by the Commission, its Gist is published by the Utilities in newspapersand posted on the websites for effecting necessary transparency and disclosure.
2.4.2 Tariff Design and Cross Subsidy
2.4.3 Process of Filing Tariff Petition

48
2.4.4 Provision forAppeals
Any person aggrieved with any order including tariff order passed by the Commission can move theAppellate Tribunal for Electricity which is located in Delhi with provision for Circuit Benches inmetropolitan cities. Such appeal is to be preferred in 45 days' time. Persons aggrieved with the orderissued byAppellate Tribunal may prefer appeals to Hon'ble Supreme Court.
Securing reasonable tariff is a must for the utilities' health. Unless revenue is such that the cost is coveredand also there is a reasonable margin for profit, new investments cannot flow in. Continuous investmentis necessary to keep up with the increasing demand for quality of supply. Thus, an exercise for obtaining areasonable tariff order is of paramount importance for a Utility.
2.5 CONCLUSION

Note

Learning Objectives
MODULE : A2
UNIT - 3
IT APPLICATIONS IN
DISTRIBUTION MANAGEMENT
After studying this unit, you should
be able to understand:
Ø IT Applications in Commercial
management
IT applications in Customer
Relations Management
Various IT applications in CESC
Ø
Ø

Note
49
3.1 ITAPPLICATION IN DISTRIBUTION MANAGEMENT
(CESC'S EXPERIENCE)
3.1.1 Deployment of IT in Power Utility:
3.1.2 IT Support in CESC:
3.1.3 IT Application in Commercial Management:
In a power utility the IT enabled applications are required mainly in the areas of Customer services,
Regulatory affairs, Distribution systems, Business process, Generation control, Power trading,
Financial management, Establishment and HR etc.
To support the functions of the Distribution wing of CESC, the identified mission critical application
areas are Induction of new consumers, Fault management, Billing system, Treasury management,
CRM, GIS, Theft management, Personnel systems, Medical services for employees, Captive mailing
system, ERP, Intranet services and building IT infrastructure.
Systems are developed and maintained in-house by a strong contingent of IT term, having a Data
Centre equipped with most modern high-end computers running on Oracle platform and linked
through our own fiber optic back bone (Network) with high band-width.
The core activities of Commercial in CESC are supported by different IT enabled systems e.g. Meter
reading and billing, Resolving billing complaints, Disconnection of supplies, Payment follow-up of
outstanding dues, Reconnection of supplies, Voluntary disconnection, Transfer of supply, Refund of
Security Deposit after disconnection and closing of accounts, Realization of additional Security
Deposit etc.
'Meter to Cash' Cycle:
In CESC, we prepare Electricity bills for 26.7 lac consumers every month, after receiving different
types of transactions data from eight departments, located at different areas in and around the city of
Kolkata and Howrah.
We use to read majority of the LT meters manually, in the Meter Books, by a fleet of ~600 Meter
Inspectors everyday and the data for the same are captured through off-line data entry. Presently we
are in the process of replacing the Meter Books by the Hand Held Instruments (palm-top computers).
The meters of high-end LT and all HT consumers are read through AMR and CMRI.
The mode of payment of electricity bills in CESC are generally by cash (at our 41 Cash Offices
scattered all over licensed area), cheque (across the counter / cheque drop box), by Credit / Debit
cards through our website, different e-payment rents and payment through 'Advance Payment
Scheme'.
A new consumer gets into the billing system after thorough checking and processing of the
application, payment of necessary charges and Security Deposit and installation of the meter.
After processing all the said major inputs / information at the respective de-centralized locations, our
Core Billing System receives the information / data through our high speed Fiber Optic Network and
produces electricity bills alongwith other essential Reports.
Main Features of CESC's LT Bills:
Information on consumption, meter reading date, bill amount, Rebate, etc.
Meter related information.
Tariff related information.
Information on last payment made
Information on Security Deposit.
Information on Outstanding Dues
l
l
l
l
l
l
l
l

50
l
l
l
l
l
l
l
Providing comparative consumption unit for last 6 months vis-à-vis similar months of last
year, through histogram.
Information on sanctioned load.
Notice to defaulters
Both sides printing with dynamic information.
Bar-coded Bills
Monetization of the bill
ComputerAided CommercialActivities:
are Electricity bill, Disconnection notice cum bill, Account ofconsumers having outstanding dues, Account of disconnected consumers, Account of Security Depositmade by the consumer, Major MIS reports (for Commercial, Corporate Services, Finance Divisions) andClosing of accounts.
are Redressal of consumercomplaints, Online enquiry, Generation of duplicate bills, Correction of bills, Accounting ofdishonoured cheques, Refund of Security Deposit etc.
To support the Business Process, the major MIS Reports Generated by the Billing System forare Category wise sales analysis, Outstanding analysis, Financial reports,
Analysis of non-actual bills, Court case / Dispute monitoring, Monitoring of new consumers etc.
Theare Computerized complaint handling and monitoring system, Control of meter reading and
manpower development of meter inspecting staff, Putting bill information in the website for providingonline payment facility through internet etc.
We use , which includes Keeping the account ofSecurity Deposit made by the consumers; Refund of Security Deposit to disconnected consumers afteradjusting the outstanding dues, if any; Calculation of interest on Security Deposit for all the consumers atthe end of financial year; Tax deduction at source on Security Deposit interest etc.
The Electricity Act' 2003 brought landmark changes in the legislative and policy environment withintroduction of National Tariff Policy, OpenAccess, Power Trading, Private Sector etc.
This Act brought a new paradigm in the areas of customer focus and grievance redressal by introducingelectricity supply code, consumer redressal forum, Ombudsman, Appellate Tribunal, Special Courts,SOPetc.
Under the circumstances, IT enabled services are required to meet the stipulated Minimum Standardsand enhance quality of services to the consumers.
We, from the Distribution wing, also need to provide the Reports on our Efforts in improving theConsumer Services, Introduction of new Technology, Cost of maintenance of Distribution Network,Establishment Cost, etc on regular intervals to the Regulator, with the help of the IT enabled Systems.
As a part of enhancing Consumer Services in CESC we use a comprehensive CRM System, developedin-house for our Call Centre, which is integrated with our Complaints Handling System at the back-end.This CRM Software has got the glory of winning InternationalAward.We provide 24 x 7 Services for 365 days to our Consumers from the referred Call Centre, through 330telephone lines, with the help of 75 agents. Most of the in-coming calls are tackled through IVR System.
Major Products of the Billing System
The Consumer Service Support that we avail of the Billing System
Commercial Activities
major Sub-System for Customer Service and Operational Control, that we get as Products of BillingSystem
Security Deposit Accounting as a part of Billing System
3.1.4 ElectricityAct and Regulator:
3.1.5 ITApplications in Customer Relations Management:
51
Though the Software is developed and integrated by our IT team, the operational part of it has been out-sourced to IBM, to run the Call Centre. The Call Centre activities are linked with our back-office Systemthrough our own 1 GB Optical Fiber Network. Consumers may get in touch with our Call Centre throughe-mail & SMS Services also.
All the Technical complains received at the Call Centre are forwarded directly to CESC's Service Centreand the Commercial complaints are forwarded directly to the Commercial Department at the RegionalOffices. We provide prompt feed-back / guidance to the Consumers, related to their complaints / query,from the Call Centre. We also make calls to the payment defaulters from the Call Center, for follow up ofthe outstanding dues against electricity bills.For providing better services to our Consumers, and convenience of maintenance of distributionnetwork, we have developed our own GIS System. Consumer Indexing in GIS map helps us in improvingthe Consumer Services, in faster manner.
Procuring high resolution Satellite image of our licensed area from Google Earth.Survey of land-base of our licensed area.Super-imposing the land-base and road maps on Satellite image.Measuring Latitude and Longitude of electrical installation (Transformer, Distribution Pillar Box,Substations etc.).Accurate placement of all electrical installations on the land-base map.Placing the service points on the building foot-prints of all consumers.Plotting of HT and LT network separately on the land-base connecting the electrical installations.Drawing of 'Isolation' in each of the Pillar Box.
With the opening up of the power sector in India, power utilities in the country have to adopt necessarymeasures to enhance efficiency and improve customer satisfaction. The Regulatory Regime is closelymonitoring the operations of power utility companies and driving them to attain new heights ofoperational efficiency by setting stringent targets, goals and also penalties in cases of default. Majorreorganization and re-engineering of various internal processes and procedures are going on and IT is avery important tool to help enhance efficiency at all levels of operations. IT activities are thus fastgraduating from the role of a facilitator to the role of an essential resource and a key driver.Enabling the core business operations with information systems at the transaction level would lay thefoundation for sustainable reforms. This will ensure world-class practices and controls at the operationslevel and would bring about sustainable improvements in the overall health of the utilities. This willenhance the overall quality of data, thereby improving the flow of information for decision support.Information Technology (IT) would enable sustainable changes in the operations increasingcontrols at a transaction level, improving the efficiency of the operations and increasingtransparency across the organization.All the above factors are contributing to the adaptation of appropriate IT-based solutions and ITES atdifferent levels of operations and strategic operational areas.
Study brings forth the customer perspective in an objective manner which is probably the most reliableway of identifying key issues that the local customer wants the utility to attend. Immediately attending tothe customer's key areas of dissatisfaction would result in quick wins for the utility and allow for buildingup a positive perception within the minds of all stakeholders (including customer, opinion leaders,
l
l
l
l
l
l
l
l
3.1.6 Preparation of GIS Map:
3.2.1 Introduction
3.2.2 Customer Satisfaction
3.2 IT SYSTEMS & E - ENABLEDAPPLICATIONS

52
employees etc) and make them ready for bigger changes (e.g. smart meters and other innovations that
would help improve the quality of service and metering efficiency). When looked into together with
other factual information (utility's assets, performance figures, collection efficiency, billing, customer
complaints etc) customer satisfaction and preference data can provide solid insight into the investments
that, if done, would help improve business productivity and growth.
The Consumer has simple wishes:
Uninterrupted Power Supply
Correct Billing
Quick Response in case of faults
Quality of Supply: Use of ITApplications for Efficient and reliable network management
Fault Isolation and Service Restoration
Outage Management System
Switching Procedure Management
Distribution Management System (DMS) and Outage Management System (OMS) enable utilities to
manage and control the isolation and restoration of outages. With DMS, the utility gets abundant real-
time information about the distribution grid. Operational systems like OMS are provided to reduce the
time and resources necessary to deal with service interruptions improve reliability service levels and
increase customer satisfaction.
Historically, the IT-related activities of CESC were scattered at various departmental levels. With the
steep growth of mission-critical systems, the issue of management of all these systems is of prime
importance. One of the important steps for efficient management is consolidation of the systems.
Consolidation will also lead to better utilization of resources. Another important issue is forming and
deploying a suitable Business Continuity Plan for the entire organization so that the impact of a disaster
at any particular location can be minimized if not eliminated.
Keeping all these issues in mind, CESC has built one state-of-the-art Data Center (DC) for its IT
applications. The DC is equipped with facilities like multiple redundant power sources, advanced fire
detection and fighting systems, temperature and humidity controlling mechanisms, water leak detection
system, rodent control system, building management and access control system. Strategically positioned
cameras are in place to monitor and record all the activities inside the center. Most of the mission-critical
IT applications are operational from this data center.
CESC is also building two Disaster Recovery (DR) sites that will plunge in if for some reason the service
is not available from the main DC. This activity is a part of the overall BCP initiative of the organization.
In the Data Center and the corresponding Disaster Recovery sites, the mission-critical applications are
running on a high availability cluster infrastructure ensuring enhanced reliability. The DC and DR sites
are interconnected through 10 Giga Bit links.
Various mission critical applications are running from the Data Center including commercial
applications like Meter Application & Security Deposit System, Treasury Management System, Payroll
System, e-Procurement System as well as the following:
To help fast and accurate decision-making coupled with adherence to statutory norms, critical businessfunctions like finance, procurement and inventory management have been covered under the ambit ofthe ERPsystem.
l
l
l
l
l
l
3.2.3 Economy and Efficiency through IT:ACESC Case Study
3.2.3.1 Data Centre &Applications
3.2.3.2 ERPSystem

53
Specific modules of Oracle 11i are deployed across the organization and running successfully for the last
few years. Several bolt-on modules are implemented to achieve smooth availability of data to the main
system without disturbing the previously used applications. This enterprise wide application has helped
to cut-down processing time and released considerable man-hours for better utilization in business
operations.
The integrated Knowledge Management Portal helps in collecting, disseminating and analyzing critical
data related to power management. This system is the lifeline for the engineering division of the
company and generation division in particular.
The Mains department looks after the last mile distribution network to ensure that the consumers
ultimately get the supply at their premises. Site office activities include, commissioning of the electrical
services, fixing up of meters, attending to break-down jobs as well as carrying out various maintenance
work. Operational data related to material usage, human resource deployment and other administrative
parameters are captured in a homegrown system known as SOS (Site Office System). This application
has data exchange/sharing capability with other related applications like the ERP and CRM. These
integrated applications work in unison to provide better control and enhance customer service.
With a major focus on customer satisfaction, the company has implemented a comprehensive Consumer
Relations Management (CRM) System. The system is designed and developed by in-house team and has
used open source software. The application has been selected as a "case study" by one of the leading
software vendors. The CRM application caters to the supply related complaints from the 2.5 million
consumers. This home grown application is highly customized to suit the typical and diverse
requirement of the organization. It is used by the call center agents for interacting with the consumers, the
operational personnel at the depot level for delivering service to the consumers and key management
personnel for monitoring and management of customer support. The CRM package seamlessly
integrates with other computerized systems such as Distribution Management System (DMS),
Geographical Information System (GIS) and Site Office System (SOS) with a view to offering a
complete and comprehensive solution to the customer through a single point interface.
The application generates vital performance related information that is used for computation of
workmen incentive and other regulatory issues. The application is having interface with the Corporate
Website.
While the CRM software package lies at the heart of the system, several technologies such as IVRS,
Wireless HHI, SMS services and GPS have been deployed and integrated with the core CRM System to
make the overall business process highly efficient and effective.
The CESC corporate web site is developed and maintained by in-house IT resource. The site, apart from
publishing general information for consumption of various audience verticals, hosts a number of
applications that enable consumers to transact directly with backend systems to pay their electricity bills,
lodge billing complaints, opt for e-Bill services, e-procurement etc.
3.2.4 Knowledge Management Portal
3.2.6 Consumer relations Management (CRM) System
3.2.7 Corporate Website
3.2.5 SOS (Site Office System)
54
3.2.8 IT Infrastructure Services
3.2.9 CESC Track
3.2.10 Distribution Transformer Management Systems
3.2.11 LCCApplications (SLIM)
3.2.12 Smart Billing in CESC
3.2.12.1 Introduction
3.2.12.2 History
The company maintains comprehensive Mailing System for the domain cesc.co.in using its in-house
resources. The infrastructure includes the mailing servers for the corporate along with the DNS Servers.
Apart from this a corporate Intranet Portal is in place to serve as an umbrella system to host different
important IT applications. These are all very critical in nature and operational on a 24 x 7 basis.
Initiatives have been undertaken to computerize important data relating to sketches, maps, EHT, HT, LT
underground cables for easy retrieval / updating / modification etc. The CESC Track system tracks all
pending jobs in this section since these drawings are the basis for future planning, maintenance & repairs
of the HT & LT networks.
Thousands of Distribution Transformers are in operation in CESC's licensed distribution area to provide
LT supply to 2.5 million consumers. Every year hundreds of distribution transformers are added to
provide connection to new consumers. The home grown software Distribution Transformer
Management Systems helps to manage the entire life cycle of the equipment covering procurement, bill
processing, storing, testing, installation, repairing etc. are also monitored. This system is integrated with
Distribution Related EngineeringAsset Management System (DREAMS).
One of the major activities of the Company is the controlling of T&D losses. This activity is spearheaded
by the Loss Control Cell. Over the past couple of years, this cell has contributed significantly to the
overall success of the Company. This department is using homegrown LCC Applications (SLIM) to
support its activities.
The billing system of CESC is a proven, home-grown IT system that caters to the needs of all LT and HT
consumers by continuously providing accurate, un-interrupted and mission-critical support and services
through optimisation of available resources using state-of-the-art technologies. The system can be
broadly divided into 2 parts : LT billing system for LT consumers and HT billing system for HT
consumers.
Computerized billing was introduced in 1977 in CESC - the first in the country. Over the decades, the
legacy software was replaced by an Oracle-based LT billing system in 2004 to meet all the requirements
specified by the users after due system analysis. This system has the flexibility and scalability to handle
unpredictable Regulatory requirements. Oracle-based HT billing was revamped, re-engineered and
made operational from 2006. Keeping the growing requirements in view, the billing system was
migrated to a high performance, high storage capacity hardware platform SUN E2900.
The billing system is integrated with the AMR system to capture billing reading, interruption details etc.
for high-end consumers. It supports billing for Time-of-the-day tariff, seasonal tariff for high-end
consumers, prepaid metering for low-end consumers. Recently it has been enhanced by incorporating
features like billing of consumers having their own sources of electricity generation and supplying the

55
excess energy to CESC for LT consumers to facilitate generation from renewable energy sources. The
system is also integrated with the ERP GL module of Finance Department to transfer post-billing data at
the desired granularity.
Monthly Bill Processing of more than 2.5 millions of low & medium voltage consumers after
incorporating all user requirements and regulatory requirements as and when required.
Monthly Bill Processing of around 1700 High voltage consumers after incorporating all userrequirements and regulatory requirements as and when required.
Implementation of Tariff and Arrear computation and levy of the same as per WBERC tariff orderand to provide various data/reports which are required for Tariff fixation.
Provision for small locality-wise (Book level) billing for LT consumers.
Regular monitoring of outstanding dues both for HT & LT consumers.
Generation of Disconnection notice for non-payment during the first month of default.
Updating and maintenance of security deposit for LT & HT consumers & Maintainable SDcalculation.
SD interest calculation & additional SD instalment bill/notice generation for LT consumers.
Bank Guarantee & Letter of Credit system for HT consumers.
Sending electricity bills through e-mail and billing information through SMS to high endconsumers immediately after generation of the bill.
The centralized billing system is integrated with the web-based Consumer services system for LT and HTconsumers.
In an effort to revamp the engineering asset documentation and maintenance practices throughout theDistribution wing of CESC, a web-based system DREAMS was thought of. The system was developedin-house by the IT department. The vision of DREAMS is to systematize and co-ordinate activities andpractices to enable CESC to optimally manage its assets & their associated performance, maintenanceaspects and expenditures over their life cycle for the purpose of achieving the organizational strategicplan.
DREAMS provides an integrated Asset Register of major electrical plant and equipment in use in CESCLimited including allied assets such as Substation buildings, premises and Yards with MaintenanceManagement functionalities encompassing Preventive Maintenance, Condition Monitoring andCondition-based Maintenance and Repair/ Break-Down Maintenance and associated Alerts, WorkOrders, Records of all work done & tests carried out andAnalysis, Recommendations and Reports. Thesystem has many different Modules to plan, schedule, execute, track and control the equipmentmaintenance. The Asset Register can be accurately posted with the thousands of equipment in usegrouped under a few dozen categories with relevant Asset Descriptors such as Make, Model, Type,Ratings, Purchase & Warranty details, photographs, catalogs etc of each piece of equipment and itsassociated Preventive Maintenance activities and schedules, Condition Monitoring activities andschedules and results and records of all planned and unplanned maintenance work carried out. Thesystem enables creation, editing and deletion of categories and equipment within each category with allassociated attributes and fields related to each equipment and its maintenance requirements and history
l
l
l
l
l
l
l
l
l
l
3.2.12.2.1 The features of the billing system includes :
3.2.13 Distribution related EngineeringAsset Management System (DREAMS)
3.2.13.1 Introduction
3.2.13.2 Functionalities

56
and auto-generate alerts of equipment due for maintenance, issue of Work Orders and allows updating of
maintenance and test records and movement (of full or part equipment) tracking.
The system is integrated to the EHV Fault/ Outage Management Systems to help in data-backed Root
Cause Analysis. It is also integrated to the Distribution Transformer Management System (DTLMS). It
will be integrated to CESC's Distribution Project Management system (DPMS) shortly to facilitate
generation of unique asset numbers at the point of procurement for tracking and monitoring of the asset
throughout its entire lifecycle.
In future, shutdown procedures and switching chits and issue of Permit-To-Work will also be integrated
into the system.
This is a web-based system developed in-house by the IT department for monitoring and analyzing
information retrieved from static meters pertaining to instantaneous parameters, load survey, events
report, meter tampering and interruption. It accepts AMR data in .XML format and displays the data
pictorially. It also shows meter reading related statistics region-wise with summary of meters read, not
read, details of not-read meters. There is a separate module for monitoring static meters installed at the
distribution transformers (DTRs) for the Loss Control Cell (LCC).
To capture the basic data regarding generation, fuel consumption, ash evacuation,
plant outages. Calculates all derived parameters. Benefits: To capture the basic data regarding
generation, fuel consumption, ash evacuation, plant outages. Calculates all derived
Archive of all operational data for every 15 minutes and using them for forecasting, planning for any
network outage. Benefits: Provides a backup database of SCADA archives, which can also be easily
linked with the other databases for reports & analysis.
Data entry, query & publishing of all 11 kV, 6 kV fault. Benefits: Computerisation of HT fault data, which
provides online MIS reports.
Preparation of daily schedule of system demand, CESC's generation and Power exchange quantum for
every 15 minutes block. Benefits: Daily schedule/ re-schedule of forecasted demand and availability of
generation is given to SLDC/ALDC. This is mandatory underABT regime.
Entry of Distribution Station-wise load-shedding details. Benefits: Provides the load-shedding schedule,
spot shed and half hourly effect on mouse click. Also provides MTD of D/S wise interruption duration.
This guides in equitable distribution of interruption hours. Interruption data is also transmitted on real
time basis and viewed by the call centre personnel on a bulletin board.
3.2.14AMR DashBoard
3.2.15 ImportanceApplications For Network Operations
3.2.15.1 Gennet:
3.2.15.2 Log:
3.2.15.3 HT Fault Report:
3.2.15.4 Schedule/Reschedule:
3.2.15.5 Shedsum:
57
3.2.15.6 Load shedding:
3.2.15.7 On line UI:
3.2.16 HT & LT Fault Management Systems
Keeping records of any kind of feeder outage. Benefits: Computerisation of load-shedding & power
supply interruption data for getting the necessary reports like loss of unit, average interruption hours etc.
on monthly basis. Interruption data on real time basis are viewed by the call centre personnel on a bulletin
board.
Monitoring of UI. Benefits: Online monitoring ofABT meter data for optimum economic operation
HT Fault Management System was developed with the view to digitize each high tension feeder tripping
& archive the records in software database management system. The information of a particular tripping
are entered in the FMS at the end of each shift (24 X 7 Manning with 3 shifts per day).
LT Fault Management System was developed replicating the HT FMS model. The salient information
pertaining to each low tension distributor failure is updated in LT FMS by Network Managers of 10
districts within 48 hours of occurrence.

Note

Learning Objectives
MODULE : A2
UNIT - 4
COMMUNICATION
SYSTEM & SCADA
After studying this unit, you should
be able to understand:
Ø Tele Communication infrastructure
VHF, Fibre Optic, TDM
communication systems
SCADA & DMS
Feeder Automation
Ø
Ø
Ø

Note

58
Efficient Power System Management demands rapid and reliable information exchange among Load
Dispatch Centre, Generating Stations, EHV Substations, Distribution Stations, Engineering Offices,
Regional Offices, Site Offices etc. From inception, CESC has developed its own voice & communication
system in addition to outsourced services to facilitate such voice and data communications. CESC has
old underground pilot copper cables and a mix of aerial & underground optical fibre for transportation of
requisite voice & data. Over the years, the use of pilot cables has reduced due to maintenance issues. In
1995-96 a point to multipoint TDM/TDMA Microwave Radio System was commissioned but was de-
commissioned in 2008 due to Govt. policies on S-band. Fibre Optic Transmission Systems form the
backbone of CESCs telecommunications network and is the mainstay for most telecommunication links.
Various Communication services in CESC are detailed in the following sections.
Around 450 licensed VHF radio communication sets are in operation to meet the voice communication
requirement at Distribution Stations, Control Room, Call centres, Mobile Maintenance Vehicles and
office premises.
These VHF sets are also used for contact transfers of around 70 Unmanned Distribution Stations to send
an alarm to the Master Control Centre if such contacts make at the Stations – a very useful feature at
Stations which do not have any SCADAsystem at present.
CESC has corporate tie-ups with Bharti Airtel and Vodafone for Voice & Data SIM cards and services.
More than 1200 voice connections and 14000 data connections are in use with the numbers growing
steeply every year. Data connections are used for RMU Automation & AMR applications. Some use
static IPs with CESC-specific APNs provided by the Service Providers but most use dynamic IPs with
client-initiated VPNs such as M2M Servers. Some managed leased lines are also operational on hire.
These are deployed for RMU automation application.
As a policy, CESC lays underground armored 48-Fibre Optical Fibre (OF) cables whenever 33kV /
132kV cables are laid thereby saving on road digging and restoration charges. In some special cases OF
cables are also laid along with 6kV and 11kV under-ground cables.
CESC uses ITU-T G.652D Optical Fibre cables (single mode, step index), both underground and aerial
types, with fibre count ranging from (6F/ 12F/ 18F/ 24F/ 48F) and wavelength of 1310 nm and 1550 nm.
Around 400 kms of UG cables and 300 kms of OH cables have been laid so far. A 92 km long OPGW
(Optical Ground Wire) has also been strung along with the 220 kV transmission circuit between Budge
Budge Generating Station and EM Substation. FCPC/ SCPC/ LCPC connectors are used.
Laying, splicing and termination of Optical Fibre Cables are carried out by CESC's own team of skilled,
trained personnel using requisite set-up and equipment. Aerial cables are, however, maintained by an
external agency.
4 TELE COMMUNICATIONS INFRASTRUCTURE
4.1 VHFCOMMUNICATION :
4.2 OUTSOURCED VOICE & DATACOMMUNICATION SERVICES :
4.3 FIBRE OPTIC CABLE NETWORK IN CESC

59
Dark fibres are used for telecommunication purpose and also for line differential protection of high
voltage feeders.
There are 2 separate Telecommunication Transmission systems operating on the Fibre Optic cables: a
circuit-switched SDH/PDH system across 33 locations (mostly Generating Stations and Substations and
Regional Offices) and a Gigabit Ethernet packet switched network using Routers across 100 odd
locations (mostly Offices). The SDH/PDH system, with transport in STM4 (622.08 Mbps) is mainly for
real-time communications such as for SCADA systems, protection contact transfers and even voice
where latency may be an issue and the Gigabit Ethernet system is mostly used for commercial uses such
as Intranet, ERP, Commercial information flow and now even for some SCADAapplications.
CESC has ring protected ABB make SDH STM4 (622.08 Mbps) & PDH communication system
covering 33 sites including Generating Stations, Receiving Stations, important office premises etc. The
system has a common Network Management System which can be viewed & controlled from multiple
strategic locations. ABB make FOX515T & FOX515 are in use as SDH & PDH equipment. Access side
includes TDM Voice, V.24 data, Contact Transfer, E1 and Ethernet. Hardware includes 19” subracks (37
for SDH & 30 for PDH), Maintenance Modules, Fan Modules etc mounted in 54 Panels, 52 Aggregate
Module cards, 42 Tributary Modules for E1 ports, 39 Tributary Modules for Ethernet and a host of
access-side cards. The equipment are powered by 48V DC battery & charger systems with high back up
time. The applications running on the system are as under:
l
l
l
l
l
l
l
l
Around 250 nos dedicated 2-wire Voice connectivity at important locations
Seamless connectivity between 20 EPABXs at different locations
Transmission SCADAIEC 60870-5-101 and IEC 60870-5-104 data for 20 stations
Extension of Distribution Management System terminals over SDH LAN
APEX metering data
Tele-protection: Emergency Trip & Emergency Lock Out
Remote connection for Disturbance Recorders
Remote connection for Numerical Relays
4.4 FIBRE OPTIC TRANSMISSION SYSTEMS
4.5 TDM SDH/PDH COMMUNICATION SYSTEM :
S T A T I O N : BS T A T I O N : A
S
D
H
FDF
TJBTJB
FDF
SJC
O.F CABLE
S
D
H
PATCHCORD
PIGTAIL
ATTN.
S
T
M
4
S
T
M
4
P
D
H
P
D
H
EPABX E1 EPABX
Ethernet
Services
Ethernet
Services

60
4.5.1 PDH (Plesio-Synchronous Digital Hierarchy):
4.5.2 SDH (Synchronous Digital Hierarchy):
4.5.2.1 Straight Joint Closure :
4.5.2.2 Terminal Joint Box (TJB):
4.5.2.3 Fiber Distribution Frame (FDF):
4.5.2.4 Advantages of SDH:
Digital multiplexer which multiplexes a total 30 nos. of Voice and/or Data channels and the minimum
output is E1 (2.048 Mbps) digital signal. The equipment are all almost synchronous. Output can be E1 or
its multiple upto 140 Mbps electrical/optical.
Worldwide standard higher order multiplexer which multiplexes atleast 63 nos. E1 (2.048 Mbps) PCM/
Ethernet (EoS)/ combination of both input signals and the output is 155.52 Mbps (STM 1) electrical/
optical. As the name suggests all the equipment connected are synchronized with the same clock.
Outputs can go upto STM 64 (9953.28 Mbps).
Joint Closure for straight jointing of O.F. cable in the run.
Joint Box for termination of O.F. cable at a terminal station.
Fiber Distribution frame mounted with suitable adaptor for interconnection between equipment and
fiber. At one end of the adaptor, pigtails (with connector at one end and bare fiber in the other end) from
TJB are connected and at the other end Patch cords (with
connectors at both ends) from equipment are connected.
Following major advantages are available in an SDH based communication system:
World Wide standard
High Transmission Rates
SimplifiedAdd & Drop Function
Multiple vendor optical transmission equipment compatible
Direct access to tributary channel
HighAvailability and Capacity Matching: Single Network Management
Reliability: Protection schemes
Future Proof Platform for New Services like video conferencing, VOD, CCTV
A set of related photographs including NMS Snapshots for existing SDH/PDH communication system,
test & diagnostic equipment etc. used in CESC is depicted below:
l
l
l
l
l
l
l
l

61
4.6 Path Forward:
Transmission SCADA system will be on IEC 60870-5-104 protocol with RTUs reporting at Master
Control Centre (at CESC House), Backup Control Centre (at Testing Department) and Communication
Control Centre (at Auckland Square) over SDH Optical backbone. Testing with the said configuration is
in progress.
The communication architecture for the full blown BCC is depicted below:
SDH/ PDH Network Management SDH/PDH Panel
Battery Charger status through SDH/PDH NMS
Some Test & Measurement Equipment

62
CESC has decided to automate all the Distribution Stations (both existing and upcoming D/Ss) as fast as
possible and set a target of commissioning 30 to 40 RTUs per year for Distribution Station Automation.
Interconnection between DMS & Transmission SCADAservers over ICCPprotocol is being considered.
Regarding Feeder Automation the company will continue technology trials for better communication
solutions before large scale deployment. In between, sites demanding urgent deployment of automated
RMUs, optical fibre based communication systems will be considered.
Implementation of a Supervisory Control and DataAcquisition (SCADA) system enables to monitor and
control electricity flow in the transmission & distribution network. It helps in maintaining supply/
demand balance, reduces cost of operations and enables process efficiencies.
SCADA has three major components: Remote Terminal Unit (RTU), Communication Network and
Control Centre. A RTU gathers digital and analog data from the field through sensors and sends them to
Control Centre via the Communication Network. The servers present at Control Centre receive the data
sent by RTUs, process them and make them available through graphical user interface (Human Machine
Interface/s). The Operator present at Control Centre can initiate remote commands from HMI terminals
to operate field equipment. Several options are available for communication media between the RTUs
and the Control Centre but the most preferred is Optical Fibre. Other features of SCADA include time
synchronization of field RTU using a GPS based time and frequency system, real time data storage and
retrieval, remote equipment configuration and interface with other enterprise IT applications.
4.7 SCADA/ DMSAND FEEDERAUTOMATION
4.7.1 SCADA/DMS
New Communication Architecture for Transmission SCADA

63
Distribution Management System (DMS) comprises of a number of applications which acts as a decision
support system for the load despatch operators, field personnel and planning. Improving the reliability
and quality of service in terms of reducing outages, minimizing outage time, maintaining acceptable
frequency and voltage levels are the key deliverables of a DMS.
SCADA/DMS were earlier typically isolated systems but today they invariably interface with several
other EnterpriseApplications such as GIS, CRM,Asset Management System etc.
CESC Limited installed SCADA, way back in 1995, for Transmission network (220 kV, 132 kV & 33 kV
voltage level) for efficient load generation balance, enhancement of network stability, reliability and
better fault management. The system has been upgraded in 2005. It is Siemens Spectrum SCADA
System with 20 RTUs. CESC has also installed a separate Siemens make, Spectrum system, an offline
DMS / Distribution SCADA in 2007, catering to the entire Distribution network of 11 kV, 6 kV, 20 kV &
3.3 kV voltage level to maintain operational safety, easy & fast operation on the network and efficient
single window clearance to field engineers. From 2011, RTUs at Distribution Stations and FRTUs at
RMUs are being commissioned and integrated with this DMS/DS-SCADA.
Operators, handling a huge power network, require some decision support tools for secure operation of
distribution system. DMS packages form the Decision Support System (DSS) which includes various
functions like state estimation, power flow, contingency analysis etc. The DSS estimates the current
system topology from the status of circuit breakers and/or isolators and different measurements obtained
through SCADA.
processes SCADAdata such as power, voltage & current, and estimates the magnitudes
and phase angles of all bus voltages in the actual power system. Using these values, the State Estimator
examines the data for obvious errors, determines those portions of the network which are observable,
generates artificial measurements at locations where data are required for observability and then
computes the estimated system voltages and tap positions of the transformers. State estimators allow the
calculation of required variables with high accuracy despite the fact that the measurements may be
missing or corrupted.
The goal of a is to obtain complete voltage angle and magnitude information for each
bus in a power system for specified load, generator real power and voltage conditions. Once this
information is known, real and reactive power flow on each branch as well as generator reactive power
output can be analytically determined. A distribution feeder is radial. Hence, iterative techniques
commonly used in transmission network power flow studies are not used because of poor convergence
characteristics. The ladder iterative technique (or forward-backward technique) is the most suitable
method for power flow study of radial systems. These are important for planning future expansion of
power systems as well as in determining the best operation of existing systems.
program employs techniques to automatically adjust the power system
control settings while simultaneously solving the power flows and optimizing operating conditions
within specific constraints. is a software application, which runs in a distribution
management system and gives an indication of what might happen to the power system in the event of an
unplanned (or unscheduled) equipment outage. With the help of contingency analysis the operator can
take some action before or after the event to help the system avoid outage events.
When there is a shortfall in the electricity supply, quick is required to prevent the power
system from being unstable. Load shedding can be carried out using frequency information, voltage
fluctuations etc. These are accomplished either in automatic or manual mode and are predefined.
State Estimator
power flow study
The Optimal Power Flow
Contingency analysis
load shedding
4.7.2 DMS Packages

64
Feeder reconfiguration is performed to enhance the quality and reliability of the distribution system by
opening/closing tie and sectionalizing switches. Feeder reconfiguration is mainly accomplished for
system power loss reduction and for load balancing. Power flow program is used to calculate the overall
real power loss for a given system configuration. It ranks it against other configurations and helps to
select a configuration for a particular system condition. Especially with the development of semi-
automatic/remote control switches, online reconfiguration has become an important component of
distribution automation.
Network connectivity analysis is an operator specific functionality which helps the operator to identify
or locate the preferred network or component very easily. NCA does the required analysis and provides
display of the feed point of various network loads.
The DMS application receives fault information from the SCADA system and processes the same for
identification of faults. On running switching management application the results are converted to action
plans by the applications. The action plan includes switching ON/OFF the automatic load break switches
/ Sectionalizers.
Load forecasts form the basis for development of strategic system planning.Accurate load forecasting is
critical since the future load characteristics determine the location, size, and timing of future facilities.
Three major categories of load forecasting methods are (i) trending methods, which project future load
growth based on some type of inference based on past load growth (ii) simulation methods, which
attempt to analyze and anticipate the process by which electric load grows and (iii) hybrid methods,
which are a mixture of trending and simulation.
There are other tools like fault locator, volt-var control etc. which not only reduce service interruption but
also improves its quality and efficiency in terms of voltage regulation, system losses and load demand.
In India, Power Utilities are striving hard to enhance the reliability of the power distribution network,
power quality, and power system efficiency by implementing Distribution Automation in the HV
network. A sub-function, Feeder Automation, offers utilities a system for reducing outage times,
shortening restoration times, improving power quality, and reducing operation and maintenance costs.
Feeder Automation focuses on aspects such as voltage control, reactive power control and Fault
Detection Isolation Restoration (FDIR) from a remote location which automatically detects, isolates the
faulted segment and reduces outage time compared to manual travel, thereby improving the reliability of
the system.
4.7.3 FeederAutomation

65
Feeder reconfiguration is performed to enhance the quality and reliability of the distribution system by
opening/closing tie and sectionalizing switches. Feeder reconfiguration is mainly accomplished for
system power loss reduction and for load balancing. Power flow program is used to calculate the overall
real power loss for a given system configuration. It ranks it against other configurations and helps to
select a configuration for a particular system condition. Especially with the development of semi-
automatic/remote control switches, online reconfiguration has become an important component of
distribution automation.
Network connectivity analysis is an operator specific functionality which helps the operator to identify
or locate the preferred network or component very easily. NCA does the required analysis and provides
display of the feed point of various network loads.
The DMS application receives fault information from the SCADA system and processes the same for
identification of faults. On running switching management application the results are converted to action
plans by the applications. The action plan includes switching ON/OFF the automatic load break switches
/ Sectionalizers.
Load forecasts form the basis for development of strategic system planning.Accurate load forecasting is
critical since the future load characteristics determine the location, size, and timing of future facilities.
Three major categories of load forecasting methods are (i) trending methods, which project future load
growth based on some type of inference based on past load growth (ii) simulation methods, which
attempt to analyze and anticipate the process by which electric load grows and (iii) hybrid methods,
which are a mixture of trending and simulation.
There are other tools like fault locator, volt-var control etc. which not only reduce service interruption but
also improves its quality and efficiency in terms of voltage regulation, system losses and load demand.

Note

Note