Embed Size (px)
DESCRIPTION
Finance
Citation preview
An Empirical study on Capital to Risk Assets Ratio
CHAPTER-1
INTRODUCTION1.1 Introduction about the internship:“Internships give students their first exposure to working in an organization and also a flavor
of the functional area they are interested in pursuing later in their careers. Internships present
a great way for companies to evaluate potential permanent hires. Interns can boost company
productivity and provide much needed support on special projects. In addition, when interns
are pleased with their internship experience, they add to a company's campus presence and
act as company emissaries. Internship program helps in experiential learning for a student in
an organizational environment which serves his academic requirements and also provides
valuable hands-on experience in a chosen area of interest. Internships are focused on what a
student learns, not what the student does. Faculty and Company supervised Internships for a
specified period of time with a focus on learning executive skills attempt to bridge the gap
between theoretical learning in the classroom and company practices. Value addition through
internships includes the following:
1. A good performance in internship fetches higher academic credentials,
particularly for those who are practice oriented
2. A good platform to reflect on theories and concepts learnt in the classroom to
observe and apply in real life situations. It reinforces the classroom learning
through practice.
3. . Provides first-hand experience into company environment, business
processes and markets.
4. Successful internships build self-confidence of students and enhance their self-
esteem. It helps in behavioural modifications and emotional balance. Students
learn to be independent and responsible.
5. Students gain new skills – cognitive, emotional and social. Learn corporate
etiquettes, understand corporate culture – all through own experiences and
observations.
6. Leads to self-discovery of strengths and weaknesses while facing the
challenges on-the-job. This coupled with coaching and mentoring by faculty
members and company executives would shape up the future manager
1
An Empirical study on Capital to Risk Assets Ratio
7. Intern gets a chance to network with executives in a company who can help in
paving the way for future opportunities
Internships give a feel of career opportunities and lay the foundation for
career planning.
8. The power of internships is that they mould the business school students into
an effective manager.
1.2 Topic chosen for study The title of the study is “An EMPIRICAL STUDY ON CAPITAL TO RISK ASSETS
RATIO” of urban co-operative bank ltd Perinthalmanna”
A bank’s real capital worth is evaluated after taking into account
the riskiness of its assets. It was earlier hoped that the capital would provide banks with a
comfortable cushion against insolvency, thereby ensuring market stability. In the wake of the
introduction of prudential regulation as an integral part of financial sector reforms in India,
there has been a growing debate as to whether capital adequacy requirements are the best
means to regulate the banking system.
1.3 Need of the study:Banks face high risks primarily because banking is one of the most highly
leveraged sectors of any economy. To tackle risk and function efficiently, there is a need to
manage all kinds of risk associated with banking. Thus, risk management is core to any banks
face high risks primarily because banking is one of the most highly leveraged sectors of any
economy. To tackle risk and function efficiently, there is a need to manage all kinds of risk
associated with banking. Thus, risk management is core to any bank. The study of CRAR
analysis of UCBP ltd will enable as to know the financial position, of UCBP ltd. The study
also reveals the performance of the UCBP ltd and also its prospects.
2
An Empirical study on Capital to Risk Assets Ratio
1.4 Objectives of the study:The main objectives of the research are as following:
To explain the importance of risk assets ratio to analyze the performance of the firm.
To analyze the current financial condition of the firm.
To compare the present ratios with past ratios of the firm.
To interpret the ratios to identify the strengths and weakness of the organization.
To measure the adequacy of an entities capital resources in relation to its current
liabilities and also in relation to the risk associated with its assets.
To strengthen the soundness and stability of the banking system.
1.5 SCOPE OF THE STUDY The scope is limited to published information received from annual reports.
The study covers P&L a/c and balance sheet items only.
The study covers a period of three financial years ranging from 2010-11 to 2012-13.
This is so because CRAR prescribes practical standards, for each element of the
study.
1.6 METHODOLOGY ADOPTED There are two types of data collection method which are being used in this research:
PRIMARY DATA
SECONDARY DATA
1. Collection of Primary data:
Primary data is that type of data which includes the first hand information which is
being collected during the course of training through observations and discussion with
departmental heads, accountants, assistants and office.
Direct interaction
Observations
2. Collection of Secondary Data:
Secondary data means data that are already available i.e., they refer to the data which
have already been collected and analyzed by someone else. When the researcher utilizes the
secondary data, then he has to look into various sources from where he can obtain them. In
this case he is certainly not confronted with the problems are usually associated with the
3
An Empirical study on Capital to Risk Assets Ratio
collection of the original data secondary data may either be published data or unpublished
data.
Here in this research, I collected the secondary data from the following
The annual reports
Journals
Books
Prospects of the company
Internet etc… Interpretation of the result has been done on graphical representation
through bar graphs.
FORMULAS OF CRAR:
Capital adequacy ratio is defined as the ratio of banks capital to its Risk Weighted
Assets.
Capital base (capital fund)
CRAR = _________________________________ x 100
Risk weighed Assets
Capital adequacy ratios (CARs) are a measure of the amount of a bank's core
capital expressed as a percentage of its risk-weighted asset.
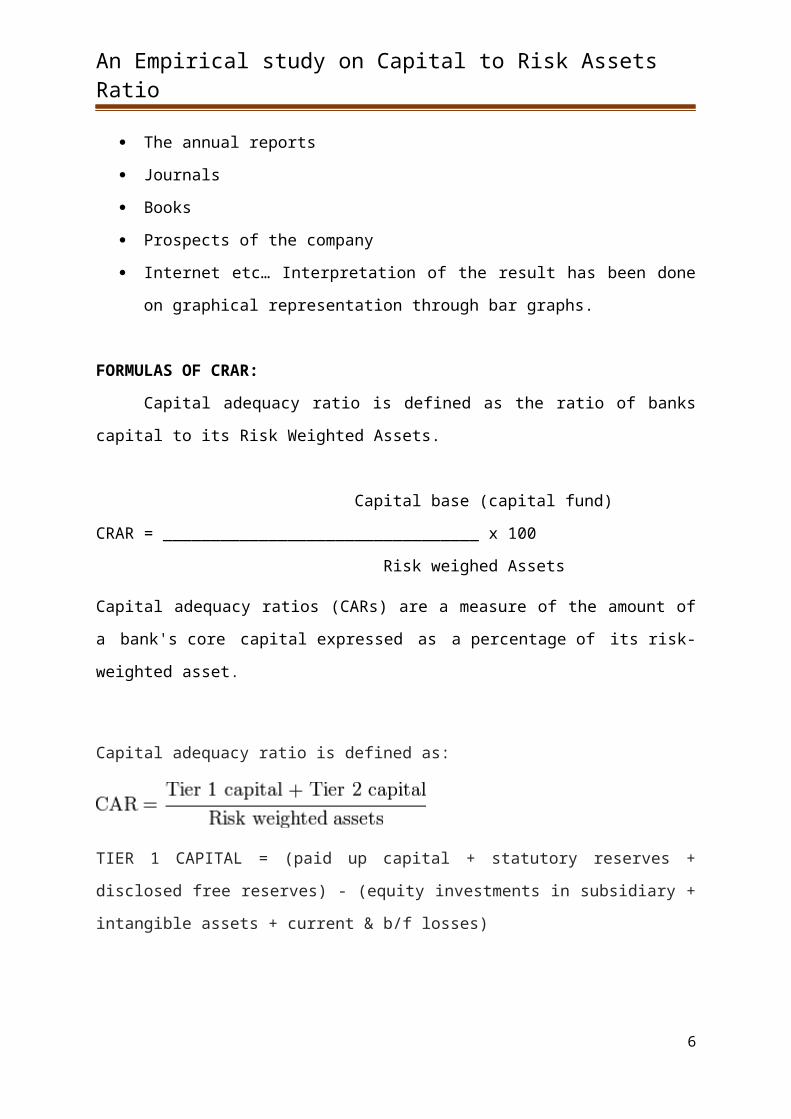
Capital adequacy ratio is defined as:
TIER 1 CAPITAL = (paid up capital + statutory reserves + disclosed free reserves) - (equity
investments in subsidiary + intangible assets + current & b/f losses)
TIER 2 CAPITAL = A) Undisclosed Reserves + B) General Loss reserves + C) hybrid debt
capital instruments and subordinated debts
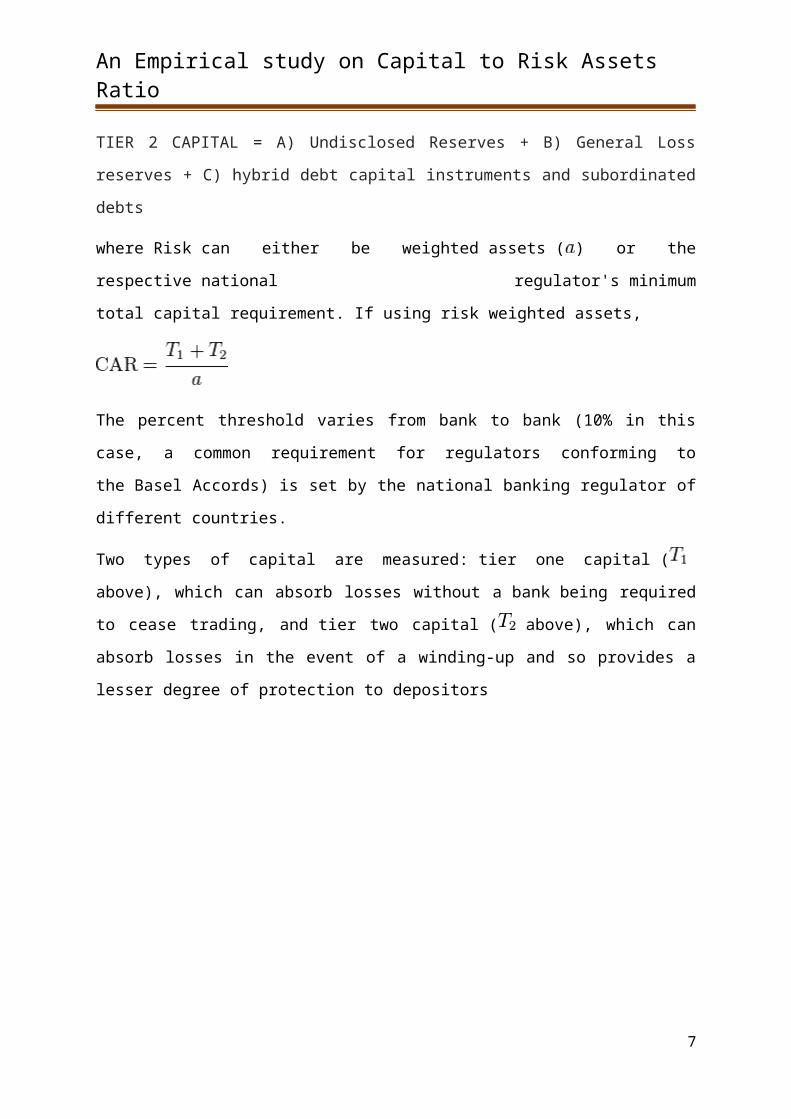
where Risk can either be weighted assets ( ) or the respective national regulator's minimum
total capital requirement. If using risk weighted assets,
4
An Empirical study on Capital to Risk Assets Ratio
The percent threshold varies from bank to bank (10% in this case, a common requirement for
regulators conforming to the Basel Accords) is set by the national banking regulator of
different countries.
Two types of capital are measured: tier one capital ( above), which can absorb losses
without a bank being required to cease trading, and tier two capital ( above), which can
absorb losses in the event of a winding-up and so provides a lesser degree of protection to
depositors
5
An Empirical study on Capital to Risk Assets Ratio
1.7 LITERATURE REVIEW
Alfriend (1988) pointed out that a weakness of the minimum capital standards was
that they failed to acknowledge the heterogeneity of bank assets and, as a result, banks had an
incentive to shift their portfolios from low-risk to high-risk assets. Jackson (1999) points out
that one of the reasons why the Basel Committee adopted a single standard for internationally
active banks is that the framework would strengthen the soundness and stability of the
international banking system by encouraging organizations to boost their capital positions.
Moreover, the framework established a structure that was intended to: (1) make regulatory
capital more sensitive to differences in risk profiles among banking organization 2) Take off
balacesheet explosure expicity in to account in assessing capital adequacy (3) lower the
disincentives to holding liquid, low risk assets. Nachane et al (2000) examined the impact of
capital adequacy norms on public sector banks in India for the period 1997 to 1999 and
concluded that capital remains a useful tool in the hands of policy makers for influencing the
banks’ behaviour and there is no conclusive evidence
to support a shift from high risk to low risk assets by banksNag and Das (2002) studied the
impact of capital requirement norms on flow of credit to the business sector by public sector
banks in India and found that in the post reform period, public sector banks did shift their
portfolio in a way that reduced their capital requirements. Rowe (2004) notes that the first
pillar defines the minimum regulatory capital for three different risk categories. Apart from
credit risk and market risk, it prescribes a capital requirement for operational risk as well.
Hall (2004) states that disclosure of risk-based capital ratios calculated are in accordance with
the prescribed methodology and qualitative disclosure about the internal processes are used to
evaluate capital adequacy. Mishra (2004)Opines that the new framework seeks to ensure that
a bank's capital position is consistent with its overall risk profile and strategy. Since the new
norms stress the need for the bank management to evolve an internal capital assessment
process and earmark capital commensurate with the bank's specific risk profile and control
environment, a supervisory review to validate such assessment is recommended as a
corollary. Rao (2004) views that Basel I norms aim at ensuring capital adequacy of banks as a
proportion of the risk-weighted assets. Vyas et al (2007) studied the impact of capital
regulation norms like Basel II on the credit growth of Indian banks and concluded that capital
regulations
6
An Empirical study on Capital to Risk Assets Ratio
do not seem to affect credit growth in spite of the growing concerns about banks’ stability.
Murali and Subbakrishna (2008) are of the view that the twin objectives of the accord were to
ensure an adequate level of capital in the international banking system and create a “more
level playing field” in competitive terms so that banks could no longer build business
volumes without adequate capital backing. Radhakrishnan and Ravi (2009) state that capital
requirements not only protect investors but also safeguard them against the possibility of
failure of big banks. They also improve market discipline. Gupta and Meera (2011) feel that
Basel II regulations have led to a significant improvement in the risk structure of banks
because their capital adequacy has improved. Also, there exists an inverse relation between
CAR and Non-Performing Assets (NPAs), which clearly indicates that due to capital
regulation, banks have to increase their CAR which leads to decrease in NPAs.
1.8 Limitations of the study:
The study was limited to finding the selected ratios only.
The study depends on the published data and documents such as balance sheet and
income statements.
It was difficult to obtain confidential data from the concern department with a view
point of confidentiality.
The time period of the project is restricted for short period.
7
An Empirical study on Capital to Risk Assets Ratio
Chapter- 2 INDUSTRY PROFILE
Urban co-operative banks have in the product category of banks. The term urban co-
operative banks (UCBs) though not formally defined, refers to primary co-operative banks
located in urban and semi urban areas. These banks till 1996, were allowed to lend money
only for non-agricultural purposes. This distinction does not hold today. These banks were
traditionally centered on communities, localities work place groups. They essentially sent to
small borrowers and businesses. Today their scope of operations has widened considerably.
The urban co-operative banks using the authorized capital of rupees thousand three
hundred and ninety five cores a class shares of rupees twenty five each. They received the
incomes of interest on deposits, borrowings, salaries, allowances and provident funds……etc.
The origins of the urban co-operative banking movement in India can be traced to the close of
nineteenth century. When inspired by the success of the experiments related to the co-
operation movement in Britain and co-operative credit movement in Germany. Such societies
were set up in India. These are based on the principles of co-operation, mutual help,
democratic decision making and open membership. Urban co-operative banks has to mobilize
savings from the middle and low income urban groups and purvey credit to their members
many of which belonged to weaker sections.
Urban co-operative banks have a role to play in economic construction. The features
of urban co-operative movements has been its heterogeneous character and its uneven
geographical spread.
Cooperative Movement in India
The Indian cooperative movement, like its counterparts in other countries of the world
has been essentially a child of distress. Based on the recommendations of Sir Frederick
Nicholson (1899) and Sir Edward Law (1901), the Cooperative Credit Societies Act was
passed in 1904, paving the way for the establishment of cooperative credit societies in rural
and urban areas on the patterns of Raiffeisen and Schulze Delitzch respectively. The
Cooperative Societies Act of 1912 recognized the formation of non-credit societies and the
central cooperative organizations /federations. The state patronage to the cooperative
8
An Empirical study on Capital to Risk Assets Ratio
movement continued even after 1947, the year in which India attained freedom. The
independent India accepted the concept of planned economy and cooperative organizations
were assigned an important role.
The policy of the Government towards the cooperative movement was guided by the
recommendations of the Saraiya Committee, which stated that .the cooperative society has an
important role to play as the most suitable medium for the democratization of economic
planning.. Various expert committees, which examined the problem of rural Credit
subsequently, have come to the same conclusion, without exception, that in the Indian
context, there is no alternative from the point of view of structural appropriateness, to
cooperatives at the village level. The Rural Credit Survey Committee (1954), the first
comprehensive enquiry into problems of rural credit, after a detailed examination of the entire
gamut of issues including the social ethos of rural society, summed up its findings in the
celebrated dictum that .cooperation has failed, but cooperation must succeed.. Since 1950s,
the cooperatives in India have made remarkable progress in the various segments of Indian
economy. During the last century, the cooperative movement has entered several sectors like
credit, banking, production, processing, distribution/marketing, housing, warehousing,
irrigation, transport, textiles and even industries. In fact, dairy and sugar cooperatives have
made India a major nation in the world with regard to milk and sugar production. Today,
India can claim to have the largest network of cooperatives in the world numbering more than
half a million, with a membership of more than 200 million. Of the primary (village) level
cooperatives, around 28 percent with 137 million memberships are agricultural cooperatives,
dealing directly or indirectly with agricultural sector. The cooperative network in the country
is rather strong covering all the villages in the country and more than 67 percent of the
households have been brought under the cooperative hold. Cooperatives supply about 46
percent of the total rural credit (including agricultural credit), account for 36 percent of the
total distribution of fertilizers, produce about 55 percent of the total sugar and constitute for
28 percent of the rural fair shops (distributing consumer articles). Though cooperative
movement has made remarkable progress in several areas, certain glaring defects have also
developed in the movement, which have been, in a way, defeating the very objectives of these
institutions. The following are the unique features of Indian cooperative movement.
9
An Empirical study on Capital to Risk Assets Ratio
COOPERATIVE BANKING IN INDIA:
Historically, Governments and policy makers have paid more attention to agricultural
cooperatives and thus, the growth and development of the Indian cooperative movement is
heavily tilted in favor agricultural cooperatives in general and in particular, credit
cooperatives. In some areas like dairy, urban banking and sugar, the cooperatives have
achieved success to an extent but there are larger areas where they have not been so
successful. The cooperative credit movement in modern India, curiously, is a state initiated
movement. The state partnership is, perhaps, the unique feature of the Indian cooperative
movement. As of today, Government contribution to the share capital of primary agricultural
cooperatives accounts for about 7.5 percent of the total. Paradoxically, the state partnership
which was conceived as a measure for strengthening the cooperative institutions had paved
the way for ever-increasing state control over cooperatives, their increasing officialization
and politicization culminating.
As against three-tier structure of short-term credit cooperatives, the long-term in virtually
depriving the cooperatives of their vitality as well as their democratic and autonomous
character. Dormant membership, lack of active participation of the members in the
management, lack of professionalism (and absence of corporate governance), undue political
and bureaucratic intervention, have made majority of the cooperatives at the primary level
almost moribund. Understandably, this has resulted in weakening of the cooperative edifice.
The upwardly transmission of the weaknesses of the primary societies have affected the
capabilities of the higher level cooperative federations in so far as their usefulness to the
former is concerned. With regard to agricultural cooperative credit structure, although the
quantitative expansion has been somewhat satisfactory, the movement continues to suffer
from structural defects and operational deficiencies. The acknowledged operational
deficiencies of the cooperative credit structure have been
(I) weak recycling of credit,
(II) poor resource mobilization,
(III) Ineffective lending and
(IV) Poor recovery.
10
An Empirical study on Capital to Risk Assets Ratio
The agricultural credit cooperative system in general has become rather over dependent on
external support in terms of participation in share capital by Government and refinance from
Government owned Financial Institutions .Credit cooperatives are the oldest and most
numerous of all the types of cooperatives in India. The cooperative credit institutions in the
country may be broadly classified into urban credit cooperatives and rural credit
cooperatives. There are about 2090 urban credit cooperatives and these societies together
constitute for about 10 percent of the aggregate banking business and therefore regarded as an
important segment of the banking system. The urban credit cooperatives are also popularly
known as Urban Cooperative Banks.
The rural credit cooperatives may be further divided into short-term credit
cooperatives and long-term credit cooperatives. With regard to short term credit cooperatives,
at the grass-root level there are around 92,000 Primary Agricultural Credit Societies (PACS)
dealing directly with the individual borrowers. At the central level (district level) District
Central Cooperative Banks (DCCB) function as a link between primary societies and State
Cooperative Apex Banks (SCB). It may be mentioned that DCCB and SCB are the federal
cooperatives and thus the objective is to serve the member cooperatives cooperative credit
structure has two tiers in many states with Primary Cooperative Agriculture and Rural
Development Banks (PCARDB) at the primary level and State Cooperative Agriculture and
Rural Development Bank at the state level. However, some states in the country have unitary
structure with state level cooperative operating with through their own branches and in one
state an integrated structure prevails. The organizational structure of the credit cooperatives
in India is illustrated in chart I.Interestingly, under the Banking Regulation Act 1949, only
State Cooperative Apex Banks, District Central Cooperative Banks and select Urban Credit
Cooperatives are qualified to be called as banks in the cooperative sector. In other words,
only these banks are licensed to conduct full-fledged banking business.
Urban Cooperative Banks in India
The term Urban Co-operative Banks (UCBs), though not formally defined, refers to
primary cooperative banks located in urban and semi urban areas. These banks, till 1996,
were allowed to lend money only for non-agricultural purposes. This distinction does not
hold today. These banks were traditionally centered around communities, localities work
11
An Empirical study on Capital to Risk Assets Ratio
place groups. They essentially lent to small borrowers and businesses. Today, their scope of
operations has widened considerably.
The origins of the urban cooperative banking movement in India can be traced to the
close of nineteenth century when, inspired by the success of the experiments related to the
cooperative movement in Britain and the cooperative credit movement in Germany such
societies were set up in India. Cooperative societies are based on the principles of
cooperation, mutual help, democratic decision making and open membership. Cooperatives
represented a new and alternative approach to organization as against proprietary firms,
partnership firms and joint stock companies which represent the dominant form of
commercial organization.
Characteristics of urban cooperative banking in India
Cooperatives may still have an edge in identifying and serving consumer needs.
In theory, cooperatives are better able to maximize consumer surplus. Hansmann, for
example, notes that inefficiencies may arise from firms seeking to satisfy the preferences of
the marginal patron (to maximize sales/profits) rather than those of the average patron (which
would maximize consumer surplus). In a cooperative, the one-member one-vote system will
lead the firm to seek to satisfy the preferences of the median patron, who is closer to the
average patron than the marginal patron is. However, in part because the median voter does
not necessarily reflect average preferences, Hart and Moore (1998) find that, for consumers,
cooperative ownership becomes less advantageous the more competitive a market is and
more so the more uniform the membership base is However, these theoretical considerations
are predicated on the assumption that all relevant decisions are made by the full membership
base, or at least by a representative sample of members. The reality is very different (see
section on corporate governance). Nevertheless, the fact that a cooperative‘s clients are also
its members and are involved in its decision-making, should provide it with an informational
advantage over commercial banks. While size and increasing distance between members and
management are likely to reduce this advantage, the remarkably high market shares some
cooperative banks have in the market segments they target (e.g., farmers in France) seem to
indicate that it remains in place to a significant extent.
12
An Empirical study on Capital to Risk Assets Ratio
Challenges for urban cooperative banks cooperatives and financial
stability:Prudential authorities need to be conscious of the specific risks cooperative banks
face, as well as of the potential impact they may have on the banking system as a whole. The
most important of these specific risks are related to the combination of the governance
challenges and the constraints cooperatives face in managing their capital.
The Experience Thus Far
Cooperative banks generally have lower incentives to take on risks, and this seems to be
confirmed by experience. The lack of a need to maximize profits and the absence of many of
the factors that lead rational managers in commercial banks to adopt short-term horizons
means that cooperative banks have lower incentives to take on risk. Much of the available
evidence is consistent with this prior. During the US savings and loans crisis, investor-owned
S&Ls fared much worse than mutual S&Ls, because they had tended to pursue more
speculative investment policies (Hansmann, 1996). It is also found that Cooperative banks in
France and Switzerland fared generally better than commercial banks during the banking
problems of the early 1990s. It‘s noted that cooperatives typically have more risk averse
clients, who may prefer member shares in a cooperative over more risky assets such as stocks
in Capital Market. Cooperative banks may be more vulnerable to certain shocks, including
credit quality and interest rate developments, but possibilities to manage these vulnerabilities
are increasing. Old-fashioned intermediation is cooperatives ‘core business. Hence, while
they may still have a bit of an edge in managing credit risk, cooperative banks typically have
a lot of such risk. Moreover, the credit risks they face tend to be correlated with each other
due to cooperatives ‘focus on a usually in at least some ways homogenous member base. As
noted above, cooperatives ‘business model also relies more on one particular source of
revenues (the interest margin), which is likely to imply higher vulnerability to interest rate.
Developments Overall, while cooperative banks may generally be stable, they do tend to be
vulnerable to certain types of instability. Just few years bank many cooperative banks in India
have had problems with nonperforming assets. However, developments in financial markets,
in particular the increased opportunities to hedge against interest rate risk and securitize loan
portfolios, should allow cooperatives to reduce and better manage the risks they face In our
country India also, because of very problem two large cooperative banks such as,
13
An Empirical study on Capital to Risk Assets Ratio
Madhavpura Mercantile Bank in Gujarat and Charminar Bank in Andhra Pradesh failed. Both
of these banks carry with them several other small and medium cooperative banks towards
failure. Cooperative banks may have more difficulties adjusting to adverse circumstances and
changing risks. The Swedish cooperative banking sector did not survive the crisis of the early
1990s in a cooperative form, and the need to restore capital was a major factor in the decision
to demutualize. A cooperative‘s typical business model comes with a relatively high fixed
cost base. With employees involved in decision making, it may be hard to cut these costs
quickly when needed. Strong
Union affiliation makes the mater worst. In many such cooperative banks cost
of employees is more than 80% of the total administrative cost. On the positive side,
employees-members may be more loyal and motivated, and therefore more determined to
pull the firm through times of hardship rather than abandon it. Cooperatives ‘business and
depositors are also more stable, allowing them to thrive with a higher (fixed) cost base.
Beyond conjuncture developments, the risk of technological change rendering the
cooperatives ‘branch-based strategies obsolete needs to be taken seriously. Risks have also
materialized when Cooperatives ventured onto unfamiliar terrain (e.g., derivatives markets).
Democratic decision-making may come at the expense of the speed and quality of decision-
making needed to thrive under rapidly changing circumstances. In cooperatives in which
members are routinely involved in strategic and managerial decisions, the outcome may be
indecisiveness, conflict, slow adaptability, and an inability to jump on business opportunities
or take tough decisions in a timely way.
Building Empires?
Capital and growth dynamics. Most cooperatives are designed to perpetually
accumulate capital, thus building an ever-larger intergenerational endowment. At the time
they were set up, a shortage of funds was typically one of the most important challenges
cooperatives faced. To remedy this, mechanisms were put in place to ensure capital
accumulation. As discussed above, this led to the creation of an intergenerational endowment
that in most cases constitutes the bulk of a cooperative‘s equity and that keeps on growing as
long as the cooperative remains profitable. Now, a century and a half after the cooperative
banking movement started, in many cases the shortage of capital problem is no longer
present, but the mechanisms that ensure capital accumulation remain in place. This section
argues that cooperatives are caught between their capital-accumulating set-up, pressures to
14
An Empirical study on Capital to Risk Assets Ratio
achieve similar profitability as commercial banks, and the already sizable equity they have
built up throughout their history.
Cooperative banks face specific challenges in managing their capital:• They have limited control over their cooperative capital, although over many decades this
has typically been rather stable.
Since in most cooperatives members can withdraw their membership and ask to have
their shares reimbursed, cooperative capital (the part of capital to which members ‘shares
represent a claim) is variable and cooperatives could theoretically face a ―run on capital‖. In
practice this has not been an issue, given the buffer provided by the intergenerational
endowment and considering lengthy withdrawal mechanisms and the unconditional rights
that some cooperatives have to refuse redemption. In many cooperatives, there is a minimum
level of capital below which redemption is refused.
• They often face binding restrictions on their pay-out policies.
At many cooperatives, there are statutory or legal restrictions that put limits on
shareholder remuneration. For example, Swiss Raiffeisen banks are legally not allowed to pay
more than 6 percent dividend on the notional value of member shares; some French
cooperative banks cannot pay more than the government bond yield; Rabobanks do not pay
dividends to members because membership is free of charge and the Italian banking law
requires that credit cooperatives add 70 percent of their annual profits to their reserves and
three percent to a solidarity fund. As far as India is concerned, The Reserve Bank of India do
not permit to Pay more than 15% Dividend to their Shareholders.
• They can face severe difficulties raising capital in times of need.
Provided there is a prospect of future profits, commercial banks (Private) can always issue
new shares and sell those at market price when the need to shore up equity arises.
Cooperatives, by contrast, can only raise new cooperative capital by increasing their
membership or by asking existing members to buy more shares. They can also issue certain
kinds of securities and, in many cases, mobilize capital from their network in times of need.
However, both raising new capital and tapping alternative sources of funding come with
potential problems. First, members may not be well placed to provide capital when needed.
They typically pay very little for their shares and buy them to gain access to the benefits the
15
An Empirical study on Capital to Risk Assets Ratio
cooperative offers rather than as a financial investment (with low dividends and no potential
of appreciation). As a result, they may not have any incentive to buy more than the minimum
number of shares needed (a sort of ―membership fee‖).
The lack of diversification at small cooperatives and the high degree of overlap between their
member and clients also means that in times of difficulties many members may not be in a
position to provide significant amounts of fresh capital. Furthermore, in many cases there are
legal and/or statutory restrictions on the total value of shares a member may hold. Second,
issuing other securities is from various perspectives not as attractive as raising cooperative
capital. Among other things, such securities often require a relatively high remuneration. In
both approaches, decision-making procedures to raise new capital may be cumbersome and
time-consuming.
• Even in the absence of restrictions, there may be few incentives to pay out a significant
share of profits.
Cooperatives are not at risk of seeing their share price traded at a discount because of
dissatisfaction with their pay-out policies. And since shareholder ship in a cooperative is not
usually driven by investment considerations, members are unlikely to care enough about the
level of dividends they receive to organize a ―member revolt,‖ which may be difficult to
begin with.
Competition between Cooperative and Commercial Banks
Cooperatives can follow market share-based or Deposit -based growth strategies, both
of which may lead to overcapacity that may need to be resolved through retrenchment of
commercial banks. Competition between cooperative and commercial banks is likely to be
beneficial to consumers. In the long run, however, it may affect the structure and stability of
the financial system, the impact of which is a subject of debate. Market share-based growth
strategies focus on selling at lower prices than the competition (adjusted for quality, location
and everything else) and therefore accepting lower profitability. Deposit -based growth
strategies are based on relatively high organic growth rates of the capital base. Such a
strategy requires significant profits because for cooperatives profits constitute the main
source of fresh Deposits. As a result of these expansion strategies, competing commercial
banks may face reduced profitability and transition costs and risks (e.g., costs of restructuring
and closing branches). May lead to macroeconomic inefficiency, waste and overcapacity in
16
An Empirical study on Capital to Risk Assets Ratio
the banking system that may take a long time to work out. However, given the higher
inherent stability of cooperative banks, they find a positive overall impact of cooperative
presence on overall banking system stability.
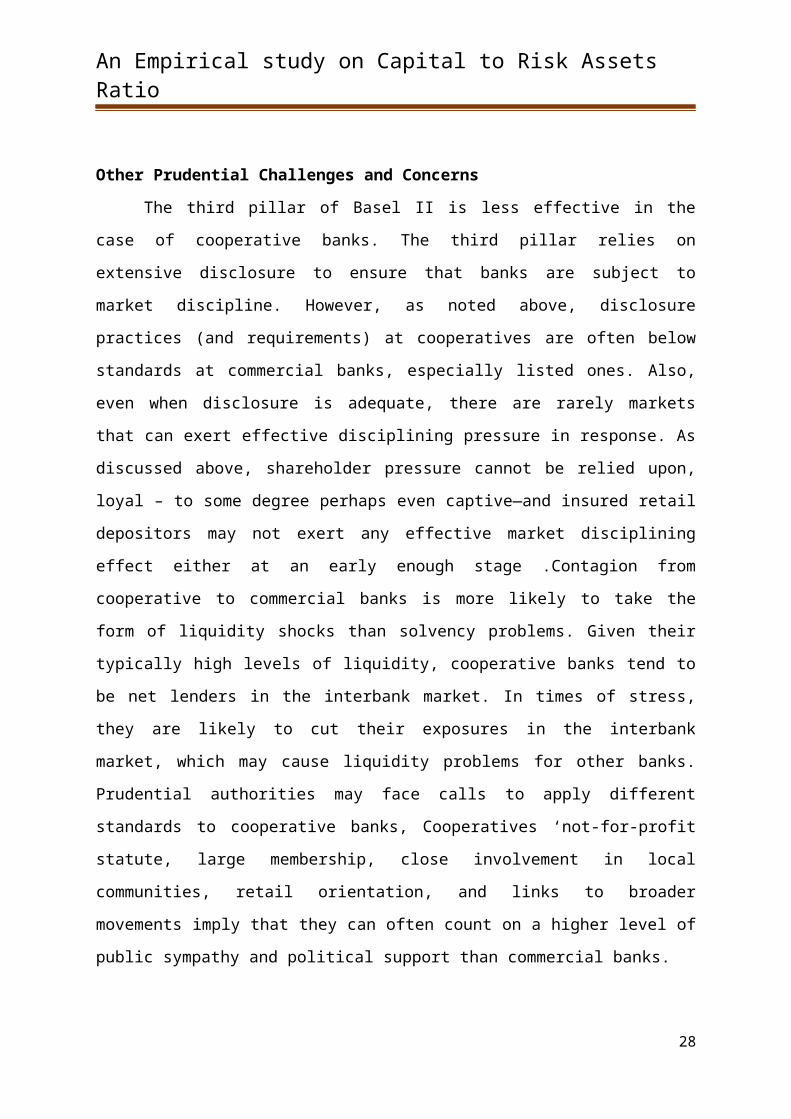
Other Prudential Challenges and Concerns
The third pillar of Basel II is less effective in the case of cooperative banks. The third
pillar relies on extensive disclosure to ensure that banks are subject to market discipline.
However, as noted above, disclosure practices (and requirements) at cooperatives are often
below standards at commercial banks, especially listed ones. Also, even when disclosure is
adequate, there are rarely markets that can exert effective disciplining pressure in response.
As discussed above, shareholder pressure cannot be relied upon, loyal – to some degree
perhaps even captive—and insured retail depositors may not exert any effective market
disciplining effect either at an early enough stage .Contagion from cooperative to commercial
banks is more likely to take the form of liquidity shocks than solvency problems. Given their
typically high levels of liquidity, cooperative banks tend to be net lenders in the interbank
market. In times of stress, they are likely to cut their exposures in the interbank market,
which may cause liquidity problems for other banks. Prudential authorities may face calls to
apply different standards to cooperative banks, Cooperatives ‘not-for-profit statute, large
membership, close involvement in local communities, retail orientation, and links to broader
movements imply that they can often count on a higher level of public sympathy and political
support than commercial banks.
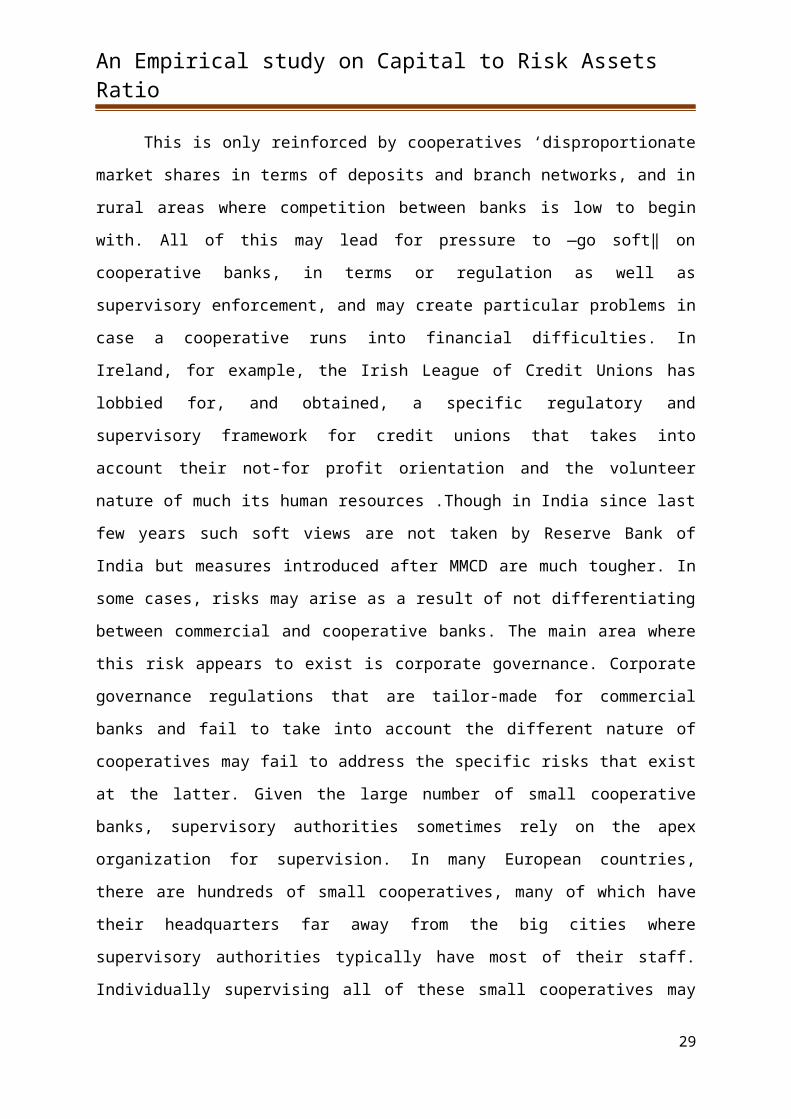
This is only reinforced by cooperatives ‘disproportionate market shares in terms of
deposits and branch networks, and in rural areas where competition between banks is low to
begin with. All of this may lead for pressure to ―go soft‖ on cooperative banks, in terms or
regulation as well as supervisory enforcement, and may create particular problems in case a
cooperative runs into financial difficulties. In Ireland, for example, the Irish League of Credit
Unions has lobbied for, and obtained, a specific regulatory and supervisory framework for
credit unions that takes into account their not-for profit orientation and the volunteer nature of
much its human resources .Though in India since last few years such soft views are not taken
by Reserve Bank of India but measures introduced after MMCD are much tougher. In some
cases, risks may arise as a result of not differentiating between commercial and cooperative
banks. The main area where this risk appears to exist is corporate governance. Corporate
governance regulations that are tailor-made for commercial banks and fail to take into
account the different nature of cooperatives may fail to address the specific risks that exist at
17
An Empirical study on Capital to Risk Assets Ratio
the latter. Given the large number of small cooperative banks, supervisory authorities
sometimes rely on the apex organization for supervision. In many European countries, there
are hundreds of small cooperatives, many of which have their headquarters far away from the
big cities where supervisory authorities typically have most of their staff. Individually
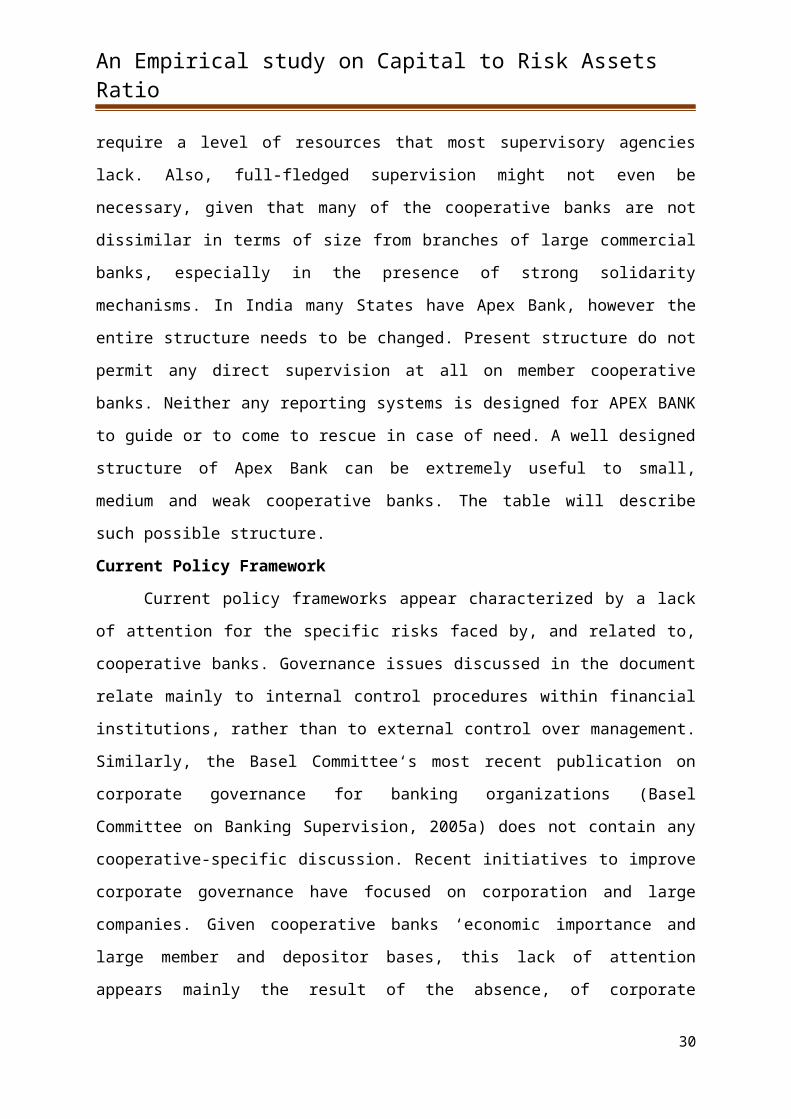
supervising all of these small cooperatives may require a level of resources that most
supervisory agencies lack. Also, full-fledged supervision might not even be necessary, given
that many of the cooperative banks are not dissimilar in terms of size from branches of large
commercial banks, especially in the presence of strong solidarity mechanisms. In India many
States have Apex Bank, however the entire structure needs to be changed. Present structure
do not permit any direct supervision at all on member cooperative banks. Neither any
reporting systems is designed for APEX BANK to guide or to come to rescue in case of need.
A well designed structure of Apex Bank can be extremely useful to small, medium and weak
cooperative banks. The table will describe such possible structure.
Current Policy Framework
Current policy frameworks appear characterized by a lack of attention for the specific
risks faced by, and related to, cooperative banks. Governance issues discussed in the
document relate mainly to internal control procedures within financial institutions, rather than
to external control over management. Similarly, the Basel Committee‘s most recent
publication on corporate governance for banking organizations (Basel Committee on Banking
Supervision, 2005a) does not contain any cooperative-specific discussion. Recent initiatives
to improve corporate governance have focused on corporation and large companies. Given
cooperative banks ‘economic importance and large member and depositor bases, this lack of
attention appears mainly the result of the absence, of corporate Governance for cooperative
Banks. However since last few years the need has been recognized and now many
discussions are taking place all over India.
Following Weaknesses are generally found in the working of Urban Co-operative
Banks.
• Absence of systematic approach to profit planning, risk and resources management.
• Miss match in cost, yield and maturity profile of asset and liability.
• Shoddy accounting practices (income and expenses recognition, investment valuation,
depreciation, NPA provisioning etc.)
• Misleading Management control systems, performance measurement and compensation
system.
18
An Empirical study on Capital to Risk Assets Ratio
• Increase in level of NPA‘s due to inadequate asset portfolio management.
• High deposit and lending rates.
• Unprofessional approach on credit and loan appraisal, product pricing and management of
asset portfolio.
• Shrinking spreads, thinning margins, poor credits off take due to general industrial
recession.
• Confidence crisis.
• Dual Regulations.
• High burden / cost of operations.
• Conflicting objectives Business V/s Societal
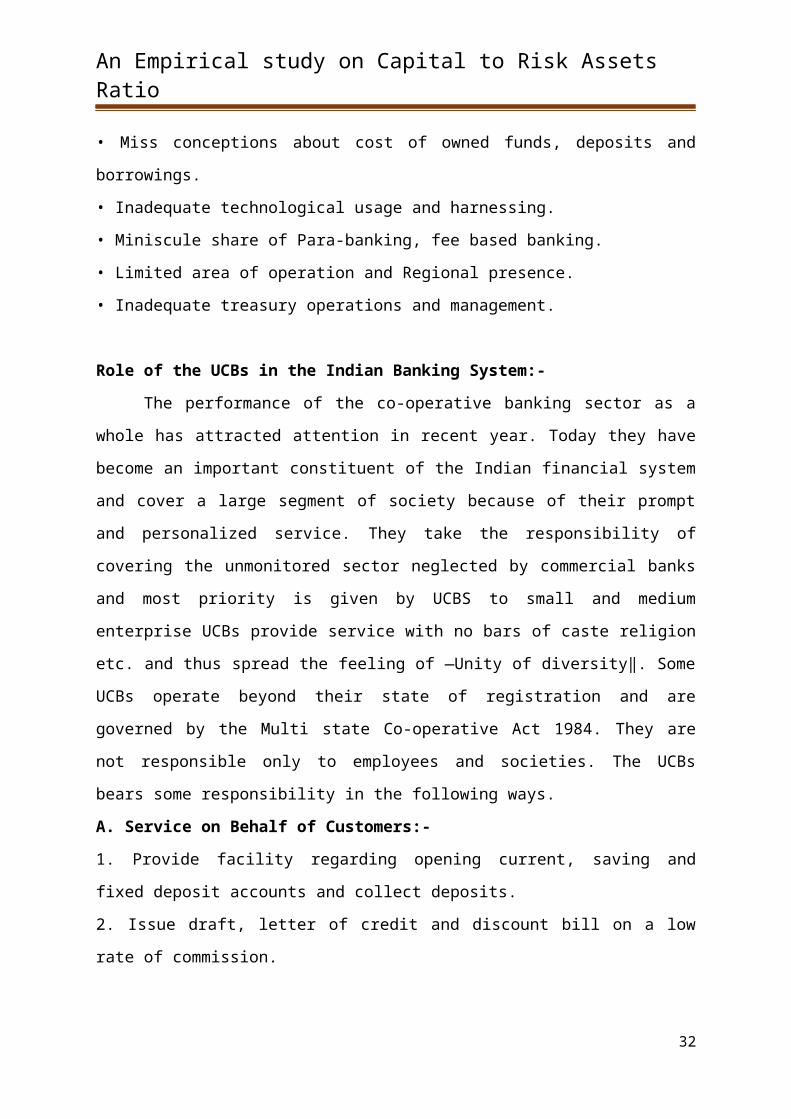
• Miss conceptions about cost of owned funds, deposits and borrowings.
• Inadequate technological usage and harnessing.
• Miniscule share of Para-banking, fee based banking.
• Limited area of operation and Regional presence.
• Inadequate treasury operations and management.
Role of the UCBs in the Indian Banking System:-
The performance of the co-operative banking sector as a whole has attracted attention
in recent year. Today they have become an important constituent of the Indian financial
system and cover a large segment of society because of their prompt and personalized
service. They take the responsibility of covering the unmonitored sector neglected by
commercial banks and most priority is given by UCBS to small and medium enterprise UCBs
provide service with no bars of caste religion etc. and thus spread the feeling of ―Unity of
diversity‖. Some UCBs operate beyond their state of registration and are governed by the
Multi state Co-operative Act 1984. They are not responsible only to employees and societies.
The UCBs bears some responsibility in the following ways.
A. Service on Behalf of Customers:-
1. Provide facility regarding opening current, saving and fixed deposit accounts and collect
deposits.
2. Issue draft, letter of credit and discount bill on a low rate of commission.
3. Provide services of automatic teller machine mobile banking and depository participants
and do immediate transfer of money.
4. Computerized bank passbook issued to customers.
5. Received complaint of customers and solve it as early as possible
19
An Empirical study on Capital to Risk Assets Ratio
6. Provide self-deposit vault facilities
7. Advances are given to small scale and medium enterprise and cottage industries.
8. Advances against properties, jewelry, govt. securities, life policy and new or old vehicles.
B. Service on Behalf of Employees:-
1. Provide medical facilities and educational facilities.
2. Provide various types of allowances.
3. Maintain various types of funds like staff provident fund bonus fund etc.
4. Conduct training programs for new employees and refresher programs for old employees
and organize a seminar and the conferences to update their knowledge.
5. Special education reward is given to employees children for highest percentage.
C. On Behalf of Society:-
1. Provide donation to educational institutions charitable institutions and hospitals etc.
2. Advances to the weaker sections of the societies to be self -sufficient.
3. Helping to the people at the time of natural calamity like earthquake, flood, drought.
4. Sustain and generate gainful employment.
5. Equal distribution of credit structure by branch expansion particularly in areas which are
not covered by the banking system.
Problems & Prospects of UCBs:-
UCBs were setup with the objective of promoting saving habits amongst the middle-
income group of the urban population 2004 is golden jubilee of urban co-operative banks
celebrated by govt. of Gujarat. During the 100 years of their inception they have attracted
considerable attention and large 78 number of them has shown creditable performance but
fair number of them have simultaneously shown discernible signs of weakness too because of
the problems they could not overcame some important factors, Which are barriers to the
progress of the UCBs are as given below.
1. Dual Control: -A major problem faced by UCBs is the duality of control by the State
Government and the RBI. The UCBs are supervised by RBI and also issued for license while
regarding administrations like, registration, administration constitution and administration
and selection etc. This had negative impact on the functioning of the UCBs. Duality in
command hampers effective supervision. The Narsimhan committee suggests removing dual
control system which is affected to UCBs. High power Committee also.
20
An Empirical study on Capital to Risk Assets Ratio
2. Limited Area of Operations:-
The UCBs have to function within restricted framework in the context of
mobilization of deposits. The need for heavy industrial advances and trade finance for
industrial units as well as for commercial enterprises is here but the UCBs are not able to
meet with it is they have to serve as per the RBI directives. But to survive in the competitive
world the UCBs should enhance their area of operation and start providing loans as per local
needs.
3. Violation of Prudential Financial Norms: -It is found that many UCBs Violate norms
governing advances. Top officials of the banks receive loans without documents. The failure
of Visangar Co-operative Bank (Mehsana) and Madhavpura Mercantile Co-operative Bank
(A ‘bad) are the example of violation of prudential norms. The UCBs must adopt a system of
internal audit and inspection of branches and department, the RBI should follow strict
supervision and to stop such malpractices.
4. Poor Management: - The necessity of the financial institution has a good corporate
financial management and articles. The Madhavrav committee insisted to appoint two
directors who are professional or experience persons. But in UCBs directors are politician or
illiterate. Due to this reasons management of the UCBs are poor. The RBI advice to directors
about it by letter dated 05-04-2002
5. Poor Quality Services: -The services of the UCBs are not significant enough in terms of
quality and have failed to attract deposits from individuals and institutions other than the co-
operative sectors. Hence they should try to improve the quality of services by providing
required facilities like waiting space; customer information counter, complain box, banking
information chart, easy accessibility to higher officials at the banking promises etc. At the
same time they should maintain good customer relations and keep positive attitude towards
customer. Besides this; they should start providing door to door services.
6. Lack of Modernization:- In today‘s world of technological advancement, still manual
form of work followed in some of the UCBs which cause delay and increase operational cost.
Most of the UCBs failed to provide service through use of modern technology except some
UCBs. It has become inevitable now on part of the UCBs to have computerized system of
banking and adopt latest banking technique like ATM, Credit Card, Internet Banking, Branch
Banking, Tele Banking etc.
7. Increasing Overdoes: - The UCBs suffer from dangerously. Low or weak quality of loans
assets and highly unsatisfactory recovery of loans, which enhance the proportion of overdue.
21
An Empirical study on Capital to Risk Assets Ratio
Due to this situation, UCBs must have to develop a separate recovery department for quick
recoveries.
8. Political Interference: -Political interference in affairs of the UCBs leads to faulty lending
and poor recovery. It compels, to pressure on the banks to provide loan to parties whose
repaying capacity is doubtful. Visanagar co-operative bank is a example of this situation.
Though banks take to legal action against the defaulter it often interferes by putting an end or
postponing such an action. Hence political interferes is damage to UCBs administration.
9. Staff Problems and prospects:-The UCBs have not trained and professional staff. The
UCBs do not select staff on professional basis. External pressures are a cause of untrained
and low standard staff which directly affect on quality work. At least appointment of chief
executive officer ( like Manager or Managing director) should be made on professional lines
and provide training to untrained or fresh staff members or employees.
10. Some Other Problems of UCBs are as under: -
I. Low capital adequacy ratio etc.
II. Lack of transparency in financial statement.
III. The Balance sheet of most of UCBs are not finalized in time due to
Non-completion of audit purpose.
IV. Lack of planning and co-ordination.
V. Lack of standardization in data reported by ratio etc.
Future of the UCBSS:-
Looking at the progress of the UCBs it can be said that they have expended by leaps
and Bounds and increased their business over the last few decades. A walk down the streets
of Mumbai, Ahmedabad, Hyderabad, Surat etc. reveals how widely they have spread their
tentacle across the nation. Every nook and corner displays the hoarding of the office of one or
the other UCB. But an increasing number of failures of the UCBs have spoiled the image of
the UCBs and shaken the faith of their depositors and investors. The scam of Madhapura
Mercantile Co-operative Bank (MMCB) of Ahmedabad, Krushi Co-operative Bank of
Hyderbad and Visanagar Nagrik Sahkari Bank (Mehsana Dist.) have brought into the fact that
loopholes exist within the banking system itself and the RBI failed to perform its duties as a
banking regulators. In the case of Krushi bank, it was found that the Chairman and the Vice
Chairman got loans from the bank without any collateral and the funds were siphoned off for
other purposes. Similarly in MMCB lending norms were violated and crores of rupees were
given to Mr. Ketan Parekh violating norms of the bank. In case of Visangar Sahakari Bank, it
22
An Empirical study on Capital to Risk Assets Ratio
was found that the chairman and his relatives got loans from bank without any proper
documents and guarantors. Free entry of private financial institutions has
also led to a threat to their existence. In spite of these problems, with regard to the future of
these banks it can be said that the UCBs will continue to be promoters of mass banking as
distinguished from class banking usually practiced by commercial banks. The future of UCBs
is much better due to their numerous distinctive such as85
(a) Close familiarity with the members
(b) Local feel
(c) Democratic management
(d) Personalized service
(e) Compactness in the area of operation
(f) Close supervision over the end use of credit
(g) Prompt recovery of dues from member borrowers.
But both the RBI and the UCBs should try to maintain this distinctive identity of the UCBs
and take care to waive scandals or scams. In order to achieve this goal, the RBI should take
measures to strengthen the regulatory frame work for the co-operative sector, lay down clear
cut guidelines for their management structure and should enforce further prudential standards
in respect of access to uncollateralized funds and lending against volatile assets.
Simultaneously, the UCBs should try to complete with private financial institutions and
commercial banks within their limits. Their main inclination should be towards customer‘s
satisfaction. They should introduce a ―Customer Day‖ on which customers can meet and
discuss with the Board of Directors their problems. They should also try to reach to the
customers by providing door-to-door services. They should open a separate wing for
publicity and advertisement of existing well as new schemes of deposits loans and other
services provided by them. Simultaneously they should try to enhance their deposits and
advances by providing quality services. For enhancing deposits, they should introduce
children savings and youth savings centers in schools and colleges respectively and provide
knowledgeabout the benefit of savings. All UCBs should introduce mobile vans for
handicapped and illiterate people. Similarly for enhancing advances, they should do market
research and start loaning according to the local needs ;keep less margin of profit on
advances; provide a guideline about the procedure of advances to the general public so that
they would not procedure of advancing loans; etc.. Such comprehensive attempts will help
the UCBs in enhancing the banking business in limited areas only. In short, the UCBs must
come into their own to take the future head on. It‘s time for them to think strategically and
23
An Empirical study on Capital to Risk Assets Ratio
focus on the opportunities in terms of market, products and customers. It requires a vision
about which their future customers are going to be what they will need; who their competitors
will be and what their disadvantages mean for the UCBs; etc. They should be ready to make
changes in their policy as per the demands and competition. They should consider
diversification of business product and must upgrade their skills and technology to provide
efficient and affordable services. At evolve a systematic approach towards human resource
development in many areas like manpower planning, recruitment, placement and leadership
development for motivating staff and increasing productivity. In short UCBs should pay
attention to human resources development and evolve a systematic approach toward human
resource development in many areas. They should focus on the opportunities in terms of
market, products and customers. They also focus on need of customers should be removed
disadvantages of management and administration
24
An Empirical study on Capital to Risk Assets Ratio
COMPANY PROFILEHistorical Background:
The urban co-operative bank ltd Perinthalmanna was commenced on 1916 April 5 and
affiliated to an urban bank branch in 1940 July. It has come under Banking Regulation Act
in1966 and it has provided insurance to the money under deposit insurance and credit
Guarantee Corporation. Today the members are numbering up to 47000. In 1966it has
covered only 6 villages but in 1972 it is covering all the Perinthalmanna taluk. In 1979 its
first branch opened at karinkallathani. In 1980-91 the bank has entered a depression stage. In
1994 got license according to the Banking Regulation Act of Reserve bank. Now bank has
fully computerized 15 branches at Perinthalmanna today the bank has 110 permanent
employees, 9 part time employees and 13 daily deposit collectors based on commission and
also 6 other workers and 5 securities. The chairman of urban co-operative bank, Board of
directors and employees, workers are foreseeing future actions and policies accordingly, has
achieved the required CRAR AND decreased NPA very effectively. Today net NPA is zero
percentage from the net profit of bank, 1% is used for the social welfare activities .And
benefit allowed 2500 for cancer, kidney and heart patients admitting EMS cooperative
hospital and to provide bed rent. This year 311800 has giving in this aspect. The urban co-
operative bank has clear vision and mission. Bank provides RTGS, NEFT lacer facilities in
all branches. Core banking facility is now providing soon. If the core banking is started ATM,
malty banking, net banking, tale banking ………..etc., can be started high interest rate are
given for depositories up to 12.5%. This bank provides loans up to 5000000 former chants
and also provides loan for retailers in with simple condition and they provides loans for
employees to meet their needs and wants. And they provide vehicle loan, gold loan and
housing loan………etc., the urban co-operative bank Perinthalmanna is act as the head office
of urban co-operative banks. It is situated pattambi road Perinthalmanna. Cooperative society
is the nature of ownership. The urban co-operative bank using 18.89 crore amount of capital.
And they using share capital and reserves as their source of capital. In the bank total 91
employees are working. These including male and female workers. It worked as two different
branches morning branch and evening branch. Morning started at 9.30 am to 4.30 pm. And
evening branch starting 3 to 8 pm. The urban co-operative bank ltd is offered loans, advances
and deposits as to its products and services. The Registration number of the bank is 1758 Dt
07.03.1916 and the RBI License No is UBD.KR.1070P.Dt.23.04.1994. The email address of
Perinthalmanna urban co-operative bank is ucbpmna@ yahoo.com
25
An Empirical study on Capital to Risk Assets Ratio
PROMOTERSThe bank is completely controlled by the President, Vice president, and the Directors.
Only RBI can interfere in the rules and regulations of the bank.
The bank consists of a President, a Vice president and 13 Directors
CHAIRMAN - Mr.DIVAKARAN
GENERAL MANAGER - V. MOHAN
DIRECTORS - M.K BALAKRISHNAN
- M. CHATHAN
- PALOLI KUNJIMOHAMMED
- K.R. BEENA
- E.V. SANKARANARAYANAN
- P.C. SHAMSUDHEEN
- V. SREEKUMARAN
- UMMER
- K.VASUDEVAN
26
An Empirical study on Capital to Risk Assets Ratio
VISION AND QUALITY POLICY1. Accepting deposits for the purpose of promoting saving habits in the minds of the
public and members.
2. Providing various types of loan facilities to members and associates members
3. QUALITY POLICY: to render good customer service
VISIONFor the growth of the bank with stability, the vision 2015 document targeted to become the
first scheduled Urban Co-Operative Bank in Kerala by mobilizing a deposit of Rs.750 crores
and to provide the specialized service to customer
To make "The urban Co-Operative Bank, Perinthalmanna" synonymous to trust and
reliability, to be a leader amongst the co-operative banks in Kerala, to render excellent and
personalized services and to contribute to co-operative movement making credit available to
the customers, more particularly to individuals, SHGS, JLGS, there by contributing to their
growth and striving to maintain net NPA at 0% level.
MISSION
1. To meet the growing aspirations of the customers of the bank in the changing
environment
2. To bring total customer satisfaction by providing quality service
3. To meet the career aspirations of the employees.
4. To promote the effectiveness of credit and to reduce the risk in granting a credit
through careful and continuous supervision.
5. The mission of this bank is to provide society with superior products and
6. Services. Satisfy customer needs and provide employees with meaningful work and
Advancement.
27
An Empirical study on Capital to Risk Assets Ratio
MISSION-2020
Inspired by the sparking performance of the bank between the years 2005-2012, the mission
of the bank has been given an upward push as -"The Urban Co-Operative Bank Ltd,
Perinthalmanna is set to scale new heights by the year 2020 the Banks ambitions is to
achieves Rs. 2000 crores business, Rs. 10 crore Profit, net NPAs to be maintained at 0%
level, net worth of Rs.100 crores and network of 20 branches and ATMs and also to become
the 1st scheduled co-operative Urban bank in kerala.
28
An Empirical study on Capital to Risk Assets Ratio
PRODUCT / SERVICE PROFILE CORE BANKING
Since all branches under core banking, the customers can make their transactions
irrespective of their home bank.
RTGS / NEFT
RTGS/NEFT facility is available in all our branches.
DD / PAY ORDER
The bank provide Demand Draft all over in India. We are members in MASK and
AIMAS. Moreover we have arrangement with HDFC Bank for issuing and collecting
demand drafts.
NRE SERVICES
The customer can open the NRE account in all of our branches.
CLEARING
We are a permanent member in Perinthalmanna and Malappuram clearing house. It
helps our customer for collection without any delay.
LOCKER
We provide locker facility for customers in our selected branches. Customers can
avail this facility on a nominal security and rent.
ATM
Now Bank is in the process of implementation of this facility.
NETBANKING
Now Bank is in the process of implementation of this facility.
29
An Empirical study on Capital to Risk Assets Ratio
The various products and services offered by the bank are ;-
1. CASH CREDITS
2. OVERDRAFTS
3. DISCOUNTING OF BILLS
4. LOAN
5. DEPOSITS
CASH CREDITS: This is a very popular type of Advance made by commercial
banks. This is sanctioned against the Hypothecation or Pledge of the goods like agriculture
and industrial product or against the guarantee of the individual or co-obligate. As per these
financial arrangements, some amount of loan is sanctioned to the borrower and he cannot
utilize it whenever he wants.
It is not obligatory to draw the entire amount in lump. The cheque are issued against
the accounts as and when required by the loans can be credited to the accounts. Thus, cash
credit account is a running account which can be operated according to the will of the
borrower. However the debt balances in the account should not exceed the sanctioned limit.
The interest will be charged quarterly or half yearly on the amount actually used at an agreed
rate. When the cash credit is sanctioned, the banker should keep the amount at the credit of
the borrower, irrespective of the fact that he utilizes the amount or not. Thus, the banker will
lose interest earnings on unpaid balance. To compensate this loss, he incorporates
(MINIMUM INTEREST CLAUSE) according to which the interests to be paid on the
amount utilized at an agreed rate or on the portion of cash credit sanctioned, whichever is
higher. Therefore, cash credit is a popular loan account sanctioned by the commercial banks.
They are also called (revolving goods loan) account as the arrangements are made against the
stock and it is for a longer period and a current account need not be opened in this case.
OVER DRAFT: This is a type of loan sanctioned up to a certain limit against a
current account. Over draft means over drawing the current account account up to a
sanctioned limit. The amount so drawn carries an agreed rate of interest. This is a temporary
financial agreement made for a short period. By the end of the financial year, the borrower
should bring back the current account to credit balance. The interest is paid only on the
utilized portion of the sanctioned limit. Hence, the charges are one percent on the (minimum
interest clause) which is explained under cash credit. Overdraft is sanctioned against the
collateral securities or against the personal security of the borrower.
30

An Empirical study on Capital to Risk Assets Ratio
DISCOUNTING OF BILLS: This is a type of financial accommodation made
between the banker and the customer. According to this, the banker discounts the trade bills
and the accommodation bills of exchange for a shorter period, say 60 days to 90 days and
credits the customer account with the proceeds (i,e., face value of the bills minus the discount
charges). The bill of exchange may be discounted or purchased by the banker or it is given as
a security against an advance.
If they are discounted or purchased by the banker, he will become the (holder for
value), and can freely act as it will be his absolute property. But in case of bills given as
security, the banker cannot freely handle such bills as they are not absolute property. Another
point to be noted here is that the banker gets discount in advance in case of bills are given as
a security against an advance.
LOAN: According to this type of advance, the banker makes advances to the
customer against his personal security of one person. The amount is credited to the
customer’s account immediately in a lump sum or in installments. The period of loan ranges
from one year to ten-twelve years. Accordingly, it has been classified as;
Short-term loan : for one year
Medium –term loan : from one to six years
Long-term loan : for more than six years
REGISTERED OFFICE
The registered office of the bank shall be situated at Perinthalmanna,
Malappuram District.
AREA OF OPERATION
31
An Empirical study on Capital to Risk Assets Ratio
The Urban Co-operative Bank Perinthalmanna has well established branches in
various major areas of Malappuram. This is done to establish a well networked customer
relation.
Bank has 15 branches. They are operating in following areas:-
PERINTHALMANNA MAIN BRANCH
KARINKALLATHANI
MALAPPURAM
PANANGANGARA
CHATTIPARAMBA
MELATTUR
PULAMANTHOLE
MAKKARAPARAMBA
KOLATHUR
PERINTHALMANNA EVENING BRANCH
PATTIKAD
THOOTHA
ANGADIPPURAM
MANKADA
MALAPPURAM EVENING BRANCH
INFRASTRUCTURAL FACILITIESThe bank has 160 X 134 sq feet site. The building is built in 100 X 100 sq feet of site.
A ground floor and first floor is built to carry out the banking activities. It is built for own
use. In top floor, there is a head office branch of the bank and in the first floor, there is an
administrative office.
The head office of the bank is located in Perinthalmanna. It has 15 other branches. All
the branches have computer facilities. Each branch has its own department which is fully
furnished and well equipped for smooth functioning of the banking activities.
The infra of the bank is not only providing facilities to employees like canteen
facilities, drinking water, snacks, proper lighting, ventilation facilities etc. with all these
facilities the employees are more motivated to work in this environment.
32

An Empirical study on Capital to Risk Assets Ratio
COMPETITOR’S INFORMATIONCo-operative bank is facing competition from the commercial banks and foreign
banks. They are not providing core banking facilities, which make the customer to make
banking transactions easy, the bank is yet to adopt this facility. So core banking providers are
the main competitor to the co-operative bank.
Apex co-operative bank
Canara bank
ICICI bank
HDFC
Axis bank
Visveswarayya bank,
33
An Empirical study on Capital to Risk Assets Ratio
SWOT ANALYSIS STRENGTH
1. Social Principles
2. Wide Network
3. Democratic Control
4. Mutuality
5. People's Support
6. Rural Accessibility
7. State's Support
8. Integration
9. Leadership
10. Cooperative Ideology & Principles
11. Apex Bank with Good Network
12. Vast Human Resources
13. Refinance on Concessional Rates
14. Support from Government
15. Support from NABARD
16. Most Modern Banking Technology Support
WEAKNESSES
1. Absence of systematic approach to profit planning, risk and resources
management.
2. Miss match in cost, yield and maturity profile of asset and liability.
3. Shoddy accounting practices (income and expenses recognition,
4. Investment valuation, depreciation, NPA provisioning etc.)
5. Misleading Management control systems, performance measurement
and compensation system.
6. Increase in level of NPA‘s due to inadequate asset portfoliomanagement.
7. High deposit and lending rates.
8. Unprofessional approach on credit and loan appraisal, product pricing
34
An Empirical study on Capital to Risk Assets Ratio
and management of asset portfolio.
9. Shrinking spreads, thinning margins, poor credits off take due to
general industrial recession.
10. Confidence crisis.
11. High burden / cost of operations.
12. Lack Of Autonomy
13. Dependency On Government:
14. Political Interference
15. Absence Of Professionalism
16. Duality Of Control
17. High Establishment Costs:
OPPORTUNITES
1. Professional Management:
2. Diversification Of Activities
3. Expansion Of Business:
THREATS
1. Competition
2. Disloyalty Of Members
3. Increasing Trend Of Corruptive Practices
FUTURE GROWTH AND PERSPECTIVE
In the near future,
The bank wants to increase its operations by setting up its branches all over the
district
They are planning to enter core banking.
Improve customer service.
To increase deposits
Expansion of credit for medium scale industries
35
An Empirical study on Capital to Risk Assets Ratio
GROWTH OF BANK Amount in lakhs
YE
AR
DEPOSIT LOANS SHARE RESERVES INVESTMENT
IN GOVT.SEC
PROFIT DIVIDEND
(%)
1980 60.43 67.51 4.68 4.74 NA -0.70 0
1990 302.56 213.72 7.64 7.04 NA 3.49 0
1991 415.87 281.47 8.94 7.70 NA -2.08 0
1992 499.48 365.10 11.06 8.67 NA 3.27 0
1993 586.71 419.62 12.77 18.40 NA 3.74 0
1994 678.47 469.79 14.64 20.33 NA 4.07 10
1995 693.89 535.88 17.67 37.29 NA 4.89 10
1996 931.36 635.80 21.46 56.96 NA 4.79 10
1997 1347.34 930.78 28.27 72.52 NA 8.44 15
1998 1901.01 1430.18 41.58 93.39 NA 17.42 20
1999 4074.07 2315.70 71.54 123.28 NA 18.46 20
2000 5413.69 3739.22 115.11 242.23 NA 59.26 20
2001 6723.69 5178.65 178.30 384.29 NA 68.90 20
2002 7911.35 5944.55 248.08 541.51 NA 82.53 20
2003 10857.37 7439.53 346.22 765.03 NA 76.13 10
2004 12090.00 9298.66 500.01 1028.65 1881.74 127.74 15
2005 12799.95 10210.22 562.25 1292.32 2077.40 137.48 14
2006 15971.20 10318.44 662.35 1421.25 2372.93 232.24 13
2007 17125.40 12151.11 764.60 1896.34 2542.77 171.72 13
2008 18198.95 13111.62 809.45 2176.62 2818.97 197.85 13.5
2009 23229.19 13992.46 856.98 2376.97 3920.17 240.11 13.5
2010 26759.96 17484.92 1074.99 2781.12 4063.00 261.82 13.5
2011 29623.92 21792.35 1355.17 3166.28 7505.55 311.83 13.5
2012 38116.27 25729.52 1551.88 3824.14 9745.09 461.54 13.5
2013 43354.55 31707.68 1889.74 4597.29 11525.00 542.99 13.5
Organization structure
36
An Empirical study on Capital to Risk Assets Ratio
The institution is coming under the administrative control of the
Registrar of Co-operative Societies. The Management and administration of the Welfare
Board is vested with a Managing Committee constituted by the Government of Kerala. The
Managing Committee consists of 13 members headed by the Humble Minister for Co-
operation as Chairman (Ex-officio). There is a Vice-Chairman nominated by Government
from among the members of the Managing Committee. Secretary- Treasurer of the Board
shall be an officer in the cadre of an Additional Registrar of Co-operative Societies appointed
by Government. The Secretary- Treasurer shall be the person to sue and be sued on behalf of
the Board. In addition to that the managing committee consisting of;
Secretary (Co-operation) to Government of Kerala
Registrar of Co-operative Societies, Trivandrum
Chairman, Kerala State Co-operative Union, Trivandrum.
Joint or Deputy Secretary to Government, Finance Department (to be
nominated by the Government of Kerala).
Two representatives of Associations of Co-operative Employees (to be
nominated by the Government of Kerala)
Five persons who are associated with the Co-operative movement to be
nominated by the Government of Kerala.
ORGANISATION STRUCTURE OF THE URBAN CO-OPERATIVE BANK LTD
PERINTHALMANNA
37
An Empirical study on Capital to Risk Assets Ratio
NATURE OF BUSINESS
38
BOARD OF DIRECTORS
GENERAL MANAGER
CHAIRMAN
ASSISTANT GENERAL MANAGER
PEON
ATTENTER
JUNIOR CLERK
ACCOUNTANTS
BRANCH MANAGERS
GENERAL BOADY
An Empirical study on Capital to Risk Assets Ratio
The operation of the bank is throughout Urban Co-operative bank limited
Perinthalmanna. They offer all types of banking services to the customers like deposits, loans,
DD pay order, bank guarantees, cheque collection facility, insurance products in
collaboration with ICICI LOMBARD, etc.
OBJECTIVES OF THE BANK
1. To encourage thrift, self – help and co-operation among members.
2. To accept deposits of money from the public repayable on demanded or other wise
and withdrawal by cheque, draft, order or otherwise for the purpose of
lending on investment.
3. To borrow or raise money.
4. To lend or to advance money either upon or without security to members and others
as permitted by Registrar.
5. To draw , make a dept. , discount , buy , sell , collect and deal in bills of exchanges ,
bundies , promissory notes , coupons , drafts , warrants, certificate, scripts , and
other instruments and other securities whether transferable or negotiable or not .
6. To grant and to issue letters of credit, travelers cheque and circular notes.
7. To buy and sell foreign exchange including foreign bank notes.
8. To purchase and to sell bonds, scripts or other forms of securities on behalf of
constituents.
9. To provide safe vaults
10. To collect and transmit money and securities.
11. To negotiate loans and advances.
39

An Empirical study on Capital to Risk Assets Ratio
SHARES
The authorized capital of the bank for the present shall Rs.18.89 crores made up of the
following type of shares, 7442730 A class shares of Rs.25 each by person which should be
paid in full on application. 1 B class shares of Rs. 1000- each by state Government ,
Panchayath , Municipalities, and other body or persons approved by the Govt. 29050 C class
shares of Rs. 100-each persons residing outside the area of operation but within Malappuram
district which should be paid in full on applications .
MEMBERSHIP
Membership is open to all persons residing within the area of operation of the bank or
should be in the location of the land within the area of operation of the bank. The person who
seeks membership must have attained the age of 18 and should be of sound mind.
SHARE CAPITAL
Share capital of this bank is subscribed by the shares from the individuals and the
Government.
‘A’ class shares of Rs. 25- each by persons which should be paid in full on
application.
‘B’ class shares of Rs. 1000 –each by state Government and other body or persons
approved by the Government.
‘C’ class shares of Rs. 100- each persons residing outside the area of operation but
within the Malappuram district.
RESERVE FUND
Reserve funds are created out of net profit. It is created to meet
unforeseen losses and eventualities. So that the bank can bear the resultant shocks. It helped
in attracting deposits and creating confidence among the members, and outsiders and also
serves as a security in borrowing. reserve funds are usually invested in outside of the bank.
Withdrawal of the reserve funds are allowed only with the special permission of the Registrar
of co-operative bank.
40
An Empirical study on Capital to Risk Assets Ratio
CHAPTER- 3
THE THEORETICAL BACKGROUND OF THE STUDY
Section 5 of Banking Regulation Act, 1949 defines banking as accepting, for the
purpose of lending or investment of money from the public repayable on demand or
otherwise, and withdraw able by cheque, draft, order or otherwise.
It can be seen from above definition that major functions of the banks are accepting
deposits, lending the resources mobilized and investing to meet statutory
requirements/surplus funds. The process of lending and investment associated with several
risks like credit risk, interest rate risk, foreign exchange risk, liquidity risks, operational risk
etc.
In view of the above risks and rapid global integration of the world financial sector
mainly banking sector, supervisory authorities of group of ten countries (G 10) namely
CANADA, FRANCE, GERMANY, ITALY, JAPAN, NETHERLANDS, SWEDEN,
SWITZERLAND, USA and UK felt the requirement of a global supervision and regulation.
These countries worked for a regulatory frame work and the governors of the above G 10
countries signed the accord titled (INTERNATIONAL CONVERGENCE OF CAPITAL
MEASUREMENT AND CAPITAL STANDARDS) in july 1988 at the bank of international
settlements (BIS), Basle, Switzerland which came to known as BASLE COMMITTEE
RECOMMENDATIONS and adopted a capital adequacy frame work for internationally
active commercial banks.
Two fundamental objectives of this convergence are; -
1 The new framework should serve to strengthen the soundness and stability of
international banking.
2 Frame work should be fair and have a high degree of consistency in its applications to
banks in different countries with a view to diminishing an existing source of
competitive inequality among international banks.
The world financial system has witnessed a considerable economic reform in the last few
years and hence the BASLE committee decided to introduce a new capital adequacy
framework. The new capital framework consists of three pillars.
1. Minimum capital requirements
41
An Empirical study on Capital to Risk Assets Ratio
2. A supervisory review process
3. The effective use of market discipline
MINIMUM CAPITAL REQUIREMENT:
With an objective of securing soundly based and consistent capital ratios, the target or
standard ratio of capital to weighted risk assets was set as 8% of which the core capital
element would be 4%.
A SUPERVISORY REVIEW PROCESS:
This will seek to ensure that a banks capital position is consistent with its overall risk
profile. This pillar also stressed on the importance of banks management in developing an
internal capital assessment and setting targets for building capital.
THE EFFECTIVE USE OF MARKET DISCIPLINE:
This will encourage the role of market participants in encouraging banks to hold
adequate capital.
Based on the BASLE committee recommendation RBI has introduced capital to risk
assets ratio (CRAR) system to strengthen the capital base of banks for commercial banks in
the year 1993.
The fundamental objectives behind this principle are:
To strengthen the soundness and stability of banking system in INDIA
The framework should be fair and have high degree of consistence in application to
banks operating at different levels.
The concept of minimum capital to risk assets ratio (CRAR) has been developed to ensure
that banks can absorb a reasonable level of loss. Capital adequacy ratio determines the
capacity of the bank in terms of meeting the several risks associated with its operations and
the time liabilities.
A bank capital is the cushion for potential losses and there by application of minimum
CRAR protects the interest of depositors and promotes stability and efficiency of the
financial system.
The Urban co-operative banks can perform the same banking functions as commercial
banks and are exposed to similar risks in their operation. In view of this High power
committee on urban co-operative banks (HPC) constituted by the RBI in the year may 1999
42
An Empirical study on Capital to Risk Assets Ratio
suggested various measures to augment capital base of urban co-operative banks. Based on
the HPC recommendations, RBI has decided to implement CRAR norms to urban co-
operative banks in a phased manner with effect from 31 march 2002 over a period of three
years as under:
AS ON SCHEDULED CO-
OPERATIVE BANKS
NON-SCHEDULED
URBAN CO-OPERATIVE
BANKS
31st march 2002 8% 6%
31st march 2003 9% 7%
31st march 2004 As applicable to
commercial banks 9%
31st march 2005 As applicable to
commercial banks
As applicable to commercial
banks
DEFINITION OF CRAR:
Capital adequacy ratio is defined as the ratio of banks capital to its Risk Weighted
Assets.
Capital base (capital fund)
CRAR = _________________________________ x 100
Risk weighed Assets
CAPITAL FUNDS:
The capital funds can be segregated into two groups namely TIER 1 and TIER2
TIER 1 CAPITAL:
This is also known as core capital and provides the most permanent and readily available
support to bank against unexpected losses. This would include the following:
1. Paid up share capital collected from regular members of the bank having voting
power.
2. Statutory and other disclosed free reserves (mainly reserve fund and building fund).
3. Capital reserve representing surplus arising out of sale proceeds of assets.
43
An Empirical study on Capital to Risk Assets Ratio
4. Any surplus in profit and loss account that is after appropriation towards dividend
payable, education fund, other funds whose utilization is defined and asset loss if any.
NOTE: intangible assets brought forward and current losses deficit in NPA provisions
etc, will be deducted from tier 1 capital.
TIER 2 CAPITALS:
This would include the following:
1. Undisclosed reserves.
2. Revaluation reserves – at discount of 55%.
3. Investment fluctuation reserves.
4. Surplus provisions/loss reserves – maximum 1.25% of weighted risk assets.
5. Hybrid debt capital instruments.
6. Sub ordinate debt – limited to 50% of tier 1 capital.
NOTE: 1) at present urban co-operative banks do not issue hybrid debt capital
instruments/subordinate debt, however there is no bar on issuing such instruments subject to :
a. Provisions of respective state co-operative Act / multi state co-operative Act.
b. Prior approval from reserve bank of India for the issue instruments.
c. Tier 2 capital should not exceed tier 1 capital et any point of time.
RISK WEIGHTED ASSETS:
All assets created by the bank carry an element of risk. It is obvious that all assets whether
fund based or off-balance sheet items are weighted with a particular risk factor and compared
against the capital to determine the capital adequacy ratio.
RBI has given different percentage weight to various types of assets appearing in balance
sheet. The value of each asset item shall be multiplied by the relevant weights to arrive at
risk-adjusted values of assets and off-balance sheet items. The sum total of all risk adjusted
values of assets will be taken into account for arriving at capital to risk assets ratio (CRAR).
44
An Empirical study on Capital to Risk Assets Ratio
ParticularRisk weight
(%)
I. BALANCES
i. Cash (including foreign currency notes) Balances with RBI 0
ii. Balances in current account with UCBs 20
iii. Balances in current account with other banks 20
II. INVESTMENTS
i. Investment in Central Government Securities 2.5
ii. Investment in Other Approved Securities guaranteed by Central
Government2.5
iii. Investment in Other Approved Securities guaranteed by State
Government2.5
iv. Investment in Other Securities where payment of interest and
repayment of principal are guaranteed by Central Govt. (include
investment in Indira/Kisan Vikas Patras and investments in bonds &
debentures where payment of interest and repayment of principal is
guaranteed by Central Govt.)
2.5
v. Investment in Other Securities where payment of interest and
repayment of principal are guaranteed by State Govt. (include
investments in bonds & debentures where payment of interest and
repayment of principal is guaranteed by Central Govt.)
2.5
or
100 (if State
Govt. is in
default)
vi. Investment in Other Approved Securities where payment of interest
and repayment of principal is not guaranteed by Central / State
Govt./s
22.5
45
An Empirical study on Capital to Risk Assets Ratio
vii. Investment in Govt. guaranteed securities of government
undertakings which do not form part of the approved market
borrowing Program
22.5
viii. Claims on commercial banks, District Central Cooperative Banks 20
ix. Claims on other Urban Cooperative Banks 20
x. Investments in bonds issued by All India Public financial Institutions 22.5
xi. Investments in bonds issued by Public Financial Institutions for their
Tier-II Capital102.5
xii. All Other Investments 102.5
III. LOANS AND ADVANCES
i. Loans guaranteed by Govt of India 0
ii. Loans guaranteed by State Govt 0
iii. Loans guaranteed by State Govts. Where guarantee has been
invoked and the concerned State Govt has remained in default100
iv. Loans granted to PSUs of GOI 100
v. Housing Loans to individuals against mortgage of residential
housing property50
vi. Gold Loan upto
Rs. 1 lakh50
vii. Gold Loan above Rs. 1 lakh 125
viii. Other Loans and Advances
a) Secured
100
b) Consumer & personal loan 125
ix. Leased Assets 100
46
An Empirical study on Capital to Risk Assets Ratio
x. Advances covered by DICGC / ECGC (only for amount covered by
DICGC /ECGC not for entire amount outstanding) 50
xi. Advances for term deposits, Life policies, NSCs, IVPs and KVPs
where adequate margin is available
0
subject to
adequate
margin
xii. Loans to Staff of banks, which are fully covered by superannuation
benefits and mortgage of flat / house20
IV. MONEY AT CALL AND SHORT NOTICE 20
V. PREMISES, FURNITURE AND FIXTURE 100
VI. OTHER ASSETS
i) Interest Due on Govt. Securities 0
ii) Accrued Interest on CRR, if any 0
iii ) Accrued Interest on loans & advances 100
iV) Overdue Interest Reserve 0
V ) Accrued Interest on FD with bank 20
Vi) )All Other Assets (including branch adjustments, non-banking assets,
etc.)100
VIII. MARKET RISK ON OPEN POSITIONS -
i. Market Risk on Foreign Exchange Open Position
(For Authorized Dealers only)
100
ii. Market Risk on Gold Open Position 100
47
An Empirical study on Capital to Risk Assets Ratio
THE RISK WEIGHTS ALLOTED TO EACH OF THE ASSETS AND OFF-BALANCE
SHEET ITEMS
CHAPTER-4
DATA ANALYSIS AND INTERPRETATION
Name of the Bank: THE URBAN CO OPERATIVE BANK LIMITED.NO.1758
PERINTHALMANNA
Name of the Bank: THE URBAN CO OPERATIVE BANK LIMITED.NO.1758
PERINTHALMANNA
Statement of Capital Funds, Risk Assets / Exposures and Risk Asset Ratio
Part A - Capital Fund and Risk Assets Ratio as on; - 31/03/2013 Rs. in Lakh
48
An Empirical study on Capital to Risk Assets Ratio
I Capital Funds 31-03-2013
A Tier I Capital elements
(a) Paid-up Capital 1889.74
Less : Intangible assets and losses
Net Paid-up Capital 1889.74
(b) Reserves & Surplus
1. Statutory reserves : 474.48
2. Capital reserves (see note below) 370.98
3. Other reserves 305.73
4. Surplus in Profit & Loss Account* 325.40
Total Reserves & Surplus 1476.59
Total Capital Funds (a + b) 3366.33
Notes : Capital reserves representing surplus on sales of assets and held in a separate
account will be included
Revaluation reserves, general/floating provisions and specific provisions made for loan
losses and other asset losses or diminution in the value of any assets will not be reckoned
as capital funds.
* In case of surplus in P & L Account the following assumption may be made :
(a) The current year's surplus may be notionally arrived at to the extent
recommended by the BOD to be allocated among various reserves/funds and retained in
business.
Where the BOD have not decided the distribution of the surplus, it may be notionally
arrived at on the basis of last 3 years average.
Tier II capital elements
49
An Empirical study on Capital to Risk Assets Ratio
(i) Undisclosed reserves
(ii) Revaluation reserves
(iii) General provisions and loss reserves # 337.06
(iv) Investment Fluctuation Reserves /
Funds
30.00
(v) Hybrid debt capital instruments
(vi) Subordinated debts
Total 367.06
Total of I (A + B) 3733.39
# Includes General Provision on standard assets (subject to restrictions)
II Risk Assets
(a) Adjusted value of funded risk assets
i.e. on Balance Sheet items (to tally
with Part ‘B')
26964.58
(b) Adjusted value of non-funded and off-
Balance Sheet items (to tally with Part
‘C')
0.00
(c) Total risk-weighted assets (a+b) 26964.58
III Percentage of capital funds to risk-
weighted assets I / II x 10013.85
50
An Empirical study on Capital to Risk Assets Ratio
Part B-Risk Weight
Assets and Exposures
ASSET ITEM
(i)
Book value
(ii)
Margins
and
provisions
(iii)
Book value
(Net)
(ii)-(iii)
Risk
weight (%)
(v)
Risk
adjusted
value (vi)
As on 31.03.2013 As on
31.03.2013
As on
31.03.2013
As on
31.03.2013
As on
31.03.2013
As on
31.03.2013
I. BALANCES
iv. Cash
(including
foreign
currency notes)
Balances with
RBI
733.16 0.00 733.16 0 0.00
v. Balances in
current account
with UCBs
0.00 0.00 0.00 20 0.00
vi. Balances in
current account
with other
banks
949.87 2.74 947.13 20 189.43
II. INVESTMENTS
xiii. Investment in
Central
Government
Securities
11525.00 395.00 11130.00 2.5 278.25
51

An Empirical study on Capital to Risk Assets Ratio
xiv. Investment in
Other
Approved
Securities
guaranteed by
Central
Government
0.00 0.00 0.00 2.5 0.00
xv. Investment in
Other
Approved
Securities
guaranteed by
State
Government
0.00 0.00 0.00 2.5 0.00
52
An Empirical study on Capital to Risk Assets Ratio
xvi. Investment in
Other
Securities
where payment
of interest and
repayment of
principal are
guaranteed by
Central Govt.
(include
investment in
Indira/Kisan
Vikas Patras
and
investments in
bonds &
debentures
where payment
of interest and
repayment of
principal is
guaranteed by
Central Govt.)
0.00 0.00 0.00 2.5 0.00
53
An Empirical study on Capital to Risk Assets Ratio
xvii. Investment in
Other
Securities
where payment
of interest and
repayment of
principal are
guaranteed by
State Govt.
(include
investments in
bonds &
debentures
where payment
of interest and
repayment of
principal is
guaranteed by
Central Govt.)
0.00 0.00 0.00
2.
5
or
100 (if
State Govt.
is in
default)
0.00
xviii. Investment in
Other
Approved
Securities
where payment
of interest and
repayment of
principal is not
guaranteed by
Central / State
Govt./s
0.00 0.00 0.00 22.5 0.00
54
An Empirical study on Capital to Risk Assets Ratio
xix. Investment in
Govt.
guaranteed
securities of
government
undertakings
which do not
form part of
the approved
market
borrowing
Program
0.00 0.00 0.00 22.5 0.00
xx. Claims on
commercial
banks, District
Central
Cooperative
Banks
6958.77 0.00 6958.77 20 1391.75
xxi. Claims on
other Urban
Cooperative
Banks
0.00 0.000.00
20 0.00
xxii. Investments in
bonds issued
by All India
Public
financial
Institutions
0.00 0.00 0.00 22.5 0.00
55

An Empirical study on Capital to Risk Assets Ratio
xxiii. Investments in
bonds issued
by Public
Financial
Institutions for
their Tier-II
Capital
0.00 0.00 0.00 102.5 0.00
xxiv. All Other
Investments 3.43 0.11 3.32 102.5 3.40
56
An Empirical study on Capital to Risk Assets Ratio
III. LOANS AND
ADVANCES
xiii. Loans guaranteed
by Govt of India0
xiv. Loans guaranteed
by State Govt0
xv. Loans guaranteed
by State Govts.
Where guarantee
has been invoked
and the concerned
State Govt has
remained in
default
100
xvi. Loans granted to
PSUs of GOI100
xvii. Housing Loans to
individuals against
mortgage of
residential housing
property
485.81 0.00 485.8150
242.91
xviii. Gold Loan upto
Rs. 1 lakh7079.94 0.00 7079.94 50 3539.97
xix. Gold Loan above
Rs. 1 lakh4515.38 0.00 4515.38 125 4515.38
xx. Other Loans and
Advances
a) Secured
18440.50 2637.43 15803.07 100 15803.07
b) Consumer &
personal loan178.36 0.00 178.36 125 222.95
xxi. Leased Assets 0.00 0.00 0.00 100 0.00
57
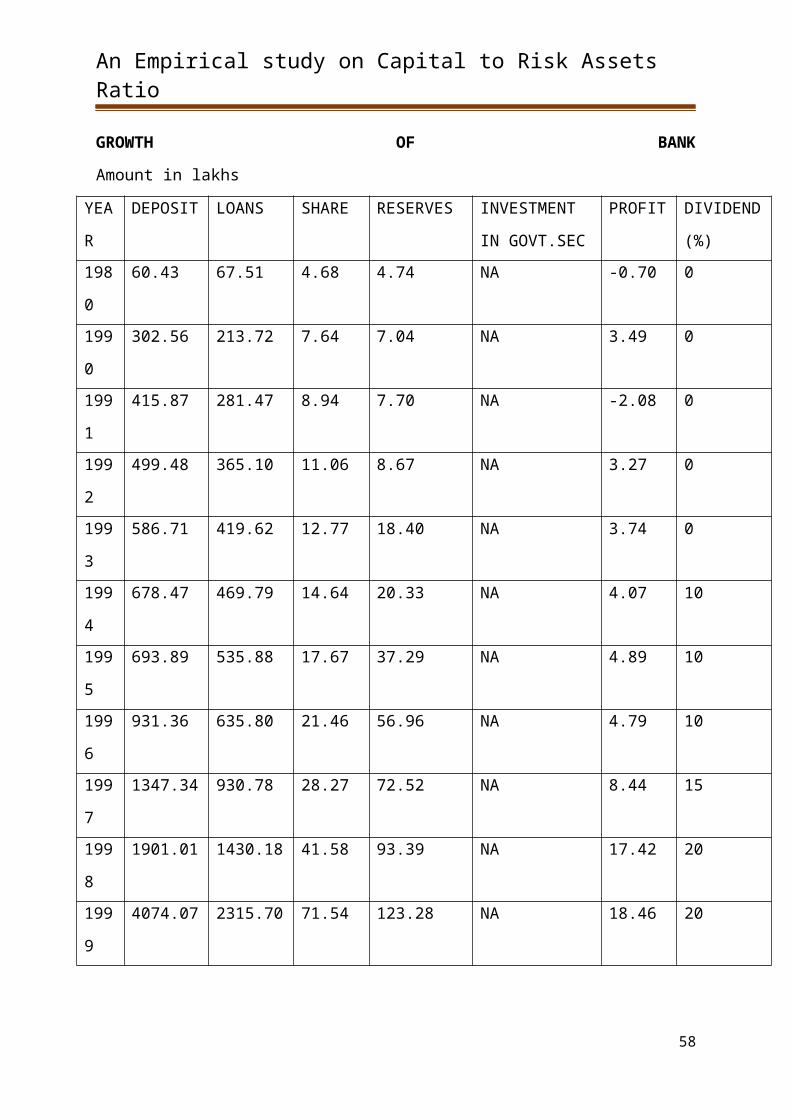
An Empirical study on Capital to Risk Assets Ratio
xxii. Advances covered
by DICGC /
ECGC (only for
amount covered
by DICGC /ECGC
not for entire
amount
outstanding)
0.00 0.00 0.00 50 0.00
xxiii. Advances for term
deposits, Life
policies, NSCs,
IVPs and KVPs
where adequate
margin is
available
837.20 0.00 837.20
0
subject to
adequate
margin
0.00
xxiv. Loans to Staff of
banks, which are
fully covered by
superannuation
benefits and
mortgage of flat /
house
170.49 0.00 170.49 20 34.10
IV. MONEY AT CALL
AND SHORT
NOTICE
0.00 0.00 0.00 20 0.00
V. PREMISES,
FURNITURE AND
FIXTURE
179.80 0.00 179.80 100 179.80
VI. OTHER ASSETS
i) Interest Due on Govt.
Securities228.98 0.00 228.98 0 0.00
ii)Accrued Interest on
CRR, if any0.00 0.00 0.00 0 0.00
58
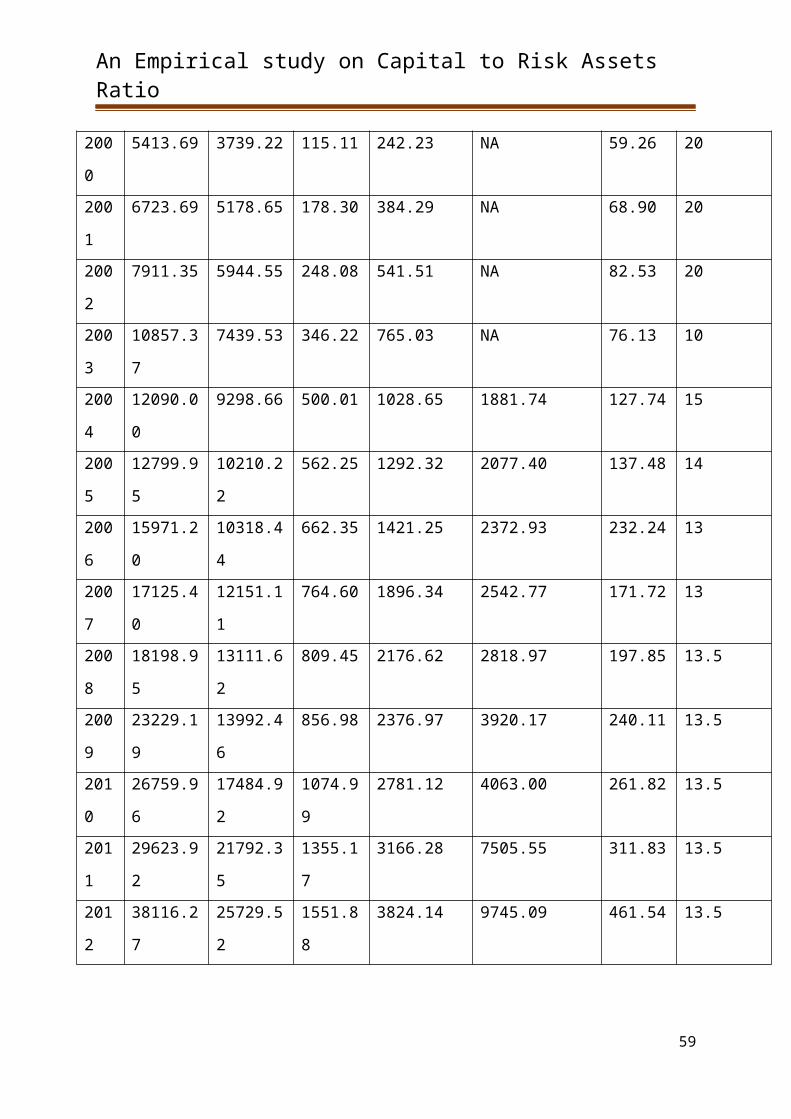
An Empirical study on Capital to Risk Assets Ratio
iii)All Other Assets
(including branch
adjustments, non-
banking assets, etc.)
219.65 6.94 212.71 100 212.71
iV ) Accrued Interest on
loans & advances336.26 0.00 336.26 100 336.26
V ) Overdue Interest
Reserve304.41 304.41 0.00 0 0.00
Vi) Accrued Interest on
FD with bank73.02 0.00 73.02 20 14.60
VIII. MARKET RISK
ON OPEN POSITIONS-
iii. Market Risk on
Foreign Exchange
Open Position
(For Authorized
Dealers only)
100
iv. Market Risk on
Gold Open
Position
100
IX. TOTAL 53220.03 3346.63 49873.40 26964.58
* Provision if any made for depreciation in investments in Government and other
approved securities may be indicated by way of a
Footnote.
** Provisions held either general or specific, for bad and doubtful debts and standard assets
may be indicated by way of footnote.
Part C -Weighed Non-funded Exposures / Off-Balance Sheet Items
59

An Empirical study on Capital to Risk Assets Ratio
Each off-Balance Sheet item may be submitted in the format indicated below:
Rs. In Lakh
Position as 31.03.2013
Nature of Item Book
Value
Conversion
Factor
Equivalent
Value
Risk
Weight
Adjusted
Value
Bank Guarantee
(Financial) 4.26
Note: Netting may be done only for advances collateralized by cash margins or deposits and
in respect of assets where provisions for depreciation or for bad and doubtful debts.
GRAPHS AND CHARTS
60
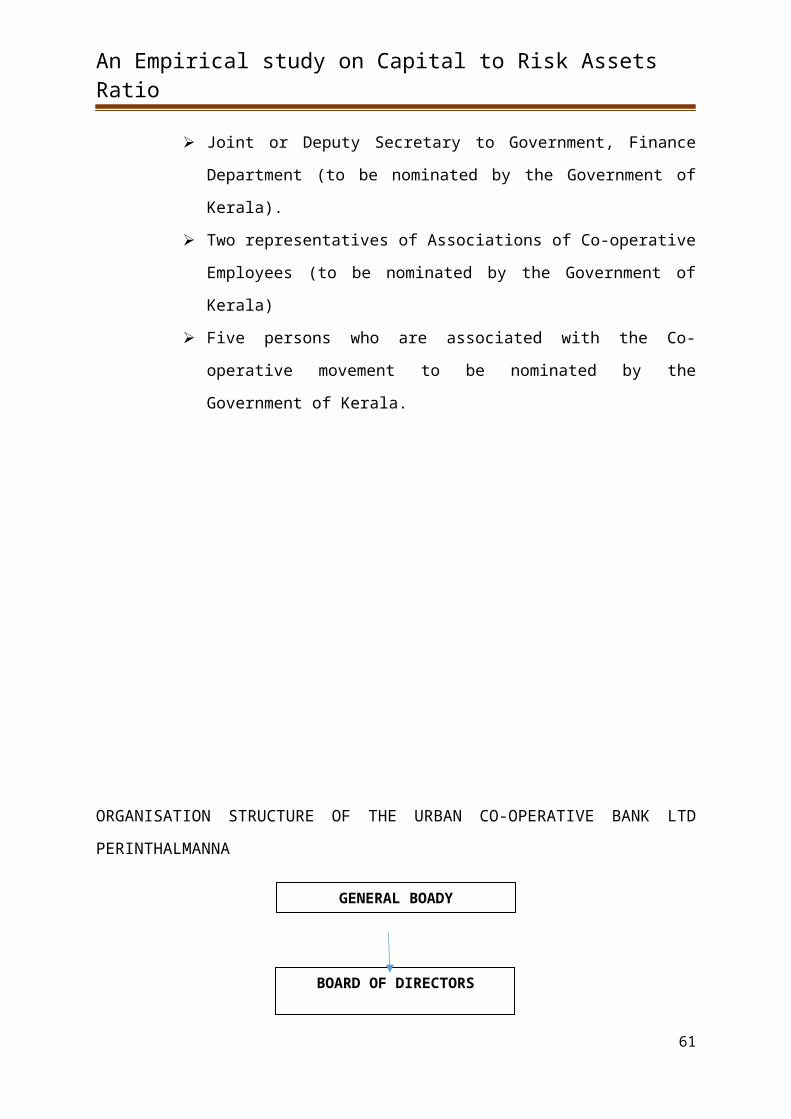
An Empirical study on Capital to Risk Assets Ratio
1. CAPITAL FUNDS
INTERPRETATION:
From the above graph we can clearly make out the bank’s capital funds are increasing year by
year it is high in 2013 when compared to 2011 and 2012 by 87.32% and 82 % respectively
ANALYSIS
There is a linear increase in capital funds, since the bank was borrowing money from the out
siders also there is an increased retained earnings. At the same time the bank is rising the
capital fund from the market. The surplus on sale of assets transferred to separate account
that is capital reserve account, it is included in capital fund account. General provisions and
specific provisions made for loan losses and other assets losses will not be reckoned as
capital fund.
2. RESERVES AND SURPLUS
61
2011 2012 20130
200
400
600
800
1000
1200
1400
1600
1800
2000
1355.17
1551.88
1889.74
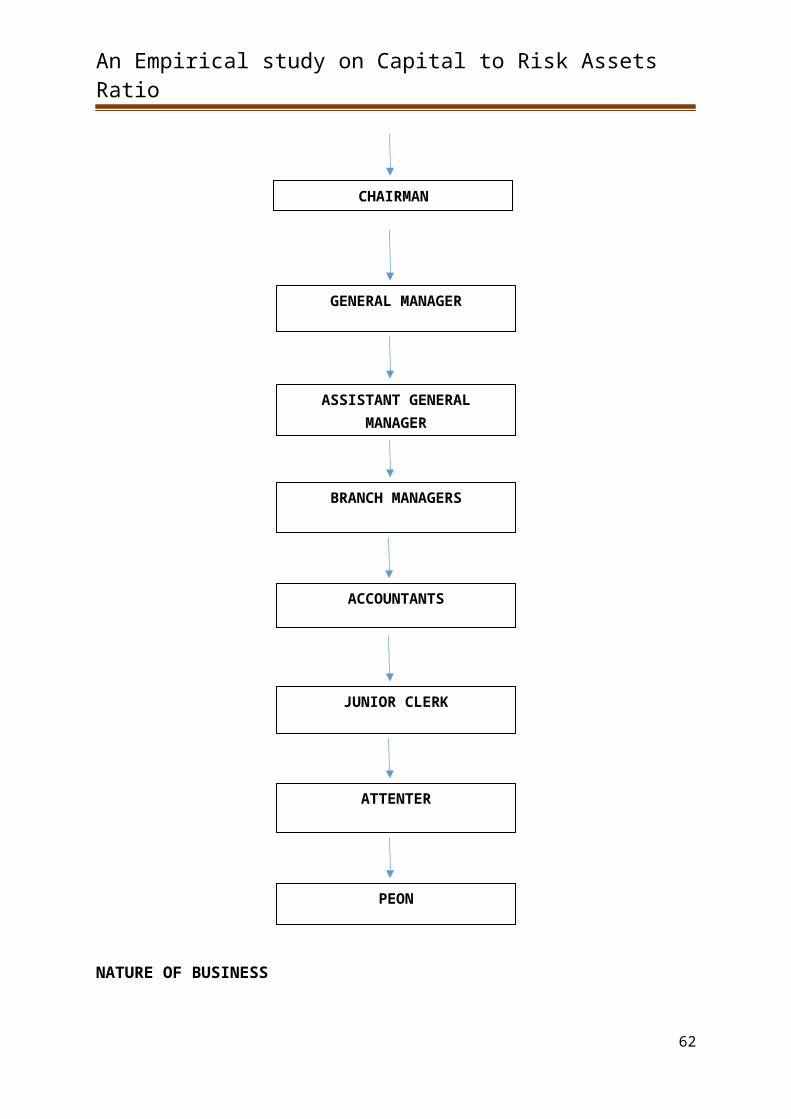
An Empirical study on Capital to Risk Assets Ratio
INTERPRETATION:
As from the above graph we can make out that bank reserves and surpluses are increasing at a
steady rate. It was high in the year 2013 which means bank’s performance is getting better
year by year.
ANALYSIS:
Increase in reserves and surpluses indicates that the net profit is increasing and the major part
of the net profit was transferred to reserve and surpluses’ account. There is scope to payment
of current liabilities.
3. TIER II CAPITAL ELEMENTS
62
2011 2012 20130
200
400
600
800
1000
1200
1400
1600
970.25
1193.45
1476.59
An Empirical study on Capital to Risk Assets Ratio
2011 2012 20130
50
100
150
200
250
300
350
400
241.35
314.47
367.06
INTERPRETATION:
The above graph indicates an increasing capital which is a witness of a decent business
growth. The capital funds (Tier-II) for the year 2013 is the highest when compared the last
two years indicating rising funds from the market.
ANALYSIS:
There is no much changes investment funds and other revaluation reserves. But bank
proactively took some measures for revaluation of any assets by increasing the general
provisions and loss reserves. Here the bank has increased General provisions and loss
reserves when compared to the previous year’s reserves making a provision for revaluation
reserves and hybrid debt capital Instruments.
4. RISK ASSETS
63
An Empirical study on Capital to Risk Assets Ratio
INTERPRETATION
From the graph the bank’s assets are increasing year by year, hence risk associated with the
assets are also increasing.
ANALYSIS:
Risk assets that is cash, loans and advances and other assets. Here there is no change in cash
balances and bank balances and rest of the assets have been increased. Increasing in risk
assets is due to increase in cash balances, various investments in central and state government
securities, claims on district central cooperative banks and other investments.
5. PERCENTAGE OF CAPITAL FUNDS TO RISK WEIGHTED ASSETS
64
2011 2012 20130
5000
10000
15000
20000
25000
30000
20523.02
22757.30
26964.58
An Empirical study on Capital to Risk Assets Ratio
2011 2012 201311.5
12
12.5
13
13.5
14
12.51
13.45
13.85
INTERPRETATION:
The percentage of capital fund to risk assets are increasing year after year and it was highest
in the year 2013 against the RBI benchmark of 9% which is remarkable.
ANALYSIS:
Here capital adequacy ratio indicates capacity of the bank in terms of meeting the several
risks associated with its operations and the time liabilities. The CRAR of the bank is getting
better year after year which ensure that bank can absorb a reasonable level of loss.
6. CASH BALNCES
65
An Empirical study on Capital to Risk Assets Ratio
INTERPRETATION
As assets in various forms of deposits of bank are increasing, bank has also to maintain cash
balances to meet demands of customers
ANALYSIS
Cash is liquid and important asset for running of the banking services. It is gradually
increased year by year.
7. INVESTMENT
66
An Empirical study on Capital to Risk Assets Ratio
2011 2012 20130
200
400
600
800
1000
1200
1400
1600
1800
2000
1185.4
1856.23
1673.4
INTERPRETATION
From the above graph we can clearly see that investments are fluctuating year after year,
mainly during 2013 investments have decreased due to lack of investment opportunities to
bank mainly due to recession problem.
ANALYSIS
Financial statements reveals that bank exhibits its interest for investment as a result raised
investments in 2011 and for market fluctuation it was down in 2012 and again raised its
investment in 2013.
8. LOANS AND ADVANCES
67
An Empirical study on Capital to Risk Assets Ratio
INTERPRETATION:
As we can see that loans and advances are increasing year by year, this is mainly attributed to
the mortgage activity of bank, this is one of the powerful tools of co-operative banks to
mortgage the assets and have claim on them.
Bank is increasing housing loans year after year, as there is boom in infrastructure.
ANALYSIS:
Bank started to increase providing housing loans to individuals against the mortgagee of
residential housing property, Gold loans other loans and advances
9. PREMISES, FURNITURE AND FIXTURE
68
2011 2012 20130
5000
10000
15000
20000
25000
30000
18813.420209.29
24358.38
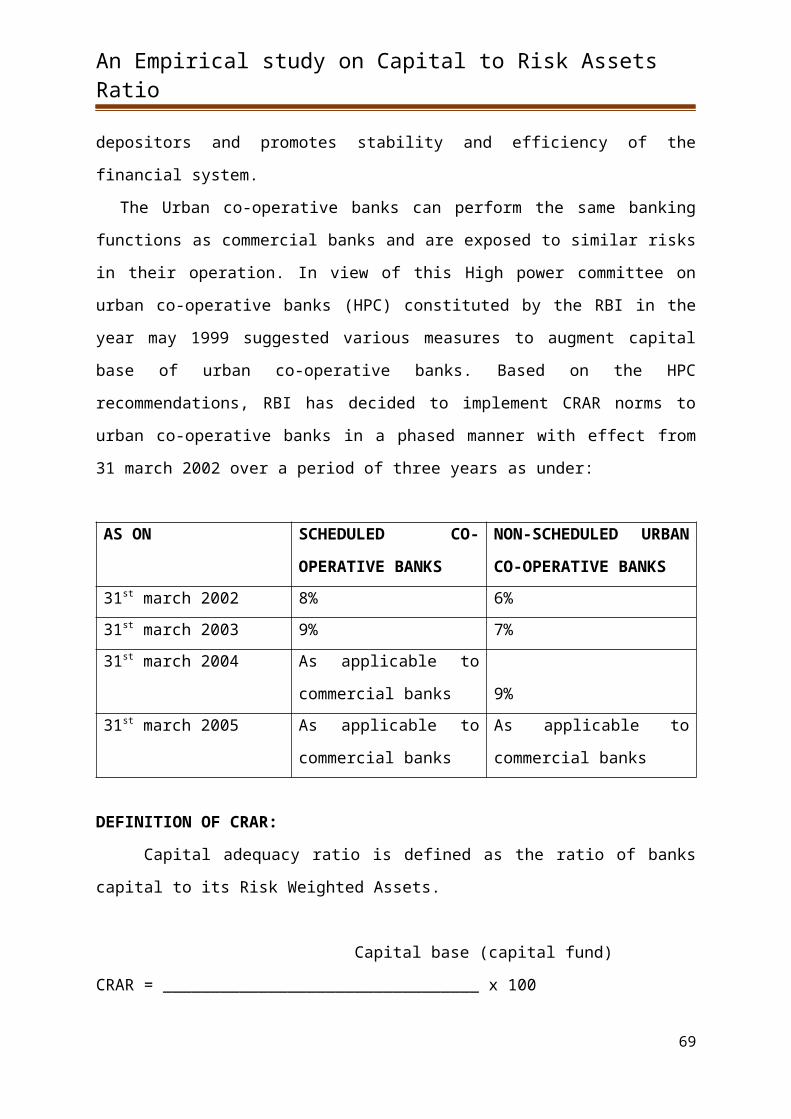
An Empirical study on Capital to Risk Assets Ratio
2011 2012 20130
20
40
60
80
100
120
140
160
180
200
114.79
138.23
179.8
INTERPRETATION
As banks assets are increasing year by year, here the premises, furniture and fixtures are very
high in 2013, compared to 2011and 2012.
ANALYSIS.
As banks assets are increasing year after year, thus the need arises for extra infrastructural facilities.
Bank has constructed few of its own buildings in recent years.
10. TOTAL PERFORMANCE OF BANK
69
An Empirical study on Capital to Risk Assets Ratio
201129%
201232%
201338%
INTERPRETATION
When we look at above performance of bank we can say that bank is satisfactorily
growing at an good rate, keeping in view that the bank has reputation of being well
performing urban co-operative bank and is also introducing modern banking facilities like
ATM and online banking, which is not provided by many co-operative banks. We can hardly
find very few banks giving these modern banking facilities in this sector.
ANALYSIS
Above graph depicted very clearly how risk adjusted value raising year by year. The bank
has given standard risk weight for banking assets in the year 2011, 2012 and 2013. Banking
risk adjusted assets gradually increased year by year 2011
CHAPTER-5
70
An Empirical study on Capital to Risk Assets Ratio
FINDINGS, SUGGESATION AND CONCLUSION
SUMMARY OF FINDINGS
1. The UCB’s capital funds are increasing year by year and there is a linear increase in
capital funds, since the bank is borrowing money from the out siders also there is an
increased retained earnings. At the same time the bank is rising the capital fund from
the market.
2. The Reserves and surplus are increasing at good rate, which means banks
performance is getting better year after year. Increase in reserves and surpluses
indicates that the net profit is increasing and the major part of the net profit is
transferred to surpluses’ account .It is also indicating the decrease in the current
liabilities when compared to previous year’s.
3. Here the UCB’s has increased General provisions and loss reserves when compared to
the previous year’s reserves making a provision for revaluation reserves and hybrid
debt capital Instruments.
4. Here capital adequacy ratio indicates capacity of the bank in terms of meeting the
several risks associated with its operations and the time liabilities. The CRAR of the
bank is getting better year after year which ensure that bank can absorb a reasonable
level of loss.
5. Increasing in risk assets is due to increase in cash balances, various investments in
central and state government securities, claims on district central cooperative banks
and other investments.
6. Risk assets that is cash, loans and advances and other assets. Here there is no change
in cash balances and bank balances and rest of the assets have been increased.
Increasing in risk assets is due to increase in cash balances, various investments in
central and state government securities, claims on district central cooperative banks
and other investments
71
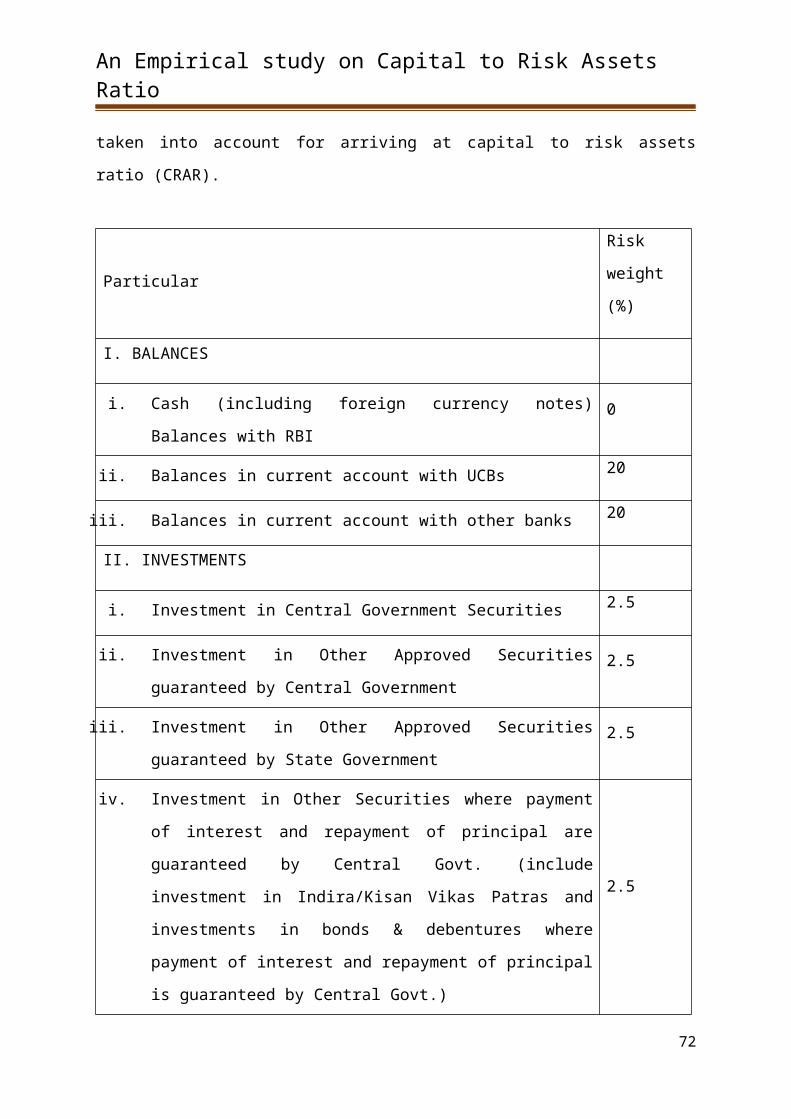
An Empirical study on Capital to Risk Assets Ratio
7. Cash is liquid and important asset for running of the banking services. It is gradually
increased year by year.
8. Financial statements reveals that bank exhibits its interest for investment as a result
raised investments in 2011 and for market fluctuation it was down in 2012 and again
raised its investment in 2013.
9. Bank started to increase providing housing loans to individuals against the mortgagee
of residential housing property, Gold loans other loans and advances.
SUGGESTIONS
72
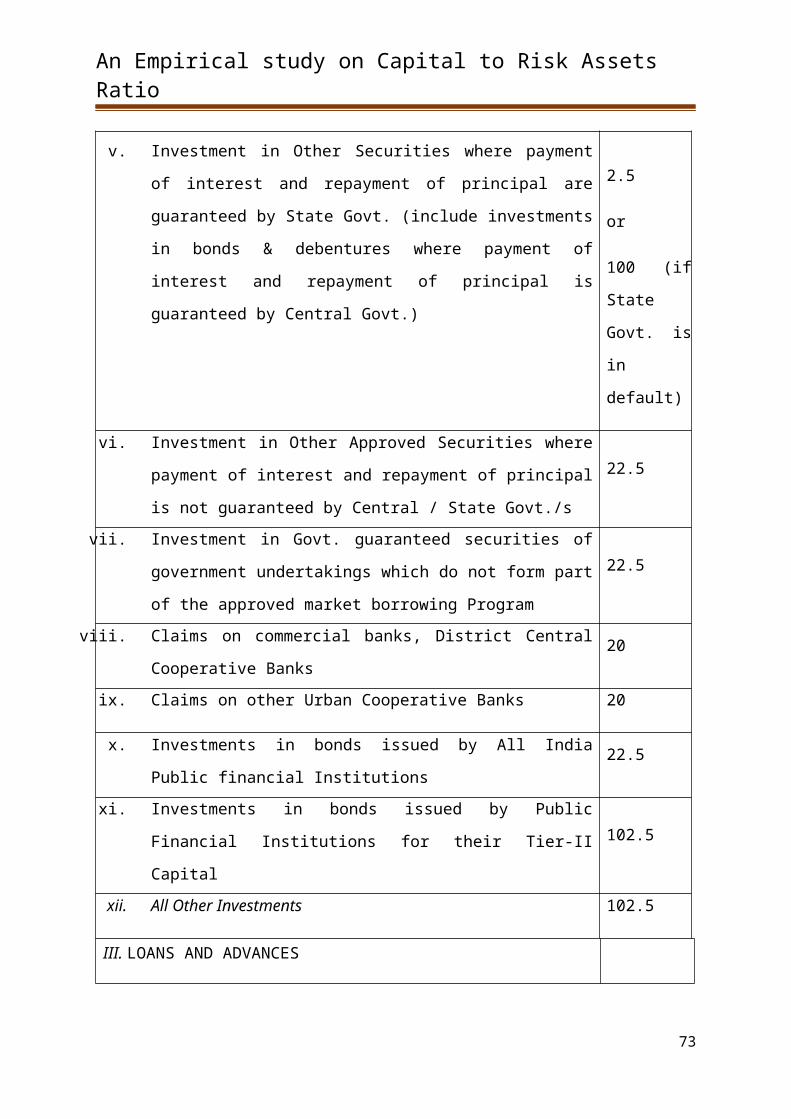
An Empirical study on Capital to Risk Assets Ratio
CAPITAL TO RISK ASSET RATIO (CRAR) is one of the most widely used analytical
measures of bank capital adequacy and a tool for controlling bank risk. Since risk assets are
always less than total assets, the capital/risk asset ratio is naturally higher than the
capital/total asset ratio for any given computational period. The Co-operatives must be
developed because there is no other suitable agency to bring about socio-economic development in
the country.
1. Enhance its profitability by reducing cost of operating by means of computerization
2. Bank can enhance its performance and compete with well-known commercial banks
3. Bank can step into new area of investments
4. Bank can enhance its business by providing modern banking facilities like ATM,
ONLINE BANKING, etc.
5. Bank can put few more conscious steps to get into active money market which is at
present very negligible.
6. As co-operative banks main strength is mortgage loan, they should still enhance their
capacity to concentrate on more mortgage loan to enhance its profitability.
7. Bank can provide more advances against term deposits because it is riskless and
return on these advances are also reasonable.
8. Consumer credit can be enhanced because of today’s increased standard of living and
returns are also satisfactory
9. Rural Penetration is an important strength. Private sector and multinational
companies do not have the accessibility to the extent the co-operatives have. The
Co-operative credit institutions and dairy co-operatives have more accessibility in
rural areas.
73
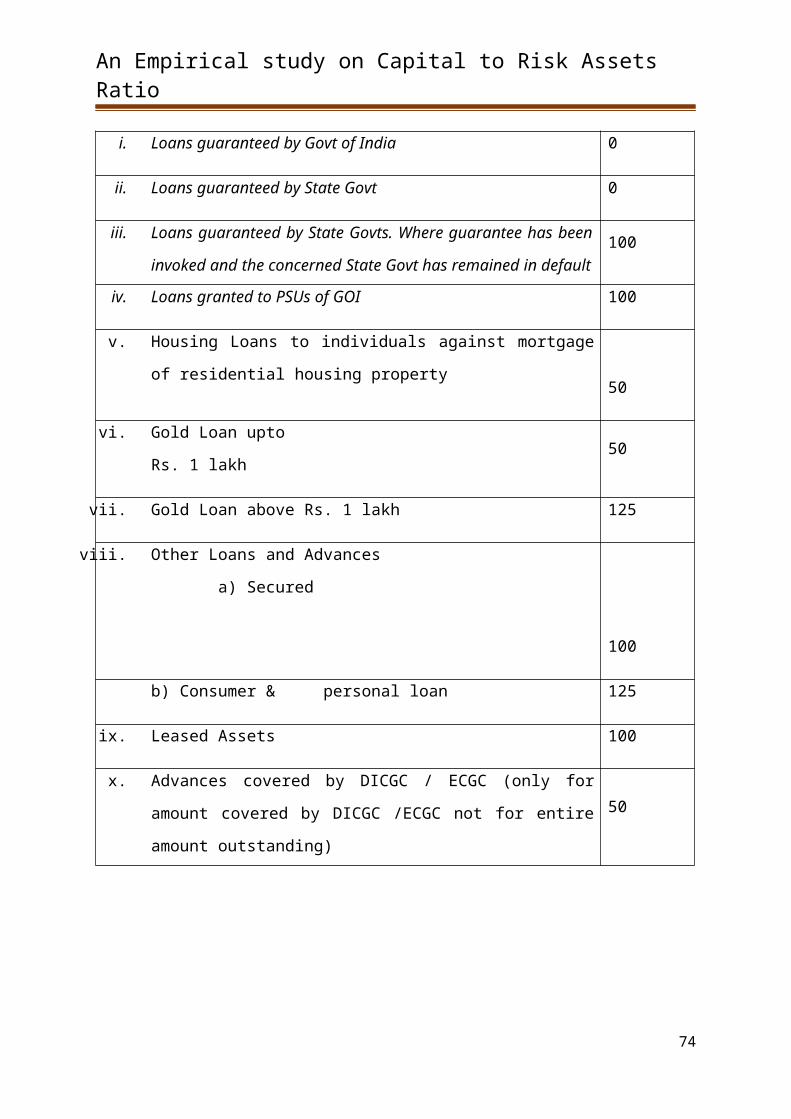
An Empirical study on Capital to Risk Assets Ratio
10. Cooperatives also suffer from the absence of professionalism. Knowledge and skills
are required to manage new challenges due to changes in the market economy.
11. The cooperatives can diversify their activities, their products and the services.
74
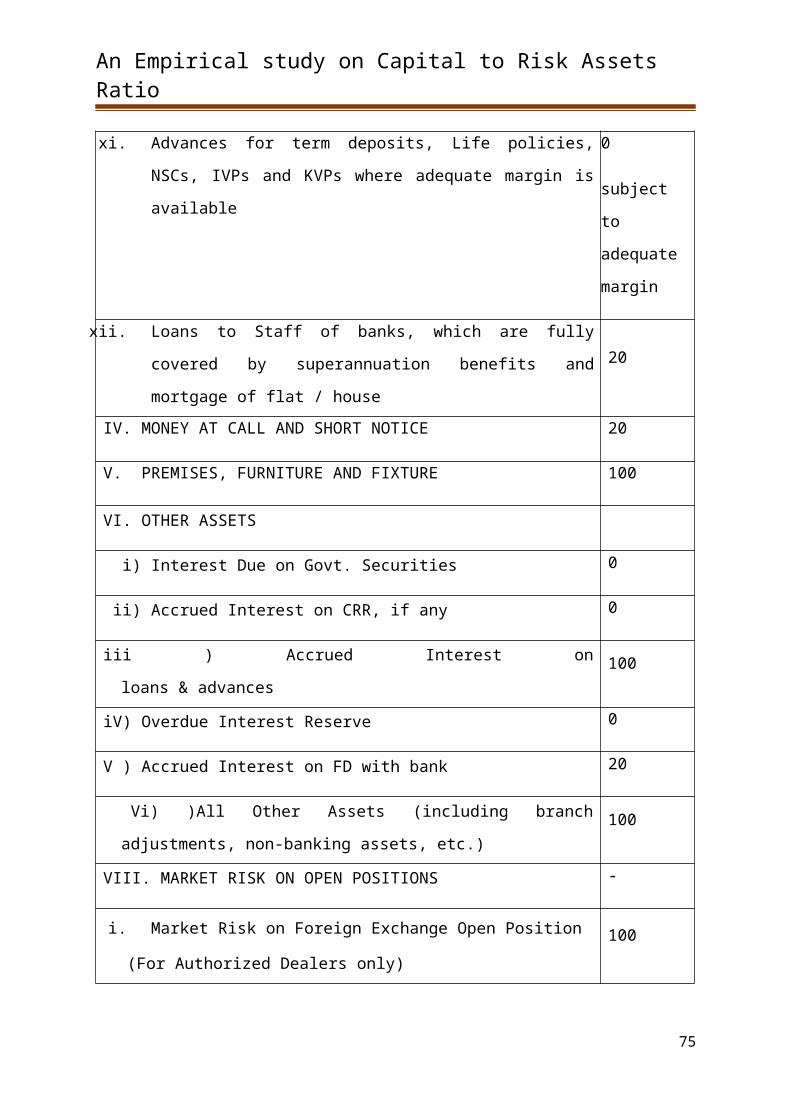
An Empirical study on Capital to Risk Assets Ratio
CONCLUSION
Cooperative movement is playing a significant role in the economy of our country by
giving great strength to the economic progress. The Governments, both central and states,
shall continue to help the cooperatives The Co-operatives must be developed because there is
no other suitable agency to bring about socio-economic development in the country.
Cooperatives also suffer from the absence of professionalism. Knowledge and skills are
required to manage new challenges due to changes in the market economy. The quality of
human resource is important for the success of cooperatives in the competitive
world. Further, the cooperatives do not follow scientific method of selection and they do not
pay remunerative salaries.
75
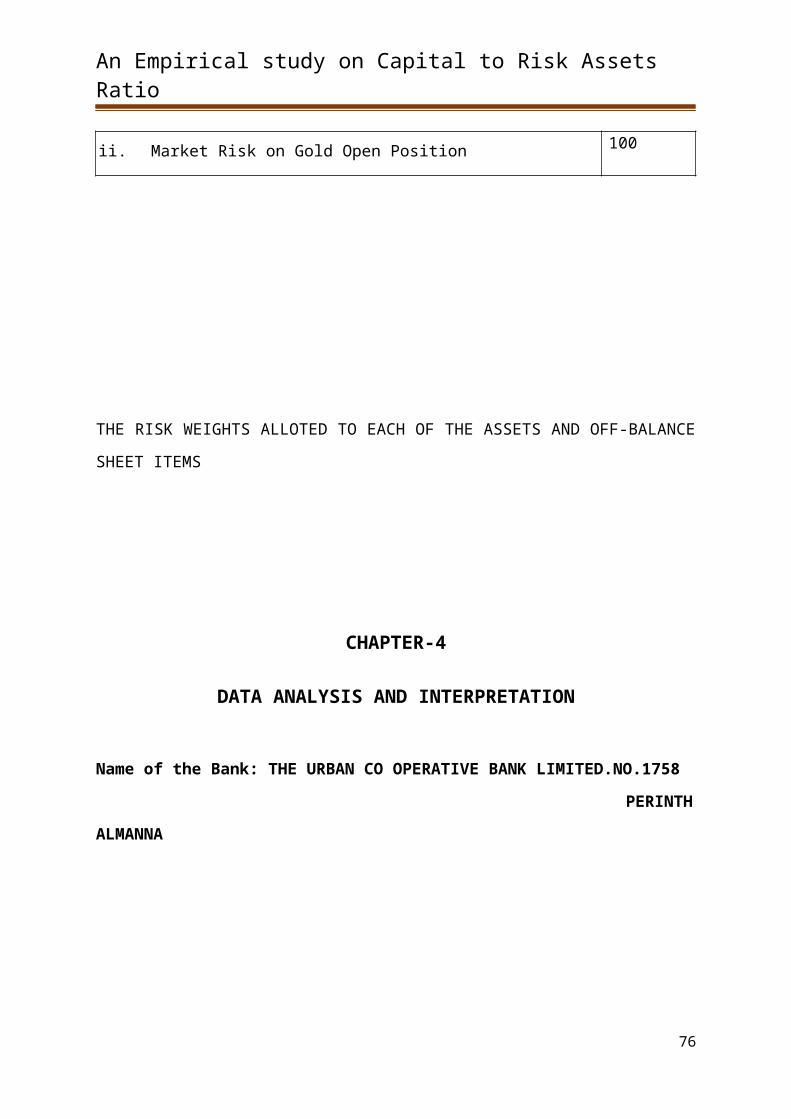
An Empirical study on Capital to Risk Assets Ratio
BIBLIOGRAPHY
1. Alfriend, M, “International Risk-based Capital Standards; History and
Explanation”, Federal Reserve Bank of Richmond Economic Review,
December 1988, pp.28-34.
2. Gupta and Meera Mehta, “Indian banks and Basel - II: An Econometric
Analysis”, Indian Journal of Finance, June 2011, pp.11-19
3. Hall, M, “Basel II: Panacea or a Missed Opportunity?” 2004
4. Jackson, P, “Capital Requirements and Bank Behaviour: The Impact of the
Basle Accord”, Basle Committee on Banking Supervision Working Papers,
Bank for International Settlements Basle, Switzerland, 1999.
5. Jehan.T.R. et al, “Indian Business Environment” V.K. Enterprises, New
Delhi, 2010.
1
2011 2012 20130
20
40
60
80
100
120
140
160
180
200
117.17
136.42
189.43
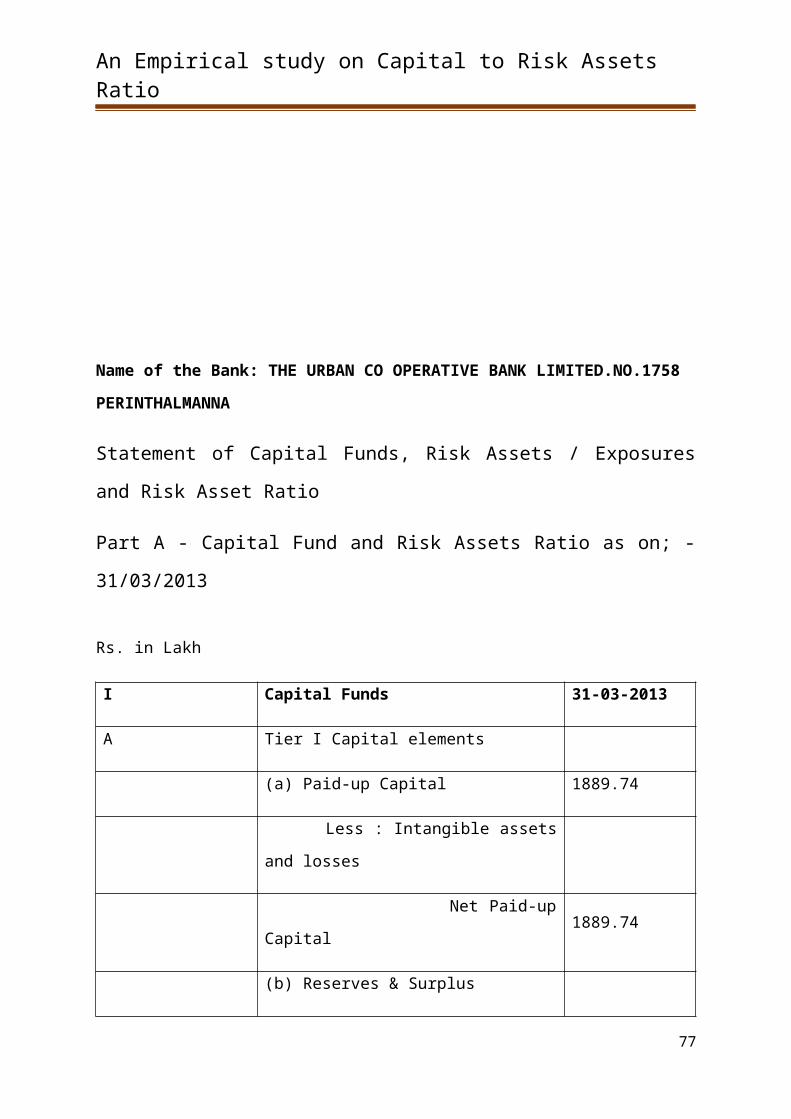
An Empirical study on Capital to Risk Assets Ratio
6. Kasturi Nageshwara Rao, “The New Basel Accord”, ICFAI University
Press, Hyderabad, 2005.
7. Kotreshwar.G, “Risk Management-insurance and derivatives”, Himalaya
Publishing House, Mumbai, First Edition, 2005.
8. Leeladhar, V, “Indian Financial Sector reform”, Annual Washington
conference of the Institute of International Bankers, 2007
9. Malgorzata Bialas & Adrian Solek, “Evolution of capital adequacy ratio”,
Vol. 3, Journal of Scientific Paper, Economics & Sociology, October 2010,
10. Mishra RN, “Basel II: Pillar 2 - The Supervisory Review process”
Professional Banker, 2004.
COMPANY’S REPORTS
BANKS ANNUAL REPORT FOR YEAR 2013-2014, 97th YEARS REPORT
BANKS ANNUAL REPORT FOR YEAR 2012-2013, 96th YEARS REPORT
BANKSANNUAL REPORT FOR YEAR 2011-2012, 95th YEARS REPORT.
WEBSITES
1) http://www.rbi.org.in, (different dates)
2) http://www.bis.org, 24 August 2011.
3) http://www.banksofindia.com, 12 November 2011
4) http://www.iupindia.org, 3 August 2011
5) http://www.economictimes.com, 8 January 2012
6) http://www.thehindubuisnessline.com, 9 January 2011
7) http://www.answers.com/topic/credit-risk, 6 November 2011
8) http://www.booksrags.com/standard_approach, 21 November 2011
9) http://www.economics-sociology.eu, 10 January 2012
10) http://Websites of selected banks, (different dates)
2
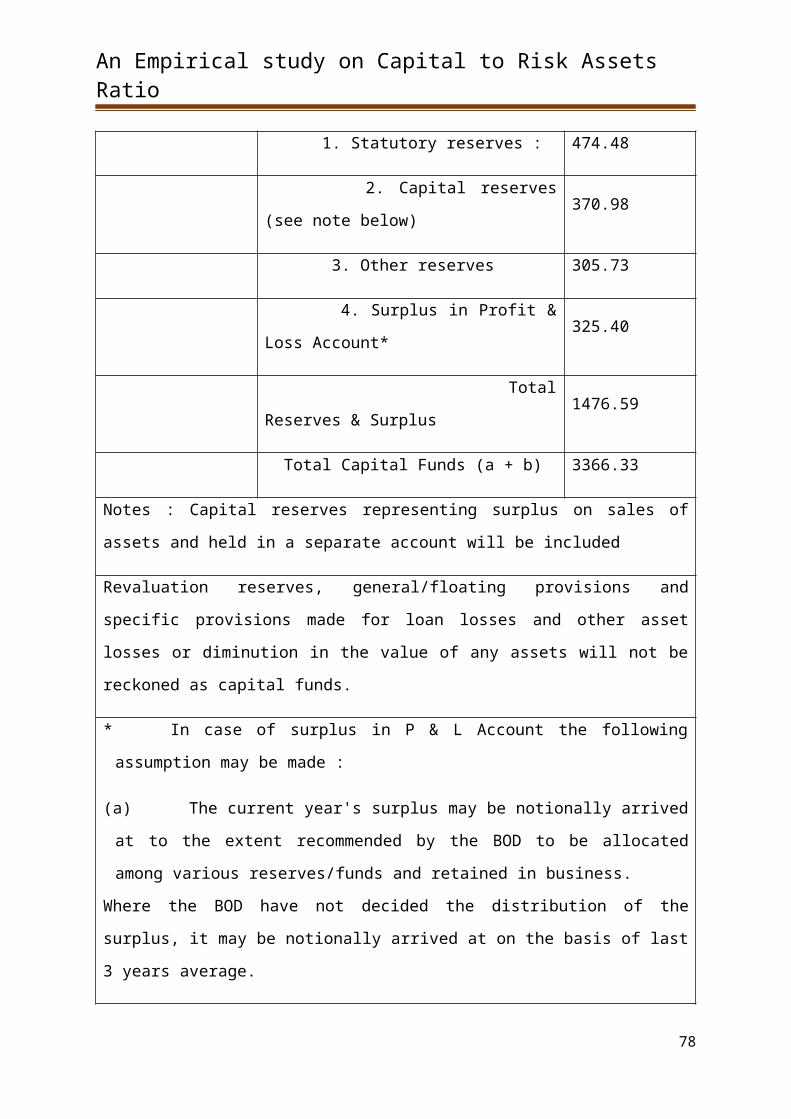
An Empirical study on Capital to Risk Assets Ratio
ANNEXURE
Statement of Capital Funds, Risk Assets / Exposures and Risk Asset Ratio
Part A - Capital Fund and Risk Assets Ratio as on; -1 31/03/2011 Rs. in Lakh
I Capital Funds 31-03-2011
A Tier I Capital elements
(a) Paid-up Capital 1355.17
Less : Intangible assets and losses
Net Paid-up Capital 1355.17
(b) Reserves & Surplus
1. Statutory reserves : 353.78
2. Capital reserves (see note below) 256.61
3
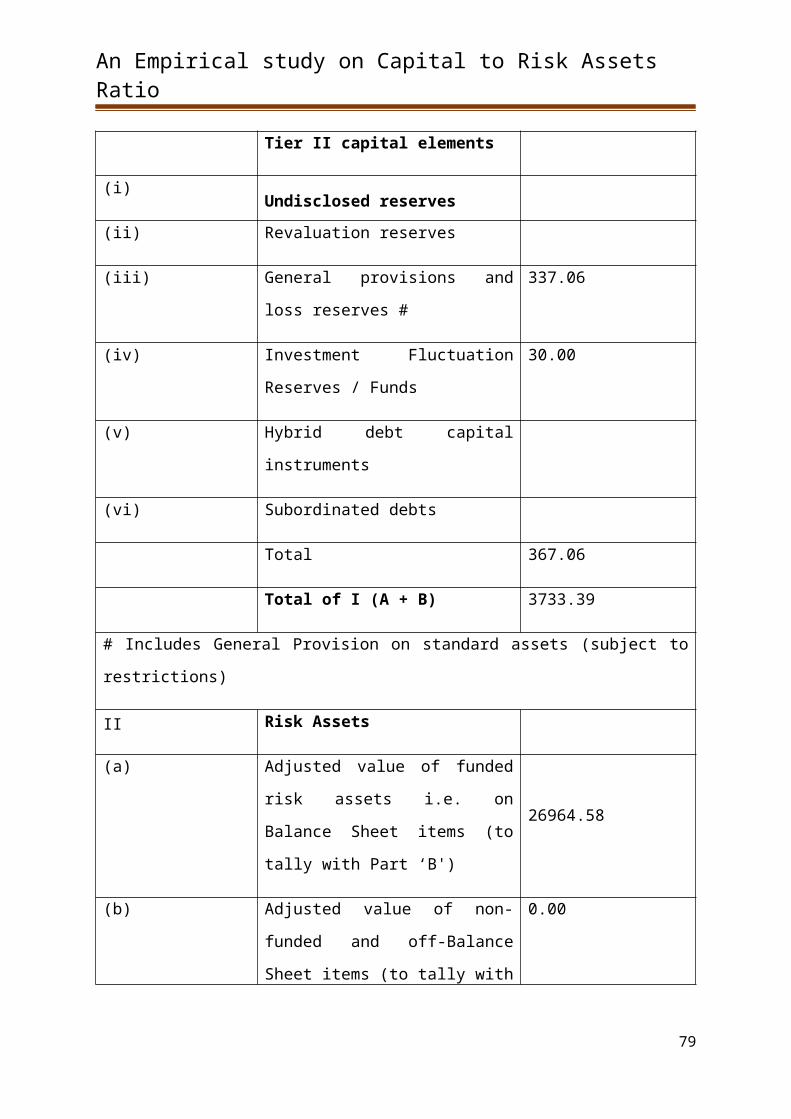
An Empirical study on Capital to Risk Assets Ratio
3. Other reserves 217.79
4. Surplus in Profit & Loss Account* 142.07
Total Reserves & Surplus 970.25
Total Capital Funds (a + b) 2325.42
Notes : Capital reserves representing surplus on sales of assets and held in a separate
account will be included
Revaluation reserves, general/floating provisions and specific provisions made for loan
losses and other asset losses or diminution in the value of any assets will not be reckoned
as capital funds.
* In case of surplus in P & L Account the following assumption may be made :
(b) The current year's surplus may be notionally arrived at to the extent
recommended by the BOD to be allocated among various reserves/funds and retained in
business.
Where the BOD have not decided the distribution of the surplus, it may be notionally
arrived at on the basis of last 3 years average.
B Tier II capital elements
(i) Undisclosed reserves
(ii) Revaluation reserves
(iii) General provisions and loss reserves
#
211.35
(iv) Investment Fluctuation Reserves /
Funds
30,00
(v) Hybrid debt capital instruments
(vi) Subordinated debts
4
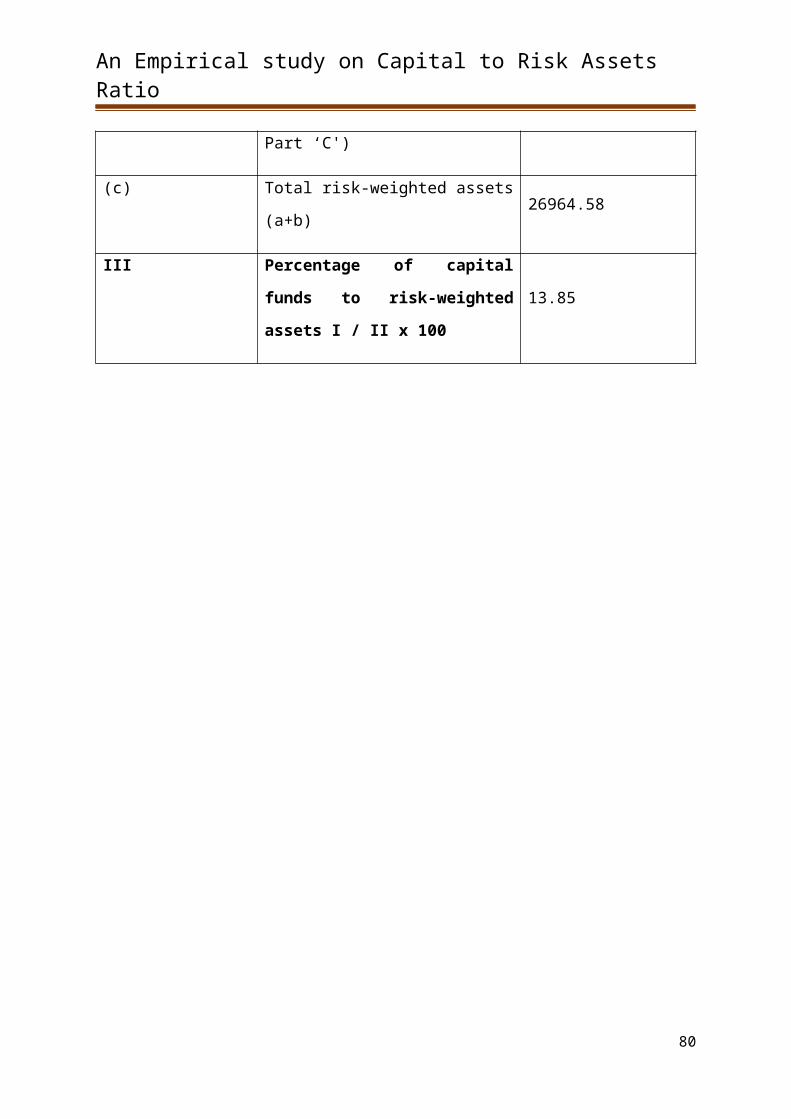
An Empirical study on Capital to Risk Assets Ratio
Total 241.35
Total of I (A + B) 2566.77
# Includes General Provision on standard assets (subject to restrictions)
II Risk Assets
(a) Adjusted value of funded risk assets
i.e. on Balance Sheet items (to tally
with Part ‘B')
20523.02
(b) Adjusted value of non-funded and
off-Balance Sheet items (to tally with
Part ‘C')
(c) Total risk-weighted assets (a+b) 20523.02
III Percentage of capital funds to risk-
weighted assets I / II x 10012.51
5
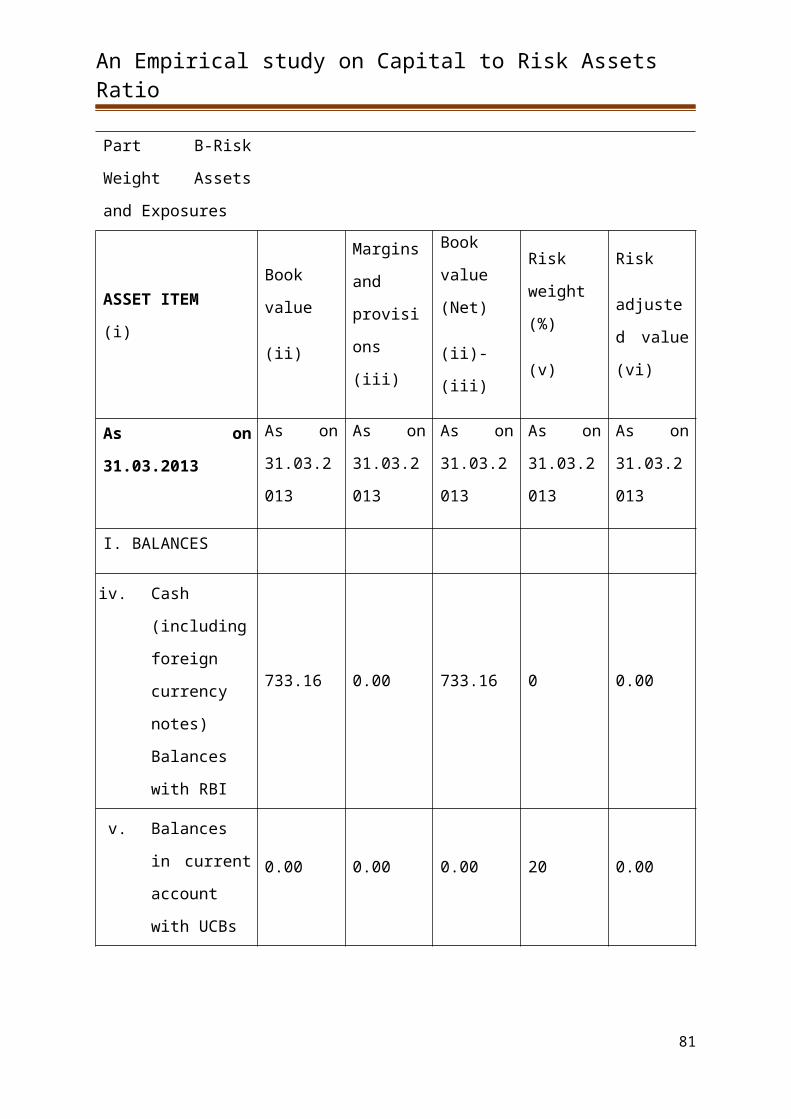
An Empirical study on Capital to Risk Assets Ratio
Part B-Risk Weight
Assets and Exposures
ASSET ITEM
(i)
Book
value
(ii)
Margins
and
provisions
(iii)
Book
value
(Net)
(ii)-(iii)
Risk
weight (%)
(v)
Risk
adjusted
value (vi)
As on 31.03.2011 As on
31.03.2011
As on
31.03.2011
As on
31.03.2011
As on
31.03.2011
As on
31.03.2011
I. BALANCES
vii. Cash (including
foreign currency
notes) Balances
with RBI
504.52 0.00 504.52 0 0.00
viii. Balances in
current account
with UCBs
0.00 0.00 0.00 20 0.00
ix. Balances in
current account
with other banks
588.68 2.82 585.86 20 117.17
II. INVESTMENTS
xxv. Investment in
Central
Government
Securities
7105.56 199.89 6905.67 2.5 172.64
6
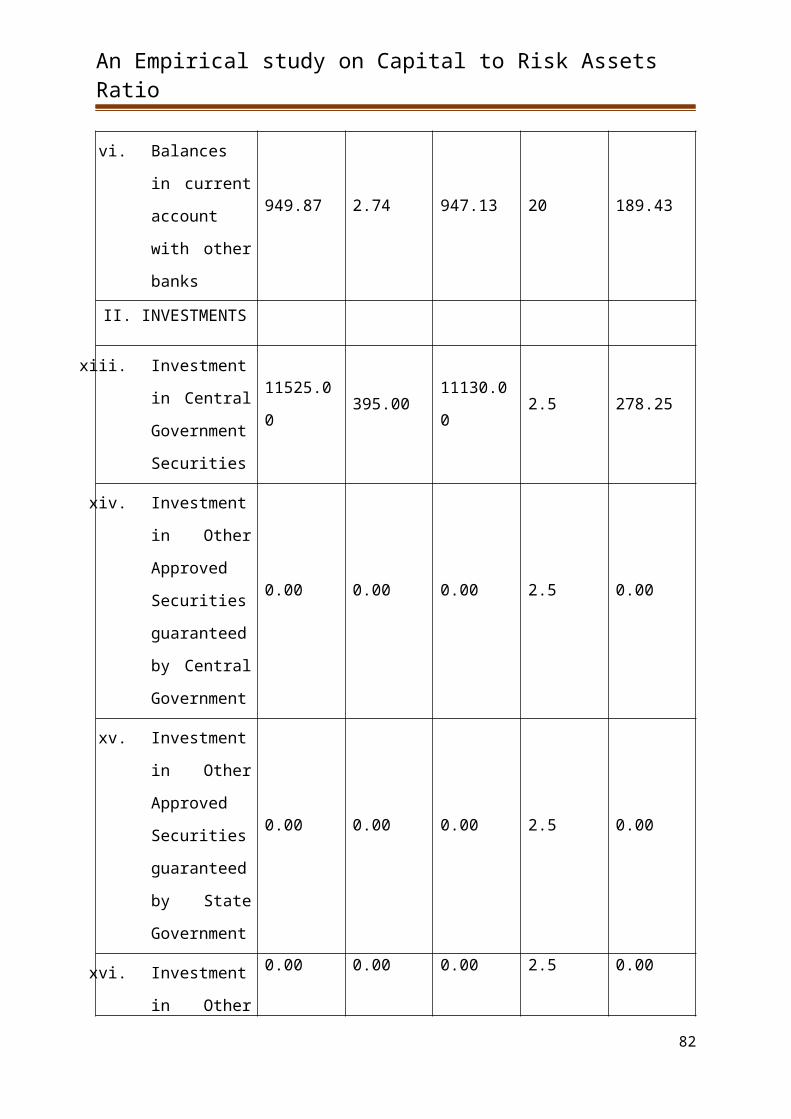
An Empirical study on Capital to Risk Assets Ratio
xxvi. Investment in
Other Approved
Securities
guaranteed by
Central
Government
0.00 0.00 0.00 2.5 0.00
xxvii. Investment in
Other Approved
Securities
guaranteed by
State
Government
400.00 0.00 400.00 2.5 10.00
7
An Empirical study on Capital to Risk Assets Ratio
xxviii. Investment in
Other Securities
where payment
of interest and
repayment of
principal are
guaranteed by
Central Govt.
(include
investment in
Indira/Kisan
Vikas Patras and
investments in
bonds &
debentures
where payment
of interest and
repayment of
principal is
guaranteed by
Central Govt.)
0.00 0.00 0.00 2.5 0.00
8

An Empirical study on Capital to Risk Assets Ratio
xxix. Investment in
Other Securities
where payment
of interest and
repayment of
principal are
guaranteed by
State Govt.
(include
investments in
bonds &
debentures
where payment
of interest and
repayment of
principal is
guaranteed by
Central Govt.)
0.00 0.00 0.00
2.
5
or
100 (if
State Govt.
is in
default)
0.00
xxx. Investment in
Other Approved
Securities where
payment of
interest and
repayment of
principal is not
guaranteed by
Central / State
Govt./s
0.00 0.00 0.00 22.5 0.00
9
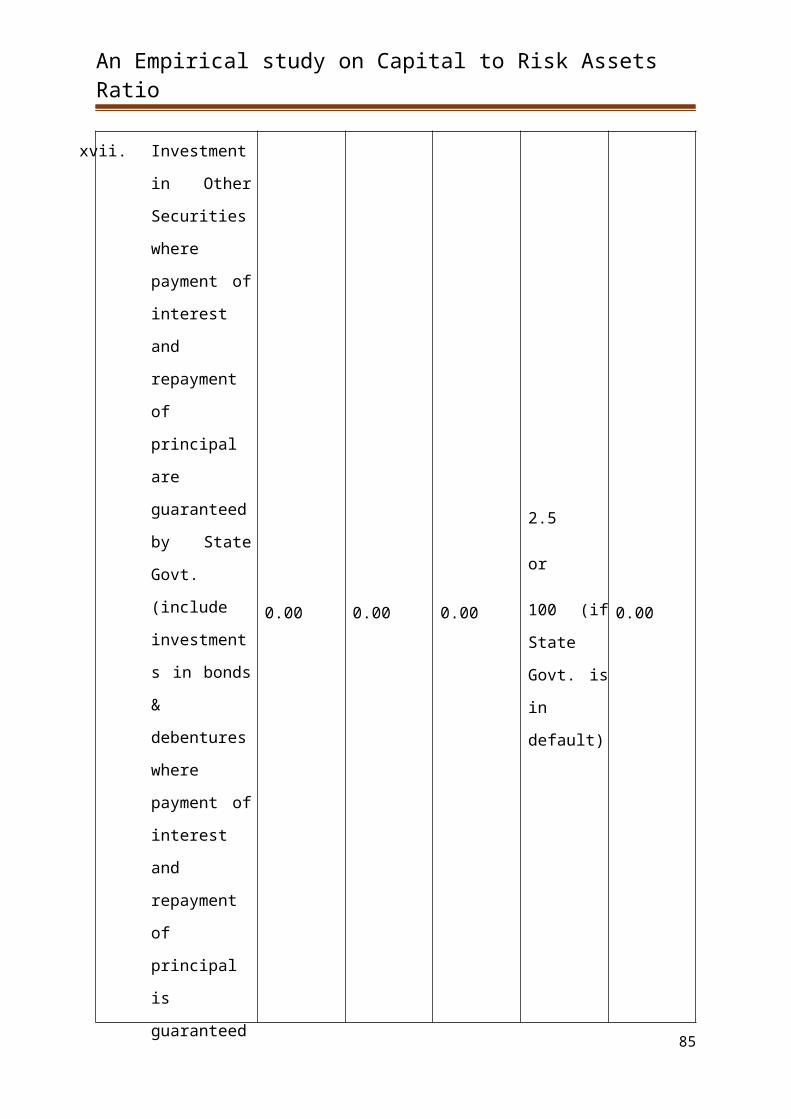
An Empirical study on Capital to Risk Assets Ratio
xxxi. Investment in
Govt.
guaranteed
securities of
government
undertakings
which do not
form part of the
approved
market
borrowing
Program
0.00 0.00 0.00 22.5 0.00
xxxii. Claims on
commercial
banks, District
Central
Cooperative
Banks
4996.81 0.00 4996.81 20 999.36
xxxiii. Claims on other
Urban
Cooperative
Banks
0.00 0.000.00
20 0.00
xxxiv. Investments in
bonds issued by
All India Public
financial
Institutions
0.00 0.00 0.00 22.5 0.00
xxxv. Investments in
bonds issued by
Public Financial
Institutions for
their Tier-II
Capital
0.00 0.00 0.00 102.5 0.00
10
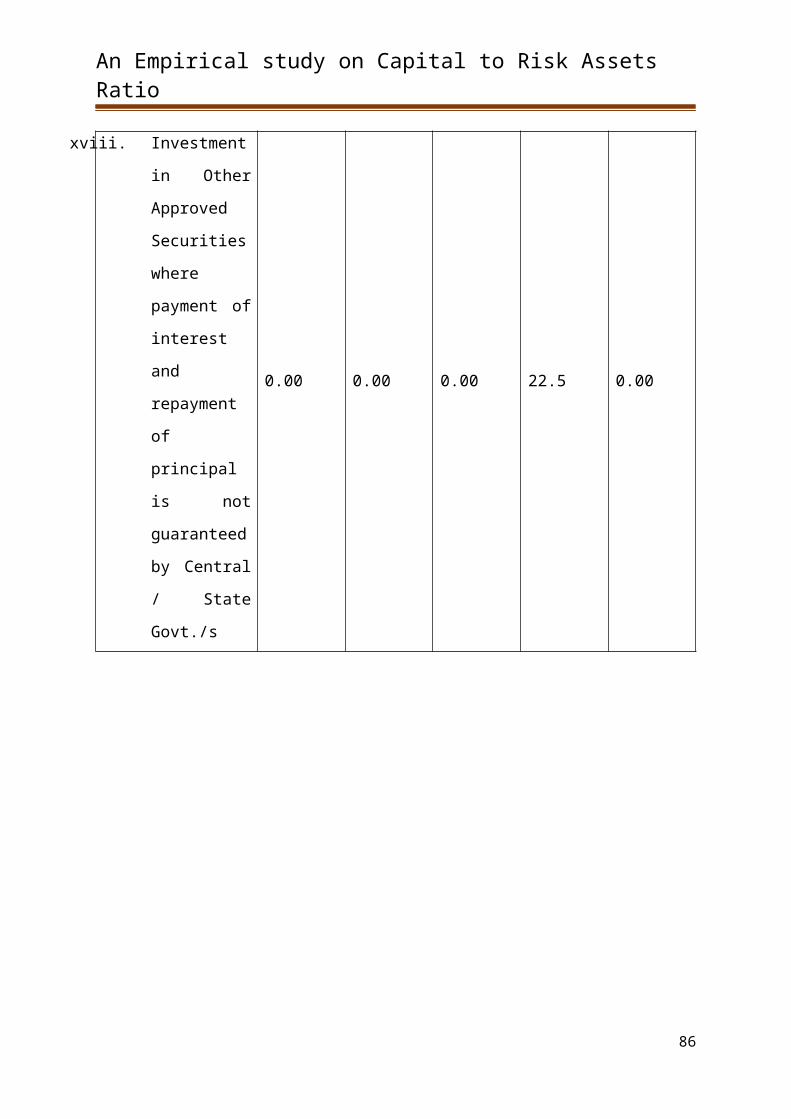
An Empirical study on Capital to Risk Assets Ratio
xxxvi. All Other
Investments 3.43 0.11 3.32 102.5 3.40
11
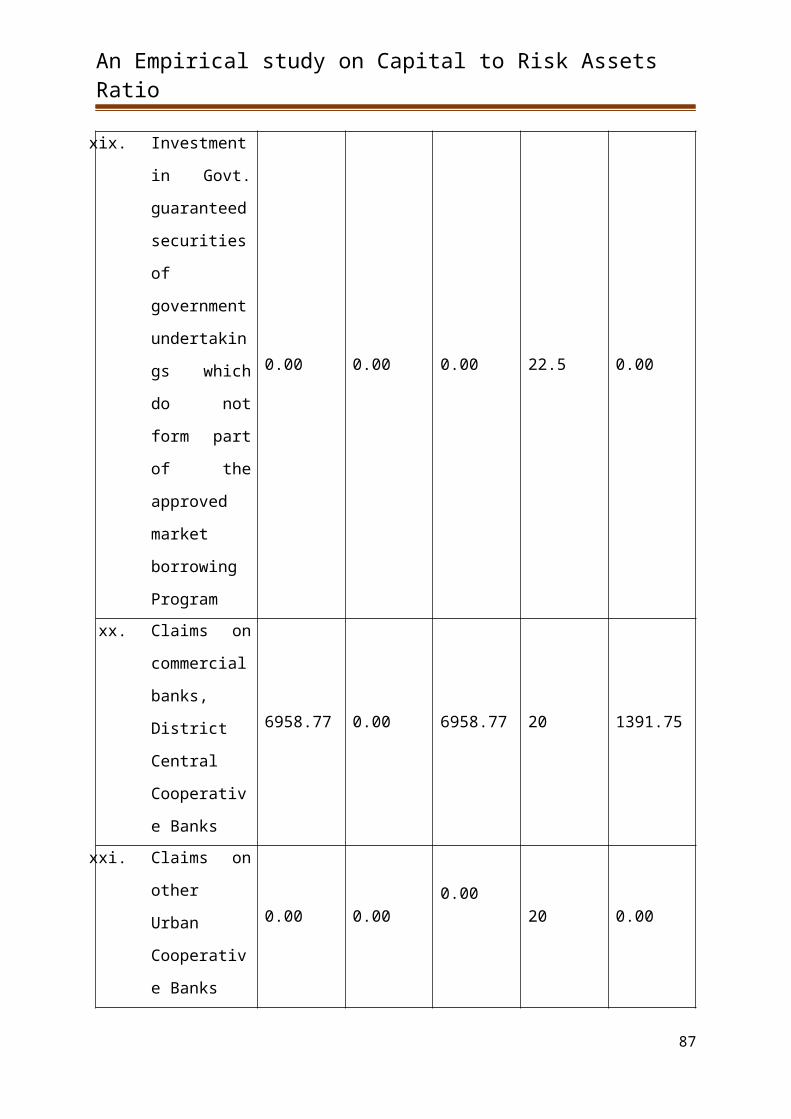
An Empirical study on Capital to Risk Assets Ratio
III. LOANS AND
ADVANCES15017.48 15017.48 12927.20
xxv. Loans guaranteed
by Govt of India0
xxvi. Loans guaranteed
by State Govt0
xxvii. Loans guaranteed
by State Govts.
Where guarantee
has been invoked
and the concerned
State Govt has
remained in
default
100
xxviii. Loans granted to
PSUs of GOI100
xxix. Housing Loans to
individuals against
mortgage of
residential housing
property
259.91 0.00 259.9150
129.96
xxx. Gold Loan upto
Rs. 1 lakh3244.49 3244.49 50 1622.25
xxxi. Gold Loan above
Rs. 1 lakh3278.04 3278.04 125 4097.55
xxxii. Other Loans and
Advances
a) Secured
14206.95 1915.47 12291.48 100 12291.48
b) Consumer &
personal loan143.95 32.21 111.74 125 139.68
xxxiii. Leased Assets 100
12
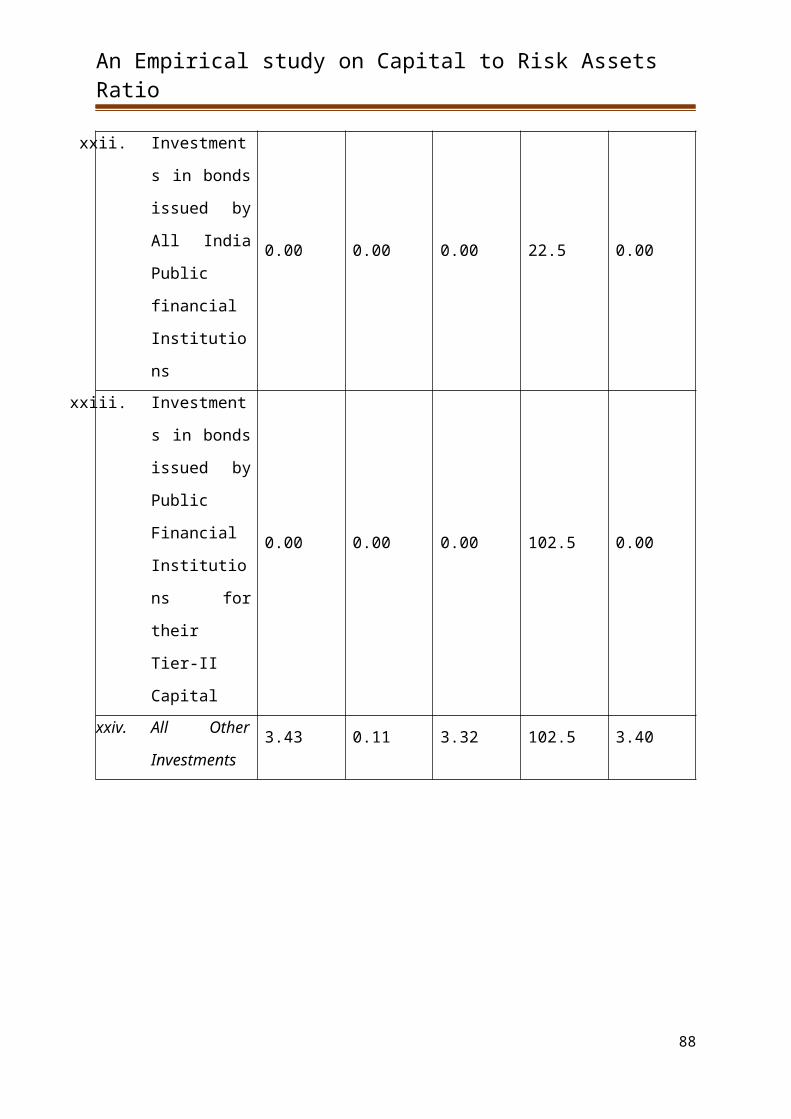
An Empirical study on Capital to Risk Assets Ratio
xxxiv. Advances covered
by DICGC /
ECGC (only for
amount covered
by DICGC /ECGC
not for entire
amount
outstanding)
50
xxxv. Advances for term
deposits, Life
policies, NSCs,
IVPs and KVPs
where adequate
margin is
available
500.85 0.00 500.85
0
subject to
adequate
margin
500.85
xxxvi. Loans to Staff of
banks, which are
fully covered by
superannuation
benefits and
mortgage of flat /
house
158.16 0.00 158.16 20 31.63
IV. MONEY AT CALL
AND SHORT
NOTICE
20
V. PREMISES,
FURNITURE AND
FIXTURE
114.79 0.00 114.79 100 114.79
VI. OTHER ASSETS
i) Interest Due on Govt.
Securities114.21 0.00 114.21 0 0.00
ii)Accrued Interest on
CRR, if any0.00 0.00 0.00 0 0.00
13
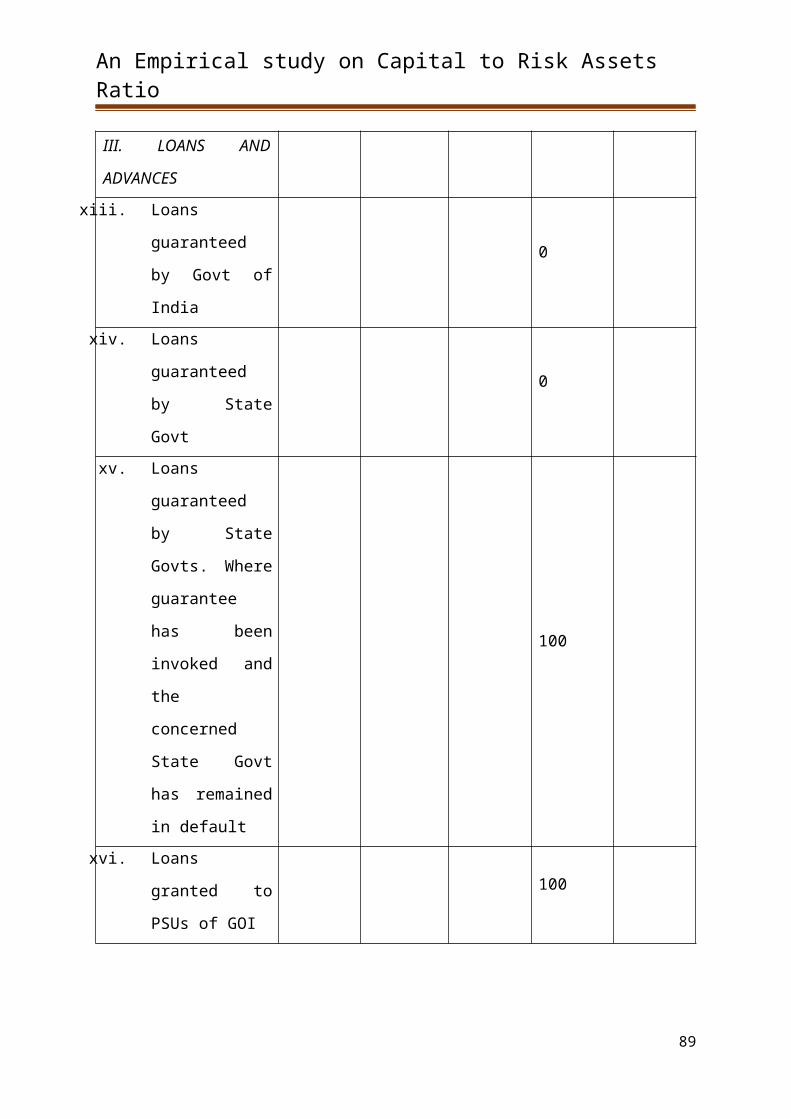
An Empirical study on Capital to Risk Assets Ratio
iii ) Accrued Interest on
loans & advances144.91 0.00 144.91 100 144.91
iV ) Overdue Interest
Reserve336.15 336.15 0 0 0.00
V ) Accrued Interest on
FD with bank52.99 0.00 52.99 20 10.60
Vi) )All Other Assets
(including branch
adjustments, non-
banking assets, etc.)
148.93 12.18 136.75 100 136.75
VIII. MARKET RISK
ON OPEN POSITIONS-
11. Market Risk on
Foreign Exchange
Open Position
(For Authorized
Dealers only)
100
12. Market Risk on
Gold Open
Position
100
IX. TOTAL 36303.33 2498.83 33804.50 20523.02
* Provision if any made for depreciation in investments in Government and other
approved securities may be indicated by way of a
Footnote.
** Provisions held either general or specific, for bad and doubtful debts and standard assets
may be indicated by way of footnote.
14
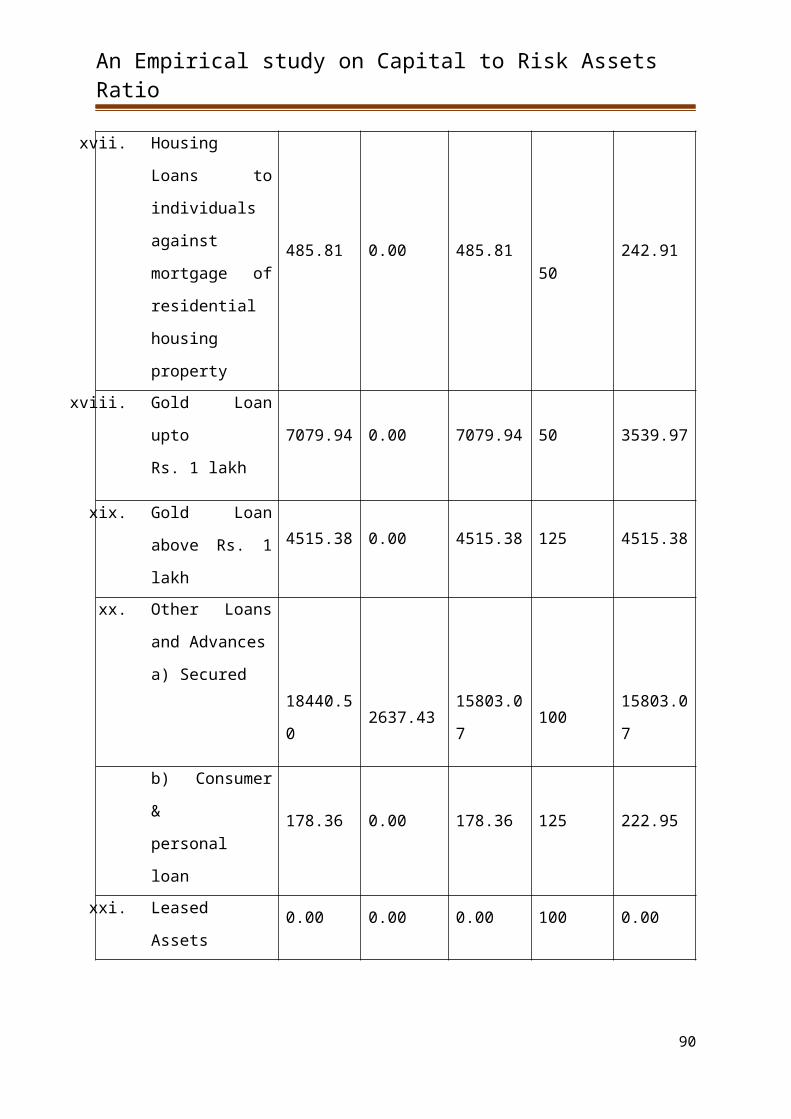
An Empirical study on Capital to Risk Assets Ratio
Part C -Weighed Non-funded Exposures / Off-Balance Sheet Items
Each off-Balance Sheet item may be submitted in the format indicated below:
Rs. In Lakh
Position as 31.03.2011
Nature of Item Book
Value
Conversion
Factor
Equivalent
Value
Risk
Weight
Adjusted
Value
Bank Guarantee
(Financial) 4.26
Note: Netting may be done only for advances collateralized by cash margins or deposits and
in respect of assets where provisions for depreciation or for bad and doubtful debts.
Name of the Bank: THE URBAN CO OPERATIVE BANK LIMITED.NO.1758
PERINTHALMANNA
15
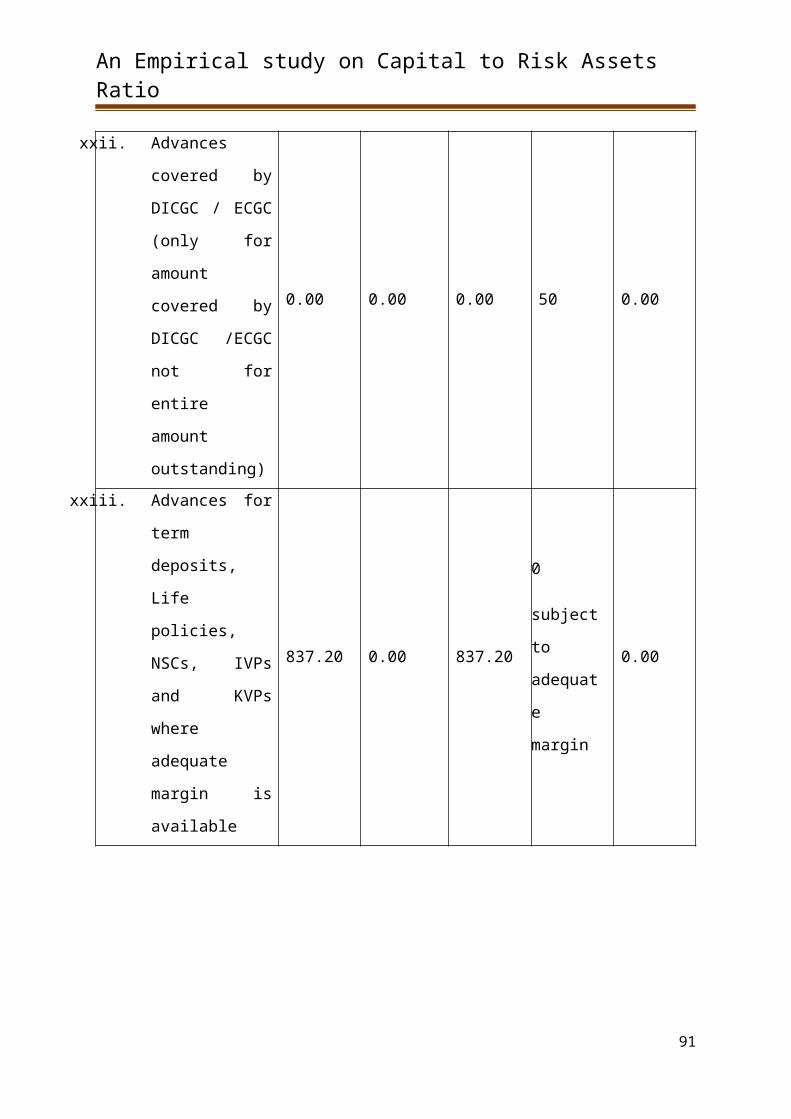
An Empirical study on Capital to Risk Assets Ratio
Statement of Capital Funds, Risk Assets / Exposures and Risk Asset Ratio
Part A - Capital Fund and Risk Assets Ratio as on; - 31/03/2012Rs. in Lakh
I Capital Funds 31-03-2012
A Tier I Capital elements
(a) Paid-up Capital 1551.88
Less : Intangible assets and losses
Net Paid-up Capital 1551.88
(b) Reserves & Surplus
1. Statutory reserves : 403.41
2. Capital reserves (see note below) 300.74
3. Other reserves 236.50
4. Surplus in Profit & Loss Account* 252.80
Total Reserves & Surplus 1193.45
Total Capital Funds (a + b) 2745.33
Notes : Capital reserves representing surplus on sales of assets and held in a separate
account will be included
Revaluation reserves, general/floating provisions and specific provisions made for loan
losses and other asset losses or diminution in the value of any assets will not be reckoned
as capital funds.
* In case of surplus in P & L Account the following assumption may be made :
(c) The current year's surplus may be notionally arrived at to the extent
recommended by the BOD to be allocated among various reserves/funds and retained in
business.
16
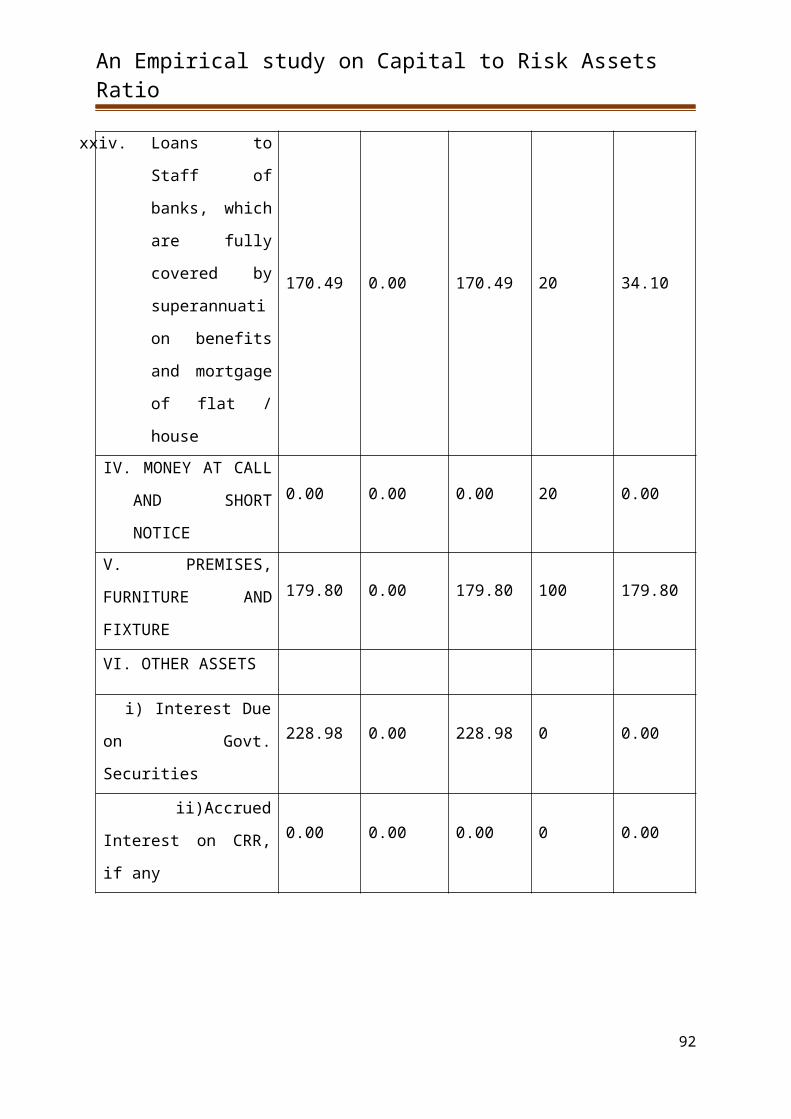
An Empirical study on Capital to Risk Assets Ratio
Where the BOD have not decided the distribution of the surplus, it may be notionally
arrived at on the basis of last 3 years average.
B Tier II capital elements
(i) Undisclosed reserves
(ii) Revaluation reserves
(iii) General provisions and loss reserves
#
284.47
(iv) Investment Fluctuation Reserves /
Funds
30.00
(v) Hybrid debt capital instruments
(vi) Subordinated debts
Total 314.47
Total of I (A + B) 3059.80
# Includes General Provision on standard assets (subject to restrictions)
II Risk Assets
(a) Adjusted value of funded risk assets
i.e. on Balance Sheet items (to tally
with Part ‘B')
22757.30
(b) Adjusted value of non-funded and
off-Balance Sheet items (to tally with
Part ‘C')
0.00
(c) Total risk-weighted assets (a+b) 22757.30
III Percentage of capital funds to risk-
weighted assets I / II x 10013.45
17
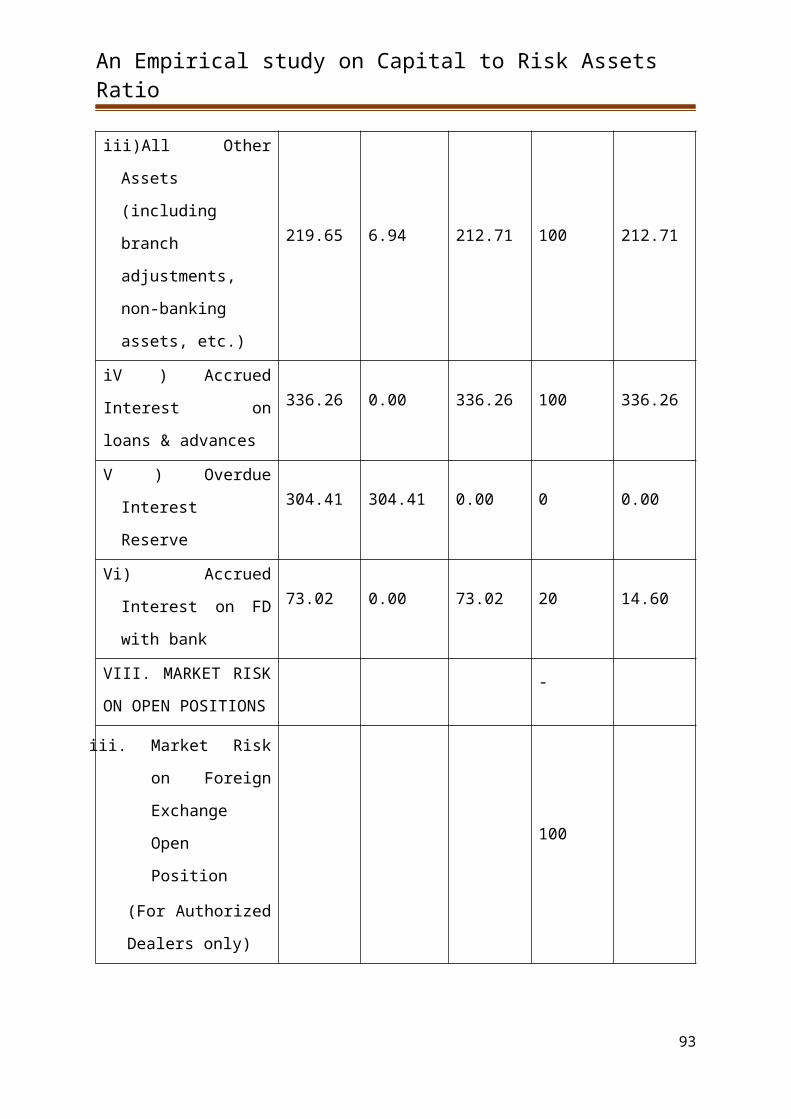
An Empirical study on Capital to Risk Assets Ratio
Part-B Risk Weight
Assets and Exposures
ASSET ITEM
(i)
Book
value
(ii)
Margins
and
provisions
(iii)
Book
value
(Net)
(ii)-(iii)
Risk
weight (%)
(v)
Risk
adjusted
value (vi)
As on 31.03.2012 As on
31.03.201
2
As on
31.03.2012
As on
31.03.201
2
As on
31.03.2012
As on
31.03.2012
I. BALANCES
x. Cash (including
foreign currency
notes) Balances
with RBI
714.17 0.00 714.17 0 0.00
xi. Balances in
current account
with UCBs
0.00 0.00 0.00 20 0.00
xii. Balances in
current account
with other banks
684.84 2.74 682.10 20 136.42
II. INVESTMENTS
xxxvii. Investment in
Central
Government
Securities
9445.09 270.00 9175.09 2.5 229.38
18
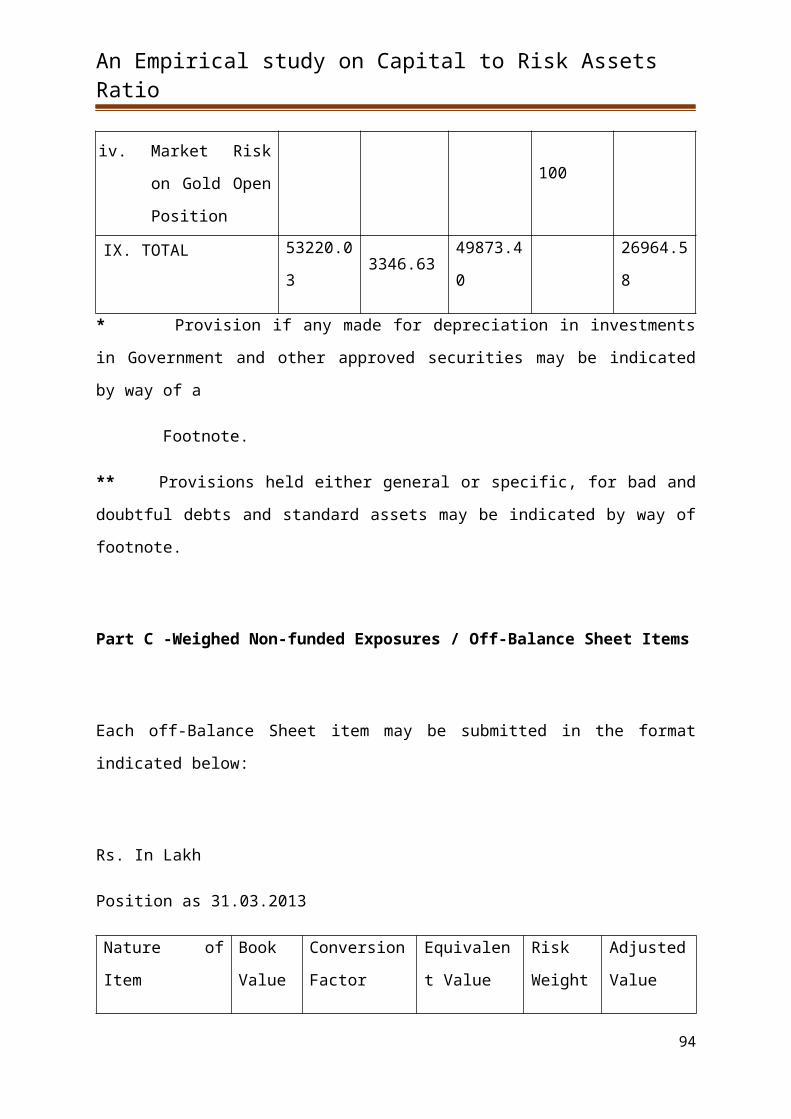
An Empirical study on Capital to Risk Assets Ratio
xxxviii. Investment in
Other Approved
Securities
guaranteed by
Central
Government
0.00 0.00 0.00 2.5 0.00
xxxix. Investment in
Other Approved
Securities
guaranteed by
State
Government
300.00 0.00 300.00 2.5 7.50
19
An Empirical study on Capital to Risk Assets Ratio
xl. Investment in
Other Securities
where payment
of interest and
repayment of
principal are
guaranteed by
Central Govt.
(include
investment in
Indira/Kisan
Vikas Patras and
investments in
bonds &
debentures
where payment
of interest and
repayment of
principal is
guaranteed by
Central Govt.)
0.00 0.00 0.00 2.5 0.00
20
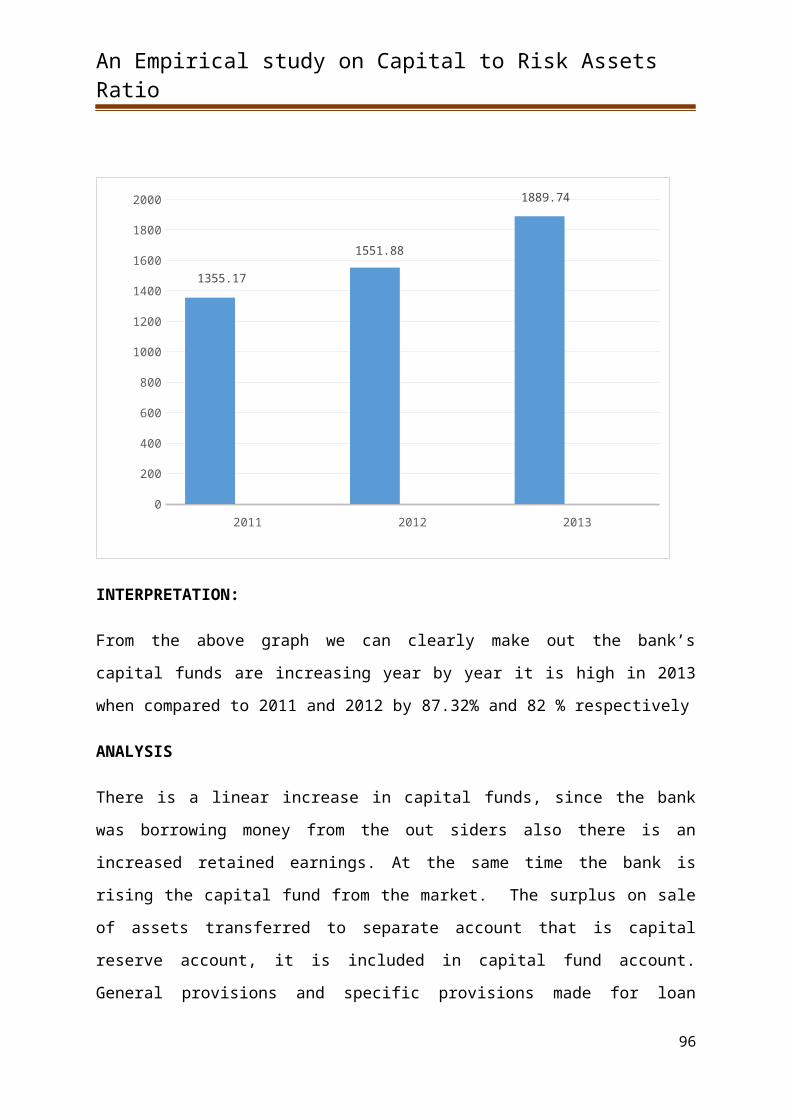
An Empirical study on Capital to Risk Assets Ratio
xli. Investment in
Other Securities
where payment
of interest and
repayment of
principal are
guaranteed by
State Govt.
(include
investments in
bonds &
debentures
where payment
of interest and
repayment of
principal is
guaranteed by
Central Govt.)
0.00 0.00 0.00
2.
5
or
100 (if
State Govt.
is in
default)
0.00
xlii. Investment in
Other Approved
Securities where
payment of
interest and
repayment of
principal is not
guaranteed by
Central / State
Govt./s
0.00 0.00 0.00 22.5 0.00
21
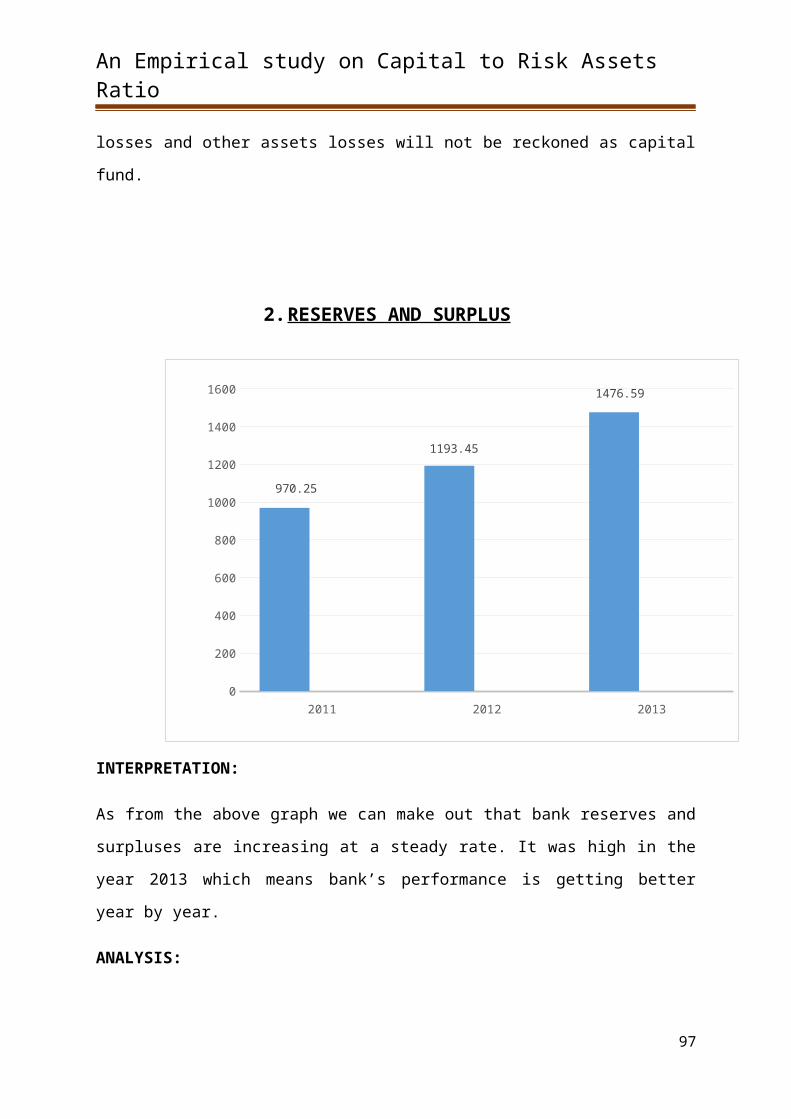
An Empirical study on Capital to Risk Assets Ratio
xliii. Investment in
Govt.
guaranteed
securities of
government
undertakings
which do not
form part of the
approved
market
borrowing
Program
0.00 0.00 0.00 22.5 0.00
xliv. Claims on
commercial
banks, District
Central
Cooperative
Banks
8079.73 0.00 8079.73 20 1615.95
xlv. Claims on other
Urban
Cooperative
Banks
0.00 0.000.00
20 0.00
xlvi. Investments in
bonds issued by
All India Public
financial
Institutions
0.00 0.00 0.00 22.5 0.00
xlvii. Investments in
bonds issued by
Public Financial
Institutions for
their Tier-II
Capital
0.00 0.00 0.00 102.5 0.00
22
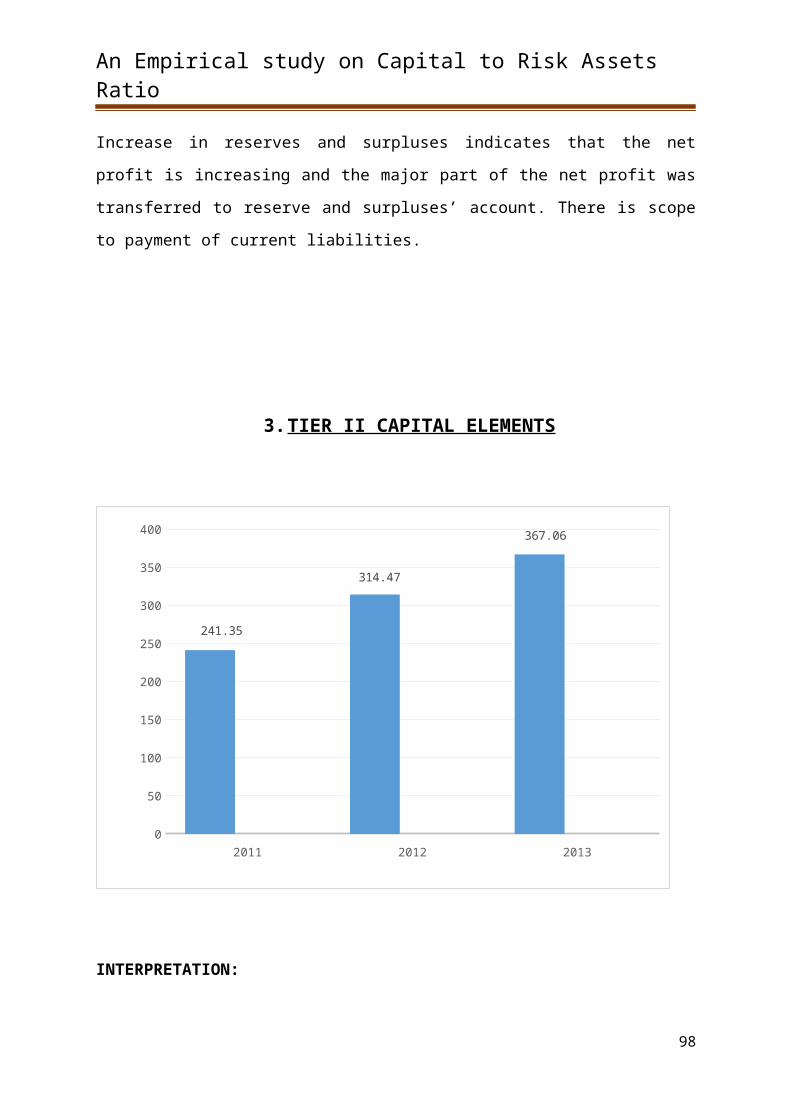
An Empirical study on Capital to Risk Assets Ratio
xlviii. All Other
Investments 3.43 0.11 3.32 102.5 3.40
23
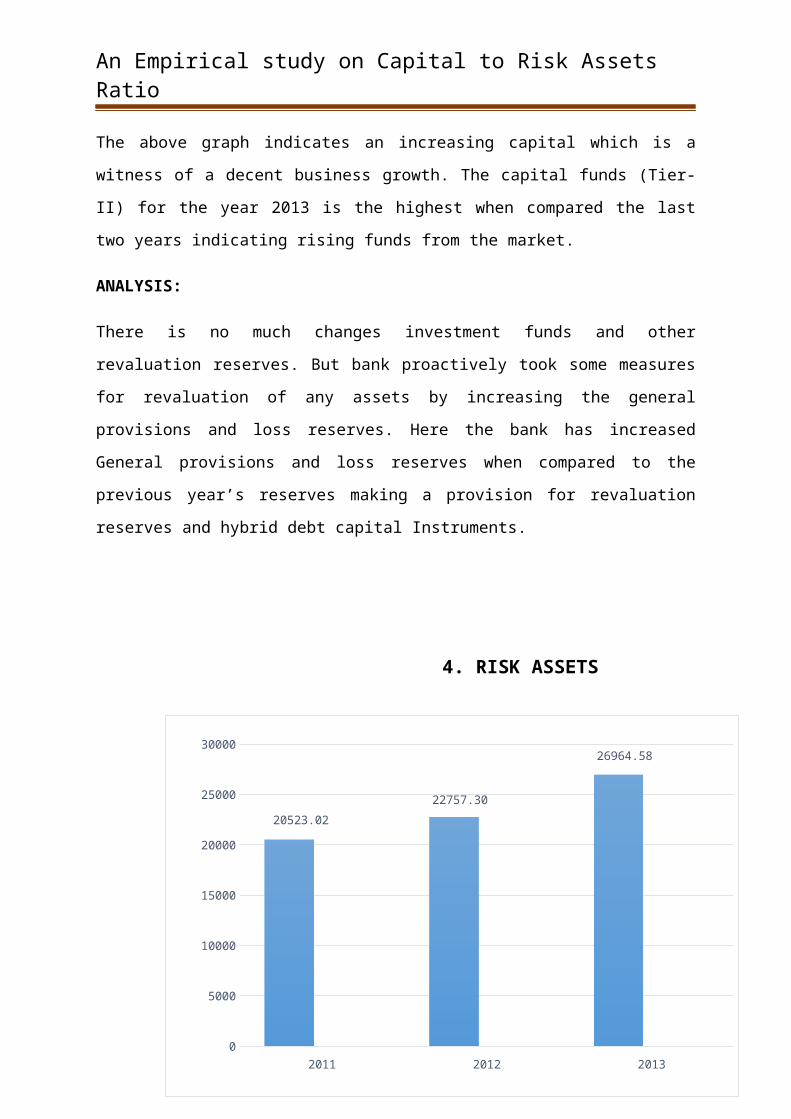
An Empirical study on Capital to Risk Assets Ratio
III. LOANS AND
ADVANCES
xxxvii. Loans guaranteed
by Govt of India0
xxxviii. Loans guaranteed
by State Govt0
xxxix. Loans guaranteed
by State Govts.
Where guarantee
has been invoked
and the concerned
State Govt has
remained in
default
100
xl. Loans granted to
PSUs of GOI100
xli. Housing Loans to
individuals against
mortgage of
residential housing
property
375.21 0.00 375.2150
187.60
xlii. Gold Loan upto
Rs. 1 lakh5023.78 0.00 5023.78 50 2511.90
xliii. Gold Loan above
Rs. 1 lakh3571.23 0.00 3571.23 50 3571.23
xliv. Other Loans and
Advances
a) Secured
15530.26 2148.76 13381.50 100 13381.50
b) Consumer &
personal loan533.91 115.59 418.32 125 522.90
xlv. Leased Assets 0.00 0.00 0.00 100 0.00
24
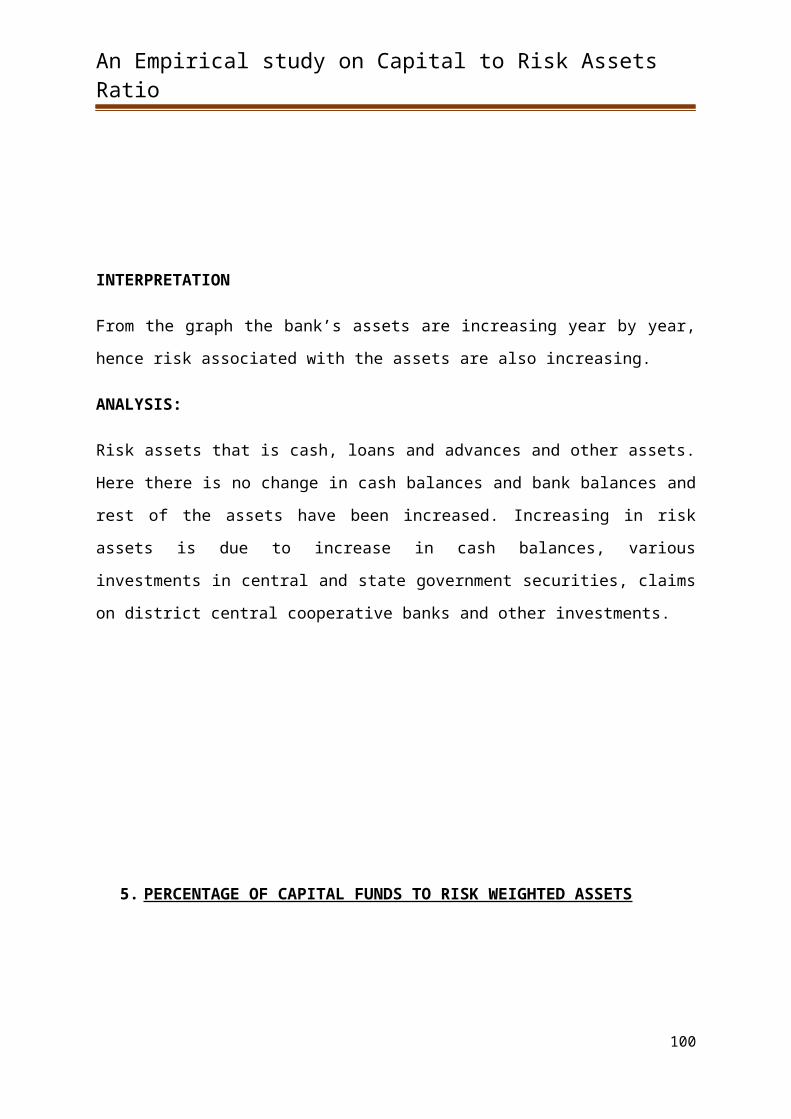
An Empirical study on Capital to Risk Assets Ratio
xlvi. Advances covered
by DICGC /
ECGC (only for
amount covered
by DICGC /ECGC
not for entire
amount
outstanding)
0.00 0.00 0.00 50 0.00
xlvii. Advances for term
deposits, Life
policies, NSCs,
IVPs and KVPs
where adequate
margin is
available
524.32 0.00 524.32
0
subject to
adequate
margin
0.00
xlviii. Loans to Staff of
banks, which are
fully covered by
superannuation
benefits and
mortgage of flat /
house
170.81 0.00 170.81 20 34.16
IV. MONEY AT CALL
AND SHORT
NOTICE
0.00 0.00 0.00 20 0.00
V. PREMISES,
FURNITURE AND
FIXTURE
138.23 0.00 138.23 100 138.23
VI. OTHER ASSETS
i) Interest Due on Govt.
Securities170.40 0.00 170.40 0 0.00
ii)Accrued Interest on
CRR, if any0.00 0.00 0.00 0 0.00
25
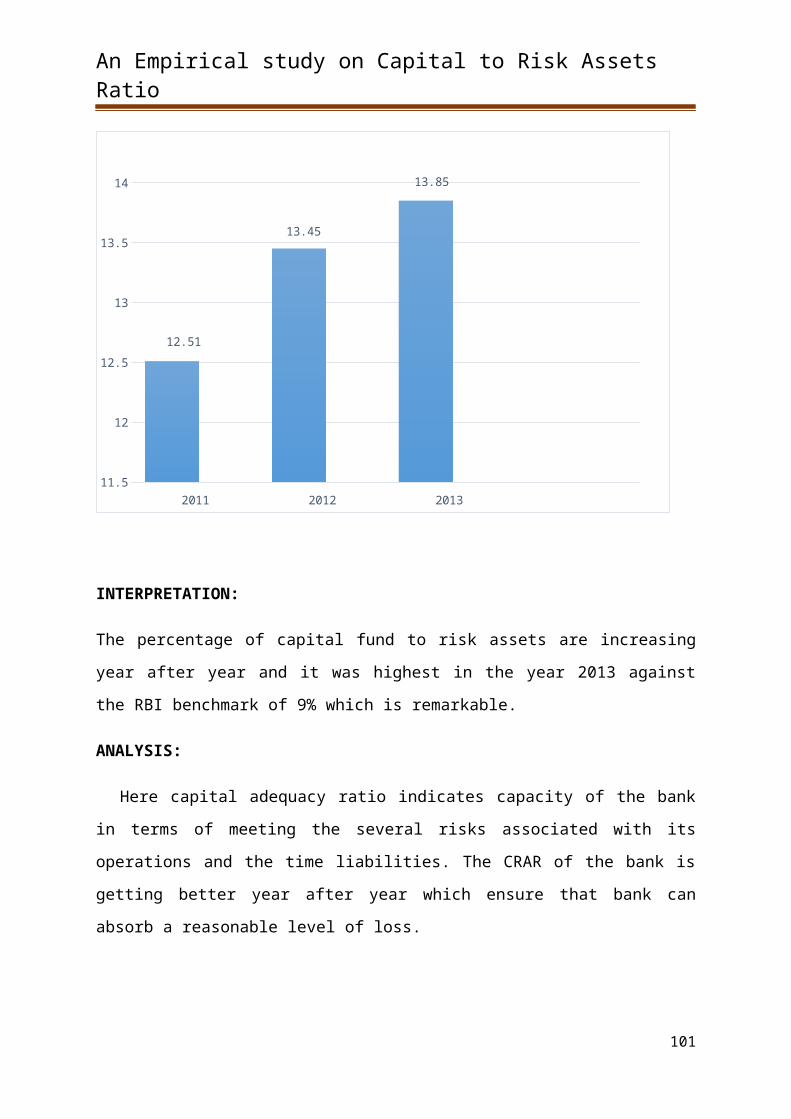
An Empirical study on Capital to Risk Assets Ratio
iii ) Accrued Interest on
loans & advances266.12 0.00 266.12 100 266.12
iV ) Overdue Interest
Reserve398.35 398.35 0.00 0 0.00
V ) Accrued Interest on
FD with bank87.71 0.00 87.71 20 17.54
Vi) All Other Assets
(including branch
adjustments, non-
banking assets, etc.)
140.41 6.94 133.47 100 133.47
VIII. MARKET RISK
ON OPEN POSITIONS-
13. Market Risk on
Foreign Exchange
Open Position
(For Authorized
Dealers only)
100
14. Market Risk on
Gold Open
Position
100
IX. TOTAL 46158.00 2942.49 43215.51 22757.30
* Provision if any made for depreciation in investments in Government and other
approved securities may be indicated by way of a Footnote.
** Provisions held either general or specific, for bad and doubtful debts and standard assets
may be indicated by way of footnote.
Part C -Weighed Non-funded Exposures / Off-Balance Sheet Items
26
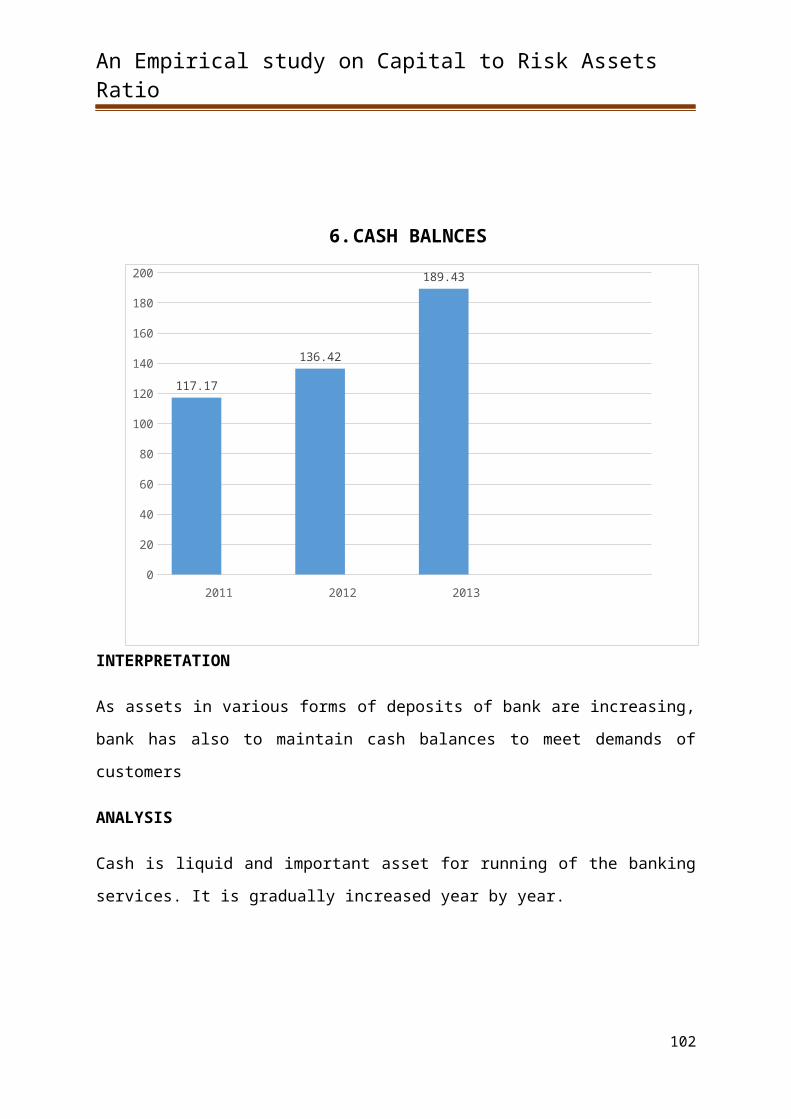
An Empirical study on Capital to Risk Assets Ratio
Each off-Balance Sheet item may be submitted in the format indicated below:
Rs. In Lakh
Position as 31.03.2012
Nature of Item Book
Value
Conversion
Factor
Equivalent
Value
Risk
Weight
Adjusted
Value
Bank Guarantee
(Financial) 4.26
Note: Netting may be done only for advances collateralized by cash margins or deposits and
in respect of assets where provisions for depreciation or for bad and doubtful debts.
27