Embed Size (px)
Citation preview
Running Head: ENDOGENOUS PREDICTORS OF LEISURE-TIME PHYSICAL1
Endogenous Predictors of Leisure-Time Physical Activity and Okun’s Law
Johnny Wright
Southern New Hampshire University
ENDOGENOUS PREDICTORS OF LEISURE-TIME PHYSICAL ACTIVITY2
Abstract
Physical activity is a necessity to the health and welfare of not only people, but entire nations
aggregately. The main failing is the evidence of public choice in the matter, when it comes to
engaging in leisure-time physical activity. The U.S. Department of Health and Human Services
is considering an initiative to increase leisure physical activity for its health and economic
benefits. The paper researches the endogenous determinants of physical activity as it relates to a
proper diet, unemployment, and socioeconomic status, more specifically, race. Models are
developed that adjust for race. To further test the predictor variables, Okun’s law, traditionally
used to measure economic growth, is used to get a better fit of the data to the model. Empirical
testing found that Hispanics were the least likely to engage in leisure time physical activity due
to their lack of participation in the market, indicated by their per-capita GDP. The Black/African
American population, while ranking high in meeting federal LPTA standards, showed the highest
unemployment, a variable highly correlated with LPTA. The Asian population ranked the lowest
in the consumption of farm produced foods, a variable both the unadjusted and Okun’s law
predicted models show is correlated to LPTA. The goal of the paper is to identify opportunities
for business that the U.S. Department of Health and Human Services can use to increase LPTA
and add economic value aggregately.
ENDOGENOUS PREDICTORS OF LEISURE-TIME PHYSICAL ACTIVITY3
Endogenous Predictors of Leisure-Time Physical Activity and Okun’s Law
Health care is a topic of much debate in the United States of America. Citizens and
politicians alike constantly discuss the appropriate level and type of focus that is needed to
ensure the long-term well-being of the nation. Some citizens believe that it is the government’s
job to provide efficiency in the market for quality of life; while politicians and government
organizations, such as the U.S. Department of Health and Human Services, believe that the
people must take an active role prolonging their health. This causes a disjunction between the
role of the people and the role of the government as it pertains to this issue and how that
responsibility should be distributed between the public and private sectors. Included in the core
responsibilities is the appropriate behavior of the citizens. The role of the government is to help
encourage its citizens to produce in the long-term and correct for any problems that arise when
inefficiency in production occurs (De Jasay, 2006). This correction does not imply a continuous
subsidy, but a mutually beneficial principle-agent scenario for both parties (“Principal-Agent
Problem Definition,” 2010).
Introduction
Taking an unbiased view of the government, push policies that are made are ultimately
for the betterment of the whole. Federal leaders see that, over time, accounting for those in the
country that engage in myopic health behavior (i.e. consumption of unhealthy food, inactivity,
tobacco smoking) causes externalities not specific to just the person engaging in the behavior.
Externalities to correct include prescription costs, unintended myopic cognitive behavior transfer
to other citizens, and overall decreased level of perceived national health. Proof of this can be
seen in the American obesity rate, which says that 66% of Americans are likely to be considered
overweight or obese, by standards of body mass index (“Overweight and Obesity Statistics,”
ENDOGENOUS PREDICTORS OF LEISURE-TIME PHYSICAL ACTIVITY4
2012). Cigarette smoking, which has a myriad of externalities in addition to its own by-products,
is another public health failure that government expenditures are expected to account for. It is
estimated that 18% of legal age citizens smoke cigarettes in the United States (“Current Cigarette
Smoking Among Adults in the United States,” 2015). Behavior and realities such as these are the
reason why the government places such high importance on citizens doing their duty to keep
themselves healthy as much as possible. Encouraging this behavior can cost citizens tax money
and lead to health problems for those not involved in the activity. In order to maximize
consumption on merit goods with respect to aggregate physical health, it is important to keep in
mind the constraint of public choice (“Merit Goods,” 2015).
Using the goal of merit good maximization constrained to public choice, a solution to
encourage the consumption of goods that promote health can be formed. One way this is done is
through initiatives to educate citizens to decrease consumption of demerit goods (i.e. cigarettes
and unhealthy food). The U.S. Department of Health and Human Services should consider the
consumption of goods that are related to leisure-time physical activity (LPTA). LPTA discounts
physical activity related to every day necessities, such as that needed for job functions. Its goal is
to decrease the amount of time used on unproductive, myopic behavior, in favor for physical
activity. As of 2013, employed Americans use almost 3 times the amount of hours engaging in
relaxation and television watching than participating in a physical or sports activity (“Charts by
Topic: Leisure and sports activities,” 2014). The results of the survey show that Americans need
activities that either decrease consumption of television watching or increase production of
leisure-time physical activities. Considering that employment was a qualifier for those statistics,
a hypothesis can be formed that looks into how employment and other economic indicators
impact physical activity consumption
ENDOGENOUS PREDICTORS OF LEISURE-TIME PHYSICAL ACTIVITY5
Literature Review
Many studies have been done on the correlation between economic indicators and
physical activity. The data is usually categorized further into different factors that can contribute
to aggregate physical activity, such as demographics, income and work performance, to evaluate
the link between the response variable (physical activity) and the predictors.
Physical Activity and Personal Health
Assuming that age reduces the type of activity that one can perform, Arvidson et al.
(2013) created a model to predict work ability based on reported LPTA. Using a sample size of
2783, the study found a direct correlation between work ability and physical activity. Those who
scored lower on the work ability index (WAI) were reported to have lower amounts of leisure
time physical activity. They also found that physical activity can be used as a predictive tool for
future performance as it demonstrates the employee’s balanced lifestyle. This information is
important to businesses looking to increase employee morale and corporate culture unity due to
common interests.
Since a balanced lifestyle was correlated with better work ability, past data can be used to
predict future performance. Casual observation suggests that people learn their lifestyle habits at
an early age, usually by adolescence. Wichstrøm, Soest, & Kvalem, (2012) evaluated the
difference between adolescent and adult activity. A 3-session survey was conducted on a sample
of 3251 kids in Norway collected information on their physical activity and amount of activity
during their adolescent years and tracked them to adulthood. They found that those who were
associated with sports clubs or had a positive image of physical activity throughout childhood
continued on with leisure physical activities into adulthood. Those with characteristics that
suppressed the activity in childhood were seen as having lower levels of leisure activity. The
ENDOGENOUS PREDICTORS OF LEISURE-TIME PHYSICAL ACTIVITY6
information here seems to indicate a cognitive aspect to leisure time activity, usually measured
by education.
Consumer Confidence and Public Health. In addition to ability to perform at work and
precognition, aggregate unemployment can be used to show public health. Janlert (2009) studied
the effects of unemployment on aggregate public health. Using mental health as response, Janlert
found that economic fluctuations influenced the number of people treated for mental issues. In
addition to the correlation, the data showed that recessions correlated with negative mental health
and increases in psychiatric patients, while expansions showed the opposite effect. Since market
activity (Gross Domestic Product or GDP) is a reflection of consumer confidence, lower
confidence is associated with a negative impact on overall health (Shields & Shooshtari, 2001).
This finding indicates that the wealth and substitution effects are present and highlights the need
for an understanding of the principle-agent problem between citizen and government.
While the indicators do influence aggregate health, decisions on how to handle the
problem should not be solely linked to them for short-term results. Ashraf, Lester, & Weil (2008)
studied the subsequent impact on GDP before and after the African malaria outbreak in 2005 to
determine whether or not sickness influenced the direction of GDP. This was done by evaluating
macroeconomic indicators (such as per capita income) in relation to overall continental health.
There was a claim in Africa that since malaria broke out, the continent’s GDP decreased by 1.3%
in 2005, prompting claims that GDP would have been higher if not for the malaria outbreak. The
null hypothesis that sickness that sickness correlated with health was upheld due to short-term
GDP on the continent showing no affect after the outbreak; however, an effect on long-term
GDP and per capita income was found. It gives reason to infer that health improvement projects
ENDOGENOUS PREDICTORS OF LEISURE-TIME PHYSICAL ACTIVITY7
are best used as humanitarian and not economic arguments; however, economic indicators
should be used a guide for policy creation.
Demographic and food consumption information as a Health Predictor. Public and
private health is influenced by cognitive development as well a consumer confidence. Cognitive
development is related to life-long production of LPTA. Self-esteem, indicated by market
participation, can be seen by the types of goods and services being sold as well. Both related
predictors can be traced back to food consumption choices based on demographics. Observation
suggests that physical activity and weight-loss is related to pre-existing eating patterns and those
successful in healthy style changes accompany that with increased physical activity. There is also
reason to believe that citizen profile has a role to play in individual quality of health, with the
summation of those individuals showing the aggregate quality. Brennan and Singh (2012)
studied the effects of socioeconomic indicators and self-reported health statistics on general
health that accounted for dietary intake. The study looked at a sample of 444 citizens of
Adelaide, Australia, via survey to collect data on their gender, age, socioeconomic status, daily
diet, and oral problems. The results found a correlation among socioeconomic status, daily
dietary intake, and general health status. Gallant and Dorn (2000) found lifestyle choices varied
based on demographics. The research sampled 1266 older adults to collect information on
preventative behaviors as a function of baseline characteristics and found that preventative
methods varied by health behavior, race and gender. It gives reason to infer that not only
economic indicators (Shields & Shooshtari, 2001) as well as categorical data, such as race having
an influence on general health, thus causing LPTA to respond accordingly.
Costs associated with increasing LPTA. It is known that a poor diet can lead to poor
health. A good diet has a cost that some citizens cannot afford (Brennan and Singh, 2012).
ENDOGENOUS PREDICTORS OF LEISURE-TIME PHYSICAL ACTIVITY8
Because of this knowledge, there exists a skew in the types of foods being consumed to favor
that which gives citizens more utility in the short-run, based on cost and income. Using a cost
benefit analysis, the substitution effect would be more powerful of an influence as citizens want
the most amount of health per dollar (in other words, to be healthy) at the lowest cost and
producers want to provide it at the highest cost (Adetunji, 2009). A market failure in public
health is now created (Normad, 1991), influencing all areas of public choice, including the
choice to engage in leisure-time physical activity.
Data Collection and Descriptive Statistics
The increase in presence of alternative cheaper alternative food choices as well as the
rising costs of farm-produced food give reason to suspect that activity may be linked to the
consumption of those products. In addition to high food prices, consumer confidence in the
aggregate market, indicated by per capita GDP, and unemployment was evaluated as standard
economic indicators. 10 yearly observations across the 4 major ethic groups in the United States
were used to test the 3 different predictors against the response. The objective is to test whether
or not the prevailing factors found in the research are endogenous to activity in order to assist the
Department of Health and Human Service identify opportunities at the state and national levels
to increase participation in leisure time physical activity.
To empirically test how physical activity responds to the important predictors, data was
collected from the Center for Disease Control (CDC) regarding meaningful participation in
LPTA across the four major racial groups in the United States since 2003. The model looks at
how reported physical activity that meets federal standards relates to variables such as race,
unemployment, and farm-produced food consumption as a percentage of per-capita GDP. The
data collected was time organized and captures specific data across racial groups. As discussed
ENDOGENOUS PREDICTORS OF LEISURE-TIME PHYSICAL ACTIVITY9
in the research (Janlert, 2009; Shields & Shooshtari, 2001; and Brennan and Singh, 2012), a
hypothesis of the response in LPTA would correlate positively with the three indicator variables.
In addition to the data collected on farm-produced food consumption, an Okun’s law relationship
was used against each unemployment rate. Okun’s law, which equates the difference of potential
and actual market activity to the change in unemployment against the natural rate of
unemployment, lagged 2%, was used to test the predicted farm-produced food consumption
correlation against its non-adjusted counterpart. Mathematically, Okun’s law is expressed as:
2 (u−un )=∆ YY
where u represents unemployment, un represents the natural rate of unemployment (given as
mean unemployment for the 2003-2012 decade), Y represents potential GDP, and ΔY
representing the difference between the actual activity and potential activity (GDP). It is
commonly used to forecast economic growth in its base form (Fladlein, 2009). To test correlation
with respect to farm produced food consumption and LPTA, Okun’s law will be rearranged as
follows:
Y=−Y a
(2u−2un−1)
Appendix A shows descriptive statistics of each variable across the 4 different races
across the 2003-2012 decade. The mean percentage of people who reported meeting federal
standards across all four major racial groups is 15.2%. The lowest reported percentage that
contributed to the mean came from the Hispanic/Latino population at 12.11%. Appendix B
shows the frequency distribution of LPTA meeting standards. The White/Caucasian population
had the highest volatility through the years, though its data yielded a more uniform population of
scores. With n = 10, none of the groups fit a normal distribution model. Appendices C and D
ENDOGENOUS PREDICTORS OF LEISURE-TIME PHYSICAL ACTIVITY10
show normal distribution fits of farm-produced food consumption and unemployment,
respectively. The white/Caucasian population showed the second lowest mean unemployment
rate and the highest amount of farm-produced food consumption expenditures, at over 9 times
aggregate per-capita GDP. The Asian population, with the lowest unemployment rate (almost
equal to the natural rate for the decade), corresponds with the 3rd highest frequency of people
reporting meeting federal LPTA standards and the lowest expenditures on farm-produced food.
Analysis and Results
Due to limitations in available data for years prior to 2003 and post 2012, two ordinary
least sum of squares models (OLS) were used: one model uses the unadjusted consumption of
farm-produced food to get a base understanding of how the correlates with LPTA reporting; the
second model uses Okun’s law-adjusted consumption. In both cases, the generalized model and
race-adjusted models are considered. Estimates for LPTA reporting are presented in both models
and assumed the following hypothesis:
H0: β1= β2= β3=0; besides what has already been researched, there is no additional
correlation between the chosen predictors;
H1: At least one of the predictors (β1, β2, or β3) is not zero, indicating further correlation
under the assumption that rejection of the null hypothesis means that the variables are
endogenous to each other.
Model 1: Unadjusted consumption and LPTA
A multiple regression on Minitab revealed that while the data did not perfectly fit the
normal distribution curve, each variable was statistically significant at the 95% level. In the
unadjusted consumption model, each of the 3 predictor variables explained almost 80% of the
model. As expected, unemployment contributed largely to the fit of the model; however, farm-
ENDOGENOUS PREDICTORS OF LEISURE-TIME PHYSICAL ACTIVITY11
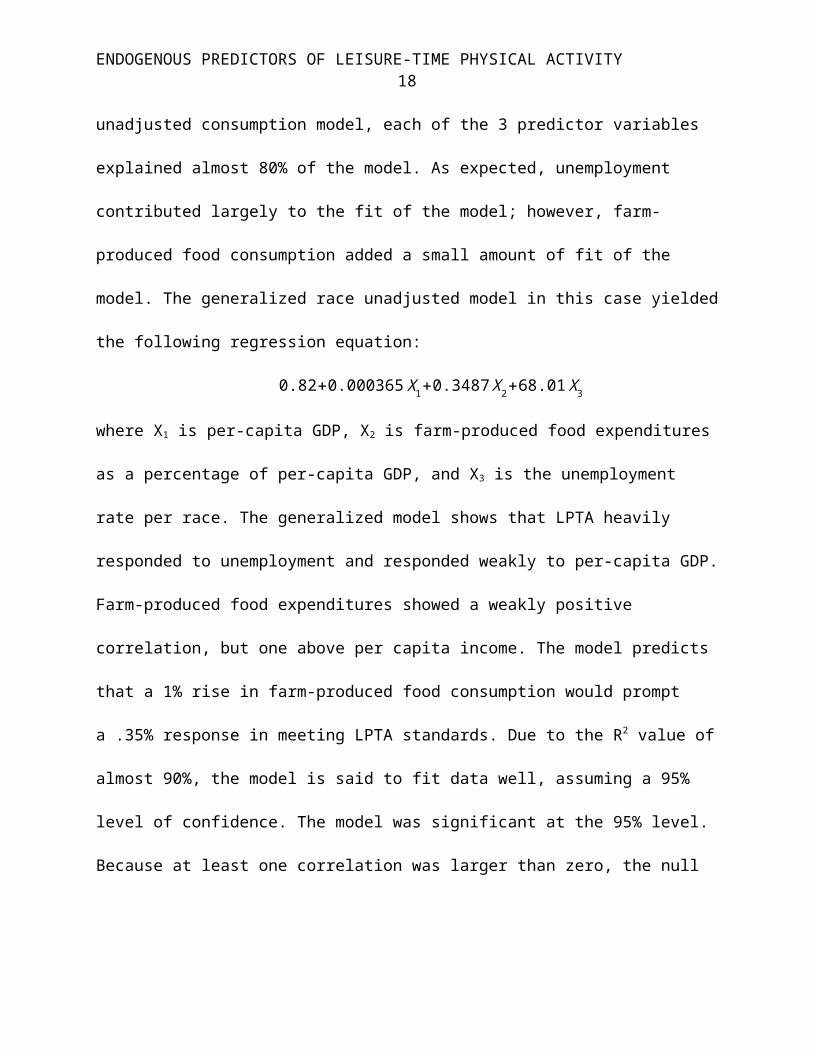
produced food consumption added a small amount of fit of the model. The generalized race
unadjusted model in this case yielded the following regression equation:
0.82+0.000365 X 1+0.3487 X2+68.01 X3
where X1 is per-capita GDP, X2 is farm-produced food expenditures as a percentage of per-capita
GDP, and X3 is the unemployment rate per race. The generalized model shows that LPTA
heavily responded to unemployment and responded weakly to per-capita GDP. Farm-produced
food expenditures showed a weakly positive correlation, but one above per capita income. The
model predicts that a 1% rise in farm-produced food consumption would prompt a .35%
response in meeting LPTA standards. Due to the R2 value of almost 90%, the model is said to fit
data well, assuming a 95% level of confidence. The model was significant at the 95% level.
Because at least one correlation was larger than zero, the null hypothesis is rejected, favoring the
alternative hypothesis that at our predictor variables correlate with LPTA.
Appendix E shows the race-adjusted models of unadjusted consumption. Each equation
represents the four major racial groups. These models suggest that the likelihood of meeting
LPTA standards, given by the intercept of the equation, does change per race and is impacted by
each of the predictor variables. In this model, while no one predictor stands out as a leading
cause, it does show that the activities of each variable having a significant correlation to LPTA.
Model 2: Okun’s Law Adjusted Consumption. Studied in the first model, farm-
produced food expenditures did have a significant correlation in both race unadjusted and
adjusted models, since the coefficient for the variable is greater than zero. Using Okun’s law
predictions with respect to food expenditures, each race was predicted to have 20% more
consumption on farm-produced food on average. The largest difference came from the
Black/African American population, which had a 35% difference in its predicted value from its
ENDOGENOUS PREDICTORS OF LEISURE-TIME PHYSICAL ACTIVITY12
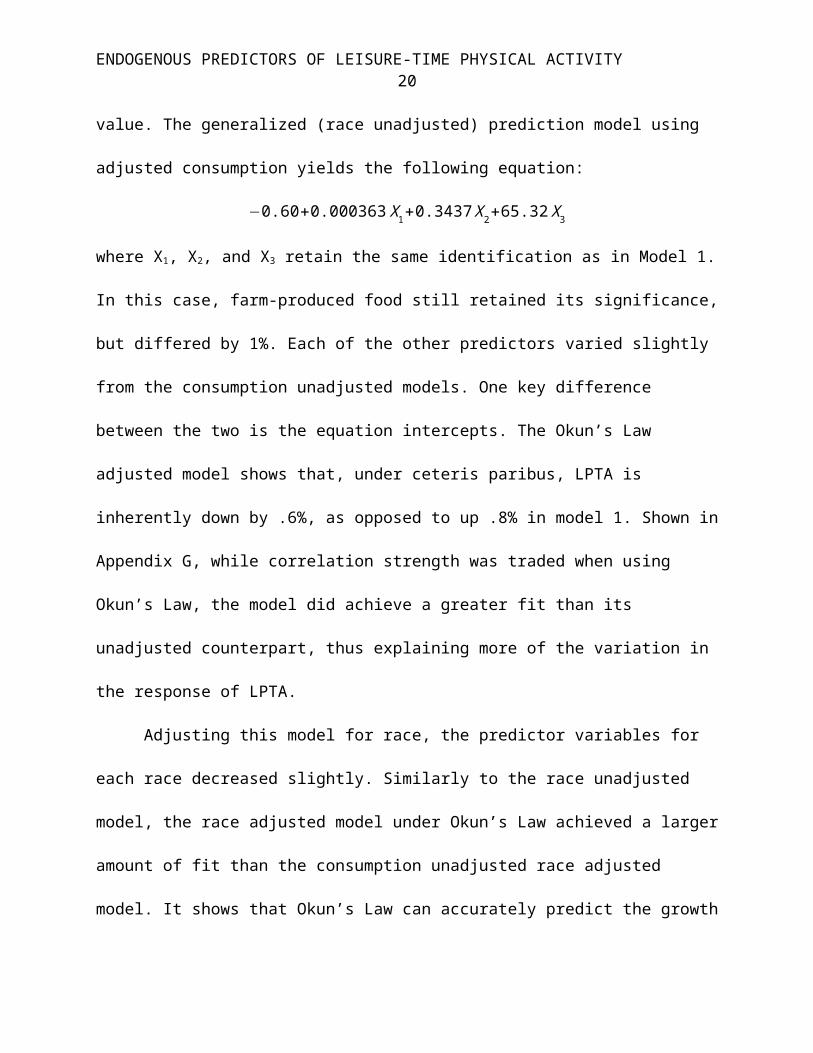
actual value. The generalized (race unadjusted) prediction model using adjusted consumption
yields the following equation:
−0.60+0.000363 X1+0.3437 X2+65.32 X3
where X1, X2, and X3 retain the same identification as in Model 1. In this case, farm-produced
food still retained its significance, but differed by 1%. Each of the other predictors varied slightly
from the consumption unadjusted models. One key difference between the two is the equation
intercepts. The Okun’s Law adjusted model shows that, under ceteris paribus, LPTA is
inherently down by .6%, as opposed to up .8% in model 1. Shown in Appendix G, while
correlation strength was traded when using Okun’s Law, the model did achieve a greater fit than
its unadjusted counterpart, thus explaining more of the variation in the response of LPTA.
Adjusting this model for race, the predictor variables for each race decreased slightly.
Similarly to the race unadjusted model, the race adjusted model under Okun’s Law achieved a
larger amount of fit than the consumption unadjusted race adjusted model. It shows that Okun’s
Law can accurately predict the growth or decline of LPTA given inputs for unemployment and
specific expenditures, showing a higher likelihood across the four races for engaging in and
meeting LPTA minimum standards. Appendix H shows the model equations using Okun’s law
consumption and race adjustment.
Summary, Conclusion, and Future Study
Identified in the research, the prevailing factors that help determine engagement in LPTA
are unemployment, diet, and socioeconomic status. Using data on each variable, statistical
significance was found on each predictor identified. Market demand for the health, determined
by the summation of the individual demands, can then be used by the U.S. Department of Health
and Human Services to create programs that effectively reduce market failures in this area. One
ENDOGENOUS PREDICTORS OF LEISURE-TIME PHYSICAL ACTIVITY13
major finding is that race does have an impact on reported LPTA, in particular, for the
Hispanic/Latino population which reported the lowest likelihood to engage in physical activity.
Coupled with their low ranking in per-capita GDP, states that have large populations of
Hispanics would be better served to encourage participation of physical activity through
education. Indicated by Arvidson et al. (2013), stimulating a balanced life outside of work for
them would be crucial to increasing their expenditures in the market, and, ultimately, their
LPTA.
While the results aligned with expectations based on the research and intuitive by nature,
there are three findings that could be considered for future study. First, based on predicted
models, it can be statistically seen that farm-produced foods is endogenous with physical
activity. A way this can be further researched is to look at the consumer price index for food
products over the years. Due to the limitation of available data for physical activity, a more
robust model will be difficult to create; however, changing food prices only strengthens the
substitution effect on consumer choices. It is possible that food prices have a larger correlation
with activity and can be looked into. If that is the case, business and nonprofits specializing in
community outreach can focus their efforts into emphasizing the positive view of diet and
exercise, as opposed to the normative view. Based on the significance of the data at the 95%
level, the normative view will not influence public choice as it is merely an opinion rather than
fact. Second, Okun’s law can be used as a way to forecast leisure time physical activity. By only
capturing the specific consumption to study and using an unadjusted race model, a higher degree
of confidence was attained. Firms that specialize in physical activity would be best served to
open in areas that feature the Hispanic population. Also, firms that specialize in farm-produced
foods should consider partnering with Asian restaurants and predominantly Asian areas. Their
ENDOGENOUS PREDICTORS OF LEISURE-TIME PHYSICAL ACTIVITY14
mean consumption on proper food was only half of their per-capita consumption, compared to
double for the Black and Hispanic populations and almost 9 times for the White/Caucasian
population. Lastly, unemployment has a large significance in leisure-time physical activity. The
highest unemployment rate was seen in the Black/African American populations. This is an area
where gyms and fitness services could take advantage of as it would serve the purpose of
reducing unemployment for this group as well as increase aggregate LPTA. Areas that have a
significantly large population of African American unemployment would benefit most from this
due to being endogenous to physical activity.
ENDOGENOUS PREDICTORS OF LEISURE-TIME PHYSICAL ACTIVITY15
References
Adetunji, H. (2009). Economics of health. In Key concepts in public health. London, United
Kingdom: Sage UK
Arvidson, E., Börjesson, M., Ahlborg, G., Lindegård, A., & Jonsdottir, I. (2013). The level of
leisure time physical activity is associated with work ability-a cross sectional and
prospective study of health care workers. BMC Public Health, (13), 855-855.
Ashraf, Q., Lester, A., & Weil, D. (2008). When Does Improving Health Raise GDP? NBER
Macroeconomics Annual, (144), 157-204.
Brennan, D. S., & Singh, K. A. (2012). Dietary, self-reported oral health and socio-demographic
predictors of general health status among older adults. The Journal of Nutrition, Health
& Aging, 16(5), 437-41. doi:http://dx.doi.org/10.1007/s12603-012-0006-3
Charts by Topic: Leisure and sports activities. (2014, September 30). Retrieved April 15, 2015,
from http://www.bls.gov/TUS/CHARTS/LEISURE.HTM
Consumer Expenditure Survey - U.S. Bureau of Labor Statistics. (2015, April 2). Retrieved April
19, 2015, from http://www.bls.gov/cex/#data
Current Cigarette Smoking Among Adults in the United States. (2015, January 23). Retrieved
April 15, 2015, from http://www.cdc.gov/tobacco/data_statistics/fact_sheets/adult_data/
cig_smoking/
De Jasay, A. (2006, October 2). The Failure of Market Failure. Part I. The Problem of Contract
Enforcement. Retrieved April 15, 2015, from
http://econlib.org/library/Columns/y2006/Jasayfailure.html
Fladlein, M. (2009, June 17). Mikeroeconomics. Retrieved April 18, 2015, from
http://mikeroeconomics.blogspot.com/2009/06/growth-rate-form-of-okuns-law.html
ENDOGENOUS PREDICTORS OF LEISURE-TIME PHYSICAL ACTIVITY16
Janlert, U. (2009). Economic crisis, unemployment and public health. Scandinavian Journal of
Public Health, (37), 783-784.
Merit Goods. (2015, January 1). Retrieved April 15, 2015, from
http://www.economicsonline.co.uk/Market_failures/Merit_goods.html
Normand, C. (1991). Economics, health, and the economics of health. BMJ, 303(6817), 1572-
1577.
Overweight and Obesity Statistics. (2012, October 1). Retrieved April 15, 2015, from
http://www.niddk.nih.gov/health-information/health-statistics/Pages/overweight-obesity-
statistics.aspx
Principal-Agent Problem Definition | Investopedia. (2010, November 29). Retrieved April 16,
2015, from http://www.investopedia.com/terms/p/principal-agent-problem.asp
Shields, M., & Shooshtari, S. (2001). Determinants of self-perceived health. Health Reports,
13(1), 35-52. Retrieved from
http://ezproxy.snhu.edu/login?url=http://search.proquest.com/docview/207491544?
accountid=3783
Table A-2. Employment status of the civilian population by race, sex, and age - Bureau of Labor
Statistics. (2015, April 3). Retrieved April 19, 2015, from
http://www.bls.gov/news.release/empsit.t02.htmhttp://www.bls.gov/news.release/
empsit.t02.htm
Table 68. Participation in leisure-time aerobic and muscle-strengthening activities that meet the
federal 2008 Physical Activity Guidelines for Americans among adults aged 18 and over,
by selected characteristics: United States, selected years 1998-2012 - Centers for Disease
ENDOGENOUS PREDICTORS OF LEISURE-TIME PHYSICAL ACTIVITY17
Control and Prevention. (2015, January 6). Retrieved April 19, 2015, from
http://www.cdc.gov/nchs/hus/contents2013.htm#068
Wichstrøm, L., Soest, T., & Kvalem, I. (2012). Predictors of growth and decline in leisure time
physical activity from adolescence to adulthood. Health Psychology, 775-784
ENDOGENOUS PREDICTORS OF LEISURE-TIME PHYSICAL ACTIVITY18
Column1Appendix A:
Descriptive StatisticsColumn
2Column
3
Variable Race Mean StDev
Dependent VariablePercent meeting Federal LPTA minimum
Asian 14.81 2.007Black/African American 14.98 2.225Hispanic/Latino 12.11 2.286White 18.92 2.051
Explanatory Variables
Farm-Prod Food ConsumptionAsian 0.5251 0.1229Black/African American 2.1036 0.2308Hispanic/Latino 2.977 0.593White 9.332 0.841
Farm-Prod Food Consumption (Okun's Prediction)
Asian 0.5301 0.1251Black/African American 2.458 0.423Hispanic/Latino 3.235 0.805White 9.541 1.149
UnemploymentAsian 0.05534 0.00397Black/African American 0.11882 0.02911Hispanic/Latino 0.08547 0.02787White 0.0601 0.01871
Per Capita GDPAsian 31120 1478Black/African American 19508 552Hispanic/Latino 16889 640White 34111 553
ENDOGENOUS PREDICTORS OF LEISURE-TIME PHYSICAL ACTIVITY19
24211815129
40
30
20
10
0
24211815129
40
30
20
10
0
Mean 14.81StDev 2.007N 10
Asian
Mean 14.98StDev 2.225N 10
Black/African American
Mean 12.11StDev 2.286N 10
Hispanic/Latino
Mean 18.92StDev 2.051N 10
White
Asian
Percent meeting Leisure time PA
Perc
ent
Black/African American
Hispanic/Latino White
Normal
Panel variable: Race
Appendix B: Frequency Distribution of LPTA reporting by Race
100
0
100
0
Mean 0.5251StDev 0.1229N 10
Asian
Mean 2.104StDev 0.2308N 10
Black/African American
Mean 2.977StDev 0.5927N 10
Hispanic/Latino
Mean 9.332StDev 0.8414N 10
White
Asian
Farm-Prod Food Consumption (GDP
Perc
ent
Black/African American
Hispanic/Latino White
Normal
Panel variable: Race
Appendix C: Distribution of Farm-Produced Food
ENDOGENOUS PREDICTORS OF LEISURE-TIME PHYSICAL ACTIVITY20
18.00%15.00%12.00%9.00%6.00%3.00%
100
75
50
25
0
18.00%15.00%12.00%9.00%6.00%3.00%
100
75
50
25
0
Mean 0.05534StDev 0.003968N 10
Asian
Mean 0.1188StDev 0.02911N 10
Black/African American
Mean 0.08547StDev 0.02787N 10
Hispanic/Latino
Mean 0.0601StDev 0.01871N 10
White
Asian
Unemployment
Perc
ent
Black/African American
Hispanic/Latino White
Normal
Panel variable: Race
Appendix D: Distribution of Unemployment
Percent mee = -0.82 + 0.000365 X1 + 0.3487 X2 + 68.01 X3
Step Change Step P Final P
3
2
1
Add X3
Add X1
Add X2
0.000
0.011
0.000
0.000
0.000
0.000
1007550250
R-Squared(adjusted) %
Unemployment
Farm-Prod Fo
Per Capita I
3020100
Increase in R-Squared %
Unemployment
Farm-Prod Fo
Per Capita I
100500
R-Squared %
X1: Per Capita I X2: Farm-Prod Fo X3: Unemployment
Final Model Equation
Model Building SequenceDisplays the order in which terms were added or removed.
Incremental Impact of X VariablesLong bars represent Xs that contribute the most new
information to the model.
Each X Regressed on All Other XsGray bars represent Xs that do not help explain
additional variation in Y.
A gray bar represents an X variable not in the model.
Appendix E: Unadjusted Consumption Model (race unadjusted)Model Building Report
ENDOGENOUS PREDICTORS OF LEISURE-TIME PHYSICAL ACTIVITY21
Asian Percent meeting = 35.88 - 0.000764 X1 + 1.518 X2 + 34.6 X3
Black/African Americ Percent meeting = 22.58 - 0.000764 X1 + 1.518 X2 + 34.6 X3
Hispanic/Latino Percent meeting = 17.54 - 0.000764 X1 + 1.518 X2 + 34.6 X3
White Percent meeting = 28.74 - 0.000764 X1 + 1.518 X2 + 34.6 X3
Race
X1: Per Capita I X2: Farm-Prod Fo X3: Unemployment X4: Race
Final Equations
Appendix F: Unadjusted Consumption Model (race adjusted)Model Equations Report
statistically significant (p < 0.10).The relationship between Y and the X variables in the model is
Yes No
0 0.1 > 0.5
P < 0.001
model.79.63% of the variation in Y can be explained by the regression
Low High
0% 100%
R-sq = 79.63%
range of values for Percent meet.settings for the X variables that correspond to a desired value orPercent meet for specific values of the X variables, or find theIf the model fits the data well, this equation can be used to predict X3: UnemploymentX2: Okuns law on farm prod food conX1: Per Capita Incomerelationship between Y and the X variables:The following terms are in the fitted equation that models the
20
15
10
Per Capita I Okuns law on Unemployment
Is there a relationship between Y and the X variables? Comments
Percent meet vs X Variables
not in the model.represents an X variableA gray background
Appendix G: Okun's Adjusted Model (race unadjusted)Summary Report
% of variation explained by the model
ENDOGENOUS PREDICTORS OF LEISURE-TIME PHYSICAL ACTIVITY22
Asian Percent meeting = 36.86 - 0.000776 X1 + 1.264 X2 + 25.5 X3
Black/African Americ Percent meeting = 23.97 - 0.000776 X1 + 1.264 X2 + 25.5 X3
Hispanic/Latino Percent meeting = 18.94 - 0.000776 X1 + 1.264 X2 + 25.5 X3
White Percent meeting = 31.78 - 0.000776 X1 + 1.264 X2 + 25.5 X3
Race
X1: Per Capita I X2: Okuns law on X3: Unemployment X4: Race
Final Equations
Appendix H: Okun's Law Consumption (race adjusted)Model Equations Report


