Embed Size (px)
Citation preview
Presenters:
The Most Important Approaches to Cutting
Health-Care Costs• Moderator, Jim Hanson, Montgomery, OH• Carey Adamson, Colonial Life• Robert Bendzick, Olmsted County, MN• John Sullivan, Anoka County, MN
Promote Wellness Proven Techniques for Gaining ROI
Presented by:
Objectives Proven cost-saving strategy
Assess the impact of outcomes-based wellness programs
Discover the connection between employee engagement and wellness program success
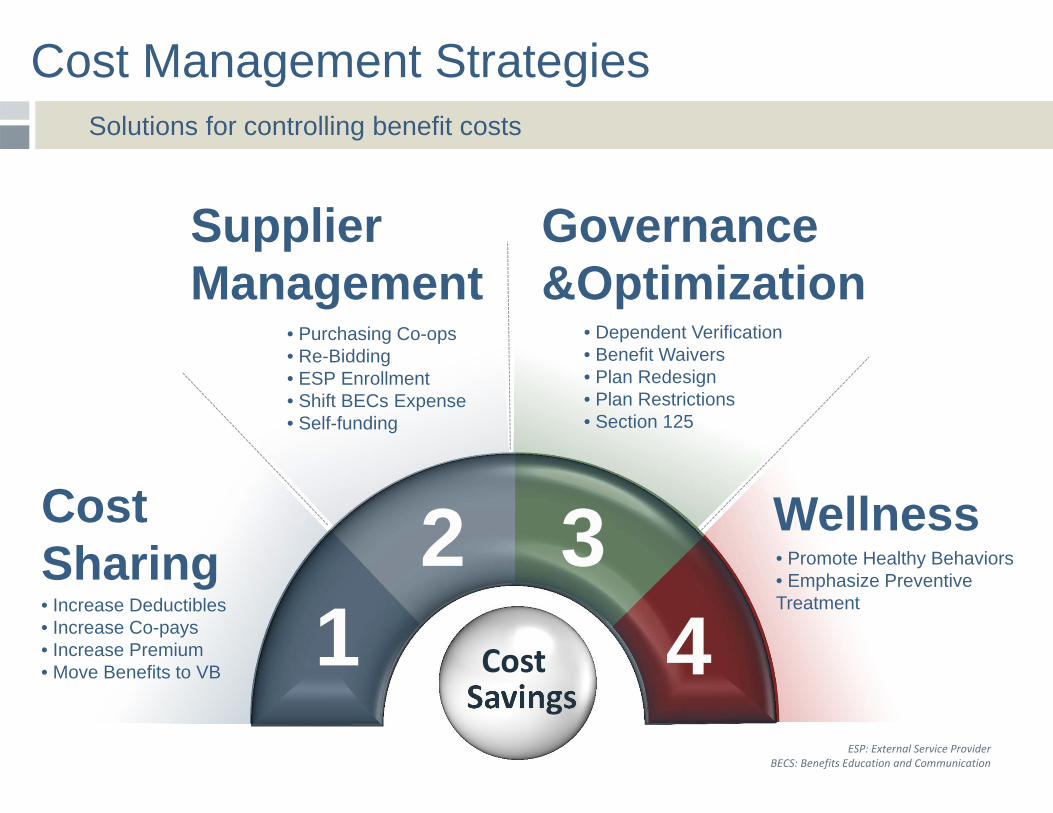
Solutions for controlling benefit costs
Cost Management Strategies
Savings
Cost Sharing
Wellness
Supplier Management
Governance &Optimization
12 3
4• Increase Deductibles• Increase Co-pays• Increase Premium• Move Benefits to VB
• Dependent Verification• Benefit Waivers• Plan Redesign • Plan Restrictions• Section 125
• Purchasing Co-ops• Re-Bidding• ESP Enrollment• Shift BECs Expense• Self-funding
• Promote Healthy Behaviors• Emphasize Preventive Treatment
ESP: External Service ProviderBECS: Benefits Education and Communication
Cost
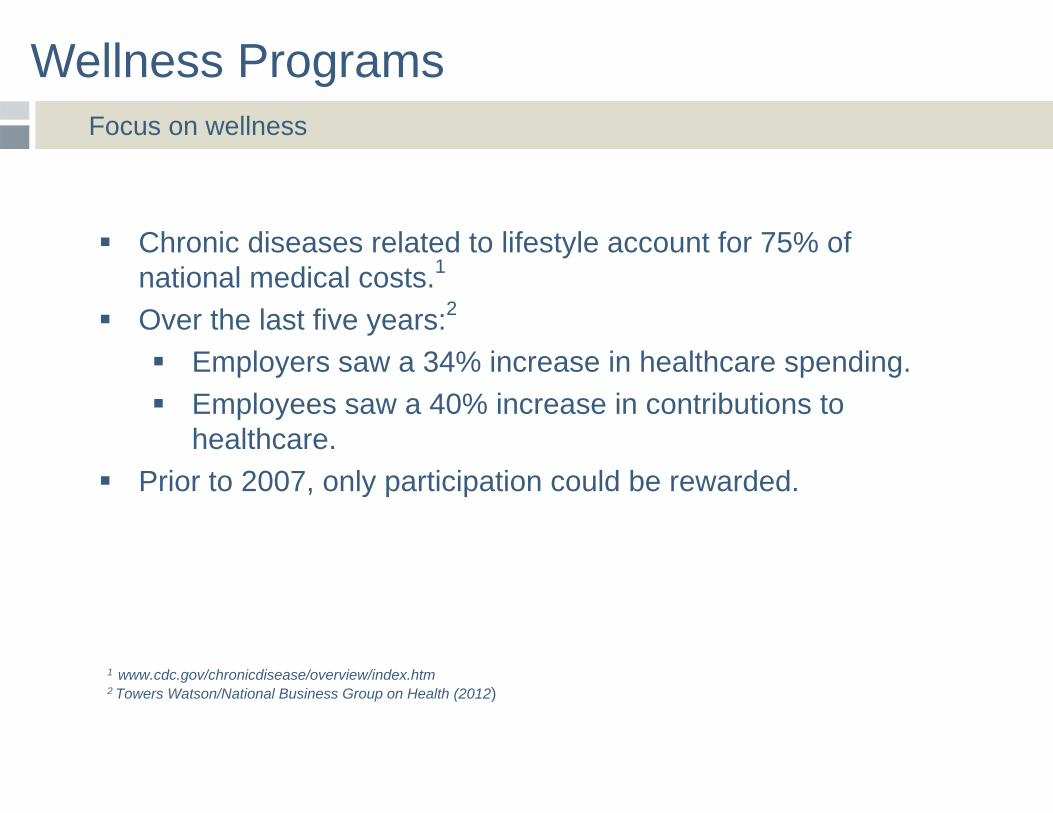
Wellness Programs Focus on wellness
Chronic diseases related to lifestyle account for 75% of national medical costs.1
Over the last five years:2
Employers saw a 34% increase in healthcare spending. Employees saw a 40% increase in contributions to
healthcare. Prior to 2007, only participation could be rewarded.
1 www.cdc.gov/chronicdisease/overview/index.htm2 Towers Watson/National Business Group on Health (2012)
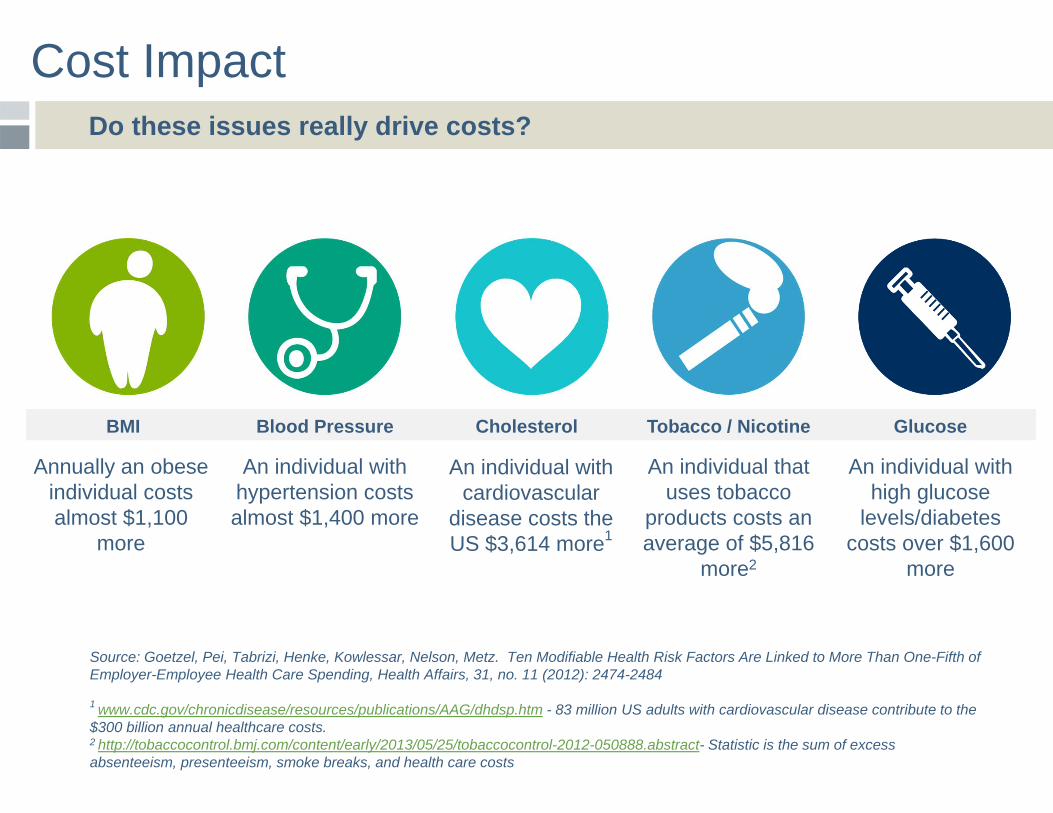
Cost Impact Do these issues really drive costs?
An individual with hypertension costs almost $1,400 more
An individual with cardiovascular
disease costs the US $3,614 more1
An individual that uses tobacco
products costs an average of $5,816
more2
An individual with high glucose
levels/diabetes costs over $1,600
more
Annually an obese individual costs almost $1,100
more
BMI Blood Pressure Cholesterol Tobacco / Nicotine Glucose
Source: Goetzel, Pei, Tabrizi, Henke, Kowlessar, Nelson, Metz. Ten Modifiable Health Risk Factors Are Linked to More Than One-Fifth of Employer-Employee Health Care Spending, Health Affairs, 31, no. 11 (2012): 2474-2484
1 www.cdc.gov/chronicdisease/resources/publications/AAG/dhdsp.htm - 83 million US adults with cardiovascular disease contribute to the $300 billion annual healthcare costs.2 http://tobaccocontrol.bmj.com/content/early/2013/05/25/tobaccocontrol-2012-050888.abstract- Statistic is the sum of excess absenteeism, presenteeism, smoke breaks, and health care costs
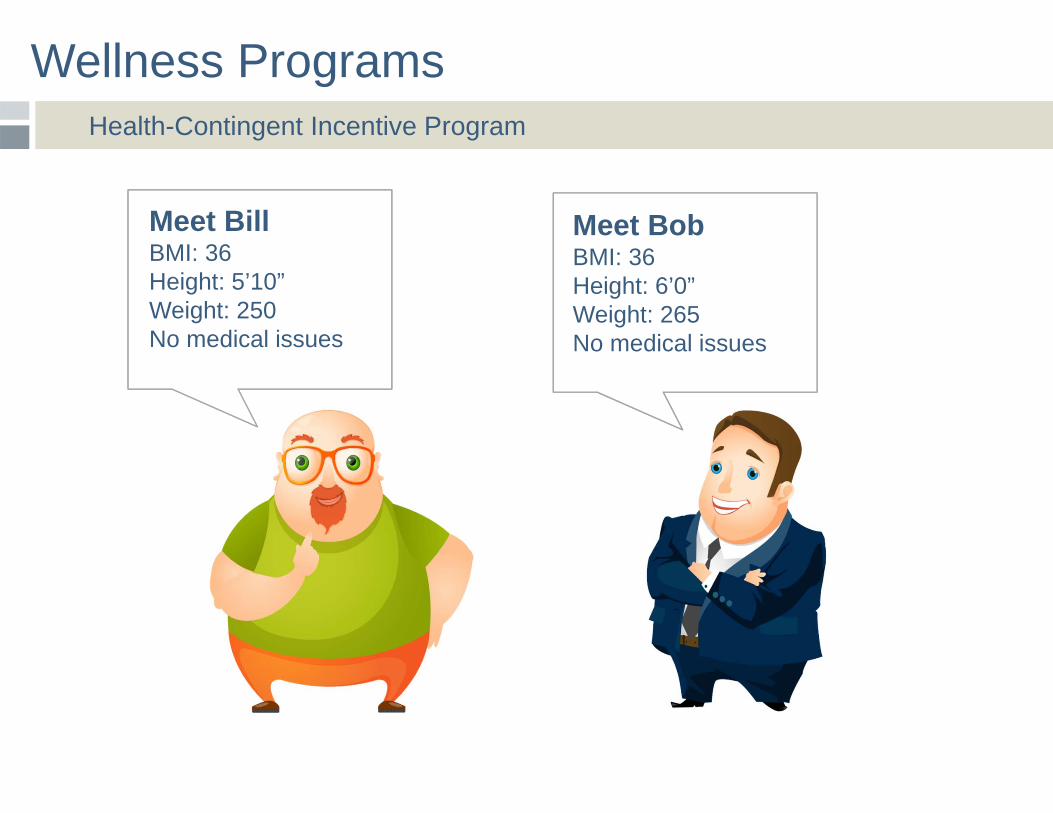
Wellness Programs Health-Contingent Incentive Program
Meet BillBMI: 36Height: 5’10”Weight: 250No medical issues
Meet BobBMI: 36Height: 6’0”Weight: 265No medical issues
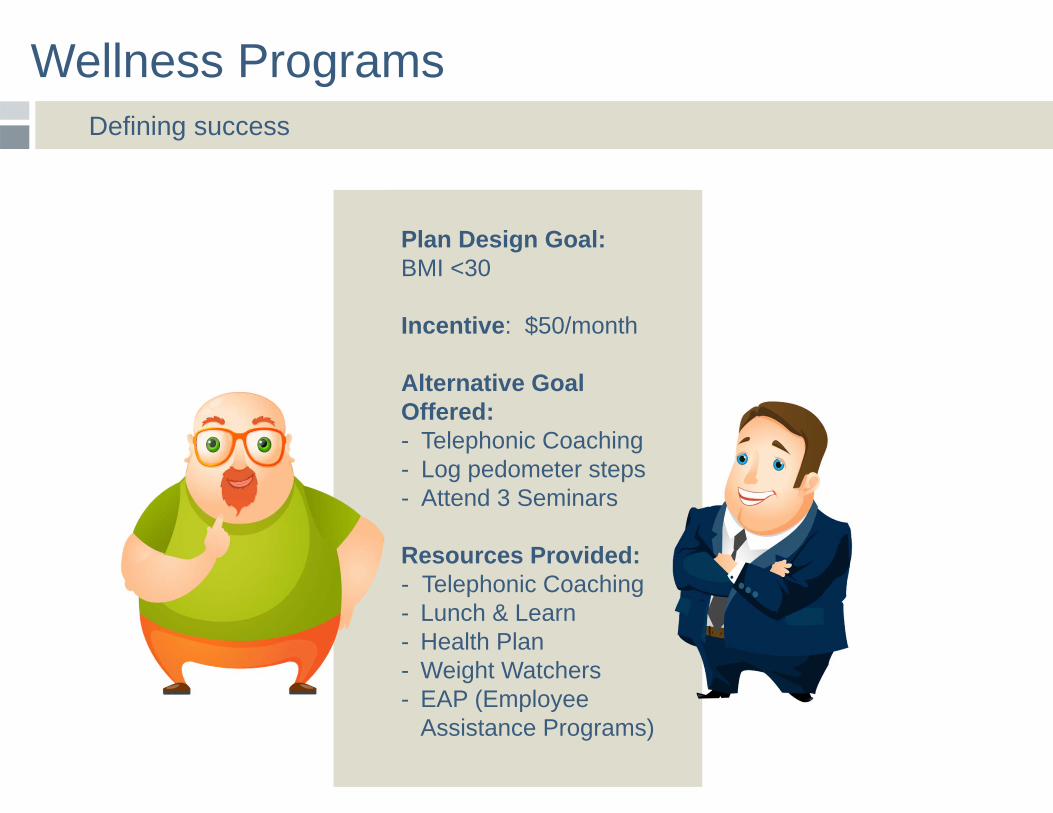
Wellness Programs Defining success
Plan Design Goal: BMI <30
Incentive: $50/month
Alternative Goal Offered:- Telephonic Coaching- Log pedometer steps- Attend 3 Seminars
Resources Provided:- Telephonic Coaching- Lunch & Learn- Health Plan- Weight Watchers- EAP (Employee
Assistance Programs)
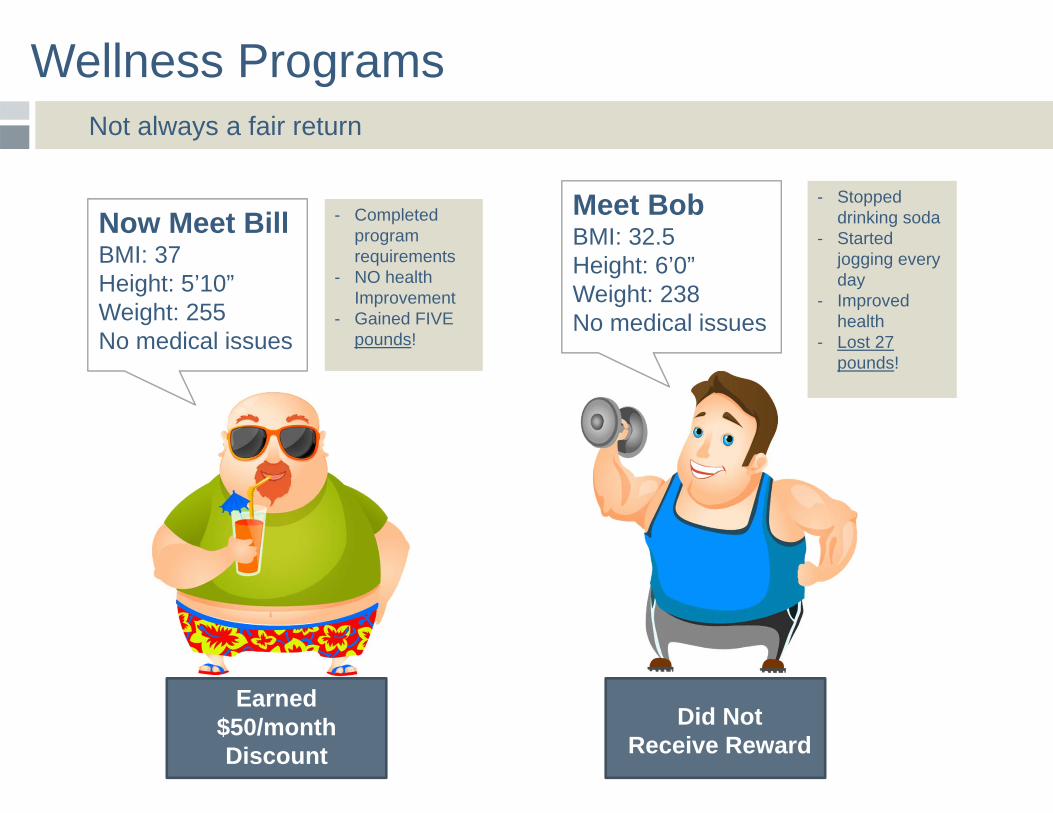
Wellness Programs Not always a fair return
- Completed program requirements
- NO health Improvement
- Gained FIVE pounds!
Now Meet BillBMI: 37Height: 5’10”Weight: 255No medical issues
Meet BobBMI: 32.5Height: 6’0”Weight: 238No medical issues
Did Not Receive Reward
Earned $50/month Discount
- Stopped drinking soda
- Started jogging every day
- Improved health
- Lost 27 pounds!
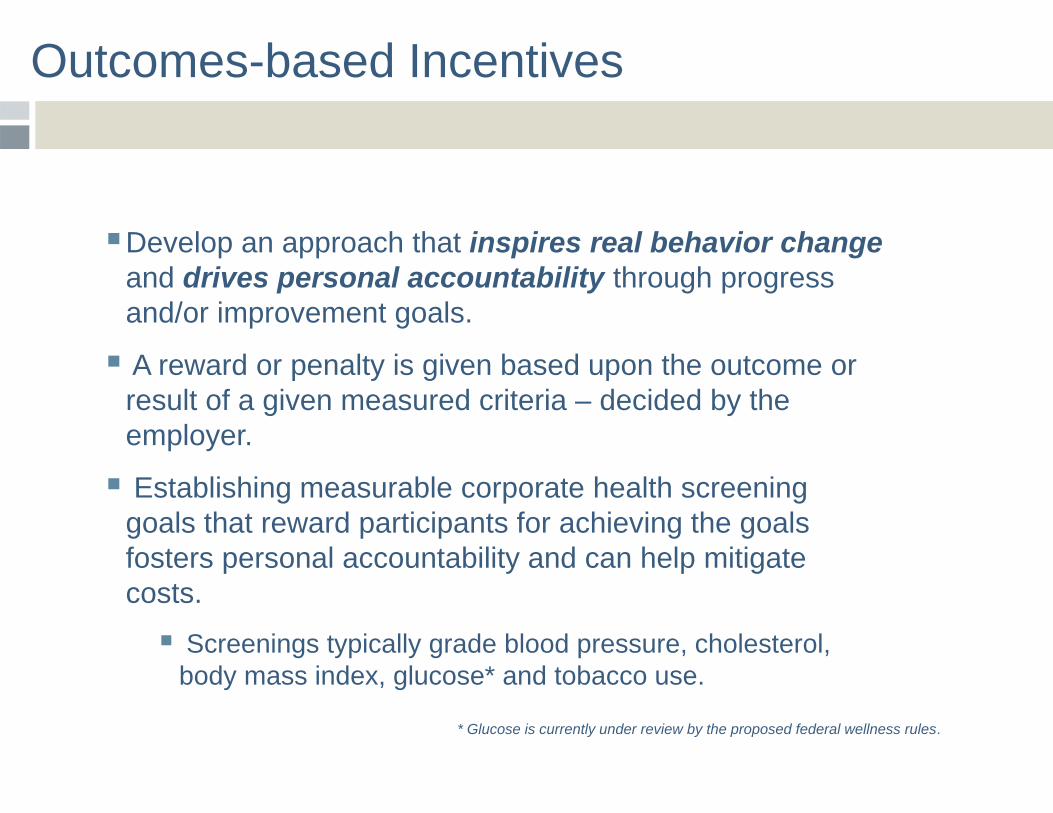
Outcomes-based Incentives
Develop an approach that inspires real behavior change and drives personal accountability through progress and/or improvement goals.
A reward or penalty is given based upon the outcome or result of a given measured criteria – decided by the employer.
Establishing measurable corporate health screening goals that reward participants for achieving the goals fosters personal accountability and can help mitigate costs.
Screenings typically grade blood pressure, cholesterol, body mass index, glucose* and tobacco use.
* Glucose is currently under review by the proposed federal wellness rules.
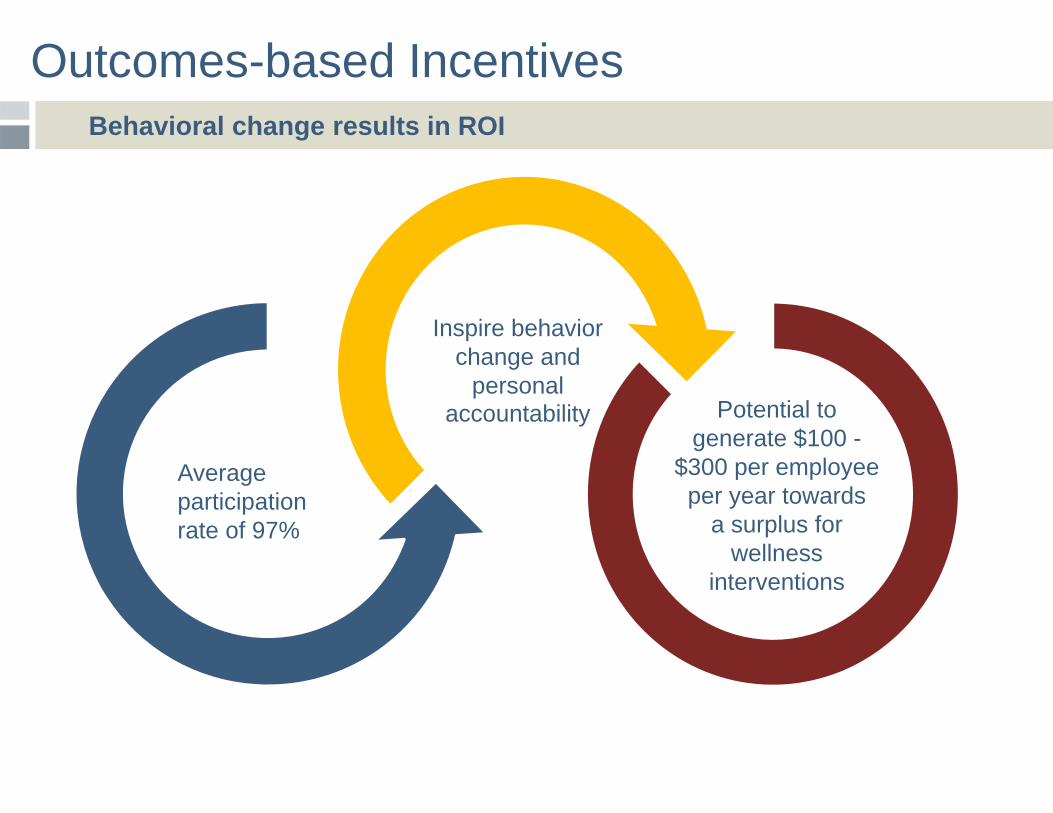
Outcomes-based Incentives Behavioral change results in ROI
Average participation rate of 97%
Inspire behavior change and
personal accountability Potential to
generate $100 -$300 per employee
per year towards a surplus for
wellness interventions
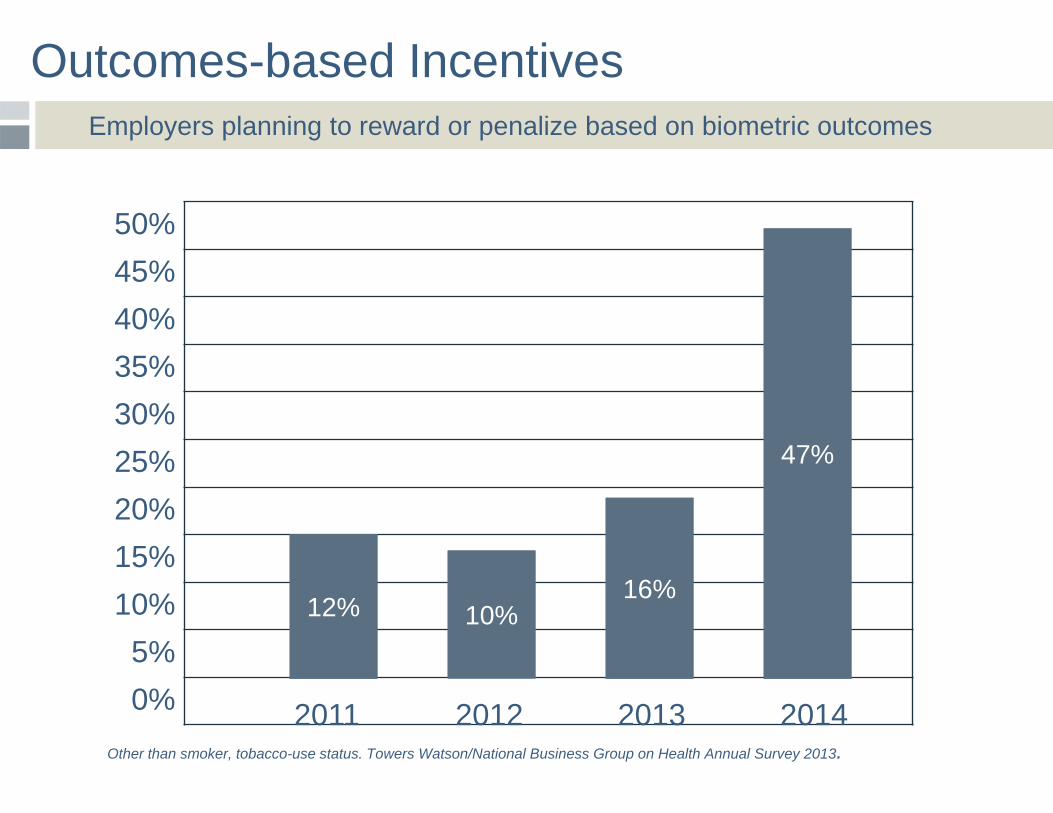
Outcomes-based Incentives Employers planning to reward or penalize based on biometric outcomes
12%12% 10%10%16%16%
47%47%
Other than smoker, tobacco-use status. Towers Watson/National Business Group on Health Annual Survey 2013.
50%45%40%35%30%25%20%15%10%
5%0% 2011 2012 2013 2014
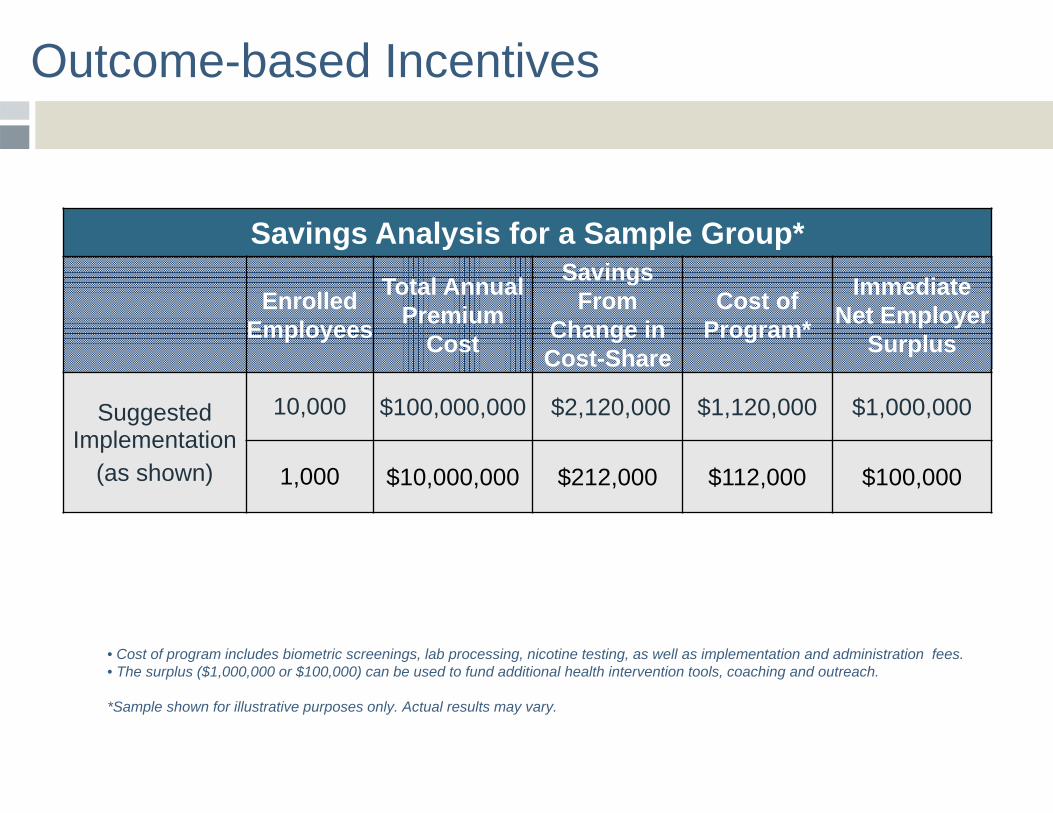
Outcome-based Incentives
Savings Analysis for a Sample Group*
Enrolled Employees
Total Annual Premium
Cost
Savings From
Change in Cost-Share
Cost of Program*
Immediate Net Employer
Surplus
Suggested Implementation
(as shown)
10,000 $100,000,000 $2,120,000 $1,120,000 $1,000,000
1,000 $10,000,000 $212,000 $112,000 $100,000
• Cost of program includes biometric screenings, lab processing, nicotine testing, as well as implementation and administration fees.• The surplus ($1,000,000 or $100,000) can be used to fund additional health intervention tools, coaching and outreach.
*Sample shown for illustrative purposes only. Actual results may vary.
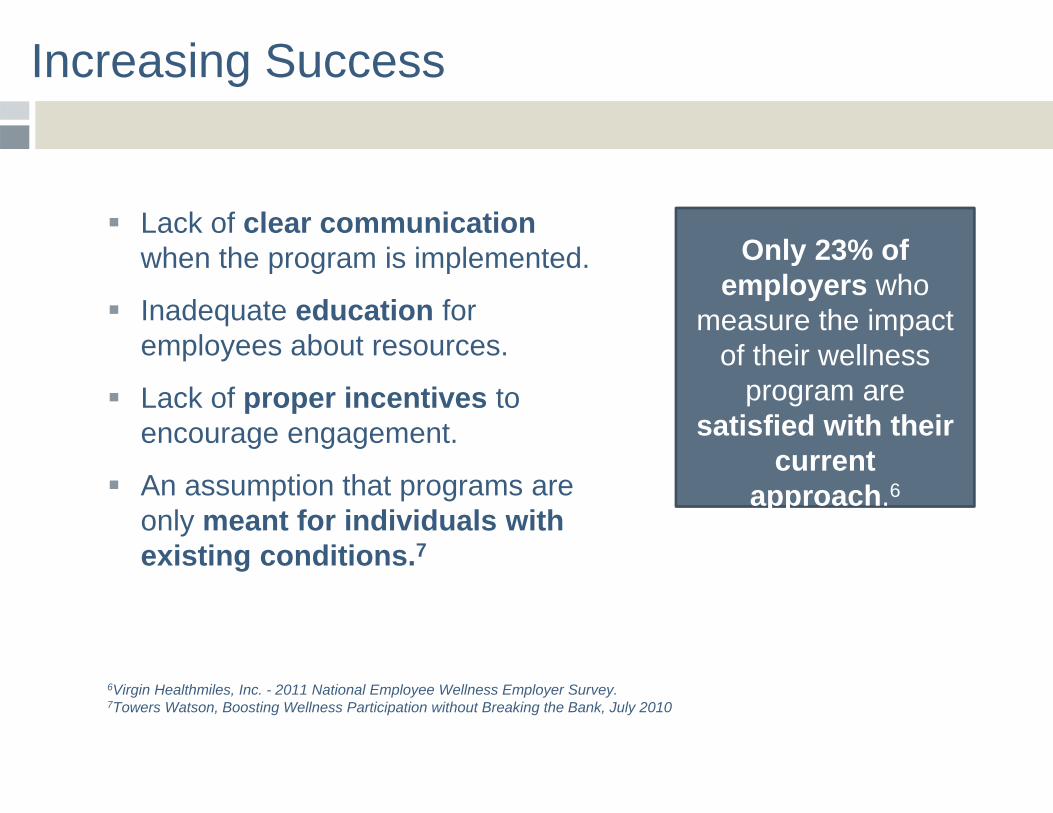
Increasing Success
Lack of clear communication when the program is implemented.
Inadequate education for employees about resources.
Lack of proper incentives to encourage engagement.
An assumption that programs are only meant for individuals with existing conditions.7
6Virgin Healthmiles, Inc. - 2011 National Employee Wellness Employer Survey. 7Towers Watson, Boosting Wellness Participation without Breaking the Bank, July 2010
Only 23% of employers who
measure the impact of their wellness
program are satisfied with their
current approach.6
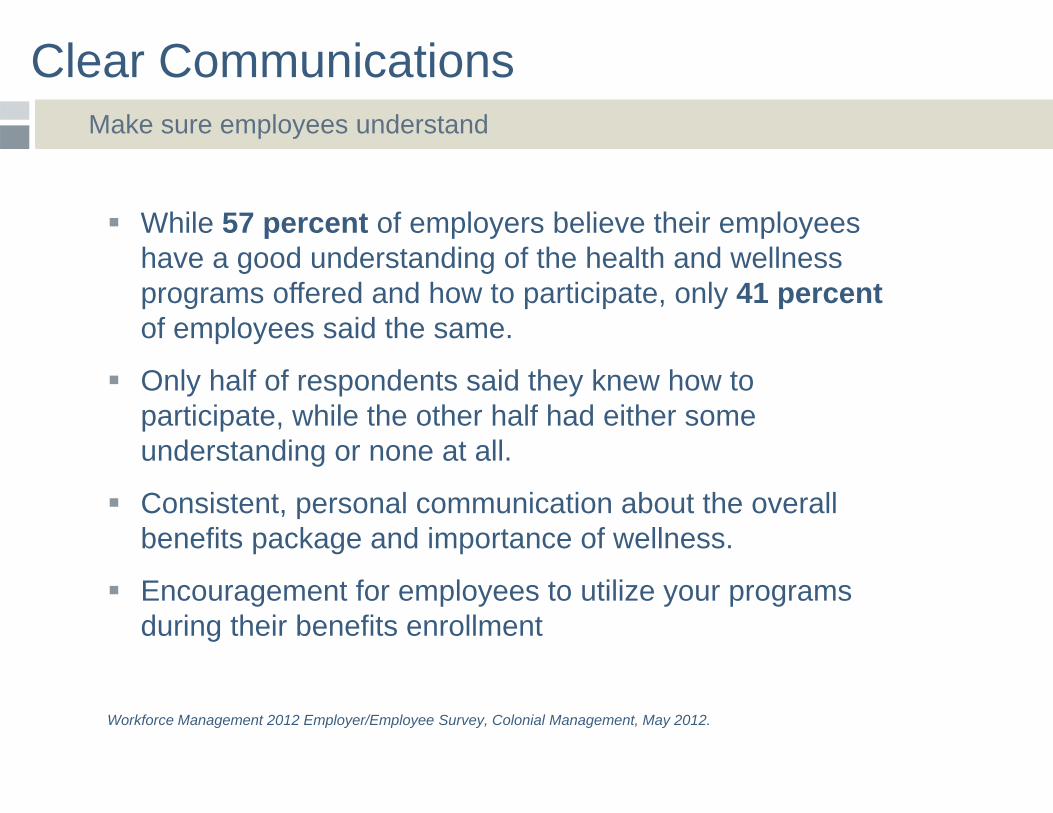
Clear Communications Make sure employees understand
While 57 percent of employers believe their employees have a good understanding of the health and wellness programs offered and how to participate, only 41 percent of employees said the same.
Only half of respondents said they knew how to participate, while the other half had either some understanding or none at all.
Consistent, personal communication about the overall benefits package and importance of wellness.
Encouragement for employees to utilize your programs during their benefits enrollment
Workforce Management 2012 Employer/Employee Survey, Colonial Management, May 2012.
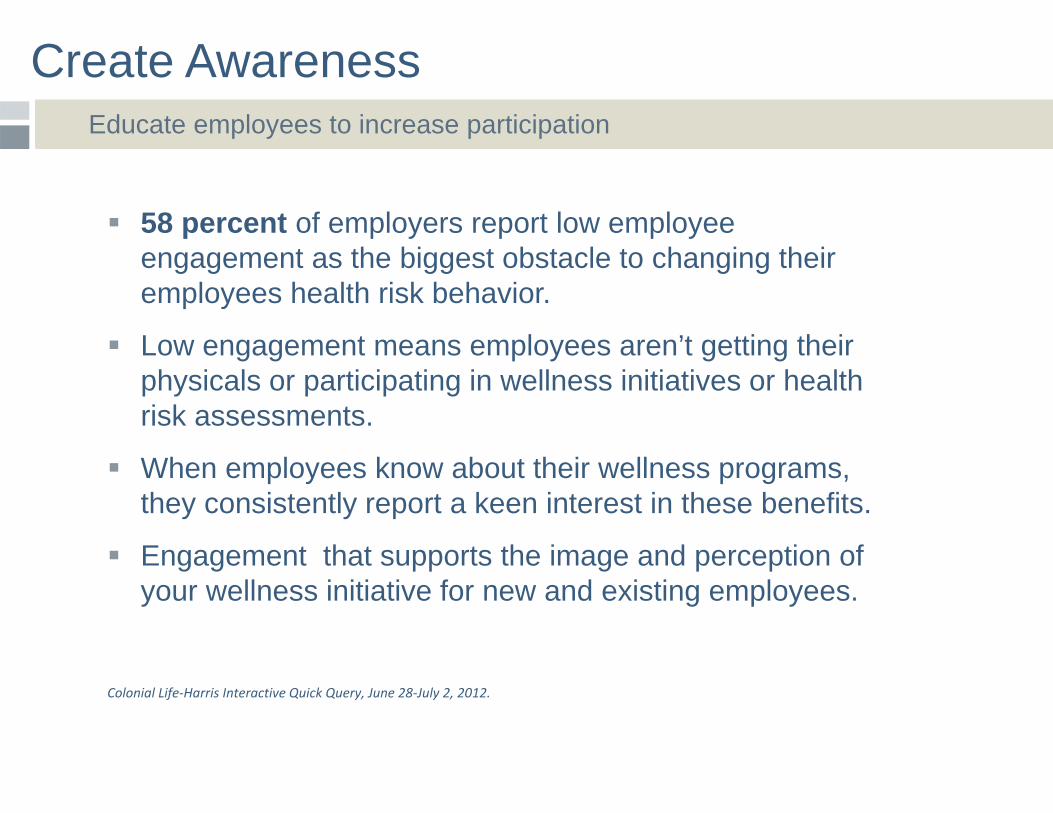
Create AwarenessEducate employees to increase participation
58 percent of employers report low employee engagement as the biggest obstacle to changing their employees health risk behavior.
Low engagement means employees aren’t getting their physicals or participating in wellness initiatives or health risk assessments.
When employees know about their wellness programs, they consistently report a keen interest in these benefits.
Engagement that supports the image and perception of your wellness initiative for new and existing employees.
Colonial Life‐Harris Interactive Quick Query, June 28‐July 2, 2012.

Utilization Produces Results
Healthier employees are more engaged and produce better business results for their employer1:
Organizations with top quartile engagement scores averaged 12% higher profitability than those with below average engagement.
Companies with most engaged workforces were: 27% more likely to report higher profitability 50% more likely to have lower staff turnover 38% more likely to have above average productivity
1 Aon Hewitt, Health Care Strategy After the 2012 Elections (Nov 2012)2 Towers Watson/National Business Group on Health (2012)
Yet healthcare costs continue to grow – trend of
5.9% expected.2
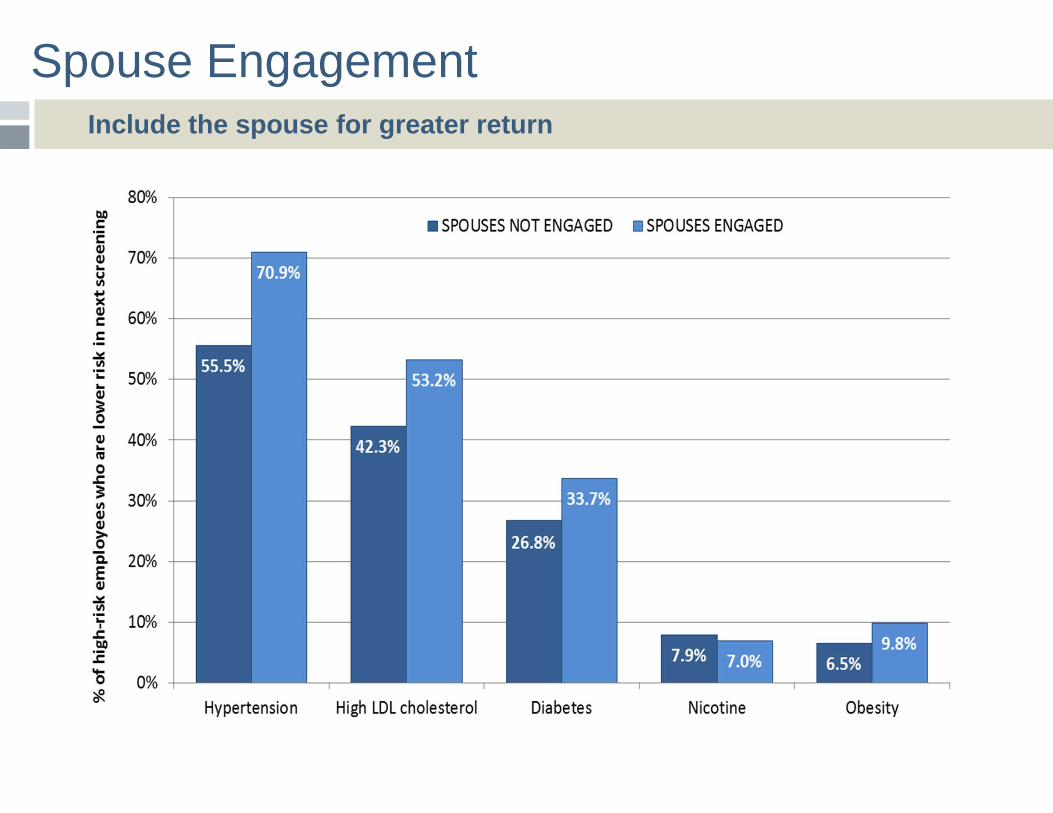
Spouse Engagement Include the spouse for greater return
Case Study The Challenge
Multi-location supermarket chain facing double-digit percentage premium increase on its health insurance plan.
Language barriers and difficulty helping workforce understand workings of health care system and company health insurance.
Case Study The Result
1-to-1 counseling sessions increase engagement and allowed employees to learn and ask questions about benefits and the new wellness initiative in their preferred languages.
The wellness initiative helped get the health care plan to an operating level well under its target premium.
Throughout the course of the enrollment process, significant savings were identified through verification and correction of personnel and dependent enrollment data.
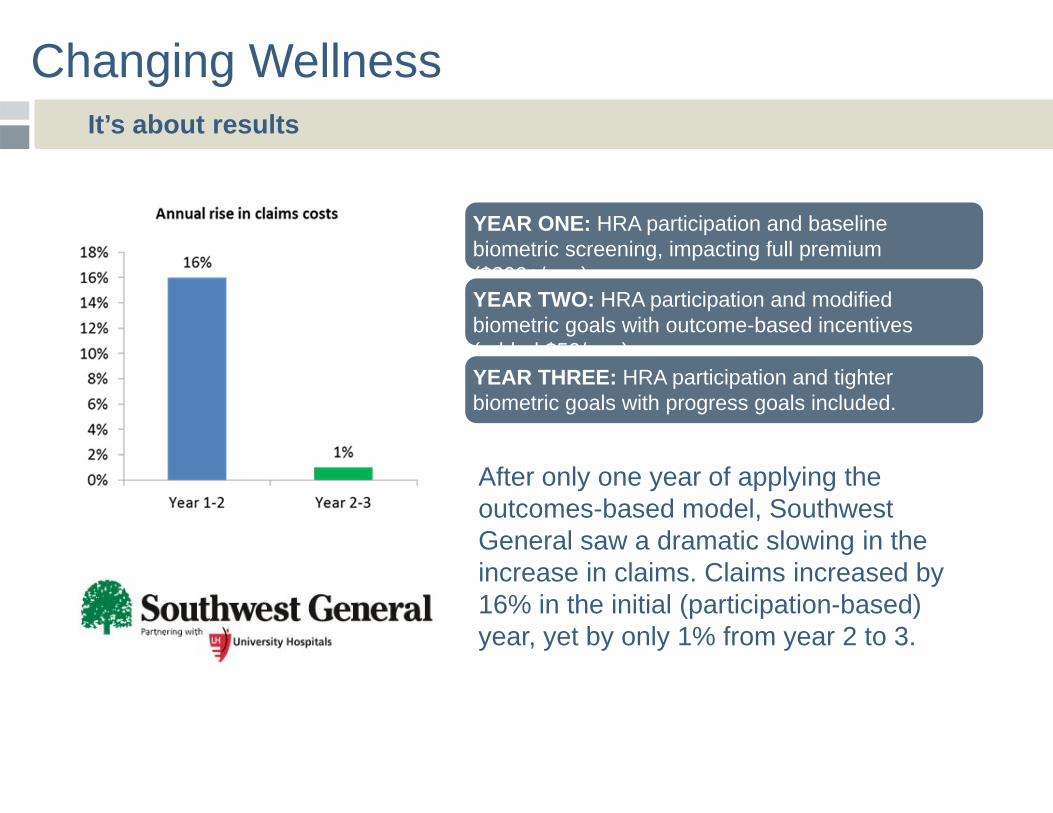
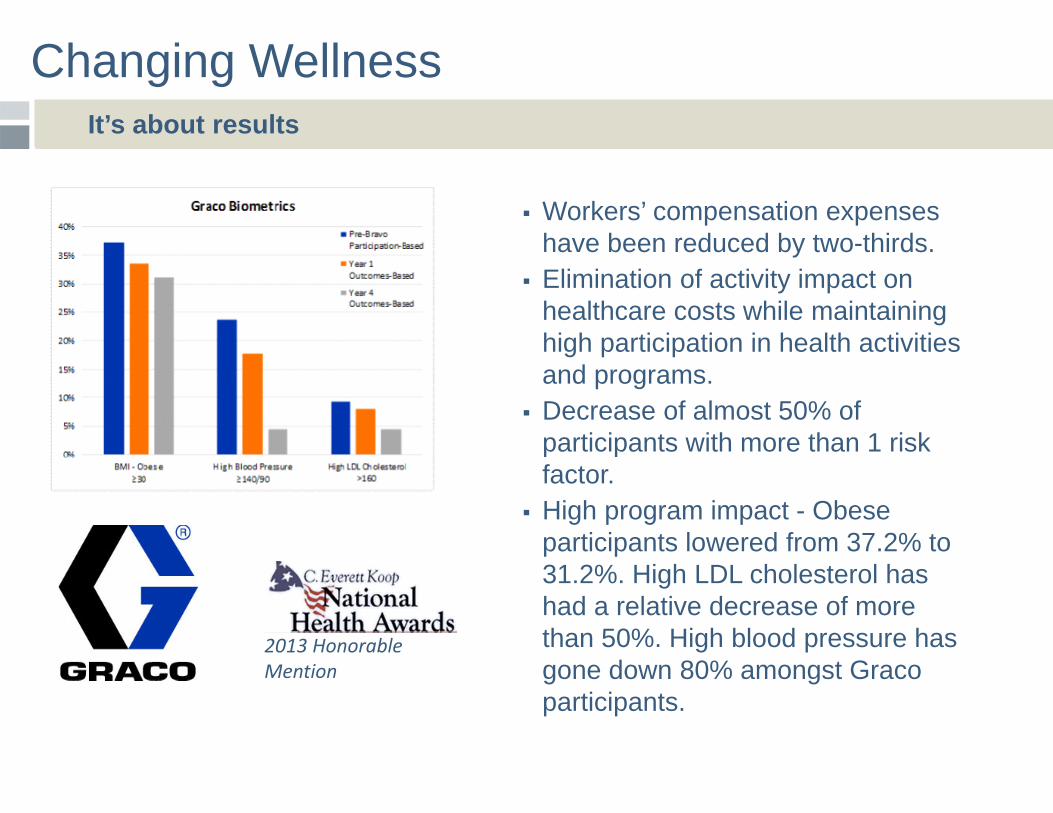
Changing Wellness It’s about results
YEAR ONE: HRA participation and baseline biometric screening, impacting full premium ($200+/mo.)
After only one year of applying the outcomes-based model, Southwest General saw a dramatic slowing in the increase in claims. Claims increased by 16% in the initial (participation-based) year, yet by only 1% from year 2 to 3.
YEAR TWO: HRA participation and modified biometric goals with outcome-based incentives (added $50/mo.)YEAR THREE: HRA participation and tighter biometric goals with progress goals included.
Changing Wellness It’s about results
Workers’ compensation expenses have been reduced by two-thirds.
Elimination of activity impact on healthcare costs while maintaining high participation in health activities and programs.
Decrease of almost 50% of participants with more than 1 risk factor.
High program impact - Obese participants lowered from 37.2% to 31.2%. High LDL cholesterol has had a relative decrease of more than 50%. High blood pressure has gone down 80% amongst Graco participants.
2013 Honorable Mention
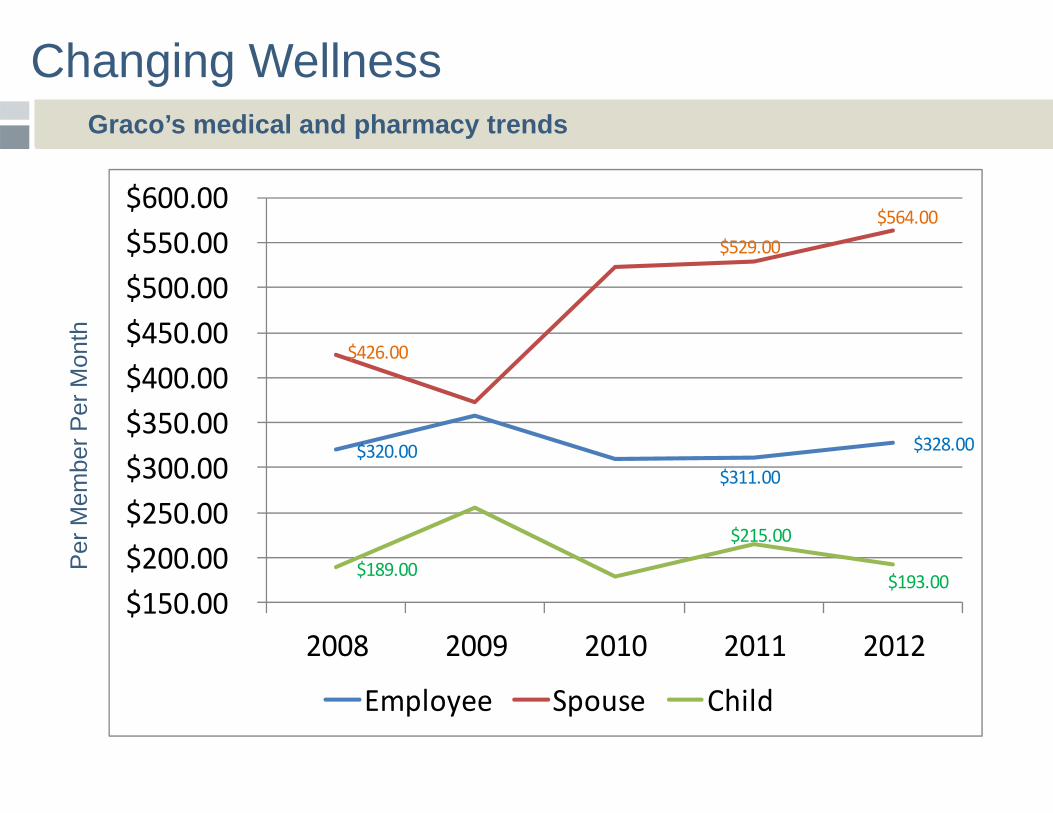
Changing Wellness Graco’s medical and pharmacy trends
$320.00 $311.00
$328.00
$426.00
$529.00 $564.00
$189.00
$215.00
$193.00 $150.00 $200.00 $250.00 $300.00 $350.00 $400.00 $450.00 $500.00 $550.00 $600.00
2008 2009 2010 2011 2012
Employee Spouse Child
Per
Mem
ber P
er M
onth
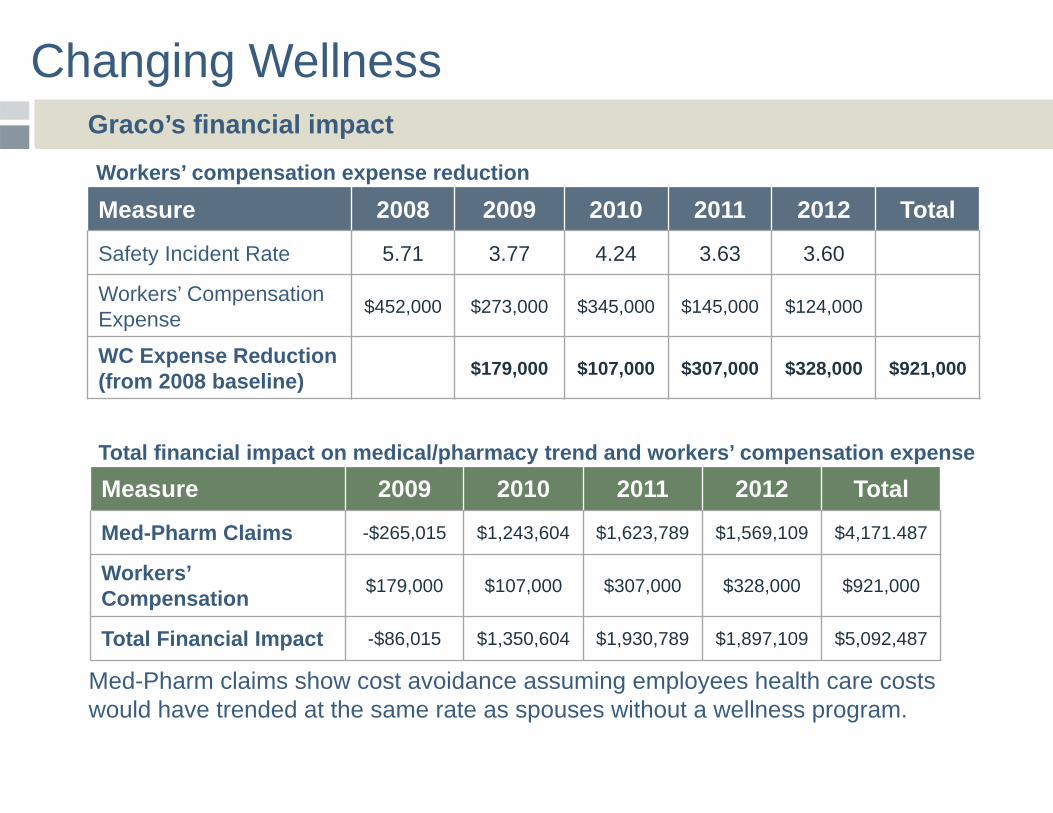
Changing Wellness Graco’s financial impact
Measure 2008 2009 2010 2011 2012 Total
Safety Incident Rate 5.71 3.77 4.24 3.63 3.60
Workers’ CompensationExpense $452,000 $273,000 $345,000 $145,000 $124,000
WC Expense Reduction (from 2008 baseline) $179,000 $107,000 $307,000 $328,000 $921,000
Measure 2009 2010 2011 2012 Total
Med-Pharm Claims -$265,015 $1,243,604 $1,623,789 $1,569,109 $4,171.487
Workers’ Compensation $179,000 $107,000 $307,000 $328,000 $921,000
Total Financial Impact -$86,015 $1,350,604 $1,930,789 $1,897,109 $5,092,487
Workers’ compensation expense reduction
Total financial impact on medical/pharmacy trend and workers’ compensation expense
Med-Pharm claims show cost avoidance assuming employees health care costs would have trended at the same rate as spouses without a wellness program.
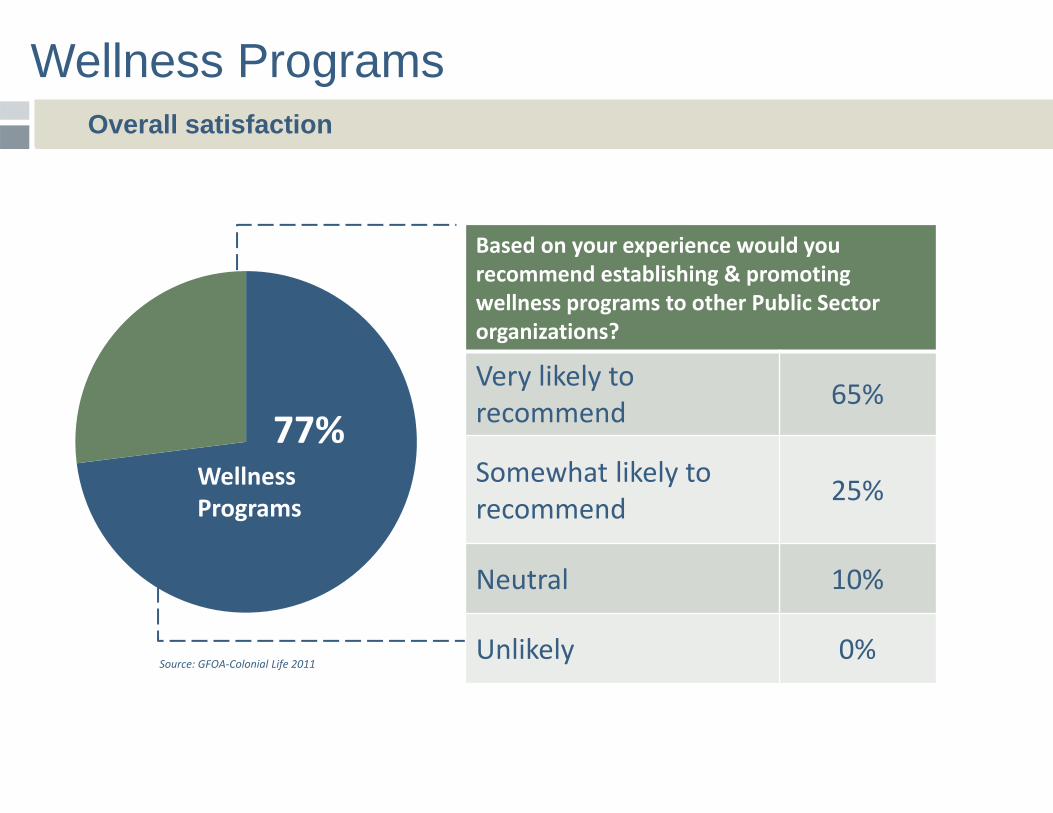
Wellness Programs
WellnessPrograms
77%
Based on your experience would you recommend establishing & promoting wellness programs to other Public Sector organizations?
Very likely to recommend 65%
Somewhat likely to recommend 25%
Neutral 10%
Unlikely 0%Source: GFOA‐Colonial Life 2011
Overall satisfaction
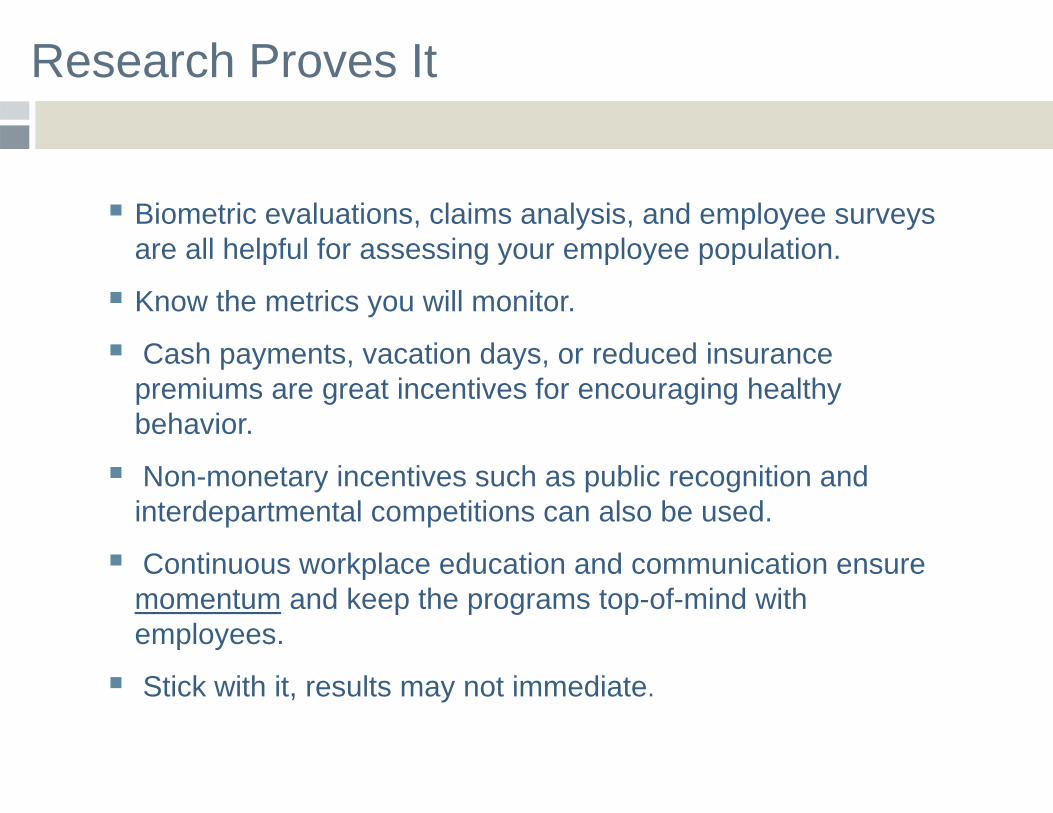
Research Proves It
Biometric evaluations, claims analysis, and employee surveys are all helpful for assessing your employee population.
Know the metrics you will monitor.
Cash payments, vacation days, or reduced insurance premiums are great incentives for encouraging healthy behavior.
Non-monetary incentives such as public recognition and interdepartmental competitions can also be used.
Continuous workplace education and communication ensure momentum and keep the programs top-of-mind with employees.
Stick with it, results may not immediate.
Background on Olmsted County
Controlling Health Care Costs
•8th largest county in Minnesota•Population of 150,000•County workforce of 1,105 FTEs•Home to Mayo Clinic, one of the nation’s preeminent healthcare providers•Only two medical care networks in the County
Background on our health plan - 1
Controlling Health Care Costs
•We’ve been self-insured for about 25 years.•We use a third party administrator for claims adjudication and advice.•We use Deloitte Consulting and Mercer for plan check-ups every 2 or 3 years to be sure we are still on track.•We buy aggregate and individual stop-loss insurance.
Background on our health plan - 2
Controlling Health Care Costs
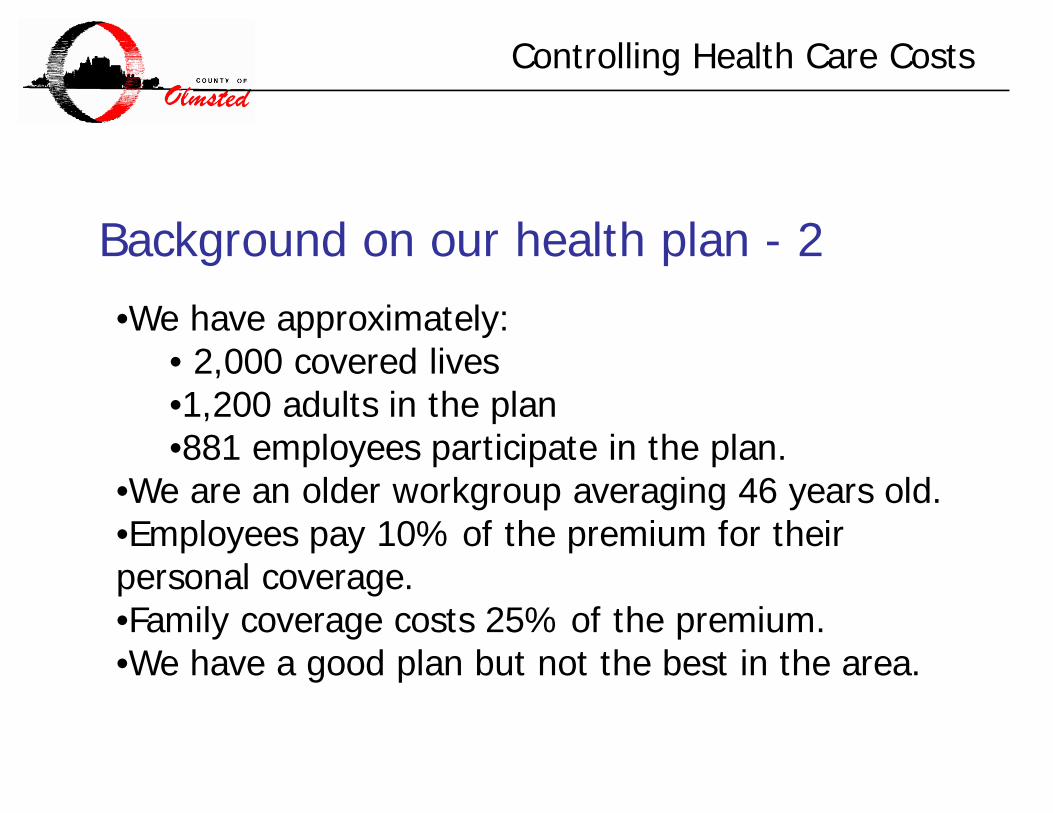
•We have approximately:• 2,000 covered lives•1,200 adults in the plan•881 employees participate in the plan.
•We are an older workgroup averaging 46 years old.•Employees pay 10% of the premium for their personal coverage.•Family coverage costs 25% of the premium.•We have a good plan but not the best in the area.
Background on our health plan - 3
Controlling Health Care Costs
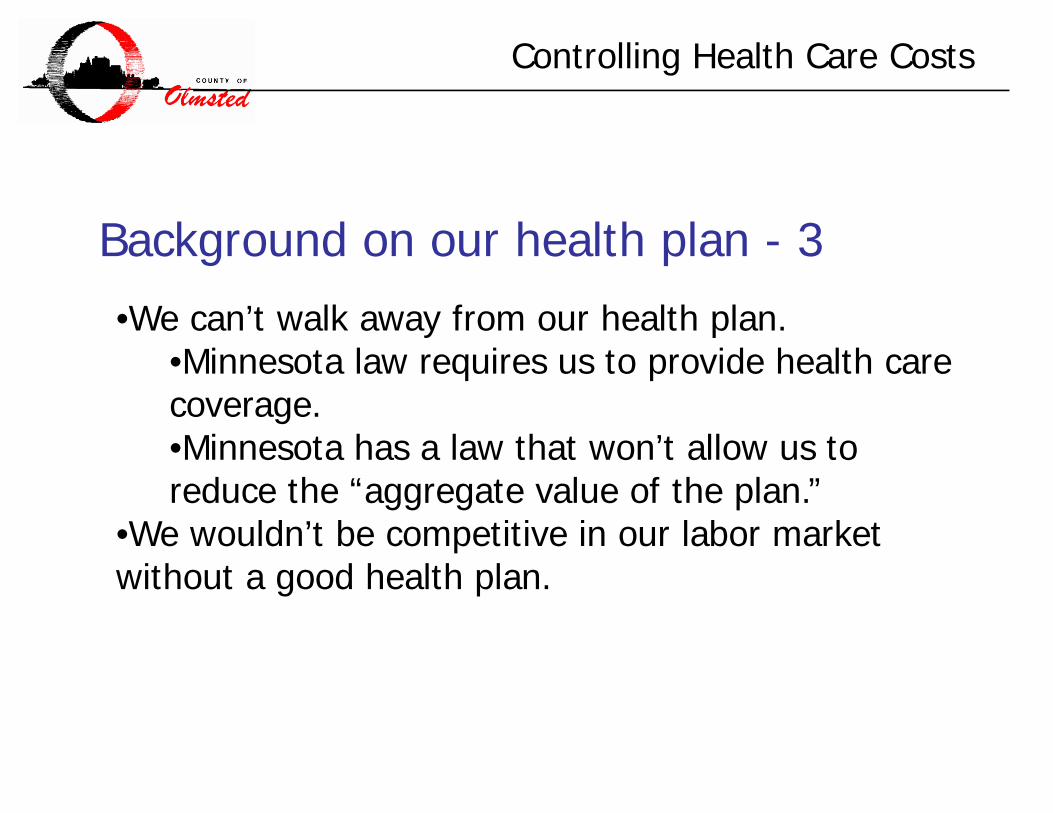
•We can’t walk away from our health plan.•Minnesota law requires us to provide health care coverage.•Minnesota has a law that won’t allow us to reduce the “aggregate value of the plan.”
•We wouldn’t be competitive in our labor market without a good health plan.
Background on our health plan - 4
Controlling Health Care Costs
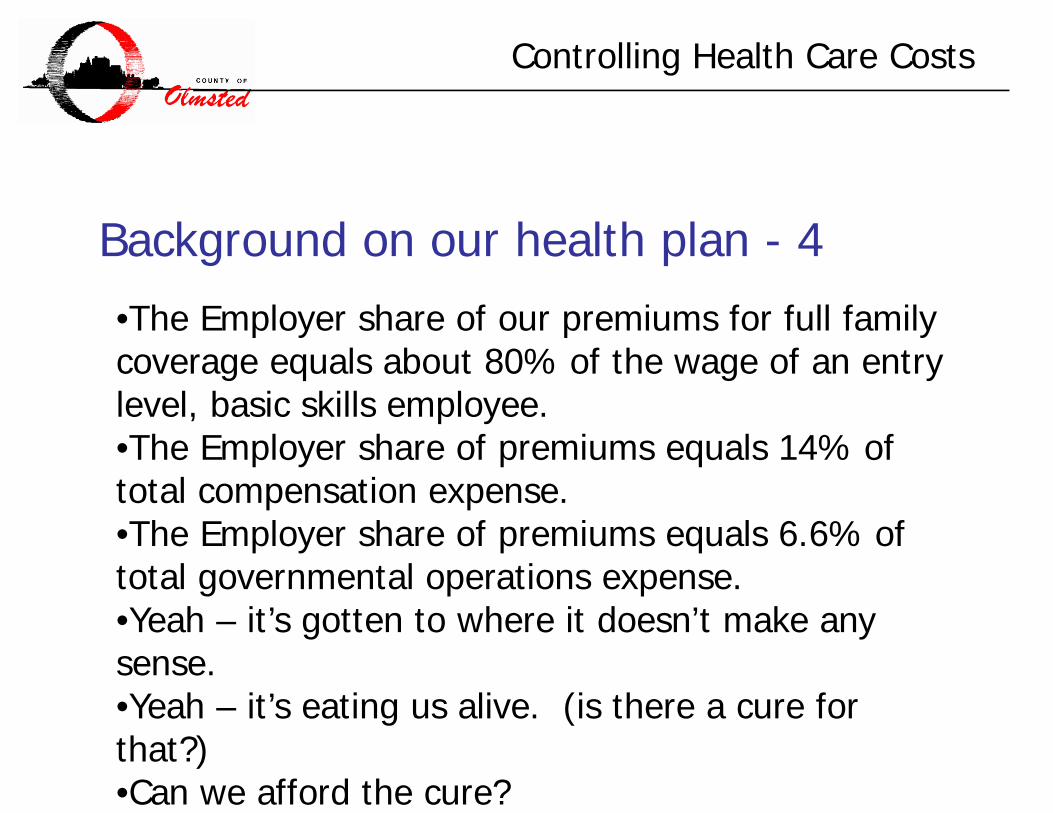
•The Employer share of our premiums for full family coverage equals about 80% of the wage of an entry level, basic skills employee.•The Employer share of premiums equals 14% of total compensation expense.•The Employer share of premiums equals 6.6% of total governmental operations expense.•Yeah – it’s gotten to where it doesn’t make any sense.•Yeah – it’s eating us alive. (is there a cure for that?)•Can we afford the cure?
How many Health Plan Members does it take to Screw in a Light Bulb?
Controlling Health Care Costs
Answer? –Only one if you could get them to pay
attention.
Controlling Health Care Costs
What Have We Done to Control Costs?
Controlling Health Care Costs
•Tinkered with the plan design•Co-pays, mail order drugs, emergency room usage, adopted a drug formulary, competitive provider premium pricing, Medication Therapy Management sessions, Centers of Excellence requirements for some treatments, etc
•Considered and rejected high-deductible plan design•Created a Wellness Initiative
What Have We Done to Control Costs?
Controlling Health Care Costs
Let’s talk about the Wellness Initiative:•We have two staff in the wellness initiative for about 2000 plan members.•One is the Care Manager and she is an RN. This position can offer current savings.•The other is a Health Educator. This is to teach long-term behavior change.•We think it’s a one-two punch.
What Have We Done to Control Costs?
Controlling Health Care Costs
Let’s talk about the Wellness Initiative:•The Nurse Care Manager is available to help manage hospital discharge plans.•The Nurse Care Manager has drop-in blood pressure and blood sugar testing office hours to assist people in managing problem numbers or to sometimes discover troublesome numbers.•The Health Educator plans and executes longer term behavioral change activities.
What Have We Done to Control Costs?
Controlling Health Care Costs
Let’s talk about the Wellness Initiative:•We have a couple weight loss programs with one being a heavy-duty version with assigned personal trainer, a dietitian, and a wellness coach. Participants have to meet certain requirements to qualify, a high BMI and some co-morbidities. The members lose on average 40 pounds in the part year session. We charge a subsidized amount to participate. We save more than the program costs in lowered medications for the participants.
What Have We Done to Control Costs?
Controlling Health Care Costs
Let’s talk about the Wellness Initiative – I’ve been asked to emphasize what we are doing with what we call “Know Your Numbers:”
•We have gradually worked toward a program where members earn incentives for “Know Your Numbers.”
•Research has indicated that 75% of health care costs originate with life style choices.
What Have We Done to Control Costs?
Controlling Health Care Costs
If you have accidents with your car because you are a bad driver, your car insurance will cost more.
If you use your body badly, shouldn’t your health insurance cost more?
Know Your Numbers
Controlling Health Care Costs
In prior years we learned through self-reported numbers that:
Our main medical issues areBlood Pressure LDL Cholesterol Body Mass Index (BMI)
Lifestyle behaviors that most commonly put us at risk are:
Tobacco use Poor Nutrition Lack of Exercise
Know Your Numbers
Controlling Health Care Costs
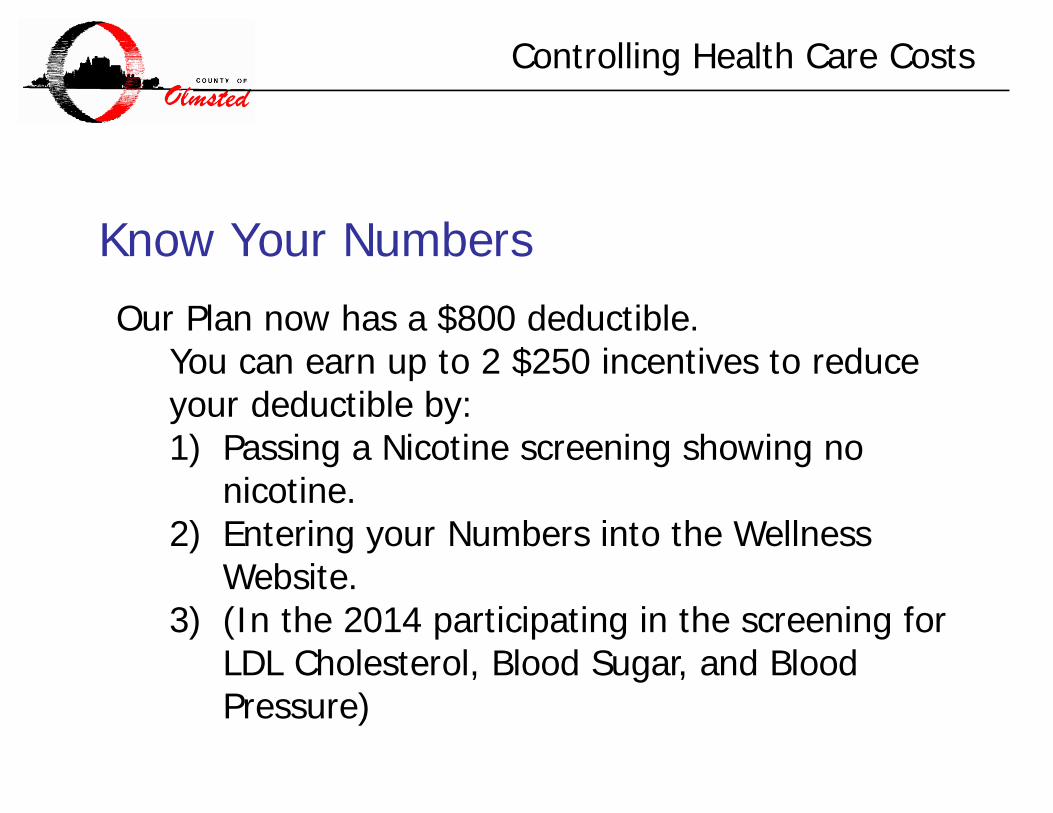
Our Plan now has a $800 deductible.You can earn up to 2 $250 incentives to reduce your deductible by:1) Passing a Nicotine screening showing no
nicotine.2) Entering your Numbers into the Wellness
Website. 3) (In the 2014 participating in the screening for
LDL Cholesterol, Blood Sugar, and Blood Pressure)
Know Your Numbers
Controlling Health Care Costs
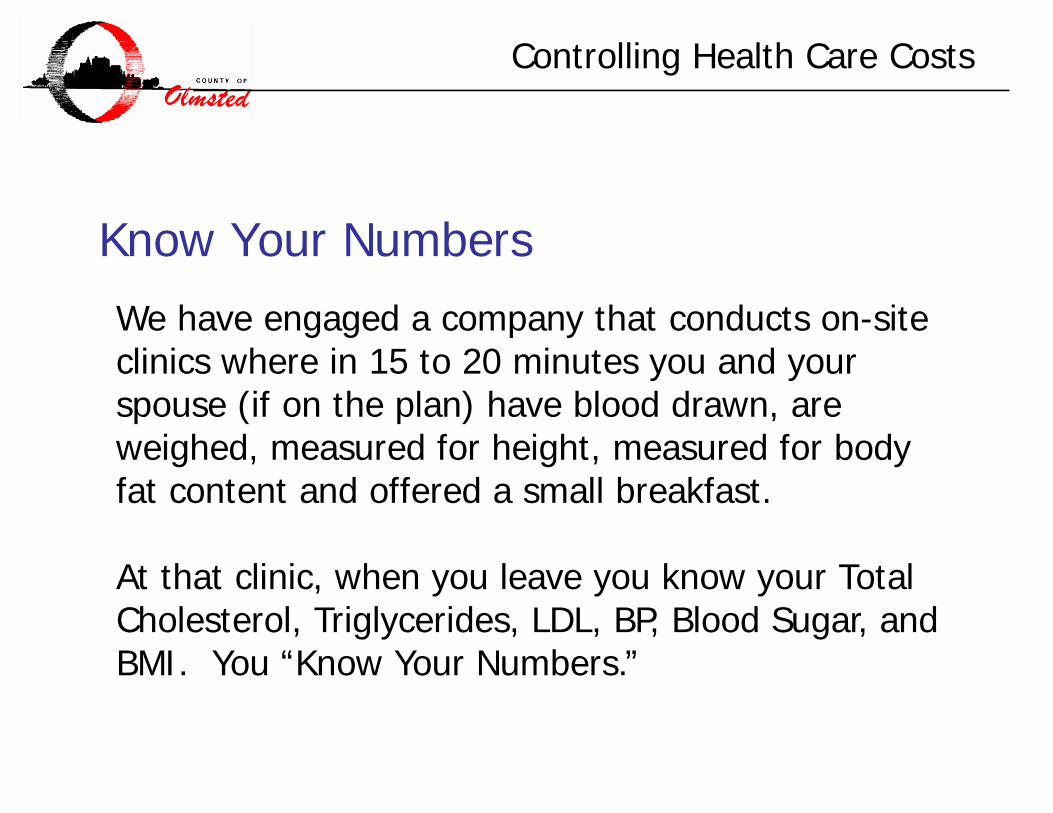
We have engaged a company that conducts on-site clinics where in 15 to 20 minutes you and your spouse (if on the plan) have blood drawn, are weighed, measured for height, measured for body fat content and offered a small breakfast.
At that clinic, when you leave you know your Total Cholesterol, Triglycerides, LDL, BP, Blood Sugar, and BMI. You “Know Your Numbers.”
Know Your Numbers
Controlling Health Care Costs
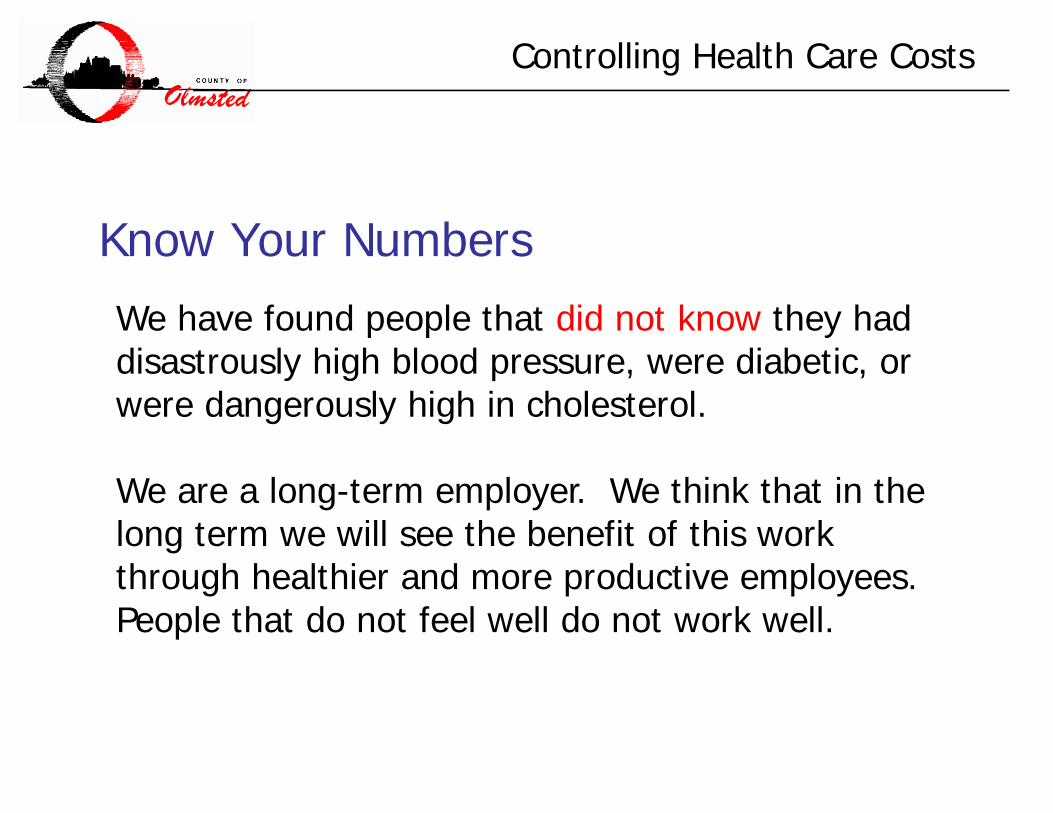
We have found people that did not know they had disastrously high blood pressure, were diabetic, or were dangerously high in cholesterol.
We are a long-term employer. We think that in the long term we will see the benefit of this work through healthier and more productive employees. People that do not feel well do not work well.
Know Your Numbers
Controlling Health Care Costs
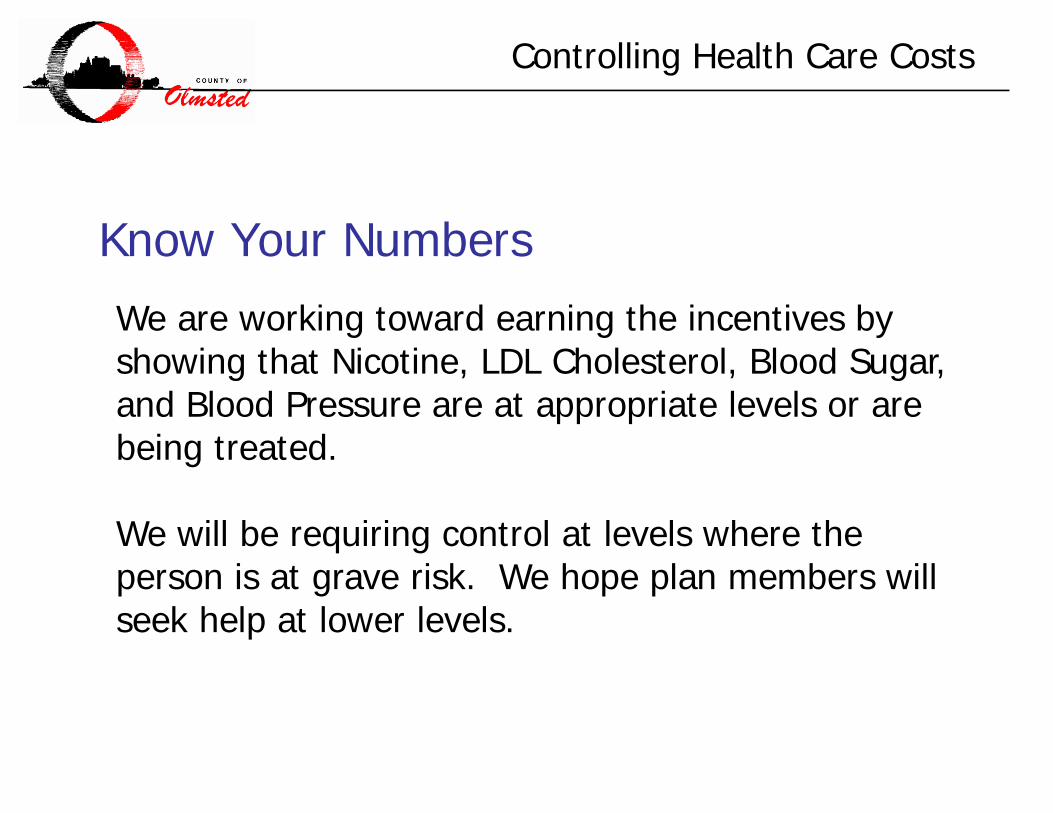
We are working toward earning the incentives by showing that Nicotine, LDL Cholesterol, Blood Sugar, and Blood Pressure are at appropriate levels or are being treated.
We will be requiring control at levels where the person is at grave risk. We hope plan members will seek help at lower levels.
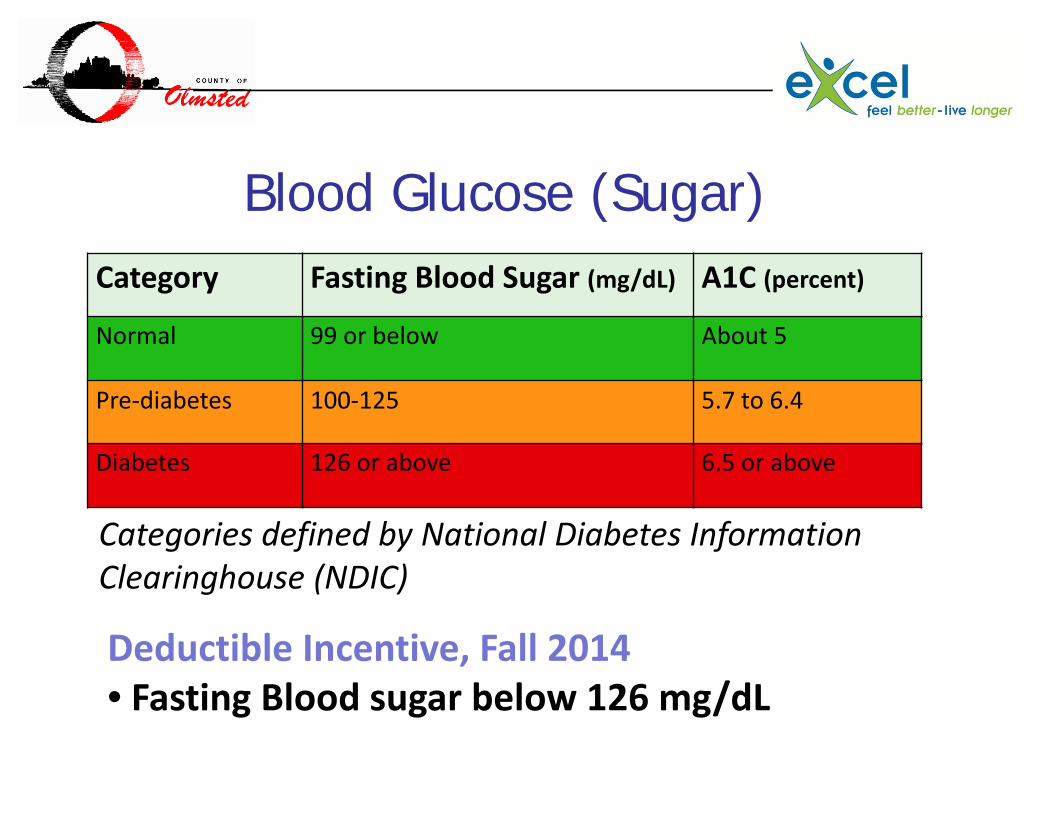
Blood Glucose (Sugar)Category Fasting Blood Sugar (mg/dL) A1C (percent)
Normal 99 or below About 5
Pre‐diabetes 100‐125 5.7 to 6.4
Diabetes 126 or above 6.5 or above
Categories defined by National Diabetes Information Clearinghouse (NDIC)
Deductible Incentive, Fall 2014• Fasting Blood sugar below 126 mg/dL
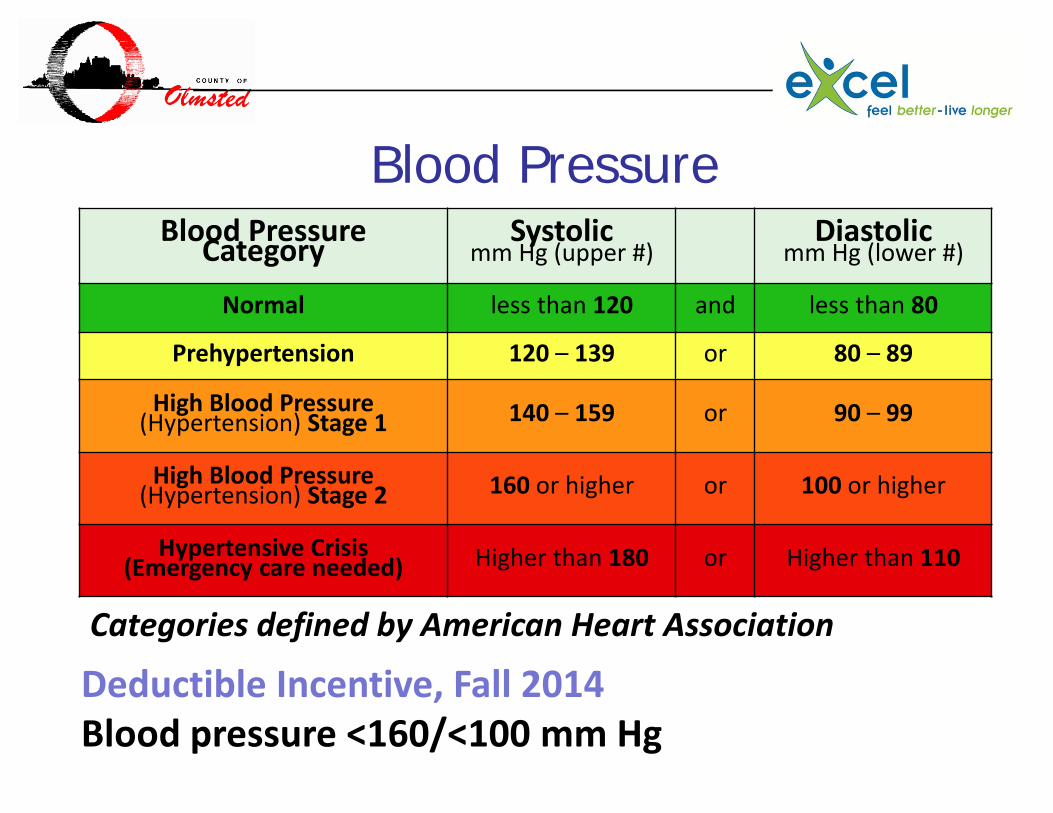
Blood Pressure
Categories defined by American Heart Association
Deductible Incentive, Fall 2014Blood pressure <160/<100 mm Hg
Blood PressureCategory Systolicmm Hg (upper #)
Diastolicmm Hg (lower #)
Normal less than 120 and less than 80
Prehypertension 120 – 139 or 80 – 89
High Blood Pressure(Hypertension) Stage 1 140 – 159 or 90 – 99
High Blood Pressure(Hypertension) Stage 2 160 or higher or 100 or higher
Hypertensive Crisis(Emergency care needed) Higher than 180 or Higher than 110
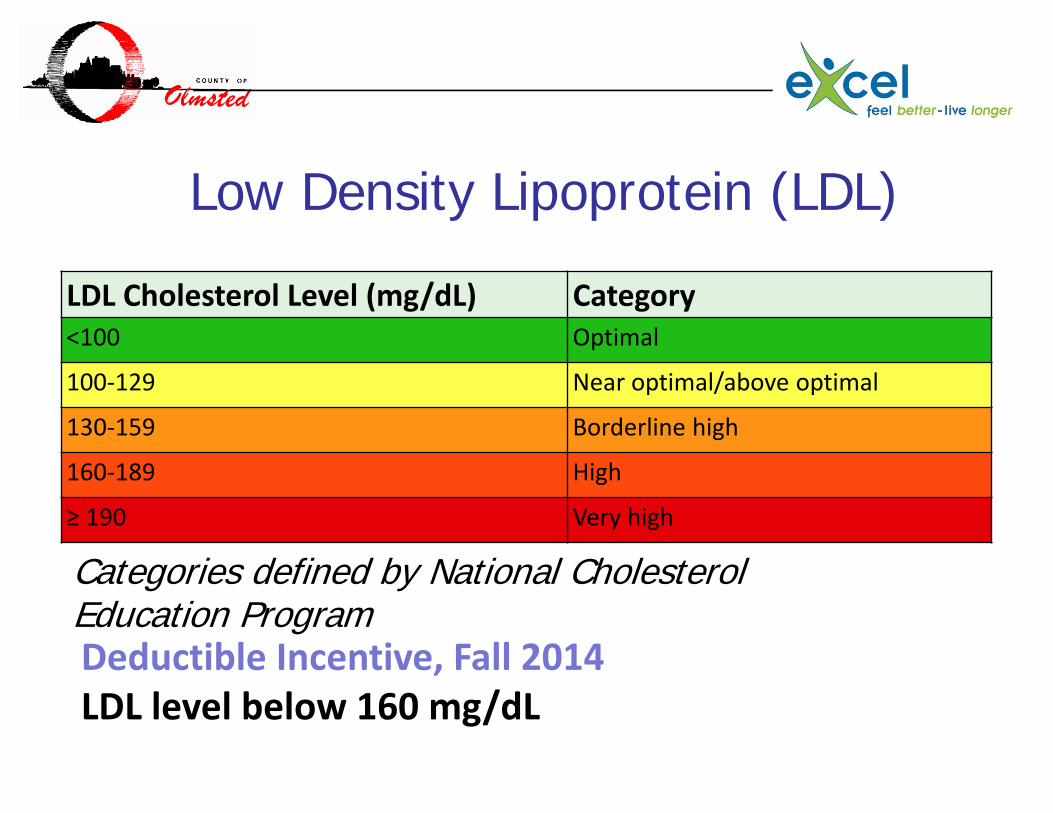
Low Density Lipoprotein (LDL)
LDL Cholesterol Level (mg/dL) Category<100 Optimal
100‐129 Near optimal/above optimal
130‐159 Borderline high
160‐189 High
≥ 190 Very high
Categories defined by National Cholesterol Education ProgramDeductible Incentive, Fall 2014LDL level below 160 mg/dL
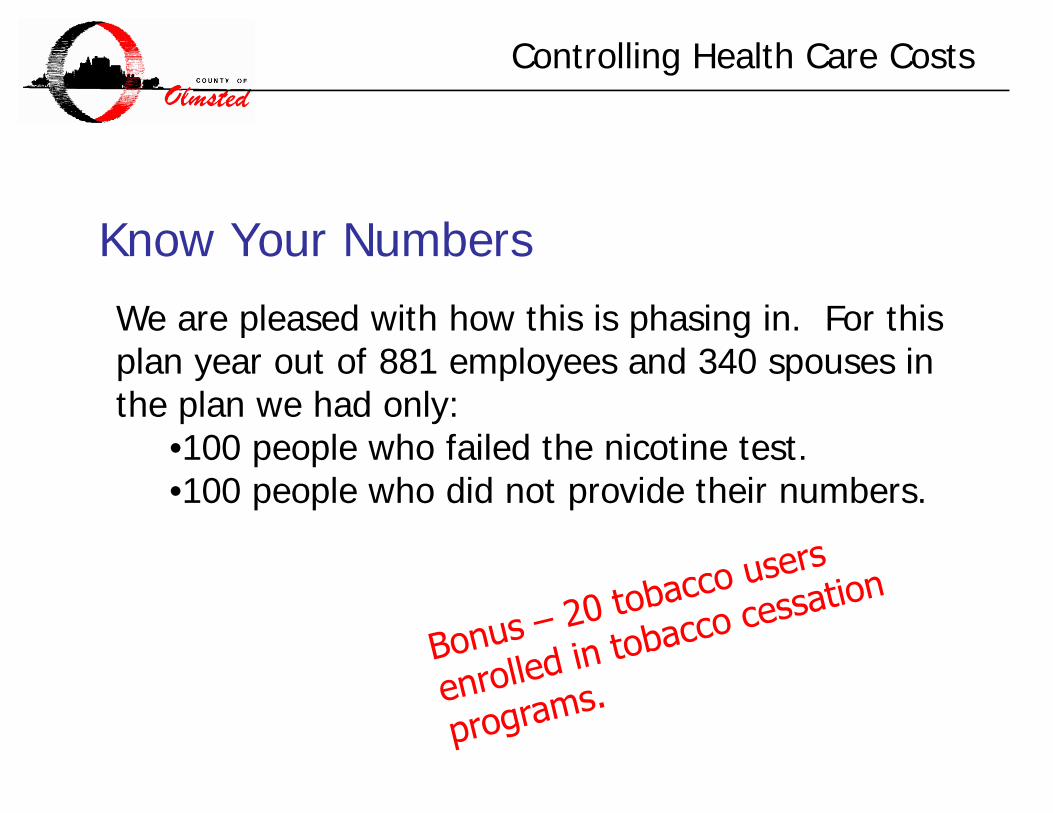
Know Your Numbers
Controlling Health Care Costs
We are pleased with how this is phasing in. For this plan year out of 881 employees and 340 spouses in the plan we had only:
•100 people who failed the nicotine test.•100 people who did not provide their numbers.
Know Your Numbers
Controlling Health Care Costs
We have:•Marketed, Marketed, Marketed.•Presented until we were hoarse.•Explained countless times that “Yes you were told and notified.”•Some members that think this is intrusive.
Know Your Numbers
Controlling Health Care Costs
Why do we do it? •Nothing else has worked well enough.•We think that high-deductible plans encourage some plan members to make foolish choices.•High-deductible plans with tax free savings plans won’t escape the Cadillac Tax under the ACA.•The only other option seems to be rationing of care for our fellow employees.
Know Your Numbers
Controlling Health Care Costs
Is it working?•We don’t know.•Our plan costs have not escalated more rapidly than in the past. (we worried that finding health problems would escalate costs.)•We know that our heavy-duty weight loss program more than pays for itself.•We think this will work too if we are allowed the time to let it work.•Avoided strokes and diabetes should save the plan money.
Controlling Health Care Costs
Robert M. Bendzick, CPA/CGFMChief Financial OfficerOlmsted County, [email protected]
The Most Important Approaches to Cutting Health-Care Costs
JOHN SULLIVANDirector, Central ServicesCounty of Anoka

Why an On-Site Clinic? Process Funding of the Clinic Tour of the Clinic ResultsWhat’s next?
Agenda
55

Why On-Site Clinic?56
57
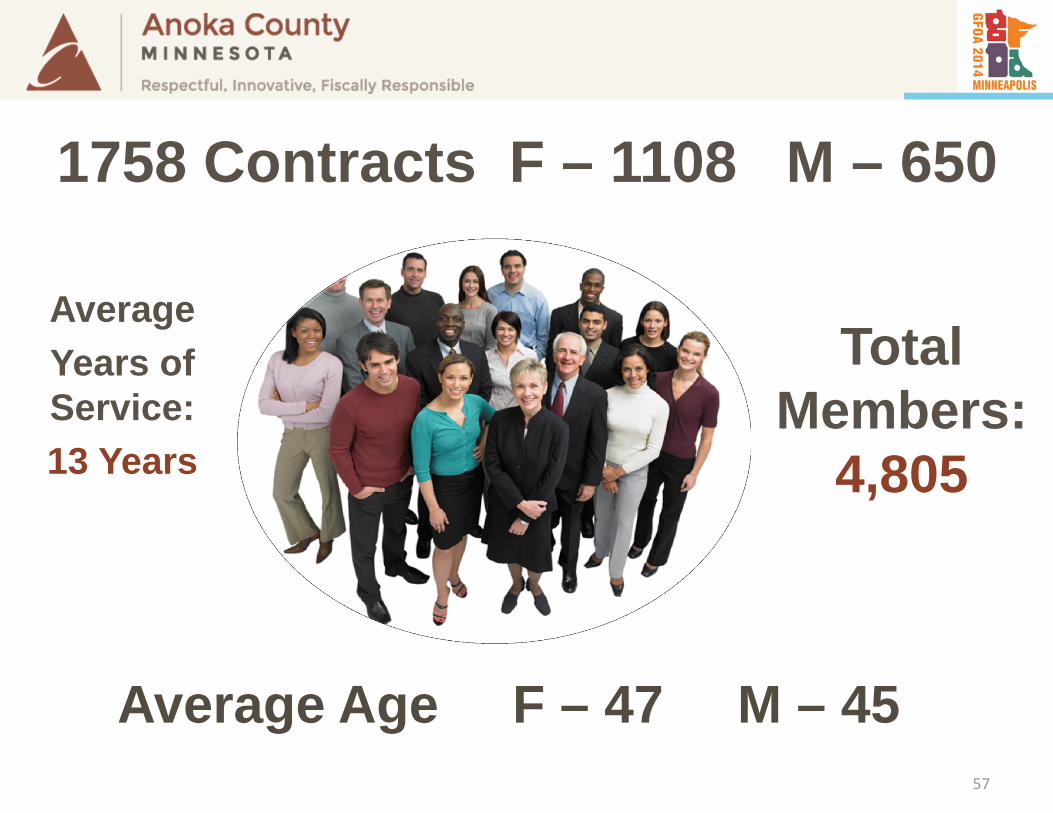
1758 Contracts F – 1108 M – 650
Average Age F – 47 M – 45
Average Years of Service: 13 Years
Total Members:
4,805
58
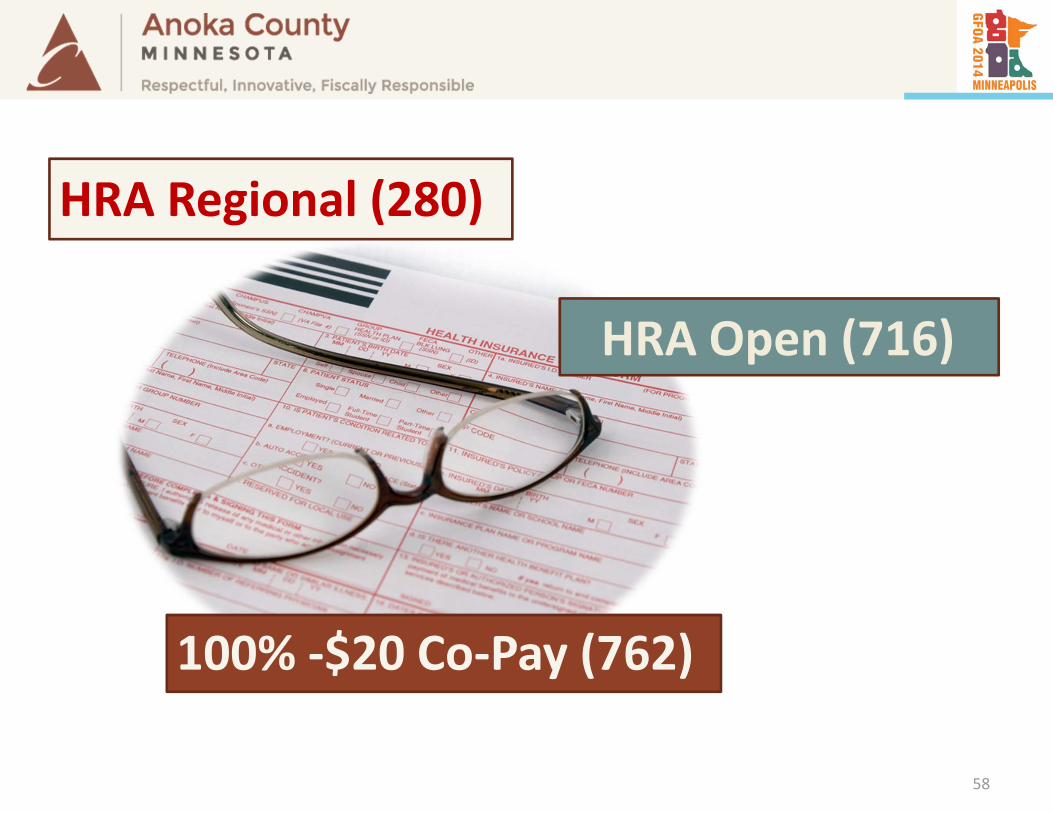
HRA Open (716)
HRA Regional (280)
100% ‐$20 Co‐Pay (762)
Why On-Site Clinic?
Doing the same thing over and over again and expecting different results.
Albert Einstein’s definition of insanity:
59
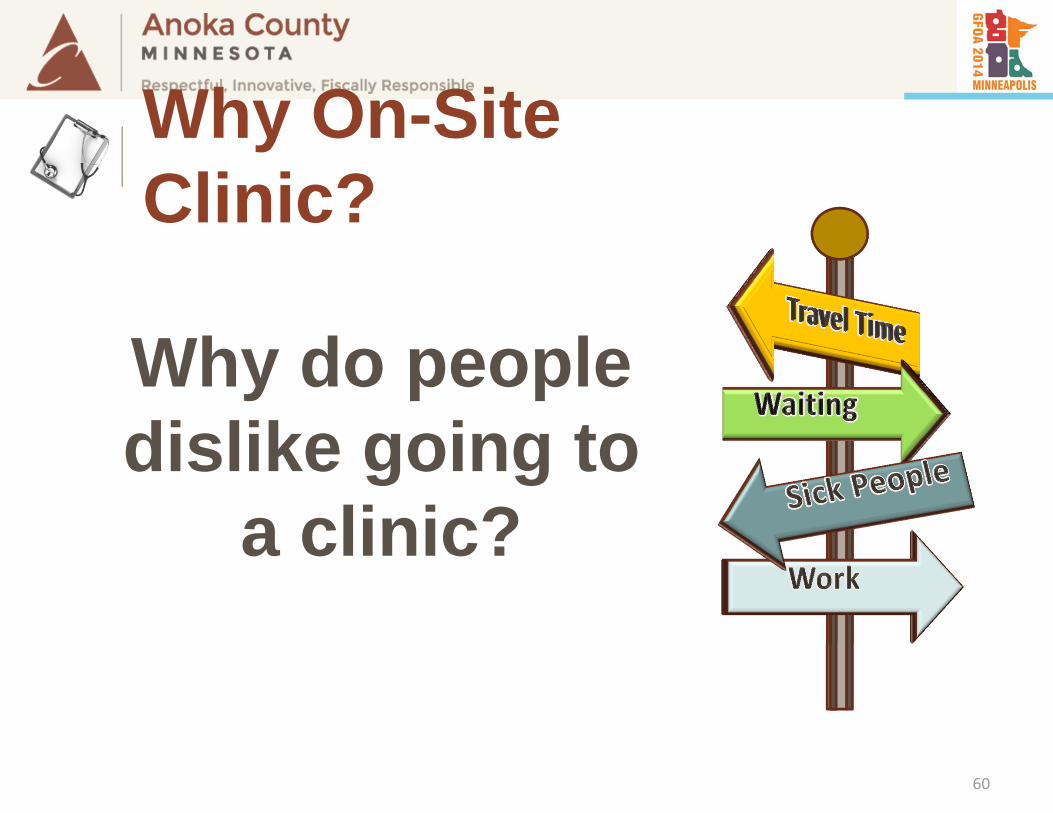
Why do people dislike going to
a clinic?
60
Why On-Site Clinic?
61
Why On-Site Clinic?

62
Why On-Site Clinic?

63
Why On-Site Clinic?

64
Process
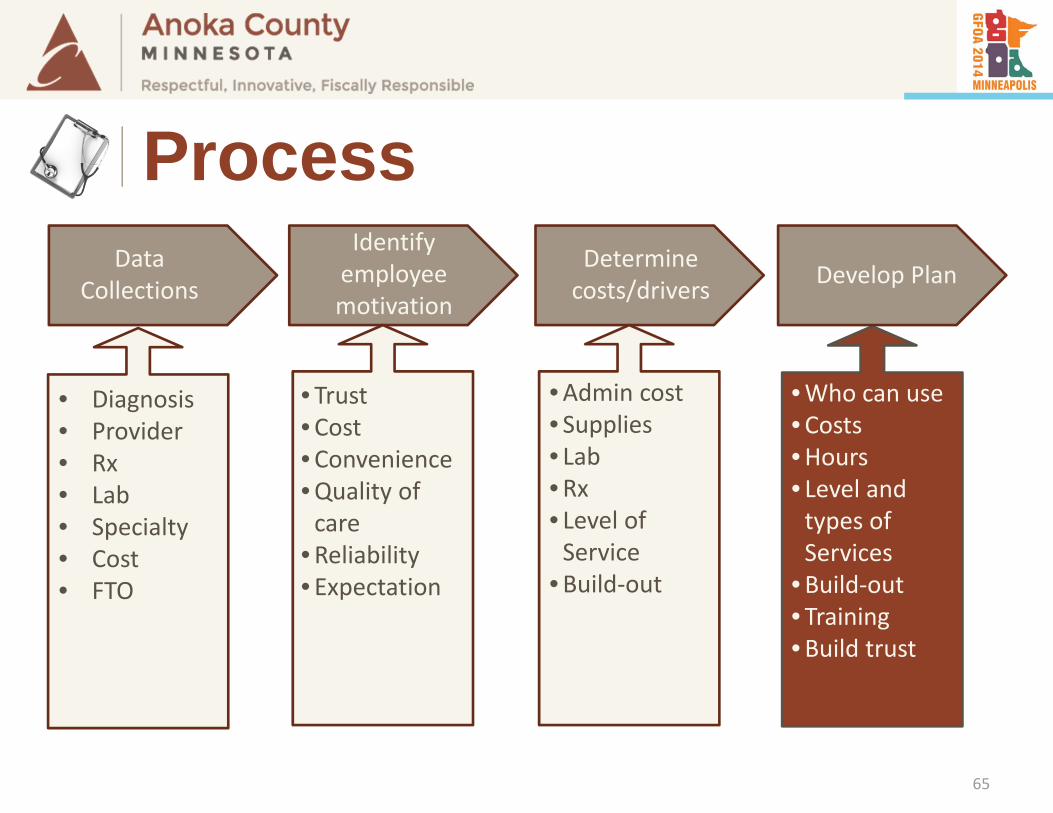
Data Collections
Identify employee motivation
Determine costs/drivers Develop Plan
• Diagnosis• Provider• Rx• Lab• Specialty• Cost• FTO
• Trust•Cost•Convenience•Quality of care
•Reliability• Expectation
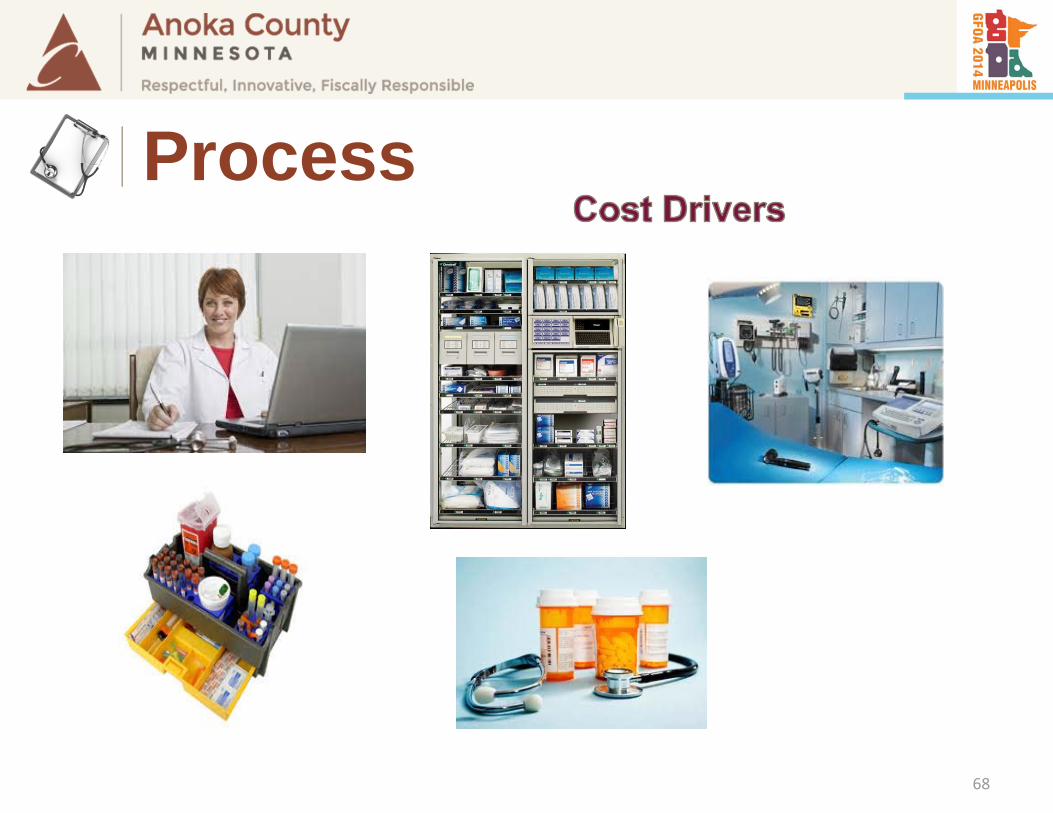
•Admin cost• Supplies• Lab•Rx• Level of Service
•Build‐out
•Who can use•Costs•Hours• Level and types of Services
•Build‐out• Training•Build trust
65
Process
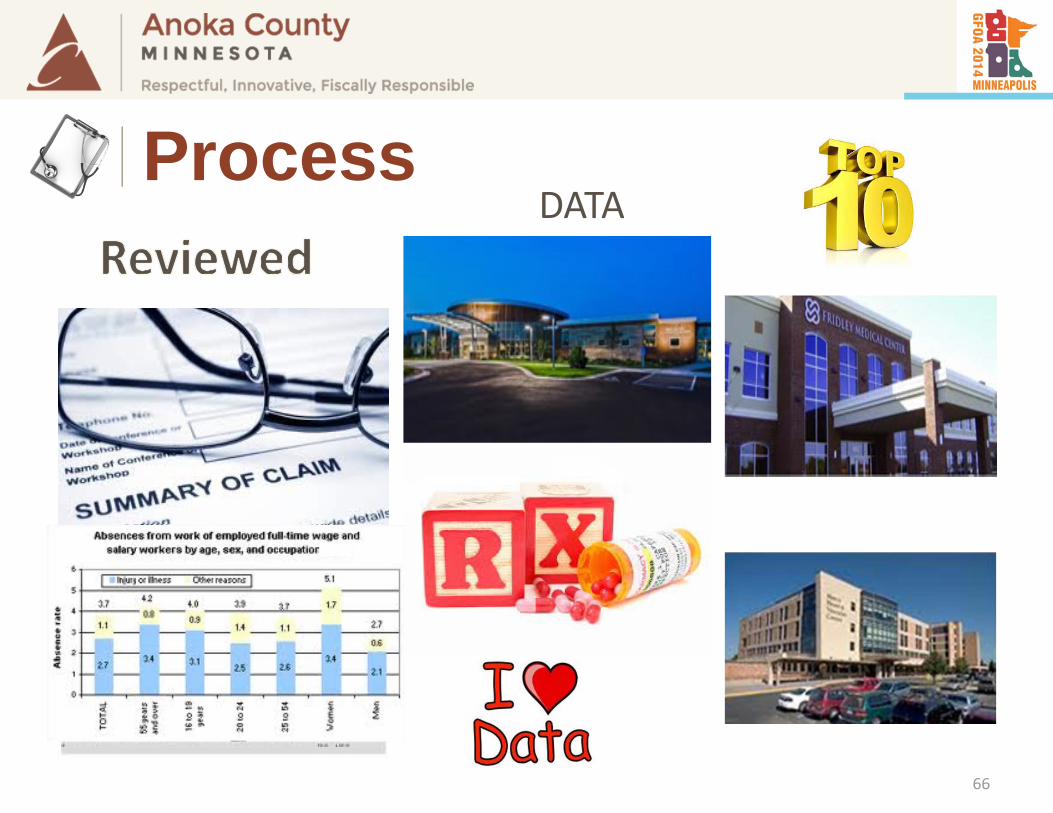
DATA
66
Process
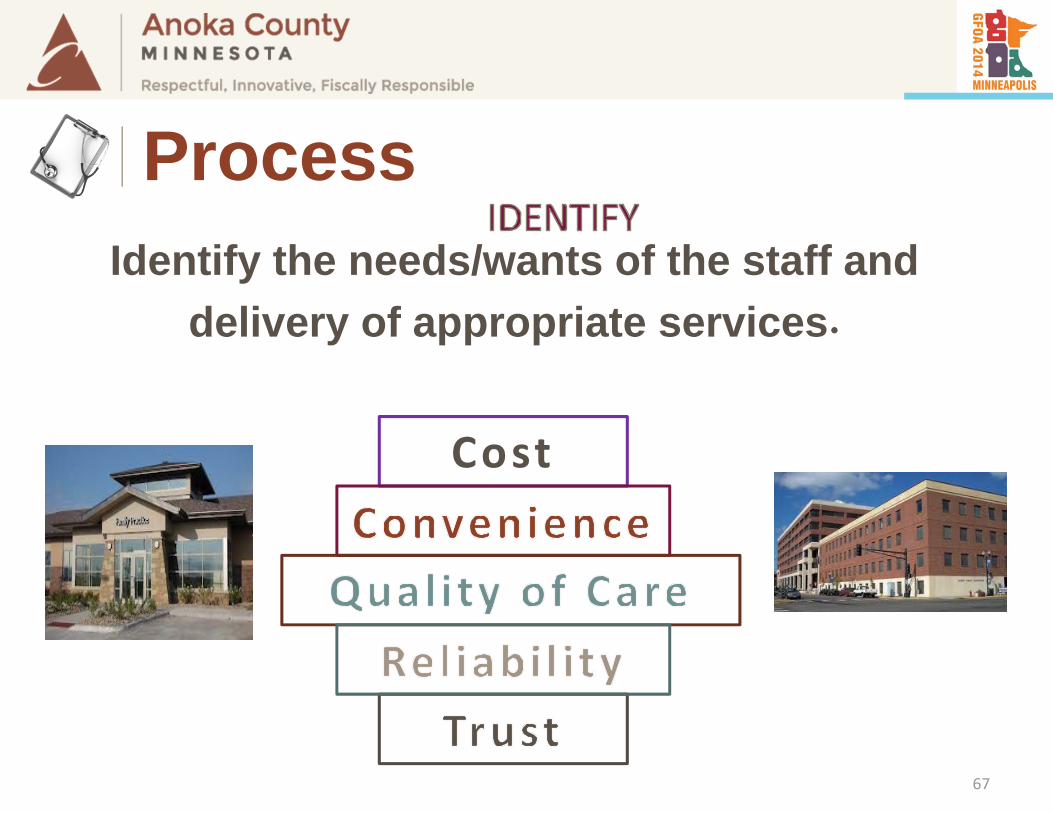
Identify the needs/wants of the staff and delivery of appropriate services.
Cost
67
Process
68
Process
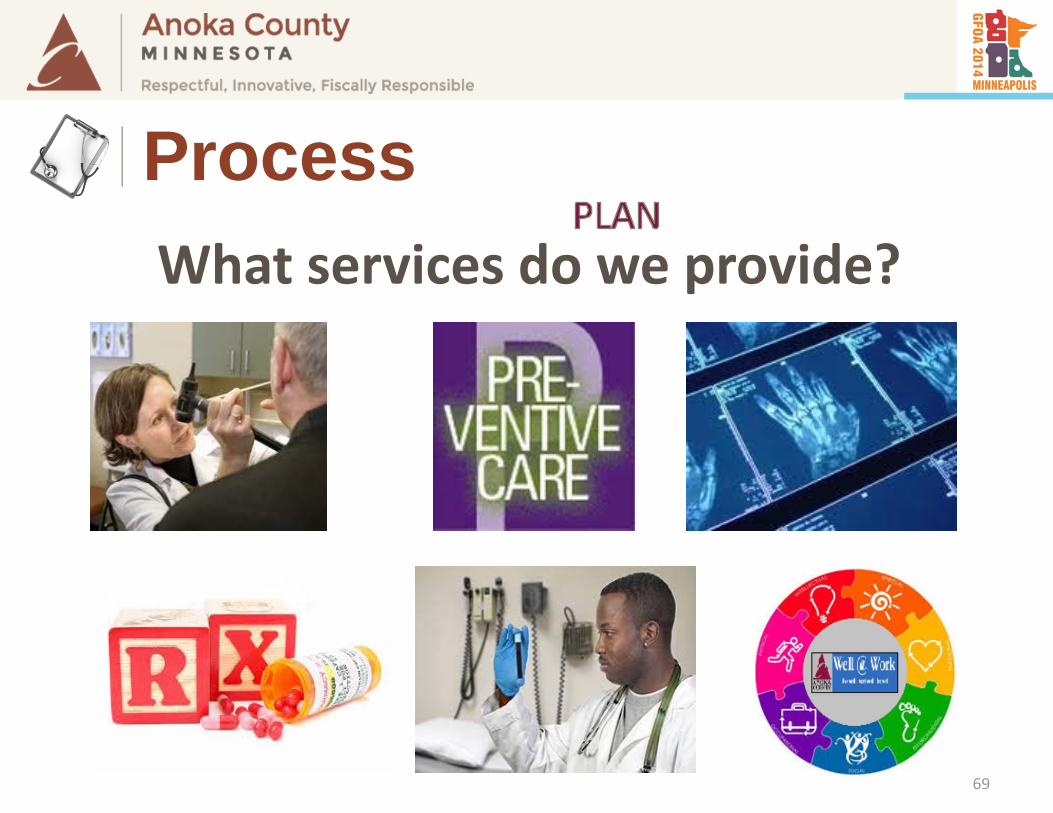
What services do we provide?
69
Process
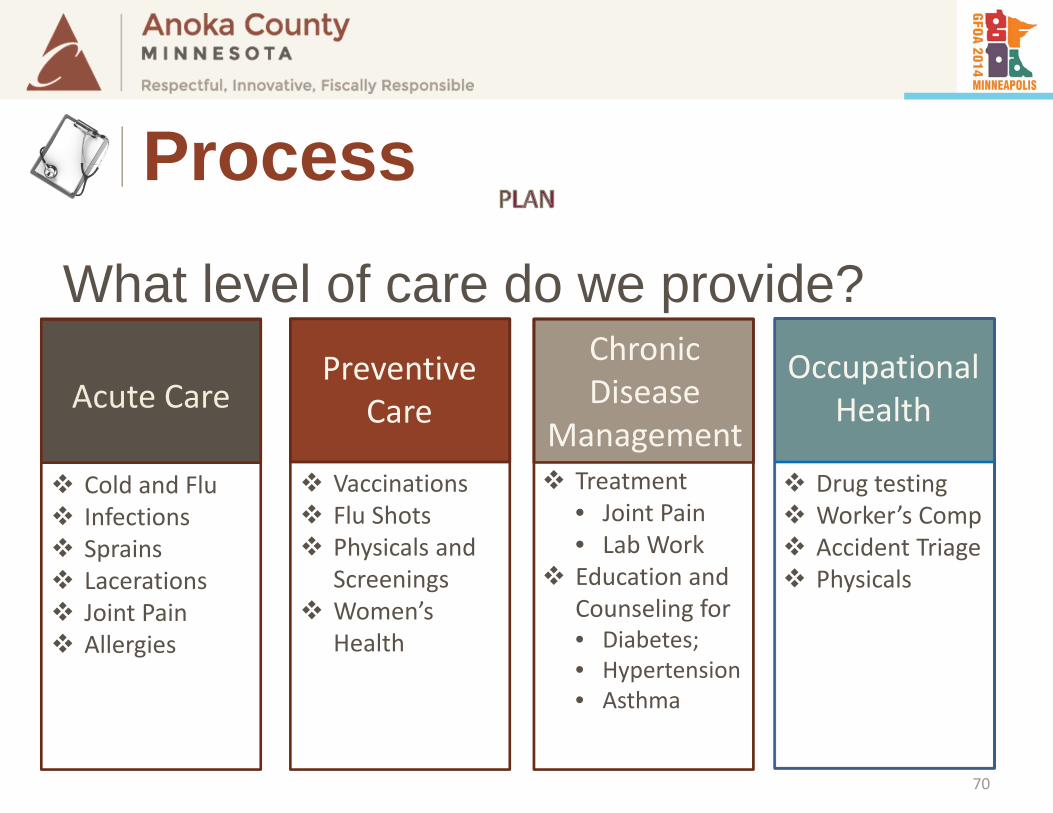
Treatment• Joint Pain• Lab Work
Education and Counseling for• Diabetes;• Hypertension• Asthma
Cold and Flu Infections Sprains Lacerations Joint Pain Allergies
Acute Care
Vaccinations Flu Shots Physicals and
Screenings Women’s
Health
PreventiveCare
Drug testing Worker’s Comp Accident Triage Physicals
ChronicDisease
Management
Occupational Health
What level of care do we provide?
70
Process
We wanted to allow all employees to use
the clinic
Final Answer:Who can use the clinic?
71
Process
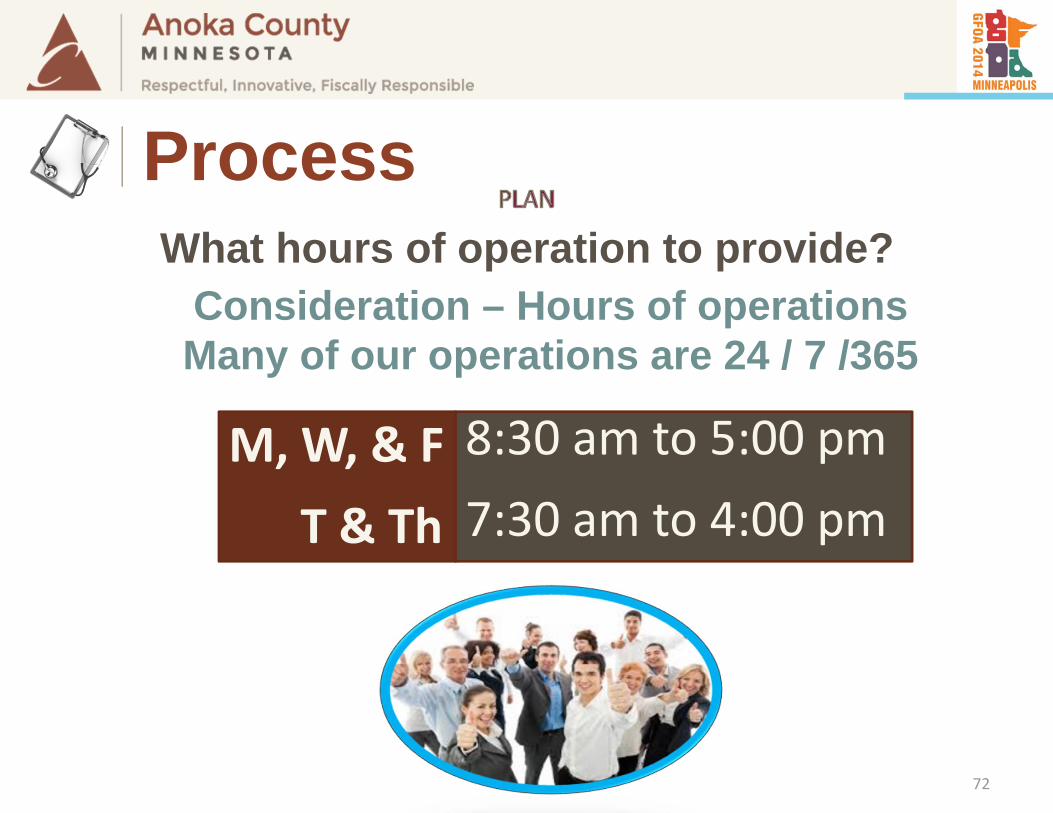
What hours of operation to provide?
M, W, & FT & Th
8:30 am to 5:00 pm7:30 am to 4:00 pm
Consideration – Hours of operationsMany of our operations are 24 / 7 /365
72
Process

73
How Did We Fund It?
74
How Did We Fund It?
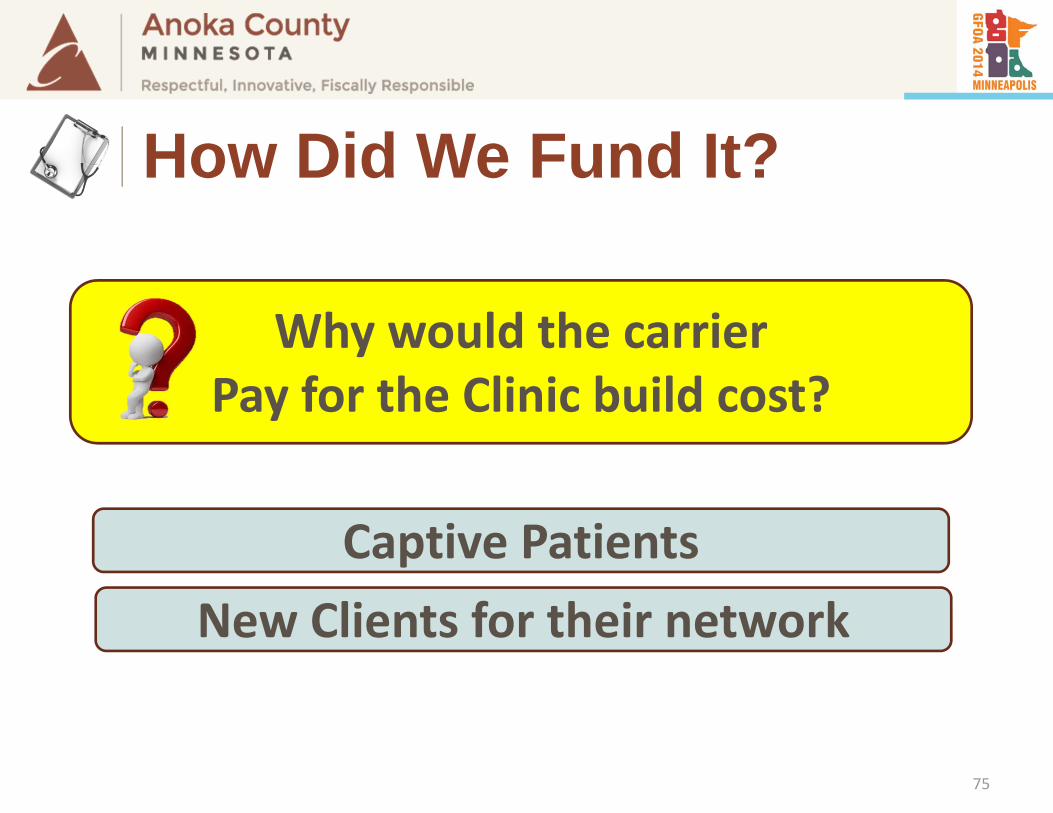
Why would the carrier Pay for the Clinic build cost?
Captive PatientsNew Clients for their network
75
How Did We Fund It?
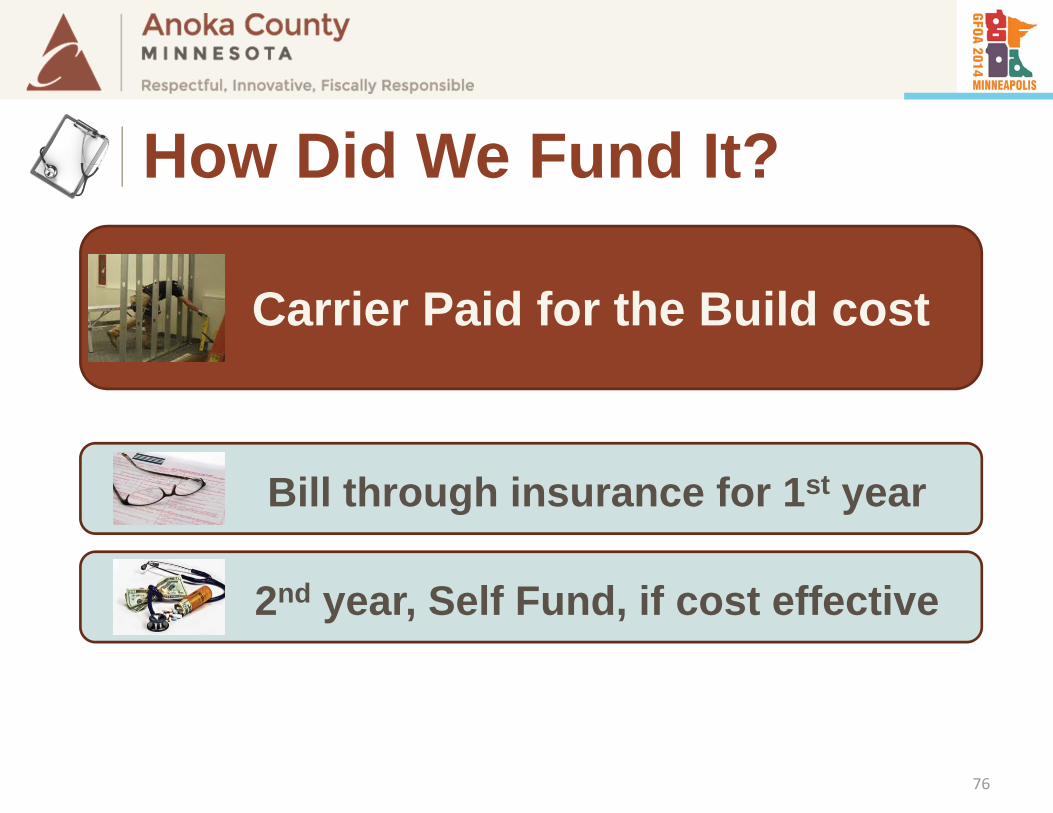
Bill through insurance for 1st year
2nd year, Self Fund, if cost effective
Carrier Paid for the Build cost
76
How Did We Fund It?
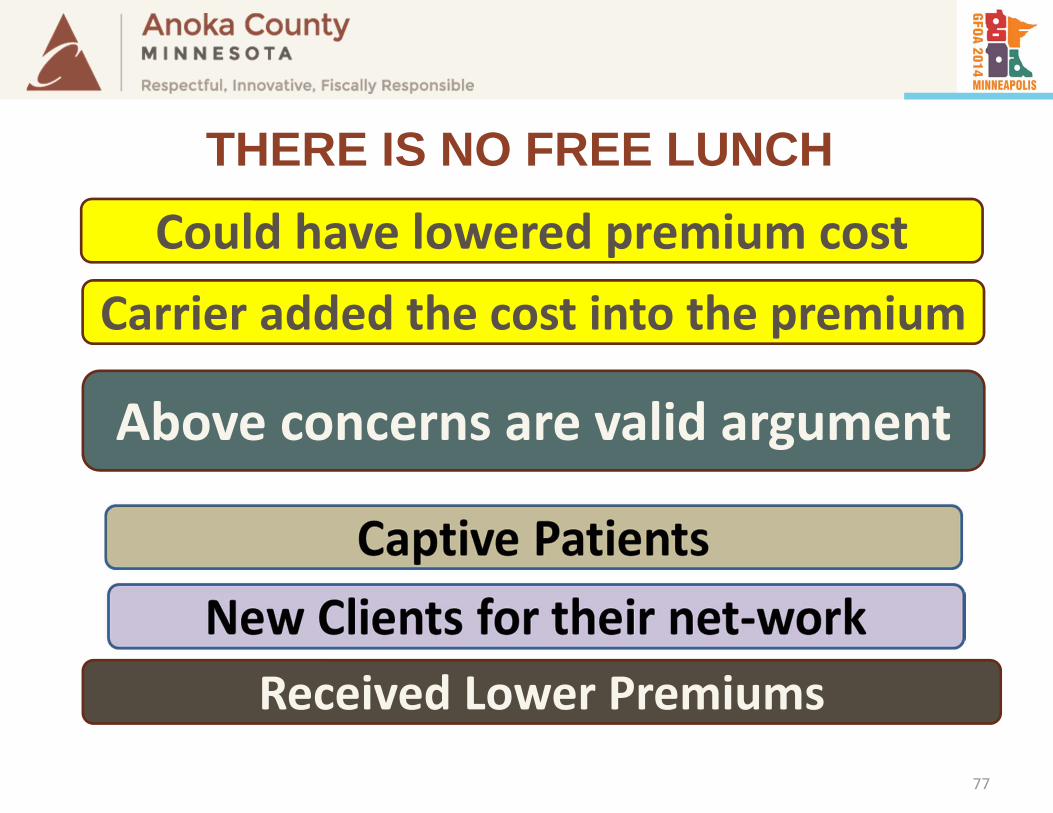
Could have lowered premium costCarrier added the cost into the premium
Above concerns are valid argument
Received Lower Premiums 77
THERE IS NO FREE LUNCH

Tour of the Clinic
78
Tour of the Clinic

79
Tour of the Clinic

80
Tour of the Clinic
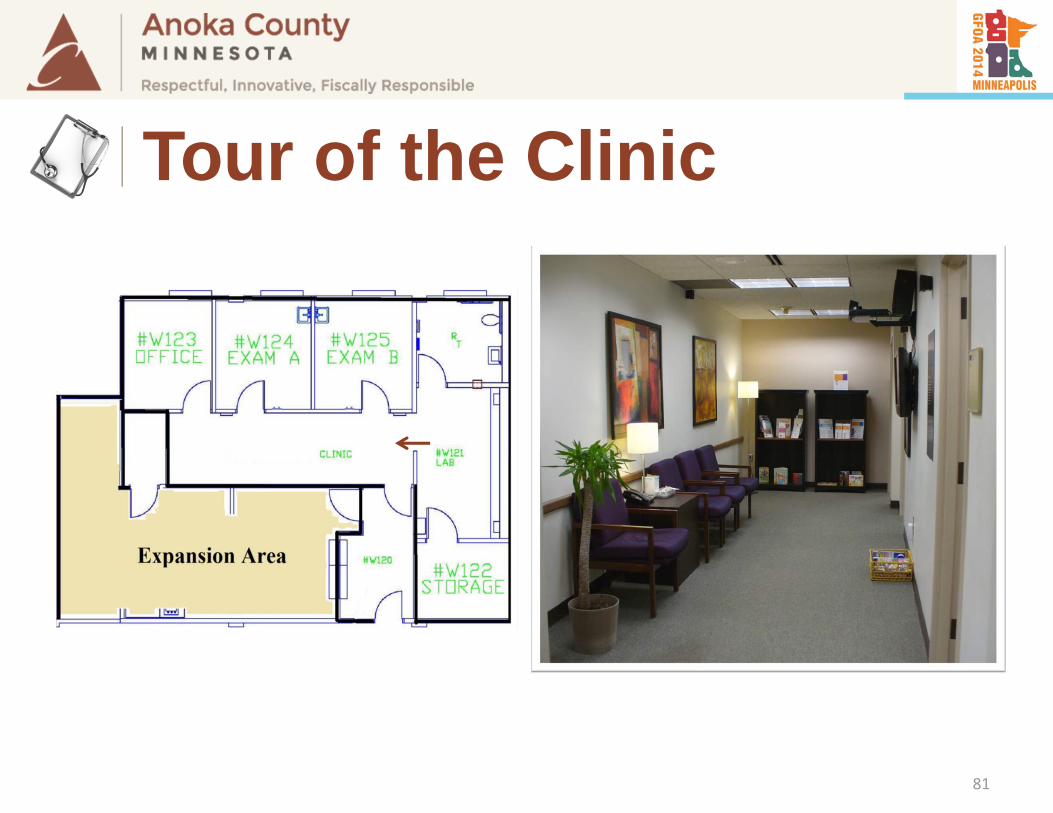
81
Tour of the Clinic
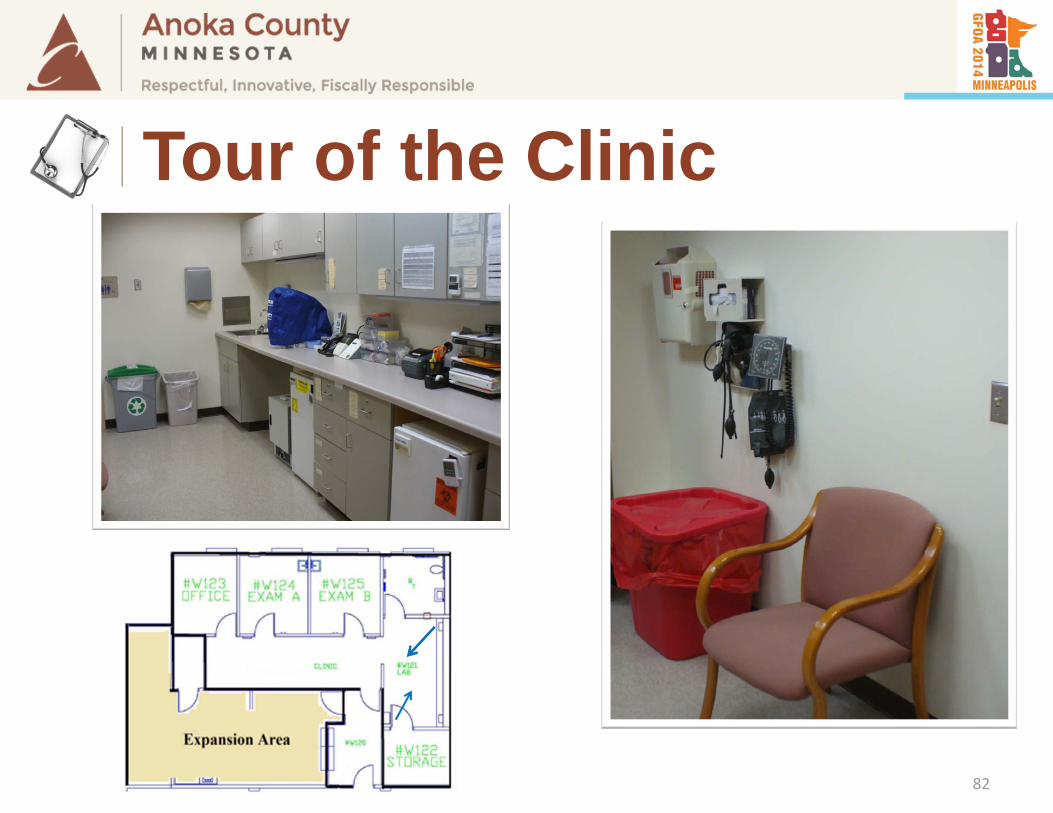
82
Tour of the Clinic
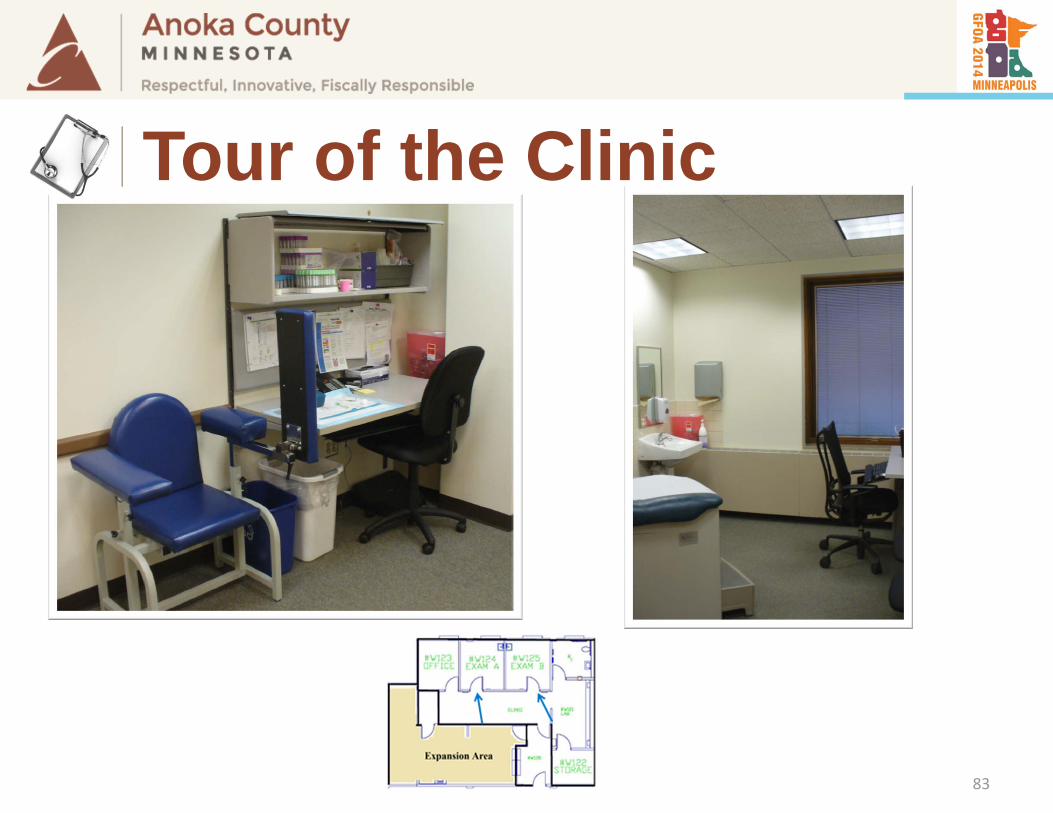
83
Tour of the Clinic

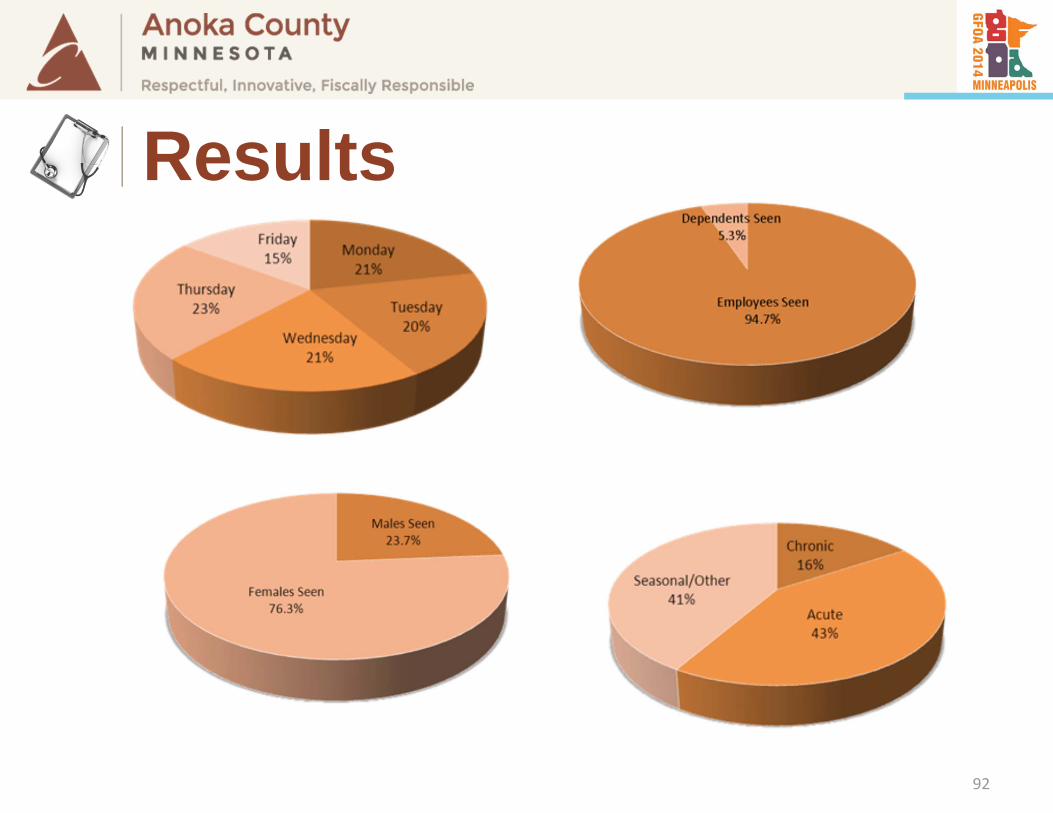
Results
84
Results
Anoka County Well @ Work clinic opened in May, 2011 and has had 6,848patient visits (as of 12-31-2013).
85
Results
Estimated County savings from the clinic: $700,000 to $1,047,265
• Using average visit cost of $200 to $250
86
Results
Estimated production hours savings 10,000+ hours
87
Results
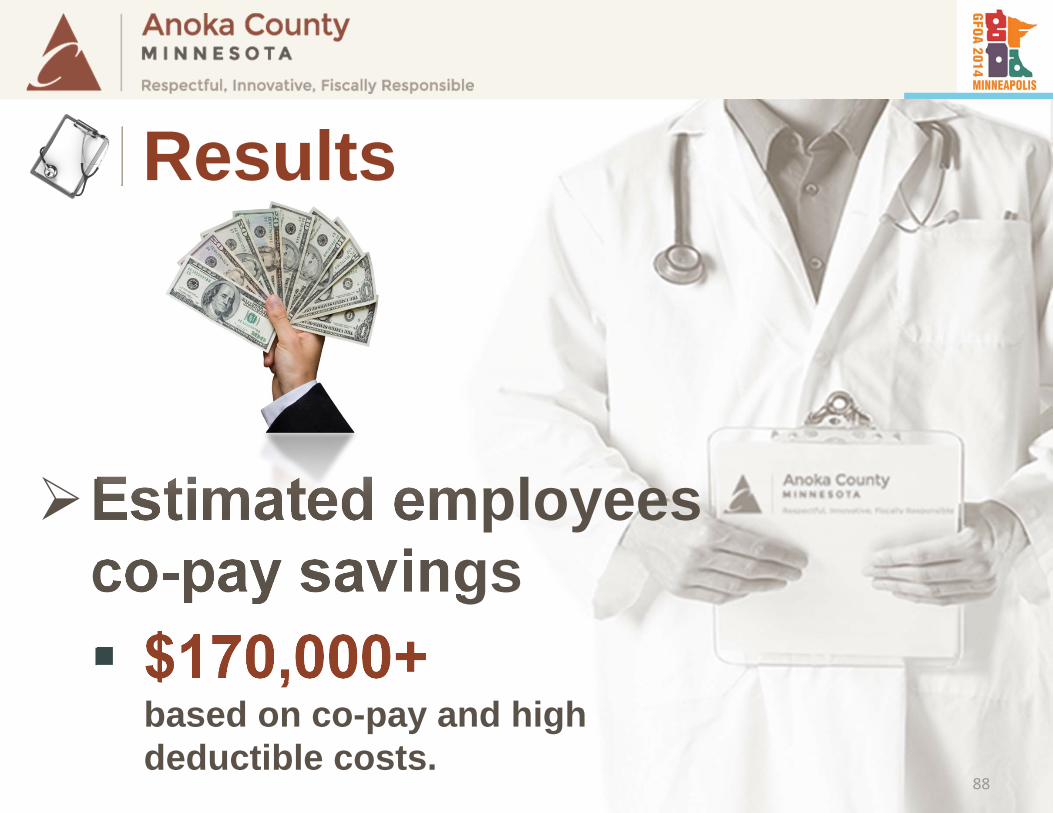
Estimated employees co-pay savings $170,000+
based on co-pay and high deductible costs.
88
Results
89
Results
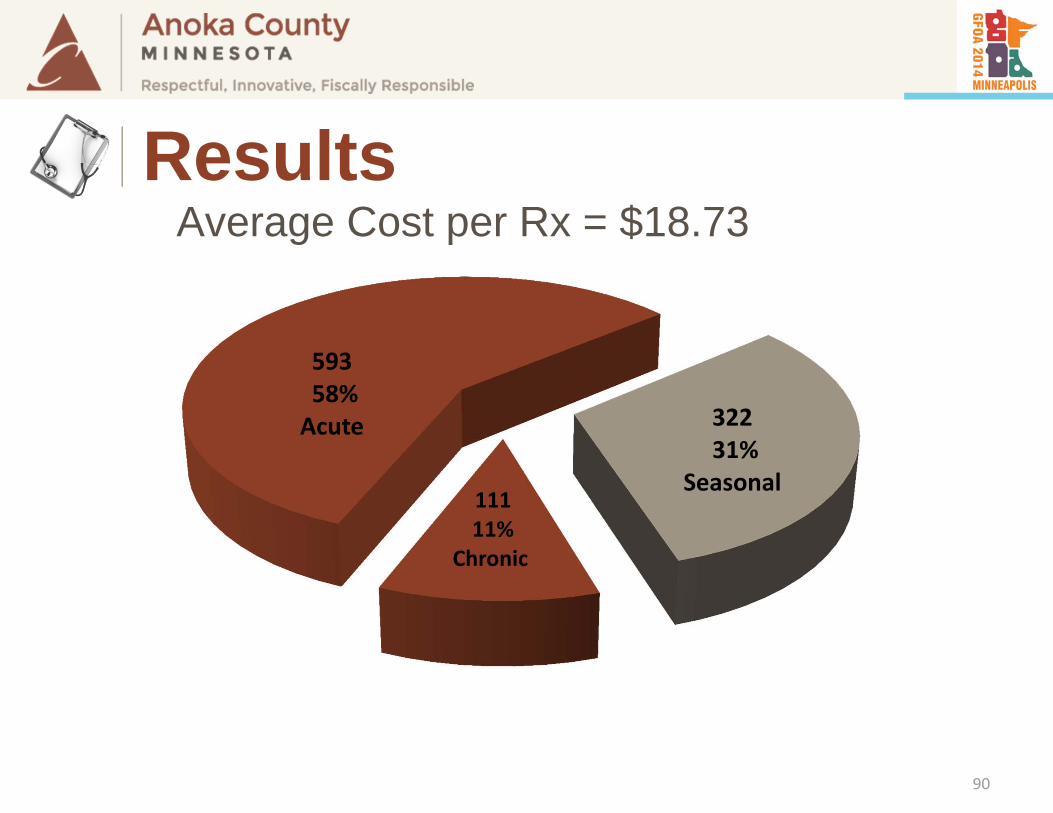
11111%
Chronic
59358%Acute 322
31%Seasonal
Average Cost per Rx = $18.73
90
Results
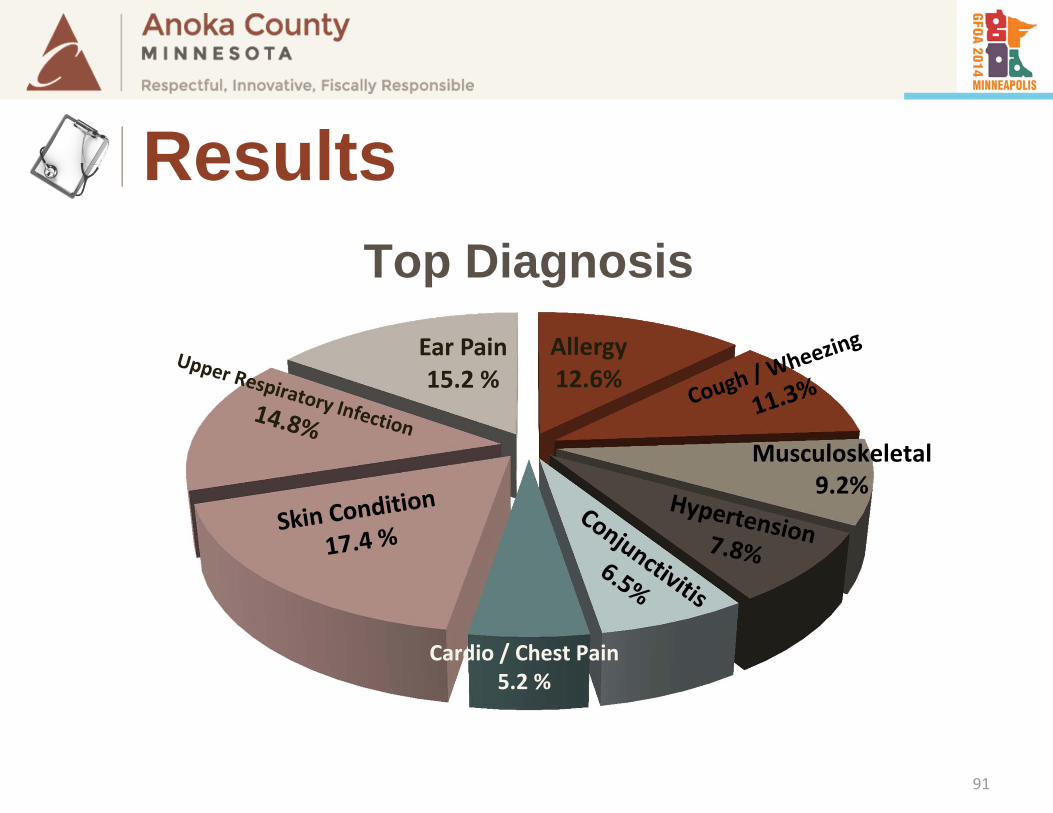
Allergy12.6%
Ear Pain15.2 %
Musculoskeletal9.2%
Cardio / Chest Pain5.2 %
Top Diagnosis
91
Results
92
Results
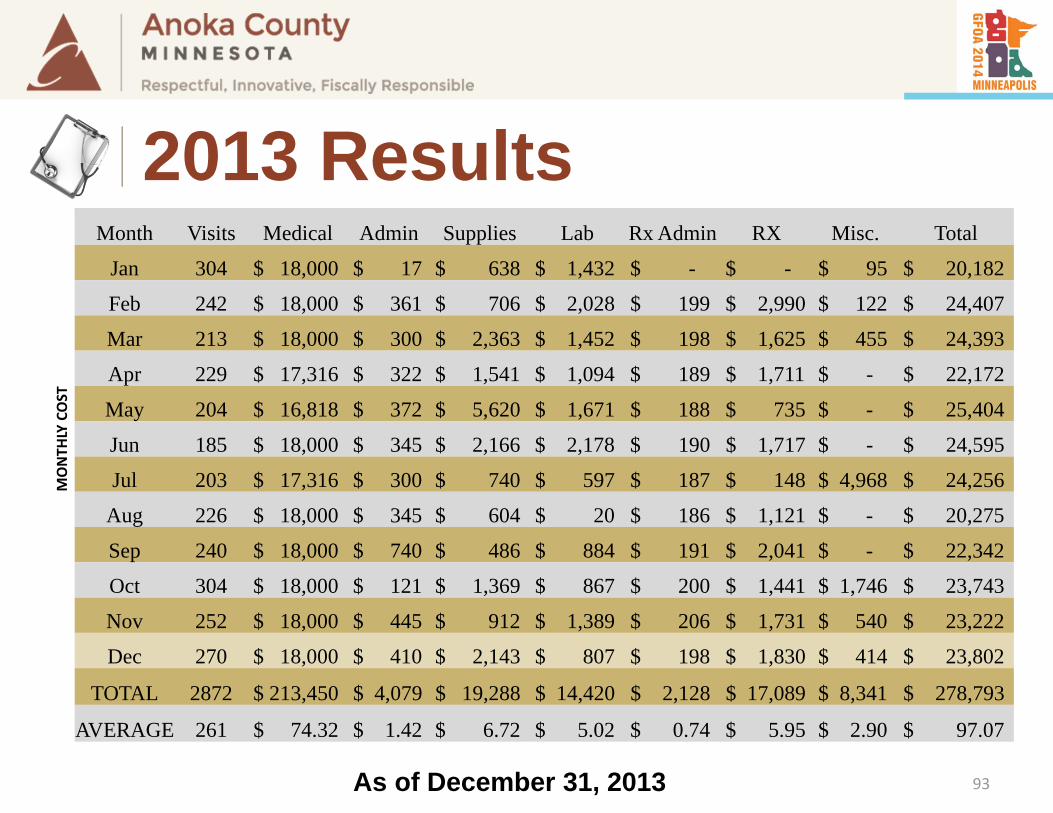
Month Visits Medical Admin Supplies Lab Rx Admin RX Misc. Total
MONTH
LY COST
Jan 304 $ 18,000 $ 17 $ 638 $ 1,432 $ - $ - $ 95 $ 20,182
Feb 242 $ 18,000 $ 361 $ 706 $ 2,028 $ 199 $ 2,990 $ 122 $ 24,407
Mar 213 $ 18,000 $ 300 $ 2,363 $ 1,452 $ 198 $ 1,625 $ 455 $ 24,393
Apr 229 $ 17,316 $ 322 $ 1,541 $ 1,094 $ 189 $ 1,711 $ - $ 22,172
May 204 $ 16,818 $ 372 $ 5,620 $ 1,671 $ 188 $ 735 $ - $ 25,404
Jun 185 $ 18,000 $ 345 $ 2,166 $ 2,178 $ 190 $ 1,717 $ - $ 24,595
Jul 203 $ 17,316 $ 300 $ 740 $ 597 $ 187 $ 148 $ 4,968 $ 24,256
Aug 226 $ 18,000 $ 345 $ 604 $ 20 $ 186 $ 1,121 $ - $ 20,275
Sep 240 $ 18,000 $ 740 $ 486 $ 884 $ 191 $ 2,041 $ - $ 22,342
Oct 304 $ 18,000 $ 121 $ 1,369 $ 867 $ 200 $ 1,441 $ 1,746 $ 23,743
Nov 252 $ 18,000 $ 445 $ 912 $ 1,389 $ 206 $ 1,731 $ 540 $ 23,222
Dec 270 $ 18,000 $ 410 $ 2,143 $ 807 $ 198 $ 1,830 $ 414 $ 23,802
TOTAL 2872 $ 213,450 $ 4,079 $ 19,288 $ 14,420 $ 2,128 $ 17,089 $ 8,341 $ 278,793
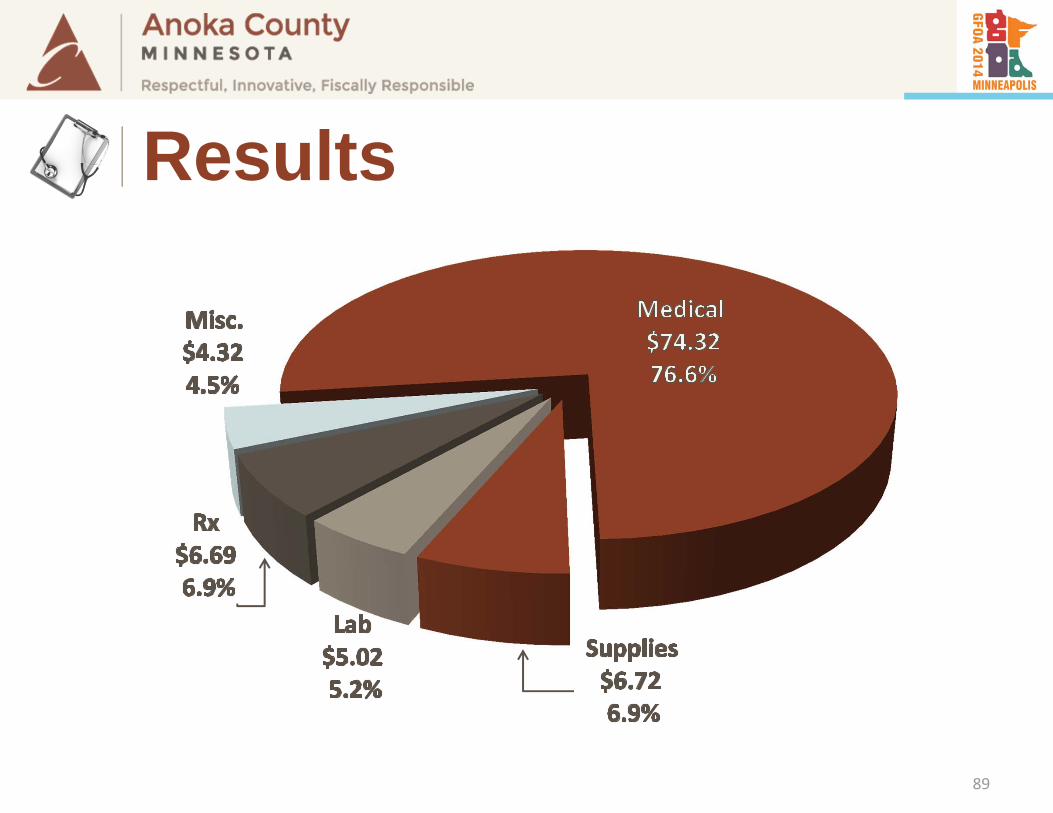
AVERAGE 261 $ 74.32 $ 1.42 $ 6.72 $ 5.02 $ 0.74 $ 5.95 $ 2.90 $ 97.07
As of December 31, 2013 93
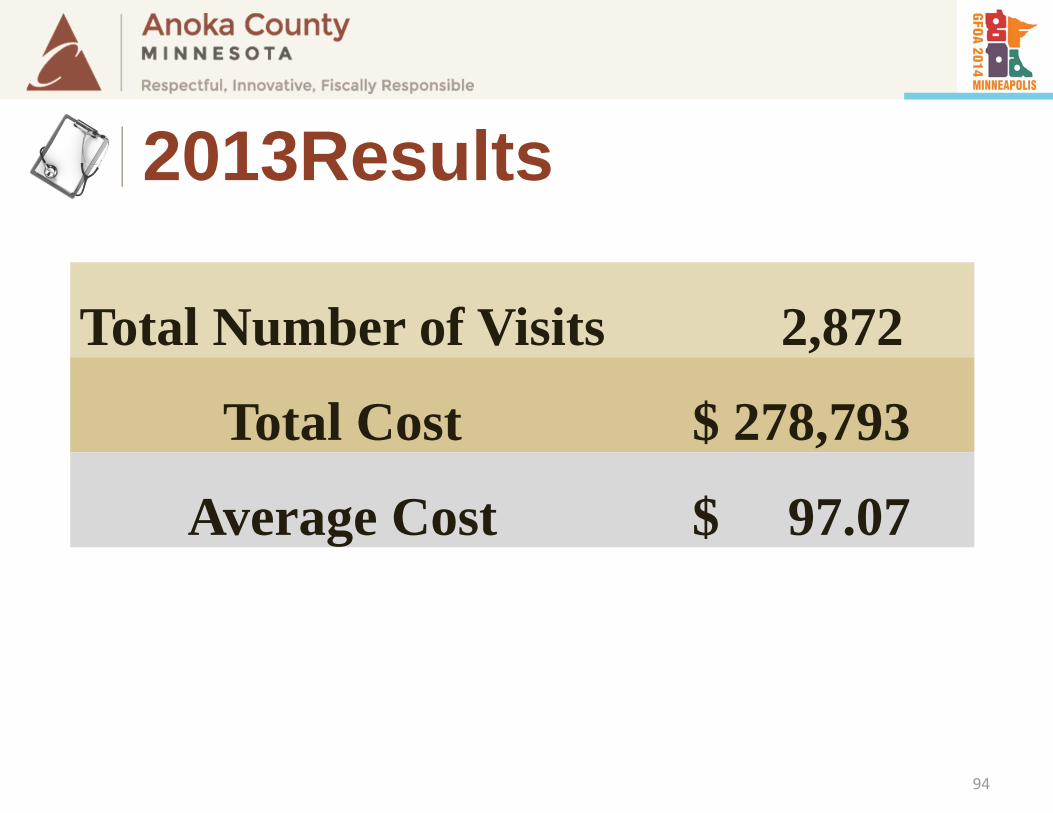
2013 Results
94
Total Number of Visits 2,872
Total Cost $ 278,793
Average Cost $ 97.07
2013Results
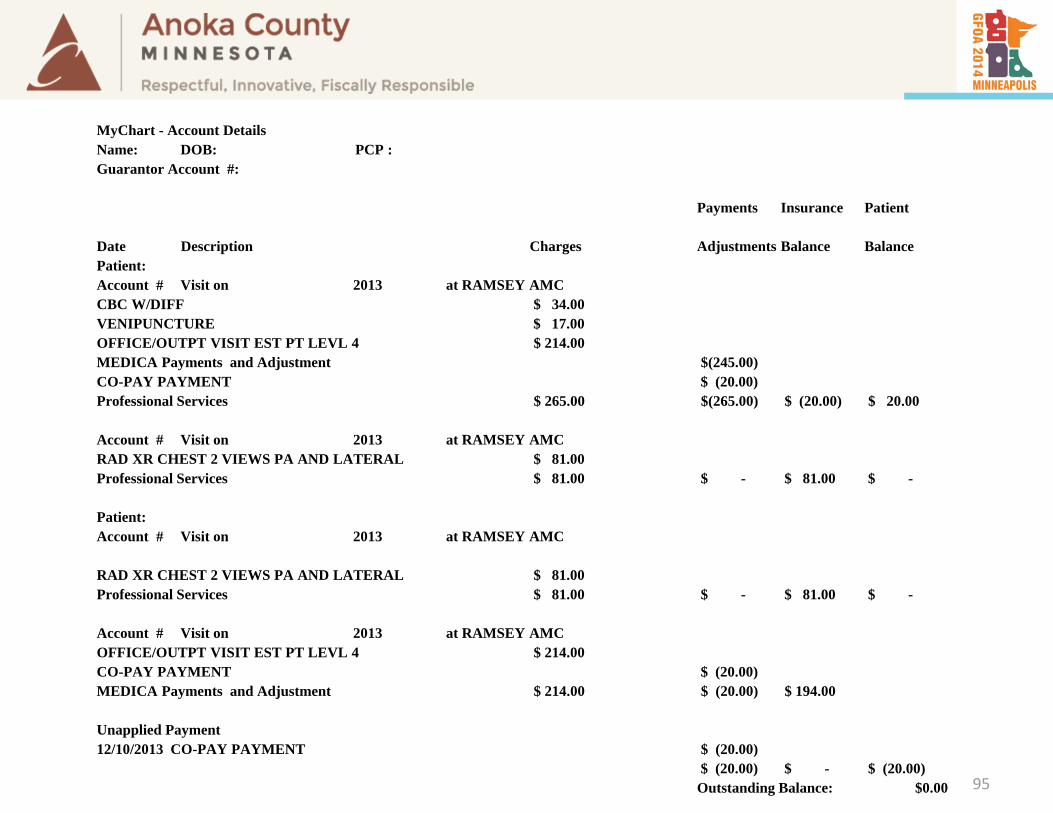
MyChart - Account Details Name: DOB: PCP : Guarantor Account #:
Payments Insurance Patient
Date Description Charges Adjustments Balance BalancePatient: Account # Visit on 2013 at RAMSEY AMCCBC W/DIFF $ 34.00 VENIPUNCTURE $ 17.00 OFFICE/OUTPT VISIT EST PT LEVL 4 $ 214.00 MEDICA Payments and Adjustment $(245.00)CO-PAY PAYMENT $ (20.00)Professional Services $ 265.00 $(265.00) $ (20.00) $ 20.00
Account # Visit on 2013 at RAMSEY AMCRAD XR CHEST 2 VIEWS PA AND LATERAL $ 81.00 Professional Services $ 81.00 $ - $ 81.00 $ -
Patient: Account # Visit on 2013 at RAMSEY AMC
RAD XR CHEST 2 VIEWS PA AND LATERAL $ 81.00 Professional Services $ 81.00 $ - $ 81.00 $ -
Account # Visit on 2013 at RAMSEY AMCOFFICE/OUTPT VISIT EST PT LEVL 4 $ 214.00 CO-PAY PAYMENT $ (20.00)MEDICA Payments and Adjustment $ 214.00 $ (20.00) $ 194.00
Unapplied Payment12/10/2013 CO-PAY PAYMENT $ (20.00)
$ (20.00) $ - $ (20.00)Outstanding Balance: $0.00 95
96
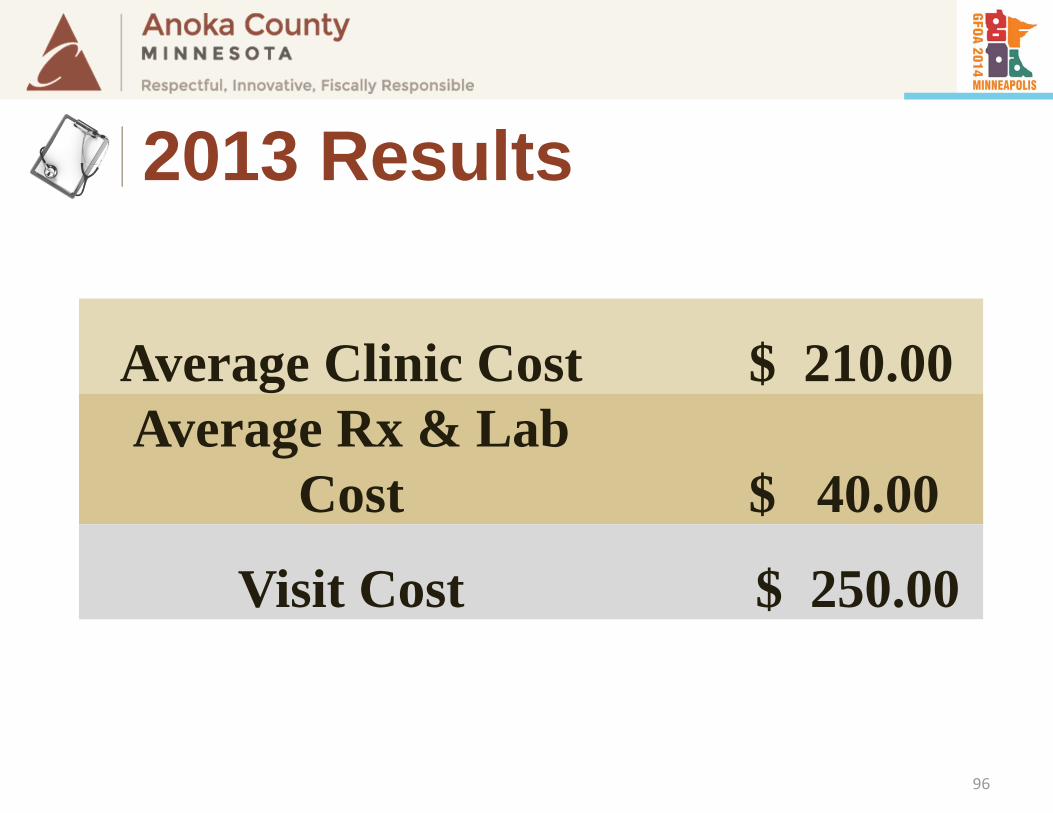
2013 Results
Average Clinic Cost $ 210.00Average Rx & Lab
Cost $ 40.00
Visit Cost $ 250.00
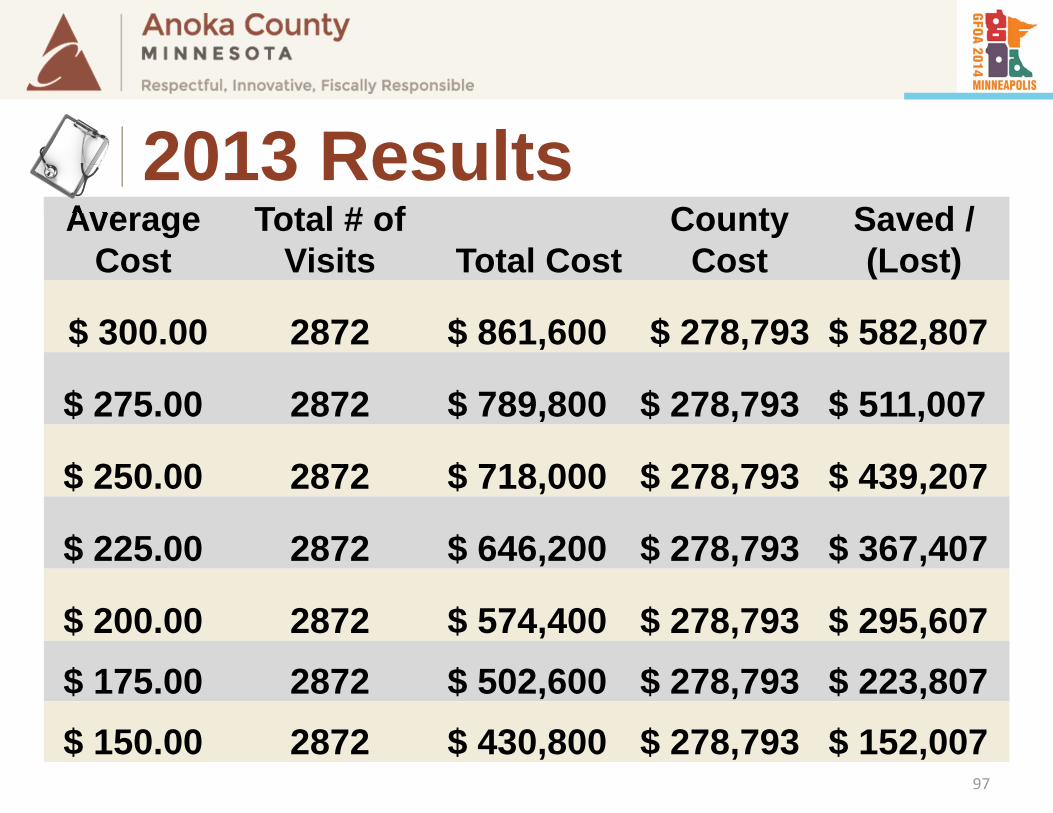
Average Cost
Total # of Visits Total Cost
County Cost
Saved / (Lost)
$ 300.00 2872 $ 861,600 $ 278,793 $ 582,807
$ 275.00 2872 $ 789,800 $ 278,793 $ 511,007
$ 250.00 2872 $ 718,000 $ 278,793 $ 439,207
$ 225.00 2872 $ 646,200 $ 278,793 $ 367,407
$ 200.00 2872 $ 574,400 $ 278,793 $ 295,607 $ 175.00 2872 $ 502,600 $ 278,793 $ 223,807 $ 150.00 2872 $ 430,800 $ 278,793 $ 152,007
97
2013 Results
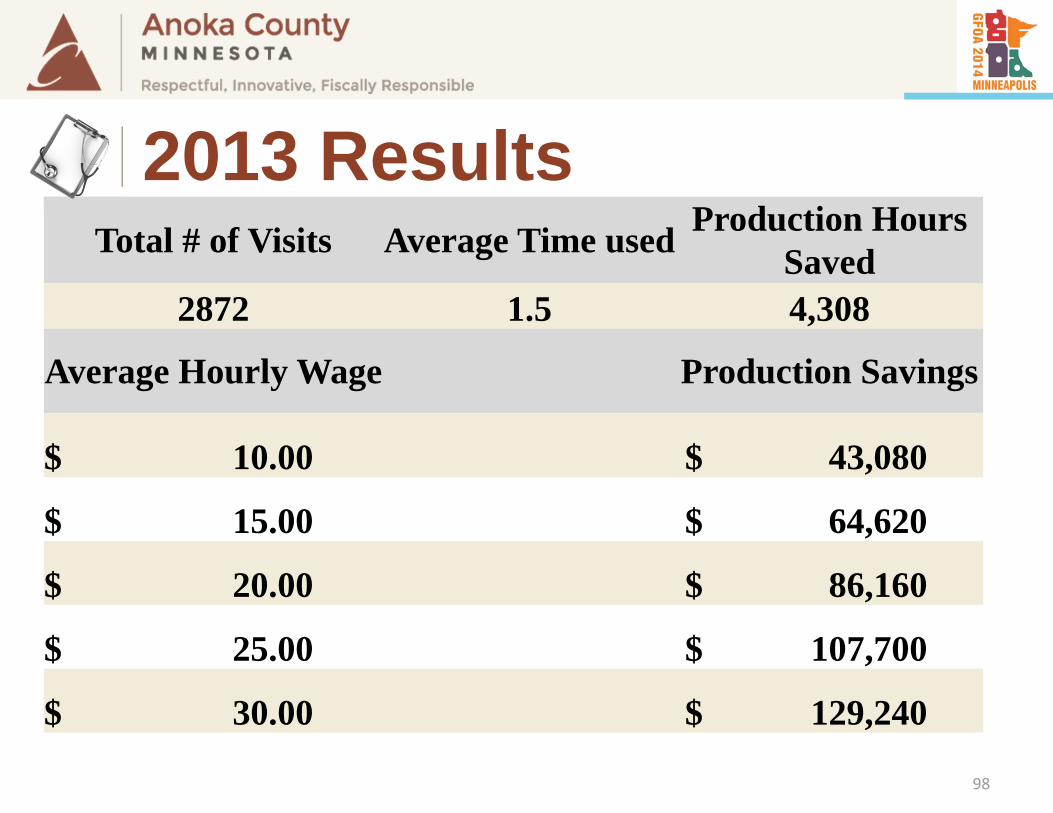
Total # of Visits Average Time used Production Hours Saved
2872 1.5 4,308
Average Hourly Wage Production Savings
$ 10.00 $ 43,080
$ 15.00 $ 64,620
$ 20.00 $ 86,160
$ 25.00 $ 107,700
$ 30.00 $ 129,240
98
2013 Results

COSTSAVINGS
99
Employee’s Perspective

What's next?
100
What’s Next?
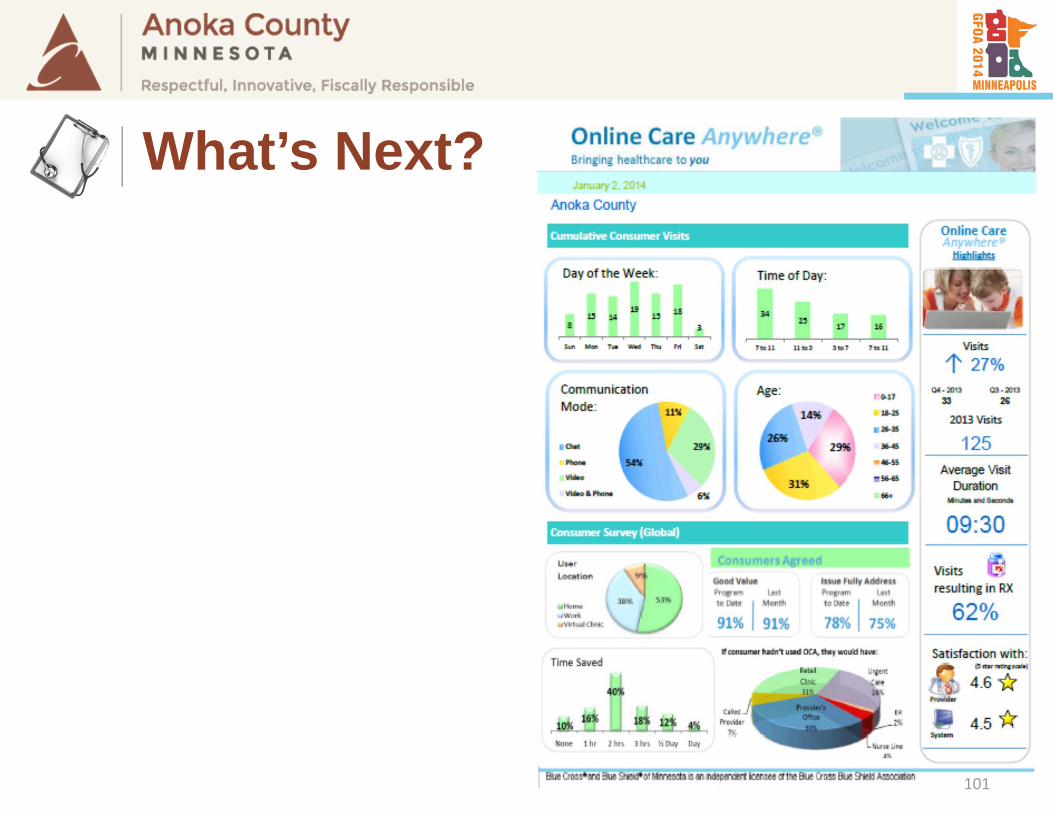
101
What’s Next?

102
What’s Next?

Dental103
What’s Next?

Rx Consulting104
What’s Next?

105
What We Learned

106
What We Learned

107
What We Learned
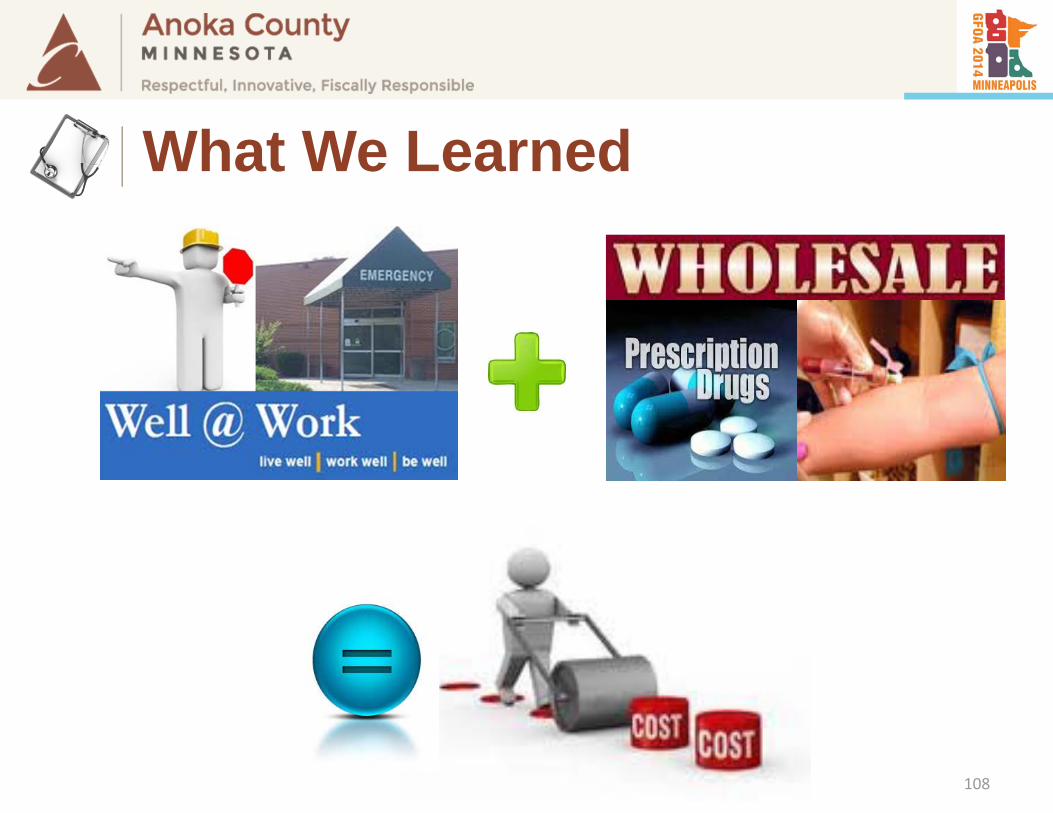
108
What We Learned
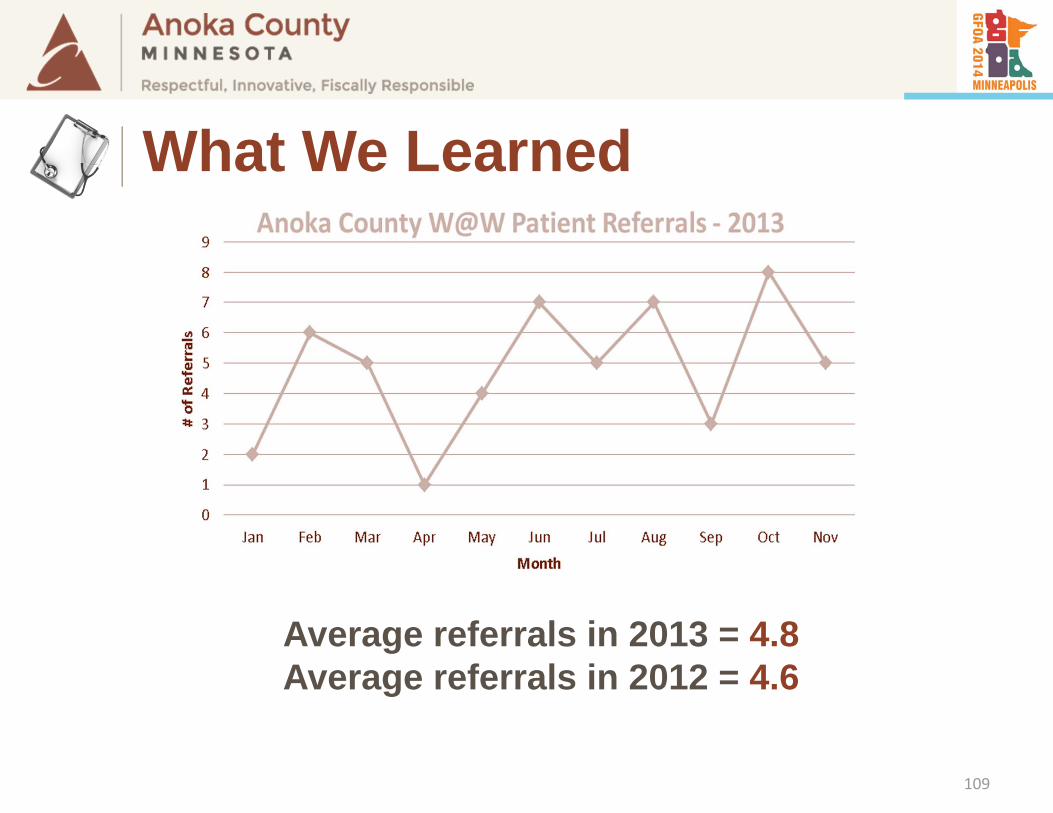
Average referrals in 2013 = 4.8Average referrals in 2012 = 4.6
109
What We Learned
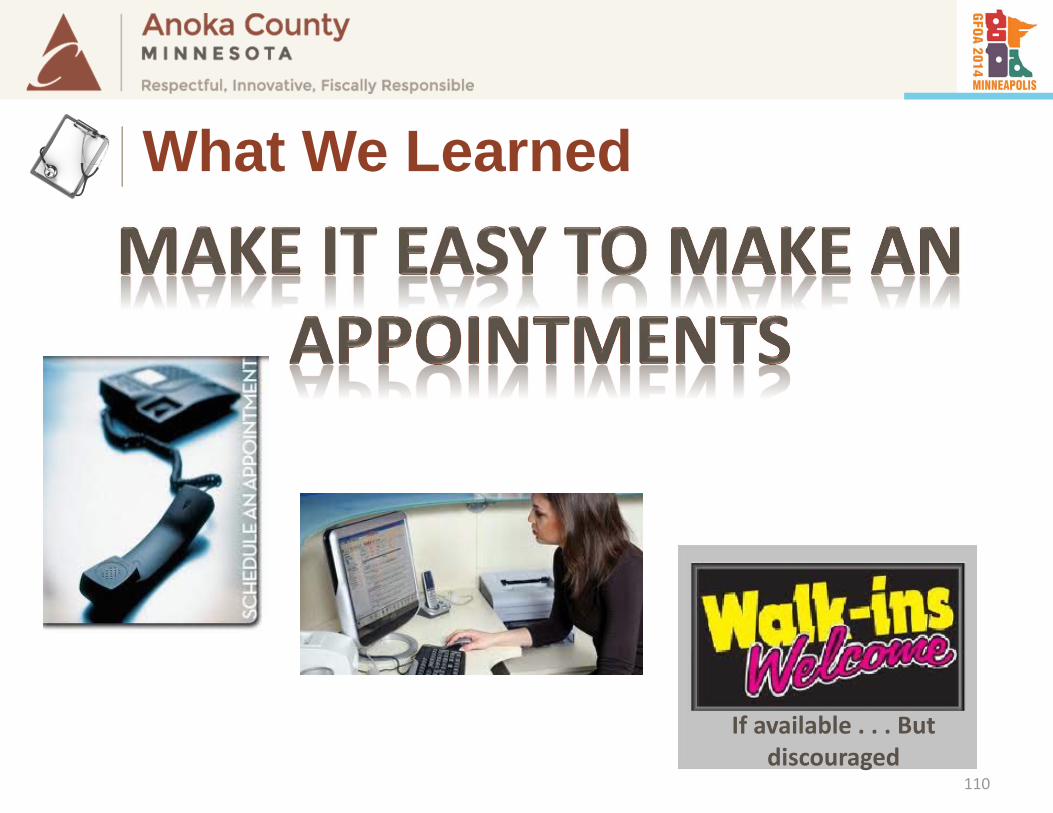
If available . . . But discouraged
110
What We Learned
111
What We Learned

112
What We Learned

113