Embed Size (px)
Citation preview
DE-FG36-08GO18180
Hawai’i National Marine Renewable Energy Center (HINMREC)
University of Hawai‘i
Final Report
1
Hawai’i National Marine Renewable Energy Center (HINMREC)
Final Technical Report
Recipient: University of Hawai‘i
Award Number: DE-FG36-08GO18180
Project Title: National Marine Renewable Energy Center in Hawai‘i
Project Period: 9/15/2008 – 9/30/2019 (per Mod 019; effective 07/19/18)
Principal Investigator: Luis Vega (through December 2017), Patrick Cross (beginning January 2018),
Manager, Hawai‘i National Marine Renewable Energy Center (HINMREC), [email protected], 808-
956-5196
Report Submitted by: Patrick Cross, Manager, HINMREC
Date of Report: 30 June 2020
Working Partners: Marc Ericksen, Sea Engineering ([email protected]);
Jarett Goldsmith, Garrad Hassan America (under DNVGL brand) [email protected]); Brian
Polagye, University of Washington ([email protected]);
Terry Lettenmaier, Williwaw Engineering ([email protected]).
Three associated faculty from University of Hawai’i: Kwok Fai Cheung ([email protected]), Margaret
McManus ([email protected]), Gerard Nihous ([email protected]).
Cost-Sharing Partners: University of Hawai’i (State Funds); Hawaiian Electric Company; Maui Electric
Company; Department of Business Economic Development & Tourism (State of Hawaii); Ocean Power
Technologies (USA); OCEANLINX (Australia); Lockheed Martin; Energy Island Ltd. (UK)
DOE Project Team: DOE HQ Program Manager – Alejandro Moreno
DOE Contracting Officer – Laura Merrick
DOE Grants Management Specialist – Jane Sanders
DOE Technology Manager – Steve Dewitt
DOE Technical Project Officer – Tim Ramsey
DOE/CNJV Project Monitor – Michael Carella

DE-FG36-08GO18180
Hawai’i National Marine Renewable Energy Center (HINMREC)
University of Hawai‘i
Final Report
2
Table of Contents
ACKNOWLEDGEMENTS ................................................................................................ 3
EXECUTIVE SUMMARY ................................................................................................ 4
MAJOR ACCOMPLISHMENTS AND FINDINGS ......................................................... 6
TASK 1: MANAGEMENT ............................................................................................... 6
TASK 2: OTEC RESOURCE ASSESSMENT AND SUSTAINABILITY ................... 32
TASK 3: WAVE RESOURCE MODEL, WAVE FIELD MEASUREMENTS AND DATA
ANALYSIS ....................................................................................................................... 50
3.1 Wave Forecasting .............................................................................................................................. 50
3.2 WETS Wave Measurements and Operational Wave Analysis .......................................................... 58
TASK 4: ENVIRONMENTAL IMPACT MONITORING AT WETS ........................... 61
4.1 Acoustic Signature Measurements ................................................................................................... 61
4.2 Electromagnetic Field Prediction, Measurement, and Protocols ..................................................... 69
4.3 Ocean Current and Wave Measurements with ADCPs ..................................................................... 70
4.4 Sediment Transport Analysis and Field Surveys ............................................................................... 74
4.5 Ecological and Seawater Chemical Analysis Surveys ........................................................................ 76
TASK 5: WAVE ENERGY CONVERSION DEVICE PERFORMANCE ..................... 76
5.1 WETS Test Protocols and Data Acquisition System .......................................................................... 77
5.2 Device Performance Analysis ............................................................................................................ 78
5.2.1 WEC Performance Model .......................................................................................................... 78
5.2.2 WEC Testing Phase Data Analysis .............................................................................................. 84
5.2.3 Hardware Reliability Surveys ..................................................................................................... 87
TASK 6: SUPPORTING STUDIES ................................................................................. 88
6.1 Operational Models for WEC Arrays ................................................................................................. 88
6.2 Alternate Mooring Designs ............................................................................................................... 90
6.3 Aluminum Corrosion and Biocorrosion Studies ................................................................................ 93

DE-FG36-08GO18180
Hawai’i National Marine Renewable Energy Center (HINMREC)
University of Hawai‘i
Final Report
3
ACKNOWLEDGEMENTS
This material is based upon work supported by the U.S. Department of Energy's Office of Energy Efficiency
and Renewable Energy (EERE) under the Water Power Technologies Office (WPTO) Award Number DE-
FG36-08GO18180. This report is the final research report for the Hawaii National Marine Renewable
Energy Center (HINMREC) at the University of Hawaii (UH), Hawaii Natural Energy Institute
(HNEI). (The HINMREC name will continue to be utilized by HNEI beyond the end of this award.)
This work would not have been possible without the generous support of the Department of Energy's EERE
and cost sharing partners: UH (State Funds); Hawaiian Electric Company; Maui Electric Company;
Department of Business Economic Development & Tourism(State of Hawaii); Ocean Power Technologies
(USA); OCEANLINX (Australia);Lockheed Martin, and; Energy Island Ltd. (UK). Partners in this effort
include: Sea Engineering, Det Norske Veritas group’s DNVGL, formerly Garrad Hassan America, Inc., the
University of Washington, the technology and device developers, and numerous regulatory and resource
agencies.
The authors would also like to acknowledge the complimentary funding efforts and collaboration of the US
Navy (Naval Facilities Engineering Command), US Naval Sea Systems Command via the Applied
Research Laboratory at UH (ARL-UH), and the US Office of Naval Research. For a comprehensive
overview of ocean energy research and development at UH, this report includes many of these related
efforts.
This report was prepared as an account of work sponsored by an agency of the United States Government.
Neither the United States Government nor any agency thereof, nor any of their employees, makes any
warranty, express or implied, or assumes any legal liability or responsibility for the accuracy,
completeness, or usefulness of any information, apparatus, product, or process disclosed, or represents
that its use would not infringe privately owned rights. Reference herein to any specific commercial
product, process, or service by trade name, trademark, manufacturer, or otherwise does not necessarily
constitute or imply its endorsement, recommendation, or favoring by the United States Government or
any agency thereof. The views and opinions of authors expressed herein do not necessarily state or reflect
those of the United States Government or any agency thereof.

DE-FG36-08GO18180
Hawai’i National Marine Renewable Energy Center (HINMREC)
University of Hawai‘i
Final Report
4
EXECUTIVE SUMMARY
This report summarizes activities at the University of Hawaii (UH) stemming from the establishment of the
Hawaii National Marine Renewable Energy Center (HINMREC) in 2008. The report covers a total of
eleven years of activity as a result of many no-cost extensions of this project. This was necessitated
primarily by lengthy delays in wave energy converter (WEC) device deployment schedules at the Navy’s
Wave Energy Test Site (WETS). The bulk of the work documented here was performed between the start
of the project when the contract was executed between the US Department of Energy (DOE) and the
University in March 2009 and the end of 2015. Work since that time, through the end of the project in
September 2019, was primarily in the form of remaining subcontracts with the University of Washington
for acoustic measurements/analysis, Williwaw Engineering for data collection and analysis support, and
Sea Engineering for ongoing at-sea support in the form of maintenance, inspections, instrumentation
deployments (ADCPs, acoustic platforms), and other logistics work. These activities continue at WETS,
now under Naval Facilities Engineering Command (NAVFAC) funding.
HINMREC was established to facilitate the commercialization of WEC devices and to accelerate
development and testing of Ocean Thermal Energy Conversion (OTEC) technologies. HINMREC was
housed at the Hawaii Natural Energy Institute (HNEI) of UH and had a primary objective of facilitating the
development and implementation of commercial wave energy systems. In recognition of the high costs
associated with at-sea testing and evaluation of WEC devices, it was deemed imperative that HINMREC
seek ways to reduce costs to developers by providing key research support to these early-stage technologies.
The DOE tasked HINMREC with facilitating and accelerating the build-out of WETS, the nation’s first
grid-connected open water wave energy conversion test facility, located off Marine Corps Base Hawaii
(MCBH) in Kaneohe, on the island of Oahu. An existing test berth developed by the Navy at 30m water
depth formed the core of the new WETS facility, which was expanded to include test berths at 60m and
80m water depths. The environmental assessment (EA) for this expansion was completed by the Navy in
early 2014, and the new berths were installed in September 2014 (moorings) and June 2015 (cables to
shore). This provided the capability to simultaneously test up to 3 WEC devices, with a maximum power
production for any single WEC of 1MW. This facility and HINMREC’s support allows development and
commercialization of wave energy technology by providing a testing infrastructure that allows technology
developers to test, demonstrate and evaluate their WEC devices, and generate data in order to advance WEC
designs toward commercial readiness. A recap of these efforts under DOE/HINMREC funds is provided
in this report, including the ways in which this DOE-funded work transitioned effectively to Navy-funded
tasks in support of WETS.
HINMREC collaborated with the NAVFAC to implement the full three-berth WETS, providing grid-
connected test berths for WEC devices with power output up to 1 MW. A major HINMREC activity was
supporting the NAVFAC team in this expansion of WETS. With input from HINMREC environmental
studies, an extensive and lengthy EA effort was undertaken by NAVFAC, contracting with an independent
environmental firm in accordance with the National Environmental Policy Act (NEPA). The EA resulted

DE-FG36-08GO18180
Hawai’i National Marine Renewable Energy Center (HINMREC)
University of Hawai‘i
Final Report
5
in a Finding of No Significant Impact (FONSI) in February of 2014, allowing the expansion and operation
of WETS to proceed. The EA means WEC developers do not have to obtain additional permits to test at
WETS.
The 60m and 80m berth designs were completed in July 2014, and three-point mooring systems were
installed in September of that year. Submarine power cables to shore were installed June 2015, and all
shore infrastructure (switchgear, cabling, fiber routing, and refurbishment of Battery French bunker on
MCBH) was completed that year. The design and installation of all WETS infrastructure was carried out
under Navy contract to Sound and Sea Technologies, Inc.
WETS now allows for testing in water depths of 30m, 60m, and 80m. HINMREC’s primary role in the
establishment of the full site was in the form of wave resource characterization and site survey, including
bathymetry and bottom type for mooring system planning. Specifically, HINMREC commissioned Sea
Engineering, Inc. to collect high-resolution bathymetric data within the WETS EA bounds, as well as
detailed bottom type data, including sand thickness. As WETS is characterized by varying thickness of
sand (from none to over 20m in some areas), a key was locating areas where sand thickness was suitable
for the placement of large drag-embedment anchors included in the deep berth mooring design.
HINMREC’s role once the site was fully permitted in early 2014 was to begin independent WEC device
power performance analysis and evaluation in support of deployed pre-commercial WECs and to monitor
their acoustic and electromagnetic field (EMF) signatures once deployed on site. While EMF
measurements were ultimately dropped due to non-availability of measuring systems and a growing
acceptance that these impacts will be negligible for the anticipated levels of power production at WETS,
many acoustic measurements were made by HINMREC and are now continuing under Navy funding.
These essential roles of power performance assessment and environmental monitoring will be discussed in
detail in this report and the associated subject area reports, journal publications, and presentations listed
throughout.
The report also covers some related WETS activities supported by Navy funding, including significant
efforts to outfit a site-dedicated support vessel, conduct mooring redesign and repair work after key failures
occurred, and to conduct a second deployment of each of the first two WECs deployed at WETS – the
Northwest Energy Innovations (NWEI) Azura and the Fred. Olsen Lifesaver.
Key findings of this work indicate that the wave regime at WETS is ideal to test, demonstrate and evaluate
precommercial WEC devices, as well as wave energy as it applies to alternative markets. WETS is
characterized by a robust year-round wave regime, driven by the dominant trade winds, providing excellent
test conditions that are well suited to the state of the fledgling wave energy industry, and to testing of
projects of relevance to DOE’s Powering the Blue Economy initiative. Further, the site experiences
substantial winter swells from the north, as well as strong winter frontal systems that allow for assessment
of WEC device and mooring survival in heavier seas – occasionally exceeding 5m significant wave height.
Wave energy is considered early stage R&D, and many such projects are less well suited to test sites with
more extreme conditions, such as the developing PacWave site in Oregon or the well-established Billia

DE-FG36-08GO18180
Hawai’i National Marine Renewable Energy Center (HINMREC)
University of Hawai‘i
Final Report
6
Croo open-ocean test site run by the European Marine Energy Center (EMEC) in Scotland. Therefore, a
key recommendation stemming from HINMREC’s experience at WETS is that DOE continue to work with
the Navy to support continuation of WETS beyond the currently planned FY2023 decommissioning.
A secondary objective in the establishment of HINMREC was to assist the private sector in moving ocean
thermal energy conversion (OTEC) systems beyond proof-of-concept to pre-commercialization. This work
was largely completed in the earlier years of HINMREC before the emphasis shifted primarily to supporting
WETS. The technical role of the Center was primarily to focus on system and component engineering, and
local and global investigations into the potential environmental impacts of OTEC systems. HINMREC was
tasked with maintaining high-resolution models of ocean thermal resources and the potential sustainable
power output of OTEC systems. Ongoing tests begun previously under ONR funding at the OTEC Heat
Exchangers (HXs) Test Facility at the Natural Energy Laboratory of Hawaii Authority (NELHA), in Kona
on Hawaii Island, have been continued to identify cost-effective aluminum alloys for use in OTEC systems
operating in the corrosive marine environment. These studies will also be summarized in this report.
The report is organized according to the DOE tasking defined in the original award as follows:
1. Management
2. OTEC Resource Assessment and Sustainability
3. Wave Resource Modeling, Wave Field Measurements, and Data Analysis
4. Environmental Impact Monitoring at WETS
5. WEC Device Performance Analysis
6. Supporting Studies.
The work that has been accomplished under each of these tasks is described, including the initial objective,
approach and accomplishments, challenges, impacts and resulting project changes, and results and
deliverables. Further detail can be found in the publications, reports, and presentations listed in each task
that were produced through these efforts and are available, or linked, on HNEI’s website at
https://www.hnei.hawaii.edu/publications/project-reports#HINMREC.
MAJOR ACCOMPLISHMENTS AND FINDINGS
TASK 1: MANAGEMENT
Later sections of this report will focus on specific project tasking related to HINMREC’s efforts in OTEC,
wave resource characterization, environmental monitoring, WEC performance monitoring and modeling,
and some supplemental studies. This Task 1 section will cover numerous topics not specifically addressed
in those sections in more detail, including some site development history and process, physical

DE-FG36-08GO18180
Hawai’i National Marine Renewable Energy Center (HINMREC)
University of Hawai‘i
Final Report
7
characteristics of the Wave Energy Test Site (WETS), outfitting of a site-dedicated vessel for WETS, and
a high-level summary of the wave energy converter (WEC) deployments conducted to date at WETS.
While not all of this work was specifically under HINMREC (DOE) funding, it is provided to give a more
comprehensive account of WETS activities to date, with the intent to make clear to the reader which agency
sponsored which related activities.
The Hawaii Natural Energy Institute (HNEI), at the University of Hawaii at Manoa (UH), has provided
extensive project management throughout the duration of the HINMREC funding. In the first several years
of the project, work focused on developing and facilitating partnerships between marine power system
developers, utility companies, financing sources, engineering and environmental support companies,
academia, government agencies, and NGOs.
Additionally, university engineering and science efforts were initiated to focus on industry needs, and DOD
interest and funding was coordinated. The science and engineering studies included: advanced wave
forecasting, numerical modeling of wave energy conversion devices, grid modeling, environmental impact
studies, reliability and survivability, and corrosion and biofouling. A HINMREC website was established
as a virtual center and repository for information developed through these efforts. Environmental studies
and support to Navy permitting efforts at WETS were also initiated, along with identification of
infrastructure needs for grid-connected testing. OTEC test facilities were enhanced at NELHA, working
with industry to establish effective testing and validation of OTEC heat exchangers, and studies were
initiated relevant to local and global OTEC resources and impacts.
At the outset of the program, three potential wave energy test sites were investigated in Hawaii. The
northeast coast of Maui, about 1 km offshore of Pauwela Point was considered as a site to test wave power
systems in collaboration with Maui Electric Company (MECO); to conduct environmental studies to assist
WEC developer Oceanlinx’s permitting effort; and to leverage MECO investment in undersea infrastructure
to expand for use by others. On Oahu, Makai Pier near Makapuu Point was investigated as a potential test
site to obtain long term data series on the wave energy resource and other environmental parameters;
provide an easily accessible site for the deployment and testing of small wave energy conversion devices
and components; and to conduct research on corrosion and innovative materials. Also on Oahu, Marine
Corps Base Hawaii (MCBH) at Kaneohe was explored and later determined to be the best site to develop a
wave energy test site. This site was previously developed under ONR funding, and was intended to
demonstrate the feasibility of wave power for naval facilities worldwide. Under ONR funding, the site was
equipped with undersea power and fiber optic cabling to a single berth at 30m water depth. Ocean Power
Technologies (OPT) began testing a single 40 kW buoy at a depth of 30m in June 2004, with the up and
down motion of a float around a spar used to drive a generator and send generated power to shore via the
undersea cable.
Also under ONR funding, an extensive Environmental Assessment (EA) was completed for the Navy by
an independent environmental firm, in accordance with the National Environmental Policy Act (NEPA).
This was for the purpose of expanding the site to include the two additional test berths – at 60m and 80m
water depths. The EA was nearly a three-year effort, supported by HINMREC in the form of extensive site
DE-FG36-08GO18180
Hawai’i National Marine Renewable Energy Center (HINMREC)
University of Hawai‘i
Final Report
8
characterization, and resulted in a Finding of No Significant Impact (FONSI) in February 2014. HINMREC
then supported the Navy’s installation of WETS hardware, including the deep berth mooring hardware in
September 2014 and the cables to shore in June 2015.
In more recent years, HINMREC has shifted primarily to supporting Navy, DOE, and WEC developer
efforts to deploy and test WECs at WETS, beginning in 2015 with the NWEI Azura device. HNEI has
supported WEC testing at WETS in three key ways: 1) environmental monitoring, 2) independent WEC
device performance analysis, and 3) development of operational and maintenance protocols. The
environmental monitoring program at WETS was designed to include device acoustic signature
measurement, device and power cable electromagnetic fields (EMFs), and possible changes in
device/mooring-induced sediment transport, seawater chemistry, and the ecological environment.
(Ultimately, EMF was dropped as a focus due to a consensus that the likely levels of EMF at WETS would
be insignificantly small. Some future EMF measurements may be made under separately funded DOE
programs.) Independent device power performance for the devices deployed during the HINMREC era
were conducted by measuring the incident wave field with two redundant Waverider© buoys (the first
procured and deployed with DOE funds in October 2012 and the second with ONR funds in August 2016),
and developing power matrices by collecting device power output for the length of the deployment. Wave
and current measurements were also made with periodic deployments of an Acoustic Doppler Current
Profiler (ADCP). In addition to power performance assessment, HINMREC also performed regular ROV
and diver device and infrastructure inspections to monitor device and mooring system degradation, allowing
creation of device-specific maintenance protocols. To support WEC deployments, numerical modeling
efforts were also initiated, including both daily wave forecast modeling and hydrodynamic modeling of
WEC performance.
A primary objective in the establishment of WETS was to reduce the considerable costs to developers
associated with at-sea testing and evaluation of WEC devices. Providing regular device and mooring
inspections are a key component of this support. Additionally, mooring design improvements and repairs
were also found to be essential (more on this below), due to failures diagnosed during HINMREC
inspections. Additionally, under NAVFAC funding, HNEI contracted with a local ocean engineering
company to obtain and modify a support vessel intended as a site-dedicated resource. This vessel can be
rapidly deployed to WETS and continues to be used under Navy funded work at WETS. Further, a limited
amount of emergency maintenance response funding is provided to tenants at WETS, furthering HNEI’s
ability to fully document device reliability issues and develop operational and maintenance protocols for
DOE and the Navy, while contributing to the fiscal unburdening of typically cash-strapped WEC
developers. Developers remain responsible for major emergency responses, as well as WEC device
deployment and recovery, but are financially aided by these funds. While the vessel outfitting and provision
of maintenance support are through Navy funds, the recognition of these needs can be directly attributed to
lessons learned through the execution of the HINMREC project.
The results and outcomes described in the subsequent Task sections of this report demonstrate extensive
coordination provided by HINMREC management. In summary, management efforts involved oversight

DE-FG36-08GO18180
Hawai’i National Marine Renewable Energy Center (HINMREC)
University of Hawai‘i
Final Report
9
of numerous research activities within UH, oversight of multiple subcontracts, quarterly reporting to DOE,
participation in DOE Peer Reviews, and extensive interaction with NAVFAC EXWC in the expansion of
WETS from one to three berths, and in the transfer of site support functionality from DOE funds to Navy
funds.
Management efforts have been focused on WETS for the past several years, with some OTEC studies
continued under ONR funding. OTEC-related research, concentrated in the first several years of the
HINMREC program, will be summarized in the next section. In terms of management, these projects
involved providing guidance and direction to a number of UH researchers in varying fields of study of
relevance to OTEC and overseeing those projects to completion.
In more recent years, the vast majority of effort under HINMREC funding was related to the establishment
of WETS, and initial WEC testing at WETS. The major WETS activities that have commanded attention
by HINMREC management are summarized in Table 1.1 below. Note that not all of these activities were
conducted under DOE funds – many, particularly in the latter part of the table, were conducted with Navy
funds, but are included here for the sake of presenting a reasonably complete sequence of major events at
WETS. Navy funding has been directed to HNEI through the Applied Research Laboratory (ARL-UH).
Developers that have tested their WEC devices at WETS include:
● Ocean Power Technologies (OPT) PowerBuoy® (prior to the establishment of HINMREC, and
continuing into 2011, although without direct support provided by HINMREC or UH).
● Northwest Energy Innovations (NWEI) – Baseline Azura under DOE funds from June 2015 to
December 2016, and Modified Azura under Navy funds through ARL from February to August
2018.
● Fred. Olsen, Lifesaver – First deployment under Navy funds, through Sound and Sea Technology,
March 2016 to April 2017, and second deployment (with University of Washington AMP system
integrated) under Navy funds through ARL from October 2018 to March 2019.
Each WEC deployment is covered in more detail below (under WEC Deployments). At the writing of this
report, several additional WEC deployments are pending, including the Ocean Energy OE35 oscillating
water column (OWC) device slated for the 60m berth in late 2020 or early 2021, the Oscilla Power Triton-
C device slated for the 30m berth in that same timeframe, a smaller (1kW average) device from Columbia
Power Technologies (SeaRay) in fall of 2020 (not at a test berth and not cabled to shore), a larger Columbia
Power device (StingRay) at the 80m berth in 2022, Aquaharmonics WEC at 30m (following the Oscilla
deployment at the 30m berth), and a grid-scale version of the NWEI point absorber WEC at the 80m berth,
likely also in 2022. Others may follow, and/or be inserted into this rough schedule, depending on the future
funding status of WETS and other programmatic developments at NAVFAC and DOE.

DE-FG36-08GO18180
Hawai’i National Marine Renewable Energy Center (HINMREC)
University of Hawai‘i
Final Report
10
Table 1.1. Summary of major Wave Energy Test Site (WETS) activities.
Event Date(s) Comment
3 PowerBuoys® deployed at 30m
berth
December, 2002-2011 Navy program, prior to
HINMREC.
60 & 80m Berths: EA/FONSI Issued February 2014 Navy funded 3-year process
60 & 80m Berths: Final Design Issued July 2014 Navy funded, aided by HINMREC
surveys.
60 & 80m Berths: 3-point Mooring
Systems
Installed September 2014 Navy funded install by Sound and
Sea Technology (SST.
60 & 80m Berths: two submarine
power cables
Installed June 2015 Navy funded, 9 months after
mooring systems to make use of
cable laying ship presence in
Hawaii for other Navy jobs.
Azura baseline tests and
performance data gathering at 30m
berth
May 2015 to December 2016 Baseline Azura
installation/operations under
EA/FONSI, issued in 2003 for
testing of six point absorbers:
three already under OPT.
LifeSaver deployed at 60m berth,
for tests and performance data
gathering
March 2016 to March or
April 2017
Not grid-connected, removed
from WETS April 20, 2017.
80m Berth: unoccupied but two of
three mooring lines failed
February 2016 (leg B-2) &
December 2016 (leg B-1)
Mooring system failed before any
device was deployed.
60m Berth: 1 of 3 mooring lines
failed
February 2019 (leg A-1) Similar failure to those observed at
80m berth.
60m & 80m Berth: Repairs May/June 2019 completion
for 60m berth, 80m berth
repairs pending, anticipated
in spring 2021.
ARL-UH contracted SST to
conduct repairs. Extensive design
support from DNV
GL. Larger chain, pretension
system.

DE-FG36-08GO18180
Hawai’i National Marine Renewable Energy Center (HINMREC)
University of Hawai‘i
Final Report
11
The modified Azura, (with added
heave plate and larger float),
deployed (with Navy funds) at 30m
berth.
February 2018 to August
2018.
Improved device motion, but no
improvement in power due to PTO
capabilities. Device scrapped in
Honolulu.
Lifesaver re-deployed (under Navy
funds) at 30m berth. UW AMP and
WiBotic charging system
integrated and received power from
WEC.
October 2018 to March 2019. Power Take-offs (PTOs)
connected 6 days after
deployment. Two-part installation
sequence to allow for curing of
rock bolt epoxy for PTOs. Device
recovered March 2019, and due to
weather, removal of remaining
hardware completed April 2019.
60m Berth: Installation of mooring
repairs, pull test, installation of no-
WEC hawser.
May 2019 mooring repair
installation, 8 June 2019 pull
test, 22 June 2019 no-WEC
install.
Operations broken into phases due
to available weather windows.
60m Berth: Cable anchor
modifications and bend-strain relief
(BSR) replacement
November 2019 for 60m
berth.
Necessitated by damage to BSR
during original deployment and
need to lighten anchor for future
ops. Umbilical attachment
hardware also changed.
80m Berth: Cable anchor modified. Anticipated in
spring/summer 2021.
Navy funded, same changes as at
60m berth.
Ocean Energy OWC deployed at
60m berth.
Anticipated spring 2021. HINMREC planning. Device
arrived in Hawaii December 2019;
deployment delay due to damages
in transit from Portland.

DE-FG36-08GO18180
Hawai’i National Marine Renewable Energy Center (HINMREC)
University of Hawai‘i
Final Report
12
To disseminate findings, and as required by DOE, all findings have been documented using the Internet
and through participation in appropriate conferences, meetings and presentations, publications in peer-
reviewed technical journals, and other publications and reports. A HINMREC website was developed to
serve as an information repository and has led to substantive working relationships with developers, US
National Oceanic and Atmospheric Administration (NOAA), National Renewable Energy Laboratory
(NREL), U.S. Department of the Interior, Bureau of Ocean Energy Management (BOEM), NAVFAC,
Mexico, Spain, UK, Norway, American Samoa as well as sister National Marine Renewable Energy
Centers. Content of the HINMREC website is being transitioned to the HNEI website and will continue to
be available online at http://www.hnei.hawaii.edu/hinmrec/.
In HNEI’s management capacity with the HINMREC program, advice was provided to WETS tenants and
interested WEC developers (e.g., Ocean Energy, Columbia Power, Oscilla, NWEI, Aquaharmonics, and
others who expressed in interest in possible future testing at WETS), along with permitting, engineering,
logistics, wave resource information, mooring design and repairs, and access to a Navy funded, dedicated
support vessel. HINMREC also developed relationships and exchanged information with WEC and OTEC
developers, the local electric utilities, and regulatory agencies, as well as guiding UH research to address
the needs of developers and designers.
WETS Test Berth Development and Related Activities
The ultimate objective of this effort was to support development and commercialization of wave energy
technology by providing open ocean testing infrastructure that allows WEC developers to prove their
devices and generate the necessary data to advance their designs toward commercial readiness. HINMREC
proposed expanding limited testing of single WEC devices located off MCBH in Kaneohe, Oahu in 2010
with the data, research, and initial experience from the HINMREC program, along with discussions with
DOE, OPT and Navy.

DE-FG36-08GO18180
Hawai’i National Marine Renewable Energy Center (HINMREC)
University of Hawai‘i
Final Report
13
WETS emerged as nearly ideal for early stage WEC device at-sea tests. The wave resource is well suited
for testing, in that there is a robust wave regime year-round due to the consistent tradewind-driven waves,
and maintenance, deployment and retrieval operations are feasible (though often require a substantial wait
for ideal weather windows) at any time of year, (Figure 1.1). The wave resource is reliable year round, and
is characterized by an annual average power flux of 10 to 15kW/m, with a significant number of events
exceeding 40 kW/m (particularly in the winter months), as well as quiet periods providing year round access
to WEC devices (Figure 1.2). Winter north swells and low-pressure system (storm) passages allow
validation of WEC performance in more severe conditions to assess survivability. WEC devices can be
tested in reasonably deep water without long power cabling to shore, and the MCBH bunker is situated on
a hill close to shore, allowing for visual/camera observation and communications (direct line of site) without
construction of a tower. MCBH is supportive of renewable energy development and has been an
outstanding host to WETS activities. Additional advantages include: 1) Dive operations for inspections
are enhanced by excellent underwater visibility in Hawaii, 2) the existing Waverider© buoys are supported
by the PacIOOS infrastructure within UH, 3) University and locally-based private sector expertise in ocean
engineering and oceanography are abundant, and 4) the test site is quite close (about 3.5 nautical miles) to
a state boat harbor (He’eia Kea Small Boat Harbor), and readily accessible from staging areas in Honolulu
Harbor and Pearl Harbor (within a day’s transit - roughly 40nm distant). Short-term staging at the MCBH
fuel pier and facilities at MCBH Waterfront Operations are also available to WETS activities, in
coordination with appropriate personnel at the base.
Figure 1.1. Monthly average wave power flux (kW/m) at WETS (black curve), as compared with two other
potential wave energy testing/commercialization areas. The WETS regime allows year round deployment and
retrieval operations, as compared with more severe offshore environments (such as Reedsport, Oregon and Pauwela,
Hawaii).

DE-FG36-08GO18180
Hawai’i National Marine Renewable Energy Center (HINMREC)
University of Hawai‘i
Final Report
14
Figure 1.2. Daily wave power flux for a representative year (2009). WETS annual average power flux is 10 to
15kW/m, with significant winter events exceeding 40 kW/m, but quiet periods can occur throughout the year.
With these findings in hand, DOE tasked HINMREC with facilitating and accelerating the build-out of
WETS – the nation’s first grid-connected open water wave energy conversion test facility. The concept
was to expand existing facilities to provide multiple berthing for devices in the 100 to 500 kW (or more)
range, in water depths ranging from 30m to 80m. Adding to the existing 30m test berth, two additional
berths were ultimately planned, to provide simultaneous testing of up to 3 WEC devices in the 10 to 1000
kW range, at depths of 30m, 60m, and 80m. The final configuration of the site, including 3-point moorings
at the two new deeper berths, is shown in Figure 1.3.

DE-FG36-08GO18180
Hawai’i National Marine Renewable Energy Center (HINMREC)
University of Hawai‘i
Final Report
15
Figure 1.3. WETS mooring configuration and bathymetry map showing the three mooring sites at 30m, 60m, and
80m depth, along with the underwater power and communication cables (De Visser and Vega 2014).
HNMREC contracted with Sea Engineering Inc. to conduct site investigations in support of the
development of the expanded test site. The surveys included multibeam bathymetry, side scan sonar, sub-
bottom profiling and remotely operated vehicle (ROV) video. These surveys were completed in 2011 -
reports are listed under Reports and Publications below.

DE-FG36-08GO18180
Hawai’i National Marine Renewable Energy Center (HINMREC)
University of Hawai‘i
Final Report
16
The bathymetric survey was conducted using multibeam sonar systems to provide high-resolution water
depth over the proposed WETS EA area. A sub-bottom profiling system, designed to provide information
on sedimentary layers below the seafloor, was also used at the site. Key findings of the surveys included:
reef limestone hard bottom is prevalent inshore of the 50 meter depth contour; a band of sediment, 5 to 12
meters thick and approximately 250 meters wide, is present at water depths of 55 to 65 meters; 1 to 2 meters
of sand is typical from the 65 to 75 meter water depths; minimal sand is present in the eastern part of the
project area seaward of the 75 meter contour; and there are barchan dunes in the northeastern corner of the
site about 1-2 meters thick. Later bathymetric surveys revealed: the nearshore portion of the project area,
between depths of 30 and 35 meters is relatively featureless and flat, with slopes ranging from 1V:34H to
1V:54H; a steeply sloping, irregular bottom is present at water depths between 35 and 45 meters, with
slopes as steep as 1V:8H occurring between 40 and 45 meter water depths; between depths of 50 and 75
meters, the seafloor appears featureless, with little vertical relief, and typical slopes of 1V:25H; between
depths of 75 and 85 meters in the northeastern corner of the project site, the bottom is relatively flat
(1V:65H), and has barchan bedform features approximately 1.5 meters high, 150 to 200 meters long, and
up to 100 meters wide, (barchans are arcuate, isolated dune forms, characteristic of an environment with a
limited supply of sand); in the western portion of the site, at water depths deeper than 55 meters, the bottom
slopes steeply into a pronounced submarine canyon. These characteristics are shown in Figure 1.4.
Following initial design analysis using the 2011 survey results, the WETS site was expanded 1000m to the
west to accommodate the anticipated mooring footprint of the WEC devices. Additional bathymetry, sub-
bottom and side scan surveys were completed to characterize and map the expanded area.

DE-FG36-08GO18180
Hawai’i National Marine Renewable Energy Center (HINMREC)
University of Hawai‘i
Final Report
17
Figure 1.4. WETS bathymetry and sub-bottom profile data obtained by Sea Engineering, Inc., showing areas of
thicker sand deposits suitable for placement of drag embedment anchors for the two new deeper berths.
In a collaborative effort led by HINMREC, and based on the bottom data collected by Sea Engineering Inc.,
the site designers for the Navy, Sound and Sea Technology (SST), were able to identify suitable areas of
thick sand to support the emplacement of drag embedment anchors for the 3-point deep water moorings at
60m and 80m. The data were also used to identify cable paths that would minimize any impact on local
coral ecosystems, resulting in the site layout (shown above in Figure 1.3).
In summary, the ocean bottom in the vicinity of WETS is a combination of rock, sand, and coral. A plot of
the bathymetry and bottom composition, with yellow and red areas depicting thicker deposits of sand, is
shown in Figure 1.5, with the final placement of the new 3-point mooring berths also shown.

DE-FG36-08GO18180
Hawai’i National Marine Renewable Energy Center (HINMREC)
University of Hawai‘i
Final Report
18
Figure 1.5. WETS bathymetry and bottom composition profile, with yellow and red areas depicting thicker deposits
of sand, and placement of test berths, with deep water berths moored in areas of thicker sand deposits.
The pre-HINMREC 30m mooring berth also has a three-point mooring system (a tri-moor configuration).
In this case, the only permanent hardware is the anchors themselves, with two rock-bolted wagon wheel
type anchor bases and one large gravity anchor. These anchors are typically configured with risers that are
connected to subsurface floats, with those floats in turn connected to a deployed WEC with a nylon (or
other) hawser system. At both the 60m and 80m berths, the three-point mooring system consists of drag
embedment anchors placed in sand as described above, heavy ground chain (with connected concrete sinker
weights) leading to chain risers and three large surface floats. Figure 1.6 shows a schematic of a
representative mooring leg for the 60m and 80m berths.

DE-FG36-08GO18180
Hawai’i National Marine Renewable Energy Center (HINMREC)
University of Hawai‘i
Final Report
19
Figure 1.6. Schematic showing one leg of the three point mooring system used for WETS deep berths at 60m and
80m depth (De Visser and Vega 2014). Note: more recent modifications have reduced the number of sinker
weights to two on each leg, and increased the weight of the riser chain (from sinkers to surface floats) for greater
fatigue life.
At the preexisting 30m test berth, WETS provides access to the MCBH power grid, and thus to the Oahu
grid, via a subsea cable with a maximum power transmission capacity of 250 kW at 4160 V. During the
Navy-funded site expansion, two additional power cables were installed to service the 60m and 80m
mooring berths, each able to transmit 1 MW at 11,500 V.
A nearby state boat harbor, He’eia Kea Small Boat Harbor on the north side of Kaneohe, lies to the west of
WETS, about a 4-mile boat run from the site. It offers 54 moorings, 21 berths and 3 boat ramps. Honolulu
Harbor, on the south side of Oahu, is more distant - about a 40nm boat trip - but offers a number of boat
harbors and boatyards, where work on smaller WECs can occur. Limited drydocking facilities exist on
Oahu, but these can be brought to bear for work on larger WECs, as is expected to occur with the 860-ton
Ocean Energy OE35 WEC in the near future. Finally, NAVFAC EXWC, which serves as WETS Project
Manager, has had success in arranging for dock space within Navy-controlled Pearl Harbor. Heavy lift
capabilities have been utilized there previously, in the case of the Lifesaver initial launch and ultimate
removal from the water, and a pier at Pearl Harbor’s Ford Island has been utilized for temporary berthing
of Lifesaver and OE35. This may be an option with future WEC projects at WETS.

DE-FG36-08GO18180
Hawai’i National Marine Renewable Energy Center (HINMREC)
University of Hawai‘i
Final Report
20
A major lesson learned over the course of the HINMREC support to the WETS effort has been related to
mooring system design and survivability. Work in this area will be described in some detail later in this
report in Tasks 4, 5 and specifically subtask 6.2, Alternate Mooring Designs, where major mooring repairs
that have been designed and executed are described. A list of Report and Publications is included at the
end of this task for more detailed information.
Site-dedicated Support Vessel
Under NAVFAC funding, HNEI contracted with Sea Engineering, Inc., a locally owned company, to
purchase and convert a suitable seaworthy vessel intended as a site-dedicated resource. The vessel, a former
Navy torpedo retriever 85 feet in length, was modified to extend its beam with the addition of two sponsons,
and outfitted with dive and ROV facilities, an A-frame with 10-ton lift capacity, knuckleboom crane, a 4-
point mooring capability, and ample workspaces for use by WEC developers and UH scientists and
engineers. The vessel can be kept at the He’eia Kea state marina, or in Honolulu Harbor, and has the speed
to be on site within an hour (if at He’eia Kea) or in about 4 hours from Honolulu. Lessons learned from
the HINMREC site establishment and early operations at WETS were vital in determining the requirements
for this vessel, which promises to serve the interests of wave energy testing at WETS for many years. The
vessel, named Kupa’a, is shown in Figure 1.7.

DE-FG36-08GO18180
Hawai’i National Marine Renewable Energy Center (HINMREC)
University of Hawai‘i
Final Report
21
Figure 1.7. Kupa’a, nearing completion for service at WETS in September 2019. A-frame and knuckleboom crane
are visible, as are modified (wider) hull sponsons and expanded wheelhouse.
An important insight from testing WEC devices at WETS has been the frequent inability to safely conduct
at-sea operations when lift capabilities are required. Operations are sea-state limited, which is made worse
by the lack of heave compensation for winches on vessels routinely used (to date) at WETS. These vessels
are cost effective, with daily rates ranging from $10,0000 to $20,0000, as opposed to the ~$100,000
required for vessels that include dynamic positioning (DP) thrusters and/or high-capacity heave
compensated winches (e.g., Gulf of Mexico class). (This is important when considering WEC device
testing at PacWave in Oregon, which is characterized by an annual average power flux of more than twice
the value at WETS.)

DE-FG36-08GO18180
Hawai’i National Marine Renewable Energy Center (HINMREC)
University of Hawai‘i
Final Report
22
To address this issue and maximize the utility of Kupa’a in a wider range of seastates when engaged in
lifting activities, HNEI, under additional funding from NAVFAC, has implemented heave compensation
into the 10-ton winch system on the vessel. As an example of the benefit of this system, without this added
heave compensation, the A-frame and winch with 10-ton lift capacity is limited to significant wave heights
(Hs) of less than about 0.5m for recovering the deep berth cable-anchor and suspended shore cable during
WEC grid-connection operations. While routine maintenance and environmental survey operations
requiring less lifting would be possible with the site-dedicated vessel in waves up to about 1.25m, the HNEI
34-year wave hindcast database indicates that 1.25m waves are exceeded at WETS about 80% of the time,
while 0.5m waves are exceeded well over 95% of the time. Consequently, WEC developers would typically
need to wait for extended periods to grid connect their devices, and HNEI’s routine research support will
be feasible just 20% of the time.
Adding heave compensation to the vessel’s winch system is expected to significantly increase the number
or workable days for various activities at WETS. Specifically, it was estimated that routine maintenance
and survey operations would be possible up to Hs=2m (or roughly 75% of the time), and cable-anchor
recovery up to 1.25 m (20% of the time), or possibly slightly higher. Following completion of the vessel
modification, including incorporation of the heave-compensated winch system in 2019, a thorough analysis
of the relative benefits of this added capability to support the types of work required at the Navy test site is
planned. This research should provide valuable insights into potential cost reductions associated with
optimizing ship size/instrumentation for future wave energy deployments.
WEC Deployments
Following is a summary of WEC deployments that HINMREC has been involved with to date - to varying
degrees. Where funding is from Navy/NAVFAC, that is noted. However, in all cases highlighted here, the
knowledge and experience gained from the HINMREC project have made direct contributions to outcomes
in all WETS WEC deployments as successful as possible.
Oceanlinx
Oceanlinx, an Australian company, worked for an extended period to develop and install a WEC with a
peak installed capacity of 500kW, off the north coast of Maui. It was to be situated approximately 200m
north of Pauwela Point, several miles east of the international airport at Kahului. The technology was based
on an oscillating water column (OWC), with bi-directional airflow driving a unidirectional air turbine. The
project was being developed in collaboration with Maui Electric Company (MECO) and HINMREC, which
supported in the form of resource assessment, permitting assistance, and other local coordination.
Electricity from the project was to be fed directly into the MECO grid. Unfortunately, the project was
ultimately cancelled because the Hawaii Public Utilities Commission did not approve related expenditures
proposed by MECO. Regrettably, OCEANLINX declared bankruptcy, and the technology and intellectual
property, brand and trademark were later sold.

DE-FG36-08GO18180
Hawai’i National Marine Renewable Energy Center (HINMREC)
University of Hawai‘i
Final Report
23
Ocean Power Technologies
Prior to the HINMREC program, various iterations of Ocean Power Technologies’ (OPT) PowerBuoys®
were tested at the 30m berth between 2002-2011 as part of a program with the US Navy to develop and test
wave energy technology. The up and down motion of the buoy was used to drive a generator which was
connected to shore via an undersea power cable to the original 30m test berth. The infrastructure
implemented by OPT approximately one kilometer off the coast of MCBH has been incorporated into the
WETS. OPT was funded by the Navy from September 2001 through December 2011.
The grid interface at the 30m berth was certified in 2007 by an independent laboratory, Intertek Testing
Services. It is compliant with national and international standards, including the safety standards UL1741
and IEEE1547, and also bears the ETL Listed mark. Local Hawaii subcontractors did the installation, test,
and servicing of the systems.
In September 2010 OPT completed the first-ever grid connection of a WEC device in the US at the MCBH
in conjunction with the US Navy. The device was operated for one year. This connection demonstrated that
WEC devices can be grid connected in a manner compliant with national and international standards.
Between December 14, 2009 and the end of March 2011, it operated and produced power for 5,600 hours.
The system had numerous on-board sensors to monitor a wide variety of system performance variables,
external conditions, and lifecycle parameters. Data collected by on-board computers was transmitted to a
shore-based facility via a fiber optic cable embedded in the submarine power transmission cable, and then
transmitted via the Internet to OPT's facility in Pennington, New Jersey. This significant deployment
predated the University of Hawaii/HINMREC direct involvement in testing, and thus its role as an
independent third party validator of power performance results.
HINMREC participated in an advisory role with OPT, including discussion of potential future testing at
one of the deeper berths at WETS. This testing ultimately did not come to pass.
NWEI Baseline Prototype Azura
NWEI’s Azura, a point absorber WEC device, was deployed from late May 2015 to early December 2016
at the 30m berth for baseline tests and to gather performance data (Figure 1.8). The Azura generates energy
from both the heave and surge motion of the wave, producing power from the relative motion between the
hull (vertical spars) and the float, which rotates between the spars. Installation and operations were
conducted under the original EA and FONSI issued in 2003 for the 30m berth, which allowed for multiple
deployments of the WEC devices similar to the previous OPT devices. To deploy and operate the Azura
for the full 18-month deployment, additional funding was required, which was made available through
HINMREC, ONR, and NAVFAC.
Ultimately, the device deployment was quite successful, in that very little maintenance intervention was
required over the 18-month period. Power was fed to the Oahu power grid in a first-of-its-kind grid-
connected wave energy deployment in the United States that was validated by HINMREC/HNEI in a third

DE-FG36-08GO18180
Hawai’i National Marine Renewable Energy Center (HINMREC)
University of Hawai‘i
Final Report
24
party capacity. However, power performance was less than predicted, which led to the motivation to make
modifications and redeploy the device, based on lessons learned from the first deployment.
Figure 1.8. Northwest Energy Innovations (NWEI) Azura WEC, during deployment in late May 2015 at the Wave
Energy Test Site (WETS) 30m test berth. Sea Engineering’s vessel Huki Pau is seen, just after deployment.
NWEI Advanced Prototype Azura
Utilizing NAVFAC funding, HNEI contracted NWEI to modify the baseline Azura and deploy it for a
second time, in hopes of improving power performance. Modifications consisted of the addition of a heave
plate and a larger float with a longer moment arm. These modifications, shown in Figure 1.9, were intended
to improve the relative motion of the float and spars, better aligning with the predominant wave conditions
at WETS and enhancing electrical power generation. HNEI used additional Navy (NAVFAC) funds to
contract Sea Engineering to deploy and retrieve the device. ONR funds were utilized to support the
permitting process to get the Azura redeployed.

DE-FG36-08GO18180
Hawai’i National Marine Renewable Energy Center (HINMREC)
University of Hawai‘i
Final Report
25
Figure 1.9. Baseline and modified Azura. Note addition of heave plate and modification of float.
The advanced device, shown in Figure 1.10, was deployed in February 2018 and was recovered in August
2018. The device again performed quite well in terms of durability, with essentially no maintenance
activities required over the course of the 6-month deployment. However, expected power performance
enhancement was not seen. This result prompted a thorough analysis of device performance by NWEI and
HNEI, which has been documented in a collaborative conference paper (presented at the European Wave
and Tidal Energy Conference - EWTEC 2019, Naples, Italy, “AZURA WEC power performance- a
preliminary comparison of trial data and numerical modeling results”, (see Task 5.2.2, for list of Reports
and Presentations) - and a pending peer-reviewed journal article. In summary, the predicted improvements
in device motions were validated, but did not translate into increased power production due the hydraulic
power takeoff (PTO) being unable to accommodate the higher torque from the float at the frequency of the
predominant wave motions from WETS. Funding was unavailable for further testing, but it seems likely
that enhancements to the PTO to accommodate this high-frequency, high-torque motion from the device
would have yielded significant improvements in device power performance.

DE-FG36-08GO18180
Hawai’i National Marine Renewable Energy Center (HINMREC)
University of Hawai‘i
Final Report
26
Figure 1.10. Advanced Azura Prototype during an inspection by Sea Engineering at WETS in spring 2018. Note
larger float with greater moment arm, as compared with baseline Azura.
Fred. Olsen Lifesaver
The Fred.Olsen LifeSaver device was deployed at the 60m berth in March of 2016 by Sound and Sea
Technology under Navy funding, supported by HINMREC (Figure 1.11). Deployment was originally
planned at the 80m berth but was shifted to the 60m berth due to an unexpected failure of one of the
moorings legs of the 80m berth (more on this below in Tasks 4, 5, and Subtask 6.2). Further, the deployment
was delayed for more than six months pending NOAA National Marine Fisheries Service (NMFS)
permitting review and final Navy approval of the categorical exclusion (CATEX) permitting document. A
key issue that held up the deployment was the potential impact of the mooring system on protected marine
mammals, specifically a perceived entanglement risk to humpback whales. These issues were resolved in
December 2015 (including a simplification in project scope), and the device was authorized for deployment
DE-FG36-08GO18180
Hawai’i National Marine Renewable Energy Center (HINMREC)
University of Hawai‘i
Final Report
27
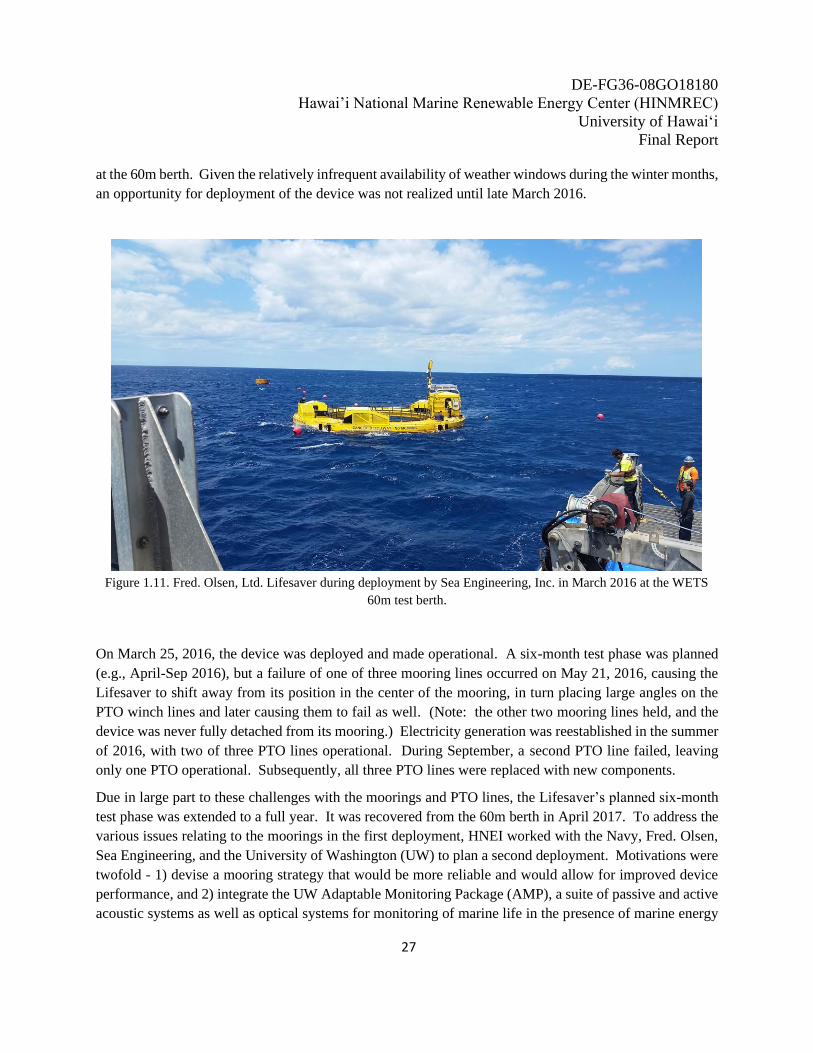
at the 60m berth. Given the relatively infrequent availability of weather windows during the winter months,
an opportunity for deployment of the device was not realized until late March 2016.
Figure 1.11. Fred. Olsen, Ltd. Lifesaver during deployment by Sea Engineering, Inc. in March 2016 at the WETS
60m test berth.
On March 25, 2016, the device was deployed and made operational. A six-month test phase was planned
(e.g., April-Sep 2016), but a failure of one of three mooring lines occurred on May 21, 2016, causing the
Lifesaver to shift away from its position in the center of the mooring, in turn placing large angles on the
PTO winch lines and later causing them to fail as well. (Note: the other two mooring lines held, and the
device was never fully detached from its mooring.) Electricity generation was reestablished in the summer
of 2016, with two of three PTO lines operational. During September, a second PTO line failed, leaving
only one PTO operational. Subsequently, all three PTO lines were replaced with new components.
Due in large part to these challenges with the moorings and PTO lines, the Lifesaver’s planned six-month
test phase was extended to a full year. It was recovered from the 60m berth in April 2017. To address the
various issues relating to the moorings in the first deployment, HNEI worked with the Navy, Fred. Olsen,
Sea Engineering, and the University of Washington (UW) to plan a second deployment. Motivations were
twofold - 1) devise a mooring strategy that would be more reliable and would allow for improved device
performance, and 2) integrate the UW Adaptable Monitoring Package (AMP), a suite of passive and active
acoustic systems as well as optical systems for monitoring of marine life in the presence of marine energy

DE-FG36-08GO18180
Hawai’i National Marine Renewable Energy Center (HINMREC)
University of Hawai‘i
Final Report
28
converters, in such a way that the AMP would draw the power it needs from the WEC itself. The device
was then deployed at the 30m berth (attaching the PTO lines to the seabed using a rock bolt system due to
the rocky bottom at that berth, as opposed to using gravity anchors on the sandy seabed of the 60m berth)
in October 2018, with the AMP integrated into the power system of the Lifesaver, and physically installed
into one of two spare PTO wells in the hull (only 3 of 5 available wells were in use). PTO riser lines with
less elasticity were utilized, and the storm mooring system was installed with reduced pretension as
compared to the first deployment - both changes made in an attempt to improve power performance. The
AMP integration included a wireless inductive charging system, from a Seattle company called WiBotic,
of the sort that can be used to recharge autonomous underwater vehicles (AUVs). The device is shown in
Figure 1.12.
From the mid-October deployment through the end of January 2019, the Lifesaver provided power to the
AMP/WiBotic system nearly continuously, with a total uptime of 84%. On batteries alone, only about 1%
uptime would be achievable. A much greater reliability in the mooring system was also achieved, although
some problems did occur with the integrity of the rock bolts after about two months of deployment. A
useful summary of both WETS Lifesaver deployments can be found at www.boltseapower.com, including
power performance. The device was recovered in March 2019 and shipped back to the UK.
Figure 1.12. Fred. Olsen Bolt Lifesaver during second deployment at WETS. Note the UW AMP electronics
enclosure (white box) and the above-water portion of the AMP instrumentation package. (The sensor head is
approximately two meters below the water surface, but could be raised when the device is in transit to/from the site.)

DE-FG36-08GO18180
Hawai’i National Marine Renewable Energy Center (HINMREC)
University of Hawai‘i
Final Report
29
Future WEC Deployments
As this report is written, WETS is in a period of infrastructure upgrade and device deployment planning.
The years of HINMREC experience with the creation of the site and support to the early deployments at
the site have directly translated into an ability for HNEI to seamlessly transition to directly supporting the
Navy and WEC developers in projects going forward. At this writing, the following WEC device
deployments are on our horizon - with rough estimates of deployment timing: Working closely with ARL,
NAVFAC, and Ocean Energy, the Ocean Energy OE35 is expected to be the next deployment at WETS –
at the 60m berth. The moorings at that berth, as well as the shore cable anchor, have been repaired and
modified, and are ready to receive the device and its umbilical cable, with deployment expected in the
summer of 2020. Other WECs expected at this writing over the next few years are:
● Oscilla Power Triton-C - 30m berth - early 2021
● Ocean Energy OE35 - 60m berth - spring 2021
● Columbia Power Technologies SeaRay - moored independently - early 2021
● Columbia Power Technologies StingRay - 80m berth - spring 2022
● Aquaharmonics - 30m berth - early 2022
● Northwest Energy Innovations (NWEI) Azura (grid-scale device) - 60m berth - spring 2022.
Reports and Publications
Technical Reports
Vega, L. January 2011. Biological Evaluation (BE) Effects of Bathymetric Surveys Required for Wave
Energy Conversion (WEC) Testing Facilities Planned for Kaneohe Bay and Pauwela (Maui).
Sea Engineering, Inc., October 2011. Kaneohe Wave Energy Test Site Multibeam Bathymetry Survey.
Sea Engineering, Inc., November 2011. Kaneohe Wave Energy Test Site Sub-bottom Profiler Survey.
Sea Engineering, Inc., 2012. The Wave Energy Test Site (WETS) at MCBH, Kaneohe Diver Surveys Site
2.
Sea Engineering, Inc., February 2012. Kaneohe Wave Energy Test Site Remotely Operated Vehicle Survey.
Sea Engineering, Inc., March 2012. Geophysical Surveys of the Wave Energy Test Site (WETS) at MCBH,
Kaneohe (summary of seafloor characteristics).
Sea Engineering, Inc., December 2012. The Wave Energy Test Site (WETS) at MCBH, Kaneohe, Diver
Surveys Site 2 Report, (geophysical surveys of expanded WETS Site 2).
Sea Engineering, Inc., May 2013. The Wave Energy Test Site (WETS) at MBBH, Kaneohe Side Scan Data
Report 2.

DE-FG36-08GO18180
Hawai’i National Marine Renewable Energy Center (HINMREC)
University of Hawai‘i
Final Report
30
Sea Engineering, Inc., December 2013. Kaneohe Wave energy Test Site, Diver Survey Report (final
deliverable).
Vega, L. et. al., 2014. Wave energy conversion and ocean thermal energy conversion potential in
developing member countries, Asian Development Bank.
Sea Engineering, Inc., December 2014. WETS Task 3A Sediment Transport Analysis, (sediment staff
deployment), Field Report.
Sea Engineering, Inc., July 2015. WETS Task 3B Sediment Transport Analysis, (sediment staff and scour
piles), Field Report.
Sea Engineering, Inc., October 2015. WETS Task 3C Sediment Transport Analysis, (sediment staff and
scour cylinders), Field Report.
Sea Engineering, Inc., April 2017. WETS Task 3D Sediment Transport Analysis, (sediment transport
around existing structures), Field Report.
Conference Proceedings
DeVisser, A., Cable, B., Vega, L., June 2013. Wave Energy Test Site (WETS), Energy Ocean International,
Providence, RI.
De Visser, A., Vega, L.A., April 2014. Wave Energy Test Site, proceedings of the 7th Annual Global
Marine Renewable Energy Conference, Seattle, WA.
Cross, P., November 2014. University of Hawaii Research at the Hawaii Wave Energy Test Site,
proceedings of the 2014 International Conference on Ocean Energy in Halifax, NS, Canada.
Cross, P., Rocheleau, R. Vega, L., Li, N., Cheung, K. F., April 2015. Early Research Efforts at the Navy’s
Wave Energy Test Site, 3rd Marine Energy Technology Symposium, METS2015, Washington, D.C.
Cross, P., U.S. February 2016. Navy Wave Energy Test Site – Research Update. Accepted presentation
as part of a panel examining global marine energy test infrastructure, at the International Conference on
Ocean Energy 2016, Edinburgh, Scotland.
Cross, P., Vega, L., Rajagopalan, K., Nihous, G., Li, N, Rocheleau, A., Anderson, P., August 2017. U.S.
Navy Wave Energy Test Site – Early Findings. Reviewed paper submission to European Wave and Tidal
Energy Conference, Cork, Ireland.
Li, N., Cross, P., May 2018. Statistical analysis of extreme wave conditions at WETS, awarded as best
paper by the conference organizers, 6th annual Marine Energy Technology Symposium (METS),
Washington, DC.
Rajagopalan, K., Cross, P., May 2018. Lifesaver mooring design, 6th annual Marine Energy Technology
Symposium (METS), Washington, DC.

DE-FG36-08GO18180
Hawai’i National Marine Renewable Energy Center (HINMREC)
University of Hawai‘i
Final Report
31
Cross, p., Rajagopalan, K., Druetzler, A., Argyros, A., Joslin, J., Hjetland, E., Stewart, A., September 2019.
Recent Developments at the U.S. Navy Wave Energy Test Site. Reviewed paper to European Wave and
Tidal Energy Conference, Naples, Italy.
Invited Conference Presentations
Cross, P., October 2013. Invited to attend, and co-authored presentation for workshop at European Marine
Energy Center to celebrate 10-year anniversary of EMEC and discuss preparations at wave and tidal energy
test sites internationally, Kirkwall, Scotland.
Cross, P., November 2014. HNEI Support at the U.S. Navy’s Wave Energy Test Site, European Marine
Energy Center-sponsored workshop on international wave and tidal energy test site developments, in
conjunction with International Conference on Ocean Energy, Halifax, Canada.
Cross, P., July 2015. Invited by Oregon Wave Energy Trust to be on a panel (focused on the development
of test infrastructure to support emerging marine hydrokinetic energy technology in the US), at the 2015
Hyrdrovision/Ocean Renewable Energy Conference. Portland.
Cross, P., April 2016. Invited by Department of Energy to represent WETS at International Marine
Renewable Energy Conference (IMREC), as part of a panel on marine energy projects in the water in the
US, (Vega., L. stood in), Washington, DC.
Cross, P., September 2016. Stood in for NAVFAC WETS Project Manager to deliver a lunch seminar at
ORE, discussing the various environmental data collection efforts underway, and planned, at WETS.
Portland, OR.
Cross, P., September 2016. Invited by Virginia Tech organizers to present an overview of WETS research
activities at the 11th Annual Energy Harvesting Workshop, Arlington, VA.
Cross, P., September 2016. Invited by Oregon Wave Energy Trust to participate in a panel discussing
marine energy test infrastructure at the Ocean Renewable Energy Conference (OREC). Portland, OR.
Cross, P., September 2017. Invited by Oregon Wave Energy Trust to participate in a panel discussing DOD
efforts in marine energy at the Ocean Renewable Energy Conference (OREC), in Portland, OR.
Cross, P., May 2018. Invited by International Marine Renewable Energy Conference organizers to discuss
WETS in-water developments at their conference, Washington, DC.
Cross, P., June 2018. Invited by Hydrovision 2018 organizers to discuss WETS in-water developments,
lessons learned, and supply chain issues at their conference, Charlotte, NC.
Cross, P., September 2018. Invited by European Marine Energy Center to provide two talks – a WETS
update and a summary of WETS environmental collection efforts – at the International Wave and Tidal
Energy Research Sites (WaTERS) workshop, which preceded the Asian Wave and Tidal Energy
Conference, Taipei, Taiwan.

DE-FG36-08GO18180
Hawai’i National Marine Renewable Energy Center (HINMREC)
University of Hawai‘i
Final Report
32
Cross, P., September 2018. Invited by Pacific Ocean Energy Trust to participate in a panel assessing the
suitability of existing marine energy test infrastructure to advance marine energy as applied to maritime
markets (as opposed to grid-connected applications) at the Ocean Renewable Energy Conference (OREC),
Portland, OR.
Cross, P., October 2019. Invited by European Marine Energy Center to provide an update on activities at
WETS at the International Wave and Tidal Energy Research Sites (WaTERS) workshop, held in Stromness,
Orkney Islands, Scotland (EMEC offices).
Other Presentations
Vega, L., February 2011, Expansion of Existing Facility into Wave Energy Test Site (WETS) Marine Corps
Base Hawaii (MCBH), briefing to DOE.
Cross, P., November 2015. Invited to give a talk about WETS and wave energy, while in Norway to visit
a wave energy test site, at NIVA – a Norwegian water research institute, Oslo, Norway.
TASK 2: OTEC RESOURCE ASSESSMENT AND
SUSTAINABILITY
The concept of Ocean Thermal Energy Conversion (OTEC) has fascinated many generations of engineers
since it was formulated by d’Arsonval in 1881. It hinges on the possibility of producing mechanical work
(and, subsequently electricity) by exchanging heat with a warm reservoir of surface seawater and a cold
reservoir of deep seawater in suitable tropical areas. While the basic heat engine technology at the heart of
OTEC can be found in every thermal power plant today, practical seawater temperature differences of the
order of only 20 C have made OTEC implementation very challenging. With thermodynamic efficiencies
of about 3%, OTEC cycles must compensate with seawater flow rates as large as several cubic meters per
second per megawatt of net electricity produced. This and other difficulties typical of deepwater marine
environments have so far prevented OTEC from being economically competitive. Interest in this renewable
technology has been sustained, however, with a growing worldwide energy demand, the prospect of
declining fossil fuel reserves and serious concerns about climate change.
The main characteristics of OTEC relevant to the HINMREC study of OTEC resources are the high
seawater flow rate intensity mentioned earlier and the sensitivity of OTEC power output to changes in
available seawater temperature differences. Unlike many intermittent renewable technologies, OTEC is
capable of baseload electricity production in favorable regions. Yet, a variation of 1o C in the seawater
thermal resource corresponds to a change in net power output on the order of 15%. The combination of
large flow rates and temperature sensitivity suggests that a very dense deployment of OTEC systems might
result in self-limiting power production. Under this scenario, OTEC resources would actually have a
maximum. This was shown to occur in very simplified one-dimensional models of the water column with
OTEC. The situation could be compared to the case of a hydroelectric power plant where excessive water

DE-FG36-08GO18180
Hawai’i National Marine Renewable Energy Center (HINMREC)
University of Hawai‘i
Final Report
33
flow rates would diminish the existing head. In the case of OTEC, however, there is no obvious flow rate
scale a priori. The following journal articles, with high-level summaries given here, provide an overview
of detailed modeling efforts carried out under HINMREC support for global OTEC assessment.
1) Rajagopalan and Nihous (2013a)
The main objective in this study was to explore the possibility of using state-of-the-art ocean general
circulation models (OGCMs) in estimating global OTEC resources. In order to limit the computational
burden of this undertaking and simplify the comparative interpretation of results with available 1-D OTEC
resource estimates, a relatively coarse spatial resolution and standard (or default) parametric choices were
made for the targeted OGCM calculations. In addition, features of the modeling protocol that specifically
define OTEC operations and power production followed those proposed in the past. Given the complexity
and broad spatial variability of oceanic circulation and temperature fields, even such preliminary numerical
experiments are expected to yield more accurate and more reliable results than previously obtained in other
studies.
The numerical tool selected for this study was the general oceanic (and atmospheric) circulation model
MITgcm developed at the Massachusetts Institute of Technology. MITgcm can represent oceanic and
atmospheric phenomena over a wide range of scales by discretizing the transport equations for momentum,
potential temperature and salinity (specific humidity in the case of the atmosphere) with the finite-volume
technique. MITgcm is configured to simulate the global ocean circulation on a relatively coarse 4o x 4o
(horizontal) grid. The MITgcm solver was modified to incorporate fluid sinks, as well as temporally varying
temperature and salinity source characteristics that can be dynamically specified. These changes were
required to properly represent OTEC intakes of surface and deep seawater (sinks) as well as an OTEC
mixed effluent discharge (source). First, basic tests were carried out with the MITgcm model (without
OTEC sources/sinks) to establish that the temperature drift is minimum, there is closure on the heat budget,
and that the MITgcm model prediction of thermohaline circulation agrees well with observations.
The criterion established for implementation of OTEC globally is that any monthly average temperature
difference between 20m and 1000m water depths always exceed 18o C. The global ocean thus selected is
shown in Figure 2.1. OTEC operations are represented in the OGCM by the inclusion of mass flow
singularities of given strengths. Two sinks depict the intake of seawater in the surface layer and at a water
depth of 1000 m, respectively, and one source describes the release of mixed effluents in the water column.

DE-FG36-08GO18180
Hawai’i National Marine Renewable Energy Center (HINMREC)
University of Hawai‘i
Final Report
34
Figure 2.1. The OTEC region defined from the quarter-degree World Ocean Atlas 2005 database. (color scale:
mean annual temperature difference between water depths of 20 m and 1000 m)
The ratio 𝛾 of OTEC surface seawater flow rate over OTEC deep seawater flow rate is fixed at 1.5, a value
greater than one typical of OTEC system optimizations. As a result, the strength of all OTEC flow
singularities can be quantified by the deep seawater value Qcw alone. Furthermore, Qcw can be expressed as
an equivalent vertical velocity wcw if it is divided by the horizontal grid cell area. In this study, constant
values of wcw across the OTEC region serve as a basis for specific MITgcm runs. Because OTEC flow rates
(per unit horizontal area) are therefore uniformly distributed, the parasitic pumping power density Ppump is
a constant. Using wcw also allows a connection to the historical notion of upwelling (vertical advection) rate
used in early descriptions of the global oceanic circulation. In 1-D studies of OTEC resources, the value of
wcw for which OTEC net power production would peak was found to be of the same order of magnitude as
the background upwelling rate.
In Figure 2.2, results from the 4o x 4o MITgcm model are given. They are the focal point of this article.

DE-FG36-08GO18180
Hawai’i National Marine Renewable Energy Center (HINMREC)
University of Hawai‘i
Final Report
35
Figure 2.2. Global OTEC net power as a function of deep seawater vertical velocity wcw
The OTEC net power maximum of 30TW is achieved. This is an order larger than the 3-5TW predicted
with the simple 1-D model. Notwithstanding the complexity of the more sophisticated model (MITgcm),
this discrepancy should be expected since horizontal transport phenomena in the ocean dominate their
vertical counterparts, especially where density stratification is strong. In a 1-D model reduced to a vertical
water column, the lack of adequate horizontal transport mechanisms would amplify the effect of OTEC
flow perturbations on the vertical thermal structure. Consequently, any significant degradation of OTEC
net power production would occur at smaller OTEC flow rates in such a limited modeling context.
With large-scale global OTEC operations (hundreds of thousands of 100MW plants), much of the heat
transferred from the atmosphere to the ocean in tropical regions would be transported horizontally
elsewhere before the local temperature stratification could be adversely affected. It is noteworthy that the
cooling of the tropical oceanic mixed-layer, which is the driving mechanism for an induced heat flux from
the atmosphere to the ocean in tropical areas, is predicted to persist in the present model. In 1-D analyses,
mixed-layer cooling under large-scale OTEC scenarios is a transient phenomenon instead. A persistent
tropical surface cooling would be balanced by a warming trend in the higher latitudes and in regions of
strong coastal upwelling, the extent of which may set practical environmental limits to massive OTEC
deployment. The large OTEC flow rates corresponding to maximum net power production are also shown
to significantly boost the oceanic thermohaline circulation (THC). In the Atlantic, for example, the THC
would essentially double from about 15 Sv. In simple interconnected 1-D approaches, large OTEC flow

DE-FG36-08GO18180
Hawai’i National Marine Renewable Energy Center (HINMREC)
University of Hawai‘i
Final Report
36
rates do not permanently affect the THC. The work described here is believed to represent an important
step toward a better quantification of OTEC resources using state-of-the-art numerical models of the ocean.
Many aspects of the OGCM runs performed in this study are subject to improvement, refinement and critical
evaluation. In particular, the effects of grid resolution, model parameterization and level of coupling
between the ocean and atmosphere deserve to be investigated. Some of these improvements were
implemented and reported in the following HINMREC-sponsored study.
2) Rajagopalan and Nihous (2013b)
In 1) above, the question of global OTEC resource was tackled for the first time with state-of-the-art ocean
general circulation models. A relatively coarse numerical grid was adopted to limit the numerical burden
of the proposed simulations, i.e. 4o x 4o horizontally, with 15 vertical layers including a 50 m thick surface
layer. The existence of a maximum for global OTEC net power production was confirmed. At 30 TW, this
maximum would be about ten times that predicted in earlier one-dimensional studies. Such a result
demonstrated the importance of fast horizontal transport phenomena, not accounted for in one-dimensional
models, in slowing the local erosion of the water column’s thermal stratification as OTEC flow intensity
increases. It was also revealed that a cooling of the surface layer in the OTEC region could be sustained as
long as warming occurs elsewhere. Although this work represents an important step to more accurately
assess interactions between the environment and a very large number of OTEC systems deployed
throughout the tropical seas, significant improvements in OGCM computational and physical resolutions
were made in the work described here.
Numerical resolution was increased to 1deg x 1deg, and the number of vertical layers was also increased to
23, with the topmost layer now 10m thick. The choice of thinner layers toward the surface allows a better
representation of enhanced vertical stratification in the upper part of the water column. Since the horizontal
resolution was increased to 1deg, many of the fluxes required to force the model needed to be recalculated.
The model is forced with several monthly averaged fluxes specified at the ocean-atmosphere boundary.
Meridional and zonal wind-stress fields were obtained from a well-known database, NOAA Atlas. The
other inputs are heat, short-wave radiation, and freshwater fluxes. Their specification required a delicate
two-step process. At first, essential flux components were either directly found or determined from
extensive parameterizations; these include the short-wave radiation, long-wave radiation, latent heat,
sensible heat, evaporation, and precipitation fluxes. Some intermediate fields were available elsewhere,
such as the short-wave radiation under clear skies and the surface albedo. In the simulations, two important
constraints had to be satisfied for the OGCM to run properly: that the annual averages of the heat and
freshwater fluxes integrated over the entire ocean surface both be zero. Simply using available or calculated
data generally fails to approximate such constraints to an acceptable degree. In the absence of continuous
data assimilation, small inaccuracies in surface input fluxes can lead to large drifts in calculated fields over
long enough simulation times. The methodology adopted here was to multiply key terms in the heat and
freshwater fluxes by unknown tuning parameters (of order one). The seven selected parameters were then
determined by minimizing the normalized sum of the yearly averaged heat and freshwater fluxes integrated
over the entire ocean surface. This operation was performed with a standard multidimensional downhill

DE-FG36-08GO18180
Hawai’i National Marine Renewable Energy Center (HINMREC)
University of Hawai‘i
Final Report
37
simplex method implemented in the MATLAB function fminsearch. A low threshold of 0.9 was also
imposed on the tuning parameters, which ended up ranging from 0.91 to 1.09.
Basic checks were performed on the MITgcm model to establish that the temperature drift is minimal, and
the model predictions of THC agrees with published data. Following these basic checks, the OTEC scenario
was implemented in the MITgcm model. The results for global OTEC net power are shown in Figure 2.3.
Figure 2.3. Yearly averaged global OTEC power as a function of OTEC flow intensity wcw.
The straight line in Figure 2.3 represents the case if the ocean did not change (meaning the temperature
difference between the surface and deep water layers remained the same even after large-scale OTEC was
operational). With the improved resolution the OTEC resource maximum has now decreased to about
14TW. This maximum is also achieved at a lower flow rate of 20 m/yr. These conclusions contrast sharply
with those from the coarser grid. The revised OTEC power limit is roughly half the previous value, but it
is achieved with an OTEC flow intensity only one-third as large. In truth, this does not mean that OTEC
systems are predicted to be more “efficient” in higher-resolution simulations; instead, it reflects the fact
that in all simulations, OTEC systems experience less adverse seawater temperature feedback at lower
values of wcw. The overall OTEC flow rates involved are considerable, and of the same order of magnitude
as large components of the global oceanic circulation.
To get a sense of the number of actual OTEC plants that would correspond to a given OTEC flow intensity
wcw, the simplest way would be to divide the corresponding zero-feedback power in Figure 2.3 by a nominal
plant size (100MW is broadly considered to be a single-unit commercial target given technological
limitations on the deep cold seawater pipe size). Since power production with given hardware is dependent
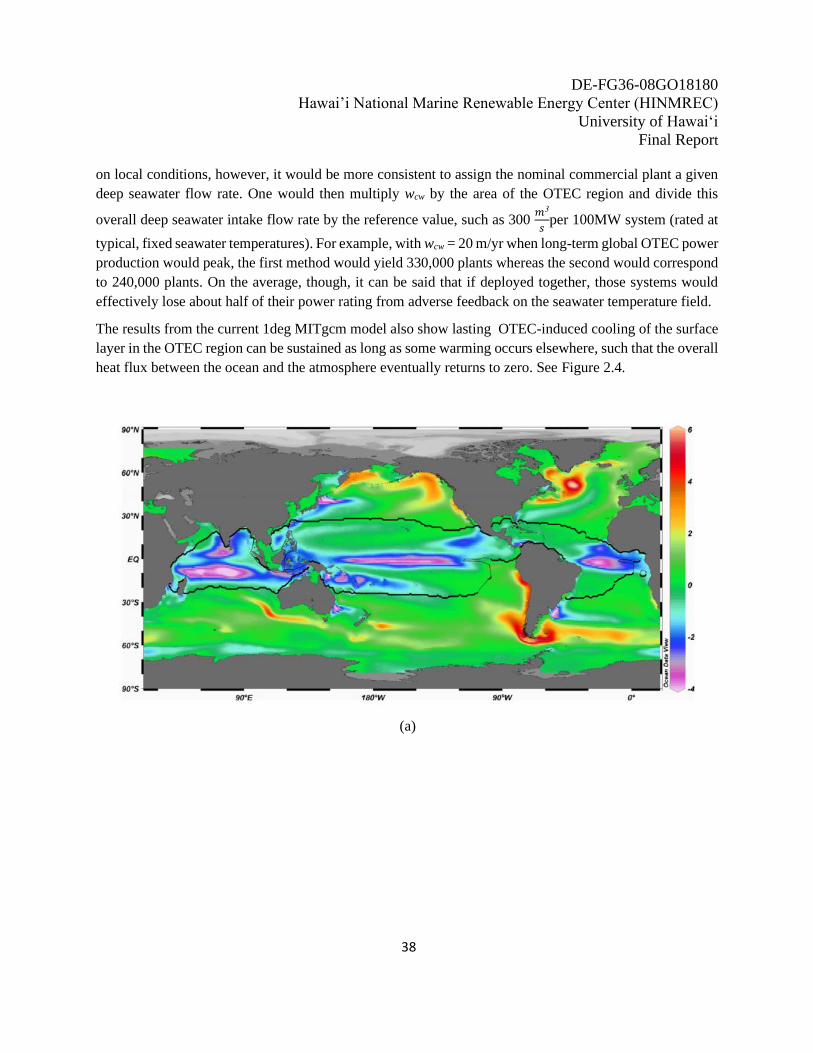
DE-FG36-08GO18180
Hawai’i National Marine Renewable Energy Center (HINMREC)
University of Hawai‘i
Final Report
38
on local conditions, however, it would be more consistent to assign the nominal commercial plant a given
deep seawater flow rate. One would then multiply wcw by the area of the OTEC region and divide this
overall deep seawater intake flow rate by the reference value, such as 300 𝑚3
𝑠per 100MW system (rated at
typical, fixed seawater temperatures). For example, with wcw = 20 m/yr when long-term global OTEC power
production would peak, the first method would yield 330,000 plants whereas the second would correspond
to 240,000 plants. On the average, though, it can be said that if deployed together, those systems would
effectively lose about half of their power rating from adverse feedback on the seawater temperature field.
The results from the current 1deg MITgcm model also show lasting OTEC-induced cooling of the surface
layer in the OTEC region can be sustained as long as some warming occurs elsewhere, such that the overall
heat flux between the ocean and the atmosphere eventually returns to zero. See Figure 2.4.
(a)

DE-FG36-08GO18180
Hawai’i National Marine Renewable Energy Center (HINMREC)
University of Hawai‘i
Final Report
39
(b)
Figure 2.4. OTEC induced temperature changes for a flow velocity of 20 m/yr (maximum global OTEC
production). (a) Yearly averaged temperature change (oC) in the surface layers (to 55 m). (b) yearly averaged
temperature change (oC) in deep-seawater-intake layer (centered at 1160 m depth).
Environmental effects at maximum OTEC power production were qualitatively similar to (example Fig
2.4), but quantitatively more acute than those reported earlier from the 4o grid. A significant boost of the
oceanic thermohaline circulation would occur. The refined MITgcm was then utilized to assess OTEC
resources under selected ocean regions within the global ocean as described below.
3) Rajagopalan and Nihous (2013c)
In 1) and 2), the OTEC was implemented globally as shown in Figure 2.1. Here, the OTEC implementation
is selected based on the temperature difference of 18oC, as well as some geographical constraints. The
feasibility of deploying OTEC plants across the global ocean as shown in Figure 2.1 would depend on the
in-situ manufacture of a fuel with the extracted energy from plants far from landmasses. While this large-
scale scenario may fit well within a future hydrogen economy, a more practical approach would be to limit
OTEC deployment in the nearer term to within some distance of land. The selected area may correspond,
for example, to the Exclusive Economic Zone (EEZ) of maritime nations, or be defined where large
submarine power cables would remain cost effective. The large-scale deployment of OTEC was also shown
to have potential environmental effects far from the OTEC region itself, (see for example Figure 2.4),
suggesting that valuable information on the system’s response could be garnered by imposing specific
geographical constraints on the OTEC domain. Thus, a more practical OTEC development roadmap and
uncertainties regarding distant potential environmental effects both provide ample motivation for the work
done in this study.
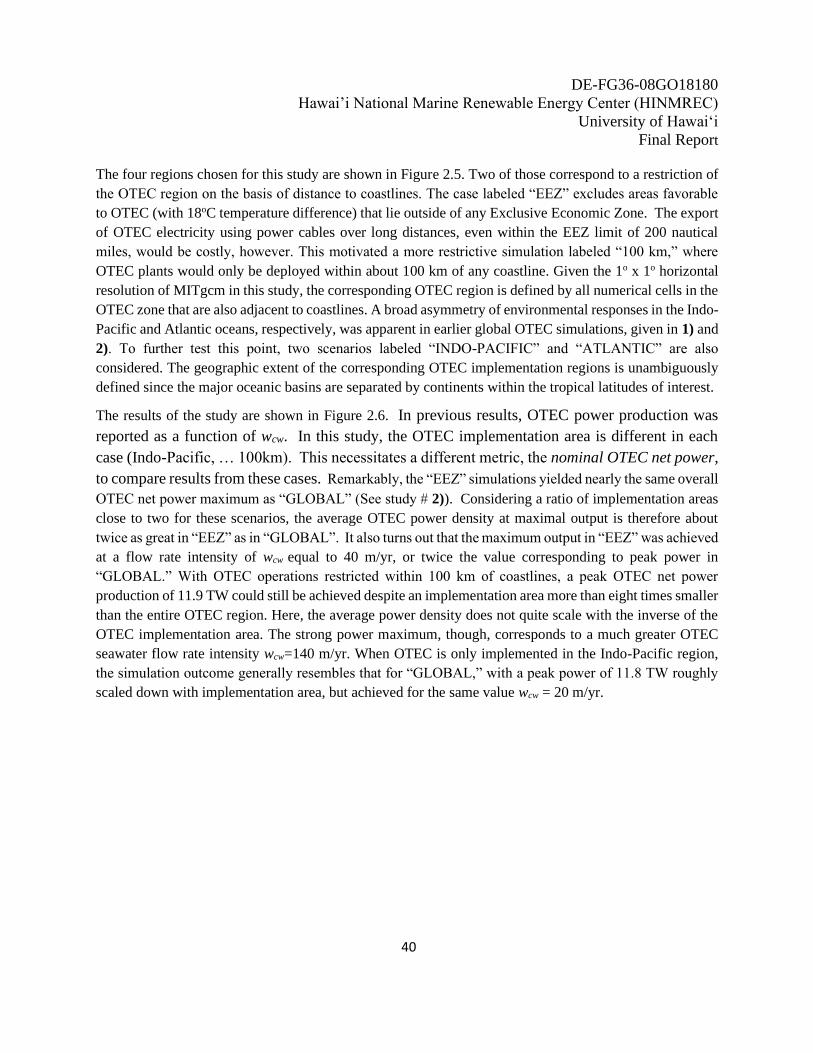
DE-FG36-08GO18180
Hawai’i National Marine Renewable Energy Center (HINMREC)
University of Hawai‘i
Final Report
40
The four regions chosen for this study are shown in Figure 2.5. Two of those correspond to a restriction of
the OTEC region on the basis of distance to coastlines. The case labeled “EEZ” excludes areas favorable
to OTEC (with 18oC temperature difference) that lie outside of any Exclusive Economic Zone. The export
of OTEC electricity using power cables over long distances, even within the EEZ limit of 200 nautical
miles, would be costly, however. This motivated a more restrictive simulation labeled “100 km,” where
OTEC plants would only be deployed within about 100 km of any coastline. Given the 1o x 1o horizontal
resolution of MITgcm in this study, the corresponding OTEC region is defined by all numerical cells in the
OTEC zone that are also adjacent to coastlines. A broad asymmetry of environmental responses in the Indo-
Pacific and Atlantic oceans, respectively, was apparent in earlier global OTEC simulations, given in 1) and
2). To further test this point, two scenarios labeled “INDO-PACIFIC” and “ATLANTIC” are also
considered. The geographic extent of the corresponding OTEC implementation regions is unambiguously
defined since the major oceanic basins are separated by continents within the tropical latitudes of interest.
The results of the study are shown in Figure 2.6. In previous results, OTEC power production was
reported as a function of wcw. In this study, the OTEC implementation area is different in each
case (Indo-Pacific, … 100km). This necessitates a different metric, the nominal OTEC net power,
to compare results from these cases. Remarkably, the “EEZ” simulations yielded nearly the same overall
OTEC net power maximum as “GLOBAL” (See study # 2)). Considering a ratio of implementation areas
close to two for these scenarios, the average OTEC power density at maximal output is therefore about
twice as great in “EEZ” as in “GLOBAL”. It also turns out that the maximum output in “EEZ” was achieved
at a flow rate intensity of wcw equal to 40 m/yr, or twice the value corresponding to peak power in
“GLOBAL.” With OTEC operations restricted within 100 km of coastlines, a peak OTEC net power
production of 11.9 TW could still be achieved despite an implementation area more than eight times smaller
than the entire OTEC region. Here, the average power density does not quite scale with the inverse of the
OTEC implementation area. The strong power maximum, though, corresponds to a much greater OTEC
seawater flow rate intensity wcw=140 m/yr. When OTEC is only implemented in the Indo-Pacific region,
the simulation outcome generally resembles that for “GLOBAL,” with a peak power of 11.8 TW roughly
scaled down with implementation area, but achieved for the same value wcw = 20 m/yr.

DE-FG36-08GO18180
Hawai’i National Marine Renewable Energy Center (HINMREC)
University of Hawai‘i
Final Report
41
(a)
(b)
(c)
(d)
Figure 2.5. OTEC implementation under geographical constraints. All plots colored by nominal power density in
kW/m2. (a) Indo pacific (b) Atlantic (c) EEZ (d) 100 km of shoreline.

DE-FG36-08GO18180
Hawai’i National Marine Renewable Energy Center (HINMREC)
University of Hawai‘i
Final Report
42
Figure 2.6. Yearly averaged OTEC power: estimate from MITgcm as a function of nominal value.
The behavior of simulations for OTEC in the relatively small Atlantic region seems quite different. This
likely stems from a greater sensitivity of the THC to flow perturbations in an ocean that is ventilated at a
faster rate. Here, a maximum OTEC power of only 5.4 TW is reached when wcw= 40 m/yr. In each case, it
appeared as though producing half the predicted power maximum would substantially limit large-scale
environmental temperature changes. The knowledge acquired by modeling OTEC implementation in
MITgcm was also leveraged for studying another interesting phenomenon, artificial upwelling. This is
briefly explained below.
4) Rajagopalan and Nihous (2014)
Artificial upwelling of nutrient rich deep water into surface layers of oligotrophic ocean can enhance
oceanic food webs. Since in an OTEC plant the deep water is brought to the surface and expelled for
generation of electric power, the upwelling so generated was considered to be a collateral benefit of OTEC.
Later, researchers suggested that upwelling can result in atmospheric carbon sequestration. This would
occur if nitrogen-fixing diazotrophs bloomed after most upwelled nutrients (including excess dissolved
inorganic carbon) had been consumed by other phytoplankton species (e.g., eukaryotes). However, some
researchers argued that diazotroph blooms would be inhibited by the loss of upper water column
stratification under widespread upwelling scenarios. This study examined how the properties of the water
column, such as stratification, vary with widespread artificial upwelling.

DE-FG36-08GO18180
Hawai’i National Marine Renewable Energy Center (HINMREC)
University of Hawai‘i
Final Report
43
The MITgcm model used in 2) & 3), with one degree horizontal resolution, was modified to study
upwelling. Before the modification, it was determined that the MITgcm model estimates of mixed layer
depth agree with published data. Figure 2.7 shows good comparison between published data and MITgcm
results for mixed layer depth (MLD). In the MITgcm model, artificial upwelling can be represented by a
sink at the depth of water withdrawal coupled with a source of the same strength close to the surface. The
region chosen for implementation is the North Pacific Subtropical Gyre (NPSG).
Figure 2.7. Maximum monthly averaged mixed-layer depth (m): top, observations; bottom, MITgcm calculations.
The results of the study are summarized in Figure 2.8. In Figure 2.8(a), MITGcm results, with and without
artificial upwelling, is compared with published results from the World Ocean NOAA Atlas (Monterey and
Levitus, 1997), and with observations from Station KAHE of the Hawaiian Ocean Time series (HOT). In
Figure 2.8(b), the comparison is with Station ALOHA, also of HOT. The conclusion is that during months
with normally deeper MLDs, the mixed layer would deepen further; on the contrary, during months with
normally shallow MLDs, the mixed layer would get shallower.

DE-FG36-08GO18180
Hawai’i National Marine Renewable Energy Center (HINMREC)
University of Hawai‘i
Final Report
44
(a)
(b)
Figure 2.8. Monthly averaged mixed layer depth. (a) Station KAHE. (b) Station ALOHA.
In the MITgcm model used in case studies (1) through (4), there was no atmospheric feedback. This
deficiency is addressed in the following publication.
(5) Jia, et al (2018)
In case studies (1) through (4), the atmosphere is not explicitly modeled. Instead, fluxes between the ocean
and the atmosphere are permitted, for example as a result of oceanic perturbations, but atmospheric fields
are assumed to be fixed. This drawback is addressed here by incorporating coupling effects between ocean
and atmosphere based on a low complexity but numerically efficient approach.
The global OTEC resource, presented earlier in 2) and 3), was then reassessed with the improved model.
The MITgcm grid is similar to the one used in 2) and 3), i.e., it has 1-deg horizontal resolution with 23
layers in the vertical direction. In previous cases, 1) through 3),, the local heat flux, Q, entering the ocean
from the atmosphere is modeled as, 𝑄 = 𝑄𝑜𝑏𝑠 + 𝜆(𝑇𝑜𝑏𝑠 − 𝑇0 ) , where Qobs and Tobs are climatological
observations of heat flux and temperature and T0 is the ocean surface layer temperature. 𝜆is the restoring
coefficient. We call this formulation of heat flux the Haney method after the researcher who proposed it.
In the present work, this formulation for heat flux is modified as shown here,
𝑄 = 𝑄𝑜𝑏𝑠 + 𝛾(𝑇𝑜𝑏𝑠 − 𝑇0 ) − 𝛻. {𝜇𝛻(𝑇𝑜𝑏𝑠 − 𝑇0)} Eq. 1
We call the formulation given in Eq.1 the R-W formulation after the researchers Rahmstorf and Willebrand
who proposed it. In Eq. 1, the 𝛾term accounts for longwave radiation heat flux to temperature. The last term
in Eq. 1 is a diffusive operator and accounts for the horizontal transport of heat flux in the atmosphere. The
R-W formulation is further modified to account for grid difference from the grid used in the Rahmstorf and
Willebrand original work. We call this the R-Wx40 formulation.
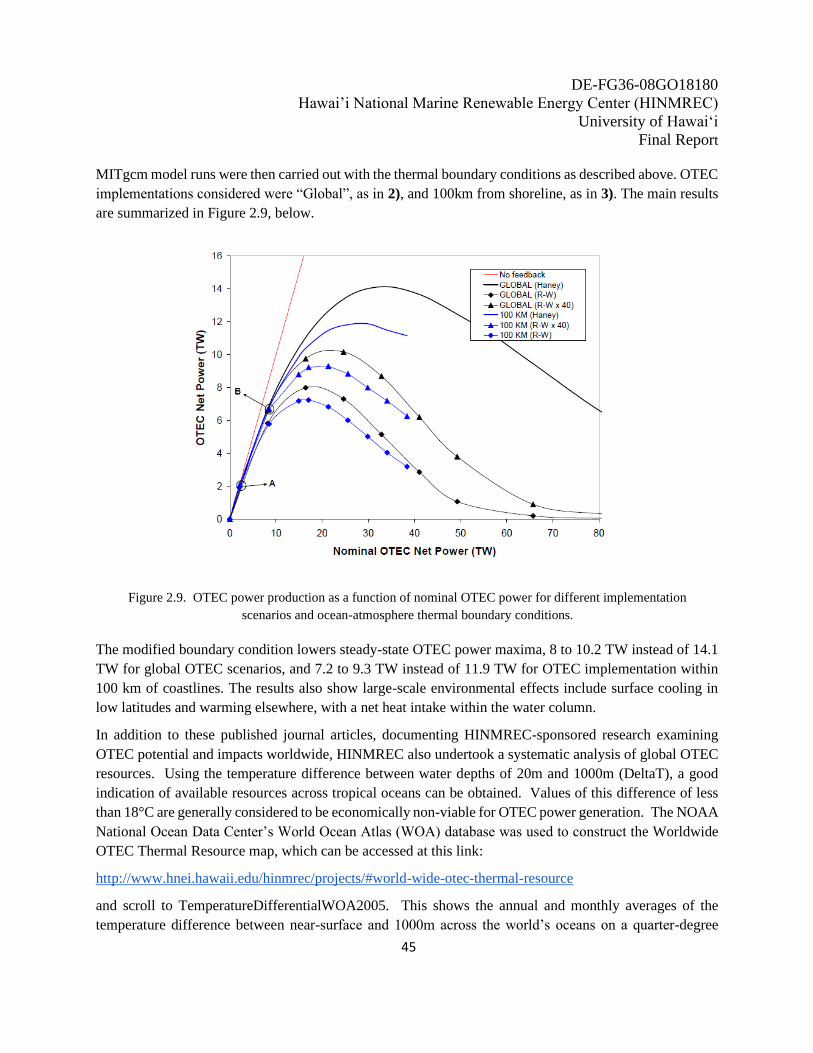
DE-FG36-08GO18180
Hawai’i National Marine Renewable Energy Center (HINMREC)
University of Hawai‘i
Final Report
45
MITgcm model runs were then carried out with the thermal boundary conditions as described above. OTEC
implementations considered were “Global”, as in 2), and 100km from shoreline, as in 3). The main results
are summarized in Figure 2.9, below.
Figure 2.9. OTEC power production as a function of nominal OTEC power for different implementation
scenarios and ocean-atmosphere thermal boundary conditions.
The modified boundary condition lowers steady-state OTEC power maxima, 8 to 10.2 TW instead of 14.1
TW for global OTEC scenarios, and 7.2 to 9.3 TW instead of 11.9 TW for OTEC implementation within
100 km of coastlines. The results also show large-scale environmental effects include surface cooling in
low latitudes and warming elsewhere, with a net heat intake within the water column.
In addition to these published journal articles, documenting HINMREC-sponsored research examining
OTEC potential and impacts worldwide, HINMREC also undertook a systematic analysis of global OTEC
resources. Using the temperature difference between water depths of 20m and 1000m (DeltaT), a good
indication of available resources across tropical oceans can be obtained. Values of this difference of less
than 18°C are generally considered to be economically non-viable for OTEC power generation. The NOAA
National Ocean Data Center’s World Ocean Atlas (WOA) database was used to construct the Worldwide
OTEC Thermal Resource map, which can be accessed at this link:
http://www.hnei.hawaii.edu/hinmrec/projects/#world-wide-otec-thermal-resource
and scroll to TemperatureDifferentialWOA2005. This shows the annual and monthly averages of the
temperature difference between near-surface and 1000m across the world’s oceans on a quarter-degree

DE-FG36-08GO18180
Hawai’i National Marine Renewable Energy Center (HINMREC)
University of Hawai‘i
Final Report
46
horizontal grid. A representative plot, showing DeltaT in the month of February, is shown in Figure 2.10
below. The user can choose any region of interest defined by specific latitude and longitude ranges to view
color-coded data of the annual average temperature difference as a function of latitude and longitude.
Further, clicking on any location gives a plot of monthly averages of the temperature difference at that
point, an example of which is shown in Figure 2.11.
Figure 2.10. OTEC Thermal Resource (DeltaT in degrees F between 20m and 1000m depth) for the month of
February, from the TemperatureDifferentialWOA2005 database.

DE-FG36-08GO18180
Hawai’i National Marine Renewable Energy Center (HINMREC)
University of Hawai‘i
Final Report
47
Figure 2.11. Representative annual plot of monthly mean temperature difference obtained from the OTEC
TemperatureDifferentialWOA2005 database.
An estimate of OTEC power production capabilities can be made with the temperature difference data.
Annual and monthly averages of the power that would be produced by a single generic OTEC plant rated
at 100 MW in standard conditions is available at the link,
http://www.hnei.hawaii.edu/hinmrec/projects/#world-wide-otec-thermal-resource, and scroll to
PowerMaps. The display is limited to a latitude band between 30°S and 30°N. The link provides the user
with a color-coded distribution of OTEC power production from the generic 100 MW plant, in GWh per
year. The user can choose any region of interest between 30°S and 30°N to view detailed values of annual
average power. Further, clicking on any location provides the user with a plot of the monthly averages of
net power at that spot, in GWh per month. Representative plots of each are shown in Figures 2.12 and 2.13.
Further information is found in “Ocean Thermal Energy Conversion” listed under Reports and Publications
below.

DE-FG36-08GO18180
Hawai’i National Marine Renewable Energy Center (HINMREC)
University of Hawai‘i
Final Report
48
Figure 2.12. Annual average power in GWh/year near Hawaii, from HINMREC-developed PowerMaps website.
Figure 2.13. Monthly average power in GWh, from a location near Hawaii.

DE-FG36-08GO18180
Hawai’i National Marine Renewable Energy Center (HINMREC)
University of Hawai‘i
Final Report
49
An OTEC discharge water model was implemented leading to the protocol for environmental monitoring
parameters (nutrients & biological; CTD; and carbonate cycle). This HNEI protocol has been adopted by
UH for ongoing Honolulu SWAC baseline measurements (ONR funding).
Reports and Publications
Book Chapters
Vega, L., August 2012. Ocean Thermal Energy Conversion, Encyclopedia of Sustainability Science and
Technology, Springer, pp. 7296-7328.
Vega, L.A., February 2016. Ocean Thermal Energy Conversion, Renewable Energy Systems, Springer,
New York, NY, https://doi.org/10.1007/978-1-4614-5820-3_695.
Journal Publications
Nihous, G.C., 2011, A Discussion of Endoreversible Engines at Maximum Output, Fundamental Journal of
Thermal Science and Engineering, Volume 1, Issue 2, 73-8, http://www.frdint.com/.
Rajagopalan, K., Nihous, G. C. 2013a. Estimates of global Ocean Thermal Energy Conversion (OTEC)
resources using an ocean general circulation model. Renewable Energy, 50, 532-540.
Rajagopalan, K., Nihous, G. C. 2013b. An assessment of global ocean thermal energy conversion resources
with a high-resolution ocean general circulation model. Journal of Energy Resources Technology, 135, 4.
Rajagopalan, K., Nihous, G. C. 2013c. An assessment of global Ocean Thermal Energy Conversion
resources under broad geographical constraints. Journal of Renewable and Sustainable Energy, 5, 6,
doi.org/10.1063/1.4850521.
Rajagopalan, K., Nihous, G. C. 2014. Predictions of Water-Column Properties under Widespread Artificial
Upwelling Scenarios in the North Pacific Subtropical Gyre using an Ocean General Circulation Model.
Journal of Marine Environmental Engineering, 9, 4.
Jia, Y., Nihous, G. C. and Rajagopalan, K. 2018. An Evaluation of the Large-Scale Implementation of
Ocean Thermal Energy Conversion (OTEC) Using an Ocean General Circulation Model with Low-
Complexity Atmospheric Feedback Effects. Journal of Marine Science and Engineering, 6, 12.
Nihous, G.C., March 2018, A Preliminary Investigation of the Effect of Ocean Thermal Energy Conversion
(OTEC) Effluent Discharge Options on Global OTEC Resources, Journal of Marine Science and
Engineering, 6, 25; doi:10.3390/jmse6010025.
Conference Presentations and Proceedings
Vega, L.A., May 2010. Economics of Ocean Thermal Energy Conversion (OTEC): An Update, Offshore
Technology Conference 2010, (OTC 21016), Houston, Texas.

DE-FG36-08GO18180
Hawai’i National Marine Renewable Energy Center (HINMREC)
University of Hawai‘i
Final Report
50
Comfort, C. M., Vega, L., September 2011. Environmental Assessment of Ocean Thermal Energy
Conversion in Hawaii: Available data and a protocol for baseline monitoring, OCEANS'11 MTS/IEEE,
Waikoloa, Hawaii. doi:10.23919/OCEANS.2011.6107210.
Vega, L.A., DeVisser, A., Cable, B., June 2013. Wave Energy Test Site (WETS): Marine Corps Base
Hawaii (MCBH), Energy Ocean International, Warwick, RI.
Vega, L.A., June 2013. Wave Energy and Ocean-Thermal Energy: Resource Assessment and Modeling,
Energy Ocean International, Warwick, RI.
Vega, L.A., April 2014. Ocean Thermal Energy Conversion, Global Marine Renewable Energy Conference
(GMREC, in conjunction with METS 2014), Seattle, WA.
Vega, L.A., June 2014. Ocean Thermal Energy Conversion (OTEC), International Offshore and Polar
Engineering Conference, Busan, Korea (invited by organizers).
Vega, L.A., September 2015. OTEC: Past, Present & Future 3rd OTEC Symposium, (keynote speaker),
3rd International OTEC Symposium 2015, Kuala Lumpur, Malaysia.
Vega, L.A., February 2016. Ocean Thermal Energy Conversion (OTEC), Ocean Energy Europe 2016,
Brussels, Belgium, (poster).
TASK 3: WAVE RESOURCE MODEL, WAVE FIELD
MEASUREMENTS AND DATA ANALYSIS
This task began with development of a numerical wave model system to provide an operational wave
forecast and long-term hindcast. The forecast dataset aids in the installation, maintenance, and retrieval of
WEC devices at the site and assists in evaluation of WEC device performance. The long-term hindcast
provides a basis for wave energy resource characterization and assessment around the main Hawaiian
Islands, identification of the most favorable conditions for operation of wave power systems, as well as an
analysis of the extreme wave conditions at WETS. New datasets and improved model schemes have been
utilized for the upkeep of the numerical model system.
3.1 Wave Forecasting
Hawaii has a complex wave climate related to its location in the mid-Pacific location and the substantial
effects of the archipelago. The main wave regimes in Hawaii are shown in Figure 3.1. The persistent trade
winds generate waves from the northeast to east throughout the year. Extratropical storms near the Kuril
and Aleutian Islands generate swells toward Hawaii from the northwest to north in winter. The south facing
shores experience moderate swells from the year-round Southern Hemisphere Westerlies that are
augmented by mid-latitude cyclones in summer. Tropical and subtropical storms and passing cold fronts
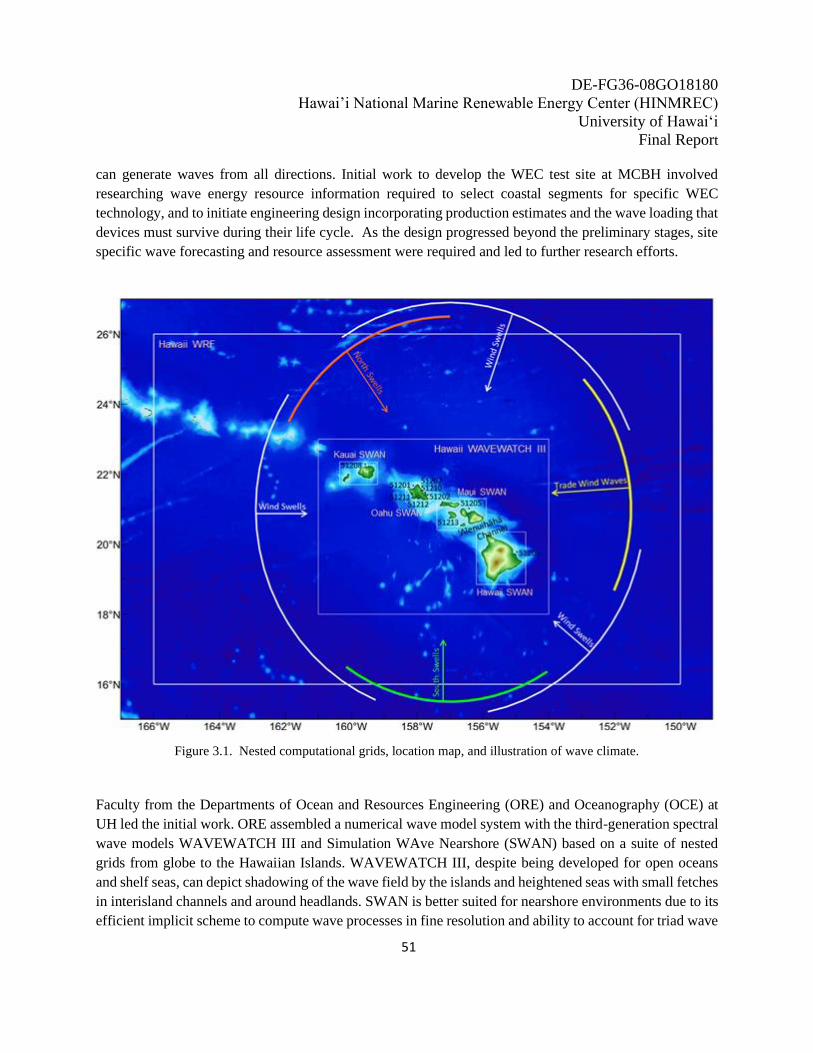
DE-FG36-08GO18180
Hawai’i National Marine Renewable Energy Center (HINMREC)
University of Hawai‘i
Final Report
51
can generate waves from all directions. Initial work to develop the WEC test site at MCBH involved
researching wave energy resource information required to select coastal segments for specific WEC
technology, and to initiate engineering design incorporating production estimates and the wave loading that
devices must survive during their life cycle. As the design progressed beyond the preliminary stages, site
specific wave forecasting and resource assessment were required and led to further research efforts.
Figure 3.1. Nested computational grids, location map, and illustration of wave climate.
Faculty from the Departments of Ocean and Resources Engineering (ORE) and Oceanography (OCE) at
UH led the initial work. ORE assembled a numerical wave model system with the third-generation spectral
wave models WAVEWATCH III and Simulation WAve Nearshore (SWAN) based on a suite of nested
grids from globe to the Hawaiian Islands. WAVEWATCH III, despite being developed for open oceans
and shelf seas, can depict shadowing of the wave field by the islands and heightened seas with small fetches
in interisland channels and around headlands. SWAN is better suited for nearshore environments due to its
efficient implicit scheme to compute wave processes in fine resolution and ability to account for triad wave

DE-FG36-08GO18180
Hawai’i National Marine Renewable Energy Center (HINMREC)
University of Hawai‘i
Final Report
52
interactions in shallow water. ORE researchers also conducted additional parameterizations for energy
dissipation due to wave breaking and bottom friction in the tropical fringing reef environment.
High-quality global and regional wind data are crucial for numerical wave models to capture the complex
wave conditions in Hawaii. The NOAA NCEP Global Forecast System (GFS) provides a 7.5-day wind
forecast at 0.5° resolution four times daily, while the more comprehensive Climate Forecast System
Reanalysis (CFSR) produces assimilated surface winds for the entire globe at 0.5° resolution from 1979 to
2011 and 0.205° afterward. Those global forecast and reanalysis datasets can resolve the synoptic weather
conditions very well, and provide boundary conditions for downscaling of regional atmospheric models.
The UH Department of Atmospheric Sciences downscales the global GFS and CFSR datasets with the
MM5/WRF (Fifth-Generation Penn State/NCAR Mesoscale/Weather Research and Forecasting) models to
provide the high-resolution surface winds in Hawaii. The MM5/WRF model covers the entire State of
Hawaii with a 6km resolution (http://www.soest.hawaii.edu/MET/Faculty/wrf/arw/). With proper depiction
of terrain and land surface conditions and assimilation of the satellite observation, the MM5/WRF model
can resolve the modification of large-scale wind flows by islands with mountain heights ranging from 500
to 4100m to account for the orographic and land-surface effects in Hawaii. The high-resolution regional
wind data complements the global datasets (GFS/CFSR), providing a complete description of synoptic and
mesoscale weather systems in distant and local areas. The complete datasets allow the wave model system
to resolve distant swells as well as local contributions to the wind waves.
ORE implemented the numerical model system with wind forcing from GFS and regional MM5/WRF
model to produce a wave forecast in the Hawaiian Islands at 6km resolution and around individual major
islands at 600m resolution. The forecast is updated once per day, and the output includes hourly significant
wave height, peak period, and peak direction at each computational grid as well as the partitioned wave
parameters and 2D spectra at predefined locations over the 7 day forecast horizon. For quality control, the
daily forecasts are compared with real-time measurements from 10 nearshore and offshore buoys in Hawaii.
Table 3.1 shows the performance indicators of wave forecast at WETS. The results for the first three days
are quite consistent with a root mean square error less than 0.26 m, correlation coefficient above 0.90 and
scatter index less than 15%. The model performance starts deteriorating after the fourth day reflecting the
uncertainty in the weather forecast, yet still provides a reasonable description of the wave conditions. The
daily 7-day wave forecast complements buoy measurements for supporting at-sea operation planning and
day-to-day operation of WEC devices.
The wave forecast continues to be updated daily under Navy funding. Regular improvements to the model
are now fully funded under the Navy. The operational wave forecast and its validation with real-time
measurements from the WETS buoys (CDIP #198 and CDIP #225) are displayed at the UH Pacific Islands
Ocean Observing System (PacIOOS) web pages:
http://www.pacioos.hawaii.edu/waves/buoy-kaneohe/#forecast, and
http://www.pacioos.hawaii.edu/waves/buoy-kaneohe-wets/#forecast.

DE-FG36-08GO18180
Hawai’i National Marine Renewable Energy Center (HINMREC)
University of Hawai‘i
Final Report
53
Table 3.1. Performance indicators of wave forecasts at WETS
Day
Significant Wave Height 1 2 3 4 5 6 7
90% error bound (±m) 0.37 0.37 0.39 0.43 0.50 0.56 0.62
Scatter index (%) 12.5 12.5 13.7 15.7 18.9 22.4 23.9
RMS Error (m) 0.24 0. 24 0.26 0.29 0.35 0.41 0.44
Regression Slope 0.86 0.88 0.87 0.85 0.83 0.77 0.73
Correlation Coefficient 0.94 0.94 0.93 0.90 0.86 0.81 0.78
The same wave model system was also implemented for wave hindcasting from 1979 to 2018 with wind
forcing from CFSR for the entire globe and downscaled WRF around Hawaii. The 38 years of hindcast
includes significant wave heights, peak wave periods, and peak directions of the full and partitioned spectra
at each grid point in hourly intervals as well as two-dimensional wave spectra at buoy locations. Energy
resource parameters such as wave power and energy period are computed from the hindcast spectrum at
selected locations. A thorough validation of the hindcast dataset was conducted with available
measurements from 16 offshore and nearshore buoys along the Hawaiian Islands from 1981 to 2018 and
altimeters on multiple platforms between 1991 and 2009. Figure 3.2 illustrates, as an example, the
comparison of hindcast and measured wave parameters at WETS in 2016. The hindcast captures the year-
round wind waves and episodic wind swells as well as the winter north swells across a wide range of wave
heights and periods. Despite underestimation at the peak of large swell events due to the low-resolution
global winds, the hindcast wave height at WETS has a small mean error of -0.04 m in comparison with the
measurements, indicating good model performance. The high-quality hindcast provides a wealth of
information for characterization of wave resources and identification of extreme waves in support of WEC
development. The long-term dataset exhibits seasonal and interannual variability of wave conditions at
WETS as shown in the upper percentile (95th), median (50th), and lower bound (5th) of significant wave
height, wave power and energy period distribution in Figures 3.3 and 3.4. The site is sheltered from the low
energy south swells and the more extreme northwest swells, is exposed to trade wind waves throughout the
year and north swells in the winter months. The persistent waves and multi-modal sea states provide a
favorable environment for WEC device testing. Numerical wave modeling has proven to be an important
aspect of HNEI’s support to the operation of the Navy's wave energy test site.

DE-FG36-08GO18180
Hawai’i National Marine Renewable Energy Center (HINMREC)
University of Hawai‘i
Final Report
54
Figure 3.2. Comparison of hindcast and measured significant wave heights, peak periods, and peak directions at
WETS in 2016.

DE-FG36-08GO18180
Hawai’i National Marine Renewable Energy Center (HINMREC)
University of Hawai‘i
Final Report
55
Figure 3.3. Monthly 5th (blue), 50th (green), and 95th (red) percentile significant wave height, wave power and
energy period at WETS from the 1979-2017 hindcast.

DE-FG36-08GO18180
Hawai’i National Marine Renewable Energy Center (HINMREC)
University of Hawai‘i
Final Report
56
Figure 3.4. The annual 5th (blue), 50th (green), and 95th (red) percentile significant wave height, wave power, and
energy period at WETS from the 1979-2017 hindcast.
Under Navy funding, the HINMREC wave hindcast model was upgraded to include extreme wave analysis.
For example, NAVFAC funded analysis of wave conditions during hurricanes in the vicinity of WETS,
based on hurricane scenarios from downscaling simulations of a global climate model to produce a range

DE-FG36-08GO18180
Hawai’i National Marine Renewable Energy Center (HINMREC)
University of Hawai‘i
Final Report
57
of severe wave conditions at WETS. The computed wave height presented as a function of annual
exceedance probability enables a risk-based survival analysis of WECs. This study provided a proof-of-
concept of the probabilistic approach and a baseline for analysis of hurricane wave conditions under the
present and future climate projections, and was presented at the METS2017 conference, “Probabilistic wave
parameters for WEC survival analysis at US Navy's wave energy test site in Hawaii”.
For more detail on this and the rest of this work, see the Reports and Publications listed below, (and also
related work under subtasks 3.2).
Reports and Publications
Technical Reports
Vega, L., October 2010. Wave Energy Resources for Representative Sites Around the Hawaiian Islands.
Li, N., Stopa, J., December 2012. Wave Power Analysis for Makapuu Point, Oahu.
Li, N., and Cheung, K.F., January 2014, Progress Report: Comparison of Wave Hindcast Model Results
with Waverider Measurements: November 2012 - October 2013.
Journal Publications
Stopa, J.E., Cheung, K.F., and Chen, Y.-L. 2011. Assessment of wave energy resources in Hawaii,
Renewable Energy Journal, 36, 554-567, doi:10.1016/j.renene.2010.07.014.
Arinaga, R. A., Cheung, K. F. 2012. Atlas of global wave energy from 10 years of reanalysis and hindcast
data, Renewable Energy Journal, 39, 49-64. doi:10.1016/j.renene.2011.06.039.
Stopa, J.E., Filipot, J.-F., Li, N., Cheung, K.F., Chen, Y.-L., Vega, L. 2012. Wave energy resources along
the Hawaiian Island chain, Renewable Energy Journal, 55, 305-321, doi.org/10.1016/j.renene.2012.12.030.
Stopa, J. E., Cheung, K. F., 2014, Intercomparison of wind and wave data from the ECMWF Reanalysis
Interim and the NCEP Climate Forecast System Reanalysis, Ocean Modelling 75, 65–83,
doi.org/10.1016/j.ocemod.2013.12.006.
Stopa, J. E., Cheung, K. F., 2014, Periodicity and patterns of ocean wind and wave climate, Journal of
Geophysical Research: Oceans, 19, 5563–5584, doi:10.1002/ 2013JC009729.
Conference Proceedings
Li, N., Cheung, K.F., Cross, P., and Vega, L., 2016. Wave energy resource characterization at the US Navy's
Wave Energy Test Site, Hawaii, proceedings of the 4th Annual Marine Energy Technology Symposium,
Washington DC.
Li, N., Cheung, K.F., Cross, P., and Vega, L., 2017. Probabilistic wave parameters for WEC survival
analysis at US Navy's Wave Energy Test Site in Hawaii, proceedings of the 5th Marine Energy Technology
Symposium, Washington DC.

DE-FG36-08GO18180
Hawai’i National Marine Renewable Energy Center (HINMREC)
University of Hawai‘i
Final Report
58
Other Presentations
Stopa, J.E., April 2013, Forecasting and Hindcasting Wind Driven Wave Environments, Society of Naval
Architects and Marine Engineers (SNAME) Spring 2013 Meeting.
3.2 WETS Wave Measurements and Operational Wave Analysis
This task was necessary to calibrate models and have real time data available during actual testing and
operations at WETS.
Prior to HINMREC, a directional Waverider© buoy was located at 100m depth 10 km southeast of WETS
at Mokapu. The 9 years of data gathered from 2003 to 2012 was used to calibrate the UH model to ensure
that the model correctly captures the diffraction and refraction of the north swells around Kahuku Point (the
northern tip of Oahu) before reaching WETS, off Kaneohe.
A directional Datawell Waverider© buoy (CDIP #198) was purchased by HINMREC and installed along
the ~80m contour, at a location that would later be very close to the center of WETS and the 60m test berth,
in October 2012 (Figure 3.5). This buoy provides real time incoming wave data for use in the evaluation
of WEC device performance (see Task 5). Permits were obtained from the US Army Corps of Engineers,
US Coast Guard, and State agencies to install the buoy at WETS.
Figure 3.5. Waverider© buoy deployed at WETS, near the 60m test berth.

DE-FG36-08GO18180
Hawai’i National Marine Renewable Energy Center (HINMREC)
University of Hawai‘i
Final Report
59
An additional Waverider© buoy was later purchased under separate funding from ONR, to provide the
required measurement redundancy, (CDIP#225). This buoy was installed during August 2016, also along
the 80m contour 350 m west of the original. The data from both buoys are used to calibrate the UH high
resolution wave model. In addition, the raw data were available to the developers and used by HINMREC
in assessing WEC device performance, as described under Task 5. Both buoys will remain deployed at
WETS with additional funding from Navy and NOAA to ensure that wave data are available to provide that
critical input to the development of power matrices for deployed WECs under test.
Waverider© data, parameters derived from the recorded sea surface elevation time series, is displayed at
the UH Pacific Islands Ocean Observing System (PacIOOS) web page http://oos.soest.hawaii.edu/pacioos/,
(Figure 3.6), and is also available at the Coastal Data Information Program (CDIP) webpage
(http://cdip.ucsd.edu/, CDIP#198 and #225), following standard National Data Buoy Center formats.

DE-FG36-08GO18180
Hawai’i National Marine Renewable Energy Center (HINMREC)
University of Hawai‘i
Final Report
60
Figure 3.6. Screen shot of wave data available online http://www.pacioos.hawaii.edu/waves/buoy-
kaneohe-wets/.
Intermittent deployments of acoustic Doppler current profilers, which can also measure wave conditions
when up-looking, have also occurred under HINMREC funding over the years. (For more detail see the
Reports and Publications listed below, and also related work under subtasks 3.1 and 4.3).
Reports and Publications
Technical Reports
Li, N., and Cheung, K.F., 2014. Wave energy resource characterization at the US Navy Wave Energy Test
Site and Other Locations in Hawaii. Report submitted to National Marine Renewable Energy Center,
Honolulu, Hawaii.

DE-FG36-08GO18180
Hawai’i National Marine Renewable Energy Center (HINMREC)
University of Hawai‘i
Final Report
61
Journal Publications
Li, N., Cheung, K. F., Stopa, J. E., Chen, Y.-L., Hsiao, F., Vega, L., and Cross, P., April 2016. “Thirty-four
years of Hawaii wave hindcast from downscaling of Climate Forecast System Reanalysis”, Ocean
Modelling, Vol. 100, pp. 78-95, SOEST No. 9576.
Li, N., Cheung, K.F., and Cross, P., 2020. Numerical wave modeling for operational and survival analyses
of wave energy converters at the US Navy Wave Energy Test Site in Hawaii. Renewable Energy, (accepted
for publication).
Conference Proceedings
Li, N., Cheung, K.F., and Cross, P., 2018. Probabilistic distributions of extreme wave heights at the Wave
Energy Test Site, Hawaii, proceedings of the 6th Annual Marine Energy Technology Symposium,
Washington DC.
TASK 4: ENVIRONMENTAL IMPACT MONITORING AT WETS
This Task was initiated under contract Modification 009, (in September 2012) to: analyze environmental
effects caused by WEC devices, namely OPT, the WEC devices deployed prior to the initiation of
HINMREC; assess WETS site sensitivity, and; identify possible impacts on marine animals. Environmental
impact studies included: evaluation of potential chemical and biogeochemical threats posed by various
discharges associated with wave energy devices; general assessment of the impacts of ocean energy
installations on marine life, including sediment transport effects, electromagnetic fields, and WEC acoustic
signatures.
4.1 Acoustic Signature Measurements
The most substantial effort at WETS in the area of environmental monitoring has been that of measuring
the acoustic signature of WECs as they relate to the ambient acoustic environment - to assess, primarily for
future regulatory determinations, the degree to which wave energy systems contribute to the acoustic
environment in a given area, and potentially impact behaviors of marine life. HINMREC has been
conducting acoustic monitoring at WETS to measure both the ambient “soundscape” and the actual acoustic
emissions from deployed WEC devices. Extensive underwater acoustic measurements and analysis during
each WEC deployment resulted in important findings of very low-level acoustic signatures of the WEC
devices tested to date. Acoustic data was collected using both fixed/bottomed and drifting devices. This
allowed for the examination of both spatial and temporal acoustic variability in the acoustic environment –
both in the ambient noise and in WEC signature data. Acoustic data was processed with the primary
objective of deriving relevant source levels of sounds coming from the WEC devices and their associated
moorings, while also comparing those emissions with ambient noise and other acoustic signals in the area.

DE-FG36-08GO18180
Hawai’i National Marine Renewable Energy Center (HINMREC)
University of Hawai‘i
Final Report
62
Variability due to weather conditions, seasonal changes in ambient noise, and other factors has been
examined, and continues to be under Navy funding.
HINMREC was tasked with making initial estimates of source levels of WEC devices when in operation at
WETS. If source levels exceeded the maximum accepted level, given in the WETS EA as 151 dB re 1 µPa
at 1m, by more than 3 dB for more than 5% of the operating time, HINMREC was required to immediately
report the measured levels to the National Marine Fisheries Service (NMFS) via the Navy. By the
conclusion of this project, this sound level threshold was not exceeded, or even approached.
Acoustic data was collected near each deployed WEC device on a nearly continuous basis, with an
autonomous single hydrophone station associated with each berth at WETS. One system developed at UH,
the Acoustic Monitoring Package, single channel (AMP-1), is shown in Figure 4.1. The stations were
intended to be capable of deployments of up to three months duration (depending on duty cycles and
sampling frequency), then recovered and redeployed with refreshed batteries and data storage. The
positively buoyant systems were designed to keep the hydrophone acoustically decoupled from the bottom
and away from the worst of the noise associated with snapping shrimp prevalent in Hawaiian waters. The
devices were designed to resolve sounds in the frequency range of 20 Hz to 100 kHz. To obtain ambient
conditions prior to WEC deployments, an initial AMP-1 deployment was begun in late January 2015.
Figure 4.1. The Acoustic Monitoring Package, single channel (AMP-1) was developed at the University of Hawaii
(UH).
Due to the departure of key personnel from UH, this system was never deployed operationally at WETS.
Instead, HINMREC strengthened its relationship with researchers at the University of Washington (UW)
to address the challenge of collecting acoustic data in proximity to deployed WECs. The HINMREC/UW
team ultimately developed two types of systems for this purpose - a bottom-fixed system for longer-term
deployments to assess temporal variability of sound, and a drifting system for short-term deployments to
assess the spatial variability of the sound field near deployed WECs. The drifting system, originally called
the Surface Wave Instrumentation Float (SWIFT) is shown in Figure 4.2. The hydrophone was suspended
1.5m below the surface. Later, the UW engineers experimented with heave plates and drogues to achieve
a compliantly coupled hydrophone/surface float configuration and reduce relative motion of the
hydrophone in the water column. The SWIFTs were deployed with supporting instrumentation, including
GPS, weather monitoring, and a camera system. Deployments were typically done over a period of a few

DE-FG36-08GO18180
Hawai’i National Marine Renewable Energy Center (HINMREC)
University of Hawai‘i
Final Report
63
days to a week to obtain a snapshot of the sounds produced by WECs and their mooring systems, as well
as obtaining ambient acoustic data.
Figure 4.2. University of Washington SWIFT buoy being deployed at WETS in the vicinity of the Fred. Olsen
Lifesaver WEC.
Figure 4.3. University of Washington SWIFT drifting hydrophone system, shown with a heave plate configuration
on the left and with a drogue on the right.

DE-FG36-08GO18180
Hawai’i National Marine Renewable Energy Center (HINMREC)
University of Hawai‘i
Final Report
64
Over time, continued efforts to reduce flow noise issues ultimately led to the next generation drifting
systems, which are called Drifting Acoustic Instrumentation SYstems (DAISYs), equipped with suites of
integrated instrumentation (Figure 4.4). Surface expressions included a meteorological station, tracking
collars, an integrated GPS, 9-axis Inertial Measurement Unit (IMU), wireless and RF communication links,
and condition health monitoring. The subsurface expression was instrumented with a board-level GPS, 9-
axis IMU, pressure sensor, and an acoustic data acquisition system built around a hydrophone.
Figure 4.4. UW DAISY systems after a successful deployment at WETS near the modified Northwest Energy
Innovations Azura WEC.
For stationary acoustic monitoring at the seafloor, two Seaspider (Teledyne Marine) platforms were
developed by the UW/HINMREC team. These were intended to be deployed near deployed WECs for
periods of approximately three months to provide long-term monitoring over changing sea states and
seasons, as well as during a range of WEC operating conditions. Deployments have also been conducted
when no WECs are deployed to obtain ambient noise data, and data with the mooring systems present, but
in “no-WEC” configuration (as described later in the mooring discussion). The Seaspider platforms are

DE-FG36-08GO18180
Hawai’i National Marine Renewable Energy Center (HINMREC)
University of Hawai‘i
Final Report
65
gravity anchored tripods with three hydrophone recording packages, as shown in Figure 4.5. Acoustic
packages used are from Loggerhead Instruments.
Figure 4.5. Loggerhead Instruments acoustic packages deployed aboard a Teledyne Seaspider package for
deployment at WETS. System is configured with dual acoustic release system for post-deployment recovery.
To supplement these data collection efforts, acoustic modeling was conducted to estimate the acoustic field,
to help clarify trends in the measured spatial distribution of sound, and to identify locations for future
stationary hydrophone deployments that will result in higher signal-to-noise ratios (SNR) at frequencies of
interest. A parabolic equation (PE) model, RAMGeo, was utilized to predict transmission loss in proximity
to the Azura as a function of range, depth, source frequency, and metocean conditions. The initial
simulations suggest rich spatial variability in transmission loss around the Azura. Repeating these
simulations for other berths and devices and refining simulations will require further efforts to validate their
accuracy. Validated models could then be used to select locations for future Sea Spider deployment that
result in minimal transmission loss in frequency bands of interest to maximize signal-to-noise ratios. This
work is detailed in the report “Transmission Loss Modeling, Acoustic Model Survey, and Implementation
of Parabolic Equation (PE) Model” listed below under Reports and Publications, and is guiding planned
acoustic system deployments under Navy funding going forward.

DE-FG36-08GO18180
Hawai’i National Marine Renewable Energy Center (HINMREC)
University of Hawai‘i
Final Report
66
A low-cost alternative to the Seaspiders was designed and tested at WETS - a Subsurface Logger for Ocean
Waves (SLOW). SLOW is an instrumented subsurface buoy designed for acoustic measurements of WECs
at close range with minimal flow noise. The SLOW was tethered to the top of a subsurface buoy that was
part of the Azura (and later 30m Lifesaver deployment and future Oscilla deployment) mooring system at
the 30m berth and tested in January 2016. The SLOW was designed in response to challenges and costs
with Seaspider deployments, and difficulty in re-deploying at precisely the same location from one
deployment to the next - for repeatability of acoustic results. Because of the risk of entanglement with a
WEC mooring system, a stand-off distance of at least 100m for the Seaspider is needed, and at this distance,
the WEC can be difficult to distinguish from other ambient noise as the sound from WECs tested to date is
of relatively low intensity. This complicates comparisons of WEC sound between deployments. Also,
during long-period swell, significant flow-noise is produced and may mask WEC sound at frequencies up
to 100 Hz. This test showed that while easier to deploy and recover than a Seaspider and allowing
measurements closer to the Azura WEC, the SLOW did not effectively mitigate flow-noise below 50 Hz.
The IMU data and video of SLOW motion captured by Sea Engineering divers suggests that the tether
length (1m) is responsible for the limited flow-noise reduction. With larger, longer period waves, the SLOW
records significant flow-noise. In addition, self-noise dominates the spectra in higher sea states and appears
to be primarily caused by motion of the attachment hardware and possible impact of the SLOW with the
subsurface buoy to which it is connected.
Acoustic measurements at WETS were used to characterize the temporal and spatial variations in sound
produced by the Azura, modified Azura, and the two deployments of the Lifesaver. Temporal variations
across a range of sea states have been quantified through the Seaspider deployments, and spatial variations
in a range of sea states have been quantified by the drifting SWIFT and DAISY hydrophone systems. Both
types of measurements have provided useful information, each with strengths and weaknesses. Stationary
measurements with the Seaspiders provide well-resolved information during a wide range of WEC
operating states, as well as observations of variability in the ambient soundscape (e.g., diurnal patterns in
snapping shrimp, passing vessel noise, and changes in the acoustic signature of WETS mooring systems in
varying sea states). Drifting measurements provide good spatial resolution and serve a valuable
reconnaissance role for placement of the stationary packages. However, the sea states in which drifters can
be recovered are limited to a subset of all WEC operating states and flow-noise masks WEC sound at
frequencies below 100 Hz, adding additional value to the fixed/bottomed measurement data sets.
At frequencies less than 1 kHz ambient noise is dominated by the sound from wind and waves. At
frequencies greater than 1 kHz, snapping shrimp dominate. Seasonally, humpback whales produce
vocalizations that dominate in the range of 100 Hz to 1 kHz. Several anthropogenic sources are also present.
The most persistent ambient noise is noise from the mooring chains used at the 60 and 80m berths. This
sound is most intense around 1.5 kHz and is produced by chain motion from moorings that are not tensioned
(as occurred in the past when a berth was unoccupied - this changed in June 2019 with the installation of a
pretensioning hawser system called the “no-WEC hawser”, which will be discussed in the mooring section
later in this report). Military aircraft traffic periodically contributes tonal sound around 100 Hz and vessel

DE-FG36-08GO18180
Hawai’i National Marine Renewable Energy Center (HINMREC)
University of Hawai‘i
Final Report
67
traffic periodically produces broadband, high-intensity sound that masks all other ambient noise when
vessel range is less than a few hundred meters.
Against this background, the Azura produced a periodic “moan/whine” from its hydraulic PTO with time
varying frequency. Multiple tones were present from 200 Hz up to 3 kHz. There are also occasional higher
frequency squeaks and lower frequency muffled bangs/clanks from wave slap against the WEC structure’s
spars and float. In summary, in the case of the Azura, the primary mechanism for sound production was
the hydraulic generator, with secondary production from wave interaction. The Azura primarily produced
sound at frequencies less than 3 kHz.
In the case of the Lifesaver, the dominant sound was mooring-chain noise, though it is unclear whether this
originated from the Lifesaver berth or the unoccupied 80m berth. No sound has been definitively assigned
to the power take-off component, suggesting that the Lifesaver would produce little identifiable sound. An
abnormal operating state was also characterized, in which a damaged bearing in one Power Take-off (PTO)
appeared to dominate the acoustic signature, clearly audible at higher frequencies (up to 5 kHz) and at
ranges greater than 1 km, and reinforced the potential for acoustic monitoring to provide information
regarding the health of marine energy systems. (Note: This was later determined to be caused from a
problem in one of the Lifesaver PTO winch lines, although the point about marine energy device health
monitoring remains valid.)
Measurements indicated that the sound from individual converters is of limited environmental consequence,
with the intensity and frequencies of sound well below those produced by recreational watercraft and ocean-
going container vessels at a range of several hundred meters. As expected for this scale of WEC, no
operating states have been identified under which the acoustic emissions exceed regulatory thresholds.
Each WEC does, however, produce sound that might be of environmental consequence in a large array.
The Azura’s subsurface, hydraulic PTO produces a series of tones between 100 Hz and 1 kHz. Conversely,
the LifeSaver PTO, located above the surface, appears to produce limited underwater sound when in normal
operation.
In anticipation of the modified Azura deployment at the 30m berth, the Seaspider bottomed acoustic sensing
station was deployed on 18 December 2017. It was recovered on 26 March 2018, at the end of its useful
deployment life, thus capturing over one month of data in proximity to the modified Azura device.
Additionally, UW DAISY drifters were deployed on 11,13, and 14 March 2018 to characterize sound in
the vicinity of the modified Azura. Data analysis was completed in April, with little difference seen in
acoustic signature as compared with the baseline Azura. A full report from UW was provided to the Navy
sponsor as part of the modified Azura deployment report, and is available to DOE upon request.

DE-FG36-08GO18180
Hawai’i National Marine Renewable Energy Center (HINMREC)
University of Hawai‘i
Final Report
68
Acoustic collection near Lifesaver, during the last deployment (at the 30m berth), consisted of UW DAISY
drifters deployed during the last week of November 2018 and again in late January/early February 2019,
and the Seaspider fixed platform deployed on 29 November 2018 – nominally for three months. Actual
recovery of the Seaspider was delayed by weather, but was completed on 27 March 2019. Data quality is
good, and analysis can be found in the report to the Navy. Procurement of two new Seaspider platforms
and additional DAISY drifters is underway (with Navy funds), to enhance collection flexibility during the
anticipated deployment of multiple simultaneous WECS at WETS in the 2021-2013 timeframe.
These acoustic surveys by HINMREC under DOE funding were completed with no-significant
environmental impact observed. Azura and LifeSaver acoustic signatures were measured to be well below
NMFS sound thresholds, and similar findings were observed during the follow-on deployments of both
WECs. Ongoing acoustic measurements under Navy funding will occur - both in no-WEC scenarios and
when one or more WECs are deployed at the site at a given time.
Reports and Publications
Technical Reports
Sea Engineering Inc., April 2015. WETS Task 1D and 1E Field Report - Acoustics, Second Hydrophone
Deployment.
Sea Engineering Inc., July 2015. Sea Spider Hydrophone and SEI ADCP Deployment at 30m, Field Report.
Polagye, B., September 2015. Sea Spider Survey Report #1, Trial Deployment, Field Report.
Polagye, B., September 2015. Sea Spider Survey Report #2, Azura Pre‐ and Post‐Installation, Field Report.
Polagye, B., September 2015. SWIFT Survey Report #1, Acoustic Characterization of Pre‐Installation
Conditions, Field Report.
Polagye, B., September 2015. SWIFT Survey Report #2, Acoustic Characterization of Azura Wave Energy
Converter, Field Report.
Sea Engineering Inc., April 2016. WETS Task 1I Field Report – Acoustic Measurements with University
of Washington, Hydrophone Drifts Around the Azura WEC.
Sea Engineering Inc., April 2016. WETS Task 1J Field Report – Acoustic Measurements with University
of Washington, SWIFT Drifts Around the Azura WEC at 30m.
Sea Engineering, Inc., June 2017. Annual Report of the Wave Energy Test Site (WETS) at MCBH,
Kaneohe 2016, (comprehensive report across several tasks).
Polagye, B., August 2016. SWIFT Field Survey #4, Initial Acoustic Characterization of Lifesaver Wave
Energy Converter, Field Report.
Sea Engineering Inc., August 2016. WETS Task 1H Field Report – Sea Spider Hydrophone Recovery and
Redeployment.

DE-FG36-08GO18180
Hawai’i National Marine Renewable Energy Center (HINMREC)
University of Hawai‘i
Final Report
69
Sea Engineering Inc., August 2016. WETS Task 1G Field Report – Acoustic Measurements with
University of Washington, SWIFT Drifts around the Azura WEC at 30m.
Polagye, B., Murphy, P., August 2016. Performance Assessment of Subsurface Logger for Ocean Waves
(SLOW) Prototype.
Sea Engineering Inc., November 2016. WETS Task 1K Field Report – Sea Spider Deployment, 60M Berth.
Polagye, B., December 2016. SWIFT Field Survey #5, Compliantly-Coupled Hydrophone Systems,
(Deliverable #15).
Polagye, B., January 2017. SWIFT Field Survey #3, Spatial Characterization of the Azura Wave Energy
Converter, Field Report.
Murphy, P., Polagye, B., January 2017. Transmission Loss Modeling Acoustic Model Survey and
Implementation of Parabolic Equation (PE) Model.
Sea Engineering Inc., June 2017. Annual Report of the Wave Energy Test Site (WETS) at MCBH, Kaneohe
2016.
Murphy, P., Polagye, B., June 2017. Two Sea-Spiders Field Survey Report #3.
Polagye, B., January 2018. SWIFT Field Survey #7, Surveys around Fred. Olsen Lifesaver.
Sea Engineering Inc., January 2015. Shore Side Report, 80m ADCP Deployment.
Polagye, B., March 2019. SWIFT Field Survey #8, Surveys around Fred.Olsen Lifesaver.
Polagye, B., Murphy, P., August 2019. WETS Acoustic Survey Final Report.
Conference Proceedings
Polagye, B., Murphy, P., Cross, P., Bethune, K., Vega, L., February 2016. Temporal and Spatial Variations
in Sound Produced by a Wave Energy Converter, ICOE 2016, Edinburgh, UK.
Polagye, B., Murphy, P., Cross, P., Vega, L., January 2017, Acoustic Characteristics of the Lifesaver Wave
Energy Converter, 12th European Wave and Tidal Energy Conference, Cork, Ireland.
.
4.2 Electromagnetic Field Prediction, Measurement, and Protocols
The original HINMREC plan was to deploy, maintain and analyze data obtained with electric and magnetic
field recorders designed to determine submarine power cable electromagnetic field (EMF) signatures at
WETS. Testing would include data acquisition of time series of magnetic and electric measurements with
equipment and cables both energized and de-energized.

DE-FG36-08GO18180
Hawai’i National Marine Renewable Energy Center (HINMREC)
University of Hawai‘i
Final Report
70
However, it was determined by the U.S. Department of the Interior, Bureau of Ocean Energy Management
(BOEM) and the University of California, Santa Barbara (UCSB), that submarine power cables operating
at much higher power levels (~ 26 MW) than those expected from WEC devices tested at WETS (≤ 1 MW),
do not negatively impact marine life such that performing measurements at WETS would not yield useful
information. Further, a growing consensus in the marine energy field suggests that EMF is an insignificant
factor in association with marine energy devices, particularly single devices of limited power production
capacity, which is what will be tested at WETS. Therefore, this task was cancelled, and funds reallocated
to acoustic emissions measurements. It is noted, however, that as new information becomes available and
sensing techniques are developed, future measurements, such as those planned by Woods Hole under the
DOE Triton program, will take place.
Major conclusions from the BOEM/UCSB report are:
● Submarine power cables transmitting electricity at power levels of 17 to 18 MW and as high as 26
MW do not affect the behavior of the fish (including some electro-sensitive species) and
invertebrate species present in the area of the measurements and observations (February 2012 to
October 2014).
● One meter away from the unburied energized cables the scalar magnitude of the magnetic field
diminishes to background levels. Therefore, cable burial should only be considered to avoid
damage from human activities (e.g., fishers, anchoring etc.).
References
[1] Love, M. S., M. M. Nishimoto, S. Clark, and A. S. Bull. 2016. Renewable Energy in situ
Power Cable Observation. U.S. Department of the Interior, Bureau of Ocean Energy Management, Pacific
OCS Region, Camarillo, CA. OCS Study 2016-008. 86 pp.
[2] Personal correspondence (June 2016) Vega with C. Blake Hebert, PE. Electrical Engineering Advisor
CSC-Electrical Function, ExxonMobil Production Company. USA.
4.3 Ocean Current and Wave Measurements with ADCPs
Since HINMREC was charged with the independent evaluation of WEC device performance, device power
output (kW) is measured as a function of wave parameters, obtained from wave measurement devices. The
primary objective under this task was to provide statistically significant comparisons between the industry
standard devices, namely a Datawell Directional Waverider© buoy, and the latest generation Acoustic
Doppler Current Profilers (ADCPs). ADCPs can be deployed on the seabed, directed up to the surface, and
through post processing can detect the essential characteristics of the surface wave field. However, how
well these data compare with Waverider© was not well documented in the literature.

DE-FG36-08GO18180
Hawai’i National Marine Renewable Energy Center (HINMREC)
University of Hawai‘i
Final Report
71
For this reason, HINMREC contracted with Sea Engineering Inc. to deploy a state-of-the-art ADCP, a
Teledyne RDI Sentinel V100, to compare measurements with the Waverider© buoy (CDIP#198) that is
maintained by UH and PacIOOS. The ADCP was deployed on November 13, 2014, on the seabed, looking
up at the surface, approximately 400 m from the WETS Waverider© buoy and along the same 80m depth
contour (Figure 4.6).
Figure 4.6. Location of the wave measurement instruments deployed at the WETS 30m berth.
The latest generation ADCPs, like the RDI Sentinel V100 installed at WETS, use five beams instead of the
traditional four and software that has been updated to resolve some of the issues identified during previous
field tests.

DE-FG36-08GO18180
Hawai’i National Marine Renewable Energy Center (HINMREC)
University of Hawai‘i
Final Report
72
Comparison between Waverider© buoys and earlier versions of ADCPs were performed based on field data
obtained at shallower depths. However, previous work was performed with ADCP devices installed at
depths less than 45 m and separated by as much as 30 km from the Waverider© , such that data had to be
transformed to different depths using linear theory correction for shoaling and refraction effects. It was
learned that estimates of wave parameters obtained with those ADCPs correlated favorably with those
obtained with Waveriders© in waters shallower than about 20 m. In general, significant wave height, peak
frequency and mean direction parameters were in agreement but directional spreading was not. The
directional information is not an issue for some type of WEC devices (e.g., heave only point absorbers) but
is important and required for the control of others that need to also tune additional degrees-of-freedom (e.g.,
their roll, pitch, surge and sway) to the wave environment.
One of the features of the Sentinel V100 ADCP is its ability to measure wave statistics using a fifth vertical
beam (in addition to the four off-vertical beams) to improve the accuracy of the measurements and provide
high resolution surface tracking. The device uses a vertical acoustic beam to measure the distance to the
water surface. Sound waves reflect off the water surface and the time a reflection takes to return to the
ACDP is used to determine the distance to the surface. Accurate wave statistics can be computed from the
measured water surface elevation record. An ADCP relies on the Doppler Effect to determine the water
currents through the water column. The direction of current can be determined by using three or four
acoustic beams. The acoustic reflection of a beam that is up current from the ACDP will arrive before the
reflection of a down current acoustic reflection. With the reflection return timing of multiple beams, the
direction of waves and currents can be calculated.
By comparison, the Waverider© buoy uses sensitive accelerometers to determine the motions of a moored
buoy. The buoy is designed such that the mooring line and anchor have minimal impact on the motion of
the buoy. The motion of the buoy is representative of wave motion and is used to calculate wave conditions
and parameters.
Measurements from the Sentinel V100, deployed from November 2014 through April 2015, and the
Waverider© had a relatively close correspondence (Figure 4.7).

DE-FG36-08GO18180
Hawai’i National Marine Renewable Energy Center (HINMREC)
University of Hawai‘i
Final Report
73
Figure 4.7. Time series of the ADCP and Waverider© at WETS (November 2014 through April 2015).
The ADCP proved to be as accurate as the Waverider© in the estimation of wave height, based on statistical
metrics of the ADCP measurement error in relation to the standard provided by the Waverider©, with the
significant wave height correlation estimated at 0.96 for the entire period.
In relation to the Waverider©, the ADCP period and direction estimates were not as precise as the wave
height estimates, as represented by the peak period and peak direction. The correlations were 0.71 and
0.59, respectively. The lower ADCP correlation of the peak direction is due to the large range of directional
values, and the large jumps in direction – from 360° to 50° – that can occur quickly at WETS as a swell
event subsides and trade wind seas become dominant. More detail is available in the reports listed below.
The ADCP data was available to the tenant at that time (NWEI), and was used in conjunction with the
Waverider© records (Task 3.2.1) in assessing the Azura power performance (Task 5.2.2) and for the
sediment transport analysis (Task 4.4).
Numerous additional ADCP deployments were done for HINMREC in the years since this comparative
analysis was done. This has built up a good data set to document currents at WETS, and has, when
deployed, provided a backup data set to the Waveriders for wave conditions. In December 2017, a different
ADCP was deployed at the 60m site, and was recovered in March 2018. During recovery, one of the sensors
was damaged, and after repairs completed by the manufacturer, the ADCP was redeployed in May 2018.
The final ADCP deployment was concluded with recovery on 3 July 2019. ADCP data collection is no
longer being conducted at WETS, with the end of HINMREC funding for this function.

DE-FG36-08GO18180
Hawai’i National Marine Renewable Energy Center (HINMREC)
University of Hawai‘i
Final Report
74
Reports and Publications
Technical Reports
Sea Engineering Inc., June 2012. Kaneohe Wave Energy Test Site Acoustic Doppler Current Profiler Data
Report.
Sea Engineering, Inc., May 2015. Task 4A, Wave Energy Test Site Comparison of Waverider© Data and
Sentinel V100 ADCP Data, Report.
Sea Engineering, Inc., September 2015. Task 4B, Wave Energy Test Site Comparison of Waverider© Data
and Sentinel V100 ADCP Data, Report.
Sea Engineering, Inc., L. Vega, 2016. Wave Measurements at WETS: Comparison of Waverider© and
ADCP in-situ Records.
Sea Engineering, Inc., September 2016. Task 4C, Wave Energy Test Site Sentinel V100 ADCP Data
Analysis at 30m Site.
Sea Engineering, Inc., March 2017. WETS Task 4E: ADCP Deployment (and Sea Spider Hydrophone
Deployment) Field Report.
Sea Engineering, Inc., June 2017. Annual Report of the Wave Energy Test Site (WETS) at MCBH,
Kaneohe 2016, (comprehensive report across several tasks).
Sea Engineering, Inc., August 2017. Task 4D Report - ADCP Data Analysis at WETS 30m Site.
Sea Engineering, Inc., August 2017. Task 4G Report - ADCP Data Analysis at WETS (70m Depth).
Sea Engineering, Inc., August 2017. Task 4H Report - ADCP Data Analysis at WETS (70m Depth).
Sea Engineering, Inc., March 2018. Task 4I Report - ADCP Data Analysis at WETS (70m Depth).
Sea Engineering, Inc., June 2018. Task 4J Report - ADCP Data Analysis at WETS (70m Depth).
Sea Engineering, Inc., December 2018. Task 4K Report - ADCP Data Analysis at WETS (70m Depth).
4.4 Sediment Transport Analysis and Field Surveys
Seafloor observations at WETS were focused on the anchor base structures and interactions with the
natural seafloor sediment movement at the 60 and 80m berths. (The 30m berth is characterized by a hard
bottom, with only a thin veneer of sand, and very sparse corals.) These were monitored with periodic
surveys conducted with an ROV. The sediment distribution (Figure 1.2 in Task 1) was periodically
reexamined to determine whether the presence of the moorings, or of the devices themselves, had a
measurable impact on sediment distribution over time. A combination of core samples, fixed measurement
staffs, and scour cylinders was used.

DE-FG36-08GO18180
Hawai’i National Marine Renewable Energy Center (HINMREC)
University of Hawai‘i
Final Report
75
The sediment staffs and two scour measurement cylinders were installed at the 60 and 80m berths in an
effort to investigate natural sediment transport and scour. The sediment staffs were marked in centimeter
graduations. The scour cylinders consisted of thin walled sheet metal cylinders approximately 12" in
diameter, and 16" high. The cylinders were partially filled with concrete from 4" to 10" from the bottom of
the cylinder. When placed on the seafloor, the cylinders sunk into the sediment to the level of the concrete,
allowing for observation of scour.
Observations of the sediment staffs indicated that there was little natural sediment transport in the area.
Survey of the sediment staffs, however, revealed significant influence of marine biological activity that
obscured the marking increments. The base of the staffs at the 80m site were undermined by marine
biological activity and there was a depression surrounding the northeast staffs. The extensive marine
growth at both locations rendered further measurement invalid.
Observations of the scour cylinders indicated there was scour at both locations such that eventually one of
the cylinders toppled over due to excessive scour. Thus, ultimately, both the sediment staffs and scour
cylinders proved ineffective at quantifying sediment transport in the area. Therefore, a determination was
made that, going forward, surveys would be done qualitatively during regular ROV inspections of the
mooring components by examining the sediment around the anchors and sinker-weights of the deep water
mooring locations.
Based on these HINMREC field surveys, it can be concluded that while measurable current-induced
sediment transport does occur in the area of the 60m and 80m berths, it is insufficient to impact the
performance of the cost-effective drag embedment anchors used at these berths. Further, the overall
distribution of sand in the vicinity of the deep berths has not significantly changed in the years since the
deep berth moorings and cable anchors were installed (September 2014).
Reports and Publications
Technical Reports
Sea Engineering, Inc., December 2014. Sediment Transport Analysis, Task 1A, Field Report.
Sea Engineering, Inc., December 2014. WETS Task 3A Sediment Transport Analysis, 80m and 60m
anchor location sediment transport deployment, Field Report.
Sea Engineering Inc., July 2015. WETS Task 3B Sediment Transport Analysis, 60m and 80m Mooring
Locations, Field Report.
Sea Engineering, Inc., April 2017. WETS Task 3D Sediment Transport Analysis Field Report, ROV
Monitoring, (estimate of sedimentation or scour around the objects).
Sea Engineering, Inc., June 2017. Annual Report of the Wave Energy Test Site (WETS) at MCBH,
Kaneohe 2016, (comprehensive report across several tasks).

DE-FG36-08GO18180
Hawai’i National Marine Renewable Energy Center (HINMREC)
University of Hawai‘i
Final Report
76
4.5 Ecological and Seawater Chemical Analysis Surveys
HINMREC performed and documented six quarterly ecological and seawater chemical analysis surveys,
completed from 2014 through 2017. The documented methodology used by NAVFAC biologists to
perform ecological dive surveys, during the previous testing phase (2003-2011) of the Ocean Power
Technologies (OPT) point absorber, was revised and used to continue the survey process and augment the
unique database for the site under HINMREC funds.
Quarterly ecological surveys around the 30m berth included a fish count and replicate quadrants in two
locations near the anchors. Also two replicate transects were conducted along the cable route. One 50
meter transect was completed from the shelf (~12 meters deep) along the cable towards shore, and another
transect at the base of the shelf (~24 meters deep) and continued up the slope to the shelf.
Water sampling and subsequent seawater chemical analysis were conducted at all three WETS berths to
determine if any the potential changes in seawater composition occurred due to the presence of WEC
devices. The following constituents were sampled at near bottom, mid, and upper water levels: Dissolved
Oxygen, Salinity, Temperature, Turbidity, and pH.
There was no evidence of significant environmental impact from all surveys conducted by NAVFAC (2003-
2011) and by HINMREC under DOE funding (2014-2017). The latter are listed below. It is noted that the
Navy continues to directly fund ecological dives at WETS (not through HNEI). These now represent an
extensive history since the early days of OPT testing in 2003. Detailed reports have been produced by the
Navy to document these surveys.
Reports and Publications
Technical Reports
Sea Engineering Inc., March 2015, WETS Ecological Survey Field Report Diving #1.
Sea Engineering Inc., April 2015, WETS Ecological Survey Field Report Diving #2.
Sea Engineering Inc., October 2015, WETS Ecological Survey, Field Report Diving #3.
Sea Engineering Inc., February 2016, WETS Ecological Survey Field Report Diving #4.
Sea Engineering, Inc., June 2017. Annual Report of the Wave Energy Test Site (WETS) at MCBH,
Kaneohe 2016, (comprehensive report across several tasks).
TASK 5: WAVE ENERGY CONVERSION DEVICE PERFORMANCE
This task was initiated under contract Modification 009 (11 September 2012), to implement a series of new
activities in support of operations at WETS, under the working partnership between Navy and DOE. A
major role was for HINMREC to assess the power performance of electricity producing WEC devices.

DE-FG36-08GO18180
Hawai’i National Marine Renewable Energy Center (HINMREC)
University of Hawai‘i
Final Report
77
HINMREC contracted with DNV GL for support in developing and providing operational guidelines for
use by WEC developers testing devices at WETS. The purpose was to identify the main activities, processes
and controls to enable safe marine operations at WETS; provide overviews of the main safety and
operational issues to consider at the various stages of the projects, and; provide checklists to assist both
HINMREC and device developers in the preparation for and execution of daily marine operations.
HINMREC designed and implemented a methodology for WEC performance analysis and verification
under a testing protocol (Task 5.1). A WEC performance numerical model was developed to allow for
virtual testing, modification, and optimization of WECs prior to field testing (Task 5.2.1). The numerical
model allows an efficient and cost-effective preliminary test to guide the field testing, and is available to
designers and developers.
The required data acquisition and data analysis protocols were designed and documented, including
instrumentation acquisition, deployment, and maintenance during the WEC device testing phase (Task
5.2.2). The performance metrics included a Power Matrix designed to tabulate the relationship between
power output (kW) and significant wave height (Hs, m) and energy period (Te, s). The wave parameters
were defined in the spectral treatment of sea surface elevation time series (also referred to as time history
records).
HINMREC also conducted a series of periodic surveys to assess the durability of the WEC devices under
testing at WETS as well as the durability of the mooring systems and the submarine power cables (Task
5.2.3). These tasks led to development of methodologies used at WETS and available for use elsewhere,
in the evaluation of technical aspects related to the operation of WEC devices.
5.1 WETS Test Protocols and Data Acquisition System
With support from DNV GL, HINMREC developed wave energy test protocols for use in the evaluation of
WEC system performance at WETS, incorporating both environmental and WEC power data. The test
protocol allowed time history records of WEC device power output to be obtained as a function of
environmental input (wave and current conditions). The protocol was needed to collate all relevant data,
and was defined based on protocols available in existing international test centers, EU initiatives, and
similar activities underway under the International Electrotechnical Commission (IEC), IEC –TC-114, and
NREL working groups.
The required electrical instrumentation was also acquired. The ocean current profile in the vicinity of the
test devices was recorded with a dedicated instrument (ADCP, under Task 4.3), and standard meteorological
parameters per World-Meteorological-Organization (WMO) specifications were available through the
Automated-Surface-Observing-System (ASOS) installed at MCBH. In this way, the combined influence
of the ocean currents and local meteorological conditions on the performance of the installed WEC devices
was assessed.

DE-FG36-08GO18180
Hawai’i National Marine Renewable Energy Center (HINMREC)
University of Hawai‘i
Final Report
78
HINMREC was a member of the IEC and NREL working groups, and participated in the design and
implementation of the IEC Technical Specification (TS) protocol that is used to provide an independent
evaluation of WEC device in-water performance [IEC/TS 62600-101:2012, Marine energy - Wave, tidal
and other water current converters - Part 100: Electricity producing wave energy converters – Power
performance assessment.] The test protocol and associated data acquisition system was designed, along
with suitable measures for uncertainty, to estimate device performance by recording the time series of sea
surface elevation (waves) and power output (kW) at the device generator terminal.
No device subsystem parameters were recorded by HINMREC, as only the environmental input (waves)
and the device output (power at generator terminal) were required. The device subsystem and design details
are generally proprietary. The WEC developer, however, is able to, and generally does, choose to
incorporate a much more complete suite of subsystem instrumentation data feeds. Data acquisition systems
were designed to document device performance by recording time series of sea surface elevation (waves)
and power output at the device generator terminal, at a point where the output is in the form of AC at 60
Hz at a grid connection voltage.
Reports and Publications
Technical Reports
GL Garrard Hassan, May 2013, Test Protocols Final Report, Hawaii National Marine Renewable Energy
Center WEC Ocean Testing.
GL Garrard Hassan, July 2013, Operational Documentation, Hawaii National Marine Renewable Energy
Center - WEC Testing.
5.2 Device Performance Analysis
HINMREC’s role under this task was to provide an independent assessment of the power performance of
WEC devices tested at WETS. A summary of the three subtasks is provided, WEC Performance Modeling,
WEC Testing Phase Data Analysis, and Hardware Reliability Surveys.
5.2.1 WEC Performance Model
This project made use of proven seakeeping analysis numerical models. Complementary wave tank studies
were also conducted early in the program, along with numerical modeling to support the field testing in an
effort to optimize WEC device development. Two primary objectives were pursued: 1) refinement of
numerical simulation packages to predict dynamic loads on floating and submerged structures and assess
the performance of single wave power devices and interacting arrays of these devices; and 2) scale tests in
an existing UH wave tank at the UH Department of Civil and Environmental Engineering, including a 12.2
m (l) x 1.2 m (w) x 0.9 m (d) wave tank/wave generator (equipped with a towing carriage for OTEC studies).

DE-FG36-08GO18180
Hawai’i National Marine Renewable Energy Center (HINMREC)
University of Hawai‘i
Final Report
79
The wave flume has an advanced computer-controlled wave maker that can generate periodic waves,
solitary waves, conoidal waves, breaking waves, and also irregular waves to better simulate the ocean wave
field. Instrumentation includes multiple wave gauges and data acquisition systems, a 3-D Laser Doppler
Velocimeter (LDV), a 3-D Particle Image Velocimeter (PIV), video cameras, high speed cameras, and flow
meters.
Experiments were conducted under different wave conditions to examine single devices and series of
devices arranged in different patterns. In one of these experiments, the geometry of a two-dimensional,
single, heaving body was optimized for maximum power absorption with regular, harmonic, linear, incident
waves. The research was conducted through both wave tank experiments and numerical simulation.
Numerically the optimum shape for power absorption efficiency was found using the software AQWA,
which was then verified experimentally, (see Figure 5.1).
(a)
(b)
Figure 5.1. Experiments carried out at UH to optimize the shape of a heaving floater for maximum power
absorption. (a) Experimental setup. (b) Summary of results from experiments, showing the concave face has the
highest efficiency.

DE-FG36-08GO18180
Hawai’i National Marine Renewable Energy Center (HINMREC)
University of Hawai‘i
Final Report
80
The concept of using man-made wave focusing structures to enhance the performance of WEC devices by
focusing waves to increase their amplitude by propagation over a submerged structure was investigated.
Laboratory experiments were conducted to explore the possibility of developing practical wave focusing
lenses that could be deployed with various wave power devices in the ocean. Wave tank information was
made available to developers and in a report posted on the HINMREC web page.
After September 2011, small-scale tests of prototype devices in the UH wave tanks were discontinued, since
it was determined that OSU, the US Naval Academy, and others have superior and larger facilities better
suited to this sort of work.
A numerical model was developed to simulate wave tank analysis, to allow virtual testing, modification,
and optimization of WECs in an efficient and cost-effective way, prior to field testing. This model utilized
proven seakeeping analysis numerical models, based on finite-volume discretization.
Verification of HNEI’s WEC performance model entailed using DNV GL’s in-house WEC performance
and loading analysis tool WaveDyn, which was developed specifically for WECs. The tool allows for
flexible, multi-body modelling of a wide range of WEC concepts in time domain simulations, and couples
loading from critical areas including hydrodynamics, power take off, and moorings. DNV GL simulated a
range of generic WEC models in conditions representative of the WETS site in order to provide a database
of results for use by HNEI. Extreme loads of a WEC model test case were also assessed for WEC devices
using a variety of methods.
Modeling efforts were geared towards the generation of a theoretical Power Matrix (electrical output as a
function of significant wave height and energy period) to be compared to the Power Matrix based on field
data recorded during operations of the WEC devices, starting with the Azura at WETS.
Power prediction of Azura was conducted using WEC-Sim, developed by NREL. The necessary
hydrodynamic coefficients, required as inputs to WEC-Sim, were generated using WAMIT™ software and
OpenFOAM CFD packages for the baseline case. Extensive numerical modeling of the device was carried
out in WEC-Sim to tune the numerical model to match experimental data of the device measured at WETS.
WEC-Sim requires model-basin or field data to be calibrated for a specific WEC device configuration.
Figure 5.2 shows the Azura device modeled in WecSim and OpenFoam solvers.

DE-FG36-08GO18180
Hawai’i National Marine Renewable Energy Center (HINMREC)
University of Hawai‘i
Final Report
81
(a)
(b)
Figure 5.2. (a) Azura device modeled in WEC-Sim, showing the instantaneous free surface, float and top of the
spar. (b) Float undergoing heave oscillations in OpenFOAM CFD solver.
Although the WEC-Sim model is not calibrated for an Azura-like device retrofitted with a heave plate,
preliminary predictions were made for such a configuration (i.e., modified Azura). This was done to
support NWEI in the implementation of future at-sea tests with NAVFAC funding.
Under ONR funding, a license for Flow3D CFD software, a flow solver for real flows, was obtained.
This software solves the Navier-Stokes equations that include viscosity and non-linearity. This was done
in an effort to set up a Numerical Wave Tank (NWT). NWTs are required to model realistic fluid flow
phenomena. In the case of the modified Azura device, Flow3D was used to calculate the viscous drag
properties of the device. Figure 5.3 shows the full-scale spar undergoing heave oscillation tests in the
NWT; from these tests the drag can be estimated.

DE-FG36-08GO18180
Hawai’i National Marine Renewable Energy Center (HINMREC)
University of Hawai‘i
Final Report
82
Figure 5.3 Snapshot of full size spar of Azura undergoing heave oscillation tests in numerical tank. The central
vertical plane in the fore-aft direction is colored by velocity magnitude. Also shown are velocity vectors.
Also under ONR funding, modeling work was continued and expanded beyond what was done under
HINMREC, and the Azura and modified Azura numerical models were completed. The comparison
between experimental data and numerical results for heave motion Response Amplitude Operator (RAO),
in the case of the modified Azura device, is shown in Figure 5.4. This figure is representative of the effect
of viscous drag parameters on the motion characteristics of the device.

DE-FG36-08GO18180
Hawai’i National Marine Renewable Energy Center (HINMREC)
University of Hawai‘i
Final Report
83
Figure 5.4 Heave RAO from trials and numerical models. Grey and black shades represent experimental data
from different dates. Other colored lines represent numerical results with different viscous drag for spar and float.
Wave arrays were also modeled, to determine the required separation distances between devices. Under
NAVFAC funding, hydrodynamic modeling of WEC performance and WEC mooring systems has
expanded. Foundations and skills developed during HINMREC hydrodynamic numerical modeling studies
have formed a solid basis on which to build this growing modeling capability.
Reports and Publications
Technical Reports
GL Garrad Hassan, March 2016, WEC Performance Model Verification - Progress Report #1,
Hawaii National Marine Renewable Energy Center, WEC Ocean Testing.
GL Garrad Hassan, April 2016, Testing Support – Progress Report #1, Hawaii National Marine Renewable
Energy Center, WEC Ocean Testing.
GL Garrad Hassan, June 2016, WEC Performance Model Verification – Progress Report #2, Hawaii
National Marine Renewable Energy Center, WEC Ocean Testing.
Journal Publications
Nihous, G.C., August 2013. Maximum wave power absorption by flexible line attenuators, Applied Ocean
Research 43, 68–70, doi.org/10.1016/j.apor.2013.08.003.

DE-FG36-08GO18180
Hawai’i National Marine Renewable Energy Center (HINMREC)
University of Hawai‘i
Final Report
84
Nihous, G.C., April 2014. Maximum wave power absorption by slender bodies of arbitrary cross sections
in oblique seas, Applied Ocean Research 47, 17–27, doi.org/10.1016/j.apor.2014.03.007.
Nihous, G. C., May 2014, The method of imbedded Lagrangian element to estimate wave power absorption
by some submerged devices, Journal of Marine Science and Application, 13, 2, doi:10.1007/s11804-014-
1247-9
Rajagopalan, K., Nihous, G. C. 2016. Study of the force coefficients on plates using an open source
numerical wave tank, Ocean Engineering, 2016, 118.
Conference Proceedings
R. Hager, N. Fernandez, M.H. Teng, September 2011. Geometric Optimization of a Single, Two-
Dimensional, Heaving Body of Power Absorption Efficiency, OCEANS’11 Conference, (poster).
Nihous, G. C., Rajagopalan, K., Vega, L. A., April 2015. Development of a Numerical Wave Tank to
Support WETS Activities, 3rd Marine Energy Technology Symposium (METS), Washington, D.C.
Rajagopalan, K., Cross, P., Nihous, G., June 2019. Numerical Modeling Research at the US Navy Wave
Energy Test Site, Honolulu, Hawaii, International Society of Offshore and Polar Engineers (ISOPE)
Honolulu.
Master’s Thesis
R. Hager, August 2012. Geometric Effects on Maximum Power Absorption Efficiency for a Single, Two-
Dimensional Heaving Body, Thesis, Master of Science in Civil Engineering, University of Hawaii.
5.2.2 WEC Testing Phase Data Analysis
Time series of WEC device power output as a function of environmental input (wave and current
conditions) under the test protocol for WETS were recorded and analyzed. Data acquisition and analysis
was conducted during field testing of the WEC devices at the three WETS berths. Tenants at WETS were
required to provide power output data at the generator terminal.
The device capacity factor was evaluated as a function of wave resource data. The device performance data
obtained at WETS has multiple uses for: device developers who want to validate the performance of their
WEC; investors who want to assess the performance of a device developer’s WEC; and, eventually project
developers who want to assess the performance of their project against manufacturer’s claims. A process
was established to determine the type of data that was made available in the public domain, in agreement
with all parties (e.g., Navy, DOE and the developers). The process made use of methods and software to
non-dimensionalize data for protection of proprietary information. Cooperative Research and Development
Agreements (CRADA) were negotiated and implemented with WEC developers before testing at WETS.

DE-FG36-08GO18180
Hawai’i National Marine Renewable Energy Center (HINMREC)
University of Hawai‘i
Final Report
85
The data acquisition, analysis, and the Power Matrix report for the first deployment of the Azura device
over 4-seasons was completed in 2016 and supplied to DOE. A similar report was prepared for the second
deployment, done under Navy funding, and provided to Navy. These reports are not shared publicly due
to the proprietary nature of the performance data.
Data acquisition for the first Lifesaver deployment was completed in April 2017 with one-year long records.
However, due to the many interruptions in data collection associated with Lifesaver, it was difficult, and
misrepresentative, to produce a proper Power Matrix (or matrices) for the Lifesaver’s first deployment.
These interruptions were caused by various hawser (horizontal mooring lines from permanent surface buoys
to the device), and PTO winch line failures. NAVFAC approved funding for additional tests with improved
(reduced) hawser pre-tension, and under that Navy-funded project to redeploy the device, emphasis was
placed on generating power matrices to augment the data collected previously and yield meaningful
conclusions as to power performance of the device.
Based on lessons learned from the HINMREC-supported first Azura deployment, a proposal was put
forward to NAVFAC, and funding received for the redesign and testing of the modified Azura. The device
was deployed and power matrices developed. Power performance data collection from the modified Azura
deployment began on 20 February 2018 and concluded in mid-August 2018 when the device was recovered.
A robust suite of performance data, as well as device motion data for comparison with numerical modeling
predictions, was collected.
Conference papers comparing the motions/performance of the baseline and modified Azura against model
predictions were completed and are listed in the Reports and Publications section below. In short, while
that device did exhibit improved motions of the float relative to the spars, that did not equate to improved
power performance. One of these papers analyzing this result was presented at the European Wave and
Tidal Energy Conference in Naples in September 2019. A key conclusion is that, although the intended
improvements in relative motion between the device float and spars were achieved, the device PTO was
unable to convert the added torque from the float into electrical power generation. Final reporting on Azura
power performance was delivered to DOE. The final report to NAVFAC on the modified Azura power
performance may be available to DOE by request, along with the final reporting on the Lifesaver power
performance which is ongoing at the time of this report.
Fred. Olsen, Ltd. shares their power performance data from the WETS deployment openly. These data can
be found at www.boltwavepower.com (Figure 5.5 and 5.6).

DE-FG36-08GO18180
Hawai’i National Marine Renewable Energy Center (HINMREC)
University of Hawai‘i
Final Report
86
Figure 5.5. Energy production from the LifeSaver WEC, during the first deployment (July 2016 through March
2017).
Figure 5.6. Energy production from the LifeSaver WEC, during the second deployment (October 2018 to through
January 2019). Also shown in this plot is the power consumption of the UW AMP system (in blue), demonstrating
that the Lifesaver provided, on most days, far more power than that system required for operation.
Reports and Publications
Conference Proceedings
Lettenmaier, T., Ling, B.., Vega, L. A., Nelson, E., May 2017. Open Ocean Testing of the Azura Prototype
Wave Energy Converter in Hawaii, 2017 METS (Marine Energy Technology Symposium), Washington
DC.
Rajagopalan, K., Cross, P., Ling, B.., Lettenmaier, T., September 2019. AZURA WEC power performance
- a preliminary comparison of trial data and numerical modeling results, European Wave and Tidal Energy
Conference, Naples, Italy.
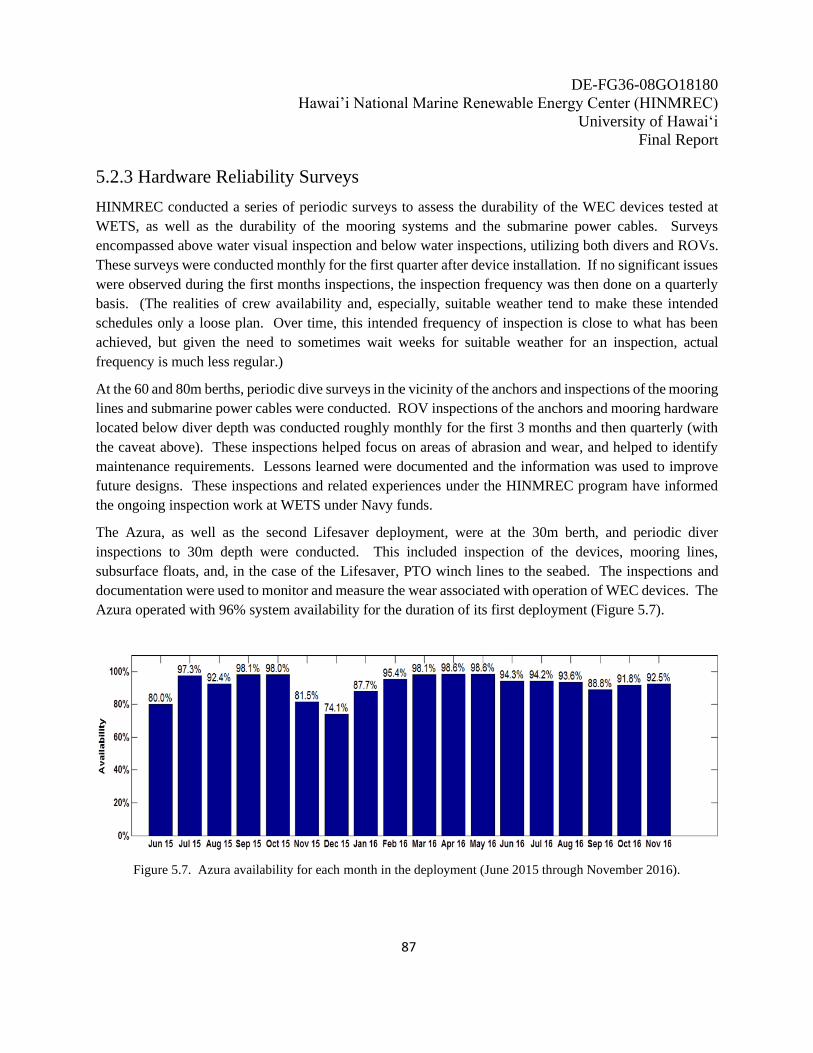
DE-FG36-08GO18180
Hawai’i National Marine Renewable Energy Center (HINMREC)
University of Hawai‘i
Final Report
87
5.2.3 Hardware Reliability Surveys
HINMREC conducted a series of periodic surveys to assess the durability of the WEC devices tested at
WETS, as well as the durability of the mooring systems and the submarine power cables. Surveys
encompassed above water visual inspection and below water inspections, utilizing both divers and ROVs.
These surveys were conducted monthly for the first quarter after device installation. If no significant issues
were observed during the first months inspections, the inspection frequency was then done on a quarterly
basis. (The realities of crew availability and, especially, suitable weather tend to make these intended
schedules only a loose plan. Over time, this intended frequency of inspection is close to what has been
achieved, but given the need to sometimes wait weeks for suitable weather for an inspection, actual
frequency is much less regular.)
At the 60 and 80m berths, periodic dive surveys in the vicinity of the anchors and inspections of the mooring
lines and submarine power cables were conducted. ROV inspections of the anchors and mooring hardware
located below diver depth was conducted roughly monthly for the first 3 months and then quarterly (with
the caveat above). These inspections helped focus on areas of abrasion and wear, and helped to identify
maintenance requirements. Lessons learned were documented and the information was used to improve
future designs. These inspections and related experiences under the HINMREC program have informed
the ongoing inspection work at WETS under Navy funds.
The Azura, as well as the second Lifesaver deployment, were at the 30m berth, and periodic diver
inspections to 30m depth were conducted. This included inspection of the devices, mooring lines,
subsurface floats, and, in the case of the Lifesaver, PTO winch lines to the seabed. The inspections and
documentation were used to monitor and measure the wear associated with operation of WEC devices. The
Azura operated with 96% system availability for the duration of its first deployment (Figure 5.7).
Figure 5.7. Azura availability for each month in the deployment (June 2015 through November 2016).

DE-FG36-08GO18180
Hawai’i National Marine Renewable Energy Center (HINMREC)
University of Hawai‘i
Final Report
88
Diver surveys were conducted during the modified Azura deployment, with the last survey shortly before
the device was recovered. The modified Azura functioned throughout the deployment with no need for
maintenance intervention. The device remained fully functional, and the moorings were sound throughout.
In the case of the Lifesaver device, which was initially deployed at the 60m berth, surveys included ROV
inspections below 30m depth in addition to diver inspections to 30m. Similar inspections were conducted
during the second Lifesaver deployment. Device reliability was excellent through the first 50 days, after
which a combination of PTO mooring (rock bolt) failures and PTO winch line failures began to occur,
although the device remained capable of providing sufficient power to the installed UW AMP/WiBotic
charging systems for approximately 3.5 months, until late January 2019.
Some of the lessons learned from the Hardware Reliability Surveys were incorporated into Task 6.2, which
entailed development of alternate mooring designs.
Reports and Publications
Sea Engineering, Inc. March 2017. Task 7E: WETS Deepwater Mooring Inspection Report.
Sea Engineering, Inc., June 2017. Annual Report of the Wave Energy Test Site (WETS) at MCBH,
Kaneohe 2016, (comprehensive report across several tasks).
TASK 6: SUPPORTING STUDIES
Under a contract modification in September 2012, supporting studies were implemented to expand and
continue certain work. The output from wave arrays (wave farms) was modeled and used to refine earlier
linear models used to estimate ocean area requirements and array overall capacity factor. A study was
conducted to determine the feasibility of an improved and cost effective alternative to the conservative
mooring design implemented at WETS. In addition, corrosion tests ongoing at the Heat Exchangers Test
Facility at NELHA were continued to augment the database and identify low-cost aluminum alloys for use
for WEC devices operating in the corrosive marine environment.
6.1 Operational Models for WEC Arrays
A WEC array model was required to evaluate combined output as a function of device spacing and
optimized ocean area requirements, and to investigate interaction effects in large arrays of WECs. This is
necessary for future commercial arrays as well as for the regulatory permitting process. Because WEC
types are very diverse, (e.g., in their dimensions and principles of operation), two different approaches were
followed to illustrate potential interferences among individual machines using robust analytical and
numerical tools.

DE-FG36-08GO18180
Hawai’i National Marine Renewable Energy Center (HINMREC)
University of Hawai‘i
Final Report
89
One study consisted of a theoretical determination of wave power extraction by arbitrary configurations of
non-diffracting oscillating water column (OWC) WECs. In the simplified framework where OWCs are
modeled as structureless pressure patches on the ocean surface, a mathematical solution for the overall
potential flow from any wave farm was derived. Air compressibility in the OWC air chamber was included
in the linearized equations. Wave spectral input typical of a particular site’s wave climate was used, in terms
of significant wave height and wave power. Switching from the linear frequency domain to the time domain,
turbine efficiency, which is a significant non-causal nonlinear effect, could be represented. Hence, both
pneumatic and mechanical turbine power could be evaluated. The algorithm was demonstrated for large
arrays in various rectangular and circular configurations for which the effect of WEC separation on overall
power output could be assessed at two typical sites in Hawaiian waters. Results indicate the need for
separation on the order of 3 to 5 OWC diameters, depending on array orientation, to limit interaction power
losses to about 10%. Results are detailed in a journal publication, “Wave power extraction by arbitrary
arrays of non-diffracting oscillating water columns” listed in the Reports and Publications below.
Another study considered very different WECs. The widely used potential flow software WAMIT™ was
set up to analyze the hydrodynamic response of multiple slender articulated rafts consisting of floating
cylindrical hinged segments. These machines were modeled to represent the well-known Pelamis® P1-750
WEC developed in Scotland, although the PTO adopted here was simply linear. The provision for hinge
modes of motion already exists in WAMIT™ and proved quite useful. It was extended to the case of multiple
hinged bodies. The PTO acts on relative rotational motions at the hinges, while external damping in the
software is allowed in the form of resistive vertical forces only. Hence, the establishment of a dynamic
equivalence between the two representations was necessary. The linear analysis of the machines’ PTO
mechanism also required an interpretation of output once rated power (dictated by the choice of an electrical
generator) was achieved in given sea conditions. Ultimately, the industrial developer’s recommendation to
separate rows of such machines by half a length (75 m) and set the WECs a length apart (150 m) in any
given row could be evaluated. Configurations were identified where more power could be produced than
with the recommended spacing. These covered a significantly greater area, however, for power gains
deemed marginal. Results are detailed in a document written by M. Frederick in partial fulfillment of the
requirements for the M.S. degree in the Department of Ocean Resources Engineering at UH.
The outcome of Task 6.1 demonstrates that robust and generally available methods with modest
computational needs may allow the estimation of WEC array performance. They also highlight the need to
cast the issue of WEC interference in a greater context, since power output gains achieved at the expense
of greater wave farm footprints are inherently problematic. From an infrastructural viewpoint, the costs of
spreading WECs in space may be significant due to additional anchoring and power transmission
constraints. Moreover, complex and potentially contentious permitting issues are likely to be exacerbated
with larger wave farm footprints.

DE-FG36-08GO18180
Hawai’i National Marine Renewable Energy Center (HINMREC)
University of Hawai‘i
Final Report
90
Reports and Publications
Journal Publications
Nihous, G.C., September 2012, Wave power extraction by arbitrary arrays of non-diffracting oscillating
water columns, Ocean Engineering 51, 94–105, doi.org/10.1016/j.oceaneng.2012.05.016.v
Master’s Thesis
M. Frederick, April 2014, Hydrodynamic Modeling of Pelamis® P1-750 Wave Energy Converters using
WAMIT™ software, (a plan B paper submitted in partial fulfillment of the requirements for the degree of)
Master of Science in Ocean and Resources Engineering, University of Hawaii.
6.2 Alternate Mooring Designs
This task arose from results of at-sea tests of WEC devices at WETS. Under a contract modification in
September 2012, supporting studies were implemented to expand and continue certain work, including a
mooring design study. This study determined the feasibility of an improved and cost effective alternative
design to the original mooring design used at WETS. The performance of the mooring systems for the
three berths was first assessed, using information gathered under Tasks 4.4 and 5.2.3. The mooring designs
were evaluated and modifications identified that led to less expensive, more effective designs for future
use. Significant design and operational lessons were learned, and are summarized below.
By 2018, every mooring system used at WETS had required adjustments after initial installation, or failed
completely. Ultimately, after failures on two legs of the 80m berth, in which chain joining links had failed
in the dynamic zone of the catenary systems (where the chain interacts with the seabed), NAVFAC charged
HNEI with redesigning and reinstalling significant portions of these systems. The 60m and 80m berths
were redesigned, with the help of critical numerical design work by DNV GL. While this work was Navy-
funded, it stemmed directly from insights gained during the years of monitoring and studying designs under
HINMREC auspices. In May and June 2019, repairs were conducted on the 60m berth, including a pull-
test and installation of a pretensioning “no-WEC hawser” system, in preparation for the anticipated
deployment of the Ocean Energy OE35 WEC (which was subsequently delayed until likely the spring of
2021). Repairs at the 80m berth are planned for spring 2021, in advance of planned deployments at that
berth.
The details of the mooring redesign can be found in reports done for the Navy by HNEI. These have been
provided to DOE and can be made available to others upon request. In summary, the redesign included an
increase of chain size in the chain risers (from the seabed to the surface floats) from 2-¾” to 4” chain,
removal of 3 of the 5 sinker weights from each mooring leg (several of these had been destroyed by chain
action during untensioned (no WEC) conditions), removal of “Kenter joining links” (not suitable for
dynamic offshore applications), replacement of Kenters with heavy D-shackles, and replacement of surface
floats with strengthened and fatigue-engineered strength members. Finally, the new mooring design
includes the no-WEC hawser system mentioned above, keeping the mooring in a prescribed level of tension

DE-FG36-08GO18180
Hawai’i National Marine Renewable Energy Center (HINMREC)
University of Hawai‘i
Final Report
91
when a WEC is not installed. The lack of such a system in the initial design done for the Navy (by an
outside contractor, prior to HINMREC’s involvement) was determined to be a major factor in the ultimate
failure of the two mooring legs at 80m, and eventually of one of the mooring legs at 60m (which occurred
shortly before the repair was conducted).
It is highly recommended that the mooring systems proposed by all future tenants be evaluated by a third
party. Under the HINMREC program, third party services were secured from DNV GL to evaluate the
design of the 60m and 80m berths. This involvement led, in turn, to DNV GL being included in the design
team for the mooring repairs completed at the 60m and 80m berths.
The primary mooring work was completed between 10 and 15 May 2015, with the mooring itself installed,
on each of three mooring legs, including new surface floats and chain down to a point on the seabed where
the new chain was connected to the existing ground chain. The revised design uses a larger diameter chain
to address fatigue issues, as well as the no-WEC hawser system to keep the mooring in tension and reduce
fatigue and wear. Following weather interruptions, a pull test to 100T was executed on 8 June, and the no-
WEC hawser system was installed on 22 June. A similar effort will be conducted at the 80m berth in 2021
under Navy funding.
Some Related Lessons Learned for WEC Deployment Planning at WETS, or Elsewhere
Important design and operational lessons learned that are applicable elsewhere can be summarized as
follows:
⮚ Design of WEC systems and moorings should consider the capabilities of vessels of opportunity
available at the deployment site.
o As a budding industry, current and proposed future WEC sites in the U.S. are not
necessarily situated in areas where offshore services are readily available. Therefore, there
may be limitations on heavy lift, dynamic positioning, and heave compensated lift vessels.
While these types of equipment can be mobilized to a site from afar, the mobilization costs
are generally prohibitive and detrimental to a project.
o WEC device developers should work with local marine contractors to determine the types
of offshore capabilities that are available readily and consistently. Whenever possible,
developers should integrate local marine resources into the design process at an early stage.
This step will reduce future installation and maintenance costs for the device while it is in
place.
⮚ Access points and ease of maintenance and servicing of WEC devices are important design
considerations.
o WEC device developers face a tradeoff between making WEC devices easy to access and
service for marine contractors, and preventing unwanted trespassing by the public. In
Hawaii, WETS is located in a controlled area of MCBH waters and, therefore, has not

DE-FG36-08GO18180
Hawai’i National Marine Renewable Energy Center (HINMREC)
University of Hawai‘i
Final Report
92
experienced trespassing or vandalism to devices or components. It is critically important
for safety and ease of maintenance that boarding and access for vessels and crew is taken
into consideration during design of the system.
o When concerns of vandalism and trespassing are great, design consideration should be
given to integrating temporary boarding solutions that can be brought out and installed
during periods of servicing.
⮚ Mooring systems should be an integral part of overall WEC device design.
o A WEC device will only be as successful as its mooring system. WEC device designs
vary, and associated mooring tension and slack also vary according to what the developers
need to maximize performance of their device. Improper selection of mooring
components, or application of components, can lead to unforeseen failures, downtime and
repairs not directly associated with the device.
o A successful mooring design system will lead to less downtime of the device and greater
energy production.
⮚ Under Navy funds, ARL-UH has conducted extensive mooring analysis associated with both the
deep berth mooring repairs and the mooring of Lifesaver at the 30m berth. This mooring analysis
capability, begun under HINMREC funding, has become a key aspect of support to the Navy and
to the developers deploying at WETS, whether Navy or DOE funded. Primarily, ANSYS AQWA
hydrodynamics simulation and diffraction software is used for this analysis.
o A substantial body of knowledge has been built up by HINMREC during this process. The
deep berth moorings at WETS have been substantially redesigned, primarily in
collaboration with DNV GL, as a subcontractor to design lead Sound and Sea Technology.
The new mooring design, taking both strength and fatigue into consideration, is detailed in
reporting to Navy, and can be shared with DOE, and potential WEC developers deploying
at WETS, on request. It is deemed absolutely essential that very careful mooring analysis
be a part of any WEC deployment, and third-party mooring analysis should be a key
component of DOE approvals of WEC deployments at the new PacWave test site in
Oregon, or at WETS.
Reports and Publications
Technical Reports
DNVGL, Noble Denton Marine Services, September 2017. Evaluation of WETS Mooring; Failure Mode
Investigation Report, prepared for Sea Engineering Inc.
Conference Presentations
Rajagopalan, K., Cross, P., Vega, L., April 2018. Numerical modeling of the lifesaver mooring system for
deployment at WETS, METS (Marine Energy Technology Symposium), Washington DC.

DE-FG36-08GO18180
Hawai’i National Marine Renewable Energy Center (HINMREC)
University of Hawai‘i
Final Report
93
6.3 Aluminum Corrosion and Biocorrosion Studies
Corrosion studies began with investigation of aluminum corrosion in the splash-spray zone, surface waters,
and deep ocean water for OTEC and WETS device applications. Components were identified and standard
sample coupons with and without coatings were tested. The exposed samples were analyzed in the Hawaii
Corrosion Laboratory (HCL) at UH to determine corrosion mechanisms. A novel corrosion-resistant
ceramic-polymer hybrid coating developed at HCL was examined. In addition, corrosion at the field sites
was investigated with a portable exposure corrosion rack mounted on the Army Logistic Support Vessel in
Pearl Harbor.
Biofouling and biocorrosion studies of sample coupons – on actual wave power devices and OTEC
components – was conducted using molecular methods to identify the composition of fouling communities.
Innovative marine coatings, containing natural compounds extracted from algae and sponges and
conductive polymers, were tested in the laboratory to determine if they are effective in providing protection
from biocorrosion to ferrous and non-ferrous metals. Al-6061 and Al-5083 coupons were treated with
different anti-fouling coatings, and subsequently immersion tested at the Makai Research Pier on the
windward side of Oahu.
Aluminum corrosion and biocorrosion testing was also conducted at the OTEC Heat Exchangers (HXs)
Test Facility, located at the Natural Energy Laboratory of Hawaii Authority (NELHA), in Kona on Hawaii
Island. In 2012, corrosion work at HCL and Makai Pier were discontinued due to NEPA Compliance issues,
and results incorporated into NELHA efforts.
HINMREC contracted with Makai Ocean Engineering to develop a corrosion test method to measure the
primary corrosion mechanisms of concern - surface pitting and crevice corrosion. The overall objective
was to develop a method of measuring the growth rates of corrosion pits in aluminum for the purpose of
determining the operating life of an OTEC heat exchanger. Testing and development were conducted at
Makai’s corrosion and heat exchanger test facility at NELHA.
Makai developed a system to observe pit growth in-situ using optical imaging and ultrasonic thickness
measurements, which allow corrosion development to be monitored over time without the removal and
destruction of samples. Three aluminum alloys were chosen for testing (Al 2024, Al 6061-T651 and Al
5086-H116) in flowing (1 m/s) and near-stagnant cold, deep seawater (6 samples total). In all corroding
samples, the ultrasonic scans revealed crevice corrosion progressing underneath the gasket interface. The
largest amount of gasket corrosion occurred in the near-stagnant water conditions. Maximum pit depths of
0.8 mm underneath the gasket and lateral penetrations of 6 mm from the inside edge of the gasket have
been observed. For Al 5086 and Al 6061, a significant change in open circuit potential (measured against
an Ag/AgCl reference electrode) was observed at the onset of corrosion. Implications of aluminum
corrosion on OTEC heat exchangers and techniques to implement corrosion monitoring in an OTEC plant
are discussed in the final report (“Makai Engineering, January 2015. OTEC Heat Exchanger Program:
Ultrasonic Scanning for Corrosion Monitoring, Final Report.” listed in Reports and Publications below).

DE-FG36-08GO18180
Hawai’i National Marine Renewable Energy Center (HINMREC)
University of Hawai‘i
Final Report
94
Based on this long-term aluminum corrosion and biocorrosion testing on OTEC components, it was
determined that certain cost effective alloys can be used in OTEC heat exchangers:
● Evaporators: Alloys 3003; 5052; and, 6063-T5 can achieve projected life expectancy of 30-
years
● Condensers: Alloys 3003 and 5052 can achieve projected life expectancy of 30-years but
6063-T5 did not qualify
The OTEC HX Test Facility continues to be maintained operational by Makai Ocean Engineering under
ONR contracts from HNEI.
Reports and Publications
Technical Reports
Hihara, L.H., Kusada, K., September 2011. Corrosion of Bare and Coated Al 5052-H3 and Al 6061-T6 in
Seawater, Progress Report.
Makai Engineering, May 2012. Aluminum Pitting Corrosion Measurement Methods, Progress Report #1.
Makai Engineering, July 2012. OTEC Heat Exchanger Program: Progress Report #2.
Makai Engineering, June 2013. OTEC Heat Exchanger Program: Progress Report #3, (corrosion
apparatus).
Makai Engineering, August 2013. OTEC Heat Exchanger Program: Progress Report #4 (test procedure).
Makai Engineering, September 2013. OTEC Heat Exchanger Program: Progress Report #4, (MA140003).
Makai Engineering, October 2013. OTEC Heat Exchanger Program: Progress Report #5.
Makai Engineering, October 2013. OTEC Heat Exchanger Program: Annual Report (photographic
imaging, ultrasonic inspection, and laser profilometry).
Makai Engineering, May 2014. OTEC Heat Exchanger Program: Ultrasonic Scanning for Corrosion
Monitoring, Task 4, Status Report #1.
Makai Engineering, September 2014. OTEC Heat Exchanger Program: Ultrasonic Scanning for Corrosion
Monitoring, Status Report #4, (MA140003).
Makai Engineering, January 2015. OTEC Heat Exchanger Program: Ultrasonic Scanning for Corrosion
Monitoring, Final Report.
Makai Engineering, February 2015. OTEC Heat Exchanger Program: Ultrasonic Scanning for Corrosion
Monitoring, Final Report, (MA140003).
Makai Engineering, April 2015. Task 2, OTEC Heat Exchanger Program: Ultrasonic Scanning for
Corrosion Monitoring, Rack Construction and Status, (Subaward MA1500177).

DE-FG36-08GO18180
Hawai’i National Marine Renewable Energy Center (HINMREC)
University of Hawai‘i
Final Report
95
Makai Engineering, November 2015. OTEC Heat Exchanger Program: Ultrasonic Scanning for Corrosion
Monitoring; Shakedown Test, (Revised).
Makai Engineering, January 2016. OTEC Heat Exchanger Program: Ultrasonic Scanning for Corrosion
Monitoring; Status Report #1, (MA150017).
Makai Engineering, March 2016. OTEC Heat Exchanger Program: Ultrasonic Scanning for Corrosion
Monitoring; Status Report #2, (MA150017).
Makai Engineering, August 2016. Task 6, OTEC Heat Exchanger Program: Ultrasonic Scanning for
Corrosion Monitoring; Status Report #3, (MA150017).
Makai Engineering, August 2016. OTEC Heat Exchanger Program: Ultrasonic Scanning for Corrosion
Monitoring, Final Report, (MA150017).
L.H. Hihara, and K. Kusada, September 2017. Corrosion of Bare and Coated Al 5052-H3 and Al 6061-T6
in Seawater.