Embed Size (px)
Citation preview
Final Technical Report for Phase I Award DE-SC0003559 Award Recipient: Springboard Engineering
Project Title: Springboard Engineering's Smart Grid Controller for Non-Smart Household Electricity-
Consuming Appliances
Project Director: Mr. Lee Glenn
Principal Investigator: Mr. Jeff Blair
The Smart Grid opens the door to the development of many companion technologies which will in turn
enable the development of a variety of devices for household electricity-consuming appliances that can
communicate with it; especially, many major appliance manufacturers (such as Whirlpool and General
Electric) have made public commitments to design their appliances to be Smart Grid-compatible over the
next several years. Yet during that same time period, customers will purchase many millions of long-
lasting appliances which are not compatible with the Smart Grid.
This research project‟s purpose is to bring significant Smart Grid compatibility to previously-installed
appliances that were not specifically designed for any Smart Grid communications, in a way that is both
economical and attractive for users who want to share in the energy cost savings and reduction of peak
power demand opportunities provided by the evolving Smart Grid infrastructure. The focus of this effort
is to identify and research smart control solutions which take advantage of the effective strategies of
demand-response (DR) communications from utilities [including time-of-day (TOD) and peak-demand
pricing options] and function apart from any need for operational changes to be designed into the non-
smart appliances.
Our Phase I concepts promote technological advancements for enabling devices that shift the available-
use time of millions of different appliances which otherwise have no Smart Grid capability. We
researched low-cost microcontroller-based ways of creating devices with the ability to:
o maintain an accurate time and day (with no need for battery backup throughout a power outage)
o perform two-way wired and wireless communications directly with the utility company‟s demand
management signals, to identify both low-cost time periods as well as critical-reduction periods
when the cost of energy use would otherwise be much higher
o measure the power usage of the connected non-smart appliance
o remove power for a period of time from the appliance (such as a dehumidifier, portable heater, or
pool pump) in response to both time-pricing schedule and critical peak-load information from the
utility, or inform the user of a batch-type appliance (such as a clothes dryer or dishwasher)
regarding the current cost associated with using the appliance
The new products that could be developed as a result of this research into new consumer-centric features
and characteristics includes smart wall outlets, smart outlet power-monitoring adapters, smart load
switches and smart remote electric rate indicators associated with the non-smart appliances.
Our Phase I goal of determining the feasibility of the above technologies was successful. The objectives
were also met of developing concepts for a family of microprocessor-based control/indicator devices that
can provide the above capabilities while connected in series between an appliance and its electrical power
source and/or while indicating cost-of-use status to the appliance user.
Key Words - Smart Grid; appliances; smart controls; demand response; peak demand

Background
In our Phase 1 proposal, “Smart Controllers for Non-smart Appliances”, we presented a number
of diverse technical questions centered on researching the capabilities and interface possibilities
of chipsets suitable for smart device controllers for home electrical appliances, and we address
these in this Phase 1 summary of our DOE-sponsored SBIR grant project activities. Specifically,
the following questions were posed for Phase 1:
1) Are the newest low-cost, low-power microcontroller chipsets with open-standard
wireless communication features capable of supporting the bi-directional
wireless communications required by the proposed wireless Smart Grid signals
from AMIs and other sources?
2) Can the wireless chipset also support the receipt of one-way time/date RF signals
broadcast from the NIST signal source (based in Colorado) for accurate,
battery-free timekeeping?
3) Can the chipset work together with a companion chip which supports open-
standard wired AC power line broadcast signals so that both wired and wireless
communication modes are supported by the same chipset?
4) Can the resulting chipset also support the smart controller function of
monitoring the electric power consumed by an attached household appliance?
5) Does the chipset also have the ability to control the smart controller function of
load-disable switching for household appliance loads?
6) Will the chipset also have sufficient embedded nonvolatile memory support
needed to ensure secure data communication keys and embedded security
features?
1 Task 1 - Wireless Communications
1.1 Phase 1 Plan
Our Task 1 drivers were, as stated in our Phase 1 proposal‟s project narrative:
“Separately investigate and evaluate two microprocessor-based with integrated wireless support
chipsets, the Texas Instruments CC2530 and Freescale MC13213, each as the potential basis for
a secure smart controller chipset that would be adaptable enough to support the development of
various smart controller devices capable of being coupled with already-installed non-smart
household appliances and effectively joining them to the Smart Grid.”
“This requires evaluating each chipset‟s native wireless communications capability between
expected appliance locations (including basements) and expected AMI broadcast locations
(including in-house and outside locations).”
“… we intend to investigate in Phase 1 if the chipset can detect and respond to wireless load
curtailment and pricing information signals broadcast from the following sources:
• An on-premise smart meter installed by the local electric utility
• Another in-home smart appliance device”
“Both the TI CC2530 and Freescale MC13213 chipsets have an integrated 802.15.4 compliant
RF transceiver which should support the main developing open communication standards being
championed by many of the appliance manufacturers and other members of the wireless energy
standards-making groups.”
“The ability of these devices to communicate wirelessly point-to-point to each other through
multiple walls/floors and over distances representative of the barriers between an outdoor electric
utility meter at one end of a large home and an appliance located in the basement at the other end
will be evaluated.”
1.2 Test Setup Overview
Testing was performed in two locations: 1) in and around Springboard Engineering‟s
headquarters in Newton, Iowa, and 2) in and around a typical private residence in Ames, Iowa.
The Springboard Engineering (SBE) site was chosen as an example of a small
commercial/industrial location. About 33% of the one-story building‟s 40,000 square feet is
open office area that includes cubicles, meeting rooms and break areas. The rest is made up of
test labs, machining and molding operations. The areas are divided by wood framed, drywalled
walls with a drop ceiling throughout. The outer walls are painted metal, and it has a flat, metal
roof. Besides the typical EMI (electromagnetic interference) sources of a mixed-use commercial
facility, the location has a Wi-Fi LAN and cell phone repeater operating.

The private residence in Ames was chosen as an example of a typical large, ranch-style home.
The structure is stick-built with a poured concrete basement. It has an “H”-shaped footprint with
1700 sq. ft. on both the main floor and basement levels. The siding is no-maintenance and non-
metallic, and the house has an asphalt shingled roof. The exterior walls are of typical
construction for the upper Midwest, including fiber-glass insulation, particle board and barrier
materials containing some metallic components. The structure was completed in 1999 and
contains a typical set of appliances. There is an active Wi-Fi LAN and 2.4 GHz cordless phone
system present.
The testing required two nodes of each manufacturer‟s evaluation kit (Freescale‟s MC13213 kit
and Texas Instrument‟s CC2530 kit), referred to within this document as the “Base” and
“Remote” nodes. The two nodes sent and received a series of messages and recorded signal
levels and the number of good messages received. The tests were performed with the nodes
separated by varying distances, adjusted for relative antenna orientation, and with barriers of
different materials placed between them.
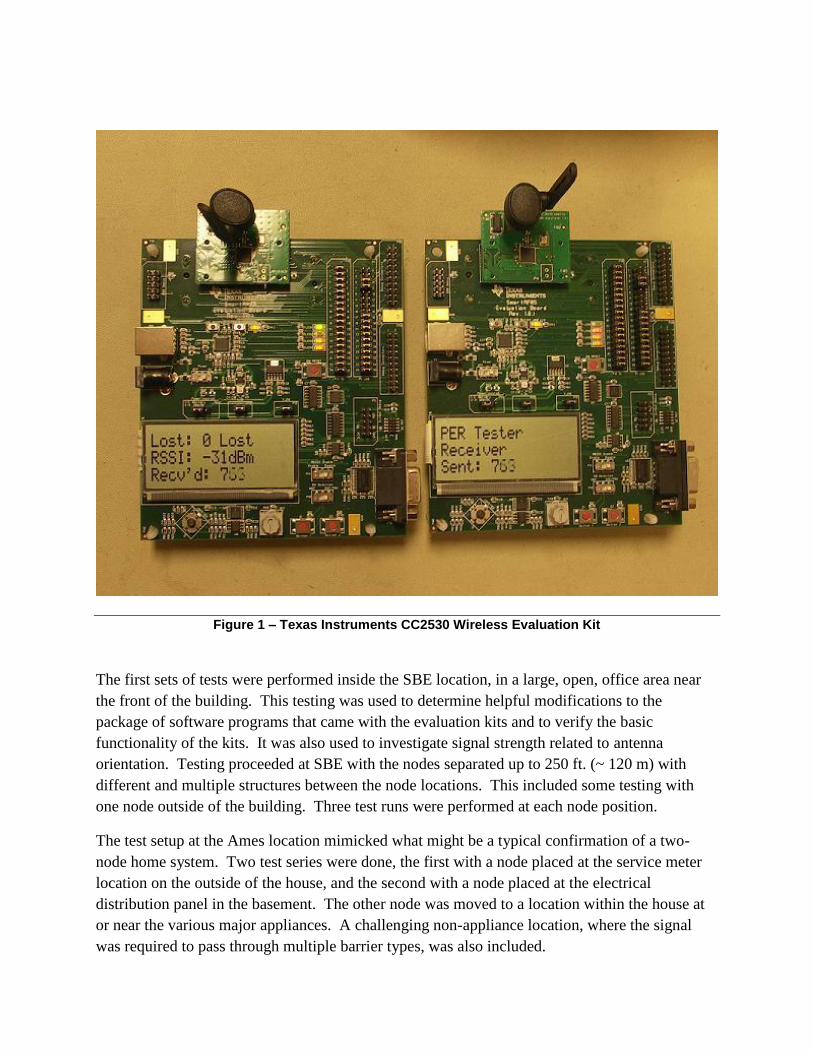
Figure 1 – Texas Instruments CC2530 Wireless Evaluation Kit
The first sets of tests were performed inside the SBE location, in a large, open, office area near
the front of the building. This testing was used to determine helpful modifications to the
package of software programs that came with the evaluation kits and to verify the basic
functionality of the kits. It was also used to investigate signal strength related to antenna
orientation. Testing proceeded at SBE with the nodes separated up to 250 ft. (~ 120 m) with
different and multiple structures between the node locations. This included some testing with
one node outside of the building. Three test runs were performed at each node position.
The test setup at the Ames location mimicked what might be a typical confirmation of a two-
node home system. Two test series were done, the first with a node placed at the service meter
location on the outside of the house, and the second with a node placed at the electrical
distribution panel in the basement. The other node was moved to a location within the house at
or near the various major appliances. A challenging non-appliance location, where the signal
was required to pass through multiple barrier types, was also included.
All testing at both locations was done with the nodes programmed to transmit at the 1 mW level
on 2.405 GHz. Base nodes transmitted 160 messages and waited for a reply from the Remote or
a time-out before sending the next series. Messages received by the Base before the time-out
and with the correct message number were counted as “good” messages and the rest counted as
“bad.” The major physical difference between the two manufacturer‟s kits was the antenna
configuration. The Freescale kit uses an F-antenna integrated into the PCB trace layout, and the
TI kit uses an external antenna connected to the board via coaxial connector. Both kits were
running their native RF and communications stack.
1.3 Testing Results
Comparing the two kits, the TI kit showed higher signal strength when inside the SBE building,
while the Freescale kit showed higher signal strength at the Ames location. The combination of
the SBE metal structure and the more omni-directional nature of the TI antenna is the suspected
reason for the stronger signals within the SBE structure, due to more reflected energy coupling
with the direct signals. Even though this could indicate a performance difference between the
two kits, it was found that if the signal level was above -94 dBm, there was successful
communication with both kits, and the dropped-packets-to-signal-level ratio was the same for
both kits. This would indicate the signal strength as the major factor in successful
communications (rather than which kit was used), and the signal strength can be affected greatly
by the surrounding structure. Since this testing was not meant to be a comparative performance
test of two manufacturers‟ kit configurations, only the data for the TI kit is shown below as
representative of the effect that the structure and distances had on signal levels.
1.3.1 Effects of the Structures
The effect of structure can be seen in the signal level versus distance chart for the TI kit below.
The dashed line represents the theoretical drop off of the signal for the test done in Ames with
the Base placed at the power meter. The solid blue line is the measured data. This case is the
closest of the three to a line-of-sight, no-obstruction condition. The two nodes are at roughly the
same height and there are minimal conductive obstructions in the area. The green line shows
what happened when the Base node was moved to the distribution panel in the basement. The
SBE plot (purple line) shows significant signal coupling where the level is higher at greater
distances. The overall levels are also higher than expected for the distances.
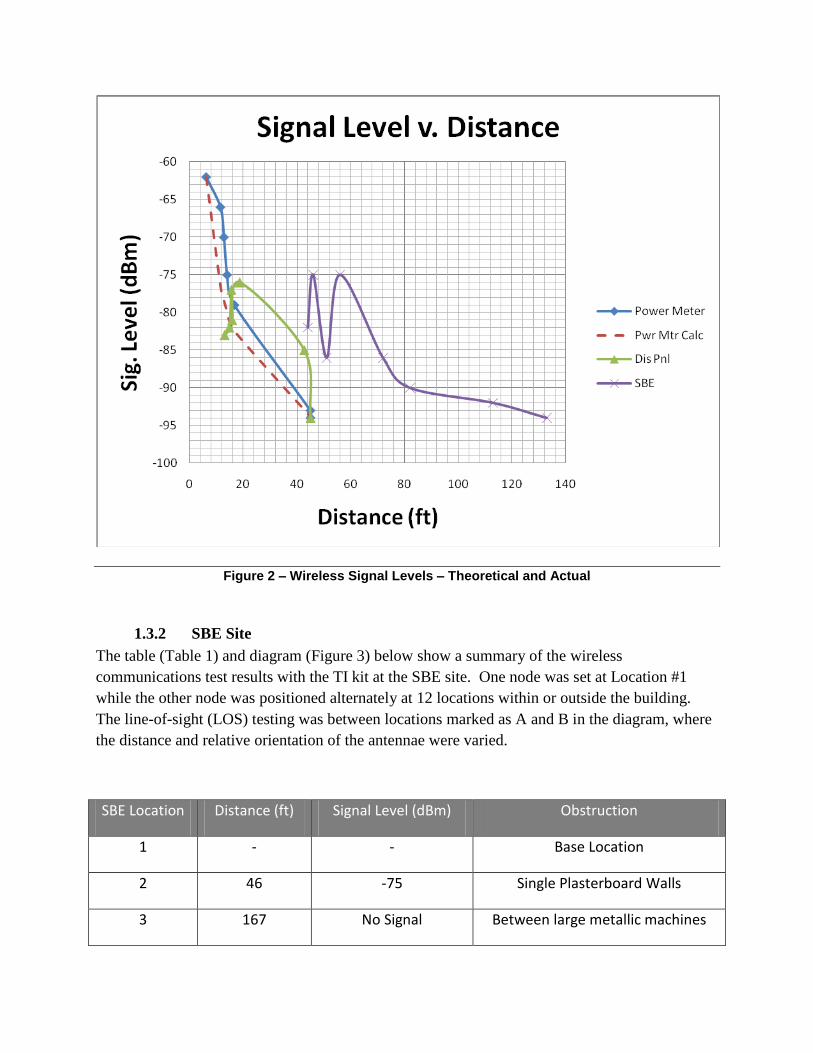
Figure 2 – Wireless Signal Levels – Theoretical and Actual
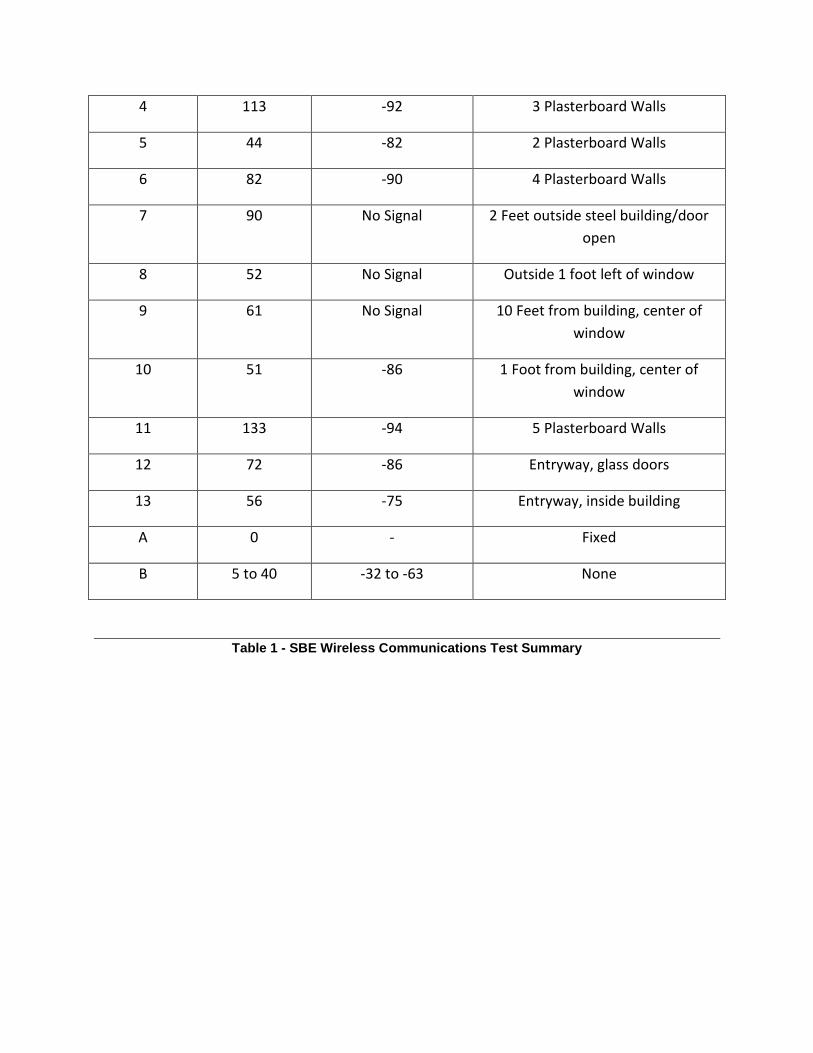
1.3.2 SBE Site
The table (Table 1) and diagram (Figure 3) below show a summary of the wireless
communications test results with the TI kit at the SBE site. One node was set at Location #1
while the other node was positioned alternately at 12 locations within or outside the building.
The line-of-sight (LOS) testing was between locations marked as A and B in the diagram, where
the distance and relative orientation of the antennae were varied.
SBE Location Distance (ft) Signal Level (dBm) Obstruction
1 - - Base Location
2 46 -75 Single Plasterboard Walls
3 167 No Signal Between large metallic machines
4 113 -92 3 Plasterboard Walls
5 44 -82 2 Plasterboard Walls
6 82 -90 4 Plasterboard Walls
7 90 No Signal 2 Feet outside steel building/door
open
8 52 No Signal Outside 1 foot left of window
9 61 No Signal 10 Feet from building, center of
window
10 51 -86 1 Foot from building, center of
window
11 133 -94 5 Plasterboard Walls
12 72 -86 Entryway, glass doors
13 56 -75 Entryway, inside building
A 0 - Fixed
B 5 to 40 -32 to -63 None
Table 1 - SBE Wireless Communications Test Summary
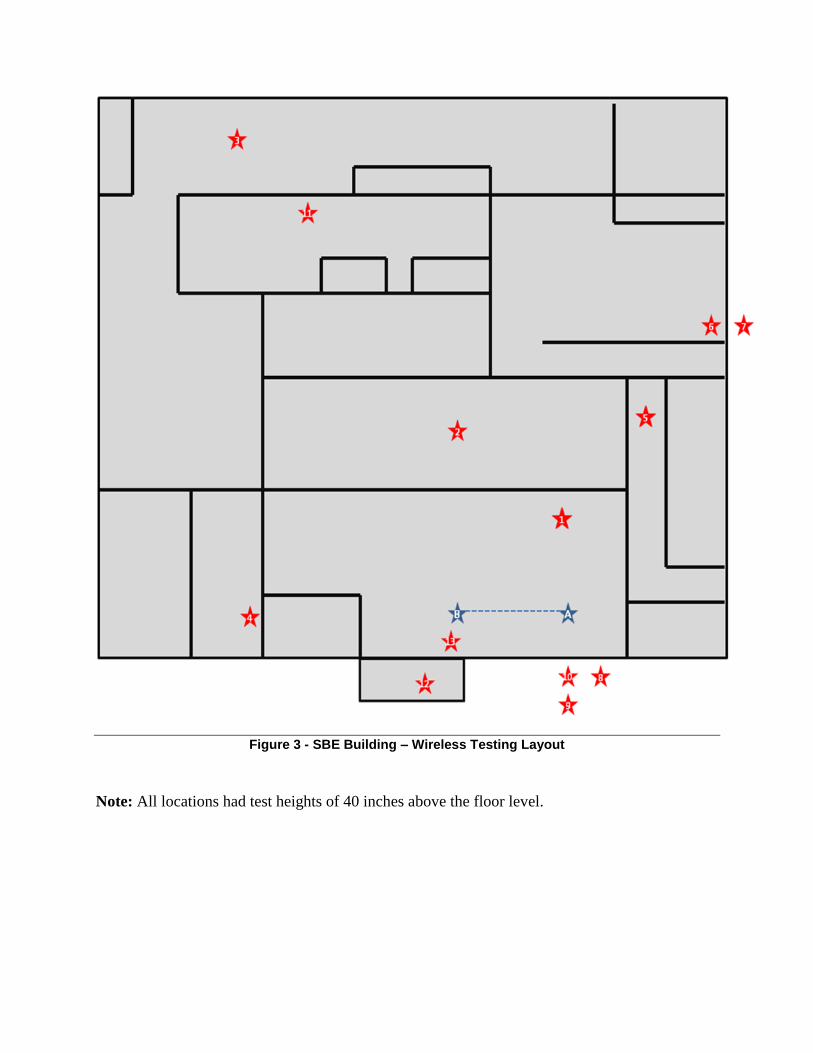
Figure 3 - SBE Building – Wireless Testing Layout
Note: All locations had test heights of 40 inches above the floor level.
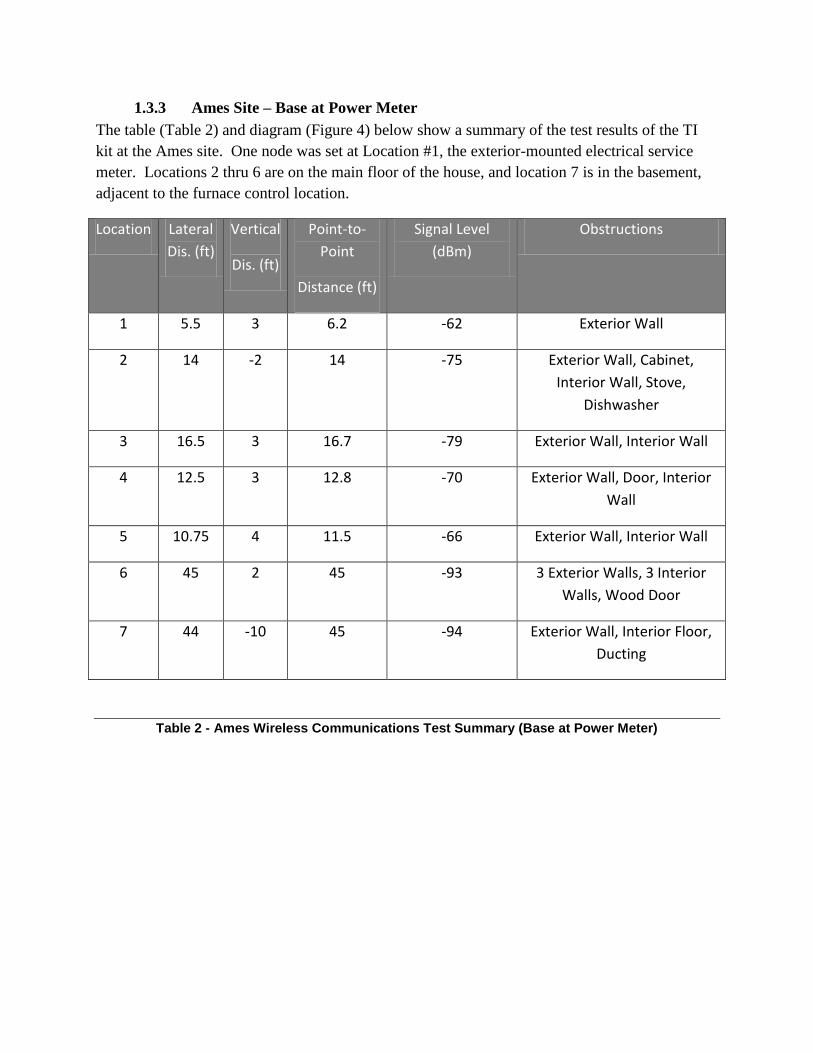
1.3.3 Ames Site – Base at Power Meter
The table (Table 2) and diagram (Figure 4) below show a summary of the test results of the TI
kit at the Ames site. One node was set at Location #1, the exterior-mounted electrical service
meter. Locations 2 thru 6 are on the main floor of the house, and location 7 is in the basement,
adjacent to the furnace control location.
Location Lateral
Dis. (ft)
Vertical
Dis. (ft)
Point-to-
Point
Distance (ft)
Signal Level
(dBm)
Obstructions
1 5.5 3 6.2 -62 Exterior Wall
2 14 -2 14 -75 Exterior Wall, Cabinet,
Interior Wall, Stove,
Dishwasher
3 16.5 3 16.7 -79 Exterior Wall, Interior Wall
4 12.5 3 12.8 -70 Exterior Wall, Door, Interior
Wall
5 10.75 4 11.5 -66 Exterior Wall, Interior Wall
6 45 2 45 -93 3 Exterior Walls, 3 Interior
Walls, Wood Door
7 44 -10 45 -94 Exterior Wall, Interior Floor,
Ducting
Table 2 - Ames Wireless Communications Test Summary (Base at Power Meter)
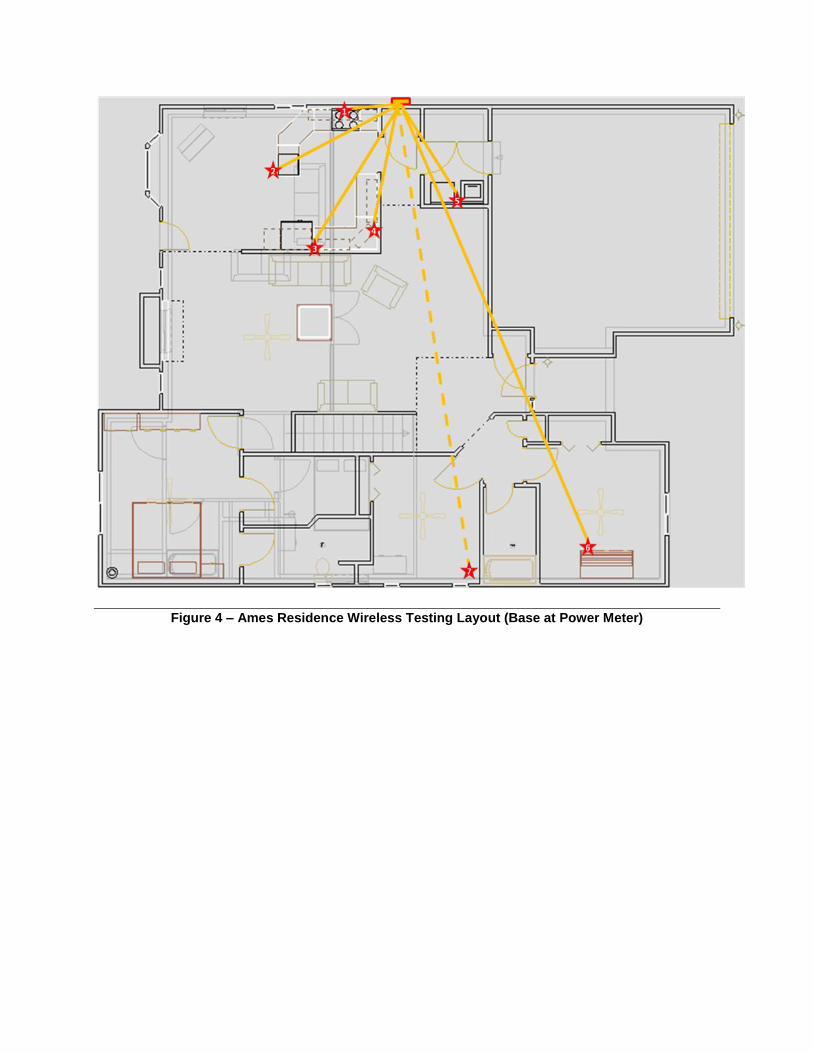
Figure 4 – Ames Residence Wireless Testing Layout (Base at Power Meter)
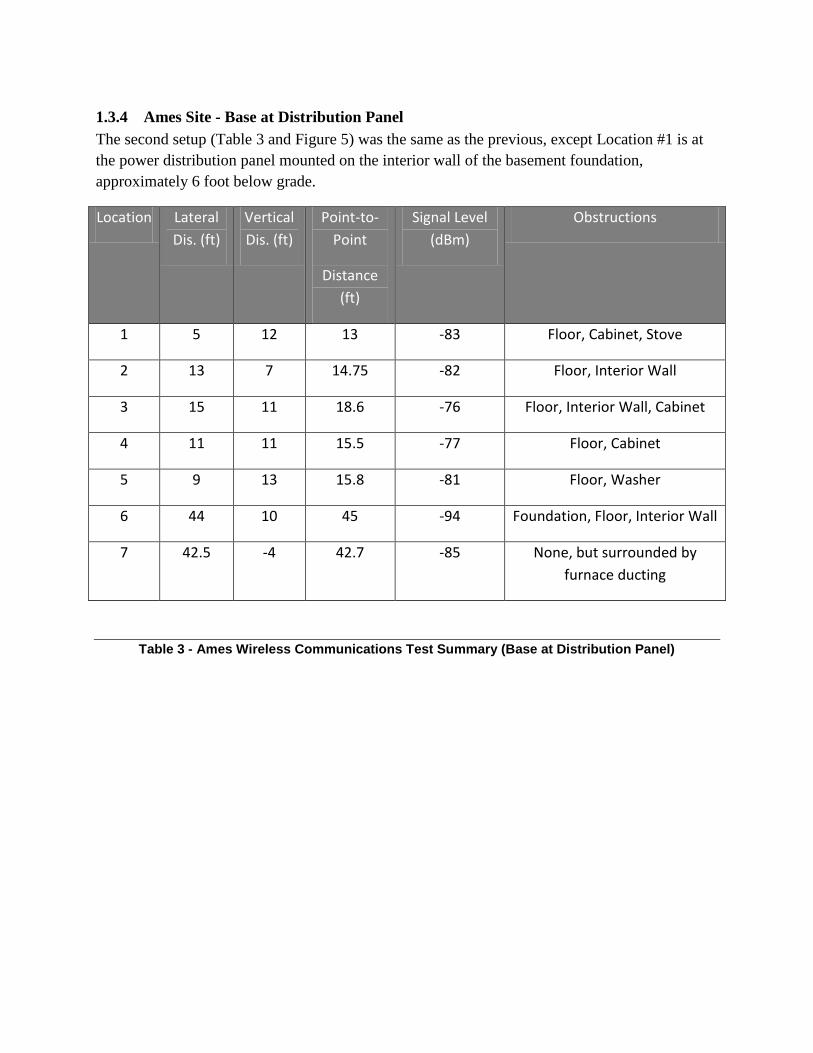
1.3.4 Ames Site - Base at Distribution Panel
The second setup (Table 3 and Figure 5) was the same as the previous, except Location #1 is at
the power distribution panel mounted on the interior wall of the basement foundation,
approximately 6 foot below grade.
Location Lateral
Dis. (ft)
Vertical
Dis. (ft)
Point-to-
Point
Distance
(ft)
Signal Level
(dBm)
Obstructions
1 5 12 13 -83 Floor, Cabinet, Stove
2 13 7 14.75 -82 Floor, Interior Wall
3 15 11 18.6 -76 Floor, Interior Wall, Cabinet
4 11 11 15.5 -77 Floor, Cabinet
5 9 13 15.8 -81 Floor, Washer
6 44 10 45 -94 Foundation, Floor, Interior Wall
7 42.5 -4 42.7 -85 None, but surrounded by
furnace ducting
Table 3 - Ames Wireless Communications Test Summary (Base at Distribution Panel)
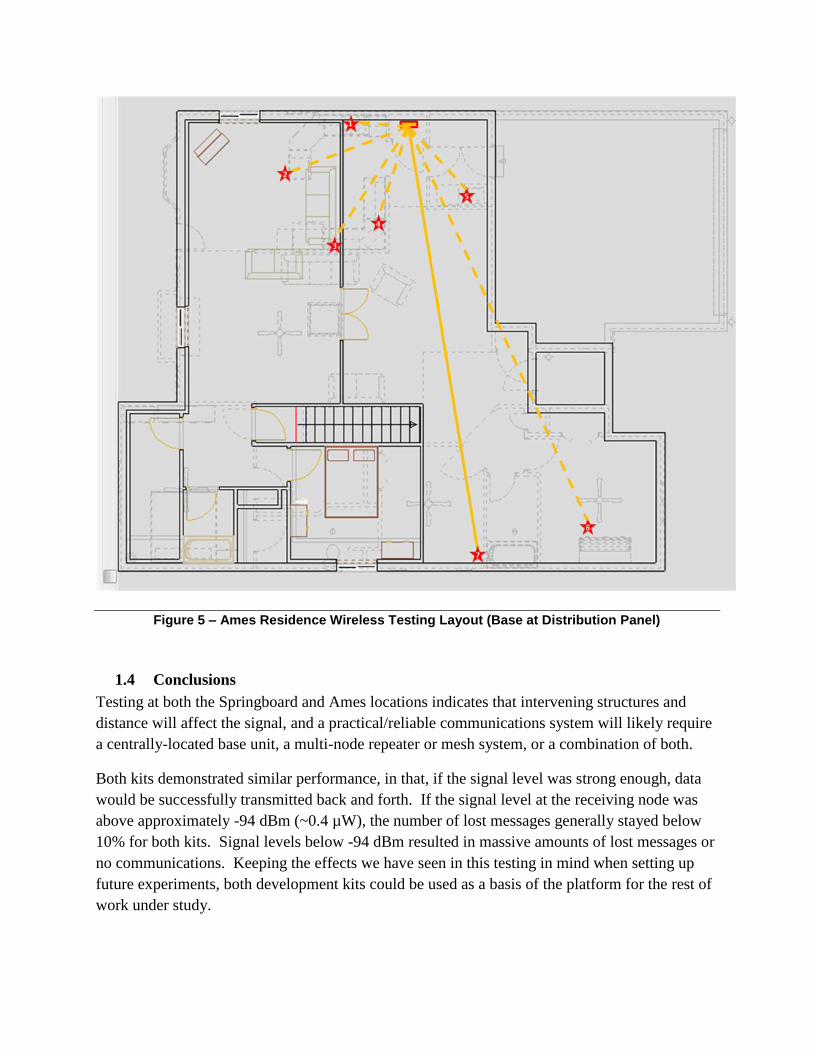
Figure 5 – Ames Residence Wireless Testing Layout (Base at Distribution Panel)
1.4 Conclusions
Testing at both the Springboard and Ames locations indicates that intervening structures and
distance will affect the signal, and a practical/reliable communications system will likely require
a centrally-located base unit, a multi-node repeater or mesh system, or a combination of both.
Both kits demonstrated similar performance, in that, if the signal level was strong enough, data
would be successfully transmitted back and forth. If the signal level at the receiving node was
above approximately -94 dBm (~0.4 µW), the number of lost messages generally stayed below
10% for both kits. Signal levels below -94 dBm resulted in massive amounts of lost messages or
no communications. Keeping the effects we have seen in this testing in mind when setting up
future experiments, both development kits could be used as a basis of the platform for the rest of
work under study.

The low-powered 2.4 Ghz RF radios and antennas we investigated as part of the Freescale and
Texas Instruments evaluation systems did not seem to have sufficient range for reliable
communications in a point-to-point configuration (electrical meter to appliance) for a typical
suburban home. We have concluded that very often, too many walls or metal barriers (such as
the appliance itself) will degrade the broadcast signal to the point of being left with unsuccessful
wireless communications.
In Phase 2 we plan to explore other areas for improvements, including power amplifier (PA)
and/or low-noise amplifier (LNA) circuits, other standard RF frequency chipsets such as those in
the 900 Mhz band, and multi-node options.

2 Task 2 – Time and Date Handling
2.1 Phase 1 Plan
Our Task 2 drivers were, as stated in our Phase 1 proposal‟s project narrative:
“… an accurate time and day-of-week must be available to the smart grid controller; in fact, to
avoid customer billing surprises, the grid-connected appliance controller should know the time
and day-of-week accurately regardless of the frequency and duration of power interruptions it
experiences…”
“We propose to investigate a solution that involves receiving always-current time and date
information from the currently-broadcast NIST signal (or other radio frequency [RF] time
source) … to need no user input for setting the current time/day needed to support time-of-day
usage shifting – even if the customer‟s communication network (or lack thereof) otherwise
provides none.”
“It also avoids less-favorable methods of keeping accurate time/date through power outages,
such as battery-backed real-time clocks, involving issues of battery-related hazards, battery
disposal and battery replacement servicing.”
“[In Task 2 we will] evaluate two different methods of maintaining accurate time-of-day
independent of any other in-home device, first by coupling the first chipset to a second radio chip
and antenna to test the reception of the NIST‟s time-of-day RF broadcast signals from Colorado,
and secondly by using a Cymbet EnerChip [to power a timekeeping source through
powerdowns]. The first chipset‟s real-time clock would maintain time while the power is active
and the NIST signal would be used to re-establish the proper time on each powerup [or if the
NIST signal is not immediately available, time as maintained by the Enerchip].”
“We will determine if maintaining only the Greenwich Mean Time (GMT) time standard is
sufficient. As an alternative method of time management, we propose to determine if the smart
controller can learn the local time zone and daylight savings status (in case the utility‟s time-
based pricing information requires this) without adding a traditional user interface requiring
buttons and a display.”
2.2 Overview
With the installation of new Smart Meters across the country (promoted in part by the DOE and
the funding provided by the American Recovery and Reinvestment Act of 2009 [ARRA]),
electric utility companies and energy service providers in various places are turning their
attention to the creation of new customer programs that involve time-of-use incentives as part of
their Demand Response plans for residential customers. In many cases, this will require the
home appliance user‟s smart energy devices to accurately know the time and date at all times.
We foresaw the advantage of such devices having ready access to the Coordinated Universal
Time (UTC) signal continually broadcast by the National Institute of Standards and Technology
(NIST). As stated by one of the reviewers to the Electric Power Research Institute‟s (EPRI‟s)
„Report to NIST on the Smart Grid Interoperability Standards Roadmap‟:
“What are we to do with Daylight Savings Timeshifts and timezone differences? I can only
suggest that all devices subscribe to a NIST approved timebase, and communicate UTC
based formats ...”
While some of the most-connected homes may have multiple sources for a “standard” time
signal, including their Internet gateway, a global positioning system (GPS) source, or maybe a
signal from a high-end Smart Meter, many conceivable devices to help energy user‟s non-smart
appliances interact best with their utility‟s Demand Response information could benefit most
from having automatic wireless time and date synchronization from outside of any Smart Grid
network. Benefits could include elimination of the need for a battery to keep time and date
accurate throughout power downs, elimination of user time-setting interfaces, and the ability to
send accurate time and date to other in-home „smart‟ devices whose designers thought it „not my
job‟ to ensure their own independent source for this very critical piece of the peak electricity
usage management equation.
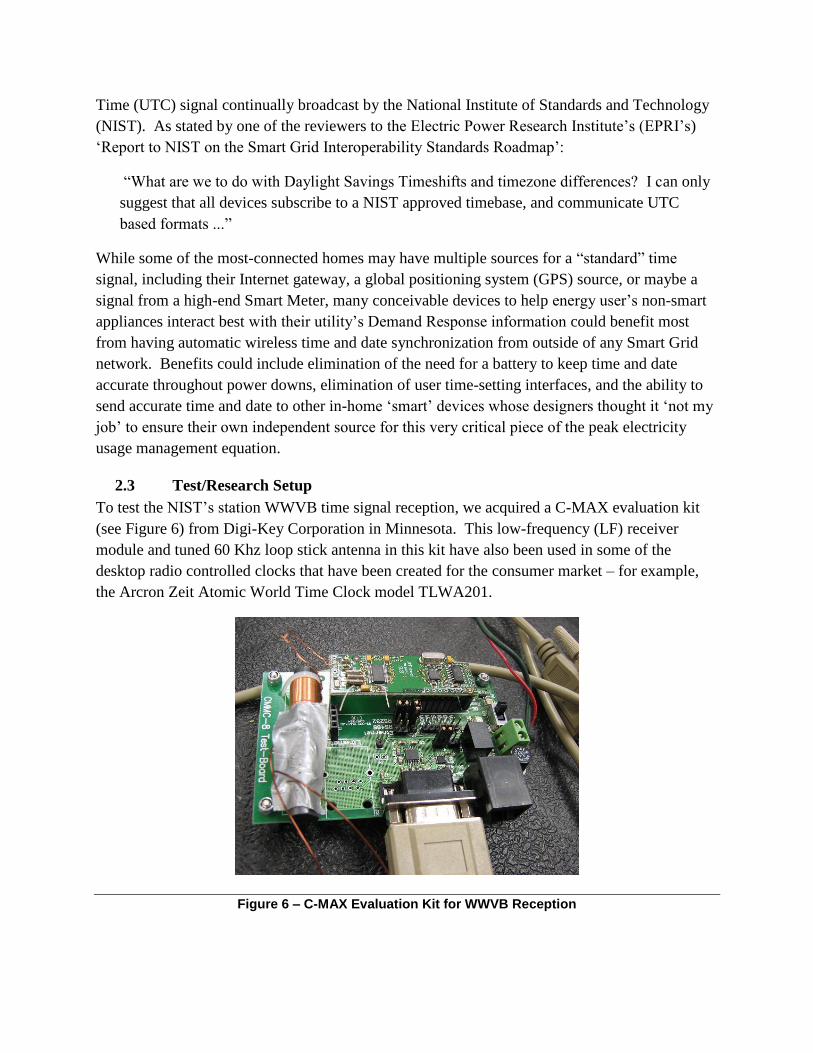
2.3 Test/Research Setup
To test the NIST‟s station WWVB time signal reception, we acquired a C-MAX evaluation kit
(see Figure 6) from Digi-Key Corporation in Minnesota. This low-frequency (LF) receiver
module and tuned 60 Khz loop stick antenna in this kit have also been used in some of the
desktop radio controlled clocks that have been created for the consumer market – for example,
the Arcron Zeit Atomic World Time Clock model TLWA201.
Figure 6 – C-MAX Evaluation Kit for WWVB Reception
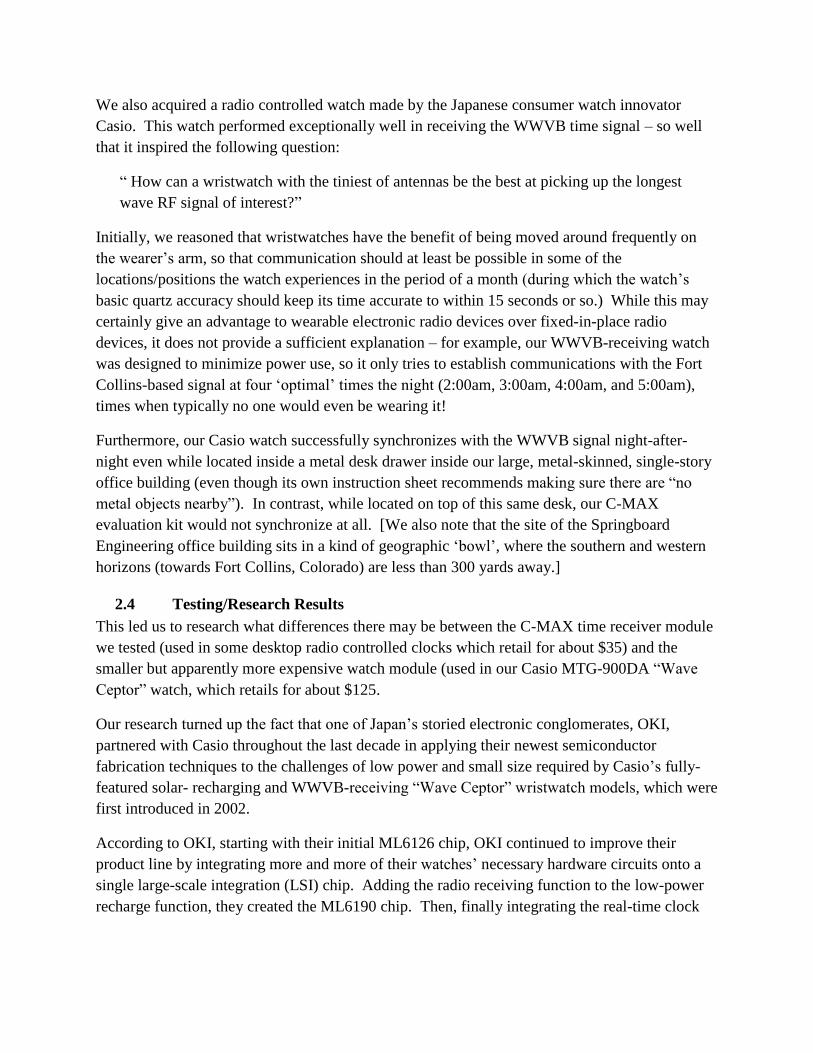
We also acquired a radio controlled watch made by the Japanese consumer watch innovator
Casio. This watch performed exceptionally well in receiving the WWVB time signal – so well
that it inspired the following question:
“ How can a wristwatch with the tiniest of antennas be the best at picking up the longest
wave RF signal of interest?”
Initially, we reasoned that wristwatches have the benefit of being moved around frequently on
the wearer‟s arm, so that communication should at least be possible in some of the
locations/positions the watch experiences in the period of a month (during which the watch‟s
basic quartz accuracy should keep its time accurate to within 15 seconds or so.) While this may
certainly give an advantage to wearable electronic radio devices over fixed-in-place radio
devices, it does not provide a sufficient explanation – for example, our WWVB-receiving watch
was designed to minimize power use, so it only tries to establish communications with the Fort
Collins-based signal at four „optimal‟ times the night (2:00am, 3:00am, 4:00am, and 5:00am),
times when typically no one would even be wearing it!
Furthermore, our Casio watch successfully synchronizes with the WWVB signal night-after-
night even while located inside a metal desk drawer inside our large, metal-skinned, single-story
office building (even though its own instruction sheet recommends making sure there are “no
metal objects nearby”). In contrast, while located on top of this same desk, our C-MAX
evaluation kit would not synchronize at all. [We also note that the site of the Springboard
Engineering office building sits in a kind of geographic „bowl‟, where the southern and western
horizons (towards Fort Collins, Colorado) are less than 300 yards away.]
2.4 Testing/Research Results
This led us to research what differences there may be between the C-MAX time receiver module
we tested (used in some desktop radio controlled clocks which retail for about $35) and the
smaller but apparently more expensive watch module (used in our Casio MTG-900DA “Wave
Ceptor” watch, which retails for about $125.
Our research turned up the fact that one of Japan‟s storied electronic conglomerates, OKI,
partnered with Casio throughout the last decade in applying their newest semiconductor
fabrication techniques to the challenges of low power and small size required by Casio‟s fully-
featured solar- recharging and WWVB-receiving “Wave Ceptor” wristwatch models, which were
first introduced in 2002.
According to OKI, starting with their initial ML6126 chip, OKI continued to improve their
product line by integrating more and more of their watches‟ necessary hardware circuits onto a
single large-scale integration (LSI) chip. Adding the radio receiving function to the low-power
recharge function, they created the ML6190 chip. Then, finally integrating the real-time clock

(RTC) circuitry with the rest, they created the ML6191 chip, advertised as “a first in the industry
single chip LSI for radio controlled clocks” in 2004.
Their ML6191 low-power, high-performance time receiver chip, was fabricated with a novel
fully-depleted Silicon-on-Insulator (SOI) process, which in 2007 was reported to be “only
performed by OKI” and “mainly for radio-controlled solar watches”. Prior to that, many high-
performance chips for other markets were made using a partially-depleted SOI process, including
high-end microprocessors such as IBM‟s PowerPC and Advanced Micro Device‟s Athlon.
According to OKI‟s website, the ML6191 has been discontinued – perhaps after OKI
Semiconductor was acquired by ROHM Semiconductor in 2008. Our conclusion is that OKI had
a superior and specialized, if more costly, technology for improving the 60 Khz NIST reception.
In the United States, the generation and transmission strength of the time signal from the NIST
site in Fort Collins, Colorado, has been continually upgraded since it was first transmitted from
that location on December 1 of 1966.
Of particular interest in the scope of our research into reception of the NIST‟s WWVB time/date
signal was the discovery that it was also included within the scope of two other recent federal
solicitations – one by the US Department of Commerce‟s SBIR program and the other by the US
Department of Defense‟s SBIR program. In the case of the Department of Commerce, the topic
looks at the potential of changes in the WWVB modulation scheme to improve the signal
robustness/quality, and while some may foresee the future of all long-distance wireless signals
(including time/date signals) moving to GPS receivers, in the case of the Department of Defense,
the Air Force is looking for small businesses to investigate the benefits of adding WWVB time
reception to the Air Force‟s current GPS mobile user equipment, because as quoted from DOD
SBIR 09.3, AF093-152, the GPS signal “may not always be available due to interference;
therefore means of acquiring alternative timing solutions provide great benefit to the
USAF. RF timing signals such as the WWV low-frequency radio stations broadcast by the
National Institute of Standards and Technology (NIST) provide relatively accurate timing
signals on high-power signals spectrally separated (in the RF spectrum) from GPS.”
Taken together, these facts reinforce the conclusion that the promotion of an ever-improving,
nationwide, low-frequency RF time source signal remains an active pursuit of the NIST‟s Time
and Frequency Division for a multitude of public and private applications. NIST‟s record has
been good – when discussing plans to increase the WWVB signal strength almost 14 years ago,
Don Sullivan, then chief of NIST's Time and Frequency Division, presciently stated that “this
will make it possible to build automatic, WWVB-controlled clocks into all kinds of
appliances, even wristwatches.”
2.4.1 WWVB Time Reception Testing Results
After pins were soldered on the C-MAX RF receiver board so it could be connected to the
evaluation motherboard, and a 5VDC switching power supply was attached to the terminal
block, the demo application on the PC seemed to communicate well enough via the RS-232
interface with the C-MAX evaluation kit, but the WWVB reception seemed non-existent from
the desktop near the back corner of the front room in our Springboard office building. The demo
application is designed to show red, yellow or green vertical bars during reception to indicate the
success of the synchronization attempt, and the results were all or nearly all red. Raising the C-
MAX kit up about 3‟ to the top of the credenza and toward the outside wall about 3‟ yielded just
a little bit of yellow during reception tests, but nothing close to successful synchronization with
the WWVB time signal broadcast from Fort Collins.
Next we moved the C-MAX kit to another computer setup near the front window which faces
south. More yellow bars were seen but little green – still no success.
Later, this same configuration was taken to a country home and tried on the sill of a south-facing
window in the late evening. This testing resulted in much more yellow and green, but still no
successful synchronization. Some further online investigation indicated that the negative voltage
generation on the C-MAX‟s RS-232 converter may produce enough on-board noise to
overwhelm the 60 Khz RF signal that the receiver is trying to detect. After replacing the external
AC-DC converter with a 9VDC battery to help reduce power supply noise, this seemed to
improve the reception somewhat. Then, after disconnecting the RS232 serial cable with the C-
MAX board still set to repeatedly attempt synchronization and then re-connecting the cable after
several minutes, the radio clock reported to the PC application a successful “Last
Synchronization” time stamp for the first time. Left running overnight, the last “successful” sync
was reported near sunup, although the year was reported erroneously as ‟90‟ rather than „10‟.
A few nights later, the older 9VDC battery was exchanged for a fresh one, and several inches of
wire in a twisted pair were added to the battery connector. With this configuration, successful
synchronization could be achieved at the country home in either of two ways: 1) by removing
the serial cable, or 2) by physically holding onto the 9V battery (which has a standard painted
metal case, electrically isolated from either terminal.) This latter result was very repeatable and
remarkable, but also very difficult to explain: whether the human body was acting as an
additional antenna or as a frequency-shifting capacitance to improve the signal or as a shunt path
for system noise, it was hard to guess. Left overnight with the serial cable still attached and
talking with the C-MAX evaluation program on the laptop, and with the battery wrapped in a foil
wrapper and wedged next to the laptop body, it was found that the C-MAX evaluation kit would
also sync.
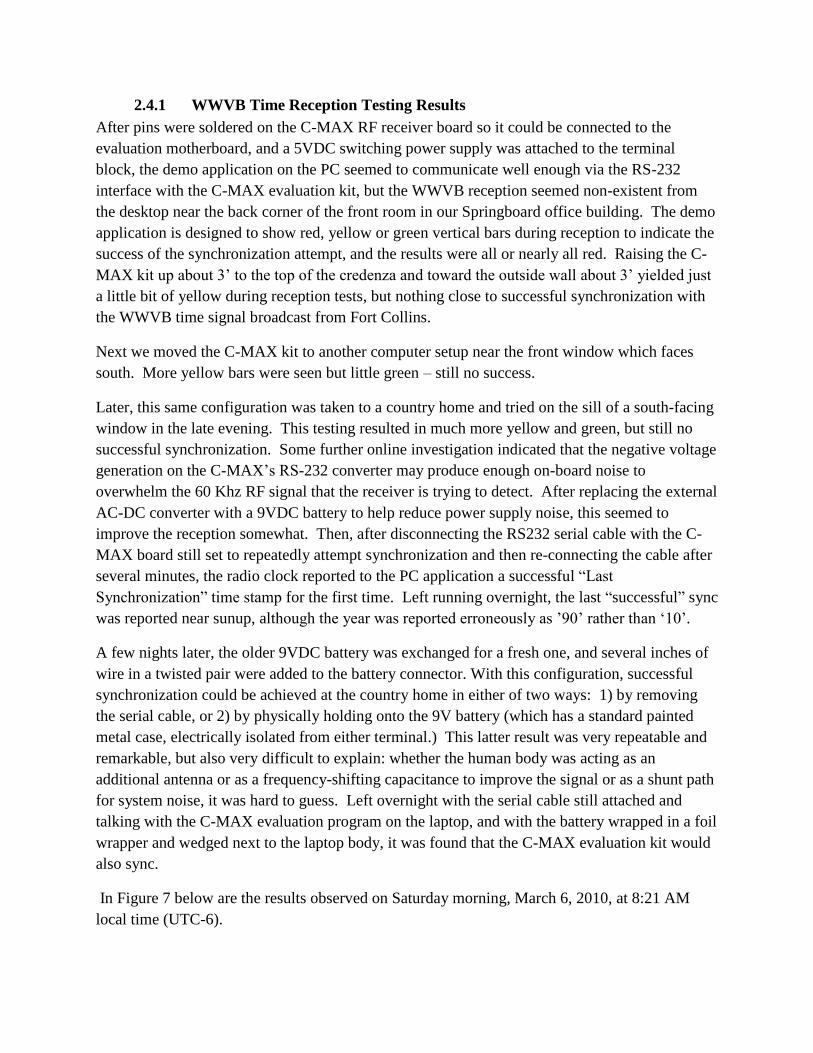
In Figure 7 below are the results observed on Saturday morning, March 6, 2010, at 8:21 AM
local time (UTC-6).
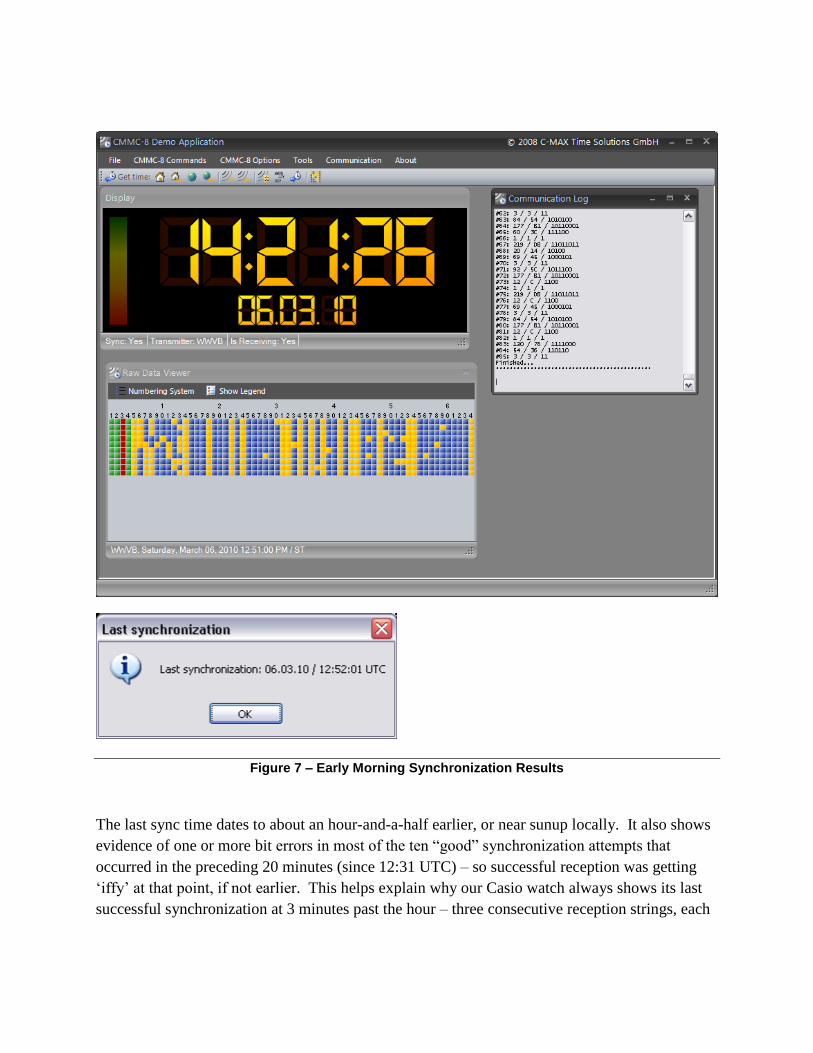
Figure 7 – Early Morning Synchronization Results
The last sync time dates to about an hour-and-a-half earlier, or near sunup locally. It also shows
evidence of one or more bit errors in most of the ten “good” synchronization attempts that
occurred in the preceding 20 minutes (since 12:31 UTC) – so successful reception was getting
„iffy‟ at that point, if not earlier. This helps explain why our Casio watch always shows its last
successful synchronization at 3 minutes past the hour – three consecutive reception strings, each
taking 1 minute to arrive at 60 Khz, are required to match bit-for-bit in the unchanging bit fields
to help verify the integrity of the received WWVB time signal data.
Additional testing at Springboard with this configuration (except with a desktop PC replacing the
laptop) in the south-facing window and also in the glassed-in entry way of the Springboard
facility (where AT&T cell phone reception was reported to have improved previously) did not
show any green bars, just more yellow bars, and synchronization was never achieved. Here,
there also did not appear to be any improvement gained by holding the battery or touching the
antenna. [See Figure 8 below.]
Figure 8 – C-MAX Time Reception Setup at Springboard
We note that this initial testing at Springboard Engineering was done during the daylight hours
only, and that the Springboard facility is in somewhat of a geographic bowl, with a land rim as
high as the single-story commercial building beginning a few hundred yards away on both the
South and West sides – toward Fort Collins, Colorado.
It seems clear from both our testing and the research we have done, that the state of WWVB
reception with the typical radio controlled desk clock hardware is:

a) far better at receiving successfully in the nighttime hours than in the daytime hours,
b) unlikely to work well or at all in certain geographic locations,
c) much more likely to synchronize in the most-optimal interior positions than in the
least-optimal positions, and
d) suffering from poor signal-to-noise ratio due to both poor signal pickup strength and
high relative noise floor.
For improvements to the signal level, exploring improved antenna designs seems especially
promising. Several options exist, including designs using Litz wire, open loop designs, and/or an
antenna system that could be installed somewhat remotely from the WWVB receiver. We would
like to create and verify a much-improved antenna design in Phase 2 of this project.
On the noise side, it seems particularly important to shield the 60 KHz receiver from other power
supply and other system noise sources, so the design of the receiver module seems critical.
As demonstrated with our watch, addressing these two areas should allow the concept of WWVB
reception for always-accurate time and date to work in the majority of currently unsuccessful,
but desirable geographic locations and interior positions.
2.4.2 Battery Backup Investigation
We also wanted to investigate the Cymbet EnerChip as a possible eco-friendly means of
maintaining power to run a smart device‟s timekeeping circuitry in case a new time sync cannot
be immediately achieved upon each powerup. The EnerChip differs from traditional batteries in
that it contains no hazardous or flammable materials, can be reflow soldered, and is designed to
last the life of devices it powers.
To evaluate this we acquired Cymbet‟s CBC-EVAL-05 kit which included two different
EnerChip devices, the CBC3112 (12uAh capacity) and the CBC3150 (50uAh capacity). These
rechargeable, solid state energy sources with integrated power management circuitry were
analyzed for potential use in keeping a real-time clock chip actively maintaining time and day
throughout a power outage.
2.4.3 EnerChip Testing Results
A test circuit was connected to experiment with the CBC3112. All basic functionality of the
chip performed as intended. The reset output signal went low when VDD was removed. The
internal protection circuit shut off the output when the battery voltage dipped below
approximately 3 vdc.
Further experimentation was conducted to measure the rated output power capability. A 150
Kohm resistor was placed in series with a 1 Kohm resistor on the output pin to ground. With this
arrangement, a 25 uA current drain was expected. The 1 Kohm resistor was connected to an

oscilloscope to measure the load current (1 mv measured output equals 1 uA current). When the
charging power supply was removed from VDD, the output voltage settled in to 3.75 vdc, and
the current measured was indeed 25 uA. The expectation was that the chip should supply this
current for approximately ½ hour (12 uAh rated capacity); however, the battery voltage dropped
to below 3 vdc after only 10 minutes and activated the internal battery protection cut-off. This
equates to only 30% of the expected capacity. Reflection upon this experiment brought the
consideration that perhaps the battery was being over-loaded with 25 uA current draw. Review
of the literature provided with the evaluation kit did not indicate a maximum rated output
current. Contact was made with an engineering representative at Cymbet, who confirmed that
too much output current may drive the battery to the 3 vdc threshold and into cut-off. He
indicated that there isn‟t a designed max output current; however, the rated output current is 8
uA. The test circuit was then revised by replacing the 150 Kohm resistor with a 330 Kohm
resistor. The expected and subsequently measured output current was approximately 8 uA;
however, the battery voltage dropped to the 3V cutoff after about 1 minute. The conclusion was
that the 12 uAh battery circuit may have been damaged by the previous, higher load current.
This discovery is critical input for future designs with this chip.
Testing then switched to the 50 uAh capacity CBC3150 chip using a 470 Kohm resistor and the
1 Kohm measurement resistor in series for a load. The circuit operated at approximately 8.5 uA
for over 5 hours and finally went into cut-off after 5 hours and 45 minutes. The approximate
output was calculated to be 46.75 uAh, indicating that the device delivers very closely to the data
sheet expectation of 50 uAh maximum.
Real-time clock (RTC) or counter chips are readily available that have adequate resolution, low
power use (ranging from 130 nA to 10 uA in standby current), and the ability to interface with a
microprocessor, making them suitable options for backup timekeeping during power outages.
The Texas Instruments bq4802LY was analyzed as one potential RTC that might use the
EnerChip as a backup power source. This RTC requires less than 500 nA of operating current in
backup mode use; therefore the 50 uAh chip from Cymbet should be able to operate it for power
outages up to 100 hours in duration (over 4 days), which should be sufficient for most
applications.
2.5 Conclusions
2.5.1 WWVB Signal Reception Conclusions
Our Phase 1 research shows that the low-frequency (LF) band, 60 Khz WWVB time/date
synchronization signal from the NIST transmitter site near Fort Collins, Colorado, is very
difficult to detect reliably with a standard consumer desktop radio controlled clock unit fixed in a
typical appliance location inside a home, yet we have demonstrated good results with our
premium watch sample. We believe that to improve receptivity, additional research and
development is warranted, particularly in the areas of WWVB antenna system design and
receiver module layout.

[Note: As recommended by NIST special publication 960-14 (2009 version), we have used
the phrase “radio controlled clock” rather than “atomic clock”, as the latter is not technically
correct for products that do not contain an atomic oscillator, such as a cesium or rubidium
oscillator. A radio-controlled clock, then, is one with a radio inside that receives the time
signal from an atomic clock source. In contrast, per the NIST‟s website, their Atomic
Devices and Instrumentation Group has actually created chip-mounted structures about the
size of a grain of rice that do embody atomic-level timing means and could rightly be called
atomic clock chips.]
2.5.2 EnerChip Backup Power Source Conclusions
Our conclusion here is that a solid state micro-energy battery such as the Cymbet devices we
tested should be easily capable of providing backup power to an RTC. At under $1 per unit at
modest volumes, they could be connected in parallel to achieve even longer backup times, if
needed.
Depending upon the application, a super capacitor could also work for an RTC application.
Their main disadvantages compared to the Cymbet devices appear to be the internal discharge
rate of a super capacitor and their larger physical size.

3 Task 3 – Wired Communications
3.1 Phase 1 Plan
Our Task 3 drivers were, as stated in our Phase 1 proposal‟s project narrative:
“…. we intend to investigate in Phase 1 if the same chipset can detect and respond to wired load
curtailment or pricing information signals from a source broadcasting on the in-home AC power
line.”
“Can the chipset work together with a companion chip which supports open-standard wired AC
power line broadcast signals so that both wired and wireless communication modes are
supported by the same chipset?”
“Since some of the home network groups are promoting a power line carrier broadcast signal
solution to in-home energy networks, it would be important for a universal chipset to support this
means of communication in addition to wireless. We propose to determine the feasibility of
using the same chipset above to support this functionality of a smart controller for non-smart
appliances.”
3.2 Test Setup Overview
Power Line Communications (PLC) uses the existing electrical wiring in a structure as the
pathways of communications by impressing a high frequency carrier with digital data on top of
the AC voltage, in effect, making the electrical outlets in that structure also function as data
ports. For testing this method, a three-module Yitran IT700 Starter Kit was purchased from
distributor Future Electronics (Figure 9 below). One module was configured as the Base (or
Network Coordinator), and the remaining two modules were configured as Remote Stations to
form a basic 3-node network.
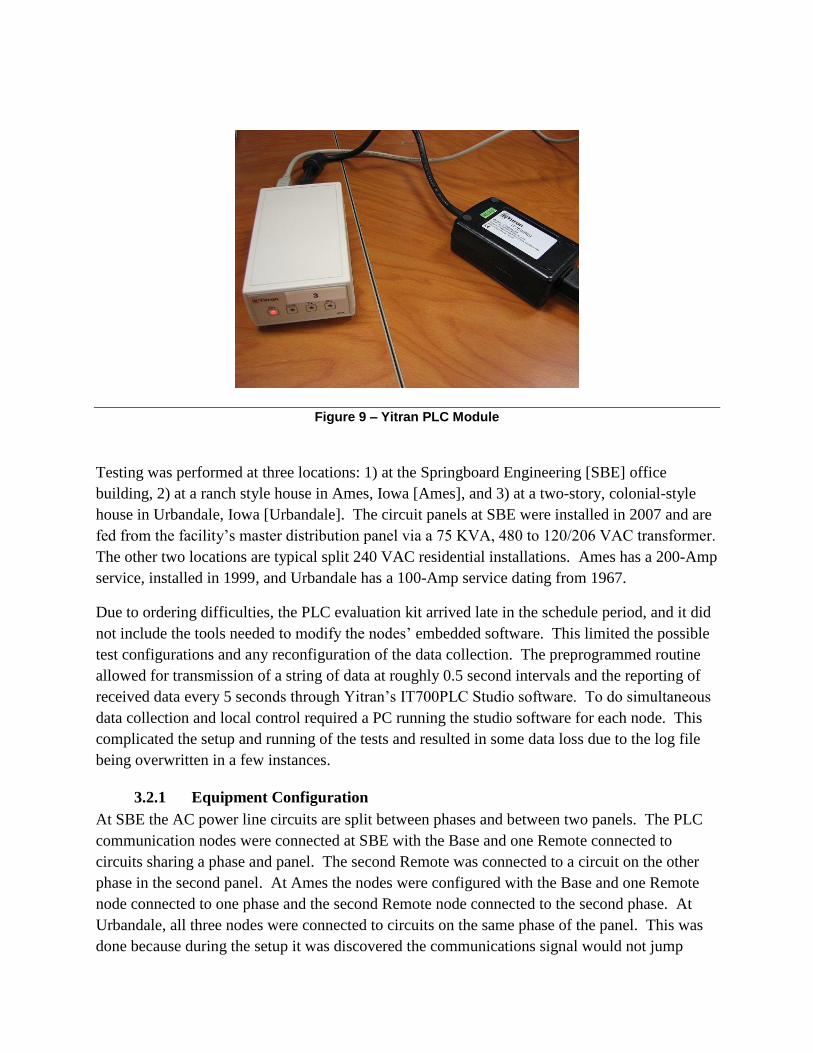
Figure 9 – Yitran PLC Module
Testing was performed at three locations: 1) at the Springboard Engineering [SBE] office
building, 2) at a ranch style house in Ames, Iowa [Ames], and 3) at a two-story, colonial-style
house in Urbandale, Iowa [Urbandale]. The circuit panels at SBE were installed in 2007 and are
fed from the facility‟s master distribution panel via a 75 KVA, 480 to 120/206 VAC transformer.
The other two locations are typical split 240 VAC residential installations. Ames has a 200-Amp
service, installed in 1999, and Urbandale has a 100-Amp service dating from 1967.
Due to ordering difficulties, the PLC evaluation kit arrived late in the schedule period, and it did
not include the tools needed to modify the nodes‟ embedded software. This limited the possible
test configurations and any reconfiguration of the data collection. The preprogrammed routine
allowed for transmission of a string of data at roughly 0.5 second intervals and the reporting of
received data every 5 seconds through Yitran‟s IT700PLC Studio software. To do simultaneous
data collection and local control required a PC running the studio software for each node. This
complicated the setup and running of the tests and resulted in some data loss due to the log file
being overwritten in a few instances.
3.2.1 Equipment Configuration
At SBE the AC power line circuits are split between phases and between two panels. The PLC
communication nodes were connected at SBE with the Base and one Remote connected to
circuits sharing a phase and panel. The second Remote was connected to a circuit on the other
phase in the second panel. At Ames the nodes were configured with the Base and one Remote
node connected to one phase and the second Remote node connected to the second phase. At
Urbandale, all three nodes were connected to circuits on the same phase of the panel. This was
done because during the setup it was discovered the communications signal would not jump
phases at the Urbandale location. All nodes were connected to individual PCs running the
IT700PLC Studio application.
3.2.2 Basic Test
In the basic test, only one node at a time was broadcasting. The active node would send 10
messages to one listening node, then 10 messages to the second listening node and finally 10
messages as a network-wide cast to all nodes. Tests at SBE were done with and without surge
protecting power strips. The presence of the strip did not appear to change the performance of
the system. The testing at Ames and Urbandale was done with protective power strips.
3.2.3 Round Robin Test
In this test, all the nodes are broadcasting at the same time to one other node. The Base node
would broadcast to the first Remote, the first Remote to the second Remote and the second
Remote to the Base. This was only done at Ames and Urbandale.
3.2.4 All Broadcast Test
In this test all three nodes send out a network-wide broadcast at the same time. This was only
done at Ames and Urbandale.
3.3 Testing Results
The IT700PLC Studio software records the following data:
Record index
Date and time
Network number
Originating node number
The node number next in the network
The node number the target node receives the message from
Target node number
Signal quality (0=Poor, 31=Best)
Contention Window – Number of “quiet” time intervals on net before transmission is
allowed
Data rate (Mode SM=7.5 kbps, RM=5 kbps, ERM=2.5 kbps)
Service Type (ACK: expect acknowledgement; UNACK: no acknowledgement)
Transmission type (to node #; all nodes on same network; Different network)
Port used
Message
The testing in this task focused on signal quality items: how many of the sent messages were
received, what was the signal quality value, what was the data rate and how long was the
contention window.
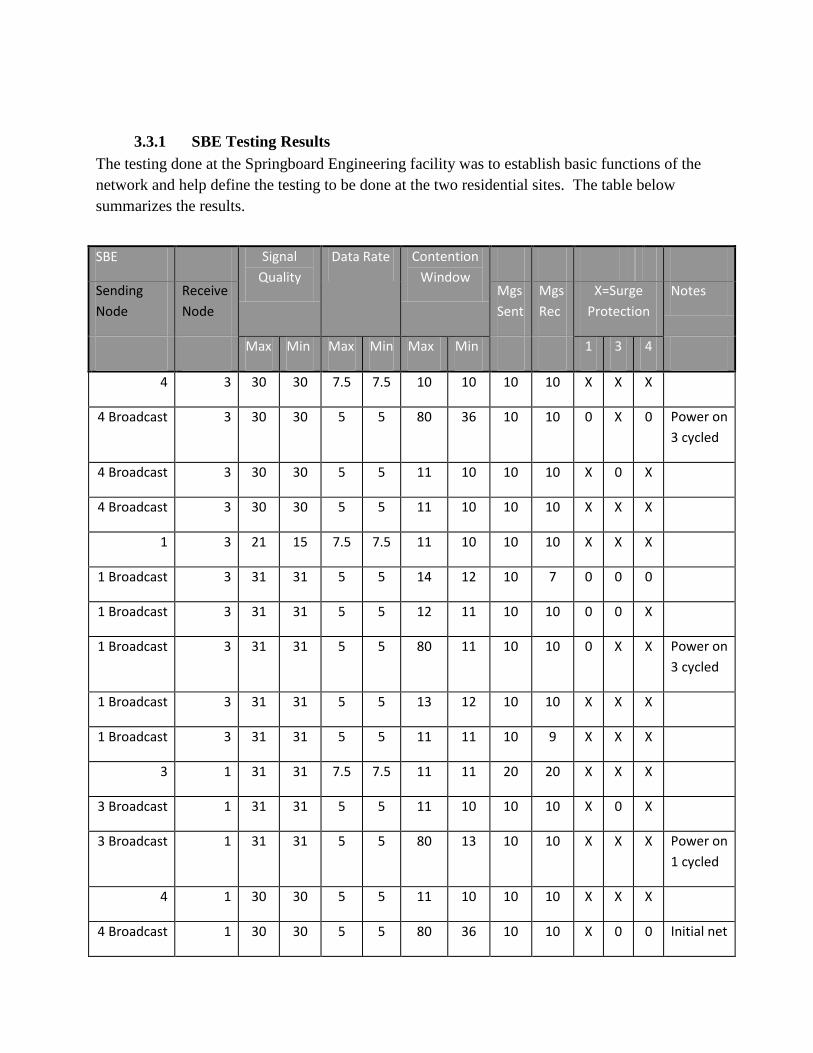
3.3.1 SBE Testing Results
The testing done at the Springboard Engineering facility was to establish basic functions of the
network and help define the testing to be done at the two residential sites. The table below
summarizes the results.
SBE Signal
Quality
Data Rate Contention
Window
Sending
Node
Receive
Node
Mgs
Sent
Mgs
Rec
X=Surge
Protection
Notes
Max Min Max Min Max Min 1 3 4
4 3 30 30 7.5 7.5 10 10 10 10 X X X
4 Broadcast 3 30 30 5 5 80 36 10 10 0 X 0 Power on
3 cycled
4 Broadcast 3 30 30 5 5 11 10 10 10 X 0 X
4 Broadcast 3 30 30 5 5 11 10 10 10 X X X
1 3 21 15 7.5 7.5 11 10 10 10 X X X
1 Broadcast 3 31 31 5 5 14 12 10 7 0 0 0
1 Broadcast 3 31 31 5 5 12 11 10 10 0 0 X
1 Broadcast 3 31 31 5 5 80 11 10 10 0 X X Power on
3 cycled
1 Broadcast 3 31 31 5 5 13 12 10 10 X X X
1 Broadcast 3 31 31 5 5 11 11 10 9 X X X
3 1 31 31 7.5 7.5 11 11 20 20 X X X
3 Broadcast 1 31 31 5 5 11 10 10 10 X 0 X
3 Broadcast 1 31 31 5 5 80 13 10 10 X X X Power on
1 cycled
4 1 30 30 5 5 11 10 10 10 X X X
4 Broadcast 1 30 30 5 5 80 36 10 10 X 0 0 Initial net
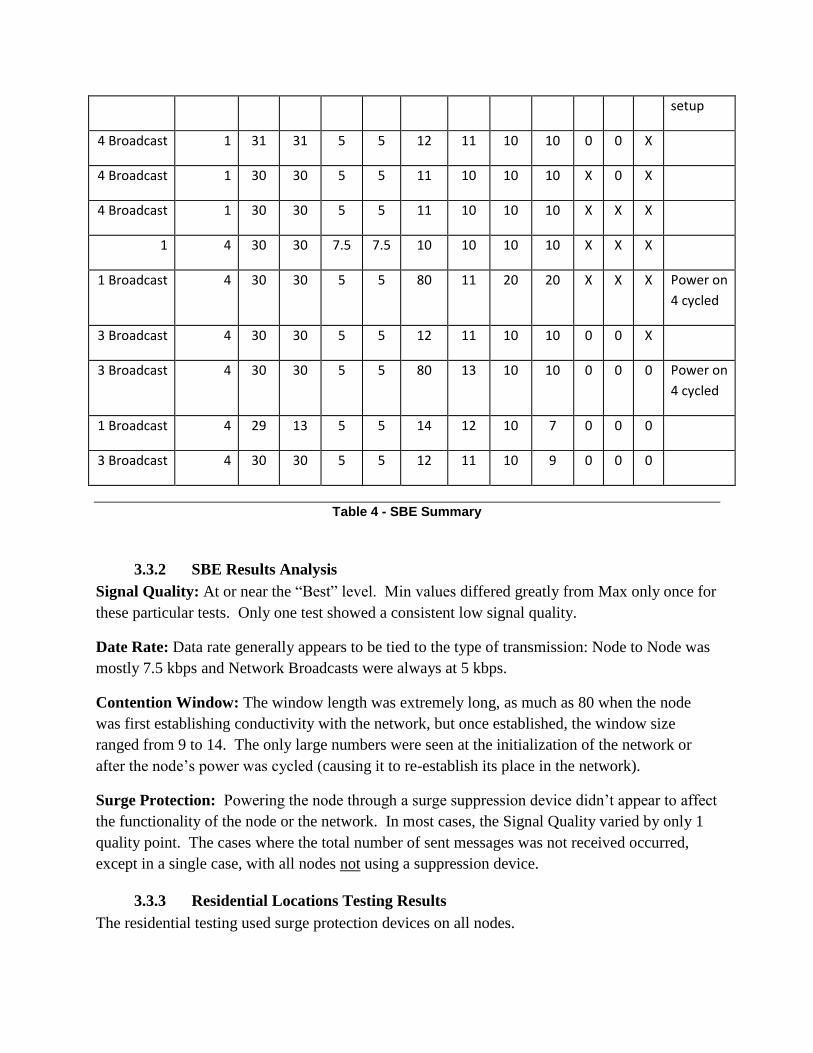
Table 4 - SBE Summary
3.3.2 SBE Results Analysis
Signal Quality: At or near the “Best” level. Min values differed greatly from Max only once for
these particular tests. Only one test showed a consistent low signal quality.
Date Rate: Data rate generally appears to be tied to the type of transmission: Node to Node was
mostly 7.5 kbps and Network Broadcasts were always at 5 kbps.
Contention Window: The window length was extremely long, as much as 80 when the node
was first establishing conductivity with the network, but once established, the window size
ranged from 9 to 14. The only large numbers were seen at the initialization of the network or
after the node‟s power was cycled (causing it to re-establish its place in the network).
Surge Protection: Powering the node through a surge suppression device didn‟t appear to affect
the functionality of the node or the network. In most cases, the Signal Quality varied by only 1
quality point. The cases where the total number of sent messages was not received occurred,
except in a single case, with all nodes not using a suppression device.
3.3.3 Residential Locations Testing Results
The residential testing used surge protection devices on all nodes.
setup
4 Broadcast 1 31 31 5 5 12 11 10 10 0 0 X
4 Broadcast 1 30 30 5 5 11 10 10 10 X 0 X
4 Broadcast 1 30 30 5 5 11 10 10 10 X X X
1 4 30 30 7.5 7.5 10 10 10 10 X X X
1 Broadcast 4 30 30 5 5 80 11 20 20 X X X Power on
4 cycled
3 Broadcast 4 30 30 5 5 12 11 10 10 0 0 X
3 Broadcast 4 30 30 5 5 80 13 10 10 0 0 0 Power on
4 cycled
1 Broadcast 4 29 13 5 5 14 12 10 7 0 0 0
3 Broadcast 4 30 30 5 5 12 11 10 9 0 0 0

There were four different test scenarios:
One node transmitting to only a second node
One node transmitting to all nodes
Node 1 transmitting to Node 3, Node 3 transmitting to Node 4, Node 4 transmitting to
Node 1. All at the same time.
All three nodes transmitting to all nodes at the same time.
3.3.3.1 Ames Testing Results
Node 1 is the Network Coordinator, and nodes 3 and 4 are the Remotes. Node 1 was placed in
the basement near the power panel and connected with a circuit of the same phase as Node 4.
Node 3 was connected to a circuit in the kitchen on the main floor, connected to the other phase
of the power panel. Node 4 was placed in a bedroom furthest from the panel, connected to the
same power phase as Node 1.
Details are shown in Table 5 – Table 8 below.
Ames Signal Quality Data Rate Contention
Window
Sending
Node
Receive
Node
Mgs
Sent
Mgs
Rec
Notes
Max Min Max Min Max Min
1 3 31 31 7.5 7.5 11 10 25 25
1 4 31 31 7.5 7.5 10 9 25 24
3 1 31 31 7.5 7.5 80 17 25 25 Initial net setup
3 4 31 31 7.5 7.5 15 13 25 25
4 3 31 15 7.5 7.5 11 10 25 25
4 1 31 31 7.5 7.5 10 10 25 24
Table 5 - Ames Signal Node to Signal Node
Ames Signal
Quality
Data Rate Contention
Window
Sending
Node
Receive
Node
Mgs
Sent
Mgs
Rec
Notes
Max Min Max Min Max Min
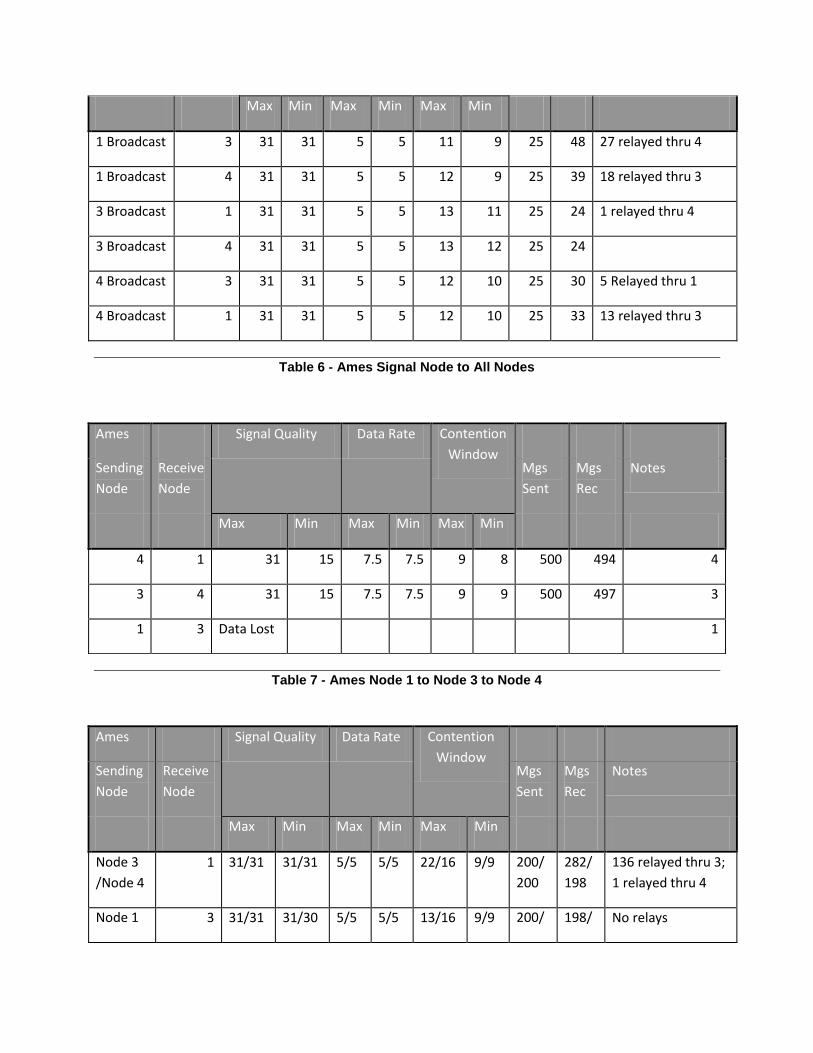
1 Broadcast 3 31 31 5 5 11 9 25 48 27 relayed thru 4
1 Broadcast 4 31 31 5 5 12 9 25 39 18 relayed thru 3
3 Broadcast 1 31 31 5 5 13 11 25 24 1 relayed thru 4
3 Broadcast 4 31 31 5 5 13 12 25 24
4 Broadcast 3 31 31 5 5 12 10 25 30 5 Relayed thru 1
4 Broadcast 1 31 31 5 5 12 10 25 33 13 relayed thru 3
Table 6 - Ames Signal Node to All Nodes
Table 7 - Ames Node 1 to Node 3 to Node 4
Ames Signal Quality Data Rate Contention
Window
Sending
Node
Receive
Node
Mgs
Sent
Mgs
Rec
Notes
Max Min Max Min Max Min
Node 3
/Node 4
1 31/31 31/31 5/5 5/5 22/16 9/9 200/
200
282/
198
136 relayed thru 3;
1 relayed thru 4
Node 1 3 31/31 31/30 5/5 5/5 13/16 9/9 200/ 198/ No relays
Ames Signal Quality Data Rate Contention
Window
Sending
Node
Receive
Node
Mgs
Sent
Mgs
Rec
Notes
Max Min Max Min Max Min
4 1 31 15 7.5 7.5 9 8 500 494 4
3 4 31 15 7.5 7.5 9 9 500 497 3
1 3 Data Lost 1

/Node 4 200 199
Node 1
/Node 3
4 31/31 31/31 5/5 5/5 14/18 9/9 200/
200
197/
268
2 relayed thru 3;
70 relayed thru 1
Table 8 - Ames All Nodes to All Nodes
3.3.3.2 Urbandale Testing Results
As before, Node 1 is the Network Coordinator, and Nodes 3 and 4 are the Remotes. Node 1 was
placed in the basement near the power panel. Node 4 was placed in a second-floor bedroom
furthest from the panel, connected to the same power phase as Node 1. Initially, Node 3 was
connected to a circuit of the second phase of the panel feeding the outlets in the family room on
the main floor. Connectivity from this initial Node 3 position was never established with the
coordinating node or Node 4. Several other locations connected to the second phase of the panel
also failed to connect to the network. Node 3 was moved to a main floor living room circuit
connected to the same panel phase as Nodes 1 & 4 and immediately joined the network.
Details are shown in Table 9 – Table 12 below.
Urbandale Signal Quality Data Rate Contention
Window
Sending
Node
Receive
Node
Mgs
Sent
Mgs
Rec
Notes
Max Min Max Min Max Min
1 3 31 31 7.5 7.5 10 9 25 25
3 1 31 15 7.5 7.5 10 10 25 25
4 3 30 30 7.5 7.5 10 10 25 25
4 1 30 30 7.5 7.5 10 9 25 24
Table 9 - Urbandale Signal Node to Signal Node
Urbandale Signal Quality Data Rate Contention
Window
Sending Receive Mgs Mgs Notes

Node Node Sent Rec
Max Min Max Min Max Min
1 Broadcast 3 31 31 5 5 11 11 25 21
3 Broadcast 1 31 30 5 5 11 10 25 21 1 relayed thru 4
4 Broadcast 3 30 30 5 5 10 9 25 24
4 Broadcast 1 30 30 5 5 10 9 25 24
Table 10 - Urbandale Signal Node to All Nodes
Urbandale Signal Quality Data Rate Contention
Window
Sending
Node
Receive
Node
Mgs
Sent
Mgs
Rec
Notes
Max Min Max Min Max Min
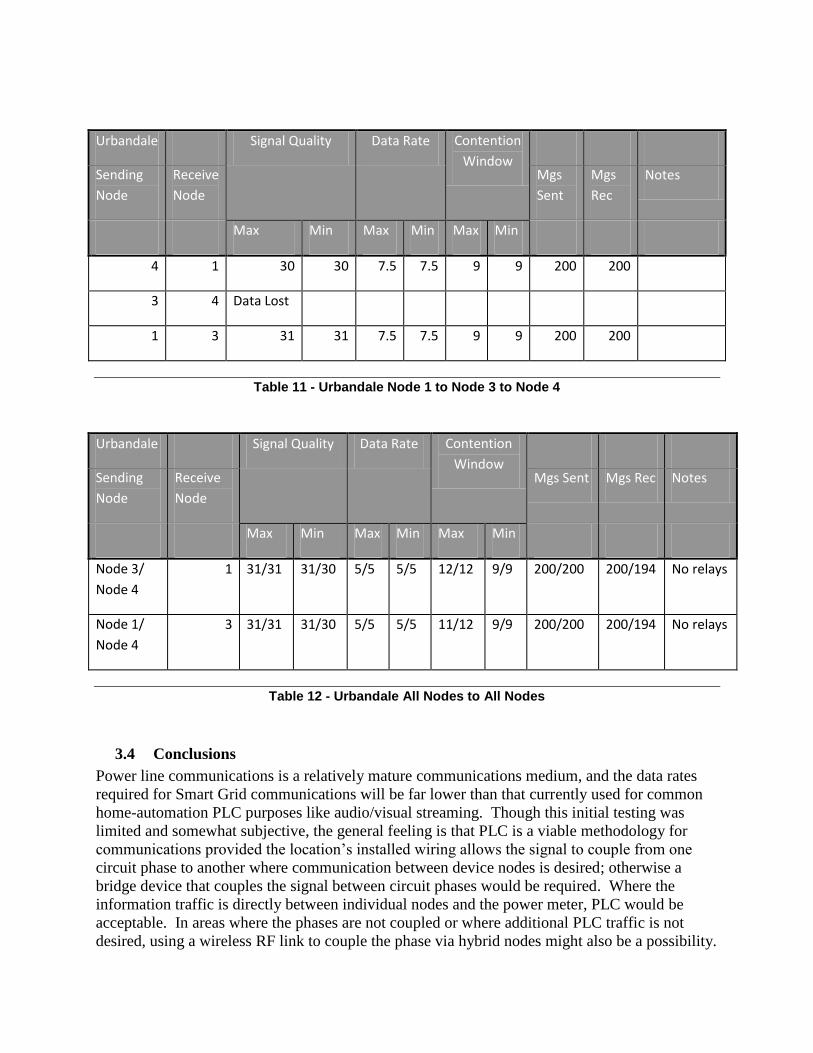
4 1 30 30 7.5 7.5 9 9 200 200
3 4 Data Lost
1 3 31 31 7.5 7.5 9 9 200 200
Table 11 - Urbandale Node 1 to Node 3 to Node 4
Urbandale Signal Quality Data Rate Contention
Window
Sending
Node
Receive
Node
Mgs Sent Mgs Rec Notes
Max Min Max Min Max Min
Node 3/
Node 4
1 31/31 31/30 5/5 5/5 12/12 9/9 200/200 200/194 No relays
Node 1/
Node 4
3 31/31 31/30 5/5 5/5 11/12 9/9 200/200 200/194 No relays
Table 12 - Urbandale All Nodes to All Nodes
3.4 Conclusions
Power line communications is a relatively mature communications medium, and the data rates
required for Smart Grid communications will be far lower than that currently used for common
home-automation PLC purposes like audio/visual streaming. Though this initial testing was
limited and somewhat subjective, the general feeling is that PLC is a viable methodology for
communications provided the location‟s installed wiring allows the signal to couple from one
circuit phase to another where communication between device nodes is desired; otherwise a
bridge device that couples the signal between circuit phases would be required. Where the
information traffic is directly between individual nodes and the power meter, PLC would be
acceptable. In areas where the phases are not coupled or where additional PLC traffic is not
desired, using a wireless RF link to couple the phase via hybrid nodes might also be a possibility.

PLC may also afford more physical security, on top of any software protocols, than a full
wireless system because the power line can be shielded by conduit, and any unused outlet could
be de-energized. Provided the power meter is equipped to transmit and receive the necessary
signals, PLC could prove to be an effective platform for a simple and robust network for the
installed non-smart appliance base. In terms of simplicity, in some of the basic usage cases the
end user only needs to plug the device into a wall outlet to achieve communications.
The technical feasibility of successful PLC communications within the home is well established,
although extra hardware to solve the communication-across-phases problem is often needed. As
we expected, a second chipset would be added to handle this specialized medium, and the two
chipsets would share data serially with one another. The objectives of this task have been
satisfied.

4 Task 4 – Appliance Power Monitoring
4.1 Phase 1 Plan
Our Task 4 drivers were, as stated in our Phase 1 proposal‟s project narrative:
“… new products that could be developed as a result of the proposed research …. include smart
wall outlets, smart outlet power-monitoring adapters, smart load switches and smart remote
electric rate indicators associated with the non-smart appliance.”
“… we will explore the feasibility of using the same chipset to control the functions of
monitoring the power used by the connected non-smart appliance and reporting either an energy-
use profile or instantaneous energy-use values back to the utility.”
“We will analyze the capability of the chipset to detect the voltage and current supplied through
the outlet to the appliance, calculate the power and report the resulting power use of the non-
smart appliance back to the AMI via the communications link (wired or wireless). This will be
calculated by measuring the peak of the AC voltage signal safely scaled down to a lower voltage
level and by inputting the signal from a magnetic current sensor to the microprocessor-based
chipset.”
4.2 Overview
Currently, there is a growing interest in home energy usage information within US households.
There are many examples of this, including the web applications of America‟s biggest business
“superbrands”, Google and Microsoft, with their “Google PowerMeter” and “Microsoft Hohm”
offerings, respectively. Being software applications, though, these rely on other hardware to
actually measure the household power use and send the data to their web-based applications.
At another level, many companies like Honeywell, White-Rodgers, and Canadian startup,
Ecobee, have been working on Smart Thermostat products which essentially add wireless
communication capabilities to the previous generation of programmable wall thermostats. This
type of device could become a new gateway for a home-centric smart energy management
system, having direct control of the home‟s major heating and cooling appliances, and the ability
to communicate with other devices via the coming open Smart Energy standards.
One particularly interesting phenomenon surrounding appliance energy monitoring is the
“Tweet-a-watt” do-it-yourself tweaking that has evolved around P3 International‟s Kill-A-Watt
electricity usage monitor device. Basically, when plugged in between an appliance‟s power cord
and the wall outlet, the Kill-A-Watt device measures and displays the electrical parameters
associated with the appliance‟s power use. This product‟s standalone capability of reporting a
consumer appliance‟s previously unknown energy consumption level, coupled with its affordable
price and retail availability, made it a popular item for the early-adopting, eco-technical
consumer. But as part of a “Greener Gadgets” design competition last year, someone proved that
with a few technical functions added, it could broadcast its energy consumption data on the
Internet via a Twitter account. Now there are “Tweet-a-watt” kits available for sale online with
instructions for the home enthusiast who would like to add a Zigbee radio module to it and
broadcast their appliance data to their free Google PowerMeter application, for example.
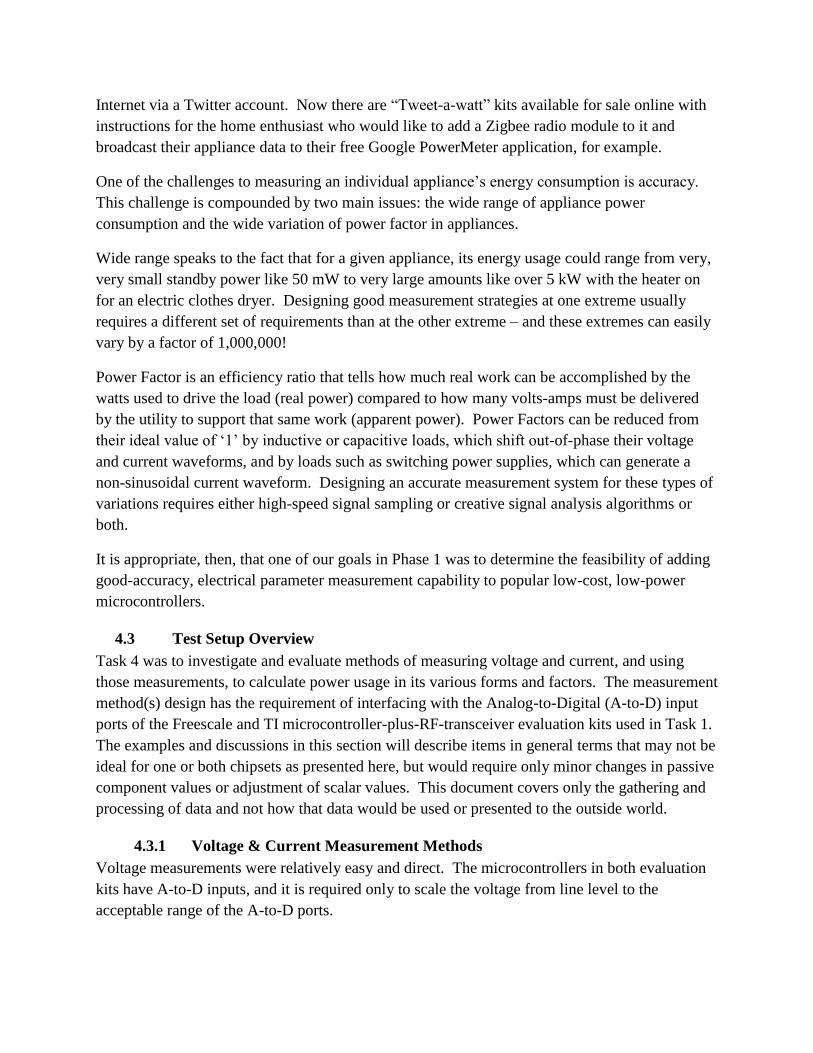
One of the challenges to measuring an individual appliance‟s energy consumption is accuracy.
This challenge is compounded by two main issues: the wide range of appliance power
consumption and the wide variation of power factor in appliances.
Wide range speaks to the fact that for a given appliance, its energy usage could range from very,
very small standby power like 50 mW to very large amounts like over 5 kW with the heater on
for an electric clothes dryer. Designing good measurement strategies at one extreme usually
requires a different set of requirements than at the other extreme – and these extremes can easily
vary by a factor of 1,000,000!
Power Factor is an efficiency ratio that tells how much real work can be accomplished by the
watts used to drive the load (real power) compared to how many volts-amps must be delivered
by the utility to support that same work (apparent power). Power Factors can be reduced from
their ideal value of „1‟ by inductive or capacitive loads, which shift out-of-phase their voltage
and current waveforms, and by loads such as switching power supplies, which can generate a
non-sinusoidal current waveform. Designing an accurate measurement system for these types of
variations requires either high-speed signal sampling or creative signal analysis algorithms or
both.
It is appropriate, then, that one of our goals in Phase 1 was to determine the feasibility of adding
good-accuracy, electrical parameter measurement capability to popular low-cost, low-power
microcontrollers.
4.3 Test Setup Overview
Task 4 was to investigate and evaluate methods of measuring voltage and current, and using
those measurements, to calculate power usage in its various forms and factors. The measurement
method(s) design has the requirement of interfacing with the Analog-to-Digital (A-to-D) input
ports of the Freescale and TI microcontroller-plus-RF-transceiver evaluation kits used in Task 1.
The examples and discussions in this section will describe items in general terms that may not be
ideal for one or both chipsets as presented here, but would require only minor changes in passive
component values or adjustment of scalar values. This document covers only the gathering and
processing of data and not how that data would be used or presented to the outside world.
4.3.1 Voltage & Current Measurement Methods
Voltage measurements were relatively easy and direct. The microcontrollers in both evaluation
kits have A-to-D inputs, and it is required only to scale the voltage from line level to the
acceptable range of the A-to-D ports.

Current measurements are more involved. All methods convert the current level to a
proportional voltage. The traditional method for measuring AC line current is to place a ferrite
core, toroidal pick-up coil around the current-carrying wire. A second method is to use a known-
value fixed resistor in series with the load (termed a Sense Resistor [RS]) and measure the
voltages on both side of the resistance. The differential of these voltages divided by the value of
the RS results in the current level. A more recent method has emerged based on a Hall Effect
sensor packaged in a surface-mount chip.
Methods considered and compared for measuring the current drawn by an appliance include:
4.3.1.1 Toroidal
Bulky, could introduce phase shift into reading
Not directly connected to power circuit
Can require special knowledge to install
4.3.1.2 Sense Resistor – Selected for Development
Mostly used for DC systems, small resistance limits system resolution, large resistance
could heat and/or increase power usage
Inexpensive, takes measurement directly from circuit
4.3.1.3 IC-based Hall Effect Sensor
Expensive compared to RS
Not directly coupled, output is scaled to microprocessor levels
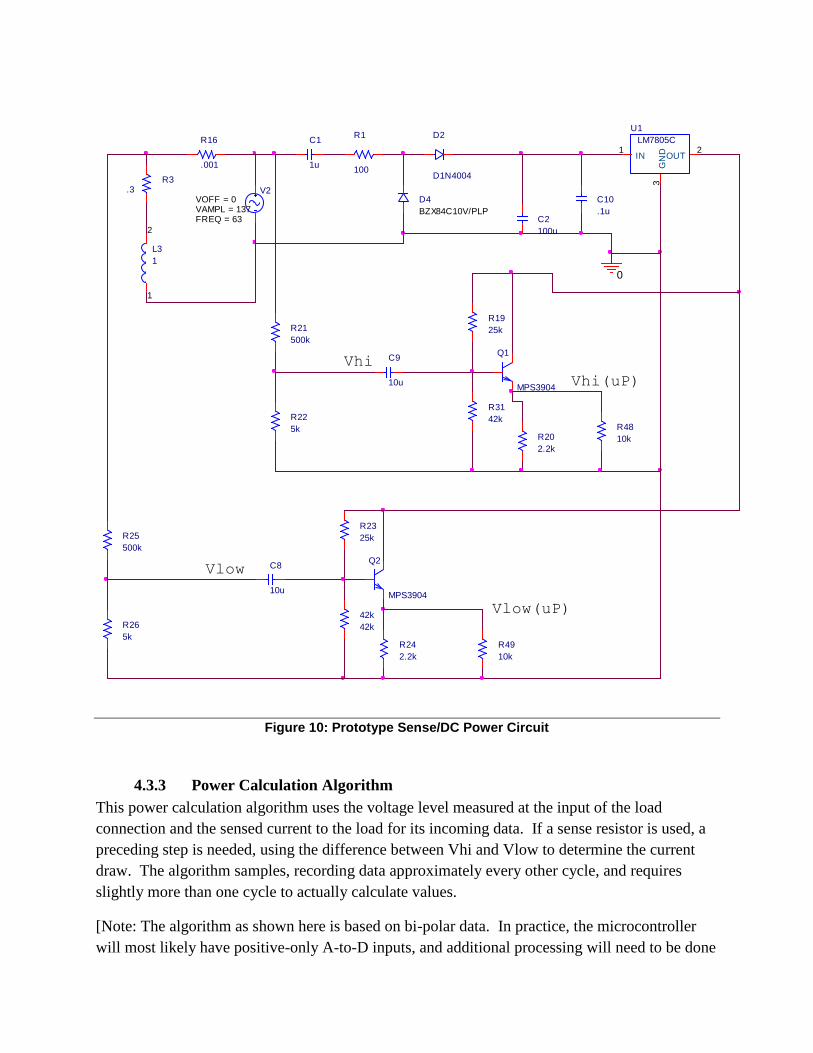
4.3.2 Hardware Examples – Sense Resistor
In Figure 10 below is an example of a circuit for scaling and conditioning voltage from either
side of a sense resistor (R16). The circuit also shows a simple AC to DC +5 volt supply that
draws power from the incoming line, L1. The measured voltages from Q1 [Vhi(uP)] and Q2
[Vlow(uP)] are used to calculate current and power. R48 & R49 represent the inputs to A-to-Ds.
The line level voltages are scaled down to a safe level, and the bias network on the transistor
gives them a positive offset so the A-to-Ds see voltages between 0 and +5 VDC.
Q1
MPS3904Vhi(uP)
Vlow(uP)
C10
.1u
C8
10u
C9
10u
R48
10k
R49
10k
D2
D1N4004
R1
100
C1
1u
V2
FREQ = 63VAMPL = 137VOFF = 0
0
R3.3
C2
100u
BZX84C10V/PLP
D4
U1
LM7805C
IN1
OUT2
GN
D3
R16
.001
R19
25k
R20
2.2k
L3
1
1
2
42k
42k
R31
42k
R21
500k
R22
5k
R25
500k
R26
5k
Q2
MPS3904
R23
25k
R24
2.2k
Vlow
Vhi
Figure 10: Prototype Sense/DC Power Circuit
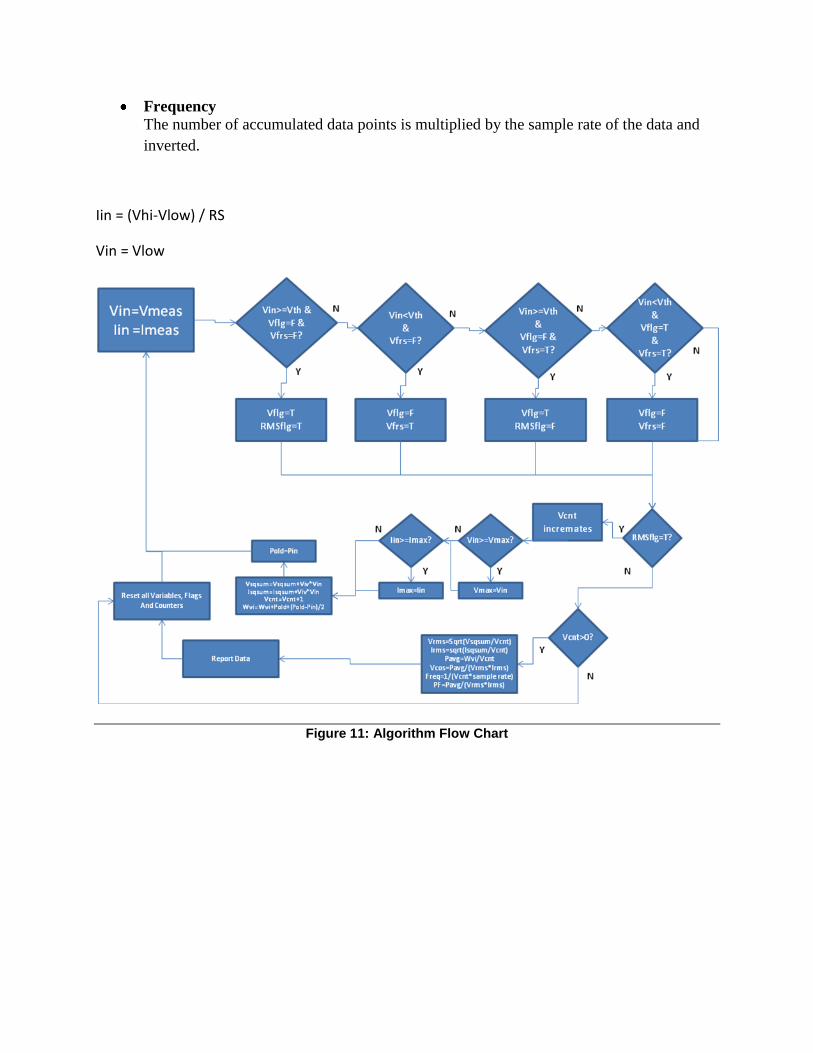
4.3.3 Power Calculation Algorithm
This power calculation algorithm uses the voltage level measured at the input of the load
connection and the sensed current to the load for its incoming data. If a sense resistor is used, a
preceding step is needed, using the difference between Vhi and Vlow to determine the current
draw. The algorithm samples, recording data approximately every other cycle, and requires
slightly more than one cycle to actually calculate values.
[Note: The algorithm as shown here is based on bi-polar data. In practice, the microcontroller
will most likely have positive-only A-to-D inputs, and additional processing will need to be done

to account for the required DC offset added to the signals. “Deadbands” around the trip points
will also need to be added for de-bounce purposes.]
The algorithm that follows in Figures 11 and 12 is based on trip points that set software flags
which control data collection and processing.
Initially all flags are set False. The voltage signal is monitored until its level exceeds a set point.
This sets the voltage flag Vflg and the RMSflg to True, and data collection is started. As the
voltage signal continues and returns to a level below the set point, Vflg is set to False and the
voltage reset flag Vfrs is set True. As long as RMSflg is True, data is collected and initial
processing is done.
Initial Processing:
Accumulation of the squares of the voltage data points
Accumulation of the squares of the amperage data points
Accumulation of the number of data points
Accumulation of the squares of the instantaneous power (V x I)
Partial integration of the instantaneous power
Maximum Voltage and Maximum Current are tracked
Once the voltage signal exceeds the voltage setpoint for the second time, indicating the end of a
full cycle, data collection stops, and data processing begins.
Processed value:
Vrms
The accumulated squares of the voltage are divided by the number of accumulated data
points, and the square root of the value is calculated with an iterative sub-routine.
Irms
The accumulated squares of the current are divided by the number of accumulated data
points, and the square root of the value is calculated with an iterative sub-routine.
Watts (Average Power)
The partial integral value for instantaneous power is divided the number of accumulated
data points.
Volt-Amps
Vrms and Irms are multiplied together.
Power Factor
Watts are divided by Volt-Amps.
Frequency
The number of accumulated data points is multiplied by the sample rate of the data and
inverted.
Iin = (Vhi-Vlow) / RS
Vin = Vlow
Figure 11: Algorithm Flow Chart
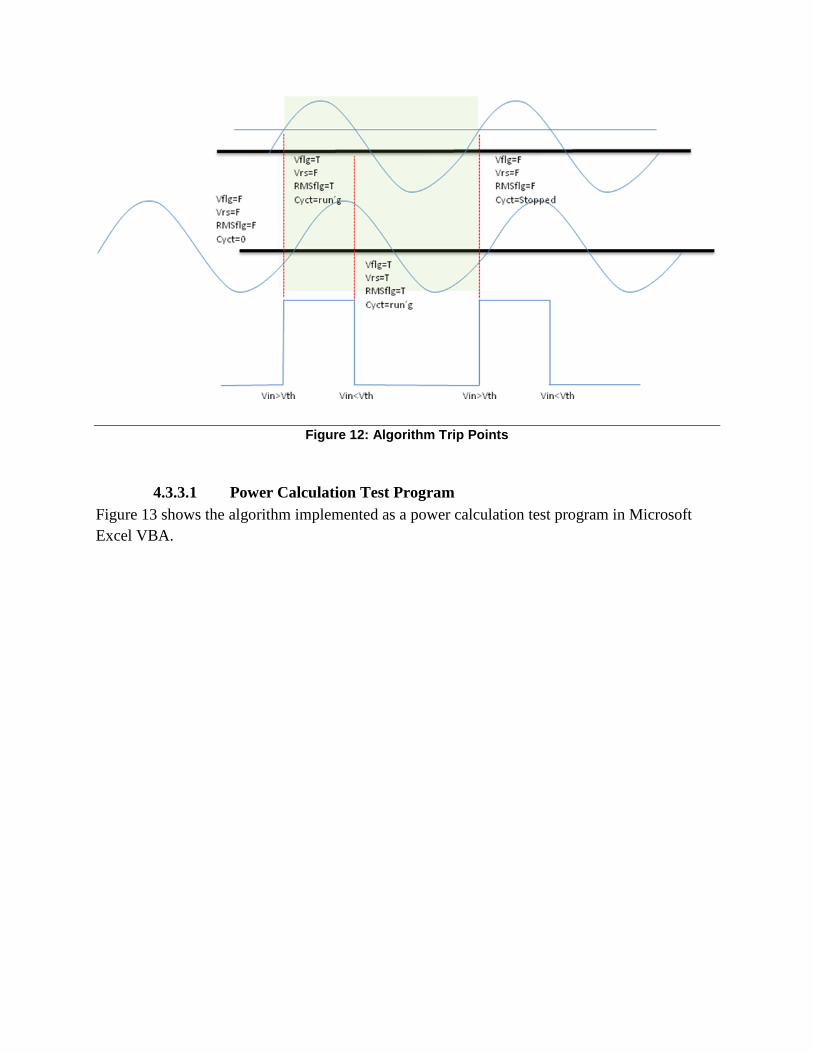
Figure 12: Algorithm Trip Points
4.3.3.1 Power Calculation Test Program
Figure 13 shows the algorithm implemented as a power calculation test program in Microsoft
Excel VBA.
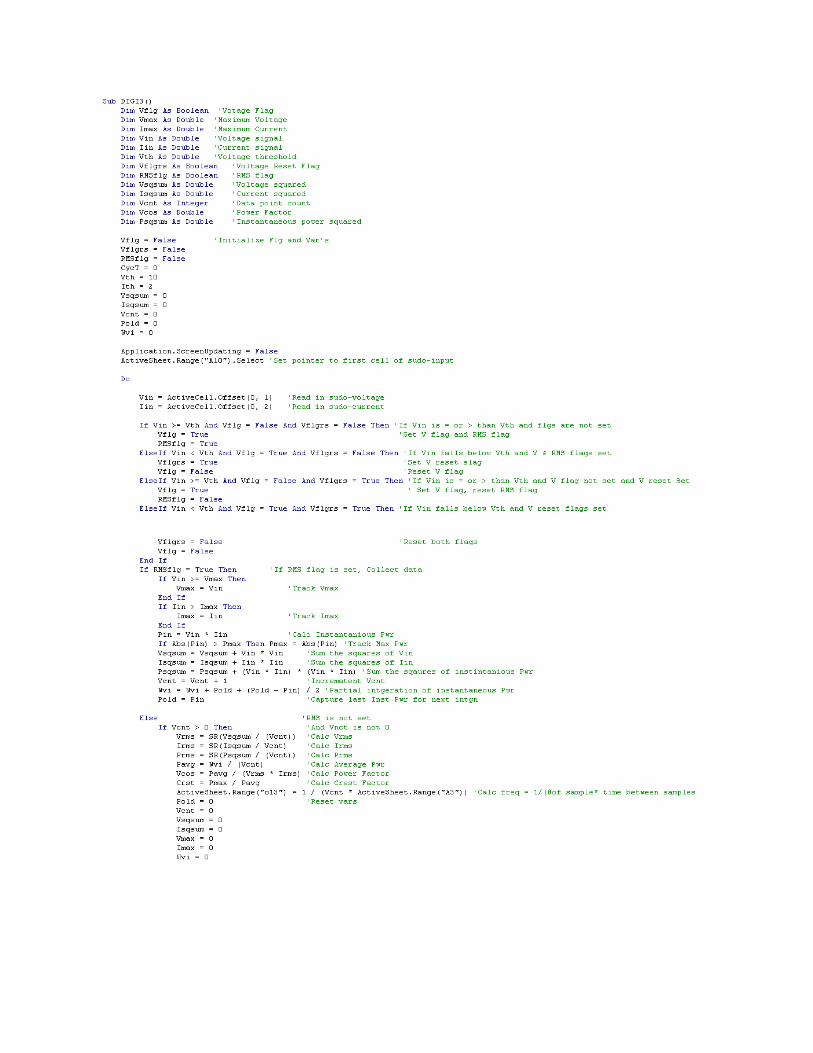
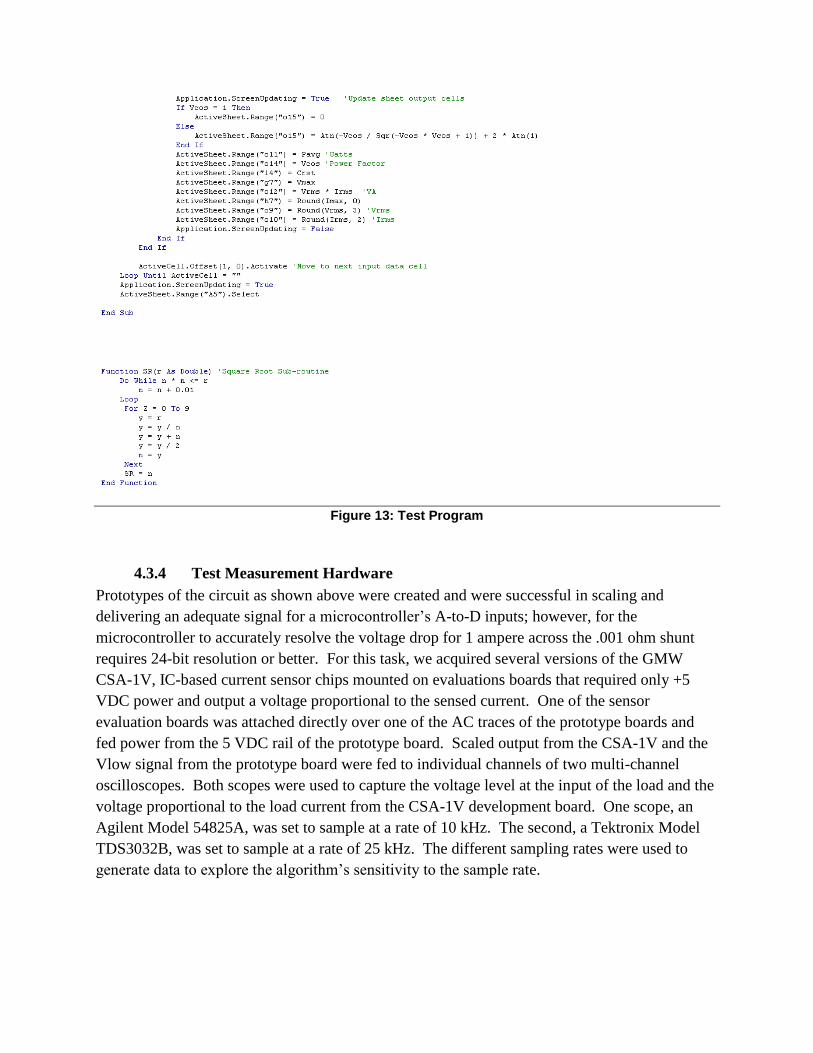
Figure 13: Test Program
4.3.4 Test Measurement Hardware
Prototypes of the circuit as shown above were created and were successful in scaling and
delivering an adequate signal for a microcontroller‟s A-to-D inputs; however, for the
microcontroller to accurately resolve the voltage drop for 1 ampere across the .001 ohm shunt
requires 24-bit resolution or better. For this task, we acquired several versions of the GMW
CSA-1V, IC-based current sensor chips mounted on evaluations boards that required only +5
VDC power and output a voltage proportional to the sensed current. One of the sensor
evaluation boards was attached directly over one of the AC traces of the prototype boards and
fed power from the 5 VDC rail of the prototype board. Scaled output from the CSA-1V and the
Vlow signal from the prototype board were fed to individual channels of two multi-channel
oscilloscopes. Both scopes were used to capture the voltage level at the input of the load and the
voltage proportional to the load current from the CSA-1V development board. One scope, an
Agilent Model 54825A, was set to sample at a rate of 10 kHz. The second, a Tektronix Model
TDS3032B, was set to sample at a rate of 25 kHz. The different sampling rates were used to
generate data to explore the algorithm‟s sensitivity to the sample rate.
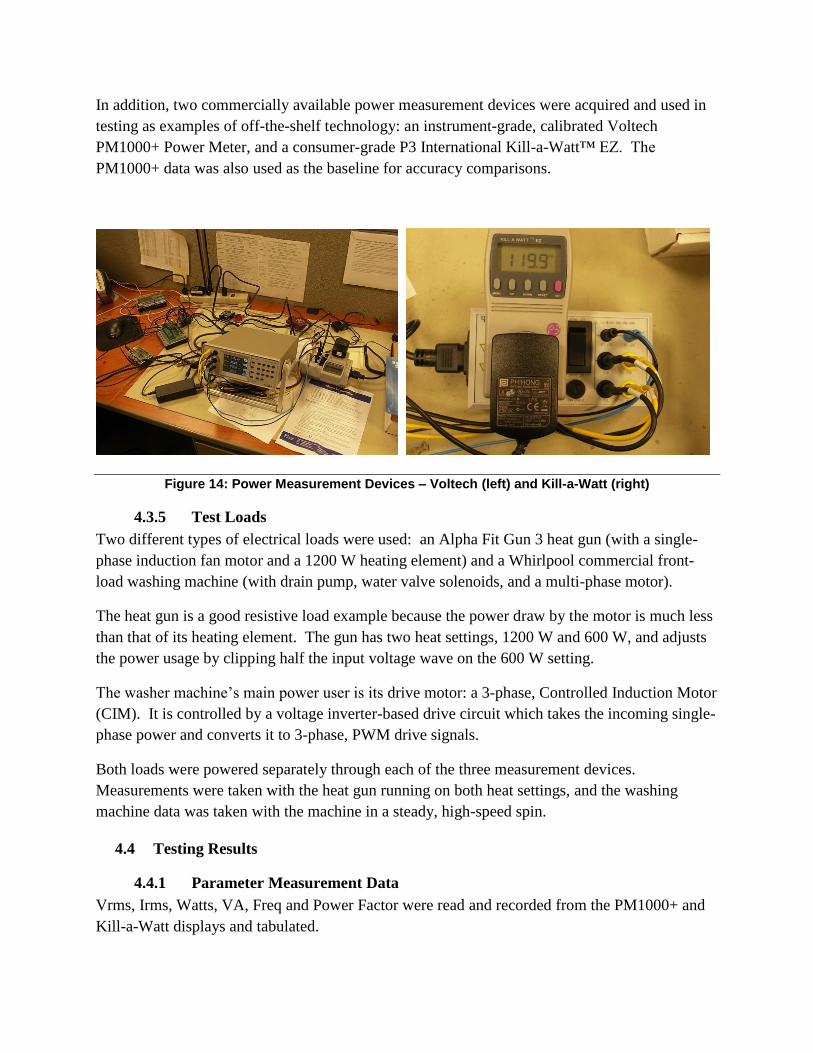
In addition, two commercially available power measurement devices were acquired and used in
testing as examples of off-the-shelf technology: an instrument-grade, calibrated Voltech
PM1000+ Power Meter, and a consumer-grade P3 International Kill-a-Watt™ EZ. The
PM1000+ data was also used as the baseline for accuracy comparisons.
Figure 14: Power Measurement Devices – Voltech (left) and Kill-a-Watt (right)
4.3.5 Test Loads
Two different types of electrical loads were used: an Alpha Fit Gun 3 heat gun (with a single-
phase induction fan motor and a 1200 W heating element) and a Whirlpool commercial front-
load washing machine (with drain pump, water valve solenoids, and a multi-phase motor).
The heat gun is a good resistive load example because the power draw by the motor is much less
than that of its heating element. The gun has two heat settings, 1200 W and 600 W, and adjusts
the power usage by clipping half the input voltage wave on the 600 W setting.
The washer machine‟s main power user is its drive motor: a 3-phase, Controlled Induction Motor
(CIM). It is controlled by a voltage inverter-based drive circuit which takes the incoming single-
phase power and converts it to 3-phase, PWM drive signals.
Both loads were powered separately through each of the three measurement devices.
Measurements were taken with the heat gun running on both heat settings, and the washing
machine data was taken with the machine in a steady, high-speed spin.
4.4 Testing Results
4.4.1 Parameter Measurement Data
Vrms, Irms, Watts, VA, Freq and Power Factor were read and recorded from the PM1000+ and
Kill-a-Watt displays and tabulated.
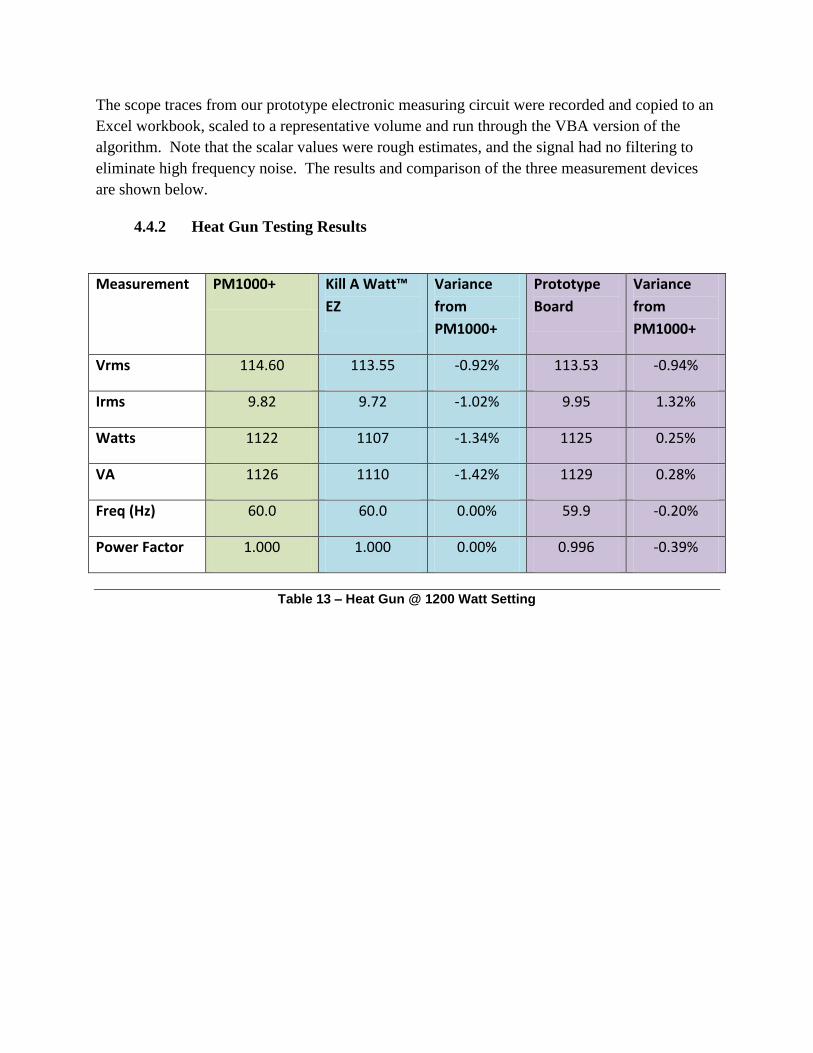
The scope traces from our prototype electronic measuring circuit were recorded and copied to an
Excel workbook, scaled to a representative volume and run through the VBA version of the
algorithm. Note that the scalar values were rough estimates, and the signal had no filtering to
eliminate high frequency noise. The results and comparison of the three measurement devices
are shown below.
4.4.2 Heat Gun Testing Results
Measurement PM1000+ Kill A Watt™
EZ
Variance
from
PM1000+
Prototype
Board
Variance
from
PM1000+
Vrms 114.60 113.55 -0.92% 113.53 -0.94%
Irms 9.82 9.72 -1.02% 9.95 1.32%
Watts 1122 1107 -1.34% 1125 0.25%
VA 1126 1110 -1.42% 1129 0.28%
Freq (Hz) 60.0 60.0 0.00% 59.9 -0.20%
Power Factor 1.000 1.000 0.00% 0.996 -0.39%
Table 13 – Heat Gun @ 1200 Watt Setting
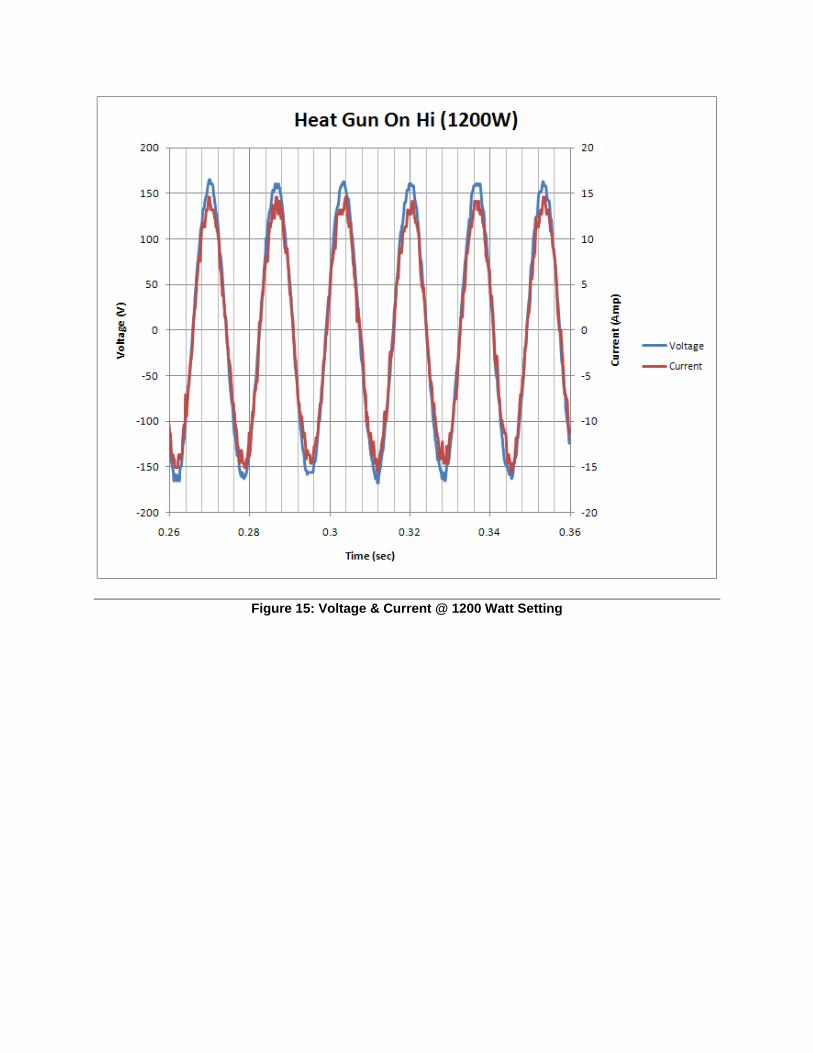
Figure 15: Voltage & Current @ 1200 Watt Setting
Measurement PM1000+ Kill A Watt™
EZ
Variance
from
PM1000+
Prototype
Board
Variance
from
PM1000+
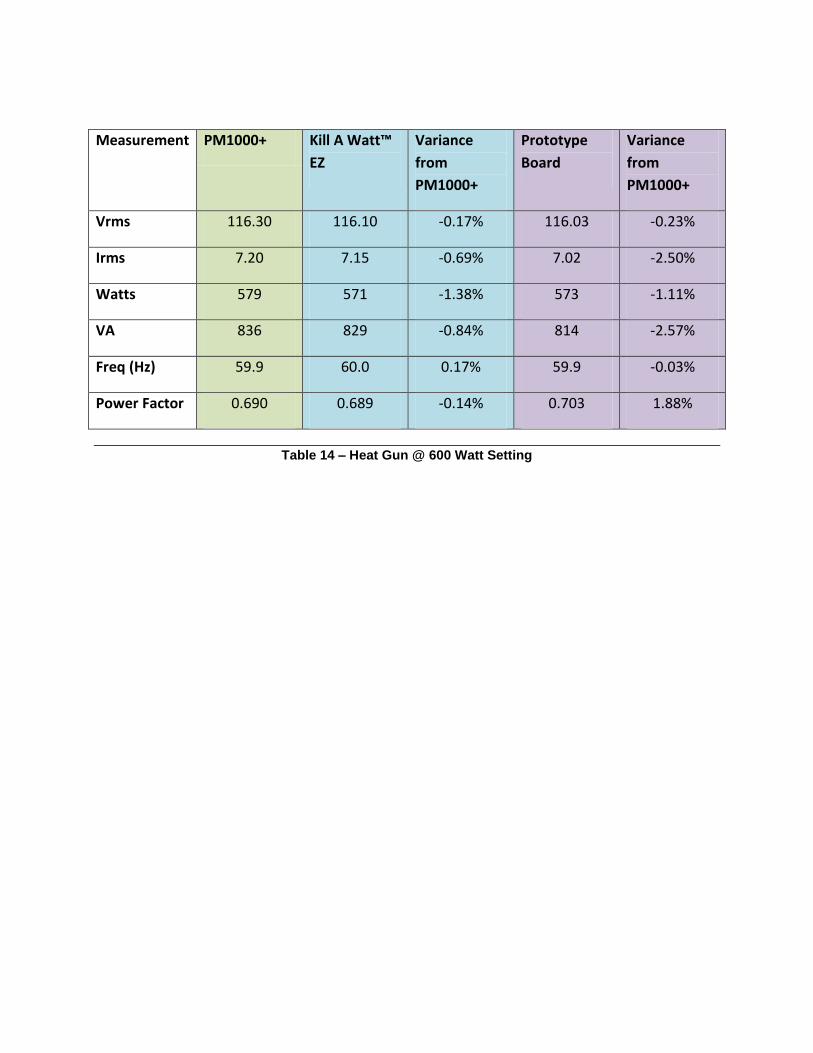
Vrms 116.30 116.10 -0.17% 116.03 -0.23%
Irms 7.20 7.15 -0.69% 7.02 -2.50%
Watts 579 571 -1.38% 573 -1.11%
VA 836 829 -0.84% 814 -2.57%
Freq (Hz) 59.9 60.0 0.17% 59.9 -0.03%
Power Factor 0.690 0.689 -0.14% 0.703 1.88%
Table 14 – Heat Gun @ 600 Watt Setting
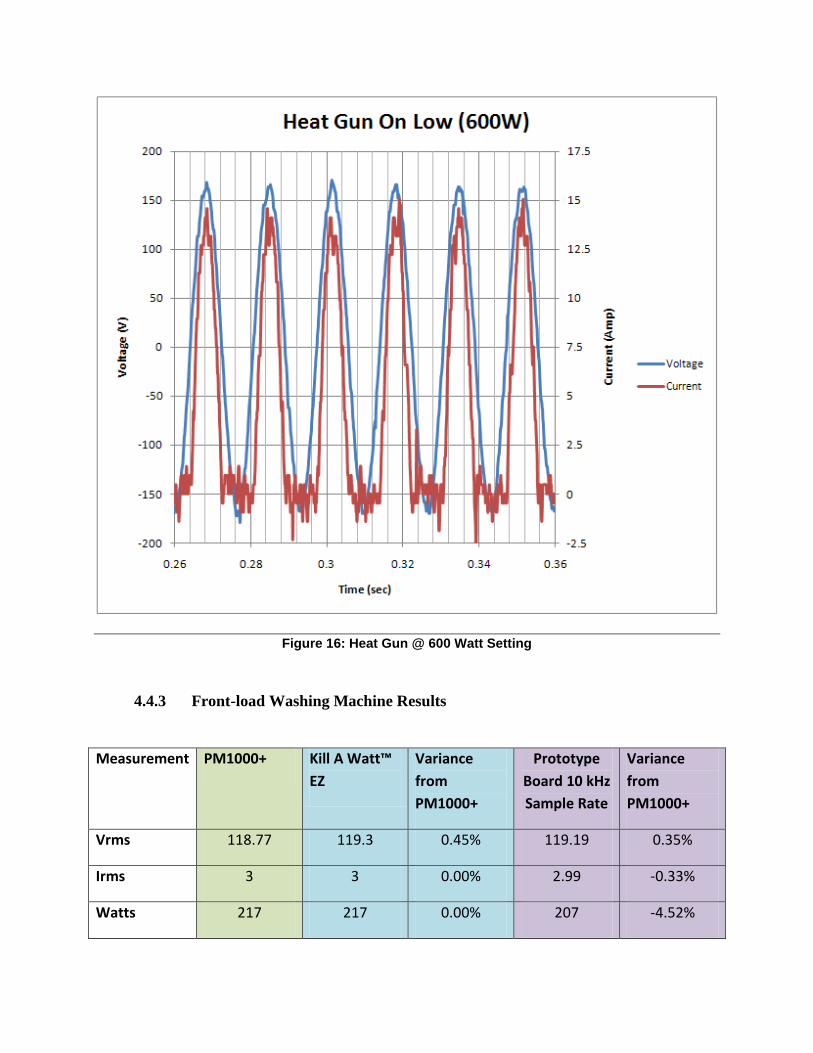
Figure 16: Heat Gun @ 600 Watt Setting
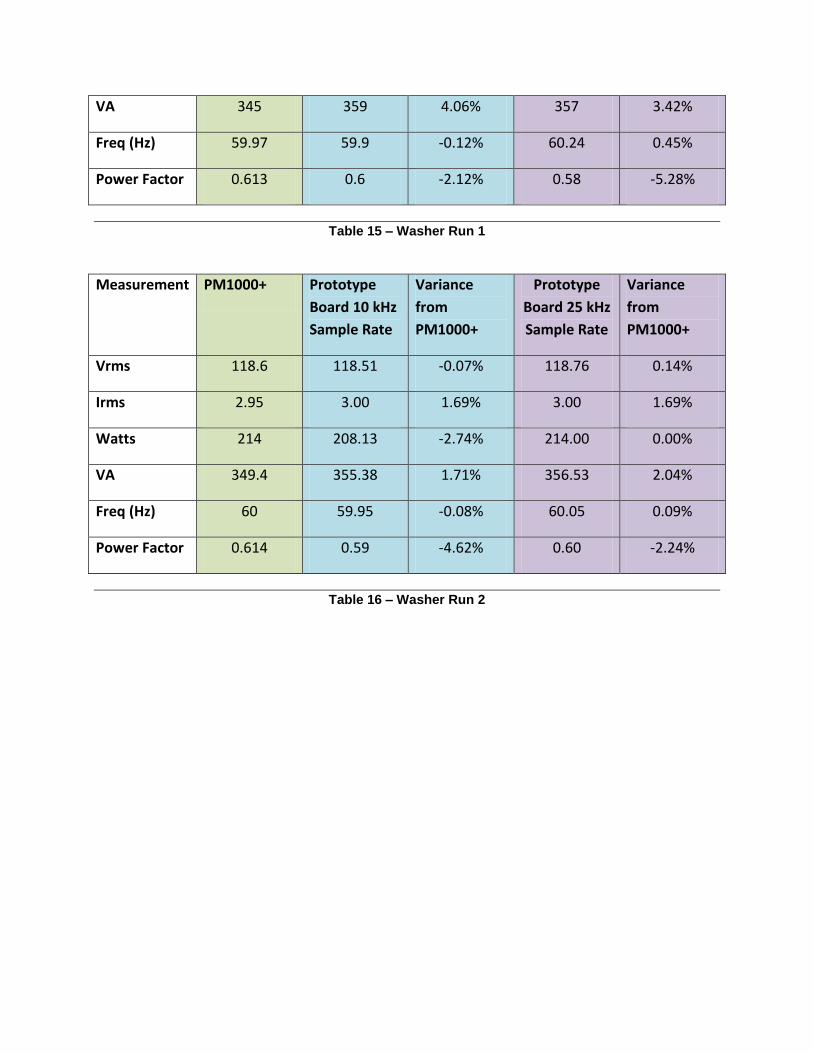
4.4.3 Front-load Washing Machine Results
Measurement PM1000+ Kill A Watt™
EZ
Variance
from
PM1000+
Prototype
Board 10 kHz
Sample Rate
Variance
from
PM1000+
Vrms 118.77 119.3 0.45% 119.19 0.35%
Irms 3 3 0.00% 2.99 -0.33%
Watts 217 217 0.00% 207 -4.52%
VA 345 359 4.06% 357 3.42%
Freq (Hz) 59.97 59.9 -0.12% 60.24 0.45%
Power Factor 0.613 0.6 -2.12% 0.58 -5.28%
Table 15 – Washer Run 1
Measurement PM1000+ Prototype
Board 10 kHz
Sample Rate
Variance
from
PM1000+
Prototype
Board 25 kHz
Sample Rate
Variance
from
PM1000+
Vrms 118.6 118.51 -0.07% 118.76 0.14%
Irms 2.95 3.00 1.69% 3.00 1.69%
Watts 214 208.13 -2.74% 214.00 0.00%
VA 349.4 355.38 1.71% 356.53 2.04%
Freq (Hz) 60 59.95 -0.08% 60.05 0.09%
Power Factor 0.614 0.59 -4.62% 0.60 -2.24%
Table 16 – Washer Run 2
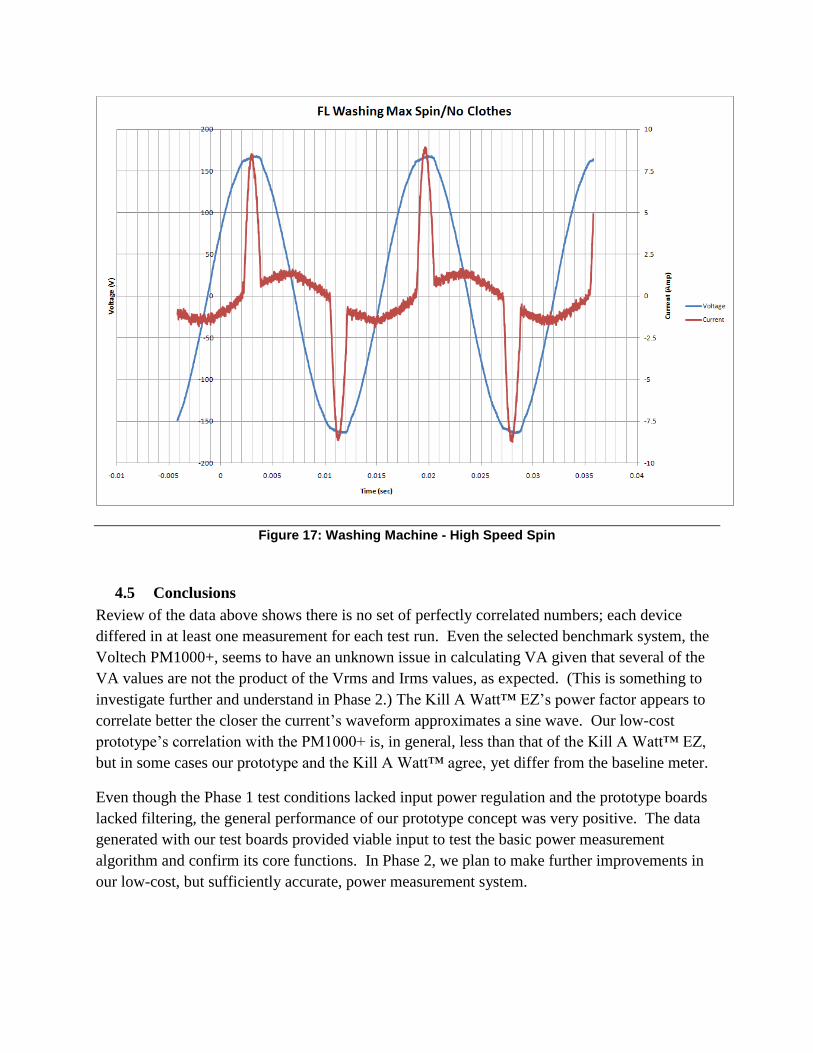
Figure 17: Washing Machine - High Speed Spin
4.5 Conclusions
Review of the data above shows there is no set of perfectly correlated numbers; each device
differed in at least one measurement for each test run. Even the selected benchmark system, the
Voltech PM1000+, seems to have an unknown issue in calculating VA given that several of the
VA values are not the product of the Vrms and Irms values, as expected. (This is something to
investigate further and understand in Phase 2.) The Kill A Watt™ EZ‟s power factor appears to
correlate better the closer the current‟s waveform approximates a sine wave. Our low-cost
prototype‟s correlation with the PM1000+ is, in general, less than that of the Kill A Watt™ EZ,
but in some cases our prototype and the Kill A Watt™ agree, yet differ from the baseline meter.
Even though the Phase 1 test conditions lacked input power regulation and the prototype boards
lacked filtering, the general performance of our prototype concept was very positive. The data
generated with our test boards provided viable input to test the basic power measurement
algorithm and confirm its core functions. In Phase 2, we plan to make further improvements in
our low-cost, but sufficiently accurate, power measurement system.

5 Task 5 – Appliance Load Control
5.1 Phase 1 Plan
Our Task 5 drivers were, as stated in our Phase 1 proposal‟s project narrative:
“… tests have been run with non-smart appliances including electric water heaters which were
cycled off during critical or peak capacity periods by the sensing and load control boxes installed
by a professional technician.”
“The current state of the art for implementing smart control of non-smart appliances is an
expensive proposition initiated by the utility provider, who then attempts to sign-up the customer
by offering a small monthly rebate in return for access to and control of the targeted appliance.
In terms of both dollars and „hassle‟, the costliness of this approach – an approach which
requires substantial advertising by the utility, industrial load control modules and
communications hardware, a smart electrical meter, professional installation services, and
scheduled access to the consumer‟s home – means that only the most power-hungry, hard-wired
electricity-consuming appliances are viable candidates, typically a central air conditioner unit or
an electric water heater.
“Appliance‟s of the „persistent-use‟ type are also good candidates for being de-energized in
response to a „critical curtailment‟ signal that might be received from a utility in response to an
urgent power supply situation. In some cases a minimum delay should be provided before the
appliance is powered again, something the smart controller should easily handle.”
“… new products that could be developed as a result of the proposed research … include smart
wall outlets, smart outlet power-monitoring adapters, smart load switches …”
“We will explore whether the same chipset can safely and effectively be coupled to control
devices capable of switching up to 30-Amp loads for disabling power to a connected household
appliance. This satisfies the time-of-use shifting means required for „persistent-use‟ appliance
types and becomes ideal if it could be accomplished in a fully integrated smart product such as a
new smart wall outlet.”
5.2 Overview
The present view of when a „peak electricity demand‟ condition is likely to occur seems fairly
simple and predictable: humid day … high temperature … afternoon. This allows for easy first-
generation solutions for peak avoidance to be somewhat managed by the energy-conscious
residential consumer, who could be both willing and able to:
reduce air conditioner use during the heat of the day
turn off unnecessary lights throughout the daylight hours
shift supper meal preparations to a later hour

delay dishwasher startup until later in the night
But this paradigm of successful peak demand avoidance will not necessarily be helpful in the
future, as illustrated by the following quote reported in the Houston Business Journal (Friday,
February 29, 2008) and referenced on the DOE‟s Office of Energy Delivery and Energy
Reliability website:
“An abrupt loss of 1,200 megawatts of wind energy production on Feb. 26 [2008]
caught the Electric Reliability Council of Texas Inc. by surprise and forced it to
declare emergency conditions underscores a critical policy issue, according to a key
industry official.
ERCOT said the sharp drop in production during a three-hour period – while overall
electricity loads were increasing – threatened the stability of the power grid and could
have caused rolling blackouts.
David Crane, President and CEO of New Jersey-based NRG Energy Inc., said the
incident underscores the most critical energy policy issue facing the power industry.
„If a system can go unstable in the winter because 1,500 MW of expected wind turns
into 400 MW wind and then fossil has to scramble to come online – and several of
our plants had to scramble to fill the gap – that's a big issue and there's going to be a
big debate,‟ Crane said.”
This emphasizes that fact that our new paradigm for interaction of home appliances with the
Smart Grid has to take into account not only sometimes-predictable peak electricity demand, but
also unpredictable peaks and valleys in the electricity supply: new renewable energy sources
like wind and solar produce new dynamics in the supply of energy – wind speed can change
unpredictably at times, and solar can be reduced in half by unpredictable clouds or reduced even
more by sudden (and maybe prolonged) airborne smoke and/or ash.
Furthermore, some energy service providers will not only be using various Demand Response
communications just to encourage consumers to reduce their electricity use during certain
dynamic time periods (to lower the peaks), they will also be using various Dynamic Pricing
programs that aim to correspondingly increase electricity usage by offering lowest rates during
other dynamic time periods (to raise the valleys) – and inside the home, only new, smart load
controllers will be able to help the millions of non-smart appliances participate in those
programs.

Residential consumers won‟t always be able to respond adequately to their utilities provider‟s
situation unless their appliances are supported by machine-to-machine communications. As
stated by the founder of GreenPeak Technologies, Cees Links (Remote Magazine,
October/November 2008):
“The first wireless wave is generally considered to be voice … person-to-person. The
second wireless wave was wireless data … computer-to-computer. The third wave of
wireless takes communications to the next step, connecting machines to machines … no
longer do you need a human in the middle, or a computer. Today there are several
available proprietary protocols that are promoted by individual companies. But to really
accelerate the acceptance of the third wave of wireless, we need industry standards.”
That last statement underscores why we appreciate the ongoing efforts of NIST in gathering the
standards-making communities together to speed up the creation of workable standards for Smart
Grid implementation, which inside the home (and closest to the appliance) looks to be the
coming Zigbee+HomePlug Smart Energy 2.0 communications standard.
Despite strong motivation by all constituents to maintain backwards compatibility with existing
protocols (including Zigbee Smart Energy 1.0 and HomePlug 1.0 protocols), this seems unlikely
to happen. Historically, even the Zigbee and HomePlug alliances, separately, were not able to
keep their latest versions (Zigbee Pro 2007 and HomePlug AV, respectively) backwards
compatible with their earlier versions because of the fundamental goals and requirements of the
latter systems. Similarly, we should expect that new Smart Grid interconnection goals and
requirements will push new security, communications, pricing and cross-functionality features
which will cause the emerging Smart Energy 2.0 standard to move beyond the capabilities of any
currently available “smart” devices. Quoting now from the Zigbee Alliance‟s Smart Energy
webpage:
“ZigBee Smart Energy version 2.0 will be IP-based and offer a variety of new features.
Given the important role ZigBee Smart Energy plays in the Smart Grid, the ZigBee
Alliance is taking unprecedented steps for an open organization engaged in standards
development.”
In summary, it appears that every existing residential communications device for smart energy
management is one step ahead of its time as far as compatibility with the coming, Smart Energy
2.0 standard and the corresponding Advanced Metering Infrastructure (AMI). More effort needs
to be made now in helping to finish the creation of the Smart Energy 2.0 standard in a way that
supports the needs of the various levels of home-centered smart devices, and more investment
needs to be made now in the development of products that will be compliant with the new
standard – including some new “multilingual” products that can bridge the communications gap
between the new and old generations.

Turning to the appliances now, unless and until the typical „persistent-use‟ appliance (one that
runs continually in the background unattended, such as a dehumidifier, pool pump, or deep
freezer) is mated with a controllable power-switching device sized adequately for its load
conditions, there can be no meaningful adaptation of its energy consumption in response to
temporary energy supply conditions.
These „persistent-use‟ appliances can be easily forgotten even in an energy-aware home because:
they are often located outside of the normal traffic path in a home: out-of-sight, out-
of-mind
though major contributors to the “baseline” energy consumption of home, they are
not revealed by an obvious spike in energy usage at a particular time of the day
they are not easily managed manually by a simple change in consumer habits; and
often they do not even have electronic controls or features
On the other hand, these appliances should be major candidates to the energy reductions goals of
home because:
they are always running, so even if ranking lower than other appliances in peak
energy consumption, they can be among the highest users on a monthly energy
consumption basis
They are also good candidates for being served by new smart devices designed to control them
because:
they are often older, longer-lived, and less energy efficient (yielding greater energy
saving potential)
they are not as likely to have smart models designed to replace them at similar cost to
the consumer (the major appliance manufacturers seem mainly focused on adding
smarts to their existing electronically-controlled „process-oriented‟ models)
they can typically be cycled while unattended without adverse consequence (suitable
for automated control)
they often require lower peak switching currents than some of the „process-oriented‟
appliance types
5.3 Load Control Research Summary
The primary power switching concepts can broadly be categorized, as detailed below, into two
primary groups: Electro-mechanical Relays and Solid State Thyristors.

5.3.1 Electro-mechanical Relays
A relay is similar to a switch. It turns ON or OFF an electrical load such as a light or an
appliance. It has two primary parts – the coil and the contacts. The coil is a spool of wire with a
core that is mechanically coupled to the electrical contacts that are connected to the load. When
the coil is energized, the mechanical coupling moves and causes the electrical contact to either
close or open, thereby controlling the load. The electrical contacts are sized according to the
amount of electrical current passing through the load.
Some advantages of relays are:
1) The coil (or control signal) is isolated from the relay contacts switching the load.
2) The coil can be designed to operate at a variety of different voltages.
3) The contact resistance and resulting heat of relay contacts is very low and is far less than
a thyristor.
4) When a relay coil is de-energized, the load is normally off.
5) When the relay contacts are open, there is normally no load voltage or current, making
them a good choice for “fail safe” applications.
6) Relays are normally less expensive than comparable thyristors for larger loads.
Some disadvantages of relays are:
1) The coil may draw a substantial amount of current – depending on the size of the load
contacts.
2) The physical size of power relays can be quite large.
3) Relay coils can produce a fair amount of heat and normally need to be energized to
operate the load.
5.3.2 Solid State Thyristors
A thyristor is a solid state switch and is typically configured as either an SCR or a Triac. These
devices typically have three leads – the anode, the cathode and the gate. The load and voltage
source is between the anode and cathode. The control signal is connected between the gate and
the cathode. When SCRs or Triacs are turned ON, there is a small voltage drop across the device
which produces heat. This heat must be dissipated, typically through a heat sink, in order for the
device to function properly.
1) SCRs:
When a signal turns ON an SCR, it stays ON until one of two things happen – either the
circuit that the SCR is controlling stops drawing sufficient current to keep the SCR
conducting, or a different signal is sent to the SCR to turn it off. On the other hand, a
relay will stay ON only as long as the signal telling it to turn ON is present.
2) Triacs:

A Triac is essentially a bi-directional SCR; however, a Triac used in an AC circuit will
reach one of the turn-off conditions “automatically”, since the circuit is AC. The circuit
the Triac controls will stop drawing current when the AC sine wave reaches 0 volts.
Some advantages of thyristors are:
1) There are no moving parts to wear out.
2) They are smaller than relays for smaller load currents.
3) Lower signal switching currents and voltages are required compared to relays.
Some disadvantages of thyristors are:
1) A minimum load current must be present for proper switching operation.
2) Heat must be properly dissipated from the device housing.
3) The proper circuit design depends significantly upon the type of load being switched.
4) Special care must be used when switching inductive loads.
5) A small leakage current/voltage may be present even when the device is off.
6) A common failure mode for Triacs is to fail ON when subjected to excessive current.
Highly inductive loads release a voltage spike when turned OFF that can cause a Triac to re-
trigger and switch back ON unintentionally. To prevent this, a “snubber” circuit or a special
class of “snubber-less” Triacs is used. Examples of these are marketed under the trade names
Alternistor (Teccor/Littelfuse), Snubberless (ST Microelectronics) and Hi-Com (NXP). This
improvement is achieved at the expense of the ability to trigger the device in the 4th quadrant
(negative voltage and positive gate current); however, this is usually no problem because this
trigger mode is seldom used since even normal Triacs are least sensitive there.
5.4 Residential Appliance Load Analysis
Table 17 below summarizes the additional research we accomplished, compiling a list of
residential electrical appliances and categorizing them by rated voltage, maximum rated
operating current, power plug type, and suitable load control method. This helps us understand
which various load control product configurations can be marketed towards which type of
appliances.
Wattage Rated Max Load Control
Methods
Range
(Running)
AC
Volts
AC
Amps Plug Type Relays Triacs
Air Cleaner
(Electronic) 40 - 50 120 0.42 120/15A OK OK
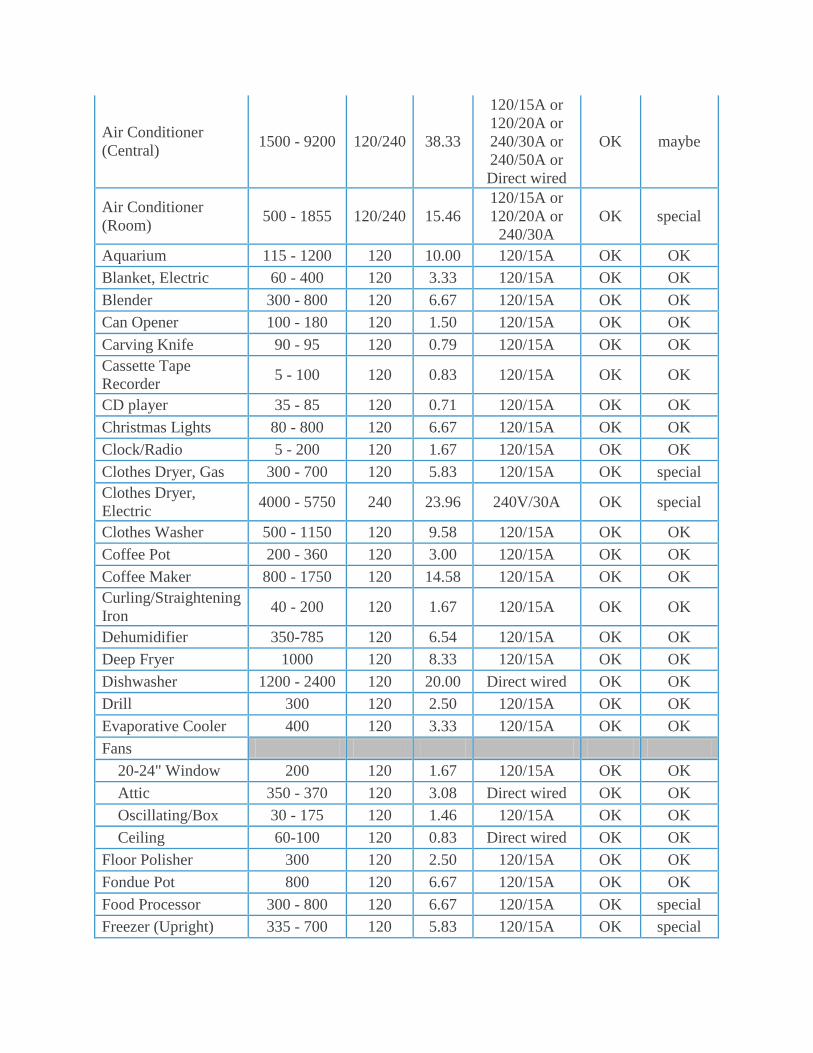
Air Conditioner
(Central) 1500 - 9200 120/240 38.33
120/15A or
120/20A or
240/30A or
240/50A or
Direct wired
OK maybe
Air Conditioner
(Room) 500 - 1855 120/240 15.46
120/15A or
120/20A or
240/30A
OK special
Aquarium 115 - 1200 120 10.00 120/15A OK OK
Blanket, Electric 60 - 400 120 3.33 120/15A OK OK
Blender 300 - 800 120 6.67 120/15A OK OK
Can Opener 100 - 180 120 1.50 120/15A OK OK
Carving Knife 90 - 95 120 0.79 120/15A OK OK
Cassette Tape
Recorder 5 - 100 120 0.83 120/15A OK OK
CD player 35 - 85 120 0.71 120/15A OK OK
Christmas Lights 80 - 800 120 6.67 120/15A OK OK
Clock/Radio 5 - 200 120 1.67 120/15A OK OK
Clothes Dryer, Gas 300 - 700 120 5.83 120/15A OK special
Clothes Dryer,
Electric 4000 - 5750 240 23.96 240V/30A OK special
Clothes Washer 500 - 1150 120 9.58 120/15A OK OK
Coffee Pot 200 - 360 120 3.00 120/15A OK OK
Coffee Maker 800 - 1750 120 14.58 120/15A OK OK
Curling/Straightening
Iron 40 - 200 120 1.67 120/15A OK OK
Dehumidifier 350-785 120 6.54 120/15A OK OK
Deep Fryer 1000 120 8.33 120/15A OK OK
Dishwasher 1200 - 2400 120 20.00 Direct wired OK OK
Drill 300 120 2.50 120/15A OK OK
Evaporative Cooler 400 120 3.33 120/15A OK OK
Fans
20-24" Window 200 120 1.67 120/15A OK OK
Attic 350 - 370 120 3.08 Direct wired OK OK
Oscillating/Box 30 - 175 120 1.46 120/15A OK OK
Ceiling 60-100 120 0.83 Direct wired OK OK
Floor Polisher 300 120 2.50 120/15A OK OK
Fondue Pot 800 120 6.67 120/15A OK OK
Food Processor 300 - 800 120 6.67 120/15A OK special
Freezer (Upright) 335 - 700 120 5.83 120/15A OK special
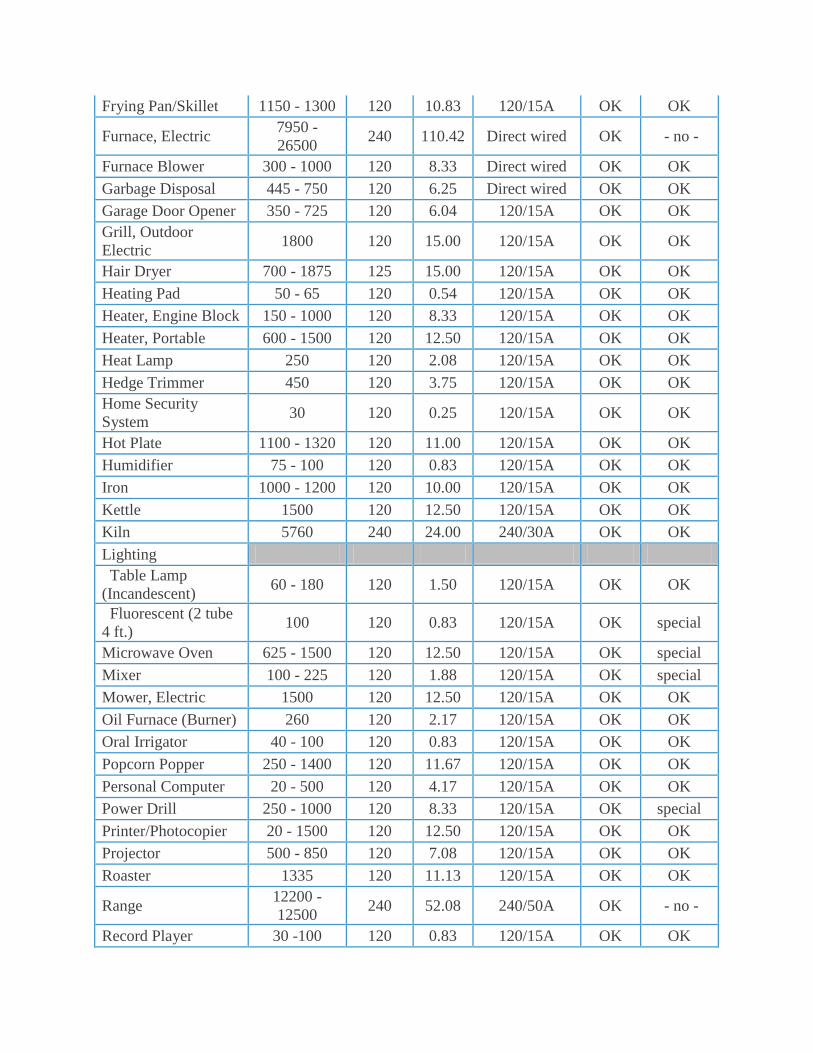
Frying Pan/Skillet 1150 - 1300 120 10.83 120/15A OK OK
Furnace, Electric 7950 -
26500 240 110.42 Direct wired OK - no -
Furnace Blower 300 - 1000 120 8.33 Direct wired OK OK
Garbage Disposal 445 - 750 120 6.25 Direct wired OK OK
Garage Door Opener 350 - 725 120 6.04 120/15A OK OK
Grill, Outdoor
Electric 1800 120 15.00 120/15A OK OK
Hair Dryer 700 - 1875 125 15.00 120/15A OK OK
Heating Pad 50 - 65 120 0.54 120/15A OK OK
Heater, Engine Block 150 - 1000 120 8.33 120/15A OK OK
Heater, Portable 600 - 1500 120 12.50 120/15A OK OK
Heat Lamp 250 120 2.08 120/15A OK OK
Hedge Trimmer 450 120 3.75 120/15A OK OK
Home Security
System 30 120 0.25 120/15A OK OK
Hot Plate 1100 - 1320 120 11.00 120/15A OK OK
Humidifier 75 - 100 120 0.83 120/15A OK OK
Iron 1000 - 1200 120 10.00 120/15A OK OK
Kettle 1500 120 12.50 120/15A OK OK
Kiln 5760 240 24.00 240/30A OK OK
Lighting
Table Lamp
(Incandescent) 60 - 180 120 1.50 120/15A OK OK
Fluorescent (2 tube
4 ft.) 100 120 0.83 120/15A OK special
Microwave Oven 625 - 1500 120 12.50 120/15A OK special
Mixer 100 - 225 120 1.88 120/15A OK special
Mower, Electric 1500 120 12.50 120/15A OK OK
Oil Furnace (Burner) 260 120 2.17 120/15A OK OK
Oral Irrigator 40 - 100 120 0.83 120/15A OK OK
Popcorn Popper 250 - 1400 120 11.67 120/15A OK OK
Personal Computer 20 - 500 120 4.17 120/15A OK OK
Power Drill 250 - 1000 120 8.33 120/15A OK special
Printer/Photocopier 20 - 1500 120 12.50 120/15A OK OK
Projector 500 - 850 120 7.08 120/15A OK OK
Roaster 1335 120 11.13 120/15A OK OK
Range 12200 -
12500 240 52.08 240/50A OK - no -
Record Player 30 -100 120 0.83 120/15A OK OK
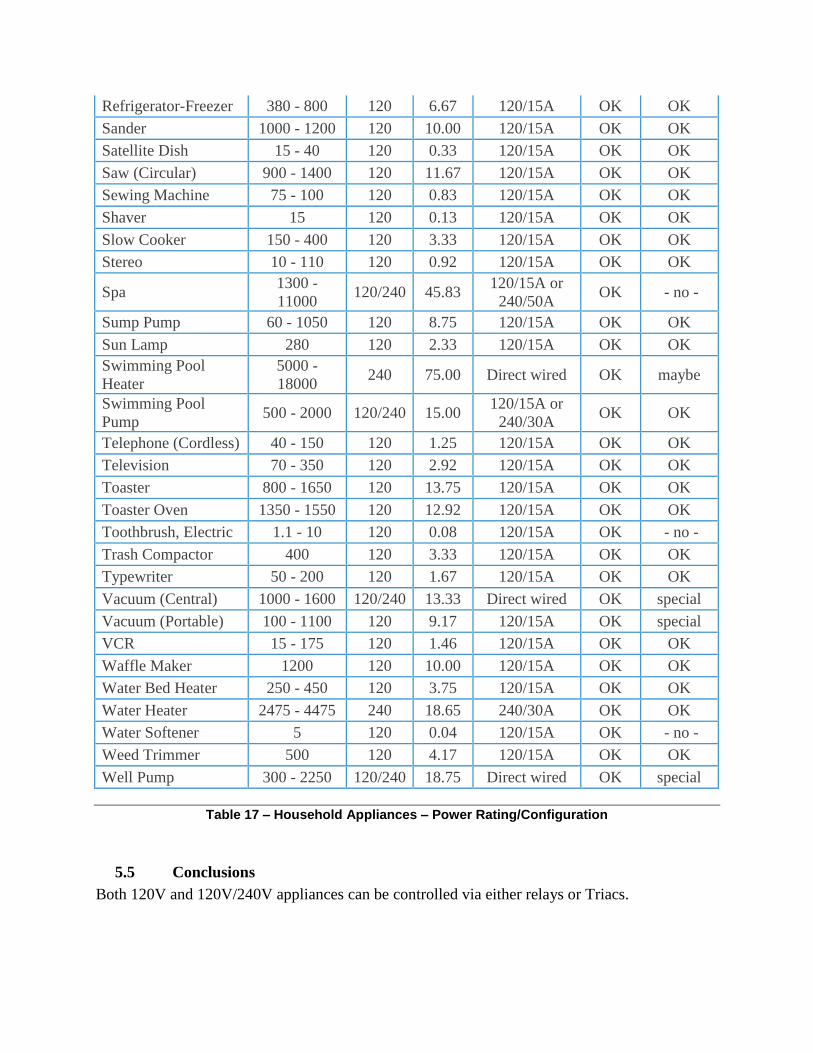
Refrigerator-Freezer 380 - 800 120 6.67 120/15A OK OK
Sander 1000 - 1200 120 10.00 120/15A OK OK
Satellite Dish 15 - 40 120 0.33 120/15A OK OK
Saw (Circular) 900 - 1400 120 11.67 120/15A OK OK
Sewing Machine 75 - 100 120 0.83 120/15A OK OK
Shaver 15 120 0.13 120/15A OK OK
Slow Cooker 150 - 400 120 3.33 120/15A OK OK
Stereo 10 - 110 120 0.92 120/15A OK OK
Spa 1300 -
11000 120/240 45.83
120/15A or
240/50A OK - no -
Sump Pump 60 - 1050 120 8.75 120/15A OK OK
Sun Lamp 280 120 2.33 120/15A OK OK
Swimming Pool
Heater
5000 -
18000 240 75.00 Direct wired OK maybe
Swimming Pool
Pump 500 - 2000 120/240 15.00
120/15A or
240/30A OK OK
Telephone (Cordless) 40 - 150 120 1.25 120/15A OK OK
Television 70 - 350 120 2.92 120/15A OK OK
Toaster 800 - 1650 120 13.75 120/15A OK OK
Toaster Oven 1350 - 1550 120 12.92 120/15A OK OK
Toothbrush, Electric 1.1 - 10 120 0.08 120/15A OK - no -
Trash Compactor 400 120 3.33 120/15A OK OK
Typewriter 50 - 200 120 1.67 120/15A OK OK
Vacuum (Central) 1000 - 1600 120/240 13.33 Direct wired OK special
Vacuum (Portable) 100 - 1100 120 9.17 120/15A OK special
VCR 15 - 175 120 1.46 120/15A OK OK
Waffle Maker 1200 120 10.00 120/15A OK OK
Water Bed Heater 250 - 450 120 3.75 120/15A OK OK
Water Heater 2475 - 4475 240 18.65 240/30A OK OK
Water Softener 5 120 0.04 120/15A OK - no -
Weed Trimmer 500 120 4.17 120/15A OK OK
Well Pump 300 - 2250 120/240 18.75 Direct wired OK special
Table 17 – Household Appliances – Power Rating/Configuration
5.5 Conclusions
Both 120V and 120V/240V appliances can be controlled via either relays or Triacs.
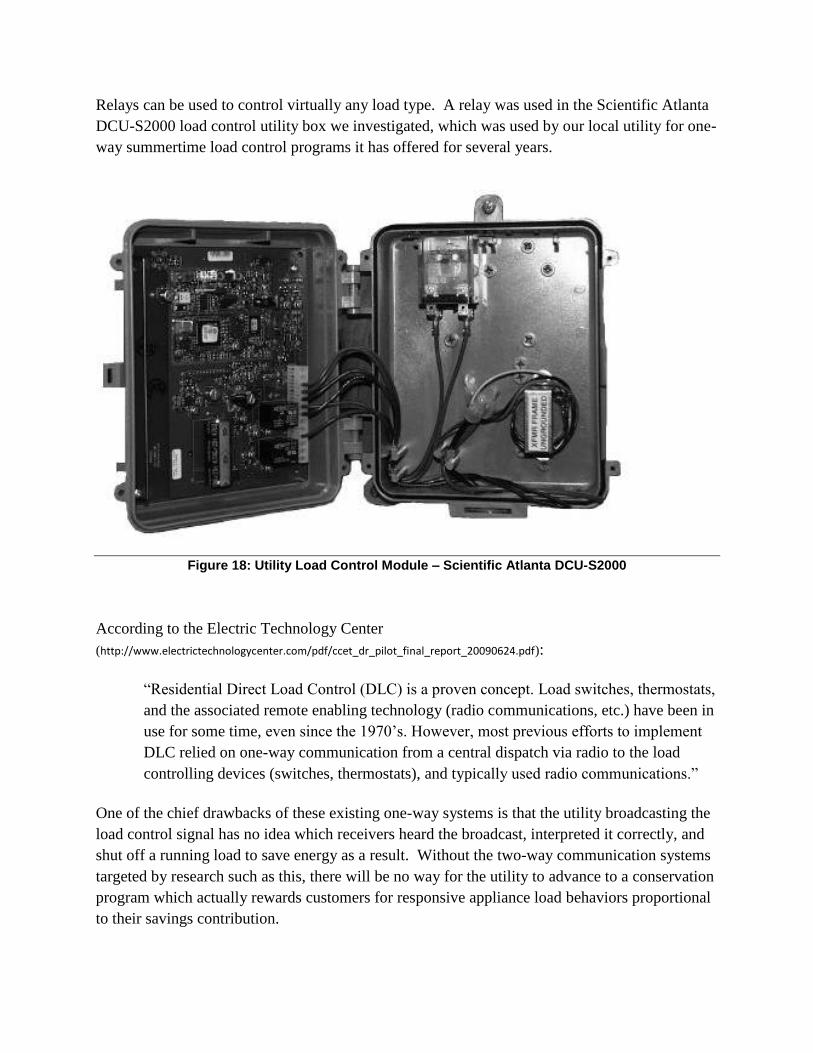
Relays can be used to control virtually any load type. A relay was used in the Scientific Atlanta
DCU-S2000 load control utility box we investigated, which was used by our local utility for one-
way summertime load control programs it has offered for several years.
Figure 18: Utility Load Control Module – Scientific Atlanta DCU-S2000
According to the Electric Technology Center
(http://www.electrictechnologycenter.com/pdf/ccet_dr_pilot_final_report_20090624.pdf):
“Residential Direct Load Control (DLC) is a proven concept. Load switches, thermostats,
and the associated remote enabling technology (radio communications, etc.) have been in
use for some time, even since the 1970‟s. However, most previous efforts to implement
DLC relied on one-way communication from a central dispatch via radio to the load
controlling devices (switches, thermostats), and typically used radio communications.”
One of the chief drawbacks of these existing one-way systems is that the utility broadcasting the
load control signal has no idea which receivers heard the broadcast, interpreted it correctly, and
shut off a running load to save energy as a result. Without the two-way communication systems
targeted by research such as this, there will be no way for the utility to advance to a conservation
program which actually rewards customers for responsive appliance load behaviors proportional
to their savings contribution.

Thyristors (Triacs) must be designed around a particular class of load types (ie: resistive heaters,
incandescent lights, inductive motors, etc.), and the load current must exceed a minimum
threshold (e.g., 0.1 Amps) for successful control.
Microcontroller chipsets like the Freescale MC13213 and the Texas Instruments CC2530
chipsets are easily capable of controlling both relays and Triacs with some custom interface
circuits, and the Springboard Engineering team has substantial experience designing as well as
qualifying (through reliability tests and failure-rate analyses) load-switching control systems for
a wide variety of appliance loads.
In Phase 2, we recommend testing and qualifying a number of candidate relays with a variety of
heavy load types based on the product class of appliances for which Springboard Engineering
targets prototyping and then commercializing load control solutions.
We have determined that the chipsets have outputs (see Table 18 below) sufficient for interfacing
with circuitry to drive relays that can switch 30-Amp loads, and have met the objectives for
Phase 1.
Feature TI CC2530 Freescale MC13213 ROM 32K/64K/128K/256K Flash 16K/32K/60K Flash
RAM 8K 1K/2K/4K (respectively)
RF chip 2.4Ghz, 802.15.4 transceiver 2.4Ghz, 802.15.4 transceiver
Package 6mm X 6mm QFN,40-pin 9mm X 9mm LGA,71-pin
ADC 12-bit, 8 channels 10-bit, 8 channels
I/O 19 GPIO, 4 ma 24 GPIO, 2 ma
2 GPIO, 20 ma 8 GPIO, 10 ma
uC chip core Hi-perf, Low-power 8051 Hi-perf, Low-power HCS08
Voltage 2 - 3.6V 2.08 - 3.6V
Active mode
current (at 3V) 3.4 ma at 16Mhz, CPU but no RF 6.6 ma at 16Mhz, CPU but no RF
6.5 ma at 32Mhz, CPU but no RF
Modem current (at
2.7V)
24.3 ma at 32Mhz, no CPU, max
RX 37 ma at 16Mhz, no CPU, max RX
33.5 ma at 32Mhz, no CPU max
TX
Low power mode
current (at 3V) .2 ma at 32.768Khz, Quick wakeup .56 ma at 2Mhz, Quick wakeup
1 ua at 32.768Khz, Sleep timer .98 ua at 1Khz, RTI wakeup
.4 ua, External interrupt .56 ua, External interrupt

Serial Ports 2 SPI/UART, full duplex 2 SCI, full duplex
Security Coprocessor plus integrated chipset Integrated chipset
Timers One 8-bit, two 16-bit One 4-channel, one 1-channel
Sense inputs Battery
Temperature
Table 18 – Wireless Microcontroller Chipsets Compared

6 Task 6 – User Interface, Standby Power and Future Expectations
6.1 Phase 1 Plan
Our Task 6 goals and expectations were, as stated in our Phase 1 proposal‟s project narrative:
“In the end, while some future smart-grid compatible process-type appliances will be able to
reduce their operating power for certain periods of time while remaining active with little
customer inconvenience (such as the smart clothes dryer which continues to run with its heater
briefly de-energized in response to a critical power event), the not-grid-ready process-type
appliances will serve best by being provided the means to indicate to the end user whether the
current time is a „green‟ (low-cost), „yellow‟ (mid-cost or shortly becoming high-cost), or „red‟
(high-cost) electricity-use time period, while still allowing that user to decide whether that
appliance should be operated at that time. “
“What would be desirable by both the utility and the consumer would be an alternative solution
for non-smart-grid-compatible appliances, having the following characteristics:
Consumer-initiated and governed (limited utility or government coaxing needed to
market or sell the energy cost-saving device)
Installable by either a novice or do-it-yourselfer (eliminating professional installer/access
requirement)
Costing an order of magnitude less than the current utility-driven solutions (providing a
breakthrough-level implementation-savings advantage)
Consuming not more than a small fraction of the energy to operate as compared to the
expected peak energy savings (minimal energy use „overhead‟)
Useful with a broad scope of household appliance types (maximizing the collective peak-
energy savings benefit opportunities)”
“Our expectation is that as a result of this research we will succeed in identifying and proving the
feasibility of at least one low-cost chipset that will be capable of all of the following:
Operating from any in-house power line or outlet using very little power
Communicating two-way with AMI signals from various near or far sources
Receiving accurate current time and day information (for time-of-day usage shifting) from a
standard source using wireless one-way communications
Understanding and processing time-of-day rate and period information and peak-demand
signals
Controlling outputs to a separate (or integrated, say, as in a new smart outlet product) load-
control module (especially for „persistent-use‟ appliance types)
Controlling indicators to provide feedback to the end user regarding the energy cost time
period currently active (especially for „process-oriented‟ appliance types)”
“We expect this chipset to be adaptable to control a number of different commercially
marketable smart-controller-based devices for non-smart appliances. Further research and

development of these smart controllers along with a Commercialization Plan is expected to
become part of the Phase II effort.”
6.2 Overview
The consumer is going to experience increasing pressure to modify their energy usage. This
pressure will flow down from federal and/or state incentivized mandates on electrical utilities
and electricity distributor/management companies to create retail programs for residential
customers that reduce peak demand usage by a certain percentage. These electricity providers
will in turn provide options to consumers that include both economic incentives and penalties for
peak load reductions, motivating these various electricity users to avoid additional cost increases
by:
a small amount - by signing up for a utility-managed demand response summer load-
shedding program for central air conditioners and/or electric water heaters,
a medium amount - by changing their family usage habits to conserve or shift
consumption by their appliances, or
a large amount - by investing in new smart products which help them easily understand
their energy usage at the appliance level and help automate the peak-avoidance, load-
shifting process for them.
There are a number of different programs that different utilities will likely be using to implement
peak-limiting, energy-leveling strategies for residences. One of the greatest challenges will be
the increasing difficulty in accurately projecting future demand once a) energy prices are
progressively deregulated in favor of the energy distributors‟ commitments to implement peak-
reducing programs of some sort, and b) energy brokers increase implementation of various types
of energy-shifting schemes, avoiding (and creating) new peak time periods much more dynamic
that any current models show.
With some of these programs, the only way for residential customers to successfully adapt their
variable energy use to these increasingly unpredictable low-cost time periods will be to have load
control married to their energy-using appliances and responsive to the energy provider‟s demand
response communications through the home information gateway (smart meter or internet hot
spot).
6.1 Research Summary
The current residential load monitor/control solutions available on the market today are not
based on the winning in-home communications standard for the Smart Grid, Zigbee Smart
Energy 2.0, so newer solutions will need to be. Current demand response pilot projects are
forerunners, but do not have the devices needed by the bill-paying residential customers outlined
above; especially not those needed by customers with limited means to purchase the coming
“smart” appliances and whole-house management systems.
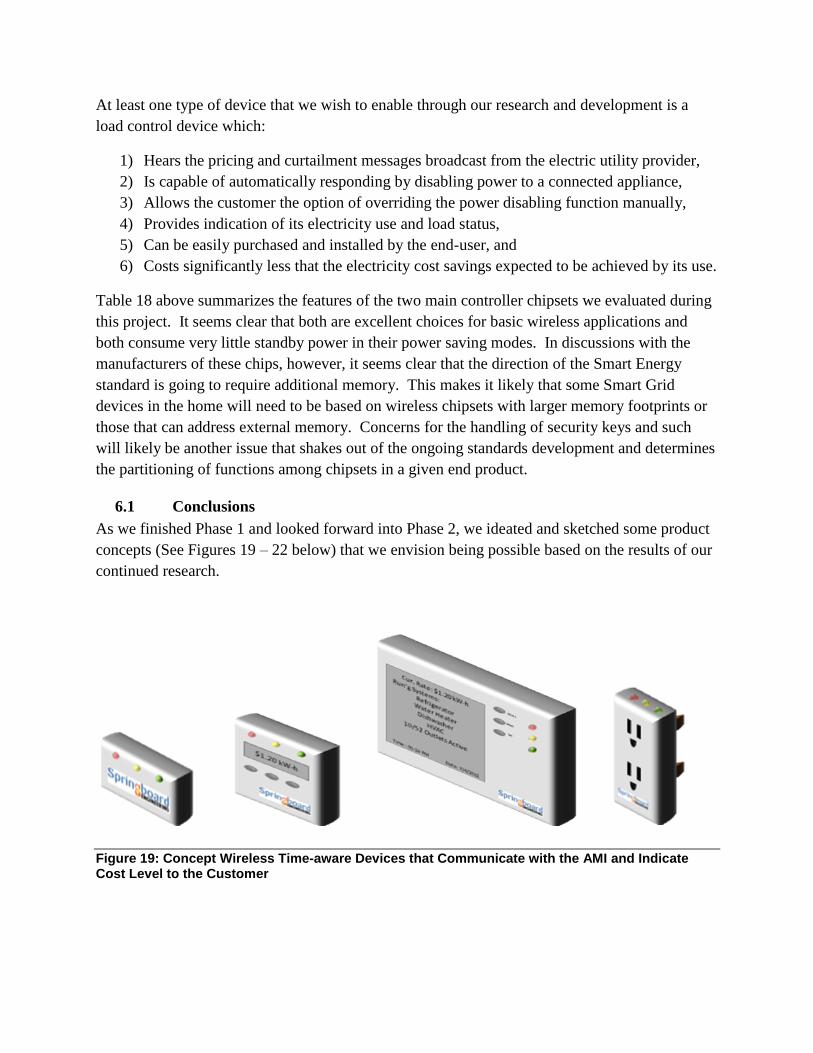
At least one type of device that we wish to enable through our research and development is a
load control device which:
1) Hears the pricing and curtailment messages broadcast from the electric utility provider,
2) Is capable of automatically responding by disabling power to a connected appliance,
3) Allows the customer the option of overriding the power disabling function manually,
4) Provides indication of its electricity use and load status,
5) Can be easily purchased and installed by the end-user, and
6) Costs significantly less that the electricity cost savings expected to be achieved by its use.
Table 18 above summarizes the features of the two main controller chipsets we evaluated during
this project. It seems clear that both are excellent choices for basic wireless applications and
both consume very little standby power in their power saving modes. In discussions with the
manufacturers of these chips, however, it seems clear that the direction of the Smart Energy
standard is going to require additional memory. This makes it likely that some Smart Grid
devices in the home will need to be based on wireless chipsets with larger memory footprints or
those that can address external memory. Concerns for the handling of security keys and such
will likely be another issue that shakes out of the ongoing standards development and determines
the partitioning of functions among chipsets in a given end product.
6.1 Conclusions
As we finished Phase 1 and looked forward into Phase 2, we ideated and sketched some product
concepts (See Figures 19 – 22 below) that we envision being possible based on the results of our
continued research.
Figure 19: Concept Wireless Time-aware Devices that Communicate with the AMI and Indicate Cost Level to the Customer
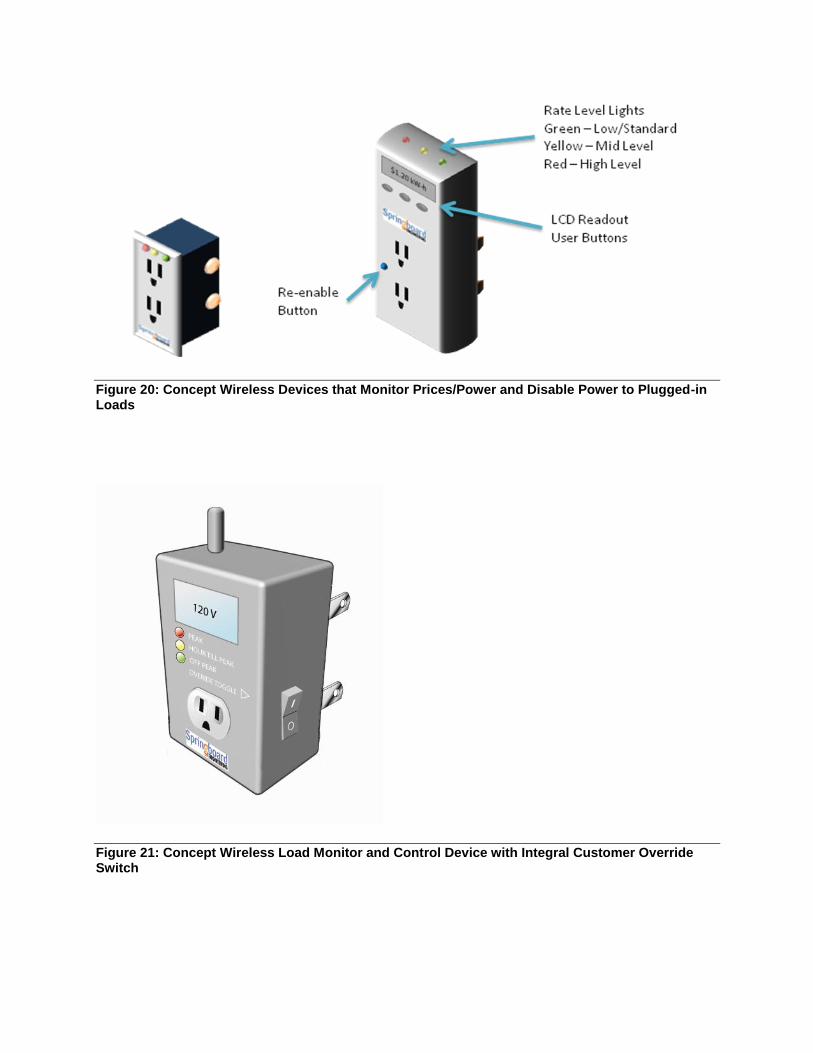
Figure 20: Concept Wireless Devices that Monitor Prices/Power and Disable Power to Plugged-in Loads
Figure 21: Concept Wireless Load Monitor and Control Device with Integral Customer Override Switch
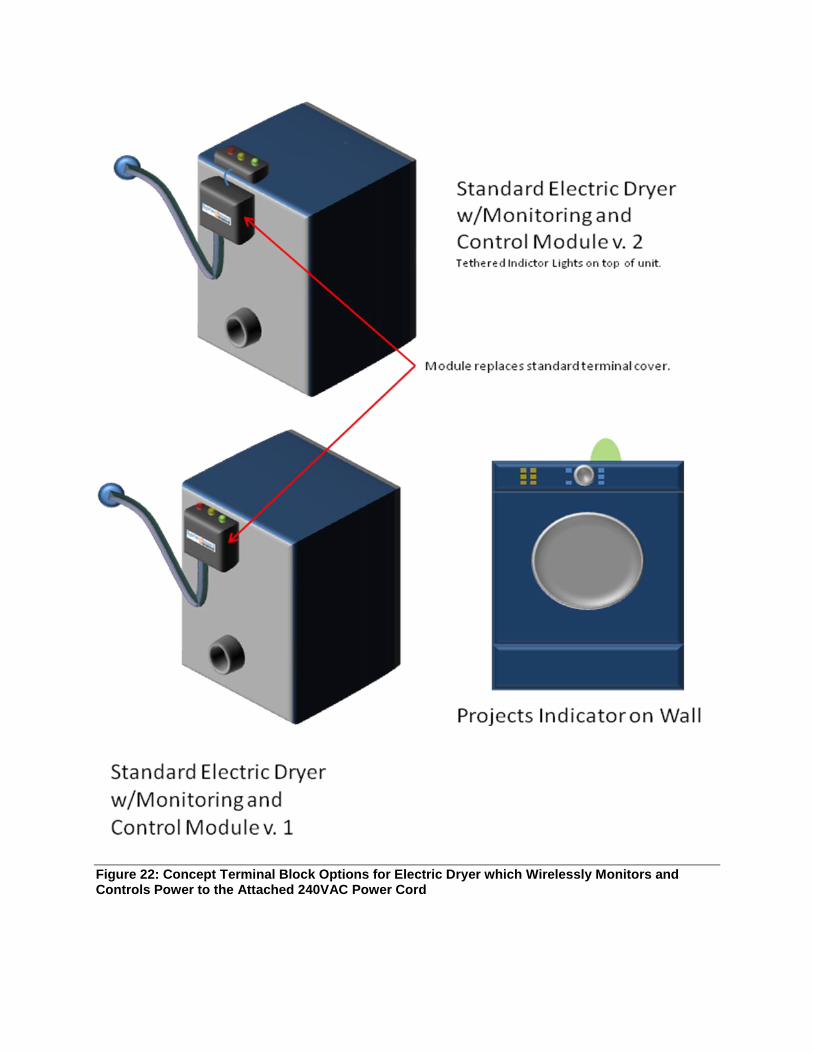
Figure 22: Concept Terminal Block Options for Electric Dryer which Wirelessly Monitors and Controls Power to the Attached 240VAC Power Cord