Embed Size (px)
Citation preview

Summary Document: eThekwini Greenhouse Gas Emissions Inventory 2013 P a g e | 1
Other 2% Municipality
5%
Industrial 32%
Residential 14%
Commercial 9%
Transportation 38%
ENERGY OFFICE
3rd
Floor, Smart Exchange, 5 Walnut Road, Durban, 4001
P O Box 1014, Durban 4000
Tel: +27 31 322 2622, Fax: +27 31 311 1089
Email: [email protected]
www.durban.gov.za
Final Summary Document: eThekwini Greenhouse Gas Emissions Inventory 2013
1 Synopsis A Greenhouse Gas Emissions Inventory (GHGEI) for the eThekwini Municipality has been compiled for the 2013 calendar
year. The inventory identifies the sources of Green House Gas (GHG) emissions from both the local government and
community sectors within the eThekwini Municipal Area. The eThekwini Municipality has compiled the GHGEI to help
plan climate change mitigation strategies within the Municipality.
The GHGEI is divided into two sub-inventories, one for the broader eThekwini community and one for the municipality
or local government emissions. The local
government “sub-inventory” includes
GHG emissions from activities under the
control of the eThekwini Municipality
entity, whilst the community inventory
includes GHG emissions from various
sectors within the boundary of the
eThekwini Municipal Area.
The total greenhouse emissions recorded
for the entire eThekwini Municipal Area
was 28,741,558tCO2e1 for the 2013 year.
As with pervious GHGEIs, the largest
contribution to this footprint was
transportation sector (38% of the total
GHGs) followed closely by Industry
emissions (32%). A graph showing the
inventory by sector is shown in Figure 1.
The 2010 Baseline GHGEI was developed as an easy to use EXCEL sheet and that allows for updating and reporting of
GHG emissions on an annual basis. That tool has been updated in order to calculate 2013 emissions.
1 Includes scope 1, 2 and selected scope 3 emissions
Figure 1: GHG emissions by sector

Summary Document: eThekwini Greenhouse Gas Emissions Inventory 2013 P a g e | 2
2 Background In 2010 eThekwini Municipality, together with a number of cities across the globe, became a signatory of The Global
Cities Covenant on Climate (the “Mexico City Pact”). Through this covenant, the Municipality committed to record its
annual GHG emissions, climate change commitments, climate mitigation and adaptation measures, and actions. The
2011 eThekwini GHG Inventory, in addition to assisting in meeting the Municipality’s commitments to The Global Cities
Covenant on Climate, is meant to aid the Municipality in forecasting emission trends, identifying the point and mobile
sources of emissions generated, and setting goals for future reductions and mitigation.
The reporting of a municipal inventory also aligns eThekwini Municipality with the intentions of the National Climate
Change Response White Paper (Department of Environmental Affairs, 2011) and the broader national government policy
on climate change.
3 Methodology Used The following Local Government GHG Emissions Analysis Protocols, developed by ICLEI – Local Governments for
Sustainability, were used to guide the development of the eThekwini GHG Inventory:
International Local Government GHG Emissions Analysis Protocol Version 1.02; and
Local Government Operations Protocol for the Quantification and Reporting of Greenhouse Gas Emissions Inventories Version 1.13.
These protocols provide a standardized set of guidelines to assist local governments in quantifying and reporting GHG
emissions associated with their government and community operations. Both protocols are based upon the Corporate
GHG Protocol4 developed by the World Resources Institute (WRI) and the World Business Council for Sustainable
Development (WBCSD) as well as technical guidance provided by the United Nations Intergovernmental Panel on
Climate Change (IPCC). Activities that cause emissions are recorded in different emission scopes:
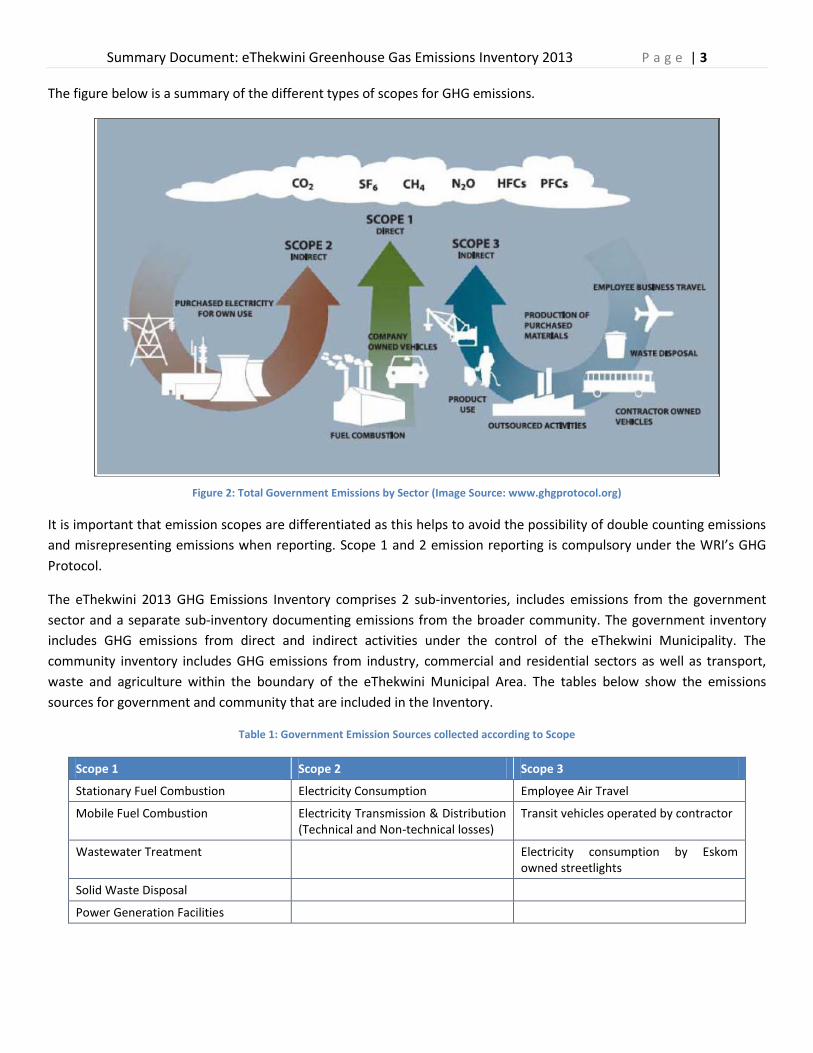
Scope 1 are any direct emissions produced by the organisation or area, such as combustion of fuel.
Scope 2 activities are indirect emissions produced by electricity that is purchased by the organisation or area.
Scope 3 emissions are those that occur from the organisation or area’s activities but the sources of the emissions are owned or controlled by another entity, such as emissions from flights where planes are not owned by the organisation/area in question.
2Available at http://www.icleiusa.org/tools/ghg-protocol
3Available at http://www.icleiusa.org/tools/ghg-protocol
4Available at http://www.ghgprotocol.org/standards/corporate-standard
Summary Document: eThekwini Greenhouse Gas Emissions Inventory 2013 P a g e | 3
The figure below is a summary of the different types of scopes for GHG emissions.
Figure 2: Total Government Emissions by Sector (Image Source: www.ghgprotocol.org)
It is important that emission scopes are differentiated as this helps to avoid the possibility of double counting emissions
and misrepresenting emissions when reporting. Scope 1 and 2 emission reporting is compulsory under the WRI’s GHG
Protocol.
The eThekwini 2013 GHG Emissions Inventory comprises 2 sub-inventories, includes emissions from the government
sector and a separate sub-inventory documenting emissions from the broader community. The government inventory
includes GHG emissions from direct and indirect activities under the control of the eThekwini Municipality. The
community inventory includes GHG emissions from industry, commercial and residential sectors as well as transport,
waste and agriculture within the boundary of the eThekwini Municipal Area. The tables below show the emissions
sources for government and community that are included in the Inventory.
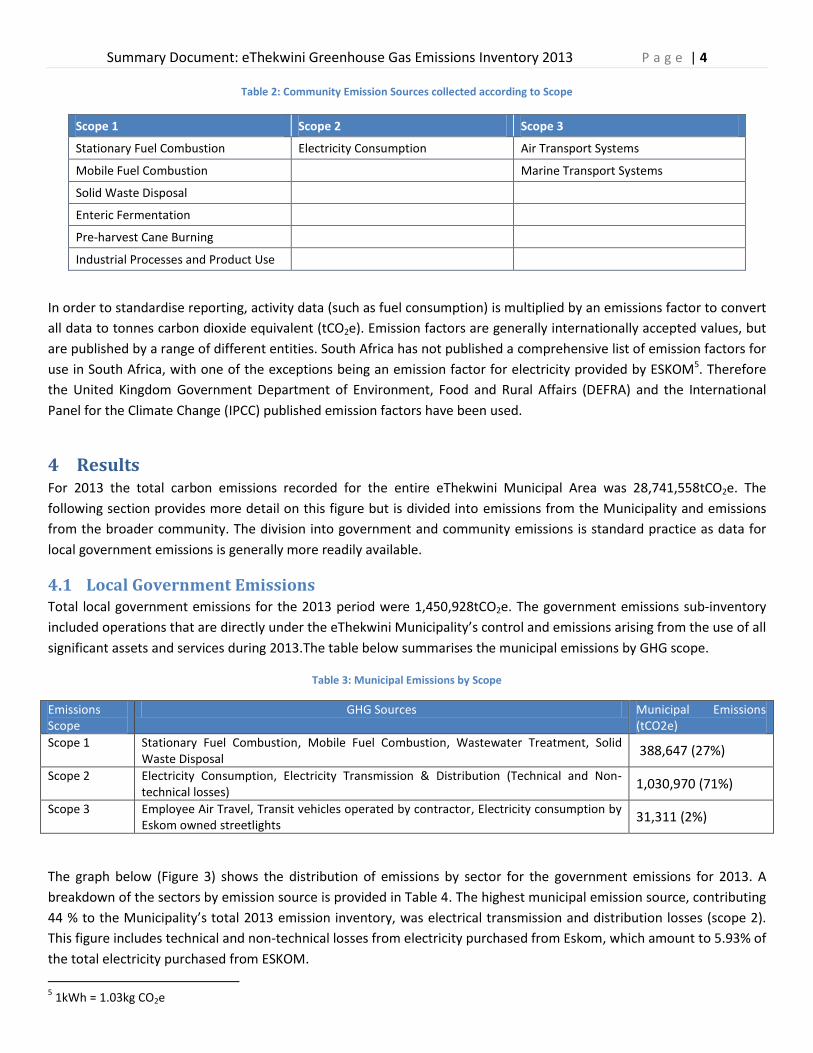
Table 1: Government Emission Sources collected according to Scope
Scope 1 Scope 2 Scope 3
Stationary Fuel Combustion Electricity Consumption Employee Air Travel
Mobile Fuel Combustion Electricity Transmission & Distribution (Technical and Non-technical losses)
Transit vehicles operated by contractor
Wastewater Treatment Electricity consumption by Eskom owned streetlights
Solid Waste Disposal
Power Generation Facilities
Summary Document: eThekwini Greenhouse Gas Emissions Inventory 2013 P a g e | 4
Table 2: Community Emission Sources collected according to Scope
Scope 1 Scope 2 Scope 3
Stationary Fuel Combustion Electricity Consumption Air Transport Systems
Mobile Fuel Combustion Marine Transport Systems
Solid Waste Disposal
Enteric Fermentation
Pre-harvest Cane Burning
Industrial Processes and Product Use
In order to standardise reporting, activity data (such as fuel consumption) is multiplied by an emissions factor to convert
all data to tonnes carbon dioxide equivalent (tCO2e). Emission factors are generally internationally accepted values, but
are published by a range of different entities. South Africa has not published a comprehensive list of emission factors for
use in South Africa, with one of the exceptions being an emission factor for electricity provided by ESKOM5. Therefore
the United Kingdom Government Department of Environment, Food and Rural Affairs (DEFRA) and the International
Panel for the Climate Change (IPCC) published emission factors have been used.
4 Results For 2013 the total carbon emissions recorded for the entire eThekwini Municipal Area was 28,741,558tCO2e. The
following section provides more detail on this figure but is divided into emissions from the Municipality and emissions
from the broader community. The division into government and community emissions is standard practice as data for
local government emissions is generally more readily available.
4.1 Local Government Emissions Total local government emissions for the 2013 period were 1,450,928tCO2e. The government emissions sub-inventory
included operations that are directly under the eThekwini Municipality’s control and emissions arising from the use of all
significant assets and services during 2013.The table below summarises the municipal emissions by GHG scope.
Table 3: Municipal Emissions by Scope
Emissions Scope
GHG Sources Municipal Emissions (tCO2e)
Scope 1 Stationary Fuel Combustion, Mobile Fuel Combustion, Wastewater Treatment, Solid Waste Disposal
388,647 (27%)
Scope 2 Electricity Consumption, Electricity Transmission & Distribution (Technical and Non-technical losses)
1,030,970 (71%)
Scope 3 Employee Air Travel, Transit vehicles operated by contractor, Electricity consumption by Eskom owned streetlights
31,311 (2%)
The graph below (Figure 3) shows the distribution of emissions by sector for the government emissions for 2013. A
breakdown of the sectors by emission source is provided in Table 4. The highest municipal emission source, contributing
44 % to the Municipality’s total 2013 emission inventory, was electrical transmission and distribution losses (scope 2).
This figure includes technical and non-technical losses from electricity purchased from Eskom, which amount to 5.93% of
the total electricity purchased from ESKOM.
5 1kWh = 1.03kg CO2e

Summary Document: eThekwini Greenhouse Gas Emissions Inventory 2013 P a g e | 5
The second highest municipal emission source was from the sale of Certified Emission Reductions (carbon credits),
contributing 14% to the total Municipal emissions. The sale of CERs are from the municipal landfill gas to electricity
project and are recorded as a separate category of emissions as the CO2e reduction is claimed by the purchaser (see
section 4.3 for more details). CERs are followed by Municipal Building and Facilities (12%); and Wastewater Facilities
(8%), Streetlights and Traffic Signals (8%).
Figure 3: Total Government Emissions by Sector
Table 4: Municipal Operation Emissions by Sector and Source
Sector Scope Emission Sources Emissions (tonnes CO2e)
Buildings & Other Facilities 1 2
Stationary Fuel Combustion Purchased Electricity
5,884
171,108
Streetlights & Traffic Signals 2 3
Electricity consumption by municipal owned streetlights & traffic signals Electricity consumption by Eskom owned streetlights
112,287
1,043
Water Delivery Facilities 2 Purchased electricity 44,903
Wastewater Facilities 1 2
Stationary and process emissions Purchased electricity
46,528 74,987
Vehicle Fleet 1 Mobile fuel combustion 37,314
Transit Fleet 3 Mobile fuel combustion 29,292
Power Generation Facilities 1 Fugitive Emissions 3 552
Power Generation Facilities 2 Electrical distribution losses 627,172
Solid Waste Facilities 1 1 2
Fugitive emissions Purchased electricity
92,768 512
Employee Air Travel 3 Mobile fuel combustion 976
Certified Emission Reduction 1 Certified Emission Reduction 202,601 Total Government Emissions 1,450,928
Power Generation Facilities
44%
Solid Waste Facilities 6%
Buildings & Other Facilities
12%
Streetlights & Traffic Signals
8% Water Delivery Facilities
3% Wastewater Facilities
8%
Transit Fleet 2%
Vehicle Fleet 3%
Employee Air Travel 0%
Certified Emission Reduction
14%
Summary Document: eThekwini Greenhouse Gas Emissions Inventory 2013 P a g e | 6
4.2 Process Emissions Fugitive Emissions (SF6) of 3 552.0 tCO2e were included from electricity switch gear equipment. SF6 is an extremely
potent greenhouse gas that is used amongst other things as an insulant gas in switch gear. SF6 is also used in magnesium
processing and semiconductor manufacturing, as well as a tracer gas for leak detection.
4.3 Certified Emission Reduction As with the 2011 GHGEI, the 2013 GHGEI included Certified Emission Reduction (CERs). CERs are tradable commodities
developed through the Clean Development Mechanism (CDM) Executive Board of the United Nations Framework
Convention on Climate Change (UNFCCC). In essence the CDM allows project developers who are able to quantify
emission reduction, to package and sell these reductions as CERs.
The eThekwini Municipality had one CDM project registered with the UNFCCC for the 2013 GHGIE reporting period,
namely the Durban Landfill-Gas-To-Electricity Project –La Mercy Landfills6 and Durban Landfill-Gas Bisasar Road7. For the
2013 period, the eThekwini Municipality registered 202,601 CERs for this project (see table below).
Table 5: Municipal Intensity Figures
Source Units Total
Bisasar Road Landfill tCO2e 201,601.09
As with the 2011 GHGEI CERs are included under Scope 1 emissions for Sanitation and Solid Waste Facilities.
4.4 Community Emissions Total community (excluding local government) emissions equated to 27,290,630 tCO2e. The community emissions
inventory includes GHG emissions associated with activities occurring within the eThekwini Municipality’s geopolitical
boundary generated during 2013. The table below shows community emissions by scope.
Table 6: Community Emissions by Scope
Emissions Scope
GHG Sources Community Emissions (tCO2e)
Scope 1 Stationary Fuel Combustion, Mobile Fuel Combustion, Solid Waste Disposal, Enteric Fermentation, Pre-harvest Cane Burning
11,620,661 (43%)
Scope 2 Electricity Consumption 11,035,847 (40%) Scope 3 Air Transport Systems, Marine Transport Systems 4,634,121 (17%)
The largest sector contributing 34% to the total community GHG emissions is the industrial sector through purchased
electricity and stationary fuel combustion. The second major contributor was the on-road and off-road (ground)
transport sector contributing 24% to overall community emissions. The third highest contributor to community
emissions was the air and water transport systems sector deriving it emissions from fuel consumption at 17%.
Collectively (ground, air and water), transport sector emissions contribute the most significant proportion of the
community emissions, at 41%. The residential sector is also significant, at 14% or 3,877,995tCO2e. Figure 4 below
6https://cdm.unfccc.int/Projects/DB/TUEV-SUED1154520464.04
7http://cdm.unfccc.int/Projects/DB/TUEV-SUED1214927681.45

Summary Document: eThekwini Greenhouse Gas Emissions Inventory 2013 P a g e | 7
illustrates the total community emissions produced in eThekwini by sectors. A more in-depth breakdown of the sectors
according to emission source can be found in Table 7.
Figure 4: Total Community Emissions by Sector
Table 7: Community Operation Emissions by Sector and Source
Sector Scope Emission Sources Emissions (tonnes CO2e)
Residential 1 Stationary Fuel Combustion 232,183
2 Electricity Consumption 3,645,812
Commercial 2 Electricity Consumption 2,577,589
Industrial 1 Stationary Fuel Combustion 4,364,716
2 Electricity Consumption 4,812,447
On-road and Off-road Vehicles 1 Mobile Fuel Combustion 6,383,881
Rail, Air and Water Transport Systems 3 Air Travel 4,634,121
Industrial Process and Product Use 1 Industrial Processes & Product Use 341,508
Solid Waste 1 Fugitive Emissions 205,740
Agriculture, Land Use and Forestry 1 Enteric Fermentation 92,634
Total Community Emissions 27,290,630
Residential 14%
Commercial 10%
Industrial 34%
On-road and Off-road Vehicles
24%
Rail, Air and Water Transport Systems
17%
Industrial Processes and Product Use
1%
Agriculture, Land Use and Forestry
0%

Summary Document: eThekwini Greenhouse Gas Emissions Inventory 2013 P a g e | 8
5 Analysis of the GHG Inventory
5.1 Total Emissions For 2013 the total8 carbon emissions recorded for eThekwini Municipality was 28,741,558 tCO2e. Local Government
Emissions account for 5% of the total eThekwini emissions (Figure 5). Transportation (ground, air and water) and
Industry contribute the highest to the total emissions (Figure 5). Emissions from the industry are also significant, which is
representative of the influential manufacturing and processing component of the city’s economy.
Figure 5: Carbon emissions by Sector
This “emission by sector” representation is largely an indication of the demand for energy in the city. The graph above
illustrates that industry and transport have a large energy demand in comparison to residence and commercial activities.
This sector comparison turn helps prioritize climate change mitigation interventions to sectors where there are large
demands on energy.
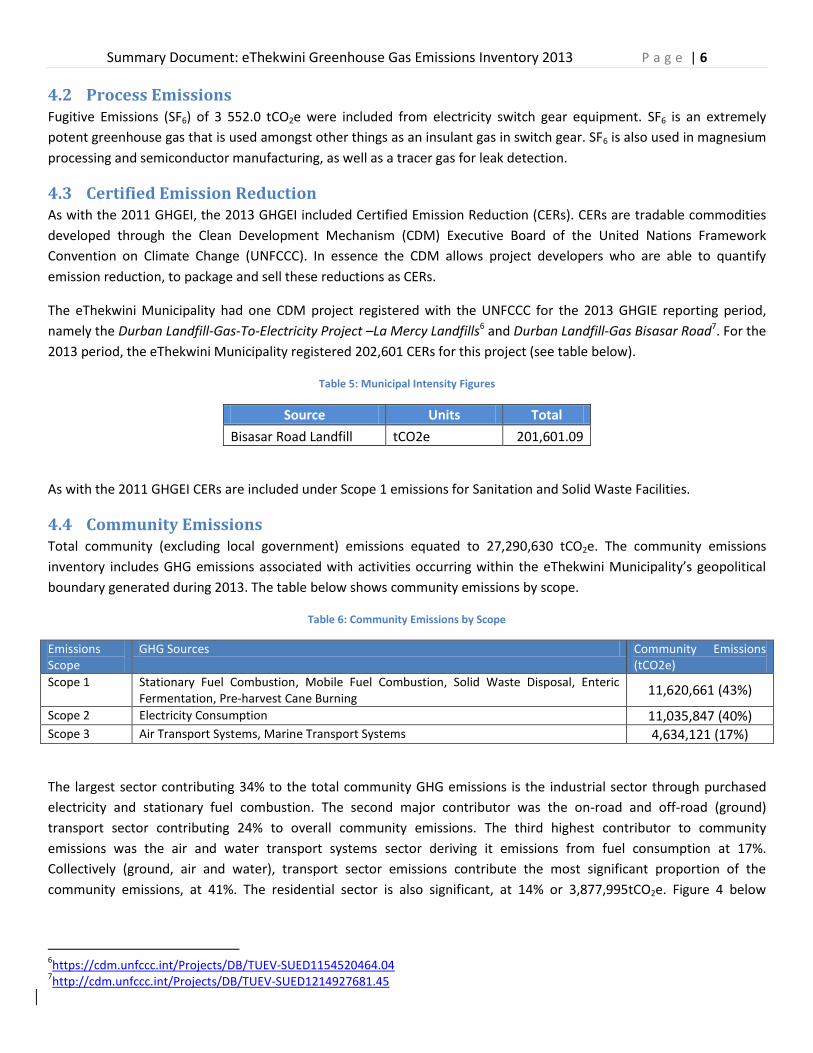
Conversely, the total emission value of 28,741,558 tCO2e can also be assessed by “source” or supply. The graph below,
Figure 6, is an indication of where the greenhouse gasses in the city come from. As to be expected Transport Fuels9 are
responsible for 39% of total GHG footprint, which closely matches the 38% allocation in the transport sector (Figure 5
above). Electricity however is the largest source of Greenhouse Gasses, responsible for 42% of the total footprint.
Stationary Combustion10 also contributes to the overall GHG footprint with 16% of the total emissions. However there
are data gaps in this particular category and research needs to be conducted to better understand the emissions from
different stationary combustion sources. For the purposes of this Graph CERs are classified as a separate source of
emissions.
8 Municipal and community emissions
9Including: Petrol, Diesel, Jet Fuel, Marine Diesel and Fuel Oil
10Including: Heavy Furnace Oil; Bitumen; Natural Gas; LPG; Coal; Coke; Illuminating Paraffin; Paraffin Wax; Refinery Gas
Other 2% Municipality
5%
Industrial 32%
Residential 14%
Commercial 9%
Transportation 38%
Summary Document: eThekwini Greenhouse Gas Emissions Inventory 2013 P a g e | 9
Figure 6: Carbon emissions by Source
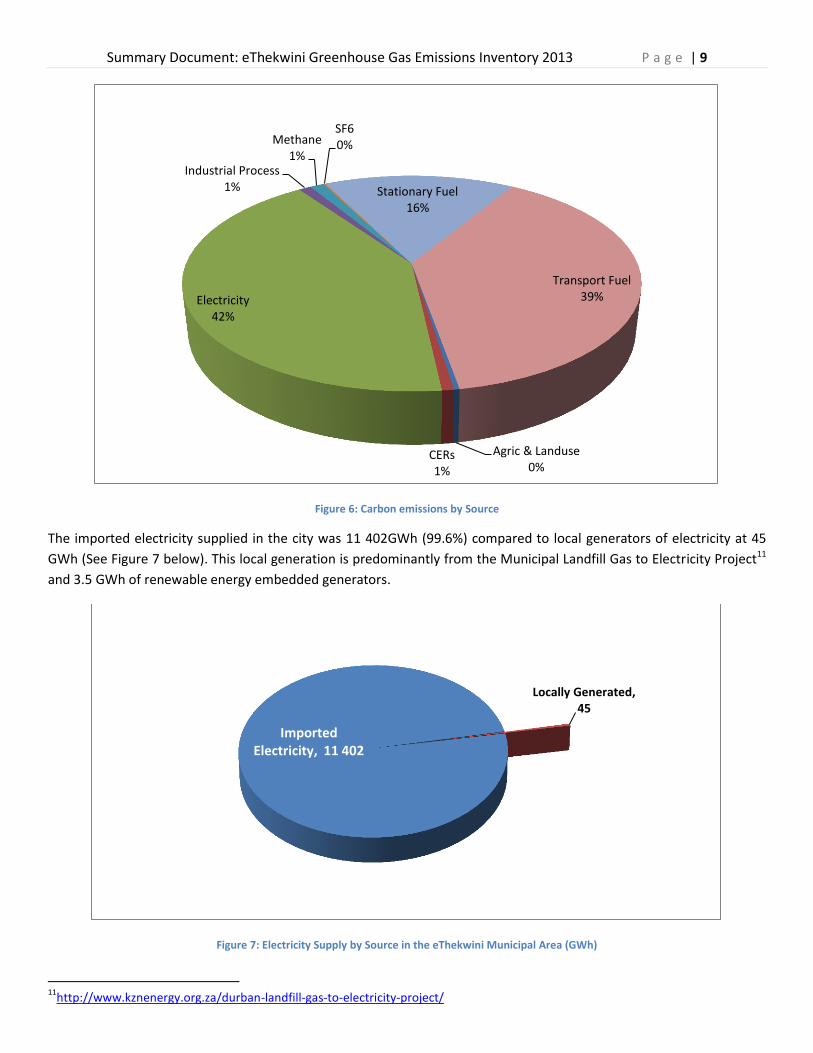
The imported electricity supplied in the city was 11 402GWh (99.6%) compared to local generators of electricity at 45
GWh (See Figure 7 below). This local generation is predominantly from the Municipal Landfill Gas to Electricity Project11
and 3.5 GWh of renewable energy embedded generators.
Figure 7: Electricity Supply by Source in the eThekwini Municipal Area (GWh)
11
http://www.kznenergy.org.za/durban-landfill-gas-to-electricity-project/
Agric & Landuse 0%
CERs 1%
Electricity 42%
Industrial Process 1%
Methane 1%
SF6 0%
Stationary Fuel 16%
Transport Fuel 39%
Imported Electricity, 11 402
Locally Generated, 45
Summary Document: eThekwini Greenhouse Gas Emissions Inventory 2013 P a g e | 10
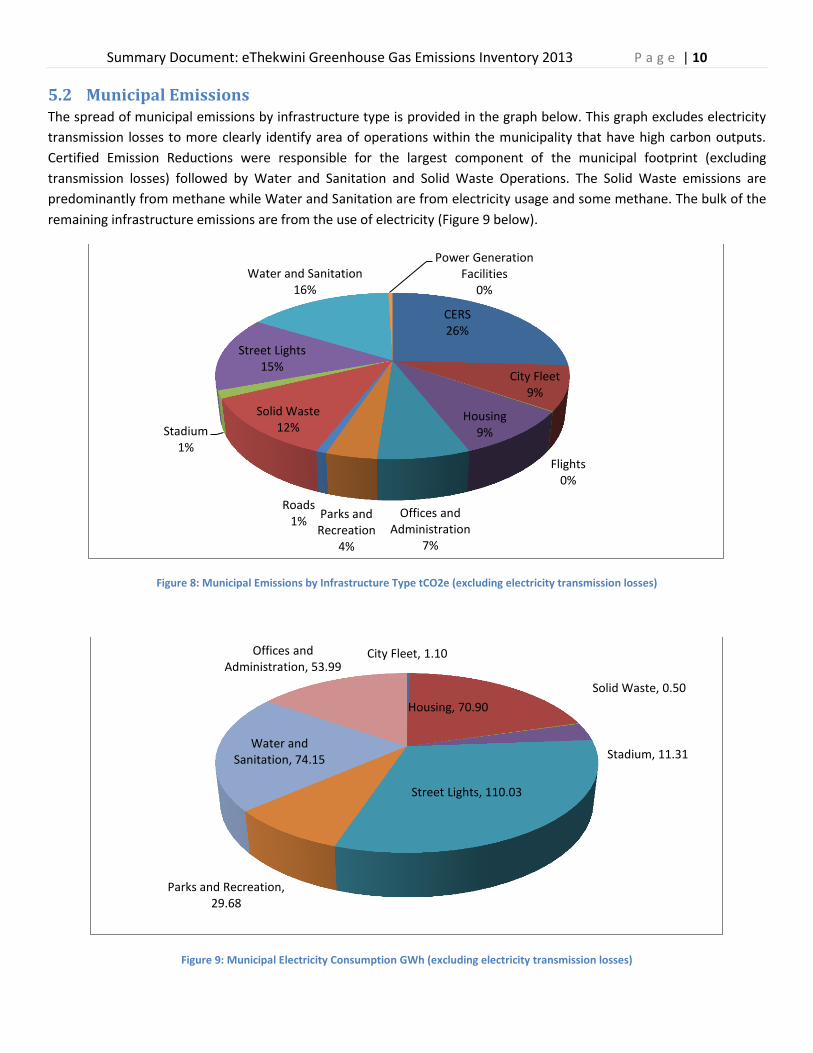
5.2 Municipal Emissions The spread of municipal emissions by infrastructure type is provided in the graph below. This graph excludes electricity
transmission losses to more clearly identify area of operations within the municipality that have high carbon outputs.
Certified Emission Reductions were responsible for the largest component of the municipal footprint (excluding
transmission losses) followed by Water and Sanitation and Solid Waste Operations. The Solid Waste emissions are
predominantly from methane while Water and Sanitation are from electricity usage and some methane. The bulk of the
remaining infrastructure emissions are from the use of electricity (Figure 9 below).
Figure 8: Municipal Emissions by Infrastructure Type tCO2e (excluding electricity transmission losses)
Figure 9: Municipal Electricity Consumption GWh (excluding electricity transmission losses)
CERS 26%
City Fleet 9%
Flights 0%
Housing 9%
Offices and Administration
7%
Parks and Recreation
4%
Roads 1%
Solid Waste 12% Stadium
1%
Street Lights 15%
Water and Sanitation 16%
Power Generation Facilities
0%
City Fleet, 1.10
Housing, 70.90
Solid Waste, 0.50
Stadium, 11.31
Street Lights, 110.03
Parks and Recreation, 29.68
Water and Sanitation, 74.15
Offices and Administration, 53.99

Summary Document: eThekwini Greenhouse Gas Emissions Inventory 2013 P a g e | 11
5.3 Intensity of Emissions
5.3.1 Government Intensity Figures
Emission intensity figures for the Municipality are recorded below in Table 8. These figures were calculated by
combining all municipal scope 1 and 2 emissions and dividing them by the relevant indicator.
Table 8: Municipal Intensity Figures
Intensity Figure Unit Metric Numerator
Unit Metric Denominator
Unit
R 50.16 tCO2e / million Rand of operating budget
1 419 617 tCO2e ( Municipal Scope 1 & 2 )
R 28 300.0012
Million Rand Operating Budget (2013/ 2014)
R 262.85 tCO2e / million Rand of Capital budget
1 419 617 tCO2e ( Municipal Scope 1 & 2 )
R 5 400.0013
Million Rand Capital Budget (2013/ 2014)
66.12 tCO2e / Permanent employee
1 419 617 tCO2e ( Municipal Scope 1 & 2 )
21 46914
Permanent Employees
5.3.2 Community Intensity Figures
Community intensity figures are recorded below. These emissions were calculated by combining relevant sector scope
emissions and dividing them by the relevant indicators.
Table 9: Community Emissions Figures
Intensity Figure
Unit Metric Numerator
Unit Metric Denominator
Unit
3.92 tCO2e / household 3,877,995 tCO2e (Residential Scope 1 & 2 )
989 93615
Number of households within the EMA
R 39.05 tCO2e / retail trade sales
2,577,589 tCO2e (Commercial Scope 1 & 2 )
R 66 000.0016
2013 Annual retail trade sales
5.3.3 Total Emissions Intensity Figures
Total emission intensity figures (for the municipality and the community) are recorded below in Table 8. These emissions
were calculated by combining relevant sector scope emissions and dividing them by the relevant indicators. A per capita
figure has been calculated using total scope 1 and 2 emissions, and separately using emissions from all three scopes to
account for different methodologies of calculating this figure.
Table 10: Total Emissions Intensity Figures
Intensity Figure
Unit Metric Numerator
Unit Metric Denominator
Unit
6.99 tCO2e / Capita
24,076,126 tCO2e (Scope 1 & 2) 3,442,36117
Population within the EMA
8.35 tCO2e / Capita
28,741,558 tCO2e (Scope 1, 2 & 3) 3,442,361 Population within the EMA
12
http://www.durban.gov.za/media_publications/Press_Releases/Pages/201314BudgetAdopted.aspx 13
http://www.durban.gov.za/media_publications/Press_Releases/Pages/201314BudgetAdopted.aspx 14
EThekwini Municipality, Human Resources 15
http://www.durban.gov.za/Resource_Centre/edge/Documents/EDGE%2010th%20Edtion.pdf 16
http://www.durban.gov.za/Resource_Centre/edge/Documents/EDGE%2010th%20Edtion.pdf 17
STATSSA: Census 2011: Municipal Fact sheet

Summary Document: eThekwini Greenhouse Gas Emissions Inventory 2013 P a g e | 12
5.4 Comparison with previous GHGIE The 2010 eThekwini GHG Inventory serves as the baseline inventory because the methodology for collecting and
reporting data was clearly defined for this period. However data for Greenhouse Gas Emissions Inventories in the
eThekwini Municipality dates back to 2002. This emerging emissions trend is summarised in the table and graph below.
As is evident from these data sets, there is a continued and steady increase in greenhouse gas emissions over time in the
city. This trend is primarily are a result of improved data collection methodologies but also due to increased uses of
energy and carbon intensive processes in the city.
Table 11: Historic Emissions Data for the eThekwini Municipality (tCO2e)
Year Government Emissions Community Emissions
Total Emissions
% Change % Change from 2010 Baseline
Yr 2002 1 047 000 18 890 000 19 937 000
Yr 2003/2004 1 247 000 18 890 000 20 137 000 1.0%
Yr 2005/2006 1 118 061 21 413 906 22 531 967 11.9%
Yr 2010 1 104 212 25 962 074 27 066 285 20.1%
Yr 2011 1 551 420 26 097 979 27 649 400 2.2% 2.2%
Yr 2012 1 526 431 27 833 965 29 360 395 6.2% 8.3%
Yr 2013 1 450 928 27 290 630 28 741 558 -2.1% 4.1%
Figure 10: Historic Emissions Data for the eThekwini Municipality (tCO2e)
Total emissions show a decrease of 2.1% from year 2012 to 2013, which is equivalent to 618 838.1 tCO2e of emissions
less emitted. The municipal and community sectors presents a decrease of -75 503.0 tCO2e and -543 335.0 tCO2e
respectively. Table 12 shows a detailed summary of the differences between 2012 and 2013.
-
5
10
15
20
25
30
35
Yr 2002 Yr 2003/2004 Yr 2005/2006 Yr 2010 Yr 2011 Yr 2012 Yr 2013
MtC
O2
e
Community Emissions
GovernmentEmissions

Summary Document: eThekwini Greenhouse Gas Emissions Inventory 2013 P a g e | 13
Table 12: Data Comparison between 2012 and 2013 Reporting Periods
Scope Type Sub-Type 2012 (tCO2e) 2013 (tCO2e)
Municipal Scope 1
Fuel Consumption Stationary Fuel Combustion 15 082.2 5 883.8 -61%
Vehicle Fleet 46 654.1 37 313.9 -20%
Solid Waste Solid Waste (CH4) 71 370.0 92 768.0 30%
Power Generation Facilities Fugitive Emissions 3 552.0 3 552.0 100%
Wastewater Treatment Wastewater (CH4) 35 978.8 46 528.4 29%
CERs Certified Emission Reduction 219 173.3 202 601.1 -8%
Municipal Scope 2
Electricity Consumption Buildings 164 935.4 171 108.2 4%
Streetlights & Traffic Signals 108 100.8 112 287.5 4%
Water Delivery Facilities 64 048.2 44 903.0 -30%
Transmission and Distribution Losses 705 364.5 627 171.8 -11%
Solid Waste Facilities 1 849.9 512.4 -72%
Wastewater Facilities 57 099.7 74 987.2 31%
Municipal Scope 3
Transport Systems Streetlights 1 079.1 1 042.7 -3%
Transit Fleet 31 951.4 29 291.8 -8%
Flights 191.5 976.2 410%
Subtotal Municipal 1 526 430.9 1 450 927.9 -4.9%
Community Scope 1
Fuel Consumption Stationary Fuel Combustion 4 719 185.8 4 596 899.3 -3%
Mobile Fuel Combustion 6 183 253.3 6 383 880.9 3%
Solid Waste Solid Waste 212 230.0 205 740.0 -3%
Industrial Processes & Product Use IPPU 331 517.2 297 174.1 -10%
Industrial Processes & Product Use IPPU 44 333.4 44 333.4 100%
Agric & Landuse Agric & Landuse 90 263.6 92 633.5 2.6%
Community Scope 2
Electricity Consumption Residential 3 587 449.7 3 645 811.7 2%
Commercial 3 142 390.7 2 577 588.9 -18%
Industrial 4 843 556.5 4 812 446.7 -1%
Community Scope 3 Transport Systems Air Transport Systems 252 028.2 206 364.8 -18%
Water Transport Systems 4 427 756.4 4 427 756.4 0%
Subtotal Community 27 833 964.8 27 290 629.7 -2%
Total 29 360 395.7 28 741 557.7 -2.1%
Summary Document: eThekwini Greenhouse Gas Emissions Inventory 2013 P a g e | 14
6 Conclusion and Way Forward
The compilation of the eThekwini GHG Emission Inventory is an important step in documenting the eThekwini
Municipality’s government and community emissions that are contributing to climate change. The current inventory is
the fourth iteration using the Local Government GHG Emissions Analysis Protocols. There has been an upward trend in
the total GHG emissions in the eThekwini Municipality from 27 066 285 tCO2e in 2010 to 29 360 395 tCO2e in 2012.
However a decrease from 29 360 396 tCO2e in 2012 to 28 741 558 tCO2e in 2013 was observed.