Embed Size (px)
Citation preview
WPT2
Innovative Tools to increase acceptability and effectiveness of low-carbon mobility policies for city centers.
Activity A.T2.2
Identification and detailed design of Value-Added services for LEZ
Deliverable D.T.2.2.1
Study on specific supply chains in professional urban freight transport and delivery services
Final version
11 2007
2
A T 2.2
Author: Turin Municipality
Version: final version
Date of version: 30/11/2017
Project: SOLEZ
Duration of the project: 36 Months
Project coordination:
Vicenza Municipality
The sole responsibility for the content of this document lies with the authors. It does not necessarily reflect the opinion of the European Union
3
A T 2.2
TABLE OF CONTENTS
1 Introduction ............................................................................................4
2 Professional urban freight transport and delivery services ......................................5
2.1 Freight transport demand in urban environment and distribution channels .........6
2.2 Stakeholders of urban freight transport and delivery services .........................9
2.3 Impacts of freight transport and delivery services in urban context ................ 12
2.4 Good practices for sustainable last-mile logistics ...................................... 14
3 Urban freight transport and supply chains ....................................................... 21
3.1 Specific supply chains chain in urban freight transport and delivery services ... 22
3.2 Public-private partnership as a success factor ......................................... 30
3.3 Analysis of baseline scenarios in FUAs and possible interventions ................... 32
3.4 Focus on the commercial activities in the LEZ of Torino ............................. 33
3.5 The experience of last-mile logistics in Torino ......................................... 36
4 Conclusions ........................................................................................... 39
5 References ............................................................................................ 40
4
A T 2.2
1 Introduction Circulation of people, goods, information and ideas has always been a foundamental
component for the development of human societies. The efficiency of the system for
moving people and freight is a key element for the growth and development of the
territory. The intensification of globalisation and the demographic growth will determine
an increasing demand of transports; it’s estimated that in 2050 the global passengers-km
will triplicate and the freight traffic will quadruplicate.
The most affected places by such changes will be the urban areas where more and more
attraction sites for the life of individuals will be invented. Just consider that today, 54% of
the world population lives in urban areas and produces 85% of the whole global GDP and
it’s foreseen that by 2050 cities will host 66% of the world population. Mobility of people
and freights however represents one of the key factors of deterioration of the quality of
both environment and life. Nowadays transports are responsible for 25% of CO2 emissions,
1.5 million deaths and 50 million injuries per year and their economic inefficiency costs 1%
of each Country’s GDP. If we think ahead 35 years from now it’s clear that the transport
sector can’t continue to develop following its actual path.
With a business as usual scenario the dependence on oil of transports will still be a little
less than 90% while the energy from renewable sources will be a little bit more than the
goal of 10% foreseen for 2020. By 2050 the costs due to congestion will raise by 50%, the
gap between central and peripheral regions will deepen and the social costs due to
accidents and acoustic pollution will continue to rise. The introduction of new policies, the
new technologies for vehicles and traffic management will be key elements for reducing
the emissions related to transports.
The competition for sustainable mobility has a new global dimension; therefore, a delay or
a lack of ambition in the introduction of new technologies might doom to an irreversible
decline the transport industry of the European Union. The transport sector of the EU has to
face an increasing competition on the rapidly developing global market of transports.
The SOLEZ project aims at accepting such a challenge and realizing new mobility solutions,
sustainable from an environmental, economic and social point of view. This report is aimed
at providing a brief introduction about professional freight transport and logistics in urban
areas, focusing the analysis on specific supply chains (retail, parcels, Ho.Re.Ca.,
pharmaceuticals).
Furthermore, this report describes significant good practices for sustainable logistics in
urban areas (last-mile logistics), public private partnerships and innovative governance
models including push and pull organizational measures (value-added services). The report
finally provides a specific analysis of the baseline scenario in Turin in last-mile logistics,
reflecting the low-carbon mobility planning and regulatory framework at urban at FUA
level towards more sustainable freight transport and logistics.
5
A T 2.2
2 Professional urban freight transport and delivery services Freight transport logistics consist of the whole of organisational, management and
strategic activities which rule the flow of raw materials in a company and the related
information flow from their origins at the suppliers’ premises to the delivery of the final
products to clients and after-sales services.
Freight transport might be performed in different ways, the main ones being: road
transport, railway transport, maritime transport and air transport. The issue is regulated
by the State with the Law 298/1974; such law differentiates freight transport between
“proprietary freight transport” (Art. 31) and “freight transport for hire or reward” (Art.
40). The proprietary freight transport is the transport performed with own vehicles where
it doesn’t represent an economically predominant activity and the freights belong to the
same persons. The freight transport for hire or reward is an entrepreneurial activity
providing a transport service in exchange of a precise compensation.
The mechanisms generating the demand of freight transport are consistently more complex
and articulated of those generating the demand of people transport. As in the case of
freight there’s not only one decider (the person who wants to travel), but a complex and
articulated whole of deciders responsible for the activities of supply, production, storage,
transport, distribution and marketing of the products. Such displacements exploit, on the
other hand, different transport services with specific features and that can be classified
depending on the involved deciders:
• producers of goods and services who decide how much to produce, how to produce,
where and the selling price;
• operators of the urban supply chain who provide logistic services (scheduling,
management and stocking, planning of the distribution network) between different
parts of the territory and that may be classified in the following way: retailers,
wholesalers, haulers and carriers, providing basically services of collection,
transport and delivery;
• retailers who are interested in low stocking costs and in frequent and punctual
deliveries;
• final consumers who are interested in low cost products and in the urban
environment.
In urban areas there is also a generalised desire to tackle in the best way possible de
discipline of freight distribution, with basically the goal of realising a net benefit for
operators, users, consumers and for the community as a whole. Therefore, a useful
classification of the transport service ma be realised taking into account the type of
utilised vehicle:
i) by dimensions (small, medium, heavy);
6
A T 2.2
ii) by fuelling (diesel, gasoline, methane, electric, hybrid).
As a matter of fact, for example, the exploitation of small low impact vehicles, more
suitable for the transports within urban areas, might, on one hand, increase the costs for
the operators because of the higher number of displacements needed, but on the other
hand reduce pollutants‘ emissions.
2.1 Freight transport demand in urban environment and distribution channels
Urban freight transport, in general, might be differentiated in transport related to the
supply of productive activities and transport related to the distribution of final products.
The configuration of the demand of transport in urban environment is determined by the
level and the spatial distribution of the activities on the territory and by the
characteristics of the offer of transport.
Transport problems do not end at city limits. Check carefully whether the problems you
are going to address may involve the territory of neighbouring municipalities (FUAs). If that
is the case, check with the main municipality about the information and engagement
policy regarding its neighbours.
As far as it concerns freight transport and delivery services, simplifying, the demand of
transport may be considered as made of two different types of displacements:
• displacements of final users (citizens, city users) for buying goods and services;
• displacements of the operators for supplying the economic activities and their
reverse logistics for displacing packaging, returned goods and other reusable or not
reusable waste.
These two components are strictly related since they are part of the same system.
Logistics is the art and science of managing and controlling the flow of goods, energy,
information and other resources from the source of production to the marketplace. The
convergence of economic, political and technological forces in the mid-1990s dramatically
increased the importance of logistics. The delivery of goods overtook production as the
most critical factor in business success.
The responsibility of logistics grew from simply getting a product out the door to the
science of controlling the optimal flow of goods, energy, and information through the
purchasing, planning and transportation management. In this respect, last-mile logistics
involves items being delivered from a depot or hub a short distance to their final
destination. Some larger delivery companies make the distinction between last miles (up
to 10 miles/km from the depot) and last metres - the actual delivery from the van in high
density areas within e.g. 1 mile. First mile logistics is the natural progression from last
mile logistics in terms of collecting items from customers who need to send items
nationally or internationally.
7
A T 2.2
Public and private sector should work together in order to determine the success of last-
mile logistics initiatives in European urban areas. Policy makers should try to create good
working relationships with companies involved in freight transport and logistics working in
their areas, through the creation of joint public and private sector working groups,
platforms and networks. All stakeholders have to be included representatives of small and
big transport operators, shopkeepers’ associations, retailers, city residents, city interest
groups. The process has to be coordinated by local authorities.
a) Demand per channel of distribution
Most of the displacements of the transport and logistic operators in urban areas are
attributable to the supplying of commercial activities.
The domain of retail commerce is quite a composite universe, that includes very different
activities in terms of dimensions, productive and distributive processes and specialisation.
It actually includes the operators of the organised large-scale distribution and the multi-
brand chain stores, big brands and the “traditional” retailers who run small or medium
multi-brand stores. The different channels of commercial distribution are differentiated
also by the modalities of physical distribution of the goods from the producers to the
selling points and by the involved operators.
A first type of distribution channel is the direct one, from the factory or the storage of the
supplier or the manufacturer or its logistic operator to the retailer, eventually by means of
a sales representative or an attempted sale operator. This is typical for perishable
products destined to small retailers. Another form of direct channel is the one that
exploits the centralisation of flows of a distribution centre. This channel is the one used by
organised large-scale distribution and franchising.
Another type of distribution channel is the indirect one. In this case there can be the
intermediation of a wholesaler between producers and retailers, as in the commerce of
clothes or pharmaceuticals, or in the case of a wholesale centre (market or cash and
carry), often with self-supply as in the case of fruits and vegetables. As an alternative, the
intermediation might by performed by a specialised operator, such as in the cases of
newspapers and tobaccos.
A direct channel is also used while directly selling to the final user and the recipient might
be the consumer’s residence or a pick-up point. The selling might occur by mail or via
internet.
b) Demand per type of recipient
A further classification of freight flows depend on the type of recipient, whether
intermediate or final. Among the intermediate recipient there are the commerce operator
which can be further distinguished according to their impact on the territory: proximity,
neighbourhood market, district or large area or peripheral extra-urban commercial centre.
In general those are independent multi-brand that get supplies directly form producers or
wholesalers. Big brands rule the distribution by managing a certain number of selling
8
A T 2.2
points and, in addition, franchising stores. The organised large-scale distribution instead
manages its commercial activities by retail selling food products or large-scale
consumption non food products in large selling points. Its selling points are characterised
by a unique brand and the supply and commercial policies and logistic activities are
managed centrally, in order to control the entire flow of the commercialised products.
Among the intermediate attractors there are also the public exercises and the so called
Ho.Re.Ca (Hotel, Restaurant and Catering).
The final consumers (citizens, city users, service and tertiary activities) are considered
final attractors.
c) Demand per type of goods
Examining, in the end, the characteristics of the goods, it is noted the need to analyse the
demand of goods in urban areas according to the physical and economical characteristics
of the goods themselves in terms of weight-volume and weight-value ratio, seasonality,
perishability (for example, fresh, dryied, frozen and deep frozen food or beverages),
danger, life cycle and unit value.
Urban areas are of course for their nature more affected by distribution flows whether
destined to final users (residents) or intermediate (selling network). The goods that go to
the final consumer might follow different paths, the most traditional ones being the
distribution centres and the wholesalers. Downstream of these there are the selling
activities divided into
organised large-scale distribution and small distribution.
In the last few years the handling of goods went through some remarkable evolutions in the
modes of distribution with the affirmation of the Just in Time (JIT) market concept and
the diffusion of e-commerce. Just in time is an industrial philosophy that inverted the “old
method” of producing final products for storage waiting to be sold (so called push logic) by
switching to a pull logic according to which it’s necessary to produce only what’s already
sold or that is foreseen to be sold shortly.
E-commerce is the whole set of transactions for the commercialisation of goods and
services between producers (offer) and consumers (demand), made via internet. The
consequence of these two professional distribution models is the intensification of
displacements for the delivery of the goods to distribution centres or final users.
E-commerce is growing at a doubledigit rate in almost every country in Europe which
entails a tremendous increase in city deliveries. While this is seen as a major contributor
to traffic, emissions and congestion, there is still an opportunity to achieve a
transformation to a more efficient delivery capability decoupled from environmental and
mobility nuisances. In parallel, new technologies such as modularisation of transport units,
autonomous delivery vehicles and drones are presented as potential technologies to be
implemented in the near future. Impact of these solutions and the way these systems
could transform city dynamics need to be further explored and understood. According to
9
A T 2.2
the investigation performed during the last three years with International Couriers, in the
framework of the European project NOVELOG - New Cooperative Business Models and
Guidance for Sustainable City Logistics, the overall daily trips have increased by 30%
because of e-commerce.
The service of delivery JIT is not exclusive of express couriers, but also involves structured
or non structured enterprises on account of third parties, whereas the first ones represent
the value-added high end of such market. If, until a few years ago, the two segments of
the good delivery market (traditional transport and urgent packages delivery) where
clearly distinct in terms of characteristics and prices, today they got closer instead. The
reason is that the basic productive technology, the cost structure and the prices of inputs
(e.g. vehicles, fuel, labour cost, drivers, etc.) are pretty much the same. Therefore, the
only difference consists in the offer by express couriers of value-added supplementary
services such as the tracking & tracing or scheduled deliveries, accepted by the client at a
slightly higher price than the standard one of traditional logistics.
2.2 Stakeholders of urban freight transport and delivery services
Urban freight transport and delivery services are characterized by the presence of many
stakeholders. The main reason for this is that it takes place in the city and neighbouring –
the central location where flows and activities intersect. Private stakeholders are very
important in the decisional and implementation process of urban logistics measures and it
became clear that public-private partnerships are crucial to develop efficient and low
carbon last mile mobility solutions.
Urban freight transport and delivery services involve many different stakeholders, both
those within the urban area that are not directly involved in the freight transport
movements (city authorities, residents, tourists/visitors) and the actors in the supply
chain. The latter can be categorised according to the demand for goods (receivers), the
supply of goods (shippers or producers) and finally the transport of goods (transport
operators). The interaction between these stakeholders increases the complexity of the
search for solutions to achieve sustainable urban distribution.
The role of the private sector consists in the private initiatives, that can be in cooperation
amongst agents and can be part of an urban freight transport policy, particularly when
public measures are taken to support this. Among private players and representatives are,
primarily, the individual businesses and companies. Logistics service providers ensure the
distribution process and the delivery of the product to the consumer. Their main role is
distribution, warehousing and other supporting activities.Usually logistics service
providers, due to the fact of being private entities, do not consider themselves as key
players whose strategies, behaviour and actions are key issues to whether or not solutions
proposed by the city will be successful and beneficial to the city and to themselves as
commercial operators. Usually they tend to complain on the regulations implemented by
cities even if these regulations focus on the congestion relief. This is because operators
mainly experience problems at an operational level and do not typically consider the wider
scope of the problems and proposed solutions. The private actors’ main interest is to find
10
A T 2.2
those aspects which help to improve their own businesses, or which can endanger their
profitability lines. This includes a strong preference for short and mid-term solutions. On
all else they usually will soon lose interest.
The private actors work in a competitive environment. They are generally willing to
cooperate on common issues – but usually they will never accept cooperation with a
competitor on a core issue. Even if such cooperation appears unavoidably reasonable to
them, they may nevertheless prefer if each works separately with the same neutral
institution. Furthermore, a number of professional logistics operators may run facilities for
cross-docking, etc., in a city and/or suburban areas.
Regulating activities should also be a task for the local authorities. Public local
administrations usually regulate essential areas of urban freight transport, mainly those
referred with access restrictions (tonnage and size). By regulating implemented measures
as access restrictions, optimization of routes, innovative financing models, etc., one can
identify and differentiate strategic plans/issues.
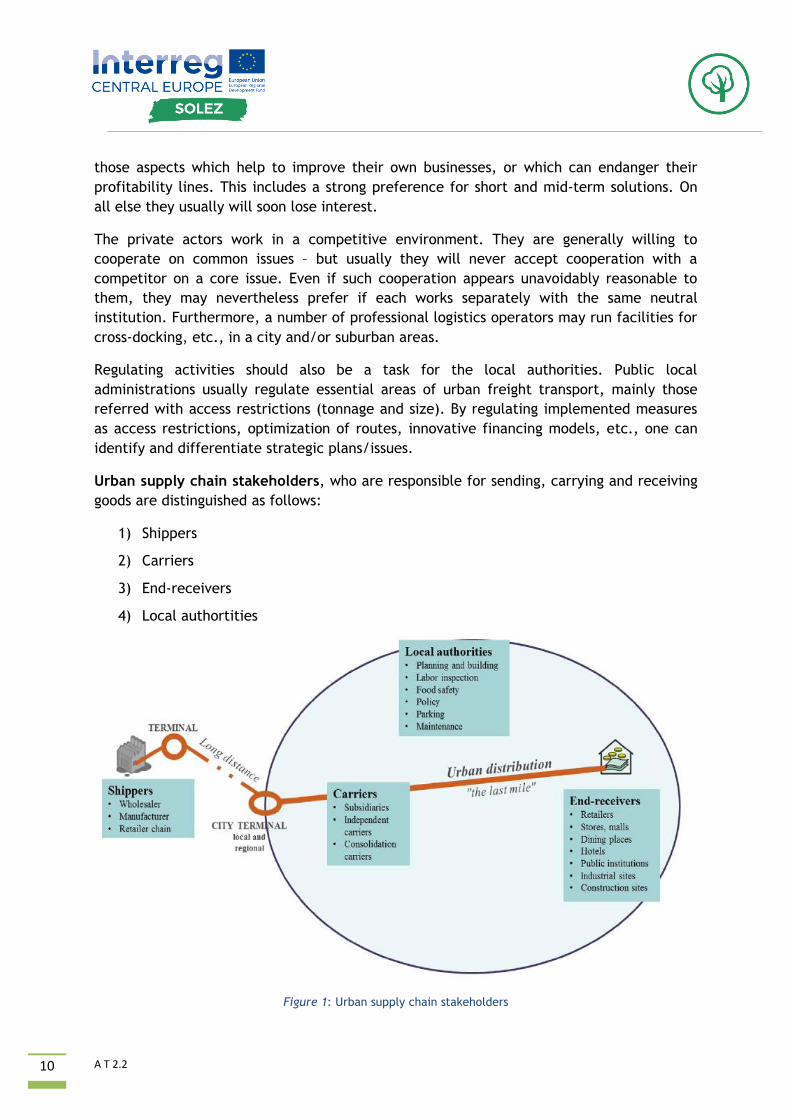
Urban supply chain stakeholders, who are responsible for sending, carrying and receiving
goods are distinguished as follows:
1) Shippers
2) Carriers
3) End-receivers
4) Local authortities
Figure 1: Urban supply chain stakeholders
11
A T 2.2
1) Shippers - manufacturers, wholesalers, retailers, etc.
Shippers send goods to other companies or persons and are often not located in the city; as
a result they usually do not feel responsible for urban freight transport issues. They tend
to maximise their levels of service in terms of costs and reliability of transport. In many
cases the shipper is the stakeholder responsible for hiring a carrier.
2) Transport operators - freight carriers, couriers, etc.
Transport operators usually aim at minimising their costs by maximising the efficiency of
their pick-up and delivery tours, and they are expected to provide a high level of service at
low cost. There is a trade-off between a high level of service and the efficiency of freight
vehicles loads. Transport operators are the stakeholders carrying out urban freight
transport, but in many cases they are restricted by boundaries set by others (e.g. opening
hours of stores or designated time windows to make the deliveries). Transport operators
are active in a geographically larger area than the city.
3) End-receivers – shopkeepers, offices, construction sites, residents, etc.
Receivers are located in the urban areas and are mostly the endpoint of the logistics chain.
Receivers are often not responsible for urban freight transport since shipments are
organised and paid for by the shipper (so for the receiver the transport price is included
within the rice of the ordered goods).
In many cases receivers do not realize that they can and do influence urban freight
transport by, for example, setting time windows. However, as the receiver is often the
only supply chain actor located in the city, they can better identify with local issues than
transport operators and shippers who are usually active across a larger geographical area.
4) Local Authorities
The role of Local Authorities in terms of freight transport and delivery governance is
essential for facilitating a freight movement that should fluent, effective and
environmentally, economically and socially friendly. Local Authorities have several ways to
influence urban freight transport and delivery services: setting regulatory and policy
framework conditions, getting involved as a player themselves, etc.. By involving relevant
stakeholders local administrations can identify problems perceived by those relating
freight delivery in city, identify measures to resolve such problems and identify good
practice measures and principles to promote economic, economical and efficient delivery
of goods.
Local Authorities are in charge of set-up and implement the following common
interventions:
• regulative measures in terms of incentives (e.g. extension of time slots to access
urban area, incentives for the adoption of ICT systems, incentives to purchase
12
A T 2.2
freight vehicles with low environmental impact, incentives for converting
traditional freight vehicles to natural gas and/or LPG fuelled vehicles, etc.);
• regulative measures in terms of restriction in accessing the city for vehicles used
for purposes of delivery and collection of goods (e.g. restrictions on the time slots
to access the city center, limiting times to load/unload, limiting access to some
types of freight vehicles identified on the basis of the relative emission factors
and/or weight, creation or extension of pedestrian areas and/or LTZs, access
permissions, etc.);
• pricing measures (e.g. payment to access a specific urban area, payment to transit
on a specific road corridor, charging for parking, etc.);
• organizational measures designed to create alternative distribution and eco-friendly
systems to ensure continuity of good delivery and collection supply within the areas
of restriction.
2.3 Impacts of freight transport and delivery services in urban context
Transport contributes significantly to economic growth and enables a global market.
Transport activities give rise to environmental impacts, accidents, congestion, and
infrastructure wear and tear.
In contrast to the benefits, the costs of these effects of transport are not fully borne by
transport users. Without policy intervention, the so-called external costs are not taken
into account by transport users when they make travel decisions. The internalisation of
external costs means making such effects part of the decision making process of transport
users. Internalising the external costs of transport has been an important issue for
transport research and policy development for many years in Europe and worldwide. The
internalisation of these costs means making such effects part of the decision making
process of transport users. This can be done directly through regulation, such as command
and control measures or indirectly through providing the right incentives to transport
users, namely with market-based instruments (e.g. taxes, charges, emission trading, etc.).
External costs refer to the difference between social costs and private costs. Social costs
reflecting all costs occurring due to the provision and use of transport infrastructure, such
as wear and tear costs of infrastructure, capital costs, congestion costs, accident costs,
environmental costs. On the other hand, private (or internal costs), directly borne by the
transport user, such as wear and tear and energy cost of vehicle use, own time costs,
transport fares and transport taxes and charges.
The available literature suggests that road transport’s share of the economic cost of
premature deaths – when properly calculated – is likely to be about 50% across the EU,
albeit not in each Member State (OECD, 2014). As far as their contribution to air pollution
is concerned, diesel vehicles are more harmful than petrol vehicles. In contrast to petrol
vehicles, diesel vehicles have not shown significant reduction in Nox emissions since the
1990s. Exhaust emissions from such vehicles are lower for carbon monoxide, non-methane
13
A T 2.2
volatile organic compounds and PM, but may be substantially higher for NOx. The fraction
of NOx emitted as NO2 by diesel vehicles is high – at around 25–30%, as opposed to a few
percent for petrol vehicles – and has shown a variable rather than downward trend over
the years (Carslaw & Rhys-Tyler, 2013; Carslaw et al., 2011).
The most recent studies that offer estimates broken down by sector support an estimate of
about 50% responsibility (directly or indirectly) for the damage inflicted by the road
transport sector in EU countries. These indicate that in the WHO European Region road
transport and household fuel combustion combined account for the majority of the
impacts. No other single source, such as industry, power generation, agriculture, transport
(other than motorized road transport) contributes as much. Existing studies on external
costs have mainly concerned road transport. The evidence shows that road transport has
by far the largest share in total external costs of transport.
Urban freight transport plays an important role in the development of cities representing
an element of great importance for the economic system, mainly distributing goods to
retail, commercial establishments, offices, as well as homes. Nevertheless, urban freight
transport can have relevant negative impacts on the environment, the economy and the
society in general.
Common negative externalities are air and noise pollution, and the consumption of non-
renewable energy sources, mainly fuel. High levels of pollutant emissions have negative
effects on public health.
Urban freight transport and delivery services cannot be seen separately from other parts of
the transportation chain, particularly when focusing on environmental aspects. Freight
transport in European cities has increased rapidly in the past decades, and hence freight
transport vehicles increasingly demand space for delivery and parking in the cities,
compete with other public and private mobility groups, cause congestion, make
distribution of goods and services less efficient, and ultimately threaten the quality of a
sustainable urban environment. Congestion can be considered as one of the main negative
externalities, causing delays in the delivering of goods, higher costs of logistic operators,
decreased hours of productive service, increased emissions, more accidents, etc.
Freight transport and delivery services in urban context is associated to the following key
problems:
• delivery vehicles circulating throughout the city centre aggravating congestion,
• pedestrian zones full of large, noisy delivery vehicles during working hours,
• double parking during loading and unloading due to the illegal occupancy of
reserved delivery bays,
• delivery vehicles entering the city’s pedestrian zones,
14
A T 2.2
• emissions of noise and air pollution,
• deterioration of the urban environment.
Even if freight transport logistics in urban areas represents only 10% of private traffic,
when it comes to the average of daily km (even 7 times more than a private vehicle for the
transport of people) and to the type of vehicles (powerful diesel engines), their impact on
the quality of air is considerable.
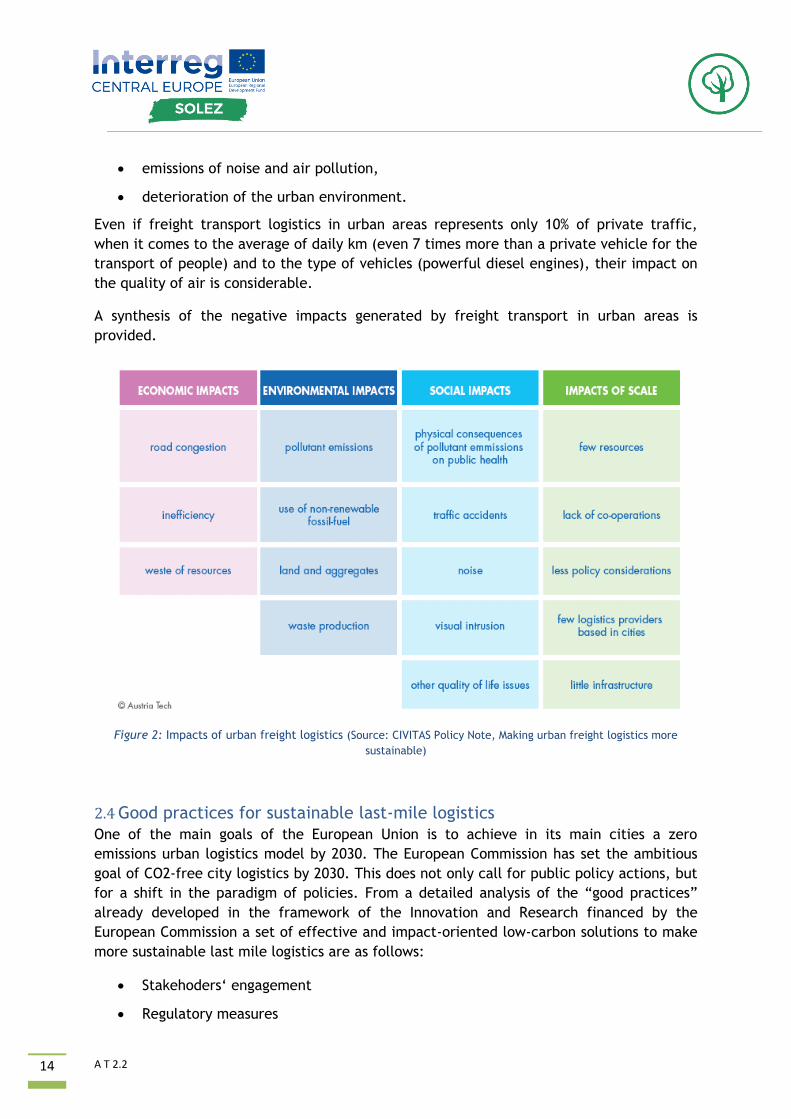
A synthesis of the negative impacts generated by freight transport in urban areas is
provided.
Figure 2: Impacts of urban freight logistics (Source: CIVITAS Policy Note, Making urban freight logistics more
sustainable)
2.4 Good practices for sustainable last-mile logistics
One of the main goals of the European Union is to achieve in its main cities a zero
emissions urban logistics model by 2030. The European Commission has set the ambitious
goal of CO2-free city logistics by 2030. This does not only call for public policy actions, but
for a shift in the paradigm of policies. From a detailed analysis of the “good practices”
already developed in the framework of the Innovation and Research financed by the
European Commission a set of effective and impact-oriented low-carbon solutions to make
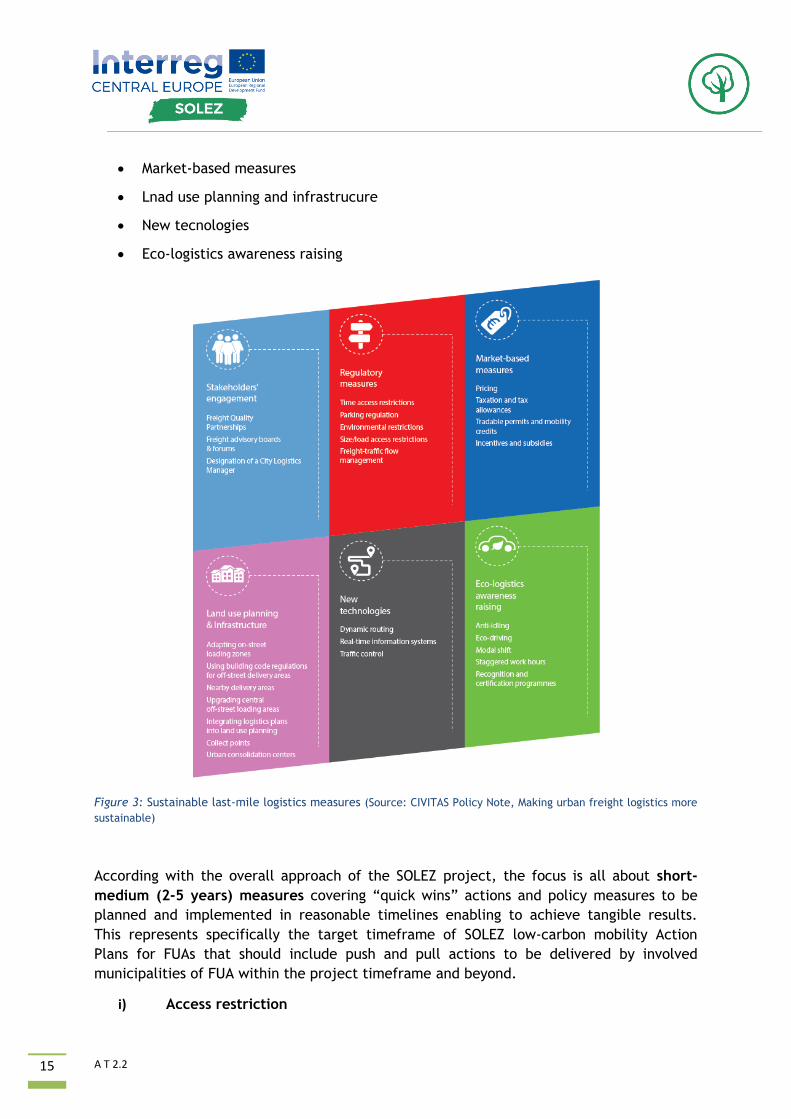
more sustainable last mile logistics are as follows:
• Stakehoders‘ engagement
• Regulatory measures
15
A T 2.2
• Market-based measures
• Lnad use planning and infrastrucure
• New tecnologies
• Eco-logistics awareness raising
Figure 3: Sustainable last-mile logistics measures (Source: CIVITAS Policy Note, Making urban freight logistics more
sustainable)
According with the overall approach of the SOLEZ project, the focus is all about short-
medium (2-5 years) measures covering “quick wins” actions and policy measures to be
planned and implemented in reasonable timelines enabling to achieve tangible results.
This represents specifically the target timeframe of SOLEZ low-carbon mobility Action
Plans for FUAs that should include push and pull actions to be delivered by involved
municipalities of FUA within the project timeframe and beyond.
i) Access restriction
16
A T 2.2
Access restrictions for urban freight transport is one of the key soft countermeasures with
regard to traffic optimisation, considered as the dominant instrument for authorities to
influence urban goods transport in city centres in particular. Access restrictions are
widespread in Europe and there are several projects addressing this measure, as per the
state of the art review carried out. Due to the diversity in terms of layout and access
parameters creating the basis for each individual city access scheme, these are usually
based on an analysis of goods deliveries in the city centre that ultimately determine time,
type, tonnage and other relevant restriction parameters, the spatial extension of the
restricted access area, and the most suitable intelligent control mechanisms.
Currently applied restrictions are of the following types: (a) regulations related to the type
of transport means, and most commonly to vehicle emissions, weights and sizes; (b)
regulations related to the access time to specified areas; (c) regulations related to
preferred truck routes and designated lanes; (d) regulations related to loading and
unloading zones; (e) regulations based on licences.
The project START in Bristol sought to prioritize freight vehicle movements and introduce
access control measures including the implementation of 3 km priority lane, resulting in a
78% reduction of vehicle movements among the participating companies. Delivery time
window restrictions are also popular measures for reducing congestion caused by urban
freight vehicles.
There may be a number of consequences for freight transport companies not allowing
activities during specified time windows:
• more vehicles may be required to make deliveries in a shorter delivery window
• deliveries may have to be made in periods of greater congestion (reducing vehicle &
driver productivity and increasing fuel consumption)
• journey times may be slower and less reliable
• supply chain may be less efficient
• total supply chain costs may be increased
For the main pedestrian area of Broadmead, in Bristol (START), a delivery window has been
put in place, notably between 5:00 – 8:00 am. For the new Quakers Friars Pedestrian area
in the city the window was 5:00 – 10:00am. This has a raised a number of issues between
retailers and their suppliers with the beneficiary being the Bristol consolidation scheme as
they are able to offer an improved delivery option to retailers, particularly in the Quakers
Friars area. The measure has resulted in 8 new retailers joining the scheme, while the city
council reached the objective related to reducing the pollution and a creating new
pedestrian area that improves the quality of life.
START in Ravenna regulated the access to the city centre through the implementation of
the access monitoring system (SIRIO) with 5 detecting points with automatic number plate
recognition (ANPR) system, for the enforcement of the new traffic regulations. START in
Riga implemented a historical centre access restriction scheme, with regulations governing
17
A T 2.2
access depending on the environmental quality of vehicles. With the aim to reduce
congestion and pollution in the Old Riga city centre in Latvia, (START) the Municipality had
implemented traffic restrictions addressed to vehicles with a total weight exceeding 5
tons. These were restricted on several bridges and access roads of the city on the peak
hours (4 pm to 7 pm) during weekdays. SMILE (Norwich) proposed measures to allow goods
vehicles, which met pre-determined clean vehicle standards, to use transport priority
lanes.
The Sustainable Freight Distribution in a Historic Urban Centre (Pilot Transport Research
Programme) City Centre Access Control project also introduced access control measures in
the city of Dublin, Ireland. Brescia in Italy (CIVITAS: MODERN) is introducing access
restriction measures for more efficient freight distribution that will decrease delivery
times, energy use and pollution, as well as significantly reduce the amount of freight
traffic in the city. In addition, CIVITAS MODERN for Vitoria – Gasteiz, Spain proposes a new
urban freight strategy that will be an integral part of the city’s new mobility concept of so-
called superblocks that largely limit traffic to certain main roads and prioritise walking and
cycling. The distribution from these centres can be realised during times of low traffic
density during the day or at night with energy-efficient vehicles. The advantages
associated with access restriction measures are several, the most important being that
they reduce congestion and pollutant emissions from urban freight traffic vehicles into the
city centre, they reduce conflicts between delivery vehicles and other road users, thus
improving the situation for pedestrians and cyclists in the city centre, while freeing up
public space for local social activities. In addition, can shorten journey times and improve
journey time reliability making the scheme more attractive to both stakeholders and
retailers together with changing the attitudes of delivery companies and increasing public
awareness about the benefits of a sustainable urban freight transportation system.
As a result of continuing increases in urban traffic in Prague, an extension of the existing
environmental zone was implemented (CIVITAS: TRENDSETTER) in order to limit access by
heavy goods vehicles to other densely populated neighbourhoods, adjacent to the existing
zone.
The areas selected were those where the road network and conditions made
implementation feasible, and where limiting heavy goods vehicles could be expected to
have a significant impact. Information leaflets were printed and the articles were
published in the local newspaper to raise awareness of the extension to the environmental
zone. The extension of the environmental zone also put pressure on haulage companies to
gradually renew their fleets with modern, light and medium-weight goods vehicles that run
on cleaner fuels, create less noise and are less disruptive to other urban traffic. The
measure achieved a reduction in emissions of carbon dioxide, nitrogen oxides and
particulates, a reduction in energy consumption and a change in the fleet towards cleaner
vehicles.
18
A T 2.2
ii) Optimization of freight transport and delivery routes
Optimisation of freight transport and delivery routes is also a common practice with regard
to freight transport optimisation. This measure refers to channelling trucks that drive into
cities of the urban agglomeration through designated truck routes. Advisory or statutory
truck routes can be used by the urban authorities to prevent goods vehicle drivers using
unsuitable or sensitive routes.
Methods include the provision of maps and the use of real-time information. Maps can be
produced in paper and electronic form. These can be distributed by local trading
companies, freight transport companies, freight trade associations, motoring associations
and urban authorities.
Tallinn (CIVITAS: MIMOSA) defined freight traffic corridors in the city centre, marked them
and installed traffic signs to guide freight vehicles. To this end, signs and devices were
installed at 43 critical points along the defined corridor. The city also planned to develop a
GPS navigation system to mark routes and guide freight traffic according to truck drivers’
needs. This GPS system would be distributed to logistics firms and truck drivers together
with general information about the new traffic corridor. The Urban Truck Navigation
project was based on two municipalities in the Ruhr District, Germany, which developed
'truck routing plans' for their jurisdiction. These plans identified streets that were
particularly suitable, and from an overall city perspective, the 'ideal' routes for freight
traffic going into or through the city. However, even though the plans were published on
the internet and disseminated to freight companies and lorry drivers, these were not
adopted by companies and drivers. It should be noted that whilst advisory truck routes
require little or no enforcement, statutory routes (which prohibit lorries from using non-
designated routes) require enforcement, and are therefore more complex and expensive to
implement and manage.
In addition, Urban Truck Navigation study showed that lorry drivers nowadays rely mostly
on onboard navigation devices and not on fold-out maps. However, to implement the
project each municipality has to update street information relevant for trucks and
designate truck routes, which is a time-consuming and potentially controversial political
task.
iii) Low-carbon freight delivery systems: Collection points, Urban Distribution
Centres
To reduce the impact of deliveries on both traffic congestion and local air quality in the
historic centre of Winchester city, CIVITAS, MIRACLE examined the feasibility of an
alternative delivery system. The company Collectpoint plc, offered an alternative to home
delivery, primarily to Internet shoppers. Collectpoints were located in convenience stores,
the main benefit of the service being the reduction in failed deliveries and the subsequent
return of goods by couriers and postal services. With the support of MIRACLES, Collectpoint
plc expanded their services within the city to a total of five locations. In addition to the
Collectpoint service, a Winchester freight map was produced for road freight operators and
19
A T 2.2
drivers of commercial vehicles, showing appropriate routes, the main delivery
destinations, and vehicular restrictions. The benefits of this particular good practice were,
however, difficult to evaluate due to lack of public response in the trial, since from the 56
people registered in the collect point exercise, only 8 used the service. Part of the
measures of creating an alternative concept for goods distribution with a smaller
environmental impact in the city of Genoa (CIVITAS, CARAVEL), was the rationalisation of
vehicle use by traders through the introduction of a van-sharing service. The van-sharing
service proved successful, with fewer commercial vehicles entering the target area and
less road congestion. Main results indicated an increase of 19% in the number of trips using
the van-sharing service, 46% in kilometres covered and 69% in hours.
City of Parma in Italy, for example, activated the last mile service (ECOCITY) that uses low
environment impact vehicles for urban goods deliveries. The methane and electric vehicles
carry full loads to reduce empty traffic and environmental impact. This new urban freight
transport service involves every key role of the urban distributive process of the goods in
the chosen areas (areas with traffic limitations, environmental pedestrian and cycling
areas or areas with urban importance): economic activities operators (e.g. forwarding
agents, couriers), logistic platforms and/or intermodal centers, local administrations (e.g.
Municipality, Province, Region), trade associations (e.g. transport associations, commercial
associations, craftsman associations, industrial associations) and citizens.
CIVITAS SMILE set up a freight consolidation centre on the edge of the urban core of the
city of Norwich, UK. In conjunction with other measures, such as engine standards
restrictions, a reduction of goods vehicles within the urban core was achieved, while those
therein produced lower emissions. Utrecht in the Netherlands has four City Distribution
Centres (CDC) that are run by well-known logistics companies (TURBLOG). Carriers and
suppliers unload their cargo for the city at a CDC, situated at the edge of the city. As soon
as goods are received at the CDC, they are coded in the logistics system and are loaded
into buses or small lorries with the right sizes and requirements to enter the inner city of
Utrecht. Therefore, these are confronted by fewer restrictions and can easily deliver the
goods to the right places. The consolidation of deliveries in urban freight hubs and
consolidation/distribution centres at the edge of a city is one of the most successful
measures employed to achieve energy efficient urban freight transport, since, as
demonstrated by the above projects, it results in significant reduction of trips within the
city, and, consequently reduction of congestion and emissions. Nevertheless, such
measures are associated with high investment costs, land area requirements, as well as
strong cooperation from the private sector.
iv) Zero emissions freight delivery systems: last-mile delivery services by cargo
bikes
In the main European cities the delivery by cargo bike is increasingly widespread. Such
tendency is strongly expanding especially thanks to the increasing volumes delivered
through the channels of e-commerce. The advantages in delivering using bikes instead of
freight transport vans are:
20
A T 2.2
• lower costs: lower purchasing costs, lower management costs (taxes, insurances,
storage) and no parking costs;
• in central areas bikes are lesser affected than van by the traffic conditions;
• lower environmental impact: CO2 emissions reduction;
• social inclusion: a driving licence is not requested to ride a bike and disadvantaged
people may be employed as a first step in their inclusion in the labour market;
• better quality of life: no noise pollution, more space for people.
Many opportunities for using bikes for freight are emerging, in particular in busy,
congested urban centres where parking is expensive and journey times by motorised
transport are slow. Pollution levels are also becoming more of a concern as air quality
controls tighten up. The most powerful argument for using bicycles for goods delivery for
the majority of businesses is the lower cost compared with motorised transport. The legal
frame conditions surrounding cargo cycle use vary across Europe. Current EU Law says that
a vehicle which has pedals, and a motor with less than 250 watts of power which is
progressively reduced as speed approaches 25 kph, and cut out at 25 kph is not a motor
vehicle. If the motor exceeds 250 watts, or does not reduce & cut out at 25kph, or has no
pedals, then it is a motor vehicle and not a bike. The vehicle must also weight no more
than 40kg, or 60kg if it is a tandem. Working within these outlined constraints means that
cargo cycles may become an economically attractive solution to some organisations
providing added-value services.
Several studies proved that the cargo bike model could handle 25% of the delivery of goods
in urban areas. The good practices are nowadays widely spread in all the countries of the
European Union.
In Germany, in the framework of the Climate Initiative, bike and car couriers are testing
the potential of electric cargo bike for urban commercial transport in seven different cities
(Ich ersetze ein Auto).
In Romania, the first bike courier service in Bucarest started in April 2012. Tribul (the
tribe) delivers packages door-to-door through the whole city. In May 2012, the city of
Ghent (Belgium) installed the firs cargobike-sharing public service in Europe. $ cargo bikes
are part of the car-sharing service Cambio available in the city. The Flemish government
has also started to actively promote bike courier services in the Flanders, after a study of
the University of Antwerp (in Dutch) that analysed the potential of involving bike couriers
in the logistics of Flanders. Furthermore, in Switzerland since 1997 already, a door-to-door
bike delivery service delivers home the products bought at the supermarket. Given its
success (21% of the clients changed its shopping habits abandoning the car for the bike or a
walk instead), 12 new services have been realised in the whole Switzerland.
The French company La Petite Reine delivers 1 million of packages yearly with electric
tricycles (Cargocycles, FR) in four large French cities, including Paris. In the United
21
A T 2.2
Kingdom cargo bikes are used for the transport of several types of goods: digital
projectors, office furniture, postal packages (like Yellow Jersey Delivery in Coventry). In
Hungary the courier company Hajtás Pajtás freed Budapest from 100 vehicles, with
estimated savings in CO2 yearly emissions of around 150 tons.
Using cycles for the ‘last mile’ deliveries is particularly attractive as they offer much
greater efficiency and flexibility than motorised transport, saving time and money. Other
points in favour of using cycles are the contribution they make to reducing CO2 and
pollution which helps to create more ‘liveable cities’. At present, in many cities, deliveries
are done in small vans and some of these deliveries could potentially be transferred to
cycles. The Transport for London (TfL) scoping study found that where this had been tried
by larger companies, there were successes in some European countries with high
proportions of cycling, but a pilot in London by a large logistics company had not been
successful. It was felt that some changes could prevent the difficulties that company
experienced, including improved payload capacity and route planning, both of which have
come about in the years since the study was written. Currently, international freight
companies - TNT, FedEx and DHL – are experimenting with freight cycles for delivery,
especially in cities.
Even within the SOLEZ project there are already success initiatives in this field such as
Graz that granted up to 1.000 euro to the companies and institutions like schools,
associations, etc. willing to buy cargo bikes and introduced cargo bike in it rent-a-bike
services. Vicenza has now a ten years experience in delivering goods within the LTZ with
the “VELOCE LOGISTICS” service and, finally, in Torino a start up of the Politecnico di
Torino “PONIZERO” is active since 2015 and after years only has already 50 cargo bikes
running on behalf of the main express couriers such as TNT, UPS and GLS.
3 Urban freight transport and supply chains A simple definition of freight transport in cities is as follows: all movements of goods in to,
out from, through or within the urban area made by light or heavy vehicles, including
service transport and demolition traffic as well as waste and reverse logistics. Household
purchasing trips are not considered to be part of urban freight transport as these are
considered to be passenger transport trips. Urban freight affects in a relevant way the
quality of people’s life, since it is an important traffic component in cities and it is
responsible for 25% of urban transport related CO2 emissions and 30 to 50% of other
transport related pollutants (particulate matter, Nitrogen Oxide). In this context, it is
fundamental to understand the potential for stakeholders’ cooperation, including the need
of new business models, in order to improve city logistics efficiency and sustainability. The
different interests of actors involved in urban logistics (local authorities, shippers, retailers
and logistics service providers and consumers) need to be addressed to find solutions
satisfying all of them.
Synergies and collaboration in the supply chain can produce significant gains in terms of
efficiency and sustainability; they represent a big step towards the transition from
22
A T 2.2
individually managed supply chains to open supply networks that are expected to provide
better asset, vehicles and infrastructure utilization (e.g. load factors, etc.). This is
possible through the creation of connected neutral data sharing platforms between
shippers, intermodal terminals operators, logistic service providers and added-value
service providers to connect freight transport offer and logistics demand. The challenge in
this area is to build appropriate business models enabling extensive scale-up of current
isolated examples. Building trust among operators and in technology is a key aspect to be
addressed.
On the other hand, gains on the freight vehicle side are expected to come from the
increased efficiency of vehicles but also from the progressive deployment of alternative
fuels and vehicles more adapted to freight transport operations in cities. The aim should
be providing commercial vehicles able to fulfil the needs of an integrated logistic system.
Achieve a zero or neutral freight logistic emissions by 2050 is a sound objective.
Considering the forecasted growth of freight transport and logistics for 2030 and 2050,
current emissions and the international agreement to keep average global temperature
«well below» 2°C above preindustrial times, a reduction of about 80-85% of emissions per
shipment is needed. The target of a free (neutral) Carbon Footprint City Logistics in 2030
set by the White Paper is as challenging as important. Ambitious targets need to be set for
2050. European Commission and ALICE (Alliance for Logistics Innovation through
Collaboration in Europe) may embrace these targets in a clearer way within their strategy.
The full integration of urban freight in the city depends on the evolution of people
lifestyle. Different models of urban development and regional land uses together with
demographic trends and the new behavioural patterns such as teleworking or e-commerce
impact the organisation of last-mile delivery. Available technologies allow door-to-door
delivery at any time, thus generating many trips that impact strongly on the urban traffic.
New business models, like crowd-shipping or crowd-delivering, can have an impact on the
demand for passenger transport and goods transport, that could become either
complementary or antagonistic. The consequences of these consumption patterns should
be evaluated to implement measures able to harness the opportunities offered by
technological development and preserve the quality of life of our cities.
3.1 Specific supply chains chain in urban freight transport and delivery
services
SOLEZ Action Plans for the FUAs cover short-medium timeframe and vision identifying a set
of low-carbon mobility actions and measures connected with traffic regulation and access
restriction schemes (including LEZ, LTZ, etc.), contributing to reduce the negative side
effects of these so-called “push” interventions. These actions are the so-called “pull”
interventions being measures designed to encourage more sustainable and low-carbon
mobility by offering added-value services, ICT-based applications for low-zero emissions
delivery services, for sharing public transport reserved lines, etc.
Urban freight traffic includes many delivery services for private households, from parcel
couriers to takeaway delivery services. In today’s world, many of the retail stores belong
23
A T 2.2
to chains. This is the truer for the big supermarkets and department stores, but many
specialized chain stores also exist.
These stores in total make up a big share of urban goods traffic. For urban logistics
schemes, that is not without consequences: these chain stores have their own delivery
strategies, and they are centrally developed by the respective chain. Often, the individual
stores of such a chain get their goods mainly via a logistics operator with whom the chain
has a contract.
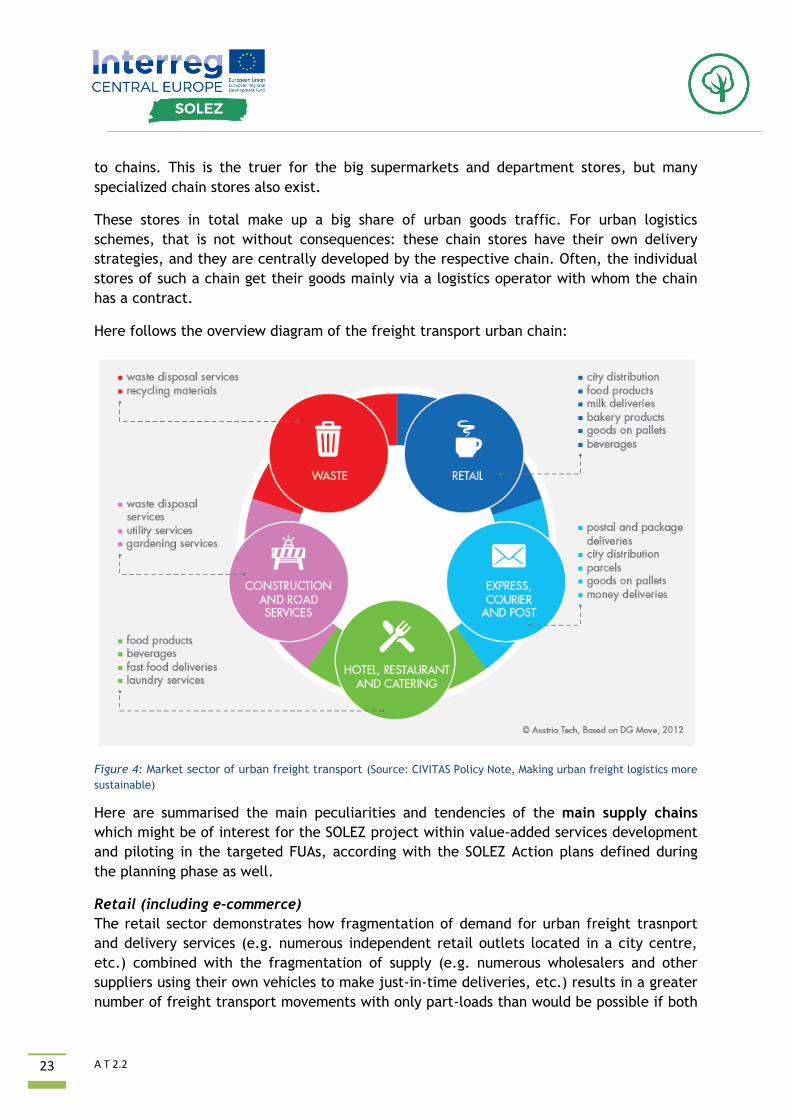
Here follows the overview diagram of the freight transport urban chain:
Figure 4: Market sector of urban freight transport (Source: CIVITAS Policy Note, Making urban freight logistics more
sustainable)
Here are summarised the main peculiarities and tendencies of the main supply chains
which might be of interest for the SOLEZ project within value-added services development
and piloting in the targeted FUAs, according with the SOLEZ Action plans defined during
the planning phase as well.
Retail (including e-commerce)
The retail sector demonstrates how fragmentation of demand for urban freight trasnport
and delivery services (e.g. numerous independent retail outlets located in a city centre,
etc.) combined with the fragmentation of supply (e.g. numerous wholesalers and other
suppliers using their own vehicles to make just-in-time deliveries, etc.) results in a greater
number of freight transport movements with only part-loads than would be possible if both
24
A T 2.2
demand and supply were more concentrated. The larger retail chains have greater volumes
of freight traffic and are more likely, by working with their logistics providers, to be able
to optimise their deliveries in terms of overall efficiency. While diversity in the retail
sector provided by small and medium-sized independent retail outlets offers greater
choice for consumers and can be seen as providing wider benefits to society, economies of
scale in the provision of freight transport services in all sectors tend to lead to greater
logistics efficiency, lower costs and more sustainable distribution.
Since the major retail groups are important players for distributing goods to their stores in
urban areas, the evolution of their supply chain has influenced urban freight transport and
delivery.
The increased proportion of shop supplies delivered in consolidated loads from retailer-
controlled distribution centres and a corresponding decline in the multiple drop deliveries
of manufacturers and wholesalers promoted the consolidation of loads in larger vehicles.
From the large retail chains’ point of view, this has meant an increase in efficiency,
making better use of each vehicle's carrying capacity and increasing the fill-rate. This
trend has led to issues for the retailers when vehicle weight restrictions are imposed in
urban areas because they have been unable to optimise the fill-rates for their vehicles,
but, at the same time, the decentralisation of shops to the periphery of urban areas has
reduced the need for lorries to penetrate urban centres. However, while the
decentralisation of retail activity has decreased freight traffic in urban areas, it has
increased the number of shopping trips made by private car, increasing urban and
suburban road congestion and pollution emissions.
In this context, the operators of all product groups with no distinction are increasingly
exploiting dedicated logistic structures, able to handle with higher efficiency the growing
flows of goods generated by the on-line purchases. The main difficulties affect the ones
operating in the food sector, where the perishability of the goods, together with the
specific conditions of storage and transport needed by the different types of goods,
requires a more fragmented and less efficient planning of the deliveries. The most pressing
challenge for the operators of such sector is to conjugate profitability, convenience for the
final consumer, safe transport and delivery granted.
The growth in the use of the Internet has led to the rapid development of e-commerce,
which currently appears to be one of the fastest growing marketing channels for different
kinds of products and services. Business-to-business (B2B) e-commerce accounts for by far
the largest share of trade, whereas the share of business-to consumer (B2C) transactions is
still small, not only compared to B2B transactions but also compared to traditional
retailing.
Although B2C e-commerce still accounts for a small market share compared to
conventional retail activity, it is growing very fast. In this high value potential market
efficient and reliable logistics is a key factor of success, even more than with a traditional
retail business.
25
A T 2.2
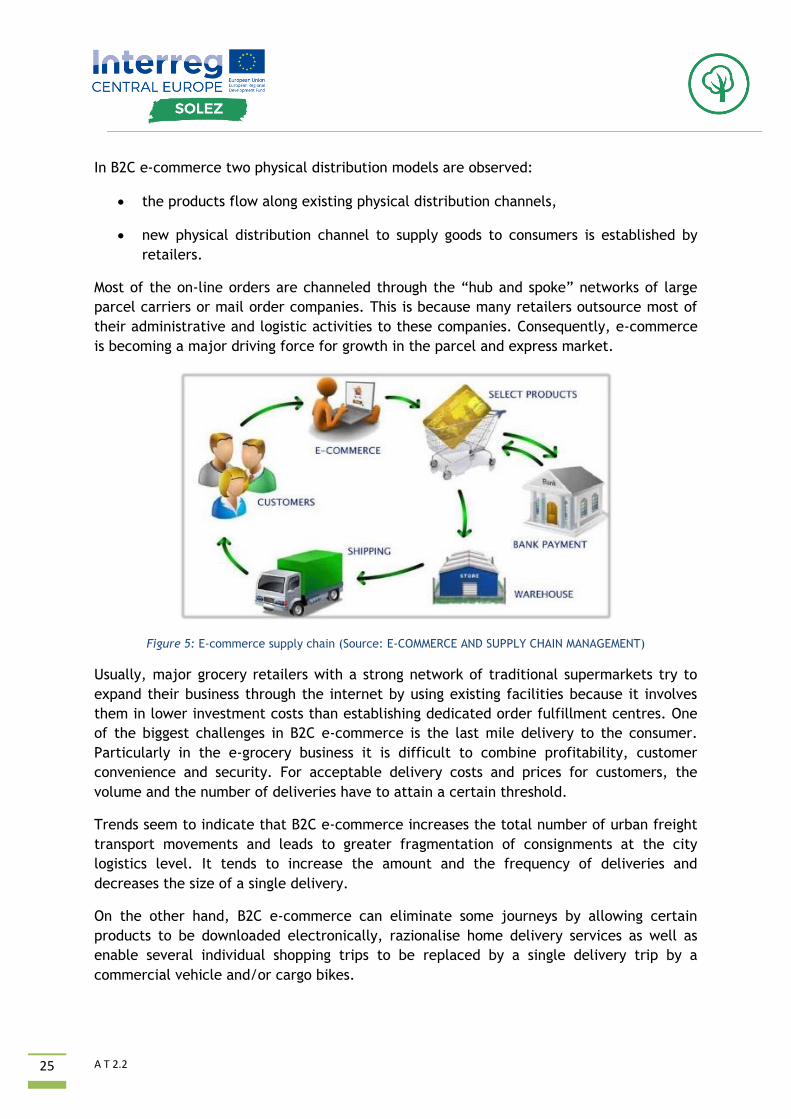
In B2C e-commerce two physical distribution models are observed:
• the products flow along existing physical distribution channels,
• new physical distribution channel to supply goods to consumers is established by
retailers.
Most of the on-line orders are channeled through the “hub and spoke” networks of large
parcel carriers or mail order companies. This is because many retailers outsource most of
their administrative and logistic activities to these companies. Consequently, e-commerce
is becoming a major driving force for growth in the parcel and express market.
Figure 5: E-commerce supply chain (Source: E-COMMERCE AND SUPPLY CHAIN MANAGEMENT)
Usually, major grocery retailers with a strong network of traditional supermarkets try to
expand their business through the internet by using existing facilities because it involves
them in lower investment costs than establishing dedicated order fulfillment centres. One
of the biggest challenges in B2C e-commerce is the last mile delivery to the consumer.
Particularly in the e-grocery business it is difficult to combine profitability, customer
convenience and security. For acceptable delivery costs and prices for customers, the
volume and the number of deliveries have to attain a certain threshold.
Trends seem to indicate that B2C e-commerce increases the total number of urban freight
transport movements and leads to greater fragmentation of consignments at the city
logistics level. It tends to increase the amount and the frequency of deliveries and
decreases the size of a single delivery.
On the other hand, B2C e-commerce can eliminate some journeys by allowing certain
products to be downloaded electronically, razionalise home delivery services as well as
enable several individual shopping trips to be replaced by a single delivery trip by a
commercial vehicle and/or cargo bikes.
26
A T 2.2
Express services, couriers and postal and mail services
Parcel, courier and express transport services are one of the fastest growing transport
businesses in cities. This sector uses large vans or small to medium sized trucks and is
based on consolidated delivery and collection tours departing from cross dock terminals
located in close proximity to suburban areas. An express courier delivery trip can involve
70-90 deliveries, while a traditional parcel delivery tour serves about twenty receivers.
This is because the express couriers’ network and planning processes enable them to
increase the efficiency of their delivery tours.
The two main operational features of these operators are time pressure and
standardization of procedures, so ideally they need to be able to collect and deliver to all
the cities they serve in the same time window and move freely to and within the relevant
urban areas.
Within this field there are two sectors: the one of the postal services as such (mail ,
registered mail, and dispatch of publications) and the one of rapid deliveries and delivery
of postal packages. Future trends seem to indicate a likely decline in the sector of postal
services as such.
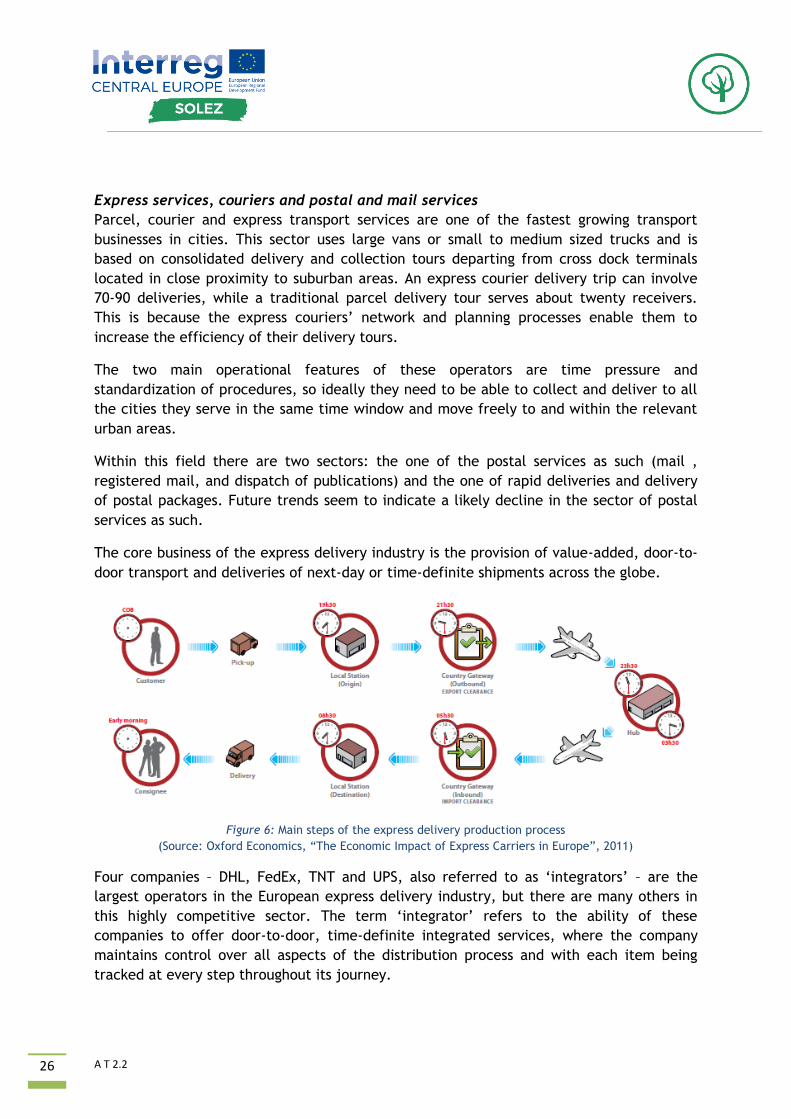
The core business of the express delivery industry is the provision of value-added, door-to-
door transport and deliveries of next-day or time-definite shipments across the globe.
Figure 6: Main steps of the express delivery production process
(Source: Oxford Economics, “The Economic Impact of Express Carriers in Europe”, 2011)
Four companies – DHL, FedEx, TNT and UPS, also referred to as ‘integrators’ – are the
largest operators in the European express delivery industry, but there are many others in
this highly competitive sector. The term ‘integrator’ refers to the ability of these
companies to offer door-to-door, time-definite integrated services, where the company
maintains control over all aspects of the distribution process and with each item being
tracked at every step throughout its journey.
27
A T 2.2
The express delivery industry simplifies and accelerates the process of transporting goods
allowing companies to reduce inventories and hence save cost. It organizes collection,
usually at the end of the business day, allows the sender access to information on the
progress of shipments from pick-up to delivery as well as provides proof of delivery. The
express delivery industry contributes close to €3 billion to EU27 public finances through the
taxes it generates. Of this total, corporation tax, income tax, and social security
contributions, both employer and employee, account for around €2.7 billion.
Other taxes, excluding sales taxes such as VAT, paid on the express delivery sectors’ sales
contribute a further €0.25 billion. There are a number of other ways in which express
delivery services and their operators contribute to freight transport and logistics’
competitiveness:
• enabling firms to reduce purchasing costs,
• facilitating cost-savings on inventories by enabling better concentration,
rationalization and location of warehouses,
• providing extensive logistics support services to companies, enabling them to
delegate responsibility to professionals,
• improving companies’ handling of returns and complaints,
• facilitating improved stock-management and production techniques, reducing firms’
storage costs.
Express delivery services generate significant supply-chain value for European businesses.
Being able to respond quickly to customer demand is essential to winning and maintaining
business in an increasingly competitive global economy. In addition to this, given the
growing weight of e-commerce and because of the problem of non-delivery door-to-door in
case of absence of the recipients, the express couriers have realised in some cities some
pick-up point networks allowing the clients to autonomously pick-up their online
purchases. This approach removes the need of rescheduling the non-deliveries and allows
the operator to reduce the delivery trips and as a consequence the emissions. The pick-up
points, together with the drop-off points (points where the sender of the goods delivers to
the operator), are located in high-traffic areas, like train stations, in order not to generate
further trips. DHL, for example, realised a pick-up point network in the main German cities
in the framework of the Pack Station initiative. Local authorities took part in the initiative
in the phase of planning the network making public spaces available for it.
Ho.Re.Ca
The term Ho.Re.Ca. refers to the food service industry and is an acronym formed by linking
the words HOtel, REstaurant and CAtering. The Ho.Re.Ca. sector in urban areas mainly
consists of the servicing of hotels and other short-stay accommodation (with and without
restaurants), bars and restaurants, canteens and catering. The Ho.Re.Ca. sector is
generally described as an homogenous market sector, but its commercial activities present
28
A T 2.2
very different logistics and organisational constraints according to the specific service
offered to the final consumers.
The distribution sector related to the Ho.Re.Ca. chain is characterised by a high
unpredictability. The orders are generally for small amounts of goods and the deliveries
happen at a very high rate. For these reasons the costs of delivery in this sector are
sometimes even four times higher than those deriving from retail selling. However, the
main restaurant and hotel chains show interest in achieving economies of scale foreseeing
more centralised and consolidated supplying modes, even with less deliveries. The
majority of manufacturers distinguish between the “organized” Ho.Re.Ca. distribution
channel and the “non-organized” one. The first type (“organized” Ho.Re.Ca.) involves
hotel and restaurant chains, the organised services for supplying hospitals, schools,
cafeterias, communities. The second type (“non-organized” Ho.Re.Ca) involves bars,
independent hotels and restaurants.
Despite the success of the large hotel, fast food and takeaway chains and franchises, the
sector is still dominated by the small, independent, family-owned “non-organized”
Ho.Re.Ca. channel.
Every operator tends to address different types of suppliers and the choice is influenced by
several factors like price, type, quality and range of the products as well as the service
offered (opening hours, customer care, door-to-door delivery, time of delivery).
Furthermore, they tend to reduce to a minimum the spaces for stocking, giving priority to
the space for selling and preferring small and frequent deliveries. In conclusion, the
Ho.Re.Ca. industry remains dominated by small, family-owned and run restaurants, bars
and hotels, despite the presence of some large multi-national chains.
Pharmaceuticals
The distribution of pharmaceuticals in one of the most complexes in Europe, because of
the high number of pharmacies, the restriction imposed and the supplying schedules to be
met. Despite that, the pharmaceutical supply chain is one of the most integrated and
efficient, with only a few hours long responding time to orders and very high levels of
quality. Other subjects can be identified upstream of pharmacies and hospitals in the same
supply chain: pharmaceutical firm, storages, pharmaceutical intermediaries. The
pharmaceutical industry is the one with the highest added value. Such companies had the
need to entrust with logistics (storage and primary distribution) specialised operators able
to move large stocks of goods in order to achieve economies of scale. For this reason
almost all pharmaceutical companies opted for outsourcing primary distribution.
29
A T 2.2
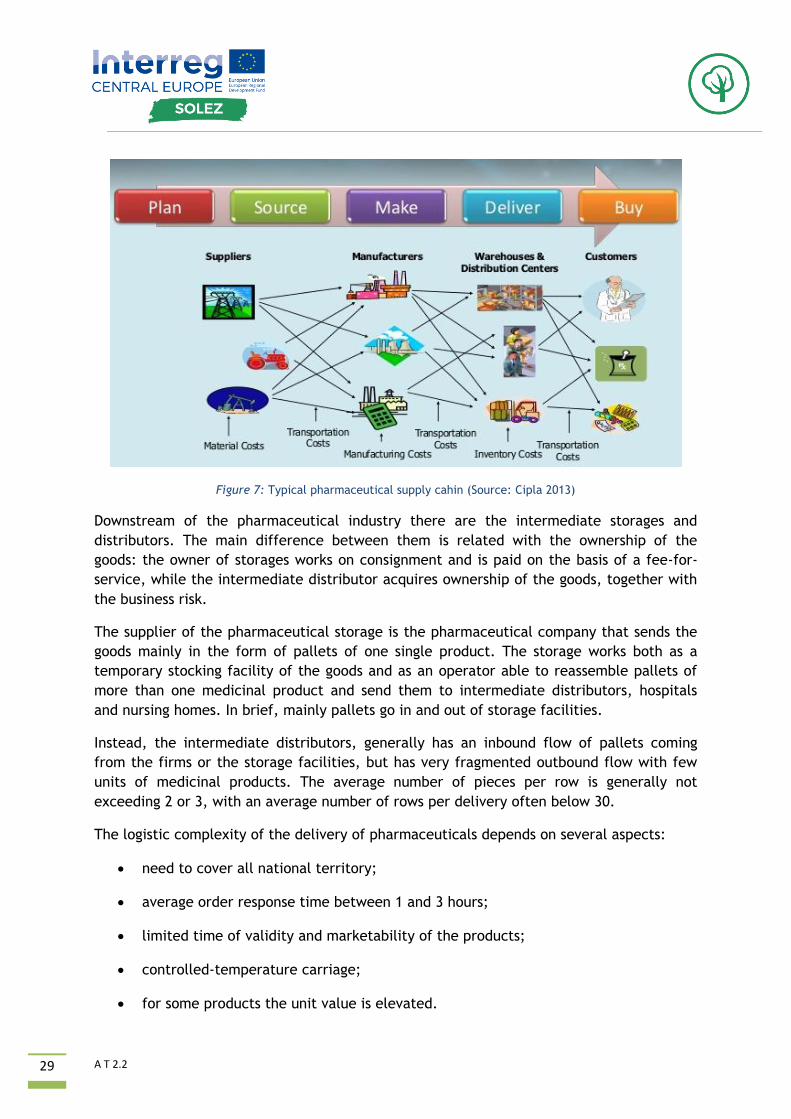
Figure 7: Typical pharmaceutical supply cahin (Source: Cipla 2013)
Downstream of the pharmaceutical industry there are the intermediate storages and
distributors. The main difference between them is related with the ownership of the
goods: the owner of storages works on consignment and is paid on the basis of a fee-for-
service, while the intermediate distributor acquires ownership of the goods, together with
the business risk.
The supplier of the pharmaceutical storage is the pharmaceutical company that sends the
goods mainly in the form of pallets of one single product. The storage works both as a
temporary stocking facility of the goods and as an operator able to reassemble pallets of
more than one medicinal product and send them to intermediate distributors, hospitals
and nursing homes. In brief, mainly pallets go in and out of storage facilities.
Instead, the intermediate distributors, generally has an inbound flow of pallets coming
from the firms or the storage facilities, but has very fragmented outbound flow with few
units of medicinal products. The average number of pieces per row is generally not
exceeding 2 or 3, with an average number of rows per delivery often below 30.
The logistic complexity of the delivery of pharmaceuticals depends on several aspects:
• need to cover all national territory;
• average order response time between 1 and 3 hours;
• limited time of validity and marketability of the products;
• controlled-temperature carriage;
• for some products the unit value is elevated.
30
A T 2.2
The solution to such limits is represented by technology, actually, up to 70-75% of the
order rows in the most advanced facilities are moved automatically (dispensers and
conveyors).
The last ring of the supply chain are pharmacies and hospitals which are the distribution
points for the final consumers/patients. Pharmacies dispense around 85% of
pharmaceuticals, while hospitals around 15% and almost all medicinal products are granted
by the intermediate distributor service. Pharmacies, given the peculiarity of the product
and the high number of references on the market, tend to stock the smallest possible
amounts, storing only those medicinal products that are highly requested on the market.
By doing so they minimise the space needed for stocking inside and reduce or eliminate the
risk of obsolescence of the goods. These needs lead to an integrated JIS approach
characterised by the absence of a stock between the distributor and the consumer and
frequent shipments. In the hospitals instead, pharmaceuticals and other hospital materials
are generally stocked, in order to ensure a backup stash both for the central pharmacy and
mainly for the wards.
Medicinal products are delivered by distributors to the central pharmacies of hospital,
stored in warehouses and then taken to be distributed to the wards in the same package in
which they came from the pharmaceutical companies.
In general, the flow of pharmaceuticals within a hospital involves two main macro-actors:
the wards and the pharmacy, which perform a series of intertwined activities. It is
foreseeable, given the continuous research activity for new and different formulas, the
ageing trend of the population and the growing urbanisation rate, that the sector will
manifest a high rate of growth in the next decade.
3.2 Public-private partnership as a success factor
To promote the cooperation between private operators and public subjects in the field of
urban freight transports, the mostly used tool are local, regional or national forums, where
the stakeholders jointly discuss about possible actions to be implemented.
In Germany for example the so called Güterverkehrsrunde (local consultation programmes)
have been activated in several cities, like Hanover and Düsseldorf. In other cases the
consultations between private and public subjects has been promoted at national or
federal level, like in Australia (Advisory Groups and Councils) and in the Netherlands
(Platform Stedelijke Distributie). In Japan, consultation programmes have been realised
both at regional and national level.
In some European countries consultation forums consist of city network like the Forum for
city logistics in Denmark, involving the cities of Aalborg, Arhus and Copenhagen and the
Ministri of Transport or the GART network (Groupement des autoritiés responsables de
transport) that puts together 150 French cities. Such forums are generally managed by the
public sector, actively involving the stakeholders of the private one.
31
A T 2.2
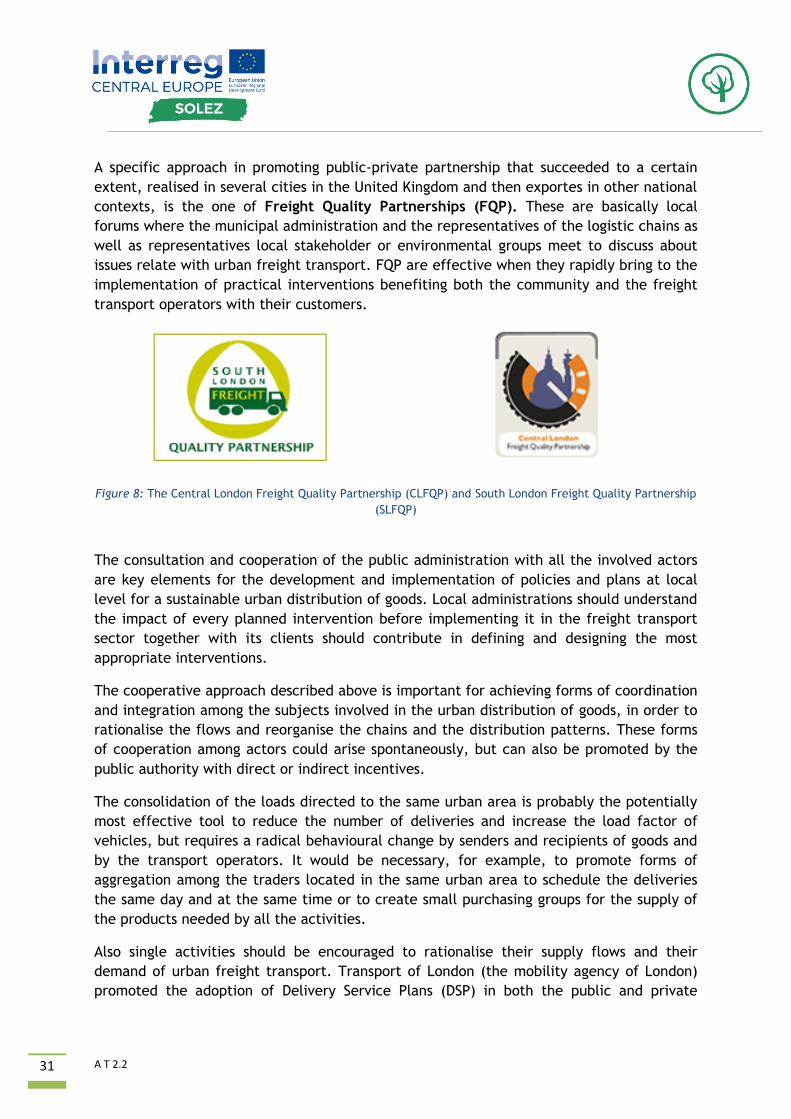
A specific approach in promoting public-private partnership that succeeded to a certain
extent, realised in several cities in the United Kingdom and then exportes in other national
contexts, is the one of Freight Quality Partnerships (FQP). These are basically local
forums where the municipal administration and the representatives of the logistic chains as
well as representatives local stakeholder or environmental groups meet to discuss about
issues relate with urban freight transport. FQP are effective when they rapidly bring to the
implementation of practical interventions benefiting both the community and the freight
transport operators with their customers.
Figure 8: The Central London Freight Quality Partnership (CLFQP) and South London Freight Quality Partnership
(SLFQP)
The consultation and cooperation of the public administration with all the involved actors
are key elements for the development and implementation of policies and plans at local
level for a sustainable urban distribution of goods. Local administrations should understand
the impact of every planned intervention before implementing it in the freight transport
sector together with its clients should contribute in defining and designing the most
appropriate interventions.
The cooperative approach described above is important for achieving forms of coordination
and integration among the subjects involved in the urban distribution of goods, in order to
rationalise the flows and reorganise the chains and the distribution patterns. These forms
of cooperation among actors could arise spontaneously, but can also be promoted by the
public authority with direct or indirect incentives.
The consolidation of the loads directed to the same urban area is probably the potentially
most effective tool to reduce the number of deliveries and increase the load factor of
vehicles, but requires a radical behavioural change by senders and recipients of goods and
by the transport operators. It would be necessary, for example, to promote forms of
aggregation among the traders located in the same urban area to schedule the deliveries
the same day and at the same time or to create small purchasing groups for the supply of
the products needed by all the activities.
Also single activities should be encouraged to rationalise their supply flows and their
demand of urban freight transport. Transport of London (the mobility agency of London)
promoted the adoption of Delivery Service Plans (DSP) in both the public and private
32
A T 2.2
sector. Thanks to this approach every organisation is encouraged to monitor its supplies in
order to identify how to rationalise and reduce the number of deliveries.
With the PUMAS project (Interreg Alpine Space 2007-2013) the city of Torino promoted
meetings with Transport, Commerce and Industry Associations and the Chamber of
Commerce and the final result was an agreement with which it was possible to launch a
pilot project with the chain of express couriers for the replacement of the most pollutant
vehicles with new generation ones. Given the good performances of the project, Torino
continued that way with the project H2020 “NOVELOG”.
In 2016 the Italian Government decided to mention precisely the experimental model of
last mile delivery developed by Torino in its economic planning document (DEF 2016) as a
“good practice” to be followed in all the national territory.
3.3 Analysis of baseline scenarios in FUAs and possible interventions
The first activity to be carried out is represented by the definition of a knowledge
framework on the goods transport demand and supply, currently existing in the surveyed
FUAs context.
The objective of this activity is to collect and analyze relevant information and data
available, in order to build a complete cognitive picture of the phenomenon of the
distribution of goods in cities.
Specific field surveys (e.g. survey for flow generators, survey for transport and logistics
operators, survey for freight vehicles drivers, etc.) to integrate and complete the collected
data might be needed. The objective is to outline and analyze the current freight
transport demand (transportation and related prevalent logistics activities) in the urban
area (including FUAs) in its typical components and in its quantitative and territorial
aspects while highlighting local needs, requirements, expectations, both by
generators/attractors of goods demand flow and by freight operators (professional and
own-account transport). The design and execution of the activities necessary to define the
reference framework should be subjected to the identification and selection of
zones/areas of the city (e.g. city center, Limited Traffic Zones, pedestrian areas, area
enclosed by the ring road network, etc.) and logistics supply chains (e.g. parcels, fresh
retail, frozen chain, pharmaceuticals, etc.) on which it is intended to intervene to
reorganize the distribution and collection of goods. These should be identified on the basis
of their representativeness/criticality with respect to the reference universe represented
by the overall urban area and the combination of logistics supply chains. On the basis of
the reference scenario and problems identified, it will be possible to define the most
appropriate strategies for the reference urban context at FUA level.
Strategies of intervention have to lead to a more efficient management of the demand for
urban haulage of goods. The collection and interpretation of the data set should enable to
better plan and implement strategies of intervention to be adopted on the regulation and
reorganization of the goods distribution system, which will be designed and constructed in
a the short-medium term.
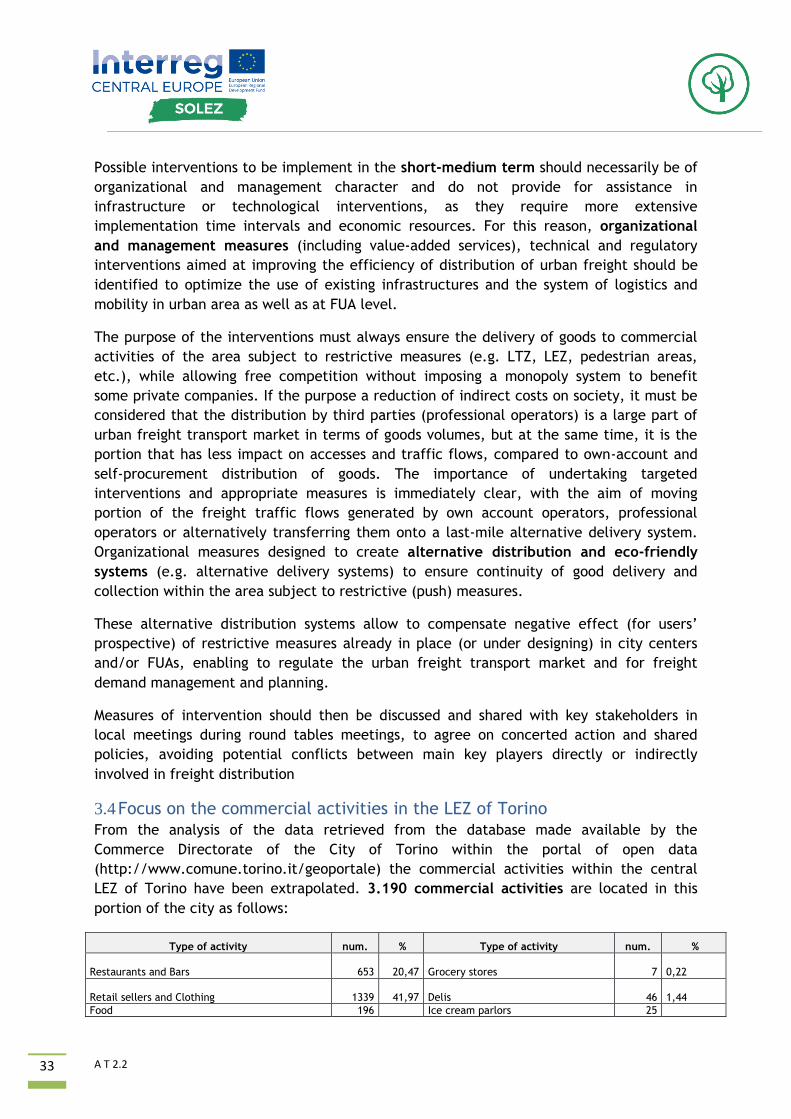
33
A T 2.2
Possible interventions to be implement in the short-medium term should necessarily be of
organizational and management character and do not provide for assistance in
infrastructure or technological interventions, as they require more extensive
implementation time intervals and economic resources. For this reason, organizational
and management measures (including value-added services), technical and regulatory
interventions aimed at improving the efficiency of distribution of urban freight should be
identified to optimize the use of existing infrastructures and the system of logistics and
mobility in urban area as well as at FUA level.
The purpose of the interventions must always ensure the delivery of goods to commercial
activities of the area subject to restrictive measures (e.g. LTZ, LEZ, pedestrian areas,
etc.), while allowing free competition without imposing a monopoly system to benefit
some private companies. If the purpose a reduction of indirect costs on society, it must be
considered that the distribution by third parties (professional operators) is a large part of
urban freight transport market in terms of goods volumes, but at the same time, it is the
portion that has less impact on accesses and traffic flows, compared to own-account and
self-procurement distribution of goods. The importance of undertaking targeted
interventions and appropriate measures is immediately clear, with the aim of moving
portion of the freight traffic flows generated by own account operators, professional
operators or alternatively transferring them onto a last-mile alternative delivery system.
Organizational measures designed to create alternative distribution and eco-friendly
systems (e.g. alternative delivery systems) to ensure continuity of good delivery and
collection within the area subject to restrictive (push) measures.
These alternative distribution systems allow to compensate negative effect (for users’
prospective) of restrictive measures already in place (or under designing) in city centers
and/or FUAs, enabling to regulate the urban freight transport market and for freight
demand management and planning.
Measures of intervention should then be discussed and shared with key stakeholders in
local meetings during round tables meetings, to agree on concerted action and shared
policies, avoiding potential conflicts between main key players directly or indirectly
involved in freight distribution
3.4 Focus on the commercial activities in the LEZ of Torino
From the analysis of the data retrieved from the database made available by the
Commerce Directorate of the City of Torino within the portal of open data
(http://www.comune.torino.it/geoportale) the commercial activities within the central
LEZ of Torino have been extrapolated. 3.190 commercial activities are located in this
portion of the city as follows:
Type of activity num. % Type of activity num. %
Restaurants and Bars 653 20,47 Grocery stores 7 0,22
Retail sellers and Clothing 1339 41,97 Delis 46 1,44
Food 196 Ice cream parlors 25
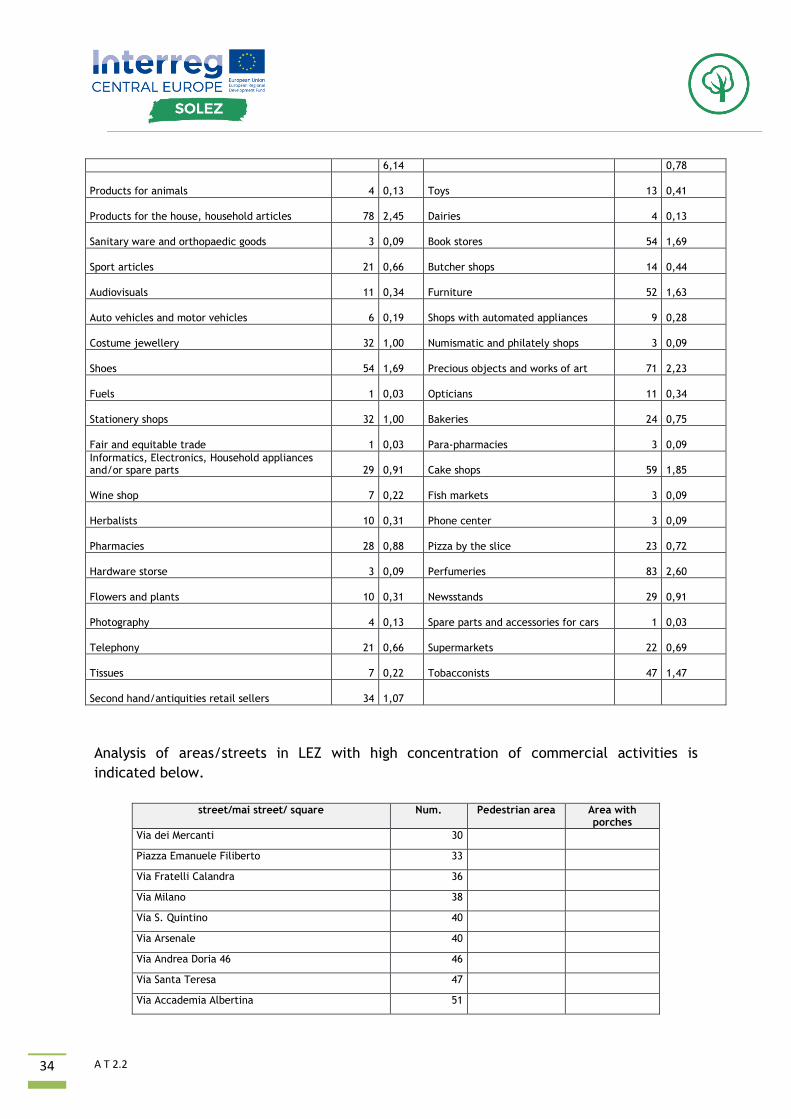
34
A T 2.2
6,14 0,78
Products for animals 4 0,13 Toys 13
0,41
Products for the house, household articles 78 2,45 Dairies 4
0,13
Sanitary ware and orthopaedic goods 3 0,09 Book stores 54
1,69
Sport articles 21 0,66 Butcher shops 14
0,44
Audiovisuals 11 0,34 Furniture 52
1,63
Auto vehicles and motor vehicles 6 0,19 Shops with automated appliances 9
0,28
Costume jewellery 32 1,00 Numismatic and philately shops 3
0,09
Shoes 54 1,69 Precious objects and works of art 71
2,23
Fuels 1 0,03 Opticians 11
0,34
Stationery shops 32 1,00 Bakeries 24
0,75
Fair and equitable trade 1 0,03 Para-pharmacies 3
0,09
Informatics, Electronics, Household appliances and/or spare parts 29
0,91 Cake shops 59
1,85
Wine shop 7 0,22 Fish markets 3
0,09
Herbalists 10 0,31 Phone center 3
0,09
Pharmacies 28 0,88 Pizza by the slice 23
0,72
Hardware storse 3 0,09 Perfumeries 83
2,60
Flowers and plants 10 0,31 Newsstands 29
0,91
Photography 4 0,13 Spare parts and accessories for cars 1
0,03
Telephony 21 0,66 Supermarkets 22
0,69
Tissues 7 0,22 Tobacconists 47
1,47
Second hand/antiquities retail sellers 34 1,07
Analysis of areas/streets in LEZ with high concentration of commercial activities is
indicated below.
street/mai street/ square Num. Pedestrian area Area with
porches
Via dei Mercanti 30
Piazza Emanuele Filiberto 33
Via Fratelli Calandra 36
Via Milano 38
Via S. Quintino 40
Via Arsenale 40
Via Andrea Doria 46 46
Via Santa Teresa 47
Via Accademia Albertina 51
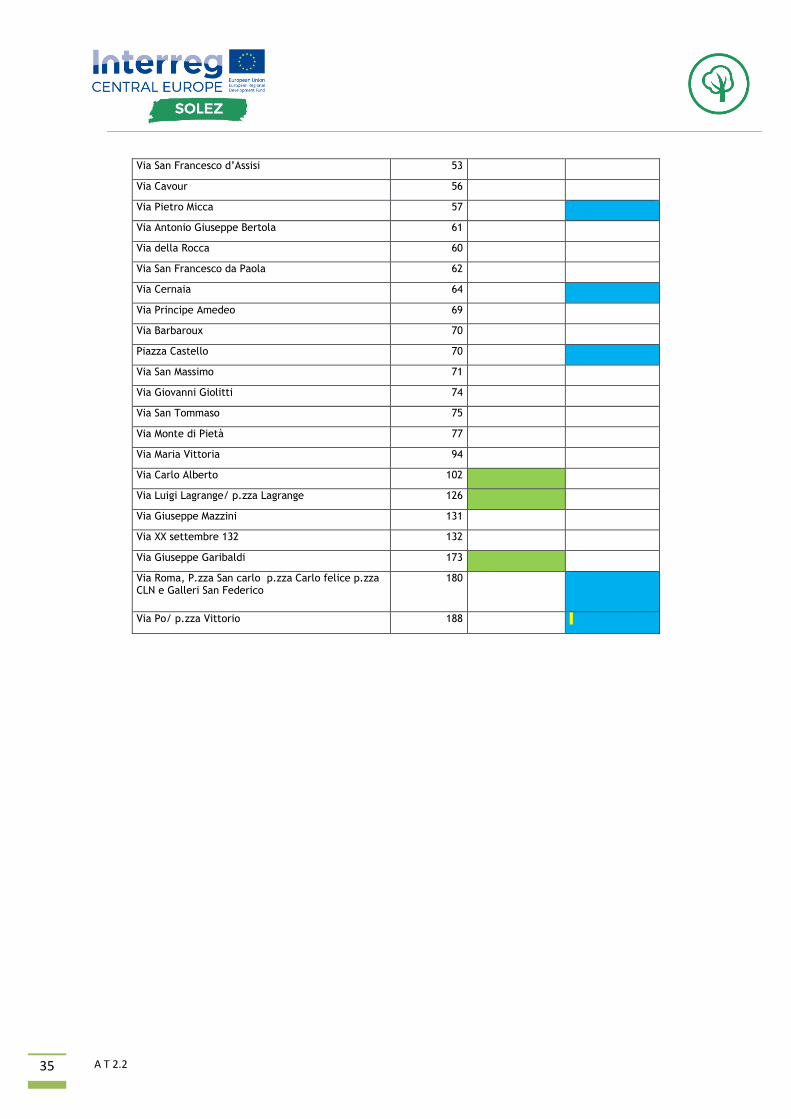
35
A T 2.2
Via San Francesco d’Assisi 53
Via Cavour 56
Via Pietro Micca 57
Via Antonio Giuseppe Bertola 61
Via della Rocca 60
Via San Francesco da Paola 62
Via Cernaia 64
Via Principe Amedeo 69
Via Barbaroux 70
Piazza Castello 70
Via San Massimo 71
Via Giovanni Giolitti 74
Via San Tommaso 75
Via Monte di Pietà 77
Via Maria Vittoria 94
Via Carlo Alberto 102
Via Luigi Lagrange/ p.zza Lagrange 126
Via Giuseppe Mazzini 131
Via XX settembre 132 132
Via Giuseppe Garibaldi 173
Via Roma, P.zza San carlo p.zza Carlo felice p.zza CLN e Galleri San Federico
180
Via Po/ p.zza Vittorio 188
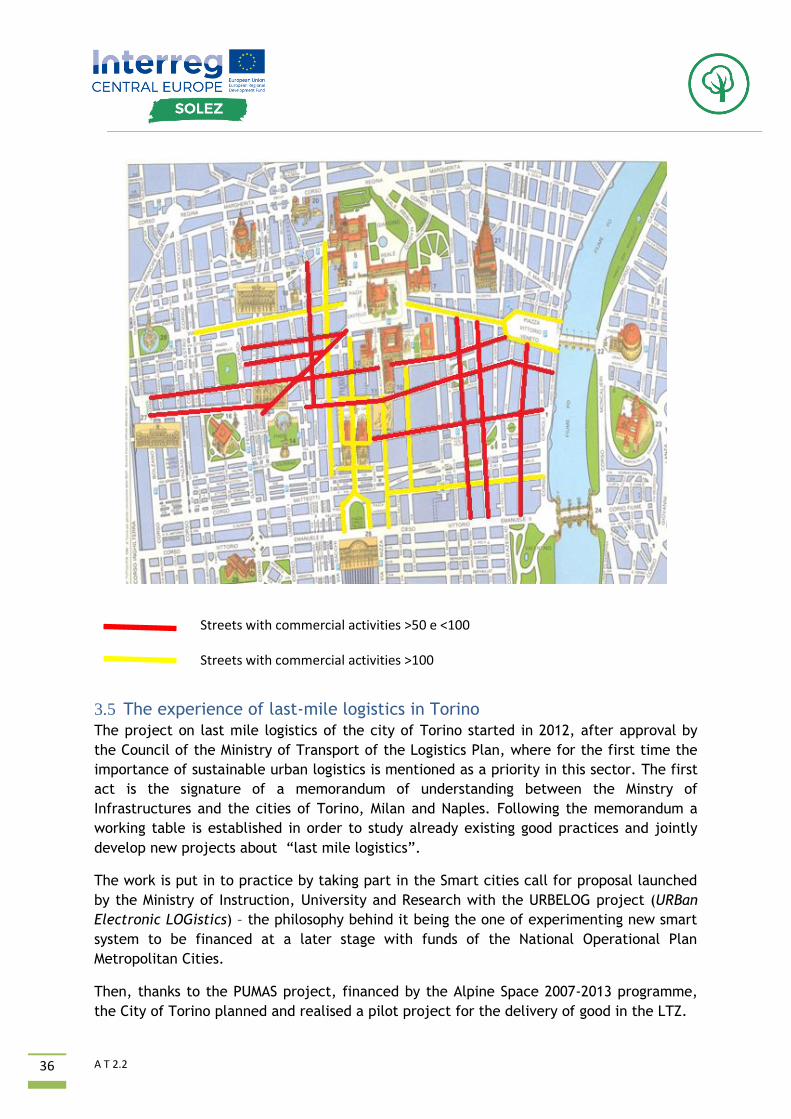
36
A T 2.2
3.5 The experience of last-mile logistics in Torino
The project on last mile logistics of the city of Torino started in 2012, after approval by
the Council of the Ministry of Transport of the Logistics Plan, where for the first time the
importance of sustainable urban logistics is mentioned as a priority in this sector. The first
act is the signature of a memorandum of understanding between the Minstry of
Infrastructures and the cities of Torino, Milan and Naples. Following the memorandum a
working table is established in order to study already existing good practices and jointly
develop new projects about “last mile logistics”.
The work is put in to practice by taking part in the Smart cities call for proposal launched
by the Ministry of Instruction, University and Research with the URBELOG project (URBan
Electronic LOGistics) – the philosophy behind it being the one of experimenting new smart
system to be financed at a later stage with funds of the National Operational Plan
Metropolitan Cities.
Then, thanks to the PUMAS project, financed by the Alpine Space 2007-2013 programme,
the City of Torino planned and realised a pilot project for the delivery of good in the LTZ.
Streets with commercial activities >50 e <100
Streets with commercial activities >100
37
A T 2.2
The main outputs of the PUMAS project were:
• the collection of freight transport and delivery data;
• the involvement of the freight stakeholders and the signature of a Memorandum of
Understanding among the City, the Chamber of Commerce, Transport and
Commerce Associations and the signature of a Freight Quality Partnership;
• on field testing of the pull measures defined in the Memorandum of Understanding.
Data collection
By cross referencing the data collected by the cameras controlling the LTZ and the data-
base of the Provincial Motor Vehicle Offices for the first time in Italy a complete picture of
the delivery of goods in urban areas was made possible. Here some figures synthesising the
whole work performed:
• around 90.000/120.00 vehicles access the LTZ every day;
• on average 2.500 freight transport vehicles access the area daily for a total of 4.000
trips (1,5 trips per vehicle);
• maximum number of trips detected per single vehicle in one day: 14
The Freight Quality Partnership (FQP)
Thanks to the PUMAS project a confrontation started among the numerous transport and
commerce associations and it’s still ongoing. After a long negotiation with the commerce
association (they were defending the interests of proprietary transport) a joint agreement
was reached among all the involved parties finalised with a Memorandum of Understanding
(MoU) among the City, the Chamber of Commerce, Transport and Commerce Associations.
This MoU was designed in the form of Freight Quality Partnership (FQP) namely
“PROTOCOLLO D’INTESA TRA COMUNE DI TORINO CAMERA DI COMMERCIO E LE
ASSOCIAZIONI FIRMATARIE – PATTO PER LA LOGISTICA E PER LA RAZIONALIZZAZIONE DELLA
DISTRIBUZIONE URBANA DELLE MERCI“ (signed FQP is provided as annex)
The FQP of Turin aimed at replacing the most pollutant vehicles and at introducing ITS in
order to improve the environmental, economic and social performances of the distribution
of goods in the city. The main innovation of the document was the introduction, for the
first time in Italy, of pull measures, that would have rewarded the participating operators
in the initiative.
A brief synthesis of the pull measures:
• access to the LTZ of the city without limitations;
• use of preferential lanes.
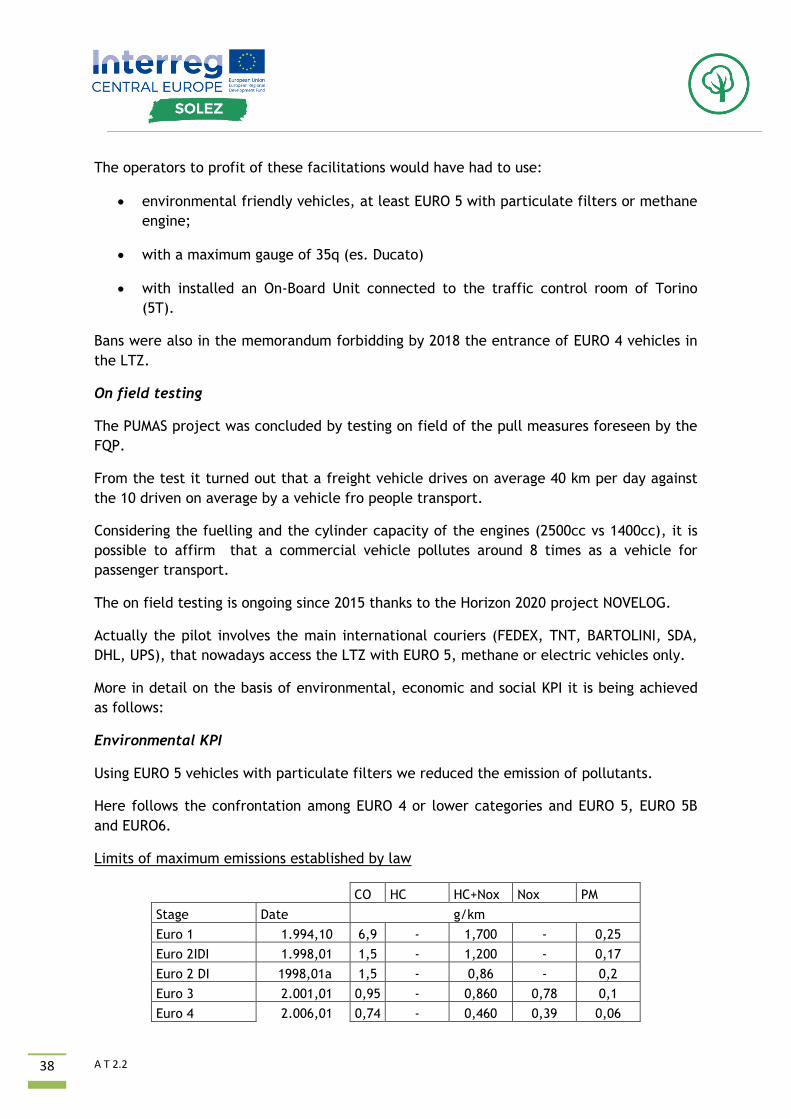
38
A T 2.2
The operators to profit of these facilitations would have had to use:
• environmental friendly vehicles, at least EURO 5 with particulate filters or methane
engine;
• with a maximum gauge of 35q (es. Ducato)
• with installed an On-Board Unit connected to the traffic control room of Torino
(5T).
Bans were also in the memorandum forbidding by 2018 the entrance of EURO 4 vehicles in
the LTZ.
On field testing
The PUMAS project was concluded by testing on field of the pull measures foreseen by the
FQP.
From the test it turned out that a freight vehicle drives on average 40 km per day against
the 10 driven on average by a vehicle fro people transport.
Considering the fuelling and the cylinder capacity of the engines (2500cc vs 1400cc), it is
possible to affirm that a commercial vehicle pollutes around 8 times as a vehicle for
passenger transport.
The on field testing is ongoing since 2015 thanks to the Horizon 2020 project NOVELOG.
Actually the pilot involves the main international couriers (FEDEX, TNT, BARTOLINI, SDA,
DHL, UPS), that nowadays access the LTZ with EURO 5, methane or electric vehicles only.
More in detail on the basis of environmental, economic and social KPI it is being achieved
as follows:
Environmental KPI
Using EURO 5 vehicles with particulate filters we reduced the emission of pollutants.
Here follows the confrontation among EURO 4 or lower categories and EURO 5, EURO 5B
and EURO6.
Limits of maximum emissions established by law
CO HC HC+Nox Nox PM
Stage Date g/km
Euro 1 1.994,10 6,9 - 1,700 - 0,25
Euro 2IDI 1.998,01 1,5 - 1,200 - 0,17
Euro 2 DI 1998,01a 1,5 - 0,86 - 0,2
Euro 3 2.001,01 0,95 - 0,860 0,78 0,1
Euro 4 2.006,01 0,74 - 0,460 0,39 0,06
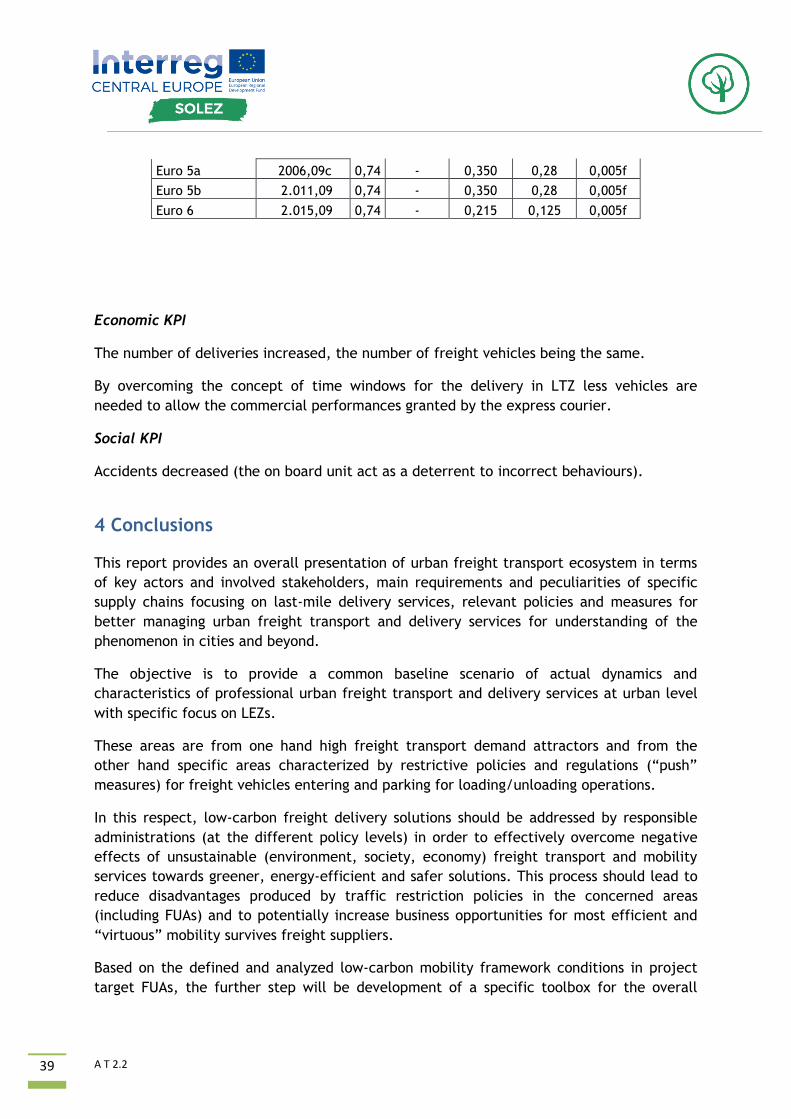
39
A T 2.2
Euro 5a 2006,09c 0,74 - 0,350 0,28 0,005f
Euro 5b 2.011,09 0,74 - 0,350 0,28 0,005f
Euro 6 2.015,09 0,74 - 0,215 0,125 0,005f
Economic KPI
The number of deliveries increased, the number of freight vehicles being the same.
By overcoming the concept of time windows for the delivery in LTZ less vehicles are
needed to allow the commercial performances granted by the express courier.
Social KPI
Accidents decreased (the on board unit act as a deterrent to incorrect behaviours).
4 Conclusions This report provides an overall presentation of urban freight transport ecosystem in terms
of key actors and involved stakeholders, main requirements and peculiarities of specific
supply chains focusing on last-mile delivery services, relevant policies and measures for
better managing urban freight transport and delivery services for understanding of the
phenomenon in cities and beyond.
The objective is to provide a common baseline scenario of actual dynamics and
characteristics of professional urban freight transport and delivery services at urban level
with specific focus on LEZs.
These areas are from one hand high freight transport demand attractors and from the
other hand specific areas characterized by restrictive policies and regulations (“push”
measures) for freight vehicles entering and parking for loading/unloading operations.
In this respect, low-carbon freight delivery solutions should be addressed by responsible
administrations (at the different policy levels) in order to effectively overcome negative
effects of unsustainable (environment, society, economy) freight transport and mobility
services towards greener, energy-efficient and safer solutions. This process should lead to
reduce disadvantages produced by traffic restriction policies in the concerned areas
(including FUAs) and to potentially increase business opportunities for most efficient and
“virtuous” mobility survives freight suppliers.
Based on the defined and analyzed low-carbon mobility framework conditions in project
target FUAs, the further step will be development of a specific toolbox for the overall
40
A T 2.2
design of low-carbon value-added services which will be customized in the SOLEZ pilot
sites based on FUA-based requirements.
ICT-based tools will be investigated (exploiting existing innovative ICT systems and/or
apps) for the implementation and operation of value-added services for both freight and
passenger transport.
5 References
• European Commission (2012): DG MOVE – Study on Urban Freight Transport. Final
Report
• FIT Consulting srl (2012) D 4.2 - C-LIEGE toolbox for the establishment of the City
Logistics Manager, C-LIEGE, Intelligent Energy Europe Programme
• TIS (2012) – D7.2 Action Plan to improve energy efficiency of urban freight transport
in EU Member States, C-LIEGE, Intelligent Energy Europe Programme
• Cyclelogistics - D2.1 Short History of Cargo Cycling – lessons to be learnt from
present and future Overview of the use of bicycles for goods delivery in selected EU
countries
• ECF (European Cyclistics Federetion) Factsheet, Cycling Logistics: The future of
good delivery
• CIVITAS Policy Note: Smart choise for ciities, Making urban freight logistics more
sustainable
• ALICE (Alliance for Logistics Innovation through Collaboration in Europe),
Collaborative Innovation Clouds (2017)
• BESTUFS (2007), Good Practice Guide on Urban Freight.
• Andrea Payaro (2016), La Catena del Farmaco
• Politecnico di Torino, La logistica del farmaco
• McKinnon et al. (2010) Green Logistics: Improving the Environmental Sustainability
of Logistics
• Gabriele Schliwa, Richard Armitage, Sara Aziz, James Evans, Jasmine Rhoades
(2015) Sustainable city logistics, Research in Transportation Business & Management
• NOVELOG - D2.2 Urban Freight and Service Transport in European Cities
• EPOMM, European Platform on Mobility Management - www.epomm.eu
41
A T 2.2
• Oxford Economics (2011), “The Economic Impact of Express Carriers in Europe”
• SMILE project, Sustainable Mobility Initiatives for Local Environment
• World Health Organization, OECD (2015), Economic cost of the health impact of air
pollution in Europe: Clean air, health and wealth
• DG MOVE (2014), Update of the Handbook on External Costs of Transport