Embed Size (px)
Citation preview
United States Department of Agriculture Forest Service January 2014
Final Soils Specialist Report
Harris Vegetation Management Project
Shasta-Trinity National Forest Shasta-McCloud Management Unit Shasta County, California
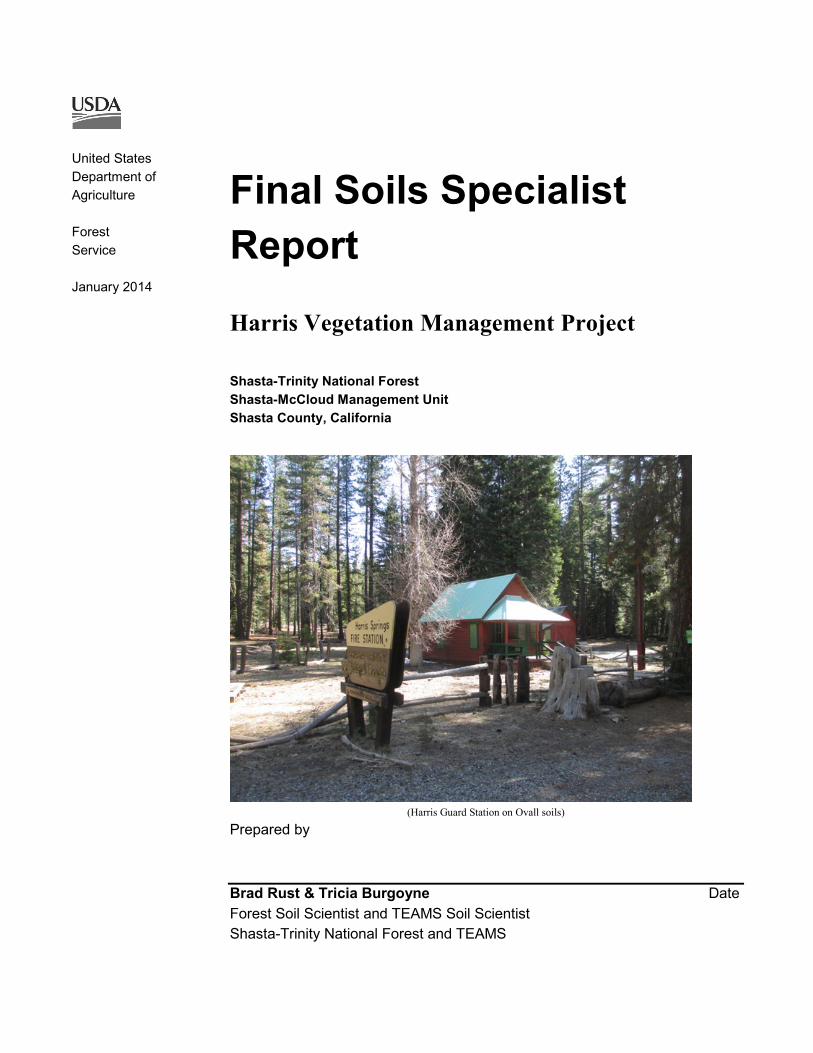
(Harris Guard Station on Ovall soils)
Prepared by Brad Rust & Tricia Burgoyne Date Forest Soil Scientist and TEAMS Soil Scientist Shasta-Trinity National Forest and TEAMS
Harris Vegetation Management Soils Report – January 2014
The U.S. Department of Agriculture (USDA) prohibits discrimination in all its programs and activities on the basis of race, color, national origin, age, disability, and where applicable, sex, marital status, familial status, parental status, religion, sexual orientation, genetic information, political beliefs, reprisal, or because all or part of an individual’s income is derived from any public assistance program. (Not all prohibited bases apply to all programs.) Persons with disabilities who require alternative means for communication of program information (Braille, large print, audiotape, etc.) should contact USDA's TARGET Center at (202) 720-2600 (voice and TDD).
To file a complaint of discrimination, write to USDA, Director, Office of Civil Rights, 1400 Independence Avenue, S.W., Washington, D.C. 20250-9410, or call (800) 795-3272 (voice) or (202) 720-6382 (TDD). USDA is an equal opportunity provider and employer.
Harris Vegetation Management Soils Report – January 2014
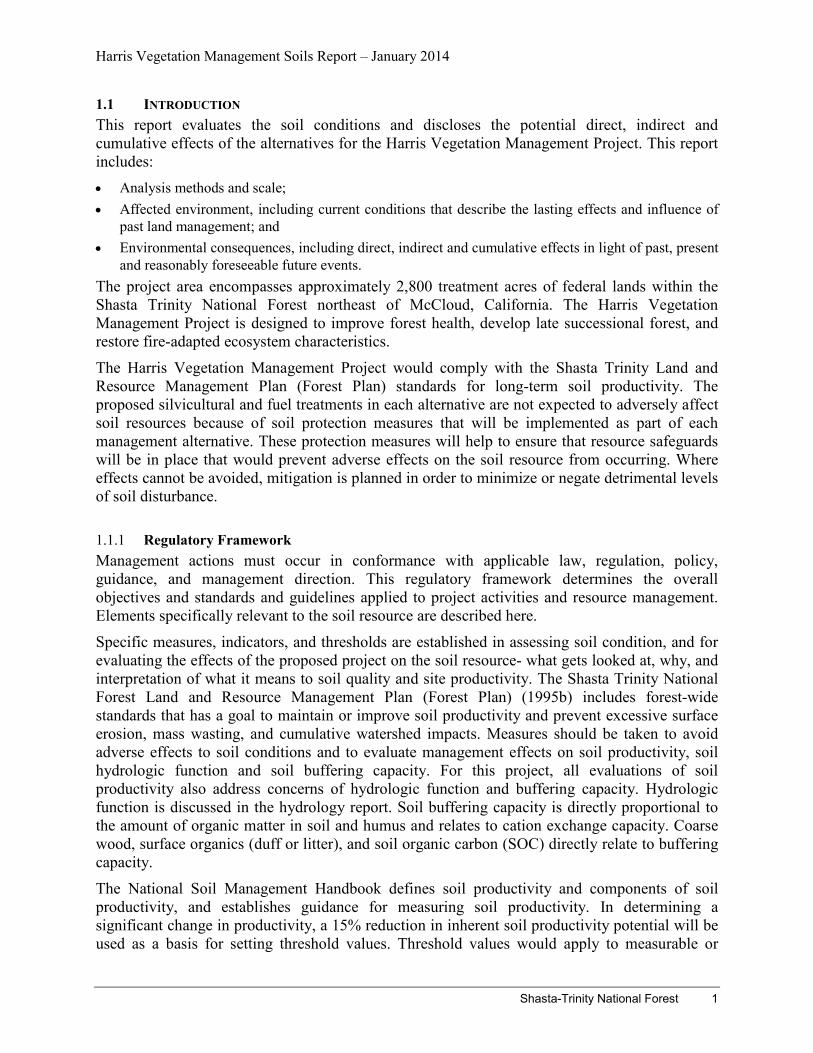
TABLE OF CONTENTS
1.1 Introduction ............................................................................................................................................ 1 Regulatory Framework .................................................................................................................... 1 1.1.1
1.2 Methodology for Analysis ...................................................................................................................... 2 1.3 Affected Environment ............................................................................................................................ 3 1.4 Current Conditions ................................................................................................................................. 5
Erosion ............................................................................................................................................. 6 1.4.1 Soil Organic Matter.......................................................................................................................... 6 1.4.2 Soil Porosity ..................................................................................................................................... 8 1.4.3
1.5 Environmental Consequences .............................................................................................................. 12 Methodology .................................................................................................................................. 12 1.5.1 Spatial and Temporal Context for Effects Analysis ....................................................................... 13 1.5.2 Assumptions ................................................................................................................................... 13 1.5.3 Resource Protection Measures ....................................................................................................... 15 1.5.4 Desired Condition for all units ....................................................................................................... 16 1.5.5 Alternative 1 – Proposed Action .................................................................................................... 17 1.5.6 Alternative 2 .................................................................................................................................. 22 1.5.7 Alternative 3 .................................................................................................................................. 22 1.5.8 Alternative 4a ................................................................................................................................. 23 1.5.9
Alternative 4b .......................................................................................................................... 23 1.5.10 Alternative 4c .......................................................................................................................... 24 1.5.11 Alternative 5 – No Action ....................................................................................................... 25 1.5.12
1.6 Summary .............................................................................................................................................. 26 1.7 Compliance with the Forest Plan and Other Regulatory Direction ...................................................... 27 1.8 References ............................................................................................................................................ 28
2. APPENDIX A. EROSION HAZARD RATING CALCULATIONS ................................................................. 32
3. APPENDIX B. CUMULATIVE EFFECTS TABLE .......................................................................................... 34
4. APPENDIX C. SUMMARY OF FIELD WORK-CURRENT CONDITION ..................................................... 37
5. APPENDIX D. SOIL DISTURBANCE MONITORING 2011 TRANSECTS ................................................... 39
6. APPENDIX E. HARRIS WETLAND DETERMINATION ............................................................................... 40
7. APPENDIX F. CUMULATIVE EFFECTS WORKSHEET ............................................................................... 44
LIST OF TABLES
Table 1. Physical properties of Harris Vegetation Management project area soils ................................................... 4 Table 2: Windrow Sampling Data ............................................................................................................................. 7 Table 3 – Soil Disturbance Monitoring on Selected Impacted Sites (Appendix D) .................................................. 9 Table 4. Soil compaction monitoring on Shasta-Trinity National Forest from 2002 to 2012 ................................. 11 Table 5. Recovery rates for mechanical understory thinning soils .......................................................................... 14 Table 6. Resource protection measures for soils ...................................................................................................... 15 Table 7. Fuel treatments and their qualitative effect on soils................................................................................... 19 Table 8. Comparison of alternatives ........................................................................................................................ 24 Table 9. EHR for Harris Vegetation Management project area soils ....................................................................... 32 Table 10. Summary of soil effects by proposed treatment unit for the Harris Vegetation Management Project .... 34 Table 11. TEAMS current conditions of Harris soils from field transect surveys of 2009 ...................................... 37
Harris Vegetation Management Soils Report – January 2014
Shasta-Trinity National Forest 1
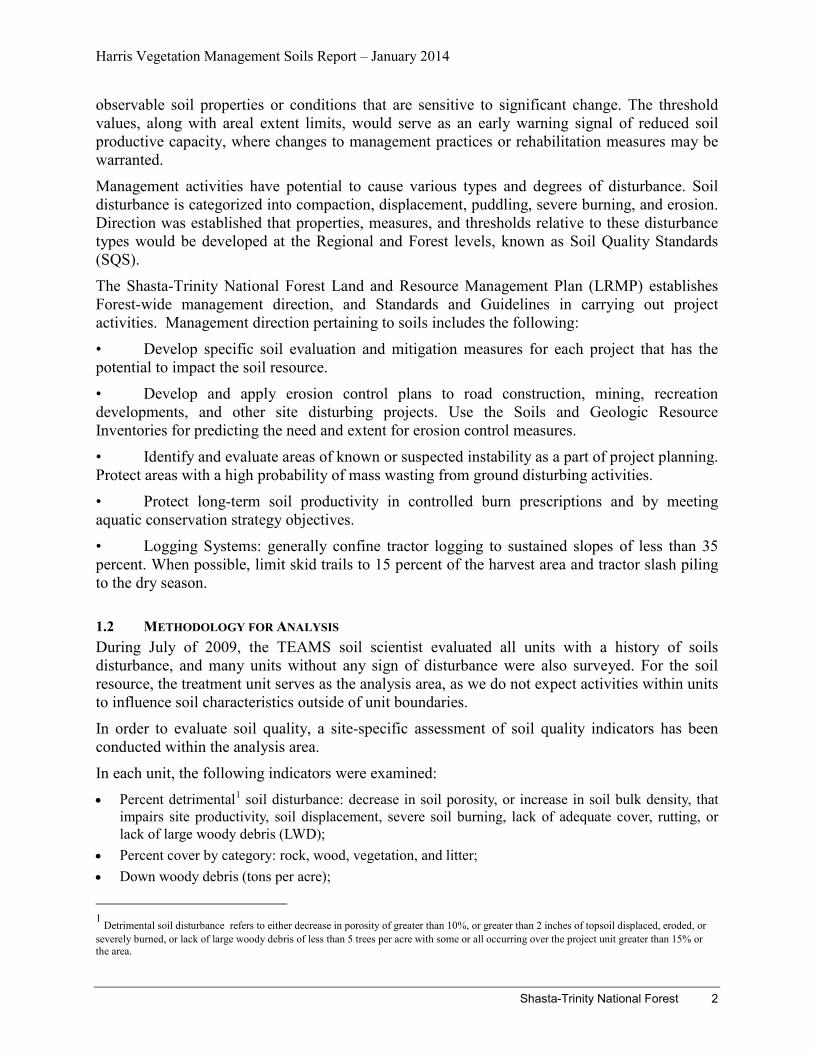
1.1 INTRODUCTION This report evaluates the soil conditions and discloses the potential direct, indirect and cumulative effects of the alternatives for the Harris Vegetation Management Project. This report includes: • Analysis methods and scale; • Affected environment, including current conditions that describe the lasting effects and influence of
past land management; and • Environmental consequences, including direct, indirect and cumulative effects in light of past, present
and reasonably foreseeable future events. The project area encompasses approximately 2,800 treatment acres of federal lands within the Shasta Trinity National Forest northeast of McCloud, California. The Harris Vegetation Management Project is designed to improve forest health, develop late successional forest, and restore fire-adapted ecosystem characteristics.
The Harris Vegetation Management Project would comply with the Shasta Trinity Land and Resource Management Plan (Forest Plan) standards for long-term soil productivity. The proposed silvicultural and fuel treatments in each alternative are not expected to adversely affect soil resources because of soil protection measures that will be implemented as part of each management alternative. These protection measures will help to ensure that resource safeguards will be in place that would prevent adverse effects on the soil resource from occurring. Where effects cannot be avoided, mitigation is planned in order to minimize or negate detrimental levels of soil disturbance.
Regulatory Framework 1.1.1Management actions must occur in conformance with applicable law, regulation, policy, guidance, and management direction. This regulatory framework determines the overall objectives and standards and guidelines applied to project activities and resource management. Elements specifically relevant to the soil resource are described here.
Specific measures, indicators, and thresholds are established in assessing soil condition, and for evaluating the effects of the proposed project on the soil resource- what gets looked at, why, and interpretation of what it means to soil quality and site productivity. The Shasta Trinity National Forest Land and Resource Management Plan (Forest Plan) (1995b) includes forest-wide standards that has a goal to maintain or improve soil productivity and prevent excessive surface erosion, mass wasting, and cumulative watershed impacts. Measures should be taken to avoid adverse effects to soil conditions and to evaluate management effects on soil productivity, soil hydrologic function and soil buffering capacity. For this project, all evaluations of soil productivity also address concerns of hydrologic function and buffering capacity. Hydrologic function is discussed in the hydrology report. Soil buffering capacity is directly proportional to the amount of organic matter in soil and humus and relates to cation exchange capacity. Coarse wood, surface organics (duff or litter), and soil organic carbon (SOC) directly relate to buffering capacity.
The National Soil Management Handbook defines soil productivity and components of soil productivity, and establishes guidance for measuring soil productivity. In determining a significant change in productivity, a 15% reduction in inherent soil productivity potential will be used as a basis for setting threshold values. Threshold values would apply to measurable or
Harris Vegetation Management Soils Report – January 2014
Shasta-Trinity National Forest 2
observable soil properties or conditions that are sensitive to significant change. The threshold values, along with areal extent limits, would serve as an early warning signal of reduced soil productive capacity, where changes to management practices or rehabilitation measures may be warranted.
Management activities have potential to cause various types and degrees of disturbance. Soil disturbance is categorized into compaction, displacement, puddling, severe burning, and erosion. Direction was established that properties, measures, and thresholds relative to these disturbance types would be developed at the Regional and Forest levels, known as Soil Quality Standards (SQS).
The Shasta-Trinity National Forest Land and Resource Management Plan (LRMP) establishes Forest-wide management direction, and Standards and Guidelines in carrying out project activities. Management direction pertaining to soils includes the following:
• Develop specific soil evaluation and mitigation measures for each project that has the potential to impact the soil resource.
• Develop and apply erosion control plans to road construction, mining, recreation developments, and other site disturbing projects. Use the Soils and Geologic Resource Inventories for predicting the need and extent for erosion control measures.
• Identify and evaluate areas of known or suspected instability as a part of project planning. Protect areas with a high probability of mass wasting from ground disturbing activities.
• Protect long-term soil productivity in controlled burn prescriptions and by meeting aquatic conservation strategy objectives.
• Logging Systems: generally confine tractor logging to sustained slopes of less than 35 percent. When possible, limit skid trails to 15 percent of the harvest area and tractor slash piling to the dry season. 1.2 METHODOLOGY FOR ANALYSIS During July of 2009, the TEAMS soil scientist evaluated all units with a history of soils disturbance, and many units without any sign of disturbance were also surveyed. For the soil resource, the treatment unit serves as the analysis area, as we do not expect activities within units to influence soil characteristics outside of unit boundaries.
In order to evaluate soil quality, a site-specific assessment of soil quality indicators has been conducted within the analysis area.
In each unit, the following indicators were examined: • Percent detrimental1 soil disturbance: decrease in soil porosity, or increase in soil bulk density, that
impairs site productivity, soil displacement, severe soil burning, lack of adequate cover, rutting, or lack of large woody debris (LWD);
• Percent cover by category: rock, wood, vegetation, and litter; • Down woody debris (tons per acre);
1
Detrimental soil disturbance refers to either decrease in porosity of greater than 10%, or greater than 2 inches of topsoil displaced, eroded, or severely burned, or lack of large woody debris of less than 5 trees per acre with some or all occurring over the project unit greater than 15% or the area.
Harris Vegetation Management Soils Report – January 2014
Shasta-Trinity National Forest 3
• Litter and duff depths; • Percent of rock in the uppermost soil horizon; and • Slope stability, erosion concerns and other soil issues. Please see the project record for unit-specific field notes and specific methods used for sampling. The sampling protocol used was the Forest Soil Disturbance Monitoring Protocol (Page-Dumroese et al 2009a).
Since then the Shasta-Trinity National Forest (STNF) has adopted the Forest Soil Disturbance Monitoring Protocol (Page-Dumroese, et. al. 2009) which is a multi-faceted approach to soil disturbance and forest sustainability. The STNF has incorporated validation sampling (using transects to measure erosion, disturbance, compaction, displacement, and cover (Rust 2011) as a component of the soil monitoring protocol.
The STNF used the Forest Soil Disturbance Monitoring Protocol (FSDMP) developed by USFS Region 1 and the Rocky Mountain Research Station to provide a standard inventory, monitoring, and assessment tool. This method uses paced transects with “toe-point” sampling combined with qualitative indicators of disturbance. At each point, spade holes are used to assess soil disturbance classes by looking at forest-floor attributes (cover, vegetation, woody debris), surface-soil attributes (displacement, erosion, ruts, burn severity), and subsurface attributes (compaction, platy and massive structure). After porosity, surface woody debris (large woody debris, fine slash, organic matter, and other visual signs of disturbance i.e. ruts, piles of soil, wheel tracks, erosion, burning, displaced topsoil, etc.) are evaluated, each sample point is ranked according to the FSDMP classification system. Bulk density samples are used to validate if detrimental effects have occurred or not, along with tree growth and lack of surface cover and vegetation. Extent of platyness, penetration resistance (cone penetrometer readings >3000 kpa), rutted terrain, and topsoil displacement are also used. Taken together a call is made in the field initially and adjusted if necessary after bulk density samples are analyzed and penetrometer readings are processed. Doing the validation sampling was a step that the STNF added to the process to confirm field calls and develop one’s ability to make proper calls in the field. It also provides additional data to support the FSDMP. 1.3 AFFECTED ENVIRONMENT The Harris Vegetation Management Project area encompasses 9,200 acres on the Shasta Trinity National Forest in the Shasta-McCloud Management Unit in the McCloud Ranger District. The project area is located approximately 23 miles northeast of the city of McCloud, CA. The vegetation in the area is predominately mixed conifer with some pure fir stands. Stands of ponderosa pine and Douglas fir are also common. Elevation ranges from 4,400 to 5,600 feet. This area is typified by buttes and cinder cones (with up to 45 percent slopes) separated by nearly level glacial outwash terraces and lava flows. Virtually no surface water exists within the project area. The climate in the project area is characterized by cool, wet winters and warm dry summers with an average annual precipitation of 48 inches, with most precipitation falling between October and May (Western Regional Climate Center 2010).
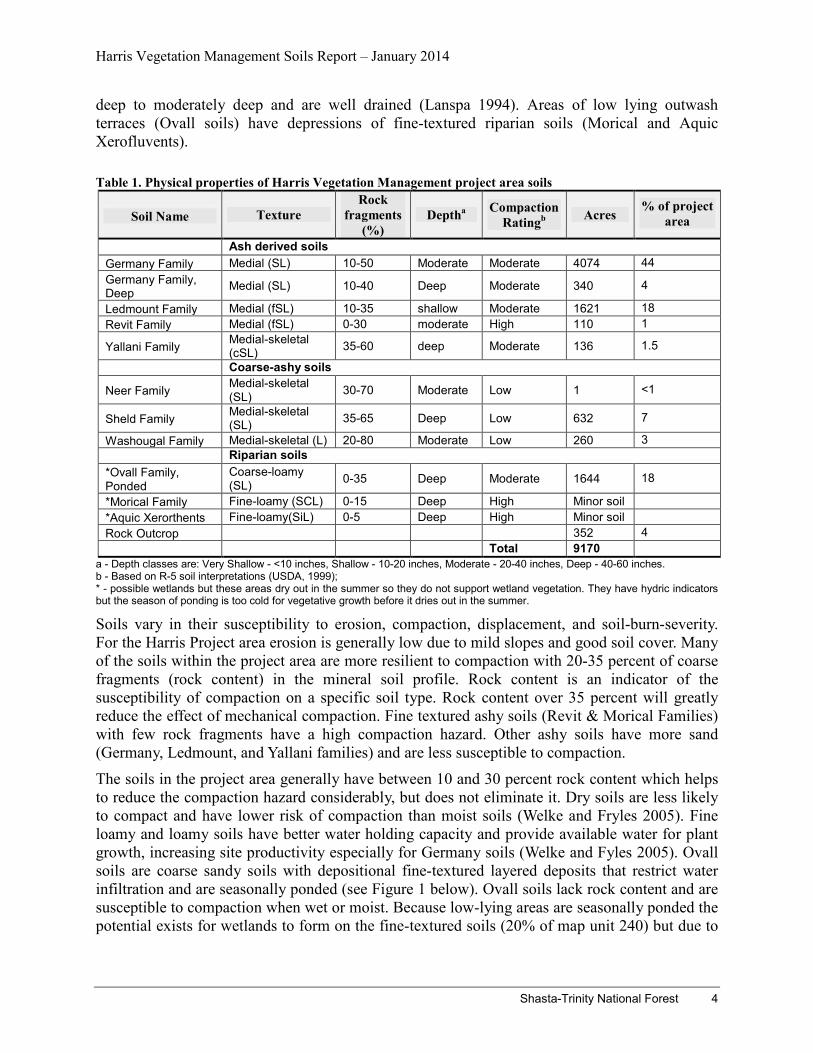
The soils in the project area (Table 1) are terrace and cinder cone soils that are deep and gravelly with sideslope and lava flow soils that are moderately deep and well drained. Soils are generally derived from volcanic materials from lava flows, pyroclastics, mudflows, ash deposition and pumice deposition. The soils are generally coarse textured with a range of coarse fragments, are
Harris Vegetation Management Soils Report – January 2014
Shasta-Trinity National Forest 4
deep to moderately deep and are well drained (Lanspa 1994). Areas of low lying outwash terraces (Ovall soils) have depressions of fine-textured riparian soils (Morical and Aquic Xerofluvents).
Table 1. Physical properties of Harris Vegetation Management project area soils
Soil Name Texture Rock
fragments (%)
Deptha Compaction Ratingb Acres
% of project area
Ash derived soils Germany Family Medial (SL) 10-50 Moderate Moderate 4074 44 Germany Family, Deep Medial (SL) 10-40 Deep Moderate 340 4
Ledmount Family Medial (fSL) 10-35 shallow Moderate 1621 18 Revit Family Medial (fSL) 0-30 moderate High 110 1
Yallani Family Medial-skeletal (cSL) 35-60 deep Moderate 136 1.5
Coarse-ashy soils
Neer Family Medial-skeletal (SL) 30-70 Moderate Low 1 <1
Sheld Family Medial-skeletal (SL) 35-65 Deep Low 632 7
Washougal Family Medial-skeletal (L) 20-80 Moderate Low 260 3 Riparian soils *Ovall Family, Ponded
Coarse-loamy (SL) 0-35 Deep Moderate 1644 18
*Morical Family Fine-loamy (SCL) 0-15 Deep High Minor soil *Aquic Xerorthents Fine-loamy(SiL) 0-5 Deep High Minor soil Rock Outcrop 352 4 Total 9170
a - Depth classes are: Very Shallow - <10 inches, Shallow - 10-20 inches, Moderate - 20-40 inches, Deep - 40-60 inches. b - Based on R-5 soil interpretations (USDA, 1999); * - possible wetlands but these areas dry out in the summer so they do not support wetland vegetation. They have hydric indicators but the season of ponding is too cold for vegetative growth before it dries out in the summer.
Soils vary in their susceptibility to erosion, compaction, displacement, and soil-burn-severity. For the Harris Project area erosion is generally low due to mild slopes and good soil cover. Many of the soils within the project area are more resilient to compaction with 20-35 percent of coarse fragments (rock content) in the mineral soil profile. Rock content is an indicator of the susceptibility of compaction on a specific soil type. Rock content over 35 percent will greatly reduce the effect of mechanical compaction. Fine textured ashy soils (Revit & Morical Families) with few rock fragments have a high compaction hazard. Other ashy soils have more sand (Germany, Ledmount, and Yallani families) and are less susceptible to compaction.
The soils in the project area generally have between 10 and 30 percent rock content which helps to reduce the compaction hazard considerably, but does not eliminate it. Dry soils are less likely to compact and have lower risk of compaction than moist soils (Welke and Fryles 2005). Fine loamy and loamy soils have better water holding capacity and provide available water for plant growth, increasing site productivity especially for Germany soils (Welke and Fyles 2005). Ovall soils are coarse sandy soils with depositional fine-textured layered deposits that restrict water infiltration and are seasonally ponded (see Figure 1 below). Ovall soils lack rock content and are susceptible to compaction when wet or moist. Because low-lying areas are seasonally ponded the potential exists for wetlands to form on the fine-textured soils (20% of map unit 240) but due to
Harris Vegetation Management Soils Report – January 2014
Shasta-Trinity National Forest 5
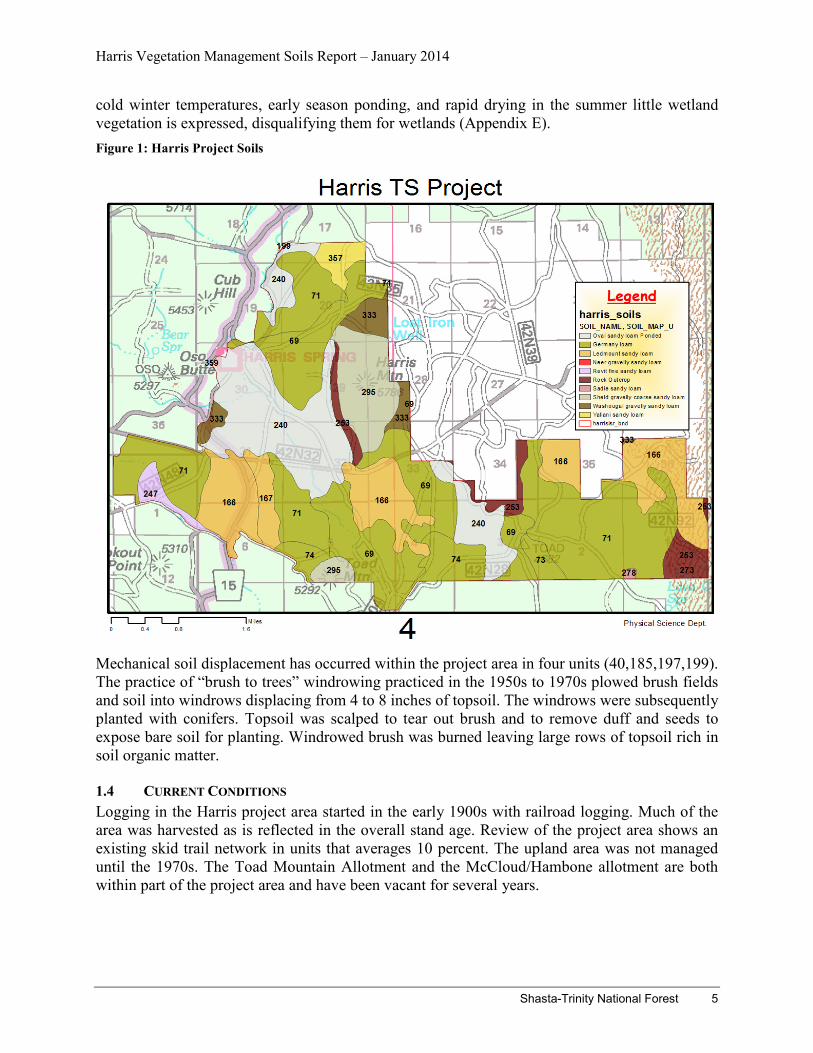
cold winter temperatures, early season ponding, and rapid drying in the summer little wetland vegetation is expressed, disqualifying them for wetlands (Appendix E). Figure 1: Harris Project Soils
Mechanical soil displacement has occurred within the project area in four units (40,185,197,199). The practice of “brush to trees” windrowing practiced in the 1950s to 1970s plowed brush fields and soil into windrows displacing from 4 to 8 inches of topsoil. The windrows were subsequently planted with conifers. Topsoil was scalped to tear out brush and to remove duff and seeds to expose bare soil for planting. Windrowed brush was burned leaving large rows of topsoil rich in soil organic matter. 1.4 CURRENT CONDITIONS Logging in the Harris project area started in the early 1900s with railroad logging. Much of the area was harvested as is reflected in the overall stand age. Review of the project area shows an existing skid trail network in units that averages 10 percent. The upland area was not managed until the 1970s. The Toad Mountain Allotment and the McCloud/Hambone allotment are both within part of the project area and have been vacant for several years.
Harris Vegetation Management Soils Report – January 2014
Shasta-Trinity National Forest 6
Erosion 1.4.1Inherent potential for erosion is low. The slope is generally between 5 and 10 percent with some small areas up to 20 percent. Ground cover by rock, litter, duff and vegetation was nearly continuous in many places, averaging 91 percent over the units. Basal vegetative cover averaged 13 percent, organic matter 65 percent, rock 4 percent and wood 9 percent across the project.
An intact litter layer was found throughout the project area, with thicker and more effective cover in the closed canopy forests versus the open shrubby areas. The litter layer was generally loose, but the shallow duff layer was generally tighter and held together by fungal hyphae. This duff layer provides excellent soil protection. Annual grasses, herbaceous vegetation, and even rock fragments can also be a form of protection and may reduce rain drop impact on soils.
In assessing inherent erosion hazard ratings (EHR) an assumption is made about the ability of a soil, with little or no vegetation cover, to withstand a precipitation event equivalent to the long-term average occurrence of a 2-year, 6 hour storm. The severity of a soil’s erosion hazard depend on a number of factors including the soil’s texture, water movement within the soil as well as runoff potential, slope length, and (importantly) soil surface cover. Risk ratings vary from low to very high with low ratings meaning low probability of adverse effects on soil and water quality if accelerated surface erosion occurs. Moderate erosion hazard ratings mean that accelerated erosion is likely to occur in most years and water quality impacts may occur. High to very high erosion hazard ratings mean that effects to soil productivity and water quality are likely to occur when accelerated erosion happens. Although two soil types within the project area (eight percent of the total area) can potentially have high erosion hazard ratings, currently all of the erosion hazard ratings for the Harris Vegetation Management Project area are low (appendix A).
Soil Organic Matter 1.4.2The importance of soil organic matter cannot be overstated (Okinarian 1996, Jurgensen et al. 1997). This organic component contains a large reserve of nutrients and carbon, and it is dynamically alive with microbial activity. The character of forest soil organic matter influences many critical ecosystem processes, such as the formation of soil structure, which in turn influences soil gas exchange, soil water infiltration rates and soil water-holding capacity. Soil organic matter is also the primary site of nutrient recycling and humus formation, which enhances soil cation exchange capacity and overall fertility.
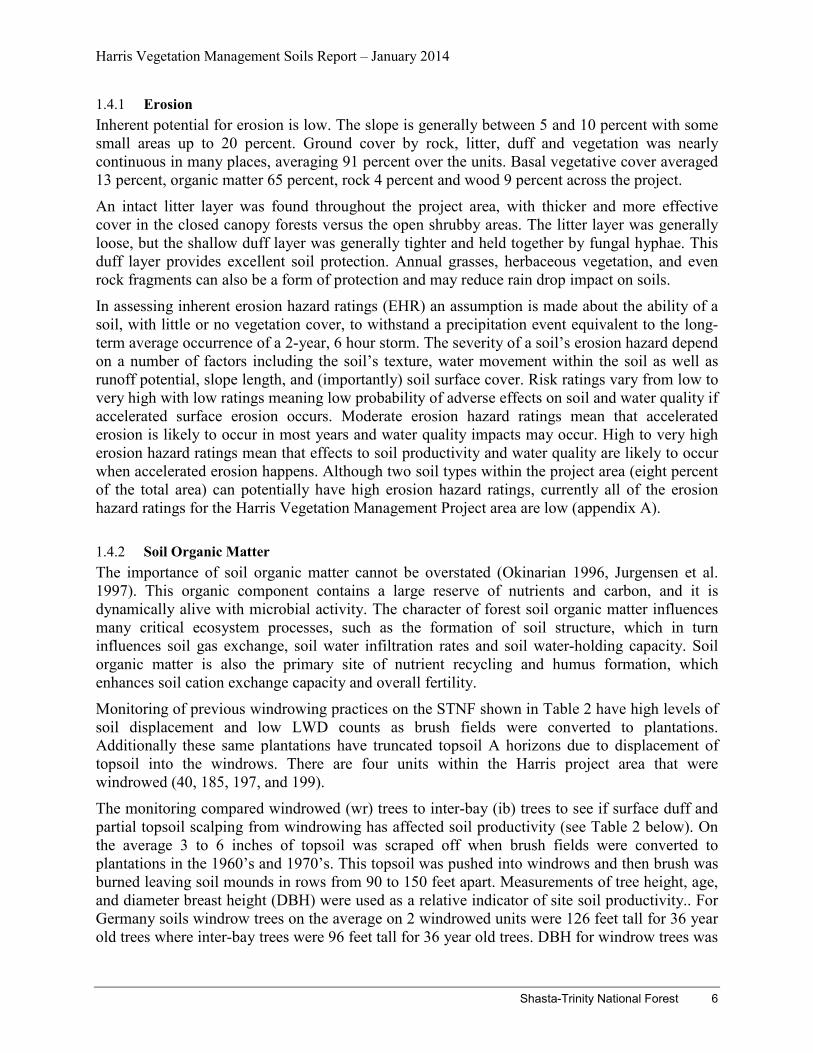
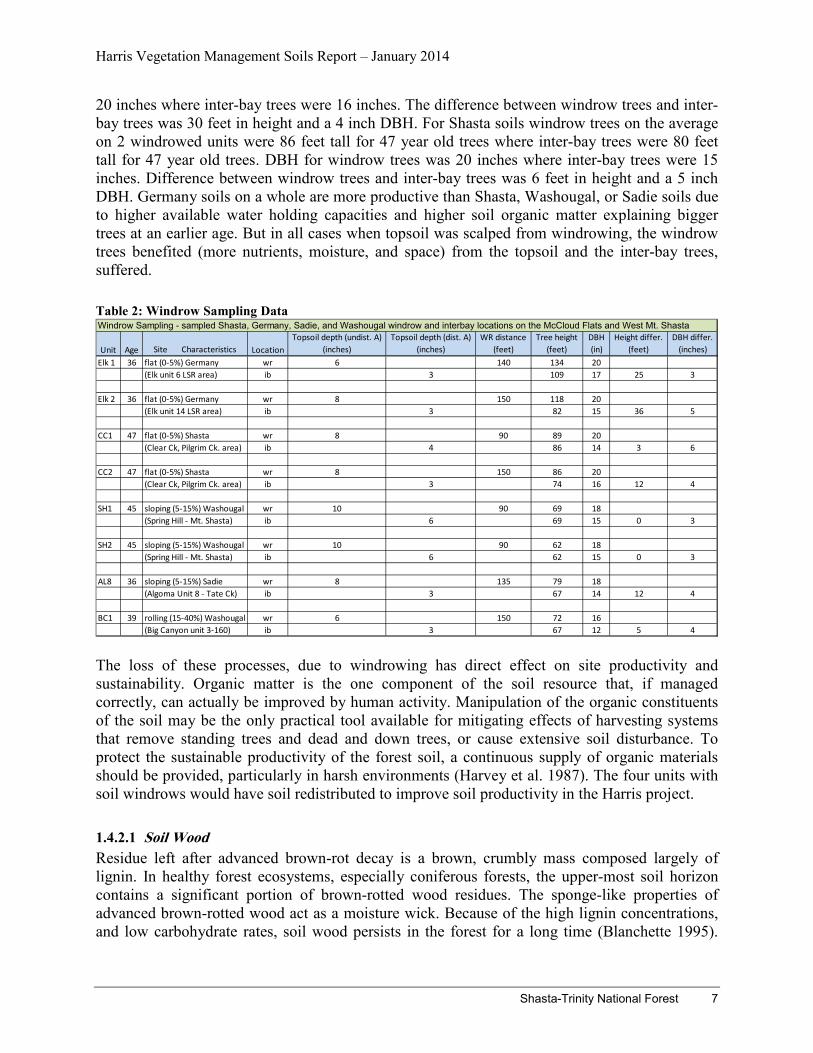
Monitoring of previous windrowing practices on the STNF shown in Table 2 have high levels of soil displacement and low LWD counts as brush fields were converted to plantations. Additionally these same plantations have truncated topsoil A horizons due to displacement of topsoil into the windrows. There are four units within the Harris project area that were windrowed (40, 185, 197, and 199). The monitoring compared windrowed (wr) trees to inter-bay (ib) trees to see if surface duff and partial topsoil scalping from windrowing has affected soil productivity (see Table 2 below). On the average 3 to 6 inches of topsoil was scraped off when brush fields were converted to plantations in the 1960’s and 1970’s. This topsoil was pushed into windrows and then brush was burned leaving soil mounds in rows from 90 to 150 feet apart. Measurements of tree height, age, and diameter breast height (DBH) were used as a relative indicator of site soil productivity.. For Germany soils windrow trees on the average on 2 windrowed units were 126 feet tall for 36 year old trees where inter-bay trees were 96 feet tall for 36 year old trees. DBH for windrow trees was
Harris Vegetation Management Soils Report – January 2014
Shasta-Trinity National Forest 7
20 inches where inter-bay trees were 16 inches. The difference between windrow trees and inter-bay trees was 30 feet in height and a 4 inch DBH. For Shasta soils windrow trees on the average on 2 windrowed units were 86 feet tall for 47 year old trees where inter-bay trees were 80 feet tall for 47 year old trees. DBH for windrow trees was 20 inches where inter-bay trees were 15 inches. Difference between windrow trees and inter-bay trees was 6 feet in height and a 5 inch DBH. Germany soils on a whole are more productive than Shasta, Washougal, or Sadie soils due to higher available water holding capacities and higher soil organic matter explaining bigger trees at an earlier age. But in all cases when topsoil was scalped from windrowing, the windrow trees benefited (more nutrients, moisture, and space) from the topsoil and the inter-bay trees, suffered.
Table 2: Windrow Sampling Data
The loss of these processes, due to windrowing has direct effect on site productivity and sustainability. Organic matter is the one component of the soil resource that, if managed correctly, can actually be improved by human activity. Manipulation of the organic constituents of the soil may be the only practical tool available for mitigating effects of harvesting systems that remove standing trees and dead and down trees, or cause extensive soil disturbance. To protect the sustainable productivity of the forest soil, a continuous supply of organic materials should be provided, particularly in harsh environments (Harvey et al. 1987). The four units with soil windrows would have soil redistributed to improve soil productivity in the Harris project. 1.4.2.1 Soil Wood Residue left after advanced brown-rot decay is a brown, crumbly mass composed largely of lignin. In healthy forest ecosystems, especially coniferous forests, the upper-most soil horizon contains a significant portion of brown-rotted wood residues. The sponge-like properties of advanced brown-rotted wood act as a moisture wick. Because of the high lignin concentrations, and low carbohydrate rates, soil wood persists in the forest for a long time (Blanchette 1995).
Unit Age Site Characteristics LocationTopsoil depth (undist. A)
(inches)Topsoil depth (dist. A)
(inches)WR distance
(feet)Tree height
(feet)DBH (in)
Height differ. (feet)
DBH differ. (inches)
Elk 1 36 flat (0-5%) Germany wr 6 140 134 20(Elk unit 6 LSR area) ib 3 109 17 25 3
Elk 2 36 flat (0-5%) Germany wr 8 150 118 20(Elk unit 14 LSR area) ib 3 82 15 36 5
CC1 47 flat (0-5%) Shasta wr 8 90 89 20(Clear Ck, Pilgrim Ck. area) ib 4 86 14 3 6
CC2 47 flat (0-5%) Shasta wr 8 150 86 20(Clear Ck, Pilgrim Ck. area) ib 3 74 16 12 4
SH1 45 sloping (5-15%) Washougal wr 10 90 69 18(Spring Hill - Mt. Shasta) ib 6 69 15 0 3
SH2 45 sloping (5-15%) Washougal wr 10 90 62 18(Spring Hill - Mt. Shasta) ib 6 62 15 0 3
AL8 36 sloping (5-15%) Sadie wr 8 135 79 18(Algoma Unit 8 - Tate Ck) ib 3 67 14 12 4
BC1 39 rolling (15-40%) Washougal wr 6 150 72 16(Big Canyon unit 3-160) ib 3 67 12 5 4
Windrow Sampling - sampled Shasta, Germany, Sadie, and Washougal windrow and interbay locations on the McCloud Flats and West Mt. Shasta
Harris Vegetation Management Soils Report – January 2014
Shasta-Trinity National Forest 8
The soil wood in the Harris Vegetation Management Project area is generally adequate. Soil cover from organic matter is nearly continuous throughout the project area except old skid trails and landings. Even where cover is naturally patchy, such as in woodland and shrub vegetation types, soil cover standards are met (well exceeding 50 percent as described above). Average observed depth of litter is 2 cm and duff is 2 cm also but total organics range from 1 cm to 13 cm. The thin litter and duff layer in this area is likely due to high rates of decomposition and the organic matter is most likely incorporated in the top soil horizon and to areas that were windrowed and in plantations. In addition to cover directly on the soil surface, most locations within the project area have a canopy cover of perennial, live vegetation which serves as a relatively continuous source of replenishment for soil organic matter. Also charcoal is found in all the units indicating this ecosystem experiences fire and may therefore have shallower litter/duff layers overall.
Currently, coarse woody debris (CWD) greater than 20 inches in diameter is relatively sparse throughout the entire project area which is consistent with historic fire regime for the area (Skinner 2002, McIver et. al. 2012). The quadratic mean diameter of project stands ranges from about 9.4” to 14.4” (Silviculture Report p. 41-42). Because of the stand age and average tree sizes, the availability of trees larger than 20” is limited. Remnant large diameter trees and snags are present, although these size classes are under-represented on the forest floor in most surveyed units.
Soil Porosity 1.4.3Soil porosity refers to the amount and character of void space within the soil. In a “typical” soil approximately 50 percent of the soil volume is void space. Pore space is lost primarily through mechanical compaction.
Three fundamental processes are negatively impacted by compromised soil pore space; gas exchange, soil water infiltration rates, and water holding capacity. Soil oxygen is fundamental to all soil biologic activity. Roots, soil fauna, and fungi all respire, using oxygen while releasing carbon dioxide. When gas exchange is compromised, biologic activity is also compromised. Maintaining appropriate soil biologic activity is paramount when considering long-term forest vitality.
Soil compaction can reduce water infiltration, leading to overland flow and associated erosion, sediment delivery, spring flooding, and low summer flows. Roads, primary skid trails, and landings have the most compaction. Timing of operations is key since activities on moist soils can cause compaction and puddling. Operations on dry or frozen soils helps maintain the soil’s natural ability to quickly restore pore spaces. Available water holding capacity is compromised by compaction since less water infiltrates to be held for plant growth.
Generally coarse fragments in the Harris project area range from 20-35 percent coarse fragments with a sandy loam texture. Soils with higher ash content also have increased susceptibility to compaction. Several units in the project area have a pumice overburden, which are less susceptible to compaction damage.
Riparian soils (Morical and Aquic Xerofluvent) are seasonally wet with stratified outwash layers that pond water and provide potential habitat for wetland vegetation. But due to cold winter seasons, shading from timber, and rapid drying during the summer wetlands are very limited in the Harris Vegetation Management Area (see Appendix E).
Harris Vegetation Management Soils Report – January 2014
Shasta-Trinity National Forest 9
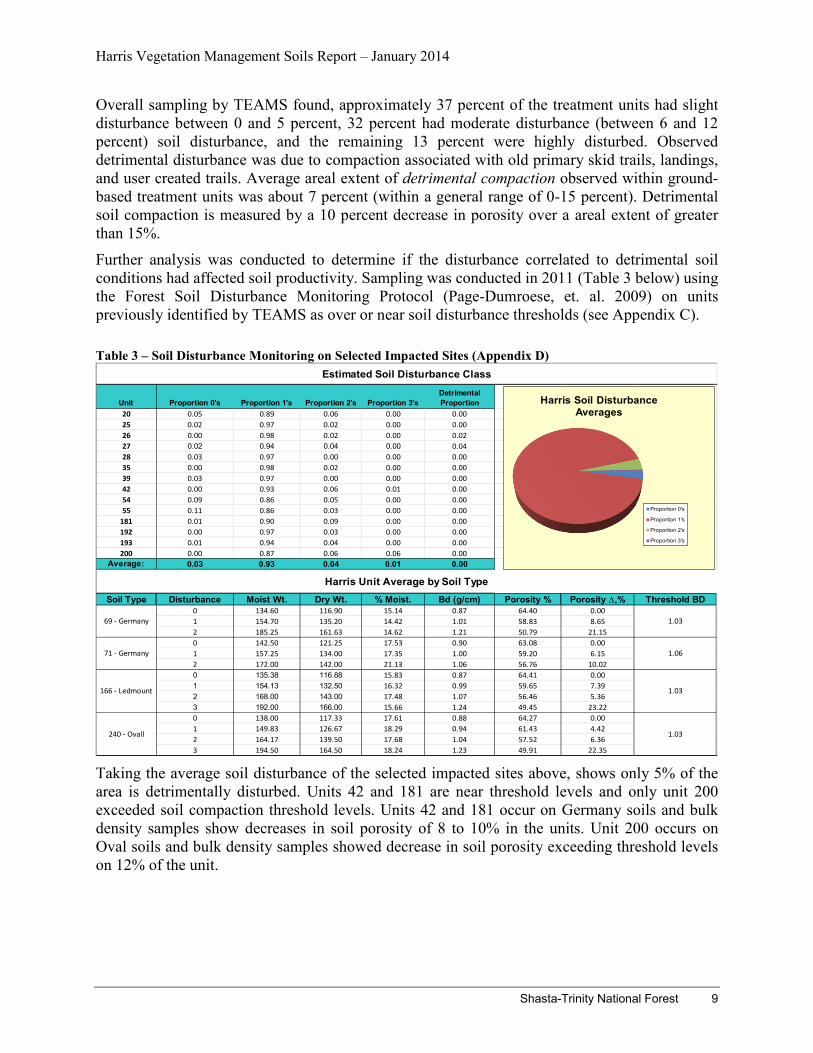
Overall sampling by TEAMS found, approximately 37 percent of the treatment units had slight disturbance between 0 and 5 percent, 32 percent had moderate disturbance (between 6 and 12 percent) soil disturbance, and the remaining 13 percent were highly disturbed. Observed detrimental disturbance was due to compaction associated with old primary skid trails, landings, and user created trails. Average areal extent of detrimental compaction observed within ground-based treatment units was about 7 percent (within a general range of 0-15 percent). Detrimental soil compaction is measured by a 10 percent decrease in porosity over a areal extent of greater than 15%.
Further analysis was conducted to determine if the disturbance correlated to detrimental soil conditions had affected soil productivity. Sampling was conducted in 2011 (Table 3 below) using the Forest Soil Disturbance Monitoring Protocol (Page-Dumroese, et. al. 2009) on units previously identified by TEAMS as over or near soil disturbance thresholds (see Appendix C).
Table 3 – Soil Disturbance Monitoring on Selected Impacted Sites (Appendix D)
Taking the average soil disturbance of the selected impacted sites above, shows only 5% of the area is detrimentally disturbed. Units 42 and 181 are near threshold levels and only unit 200 exceeded soil compaction threshold levels. Units 42 and 181 occur on Germany soils and bulk density samples show decreases in soil porosity of 8 to 10% in the units. Unit 200 occurs on Oval soils and bulk density samples showed decrease in soil porosity exceeding threshold levels on 12% of the unit.
Unit Proportion 0's Proportion 1's Proportion 2's Proportion 3'sDetrimental Proportion
20 0.05 0.89 0.06 0.00 0.00 0.04 0.0025 0.02 0.97 0.02 0.00 0.0026 0.00 0.98 0.02 0.00 0.0227 0.02 0.94 0.04 0.00 0.0428 0.03 0.97 0.00 0.00 0.0035 0.00 0.98 0.02 0.00 0.0039 0.03 0.97 0.00 0.00 0.0042 0.00 0.93 0.06 0.01 0.0054 0.09 0.86 0.05 0.00 0.0055 0.11 0.86 0.03 0.00 0.00
181 0.01 0.90 0.09 0.00 0.00192 0.00 0.97 0.03 0.00 0.00193 0.01 0.94 0.04 0.00 0.00200 0.00 0.87 0.06 0.06 0.00
Average: 0.03 0.93 0.04 0.01 0.00
Soil Type Disturbance Moist Wt. Dry Wt. % Moist. Bd (g/cm) Porosity % Porosity ∆,% Threshold BD0 134.60 116.90 15.14 0.87 64.40 0.001 154.70 135.20 14.42 1.01 58.83 8.652 185.25 161.63 14.62 1.21 50.79 21.150 142.50 121.25 17.53 0.90 63.08 0.001 157.25 134.00 17.35 1.00 59.20 6.152 172.00 142.00 21.13 1.06 56.76 10.020 135.38 116.88 15.83 0.87 64.41 0.001 154.13 132.50 16.32 0.99 59.65 7.392 168.00 143.00 17.48 1.07 56.46 5.363 192.00 166.00 15.66 1.24 49.45 23.220 138.00 117.33 17.61 0.88 64.27 0.001 149.83 126.67 18.29 0.94 61.43 4.422 164.17 139.50 17.68 1.04 57.52 6.363 194.50 164.50 18.24 1.23 49.91 22.35
166 - Ledmount 1.03
240 - Ovall 1.03
Harris Unit Average by Soil Type
Estimated Soil Disturbance Class
69 - Germany 1.03
71 - Germany 1.06
Harris Soil Disturbance Averages
Proportion 0's
Proportion 1's
Proportion 2's
Proportion 3's
Harris Vegetation Management Soils Report – January 2014
Shasta-Trinity National Forest 10
Monitoring from the STNF National Forest (Rust 2009b, Foss 2010) from 2001 to 2010 found that when soils are dry2 to 8 inches, detrimental compaction does not occur. Resource protection measures restricting operation during wet weather have been effective according to monitoring results on the forest (Table 4).
2 Dry is defined as “when soils are dry (generally less than 18% soil moisture) enough to operate mechanical equipment without causing detrimental soil impacts of erosion, compaction, puddling, or displacement.”
Harris Vegetation Management Soils Report – January 2014
Shasta-Trinity National Forest 11
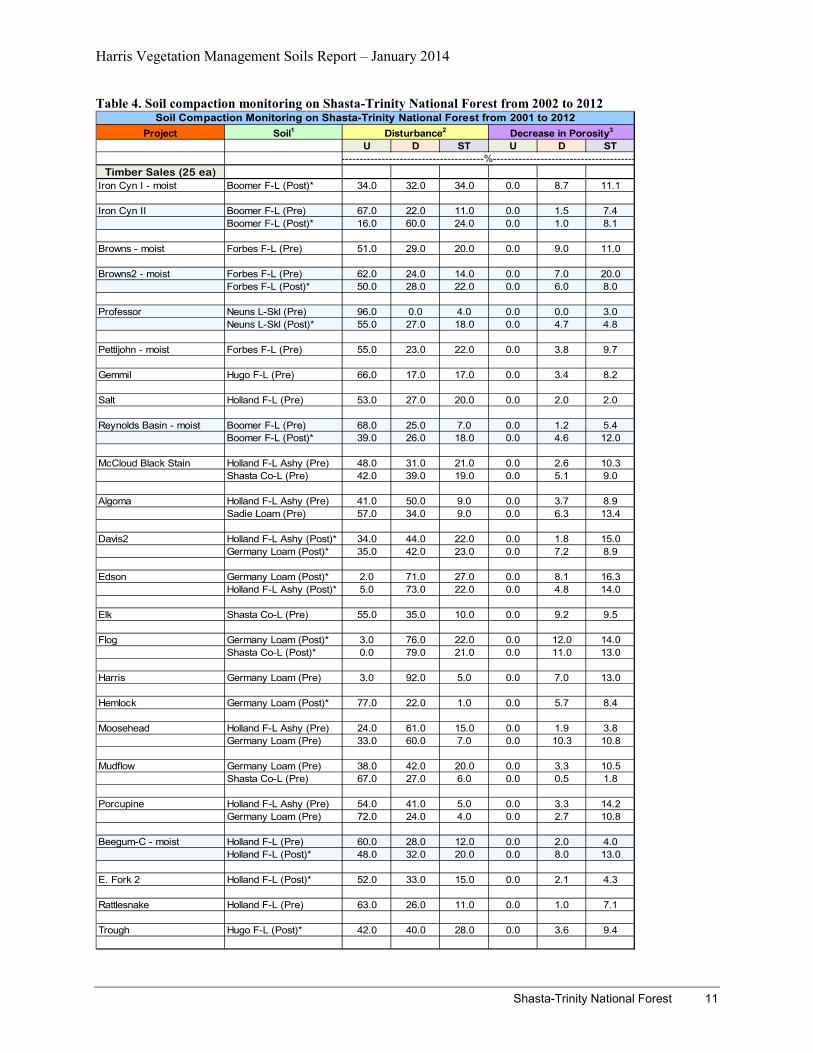
Table 4. Soil compaction monitoring on Shasta-Trinity National Forest from 2002 to 2012
Project Soil1
U D ST U D ST
Timber Sales (25 ea)Iron Cyn I - moist Boomer F-L (Post)* 34.0 32.0 34.0 0.0 8.7 11.1
Iron Cyn II Boomer F-L (Pre) 67.0 22.0 11.0 0.0 1.5 7.4Boomer F-L (Post)* 16.0 60.0 24.0 0.0 1.0 8.1
Browns - moist Forbes F-L (Pre) 51.0 29.0 20.0 0.0 9.0 11.0
Browns2 - moist Forbes F-L (Pre) 62.0 24.0 14.0 0.0 7.0 20.0Forbes F-L (Post)* 50.0 28.0 22.0 0.0 6.0 8.0
Professor Neuns L-Skl (Pre) 96.0 0.0 4.0 0.0 0.0 3.0Neuns L-Skl (Post)* 55.0 27.0 18.0 0.0 4.7 4.8
Pettijohn - moist Forbes F-L (Pre) 55.0 23.0 22.0 0.0 3.8 9.7
Gemmil Hugo F-L (Pre) 66.0 17.0 17.0 0.0 3.4 8.2
Salt Holland F-L (Pre) 53.0 27.0 20.0 0.0 2.0 2.0
Reynolds Basin - moist Boomer F-L (Pre) 68.0 25.0 7.0 0.0 1.2 5.4Boomer F-L (Post)* 39.0 26.0 18.0 0.0 4.6 12.0
McCloud Black Stain Holland F-L Ashy (Pre) 48.0 31.0 21.0 0.0 2.6 10.3Shasta Co-L (Pre) 42.0 39.0 19.0 0.0 5.1 9.0
Algoma Holland F-L Ashy (Pre) 41.0 50.0 9.0 0.0 3.7 8.9Sadie Loam (Pre) 57.0 34.0 9.0 0.0 6.3 13.4
Davis2 Holland F-L Ashy (Post)* 34.0 44.0 22.0 0.0 1.8 15.0Germany Loam (Post)* 35.0 42.0 23.0 0.0 7.2 8.9
Edson Germany Loam (Post)* 2.0 71.0 27.0 0.0 8.1 16.3Holland F-L Ashy (Post)* 5.0 73.0 22.0 0.0 4.8 14.0
Elk Shasta Co-L (Pre) 55.0 35.0 10.0 0.0 9.2 9.5
Flog Germany Loam (Post)* 3.0 76.0 22.0 0.0 12.0 14.0Shasta Co-L (Post)* 0.0 79.0 21.0 0.0 11.0 13.0
Harris Germany Loam (Pre) 3.0 92.0 5.0 0.0 7.0 13.0
Hemlock Germany Loam (Post)* 77.0 22.0 1.0 0.0 5.7 8.4
Moosehead Holland F-L Ashy (Pre) 24.0 61.0 15.0 0.0 1.9 3.8Germany Loam (Pre) 33.0 60.0 7.0 0.0 10.3 10.8
Mudflow Germany Loam (Pre) 38.0 42.0 20.0 0.0 3.3 10.5Shasta Co-L (Pre) 67.0 27.0 6.0 0.0 0.5 1.8
Porcupine Holland F-L Ashy (Pre) 54.0 41.0 5.0 0.0 3.3 14.2Germany Loam (Pre) 72.0 24.0 4.0 0.0 2.7 10.8
Beegum-C - moist Holland F-L (Pre) 60.0 28.0 12.0 0.0 2.0 4.0Holland F-L (Post)* 48.0 32.0 20.0 0.0 8.0 13.0
E. Fork 2 Holland F-L (Post)* 52.0 33.0 15.0 0.0 2.1 4.3
Rattlesnake Holland F-L (Pre) 63.0 26.0 11.0 0.0 1.0 7.1
Trough Hugo F-L (Post)* 42.0 40.0 28.0 0.0 3.6 9.4
Soil Compaction Monitoring on Shasta-Trinity National Forest from 2001 to 2012Disturbance2 Decrease in Porosity3
---------------------------------------%---------------------------------------
Harris Vegetation Management Soils Report – January 2014
Shasta-Trinity National Forest 12
The main soil type found in the Harris Vegetation Management Project area is Germany and these soils are much less compactable than Holland soils. Skid trails in the Harris Project are compacted with an average of 13 percent decrease in porosity on 5 percent of the units. Monitoring on the adjacent Klamath National Forest with similar soil types noted that while compaction does occur on landings and main skid trails (usually only within about 200 feet of the landings where multiple passes of machinery coalesce), it is generally less than 15 percent of the unit (Laurent 2007). Areas on the Klamath where detrimental compaction was found were effectively rehabilitated by subsoiling. The STNF has also incorporated subsoiling to reduce compaction and improve infiltration on projects on the Shasta-McCloud Management Unit.
The table above shows soil compaction monitored projects from 2001 to 2012. Soil types are listed from fine-loamy soils (Boomer, Forbes, Holland, and Hugo) to coarse soils (Neuns, Marpa, Germany, Sadie, and Shasta) on tractor based slopes of 2 to 40%. Disturbance levels are noted as U is undisturbed sites (SD0), D is areas with moderate levels of disturbance (SD1), and ST is areas that have definite skid-trails (SD2&3). Breaking out fine textured (fine-loamy and loamy) soils from coarse textured (coarse-loamy and loamy-skeletal) soils showed more post-harvest skid-trails at threshold bulk density for fine soils vs. coarse soils, indicating fine textured soils are more susceptible to compaction than coarse textured soils. This data shows on the average across all soil types current mechanical harvesting operations decrease porosity on skid-trails only by 1 to 3% from pre-harvest levels due to better equipment, effective BMPs, and site specific mitigations. Total disturbance increased on an average of 12 to 15% using new harvest methods but this disturbance is not detrimental. New harvest equipment is lighter on the ground but has a bigger footprint.
1.5 ENVIRONMENTAL CONSEQUENCES Methodology 1.5.1
Soil resources on the project area have been reviewed using soil survey data, data in GIS, and field reconnaissance. Most of the units have been field reviewed by the soil scientist to verify mapping, identify areas where soil productivity may be affected by proposed actions, and examine current disturbance on site. Best management practices (BMPs) and resource protection measures for soil protection in harvest units and along road segments are based on field data. Effects analyses are based on the proposed silvicultural prescriptions and fuel treatments.
In determining a significant change in productivity, a 15 percent reduction in inherent soil productivity potential will be used as a basis for setting threshold values. This 15 percent reduction is generally considered a reduction of productivity over 15 percent of an area. Threshold values would apply to measurable or observable soil properties or conditions that are sensitive to significant change. The threshold values, along with aerial extent limits, would serve as an early warning signal of reduced soil productive capacity, where changes to management practices or rehabilitation measures may be warranted. Management activities have potential to cause various types and degrees of disturbance. Soil disturbance is categorized into compaction, displacement, puddling, severe burning, and erosion. Direction was established that properties, measures, and thresholds relative to these disturbance types would be developed at the Regional and Forest levels, known as soil quality standards.
The effects of each alternative on the soil resource have been assessed using the Region 5 Soil Quality Standards and the Forest Plan. Soil quality analysis standards provide threshold values
Harris Vegetation Management Soils Report – January 2014
Shasta-Trinity National Forest 13
that indicate when changes in soil properties and soil conditions would result in significant change or impairment of the productivity potential, hydrologic function, or buffering capacity of the soil. Forest Plan Standards and Guidelines for soils state that in an even-aged managed stand no more than 15% of the area shall be in a nonproductive state (landings, roads, and main skid-trails) on matrix lands (Forest Plan Chapter 4 section 4-25). These standards apply to the soil project bounding area only (treatment units).
The best available science was used in analyzing the soils and the effects of the Harris Vegetation Management Project. The most current and relevant reports were used. Studies and monitoring were related to the specific project area.
Spatial and Temporal Context for Effects Analysis 1.5.2The analysis area or bounding area, for direct, indirect, and cumulative effects for the soil resource includes the proposed harvest units. This is the area that is expected to be directly impacted by any silvicultural or fuel reduction activities. The Harris Vegetation Management Project area is used to qualitatively discuss the past activities outside of proposed treatment units. Please see the hydrology resource report for cumulative watershed effects.
The soil analysis includes the current environmental conditions as they reflect the aggregate impact of both human and natural activities within the proposed treatment units. Many of the past activities were not known prior to doing field surveys. GIS analysis prior to field surveys did not have any past harvest activities documented in proposed units except for the plantations. The evidence of railroad logging and yarding patterns are evident on the 1944 aerial photos.
The following units of measure will be used to describe the differences among alternatives. • Percent detrimental soil conditions from thinning and fuel operations, including skid trails, treatment
units, etc. post-activity will be evaluated by using pre-harvest conditions vs. proposed alternatives. • Number of units that have a high risk of exceeding soil quality standards with planned alternatives.
Assumptions 1.5.3
The effect of proposed activities have varying recovery rates depending on the degree of disturbance, duration of disturbance effect, distribution of disturbance (pattern), and soil variability. Soil compaction within the project area will vary depending on the existing condition, type of harvest, equipment, and use of resource protection measures. Soil compaction is reduced over the timeframe due to inputs from plant roots, other organics, and physical weathering Table 4). Erosion recovery ranges from two to five years and fertility is one to three years depending if the area has not been windrowed. Windrowed units that have topsoil removal will begin to recover with windrow respreading.
The effect of management on soil recovery is dependent on soil type, climate, moisture, cover and time. Different soil characteristics (erosion or compaction or fertility) have different estimated recovery rates (Table 5). There are short term increases in erosion but over a two to five year span those rates decrease. Reduced duff and dead woody material reduce fertility in the short-term but recover quickly except areas windrowed. Residual trees will respond with increased growth, root mass, soil organic matter and an overall increase of soil fertility when released.
Harris Vegetation Management Soils Report – January 2014
Shasta-Trinity National Forest 14
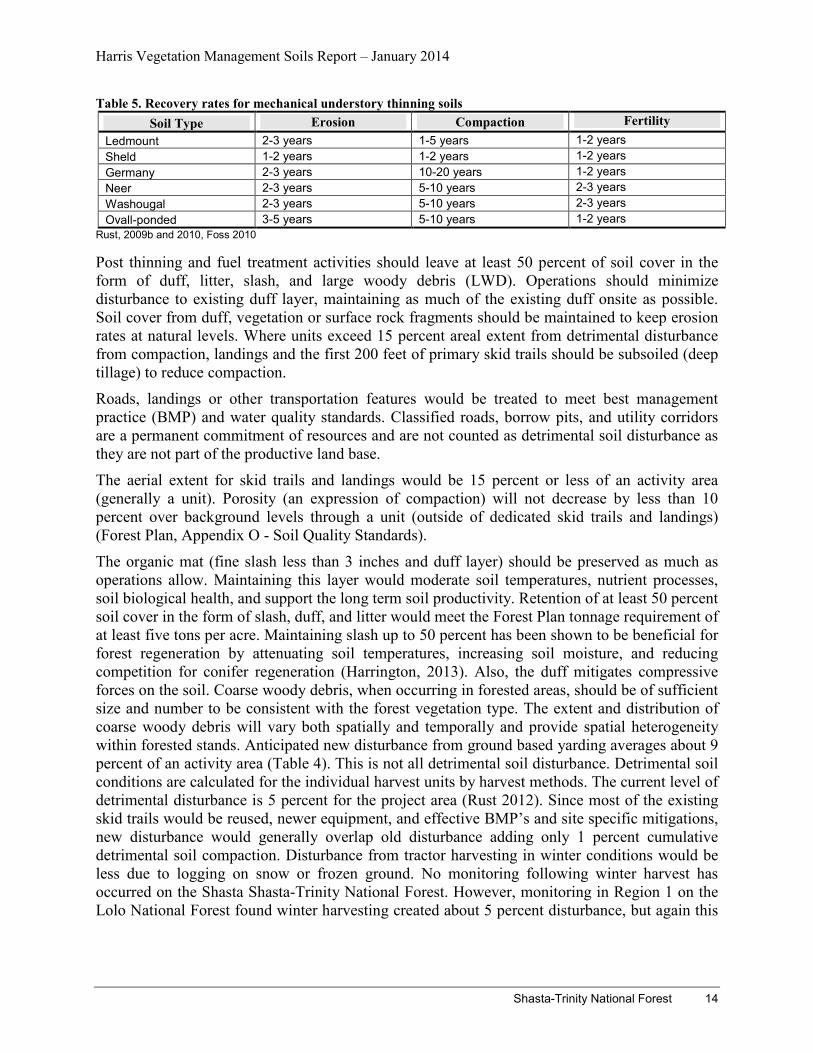
Table 5. Recovery rates for mechanical understory thinning soils Soil Type Erosion Compaction Fertility
Ledmount 2-3 years 1-5 years 1-2 years Sheld 1-2 years 1-2 years 1-2 years Germany 2-3 years 10-20 years 1-2 years Neer 2-3 years 5-10 years 2-3 years Washougal 2-3 years 5-10 years 2-3 years Ovall-ponded 3-5 years 5-10 years 1-2 years
Rust, 2009b and 2010, Foss 2010 Post thinning and fuel treatment activities should leave at least 50 percent of soil cover in the form of duff, litter, slash, and large woody debris (LWD). Operations should minimize disturbance to existing duff layer, maintaining as much of the existing duff onsite as possible. Soil cover from duff, vegetation or surface rock fragments should be maintained to keep erosion rates at natural levels. Where units exceed 15 percent areal extent from detrimental disturbance from compaction, landings and the first 200 feet of primary skid trails should be subsoiled (deep tillage) to reduce compaction.
Roads, landings or other transportation features would be treated to meet best management practice (BMP) and water quality standards. Classified roads, borrow pits, and utility corridors are a permanent commitment of resources and are not counted as detrimental soil disturbance as they are not part of the productive land base.
The aerial extent for skid trails and landings would be 15 percent or less of an activity area (generally a unit). Porosity (an expression of compaction) will not decrease by less than 10 percent over background levels through a unit (outside of dedicated skid trails and landings) (Forest Plan, Appendix O - Soil Quality Standards).
The organic mat (fine slash less than 3 inches and duff layer) should be preserved as much as operations allow. Maintaining this layer would moderate soil temperatures, nutrient processes, soil biological health, and support the long term soil productivity. Retention of at least 50 percent soil cover in the form of slash, duff, and litter would meet the Forest Plan tonnage requirement of at least five tons per acre. Maintaining slash up to 50 percent has been shown to be beneficial for forest regeneration by attenuating soil temperatures, increasing soil moisture, and reducing competition for conifer regeneration (Harrington, 2013). Also, the duff mitigates compressive forces on the soil. Coarse woody debris, when occurring in forested areas, should be of sufficient size and number to be consistent with the forest vegetation type. The extent and distribution of coarse woody debris will vary both spatially and temporally and provide spatial heterogeneity within forested stands. Anticipated new disturbance from ground based yarding averages about 9 percent of an activity area (Table 4). This is not all detrimental soil disturbance. Detrimental soil conditions are calculated for the individual harvest units by harvest methods. The current level of detrimental disturbance is 5 percent for the project area (Rust 2012). Since most of the existing skid trails would be reused, newer equipment, and effective BMP’s and site specific mitigations, new disturbance would generally overlap old disturbance adding only 1 percent cumulative detrimental soil compaction. Disturbance from tractor harvesting in winter conditions would be less due to logging on snow or frozen ground. No monitoring following winter harvest has occurred on the Shasta Shasta-Trinity National Forest. However, monitoring in Region 1 on the Lolo National Forest found winter harvesting created about 5 percent disturbance, but again this
Harris Vegetation Management Soils Report – January 2014
Shasta-Trinity National Forest 15
new disturbance would overlap existing disturbance adding about 9 percent cumulative disturbance to a particular unit but only 1to 3 percent increase in detrimental soil disturbance.3
Detrimental soil disturbances from fuel treatments are estimated at an additional 1 percent for mastication or underburning, 2 percent for mechanical brush piling and burning, negligible for handpiling for each unit.
Erosion risk for all units is low due to the gentle slopes and high infiltration capacity of the ash-derived soils (most soils are in hydrologic group B). Erosion is predicted to remain low in all units and in all action alternatives due to soils that are very deep to deep, well drained and gentle slopes. The erosion hazard rating model rated three soils at low-moderate after treatment due to small portions of steeper slopes (appendix A). The steepest slopes possible in the units were used in the model so this is the highest post treatment risk. Generally, proposed harvest is on slopes from 0 to 15 percent, much gentler than modeled.
By implementing all resource protection measures (soil design features), BMPs, and standard timber sale contract clauses, all units should meet Forest Plan soil quality standards. There should be less than 15 percent of any unit in skid trails or other non-productive state, adequate cover should minimize erosion, added slash and maintenance of the duff layer should maintain soil biological process, soil fertility, and ultimately soil productivity.
Many of the proposed units are located on the rocky coarser-textured soils which would resist compaction and impacts could be less than anticipated (Welke and Fryles 2005).
Resource Protection Measures 1.5.4The following resource protection measures are included and should apply (all resource protection measures can be found in chapter 2 of the EIS).
Table 6. Resource protection measures for soils Soil
Number Resource Protection Measure Alternatives Units/Location
S-1
Reuse existing skid trails and landings where possible and dedicate no more than 15 percent of a harvest unit to primary skid trails and landings to limit the extent of skid trail and landing impacts. Till landings and main skid trails within 200 feet of landings with equipment such as a winged subsoiler or other tilling device to a maximum depth of 18 inches so that the soil is lifted vertically and fractured laterally to alleviate detrimental compaction (where it occurs) following completion of all management activities. Tillage will be completed outside of the tree drip line so as not to impact root systems.
1, 2, 3, 4a, 4b, 4c
Units 1,2,4-20,22,25-30,33-38,40,41,42,43,45-52,54,56-58,113,173,174,175,180-182,184-189,192-200,223
S-2
Implement best management practices (BMPs) and Forest soil quality standards for all activities. These BMPs will be used to prevent or mitigate project-associated effects related to soil erosion, compaction, and productivity. BMPs are found in
1, 2, 3, 4a, 4b, 4c All units
3 Detrimental soil disturbance vs. soil disturbance is defined as “detrimental soil disturbance is when SQS threshold levels are exceeded causing a reduction in soil productivity. Soil disturbance is when SQS threshold levels are not exceeded and that does not cause a reduction in soil productivity”.
Harris Vegetation Management Soils Report – January 2014
Shasta-Trinity National Forest 16
Soil Number Resource Protection Measure Alternatives Units/Location
Water Quality Management for Forest System Lands in California (USDA Forest Service 2000).
S-3 Redistribute soil windrows in old plantations post-harvest to restore soil productivity. Plantation units 185 and 199 will be evaluated post-harvest to determine if windrow respreading is necessary.
1, 2, 3, 4a, 4b, 4c Units 40, 185, 197 and 199.
S-4 Maintain ground cover (duff, leaves) across at least 50 percent of all activity areas to maintain soil productivity where available.
1, 2, 3, 4a, 4b, 4c All units
S-5
Limiting the operating period (LOP) of timber sale activities: The objective of Practice S-5 is to ensure that the purchasers conduct their operations, including erosion control work and road maintenance, in a timely manner and within the timeframe specified in the timber sale contract. The extent of the wet weather and snowmelt season in Northern California can be very unpredictable, therefore a fixed Limited Operating Period for wet weather conditions will not be set for any of the proposed actions described in the EIS. Timber sale contract provision B6.6 can be used to close down operations because of wet weather, high water, or other considerations in order to protect resources. The spring snowmelt period (April-May) is the time when the potential for soil impacts are greatest. The sale administrator will be responsible for ensuring that timber harvest activities will not degrade the soil and water resource.
1, 2, 3, 4a, 4b
Units 20, 21, 24, 27, 28, 32, 33, 35, 39, 42, 44, 45, 52, 53, 54, 55, 57, 58, 173, 180, 181, 185, 186, 192, 194, 196, 199, 200.
4c
Units 20, 21, 24, 27, 28, 32, 33, 35, 39, 42, 45, 52, 53-55, 57, 173, 180. 181, 185, 186, 192, 194, 196, 199
S-6 Conduct post-treatment FSDMP monitoring 1-3 years post-treatment to evaluate soil conditions including CWD.
All Representative units that include different soils and treatments.
Desired Condition for all units 1.5.5Soil productivity is retained or improved in all treatment units.
At the end of project activities, a layer of ground cover should occur over at least 50 percent of the activity area including duff, slash, and coarse woody debris.
Harris Vegetation Management Soils Report – January 2014
Shasta-Trinity National Forest 17
Alternative 1 – Proposed Action 1.5.61.5.6.1 Direct Effects Proposed activities would have short-term direct negative effects on forest soils. However, by implementing the soil resource protection measures prescribed here and shown in chapter 2 of the EIS the project would meet or exceed the Forest Plan soil quality standards as shown below, and would therefore not have a significant impact to soils.
Effects include: • Compaction; • Rutting and displacement; • Soil-burn-severity; • Degraded litter layer and soil organic matter caused by increased decomposition rates and lack of
appropriate annual litter contributions; Coarse woody debris. Proposed activities use techniques that maintain or promote natural soil bio-physical resiliency. The effect of proposed activities should be relatively short compared to techniques used in the past due to newer logging systems and resilient soils. By retaining natural elements and processes we can expect soil impacts to be nearly undetectable within 10 to 20 years based on professional judgment and experience on these soil types. Freeze-thaw cycles, soil organisms, and root growth will help alleviate compaction and rutting. Soil displacement may last longer, but design features minimize soil displacement (Soil Design Features: S-1, S-2).
Units 42, 181, 186, and 193 are near the threshold for detrimental disturbance with 8 to 12 percent detrimental disturbance on 7 to 9 percent of the units. Following Forest Plan standards and guidelines, BMPs, and project resource protection measure (including subsoiling of landings and heavily used skid trails) should reduce adverse effects and improve soil physical, chemical and biological properties. (Soil Design Feature: S-2). Monitoring has found that when soils are dry4 to 8 inches, detrimental compaction does not occur. Resource protection measures restricting operation during wet weather have been effective according to monitoring results on the forest.
Unit 200 has detrimental soil disturbance levels above 10 percent on 12 percent of the unit in existing landings and skid trails. Those units with ashy soils are more easily rutted and compacted especially during wet weather. Other ashy soils with more sand (e.g. Germany, Ledmount families) are less susceptible to compaction (unit 42). The risk of exceeding soil quality standards is minimized by reusing existing skid trails, operating during dry weather or frozen soil conditions, minimizing the sizes of landings, and rehabilitating sections of skid trails and landings. In unit 42 about one half of a mile of an unauthorized road will be decommissioned thus reducing future impacts to this unit. Reusing existing skid trails and minimizing size of landings should keep the aerial extent of disturbance to a minimum, because a smaller impacted area leaves more of the unit in an undisturbed state. Mechanical harvesting operations should only increase detrimental compaction by 1 to 3 percent due to better operations, equipment, and soil resource protection measures as show by the STNF Monitoring (Table 4 and Soil Design Feature: S-5).
4 Dry is defined as “when soils are dry (generally less than 18% soil moisture) enough to operate mechanical equipment without causing detrimental soil impacts of erosion, compaction, puddling, or displacement.”
Harris Vegetation Management Soils Report – January 2014
Shasta-Trinity National Forest 18
Units 40, 185, 197, and 199 are ponderosa pine plantations. When initially harvested, organic matter and the top soil horizon were scraped into piles (windrows) on the edges of these units. This organic matter and top soil horizon are crucial for soil productivity. The loss of organic matter due to windrowing has a direct effect on site productivity and sustainability. In these units, the soil piles would be redistributed throughout the unit to increase soil productivity and increase the resiliency of these units. Windrow respreading has been used in several locations on the STNF near the Harris Vegetation Management Project Area and has been found to be effective (Van Susteren 2010 and Soil Design Feature: S-3).
Tractor piling brush in these units when soils are dry would not increase soil compaction due to the degree, extent, distribution, and duration of the activity. General concerns about tractor piling practices are worthy of discussion. Historically, tractor piling did in many cases earn a reputation as a harmful practice on soils; this generality is from an era where tractor piling almost exclusively referred to site preparation for planting after a clearcut, and often occurring on moderately steep slopes. Heavy slash accumulations were “straight-bladed” into piles, often including large amounts of topsoil into the piles (sometimes purposely, to reduce re-growth of sprouting species as competition for planted trees). This practice was eventually widely recognized as harmful to soil productivity, and one of a few practices that directly led to topsoil displacement standards incorporated in national and regional soil management direction from 1991 to 1995. Slash piling as practiced then no longer occurs on FS lands since the mid-1990’s. Mechanical operations as a whole are limited to slopes <35%, so impacts associated with steeper slope operations are avoided altogether. “Modern” mechanical slash piling uses much smaller tractors equipped with brush rakes on the blade, resulting in little to no topsoil displacement with a skilled operator, and little to no compaction that would be of a detrimental degree. The activity is often in thinning stands, so there is much less slash being generated; this together with whole tree yarding results in much less slash material being moved about into piles, so there is much less equipment traffic on the soils. Further, the purpose of the activity has changed from site preparation to fuel reduction, so the units do not need to be rigorously “clean” of slash material, and duff materials are left in place for soil cover and erosion protection. Specifications for these activities require “clean” piles without soil, which helps them burn properly as well. The Shasta-Trinity has a long track record of working directly with equipment operators to achieve minimal soil displacement or other soil impacts historically associated with this practice. Rust, 2012 found machine pile and burning overall effects on the soil were minimal due to clean piles that lacked displaced soil. Fall burning consumed most of the slash, and had minimal loss of soil organic matter and topsoil. Soil heating was 2 to 4 inches deep, and had high levels of both soil organic matter and roots. There wasonlylow to moderate levels of compaction identified during monitoring.
The areal extent of tractor piling is limited to slash concentrations and the equipment will operate over existing slash which reduces the degree of impact to the forest floor. Some soil displacement may occur associated with equipment operations but this too should be limited in extent due to flat topography and the spatially patch distribution of activity generated slash. The fuel prescription requires approximately four tons of slash in the unit (see fuels specialist report). The remaining slash will provide for soil cover, erosion control, and provides a source of nutrient supply over time. The five tons of slash is in addition to duff and smaller surface organics that would remain in the unit (Soil Design Features: S-2, S-4).
Harris Vegetation Management Soils Report – January 2014
Shasta-Trinity National Forest 19
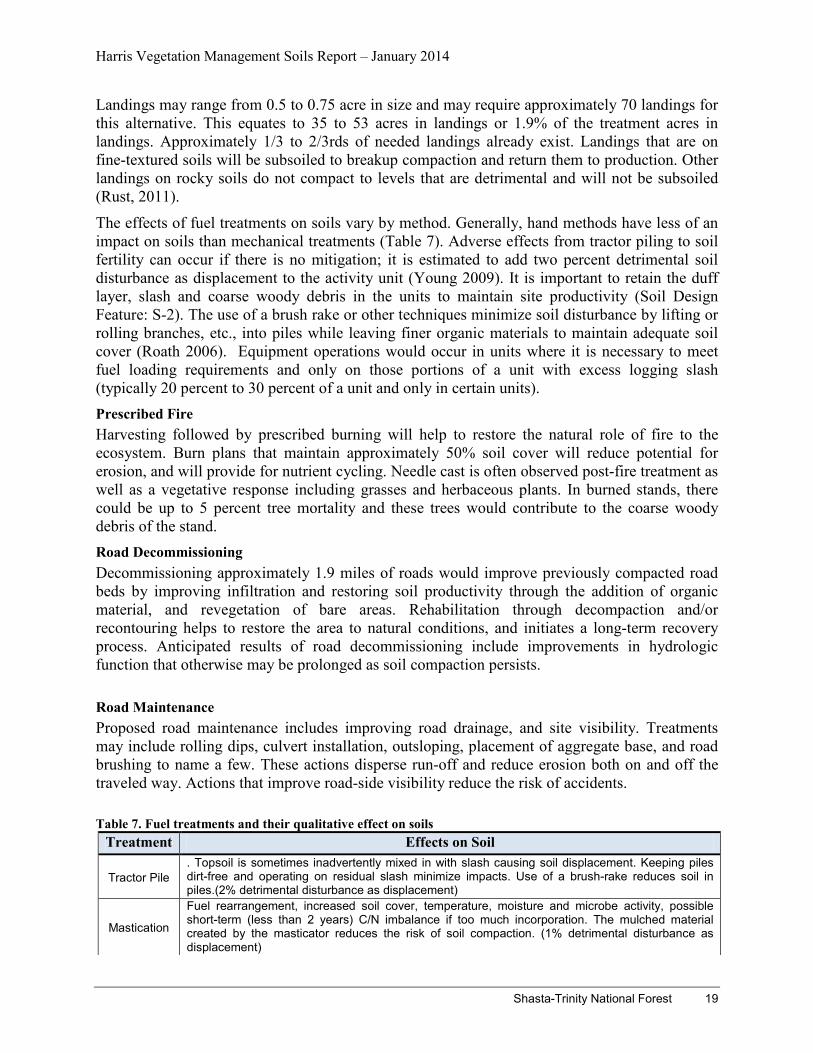
Landings may range from 0.5 to 0.75 acre in size and may require approximately 70 landings for this alternative. This equates to 35 to 53 acres in landings or 1.9% of the treatment acres in landings. Approximately 1/3 to 2/3rds of needed landings already exist. Landings that are on fine-textured soils will be subsoiled to breakup compaction and return them to production. Other landings on rocky soils do not compact to levels that are detrimental and will not be subsoiled (Rust, 2011).
The effects of fuel treatments on soils vary by method. Generally, hand methods have less of an impact on soils than mechanical treatments (Table 7). Adverse effects from tractor piling to soil fertility can occur if there is no mitigation; it is estimated to add two percent detrimental soil disturbance as displacement to the activity unit (Young 2009). It is important to retain the duff layer, slash and coarse woody debris in the units to maintain site productivity (Soil Design Feature: S-2). The use of a brush rake or other techniques minimize soil disturbance by lifting or rolling branches, etc., into piles while leaving finer organic materials to maintain adequate soil cover (Roath 2006). Equipment operations would occur in units where it is necessary to meet fuel loading requirements and only on those portions of a unit with excess logging slash (typically 20 percent to 30 percent of a unit and only in certain units). Prescribed Fire Harvesting followed by prescribed burning will help to restore the natural role of fire to the ecosystem. Burn plans that maintain approximately 50% soil cover will reduce potential for erosion, and will provide for nutrient cycling. Needle cast is often observed post-fire treatment as well as a vegetative response including grasses and herbaceous plants. In burned stands, there could be up to 5 percent tree mortality and these trees would contribute to the coarse woody debris of the stand. Road Decommissioning Decommissioning approximately 1.9 miles of roads would improve previously compacted road beds by improving infiltration and restoring soil productivity through the addition of organic material, and revegetation of bare areas. Rehabilitation through decompaction and/or recontouring helps to restore the area to natural conditions, and initiates a long-term recovery process. Anticipated results of road decommissioning include improvements in hydrologic function that otherwise may be prolonged as soil compaction persists. Road Maintenance Proposed road maintenance includes improving road drainage, and site visibility. Treatments may include rolling dips, culvert installation, outsloping, placement of aggregate base, and road brushing to name a few. These actions disperse run-off and reduce erosion both on and off the traveled way. Actions that improve road-side visibility reduce the risk of accidents.
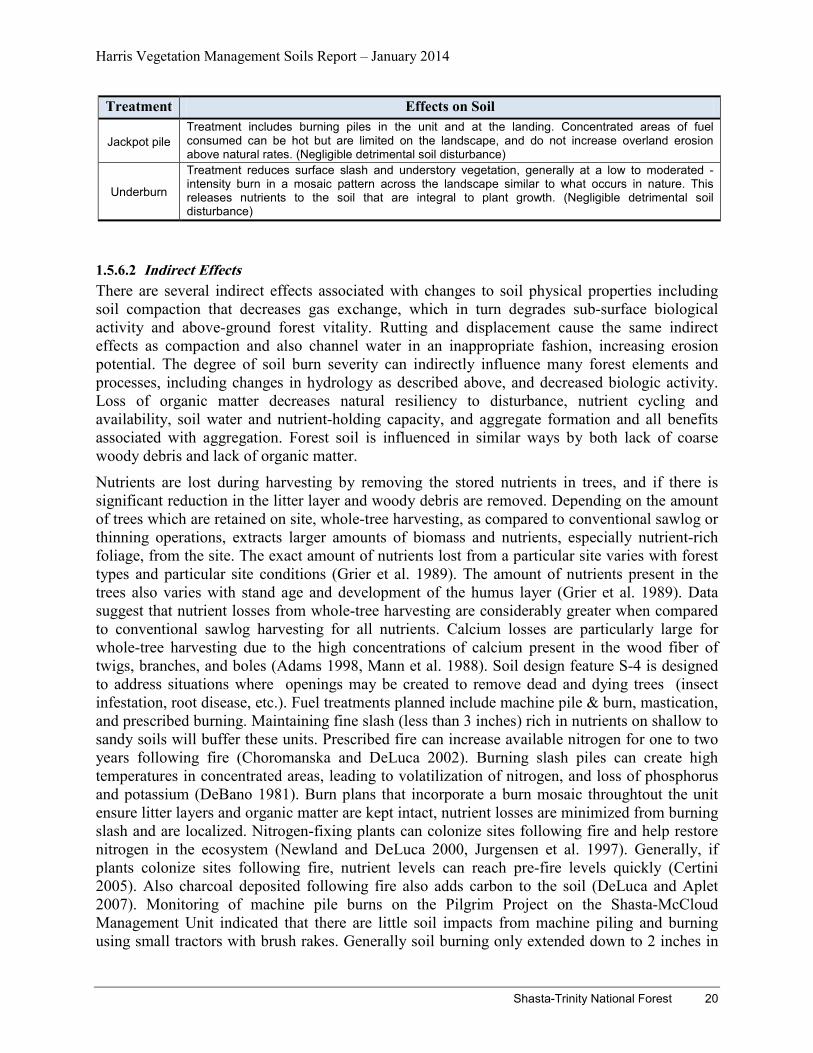
Table 7. Fuel treatments and their qualitative effect on soils Treatment Effects on Soil
Tractor Pile . Topsoil is sometimes inadvertently mixed in with slash causing soil displacement. Keeping piles dirt-free and operating on residual slash minimize impacts. Use of a brush-rake reduces soil in piles.(2% detrimental disturbance as displacement)
Mastication
Fuel rearrangement, increased soil cover, temperature, moisture and microbe activity, possible short-term (less than 2 years) C/N imbalance if too much incorporation. The mulched material created by the masticator reduces the risk of soil compaction. (1% detrimental disturbance as displacement)
Harris Vegetation Management Soils Report – January 2014
Shasta-Trinity National Forest 20
Treatment Effects on Soil
Jackpot pile Treatment includes burning piles in the unit and at the landing. Concentrated areas of fuel consumed can be hot but are limited on the landscape, and do not increase overland erosion above natural rates. (Negligible detrimental soil disturbance)
Underburn
Treatment reduces surface slash and understory vegetation, generally at a low to moderated -intensity burn in a mosaic pattern across the landscape similar to what occurs in nature. This releases nutrients to the soil that are integral to plant growth. (Negligible detrimental soil disturbance)
1.5.6.2 Indirect Effects There are several indirect effects associated with changes to soil physical properties including soil compaction that decreases gas exchange, which in turn degrades sub-surface biological activity and above-ground forest vitality. Rutting and displacement cause the same indirect effects as compaction and also channel water in an inappropriate fashion, increasing erosion potential. The degree of soil burn severity can indirectly influence many forest elements and processes, including changes in hydrology as described above, and decreased biologic activity. Loss of organic matter decreases natural resiliency to disturbance, nutrient cycling and availability, soil water and nutrient-holding capacity, and aggregate formation and all benefits associated with aggregation. Forest soil is influenced in similar ways by both lack of coarse woody debris and lack of organic matter.
Nutrients are lost during harvesting by removing the stored nutrients in trees, and if there is significant reduction in the litter layer and woody debris are removed. Depending on the amount of trees which are retained on site, whole-tree harvesting, as compared to conventional sawlog or thinning operations, extracts larger amounts of biomass and nutrients, especially nutrient-rich foliage, from the site. The exact amount of nutrients lost from a particular site varies with forest types and particular site conditions (Grier et al. 1989). The amount of nutrients present in the trees also varies with stand age and development of the humus layer (Grier et al. 1989). Data suggest that nutrient losses from whole-tree harvesting are considerably greater when compared to conventional sawlog harvesting for all nutrients. Calcium losses are particularly large for whole-tree harvesting due to the high concentrations of calcium present in the wood fiber of twigs, branches, and boles (Adams 1998, Mann et al. 1988). Soil design feature S-4 is designed to address situations where openings may be created to remove dead and dying trees (insect infestation, root disease, etc.). Fuel treatments planned include machine pile & burn, mastication, and prescribed burning. Maintaining fine slash (less than 3 inches) rich in nutrients on shallow to sandy soils will buffer these units. Prescribed fire can increase available nitrogen for one to two years following fire (Choromanska and DeLuca 2002). Burning slash piles can create high temperatures in concentrated areas, leading to volatilization of nitrogen, and loss of phosphorus and potassium (DeBano 1981). Burn plans that incorporate a burn mosaic throughtout the unit ensure litter layers and organic matter are kept intact, nutrient losses are minimized from burning slash and are localized. Nitrogen-fixing plants can colonize sites following fire and help restore nitrogen in the ecosystem (Newland and DeLuca 2000, Jurgensen et al. 1997). Generally, if plants colonize sites following fire, nutrient levels can reach pre-fire levels quickly (Certini 2005). Also charcoal deposited following fire also adds carbon to the soil (DeLuca and Aplet 2007). Monitoring of machine pile burns on the Pilgrim Project on the Shasta-McCloud Management Unit indicated that there are little soil impacts from machine piling and burning using small tractors with brush rakes. Generally soil burning only extended down to 2 inches in
Harris Vegetation Management Soils Report – January 2014
Shasta-Trinity National Forest 21
hot burned areas and for the rest of the piles it was 1 inch or less. Soil displacement was minimal along with soil compaction (Rust 2012).
Indirect effects of soil nutrient loss on forest vegetation include reduced growth and yield and increased susceptibility to pathogens, such as root disease (Garrison and Moore 1998, Garrison-Johnston 2003) and insect infestation (Garrison-Johnston et al. 2003 and 2004). Precipitation (Stark 1979) and weathering of rocks would continue to make additional nutrients available on site. Annual needle, leaf, and twig fall, forbs, and shrub mortality would continue to recycle nutrients as well.
To prevent root disease, Sporax would be applied to cut stumps (RD-1), which should result in a slight reduction in soil biotic activity in small areas. However, research has shown that it should not contribute a significant amount of boron to the soil. Amounts applied to stumps are generally small and are confined to a small area (USDA Forest Service 2006).
To summarize: maintaining soil organic matter in the upper 12 inches of soil on at least 85 percent of the site by limiting detrimental disturbance to 15 percent or less of the unit area should not alter nutrient cycling and availability, and should maintain soil productivity. The project design features prescribed above and shown in chapter 2 of the FEIS would meet or exceed Forest Plan soil quality standards (the established standard for protecting soil resources) and would not have a significant impact to soils. 1.5.6.3 Cumulative Effects Cumulative effects include a discussion of the combined, incremental effects of human activities. For activities to be considered cumulative their effects need to overlap in both time and space with those of the proposed actions. For the soil resource, the area for consideration is the unit because effects on soils are site specific. Fire and Fire Suppression Active fire suppression has protected much of the Harris area over the past decades but has resulted in increased fuel loading. The proposed harvest and subsequent treatments including machine piling, mastication and under burning would improve overall forest health and resilience. Treatments that reduce both current levels of infected dead and dying trees and overstocked stands would help to reduce the risk of fire. Fuel model 9 accounts for a large part of the project area and is characterized by closed canopy conifer stands with densely stocked pole size trees in the understory. Typically, these stands contain pockets of dead and down woody fuels. These fuels create high fire intensities during ground fires that can cause adverse impacts to the soil resource. Fires with lower intensity and severity would reduce the potential for excessive soil heating and sterilization as well as hydrophobic conditions that tend to increase sediment movement, flooding, and possible slope instability (DeDios Benavides-Soloria and McDonald 2005, Neary et al. 2005).The proposed risk reduction treatments will help restore. Grazing There are two vacant allotments that overlap with the Harris Vegetation Management Project Area; the Toad Mountain allotment and the McCloud/Hambone Allotment. Climate Change The climate in Northern California is predicted to change in the near future. Increases in temperature are likely and a change in precipitation is predicted as well but there is no clear trend on precipitation changes (CEC 2006). What changes will actually occur and how these changes
Harris Vegetation Management Soils Report – January 2014
Shasta-Trinity National Forest 22
will affect the soil resource are still unknown. Increased precipitation could lead to increased erosion from rainfall (Nearing et al. 2004), but this is unlikely in the Harris Vegetation Management Project area because of slopes and lack of water. Increased precipitation could also lead to higher soil moisture levels and increased productivity (Nearing et al. 2004). Increased temperature will increase soil respiration which will decrease carbon levels in the soil and increase CO2 released into the atmosphere along with increased decomposition rate (Safford, 2011). Also predicted is a shift in species composition which could affect the soil resource (CEC 2006). Changes in species could affect litter and duff layers, nutrient cycling and soil productivity.
There are insignificant cumulative effects to soils from global warming in the project area if soils project design features are implemented.
Cumulative effects of Ongoing and Reasonably Foreseeable Activities: The following known ongoing and foreseeable activities in the area may overlap in space with the current proposed activities but would not appreciably contribute to adverse soil impacts. The Harris Project cumulative effects worksheet was developed by ID Team inputs. The worksheet is filed in the project record and summarized in Appendix F.
• Road maintenance • Firewood cutting • Mushroom picking • Dispersed recreation, including: driving for pleasure, snowmobiling, camping and hunting. • Fire suppression • Noxious weed control: monitoring of noxious weeds, prevention and control measures (hand
methods, no herbicides). • Remaining underburning in portions of the Betty Davis units of Davis NEPA.
There are no private lands within the project boundary. All lands within the project boundary are National Forest System lands.
Alternative 2 1.5.71.5.7.1 Direct Effects Direct effects for alternative 2 would be similar to those of alternative 1, but alternative 2 treats fewer total acres (2,617 acres versus 2,772 acres in alternative 1). This alternative would retain more cover in the Harris Mountain LSR and would not have hazard reduction treatments occurring in the LSR area. Retaining canopy cover in these areas would have less impact on nutrient cycling and increase the soil resiliency of these sites to disturbance. 1.5.7.2 Indirect Effects Indirect effects would be similar to those of alternative 1. 1.5.7.3 Cumulative Effects This alternative would have the same cumulative effects in units outside of the LSR as alternative 1.
Alternative 3 1.5.81.5.8.1 Direct Effects The total acreage proposed for treatment in alternative 3 is less than alternative 1 (2,274 acres versus 2,772 acres in alternative 1). Additionally no stands would be cut with less than 60 percent canopy cover, no hazard reduction treatments would occur, and no fuel reduction
Harris Vegetation Management Soils Report – January 2014
Shasta-Trinity National Forest 23
activities would take place (machine pile and burn or mastication). No treatment would take place in units 20, 21, 22, 26, 27, 33, 34, 54, 56, 180, 181, 189, 192, 194, 196, 197, 199 and 223; therefore, no direct effects would occur in these units. Units 36, 41, 174, 183, 185, and 193 would only be underburned in this alternative and burning effects would be the only effects on these units. Currently units 42 and 200 are over 15 percent detrimental soil disturbance.
Alternative 3 would have the least impact on soil productivity of all of the action alternatives. 1.5.8.2 Indirect Effects Indirect effects would be less than those of alternative 1. 1.5.8.3 Cumulative Effects Cumulative effects would be less than alternative 1 especially in the units listed above that would not have treatment in this alternative.
Alternative 4a 1.5.91.5.9.1 Direct Effects Direct effects would be similar to those in alternative 1 except that the units proposed for masticated treatments only (Units 1, 2, 3, 4, 5, 6, 7, 8, 9, 10, 11, 12, 13, and 14) would also be underburned to release remaining scatted timber. Mastication would increase the amount of woody debris left on the soil surface and some of the debris would be incorporated into the soil. There would be a short term decrease in nutrient availability, slight increase in compaction, and disturbance would increase where machines are driven.
Operating on dry soils where soils are fine-textured during mastication operations reduces the risk of compacting the soils across all slopes. Monitoring (Rust 2009a) shows that even with high soil moisture, compaction from low pressure mastication (less than 6 psi) was below the threshold value on slopes up to 35 percent. When the soils were moist and slopes exceeded 35 percent then detrimental compaction occurred. No units in the Harris Vegetation Management Project area have slopes greater than 35 percent. Burning at low severity will create a mosaic pattern leaving patches of duff and release short-term nutrients. Mastication of brush will provide additional cover along with litter-fall from scattered trees. 1.5.9.2 Indirect Effects Indirect effects would be similar to those of alternative 1 and have marginal impacts. 1.5.9.3 Cumulative Effects Cumulative effects would be similar to alternative 1 as well and little cumulative effects will be realized by implementing the soil protection measures listed in Table 6.
Alternative 4b 1.5.101.5.10.1 Direct Effects Direct effects would be similar to those in alternative 1 except that there will be increased under-burning with this proposal and mastication and slightly fewer acres treated (e.g. due to adjustments to protect sensitive resources) (2,719 acres versus 2,772 acres in alternative 1). Prescribed fire has been an effective tool in restoring fire to the landscape and improving vegetative cover. Use of existing roads and trails as fire controls lines will eliminate additional soil disturbance from fire line construction. Several units proposed for acceleration of late successional characteristics thinning will be changed to hazard and risk reduction treatments to treat trees that show evidence of western gall rust, dwarf mistletoe, or evidence of bark beetle
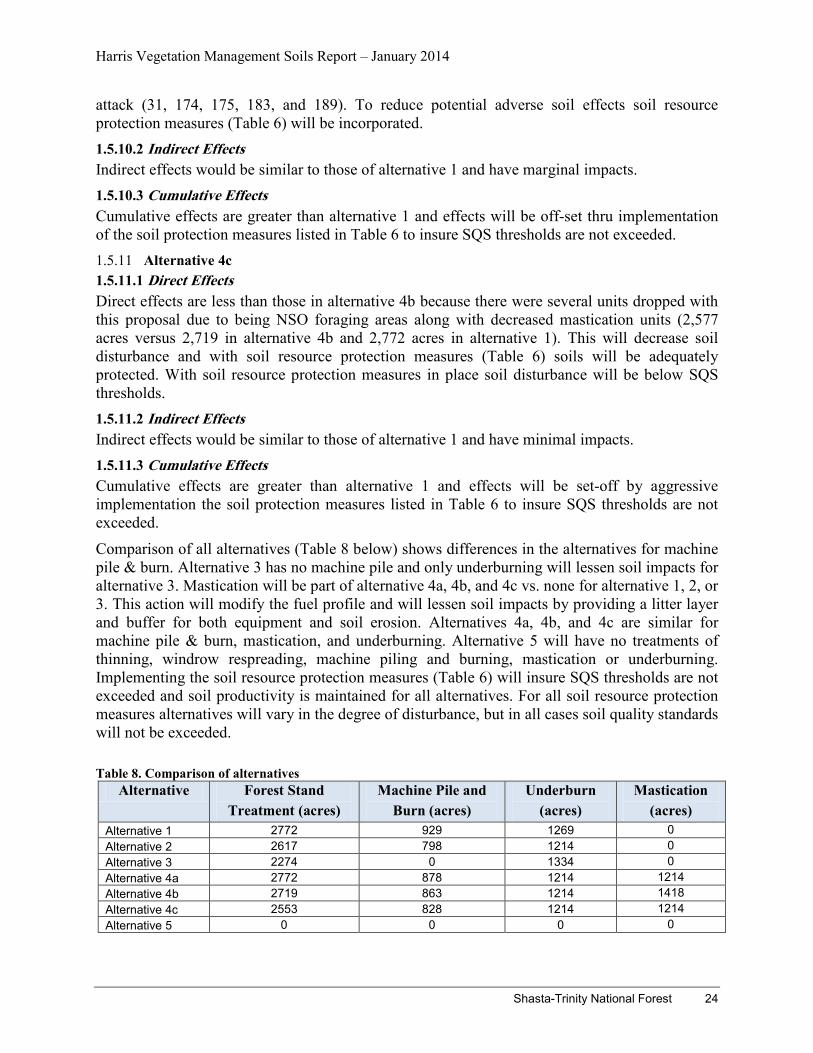
Harris Vegetation Management Soils Report – January 2014
Shasta-Trinity National Forest 24
attack (31, 174, 175, 183, and 189). To reduce potential adverse soil effects soil resource protection measures (Table 6) will be incorporated. 1.5.10.2 Indirect Effects Indirect effects would be similar to those of alternative 1 and have marginal impacts. 1.5.10.3 Cumulative Effects Cumulative effects are greater than alternative 1 and effects will be off-set thru implementation of the soil protection measures listed in Table 6 to insure SQS thresholds are not exceeded.
Alternative 4c 1.5.111.5.11.1 Direct Effects Direct effects are less than those in alternative 4b because there were several units dropped with this proposal due to being NSO foraging areas along with decreased mastication units (2,577 acres versus 2,719 in alternative 4b and 2,772 acres in alternative 1). This will decrease soil disturbance and with soil resource protection measures (Table 6) soils will be adequately protected. With soil resource protection measures in place soil disturbance will be below SQS thresholds. 1.5.11.2 Indirect Effects Indirect effects would be similar to those of alternative 1 and have minimal impacts. 1.5.11.3 Cumulative Effects Cumulative effects are greater than alternative 1 and effects will be set-off by aggressive implementation the soil protection measures listed in Table 6 to insure SQS thresholds are not exceeded.
Comparison of all alternatives (Table 8 below) shows differences in the alternatives for machine pile & burn. Alternative 3 has no machine pile and only underburning will lessen soil impacts for alternative 3. Mastication will be part of alternative 4a, 4b, and 4c vs. none for alternative 1, 2, or 3. This action will modify the fuel profile and will lessen soil impacts by providing a litter layer and buffer for both equipment and soil erosion. Alternatives 4a, 4b, and 4c are similar for machine pile & burn, mastication, and underburning. Alternative 5 will have no treatments of thinning, windrow respreading, machine piling and burning, mastication or underburning. Implementing the soil resource protection measures (Table 6) will insure SQS thresholds are not exceeded and soil productivity is maintained for all alternatives. For all soil resource protection measures alternatives will vary in the degree of disturbance, but in all cases soil quality standards will not be exceeded.
Table 8. Comparison of alternatives Alternative Forest Stand
Treatment (acres) Machine Pile and
Burn (acres) Underburn
(acres) Mastication
(acres) Alternative 1 2772 929 1269 0 Alternative 2 2617 798 1214 0 Alternative 3 2274 0 1334 0 Alternative 4a 2772 878 1214 1214 Alternative 4b 2719 863 1214 1418 Alternative 4c 2553 828 1214 1214 Alternative 5 0 0 0 0
Harris Vegetation Management Soils Report – January 2014
Shasta-Trinity National Forest 25
Alternative 5 – No Action 1.5.121.5.12.1 Direct Effects and Indirect Effects Under the no-action alternative, no commercial timber harvest or fuel reduction treatments would be implemented to accomplish project goals. There would be no new disturbance resulting from forest management activities, and existing disturbance would persist. No new addition of detrimental compaction would occur and old skid trails would continue to recover at natural rates. Freeze-thaw processes, weathering, and soil biota would work to slowly break up compaction over time and vegetation would continue to re-establish on the existing infrastructure of trails as their roots become able to penetrate growth-limiting layers of old compaction. No new adverse effects would likely result from this action but in some locations productivity potential in the short term may not be as high under this alternative as compared to the action alternatives because historic disturbance would not be alleviated. Hydrologic function, such as soil drainage, would be maintained at existing rates.
Under the no-action alternative, the forest canopy would not be altered and organic material covering the soil would not be disturbed by management. Soil cover standards would likely continue to be met and the litter/duff layer would likely continue to thicken and increase in continuity. Coarse woody debris levels would also likely continue to increase. As a result, erosion hazards would likely remain low and soil nutrient cycles would be maintained.
Under the no-action alternative, the four units with windrowed soils would remain in its current condition and no restoration of soil productivity would occur.
The probability of a high-severity fire within the project area during a given timeframe is unpredictable. However, when a fire breaks out, the chances for high-severity fire effects on soils can be much higher in untreated areas with excessively heavy fuel loads compared to those that have been treated, including post-harvest logging slash (Certini 2005, Cram et al. 2006, Graham et al. 2004, Gorman 2003, Keane et al. 2002).
Vegetation and fuel treatments would reduce the chance that a wildfire could have as severe an effect on the soils and surrounding private property in treated areas as it could in untreated areas because there would be fewer tons per acre of dead and dying fuels on treated sites.
A high-intensity wildfire would increase the potential for impacts to soils and soil productivity in severely burned areas, especially since the risk of soil erosion increases proportionally with fire intensity (Megahan 1990). Other effects would include the potential loss of organics, loss of nutrients, and reduced water infiltration (Wells et al. 1979). Fires that create very high soil surface temperatures, particularly when soil moisture content is low, almost completely destroy soil microbial populations, woody debris, and the protective duff and litter layer over mineral soil (Hungerford 1991, Neary et al. 2005). Nutrients stored in the organic layer (such as potassium and nitrogen) can also be lost or reduced through volatilization and as fly ash (DeBano 1991, Amaranthus et. al. 1989). Fire-induced soil hydrophobicity is presumed to be a primary cause of the observed post-fire increases in runoff and erosion from forested watersheds (Huffman et al. 2001). Though hydrophobicity is a naturally occurring phenomenon that can be found on the mineral soil surface, it is greatly amplified by increased burn severity (Doerr et al. 2000, Huffman et al. 2001, Neary et al. 2005).
Harris Vegetation Management Soils Report – January 2014
Shasta-Trinity National Forest 26
Soil hydrophobicity usually returns to pre-burn conditions in no more than six years (DeBano 1981). Dyrness (1976) and other studies have documented a much more rapid recovery of one to three years (Huffman et al. 2001). The persistence of a hydrophobic layer depends on the strength and extent of hydrophobic chemicals after burning and the many physical and biological factors that can aid in breakdown (DeBano 1981). This variability means that post-fire impacts on watershed conditions are difficult to predict and to quantify. 1.5.12.2 Cumulative Effects and Summary Not treating the project area could result in unknown effects on productivity in the future in the event of a wildfire. However, due to a lack of direct and indirect effects as a result of this alternative, no cumulative effects are anticipated at this time. Because of the lack of adverse effects, the forest is likely to continue meeting, or make progress toward Forest Plan standards. By meeting soil quality standards, it is expected that desired conditions pertaining to the soil resource would be achieved. 1.6 SUMMARY The desired soil condition is to maintain long term soil productivity. All of the alternatives will meet Forest Land and Resource Management Plan standards for soil. Overall soil risk ratings for the project area are low given the inherent soil physical, chemical, and biological properties. Existing conditions indicate two units (42, 200) with high levels of disturbance but not detrimental levels. Soil resource protection measures will help to reduce adverse impacts to soil physical, chemical and biological properties that could be directly or indirectly affected. The degree of potential soil effects is ameliorated through these resource protection measures. Comparison of the action alternatives indicate alternative 3 would have the least impacts on soils based on acres treated and the remaining alternatives will have the potential for more disturbance due to the duration and distribution of disturbance.
To address the cumulative effects, a conservative approach was taken to maintain or reduce existing levels of disturbance. Reusing old skid trails, logging during winter conditions (snow or frozen ground) or on dry soils, and avoiding re-entry into areas of concern would avoid new detrimental disturbance and adverse cumulative effects. Reclamation would focus on major skid trails and landings, especially in units with high amounts of old harvest routes that have resulted in relatively high levels of compaction. Less-traveled trails would be excluded since they are not expected to have detrimental levels of compaction. Where compaction exists in both extent and duration, sub-soiling should effectively relieve most of the compaction. Recommended sub-soiling would be 18 inches deep and only occur on high traffic skid trails and on landings, where the great majority of detrimental compaction occurs. Visits to previously sub-soiled locations on the Forest revealed the importance of re-establishing vegetation on reclaimed sites in order to help recovery of the soil. Where skid trails would be sub-soiled there should be an adequate overstory that would encourage trees to seed in post-harvest. Where only low to moderate compaction exists, leaving soils intact is more desirable. The net effect is that the proposed management alternatives should not increase the degree of compaction such that soil productivity would be adversely affected.
Overall, the intensity of harvesting and fuel reduction activities would minimize any cumulative effects on soil cover or nutrient cycling. The use of existing skid trails and landings minimizes cumulative effects to these previously disturbed acres. As a result, cover and organic matter standards would be met. Soil protection standards and natural processes should provide for
Harris Vegetation Management Soils Report – January 2014
Shasta-Trinity National Forest 27
coarse woody debris within the project area. The dynamic and highly variable nature of soil ecosystem processes and its strong buffering capacity minimize the risk of having measurable, negative, or long-term cumulative effects on soil productivity.
The area has a high level of productivity and recovery potential. The indications are that the site has a very high growth potential based on the field observations. The site potential, together with other soil indicators being met, leads to the conclusion that the sites have a very high resiliency to soil disturbance, low soil risk rating, and it is not expected that soil productivity would be adversely affected. 1.7 COMPLIANCE WITH THE FOREST PLAN AND OTHER REGULATORY DIRECTION By implementing the soil resource protection measures, BMPs and any other mitigation measures, the proposed activities will comply with the Forest Plan direction. Impacts to soil productivity will stay below thresholds and will therefore meet NFMA.
See the regulatory compliance section (page 1) at the beginning of this report for more details.
Harris Vegetation Management Soils Report – January 2014
Shasta-Trinity National Forest 28
1.8 REFERENCES Adams, M.B. 1999. Acidic deposition and sustainable forest management in the central
Appalachians, USA. Forest Ecology and Management 122: 17-28.
Amaranthus, M. P.; J. M. Trappe and R. J. Molina. 1989. Long-term forest productivity and the living soil. In: Maintaining the long-term productivity of Pacific northwest forest ecosystems. D. A. Perry, ed: 36 and 48.
Blanchette, R.A. 1995. Degradation of the lignocellulose complex in wood. Can. J. Bot. 73 (Suppl. 1): S999-S1010.
CEC 2006. Our changing climate: assessing the risks to California. CEC-500-2006-077. 16p.
Certini, G. 2005. Effects of fire on properties of forest soils: a review. Oecologia 143:1-10.
Choromanska, U. and T.H. DeLuca. 2002. Microbial activity and nitrogen mineralization in forest mineral soils following heating: evaluation of post-fire effects. Soil Biology and Biochemistry 34: 263-271.
Cram, D., T. Baker, and J. Boren. 2006. Wildland fire effects in silviculturally treated vs. untreated stands of New Mexico and Arizona. Research Paper RMRS-RP-55. Fort Collins, CO: U.S. Department of Agriculture, Forest Service, Rocky Mountain Research Station. 28 p.
D’Anotonio, C. M. and P. M. Vitousek. 1992. Biological invasions of exotic grasses, the grass/fire cycle, and global change. Annual Review of Ecology and Systematics 23: 63-87.
de Dios Benavides-Soloria, J., and L.H. MacDonald. 2005. Measurement and prediction of post-fire erosion at the hillslope scale, Colorado Front Range. Int. J. of Wildland Fire 14:457-474.
DeBano, L. F. 1991. The effect of fire on soil properties. In: Proceedings—Management and Productivity of Western Montane Forest Soils. Harvey, A. and L. Neuenschwander, compilers. Gen. Tech. Rep. INT-280. USDA, Forest Service, Intermountain Research Station. pp. 151-155.
DeBano, L.F. 1981. Water repellant soils: a state-of-the-art. Gen. Tech. Rep. PSW-46, Pacific Southwest Forest and Range Exp. Stn., USDA Forest Service, Berkeley, CA. 21 pp.
DeLuca, T. and G.H. Aplet. 2008. Charcoal and carbon storage in forest soils of the Rocky Mountain West. Fron. Ecol. Environ. 6: 18-24.
Doerr S.H., R.A. Shakesby, and R.P.D. Walsh. 2000. Soil water repellency: its causes, characteristics, and hydro-geomorphological significance. Earth-Sci. Rev. 51:33-65.
Dyrness C.T. 1976. Effect of wildfire on soil wettability in the high Cascades of Oregon. Res. Pap. PNW-202. 18 pp.
Foss, J. 2010. Moosehead Vegetation Management and Roads EIS: Soil Resource Report. Shasta-Trinity National Forest. Draft.
Harris Vegetation Management Soils Report – January 2014
Shasta-Trinity National Forest 29
Garrison, M. T. and J. A. Moore. 1998. Nutrient management: a summary and review. In: Intermountain Forest Tree Nutrition Garrison-Johnston, M. T., J. A. Moore and G. J. Niehoff. 2001. Cooperative Supplemental Report 98: 5.
Garrison-Johnston, M. 2003. Geologic controls on tree nutrition and forest health in the Inland Northwest. Presented at GSA Ann. Mtng, Seattle, WA. 9 pp.
Garrison-Johnston, M., T.M. Shaw, L.R. Johnson, and P.G. Mika. 2004. Intermountain Forest Tree Nutrition Cooperative, Presentation at the Potassium Meeting, IPNF, Coeur d’Alene, ID, April 23.
Gomez, A., RF Powers, MJ Singer, WR Horwath. 2002. Soil Compaction Effects on Growth of Young Ponderosa Pine Following Litter Removal in California's Sierra Nevada. Soil Sci. Soc. Am. J. 66: 1339
Gorman, J. 2003. How a forest stopped a fire in its tracks. New York Times article, July 22, 2003
Grier, C.C., K.M. Lee, N.M. Nadkarni, G.O. Klock, and P.J. Edgerton. 1989. Productivity of forest of the United States and its relation to soil and site factors and management practices: A review. PNW-GTR-222. United Stated Department of Agriculture, Forest Service, Pacific Northwest Research Station, Portland, Oregon.
Harrington, T.B., Slesak, R.A., Schoenholtz, S.H. 2013. Variation in logging debris cover influences competitor abundance, resource availability, and early growth of planted Douglas-fir. Forest Ecology and Management 296 (2013) 41-52 pp.
Harvey, A.E., M.J. Larsen, and M.F. Jurgensen 1981. Rate of woody residue incorporation into Northern Rocky Mountain forest soils. USDA, Forest Service, Intermountain Forest and Range Experiment Station, Research Paper INT-282.
Harvey, A.E., M.J. Larsen, and M.F. Jurgensen and R.T. Graham. 1987. Decaying organic materials and soil quality in the Inland Northwest: A management opportunity. USDA, Forest Service, Intermountain Research Station, General Technical Report, INT-225Howes, S.W. 2000. Proposed Soil Resource Condition Assessment. Wallowa-Whitman National Forest. Baker City, OR. 9p.
Huffmann, E.L., L.H. MacDonald, and J.D. Stednick. 2001. Strength and persistence of fire-induced soil hydrophobicity under ponderosa and lodgepole pine, Colorado Front Range. Hydrol. Process. 15: 2877-2892. 5
Hungerford, R.D., M.G. Harrington, W.H. Frandsen, K.C. Ryan, and G.J. Niehoff. 1991. Influence of fire on factors that affect site productivity. In: Proceedings – Mgtmt. And productivity of western montane forest soils. USDA FS Gen. Tech. Rep. INT-280. p. 32-50.
Jurgensen, M.F., A.E. Harvey, R.T. Graham, D.S. Page-Dumrose, J.R. Tonn, M.J. Larson, and T.B. Jain. 1997. Impacts of timber harvests on soil organic matter, nitrogen, productivity and health of inland northwest forests. Forest Science 43: 234-251.
Keane, R.E., K.C. Ryan, T.T. Veblen, and others. 2002. Cascading effects of fire exclusion in the Rocky Mountain ecosystems: a literature review. General Technical Report. RMRSGTR-91. Fort Collins, CO: U.S. Dept. of Agr., Forest Service, Rocky Mountain Research Station. 24 p.
Harris Vegetation Management Soils Report – January 2014
Shasta-Trinity National Forest 30
Klock, G.O. 1975. Impact of five post-fire salvage logging systems on soils and vegetation. J. Soil & Water Cons. Vol. 30(2):78-81.
Lanspa, Kenneth. 1994. Soil Survey of Shasta-Trinity National Forest Area, California. USDA Forest Service.
Laurent, Tom. 2007. Soils Report: Little Doe/Low Gulch Timber Sale. Six Rivers National Forest.
Mann, L.K., D.W. Johnson, D.C. West, D.W. Cole, J.W. Hornbeck, C.W. Martin, H. Riekerk, C.T. Smith, W.T. Swank, L.M. Tritton, and D.H. Van Lear. 1988. Effects of whole-tree and stem-only clearcutting on postharvest hydrologic losses, nutrient capital, and regrowth. Forest Science 34: 412-428.
McIver, J., S. Stephens, J. Agee, J.Barbour, R.Boerner, C.Edminster, K.Erickson, K.Farris, C. Fettig, C. Fiedler, S. Hase, S.Hart, J. Keeley, E.Knapp, J. Lehmkuhl, J. Moghaddas, W.Otrosina, K. Outcalt, D. Schwilk, P. Shea, C.Skinner, T. Waldrop, P. Weatherspoon, D. Yaussy, A.Youngblood, and S. Zack. Ecological effects of alternative fuel reduction treatments: highlights of the U.S. Fire and Fire Surrogate study (FFS). International Journal of Wildland Fire. 2012
Megahan, W.F. 1990. Erosion and site productivity in western-Montana forest ecosystems. In: Proceedings, Management and Productivity of Western-Montana Forest Soils. Gen. Tech. Rep. INT-280. USDA, Forest Service, Intermountain Research Station. pp. 146-150.
Nearing, M.A., F.F. Pruski and M. R. O’Neal. 2004. Expected climate change impacts on soil erosion rates: a review (conservation implications of climate change). Journal of Soil and Water Conservation 59: 43-50.
Neary, D.G., K.C. Ryan, and L.F. DeBano, eds. 2005. Wildland fire in ecosystems: effects of fire on soils and water. Gen. Tech. Rep. RMRS-GTR-42-vol.4. Ogden, UT: U.S. Department of Agriculture, Forest Service, Rocky Mountain Research Station. 250 p.
Newland, J.A., and T.H. DeLuca. 2000. Influence of fire on native nitrogen-fixing plants and soil nitrogen status in ponderosa pine-Douglas fir forests in western Montana. Canadian Journal of Forest Research 30:274-282.
Okinarian, M. 1996. Biological soil amelioration as the basis for sustainable agriculture and forestry. Biol. Fertil. Soils. 22: 342-344.
Page-Dumroese, D, S. Deborah, A.A. Abbott, and T.M. Rice. 2009. Forest soil disturbance monitoring protocol: Volume 1: Rapid assessment. WO-GTR-82a. Washington D.C. U.S. Department of Agriculture, Forest Service. 31 p.
Rust, Brad. 2008. Effects of tractor harvest on Shasta-Trinity soils. Personal communication. Located in the project file
Rust, Brad. 2009a. Lakehead Mastication Project Soil Compaction Results. Internal monitoring report.
Rust, Brad. 2009b. Personal communication (between Jacqueline Foss and Brad Rust) for recovery rates of soils in Moosehead project area.
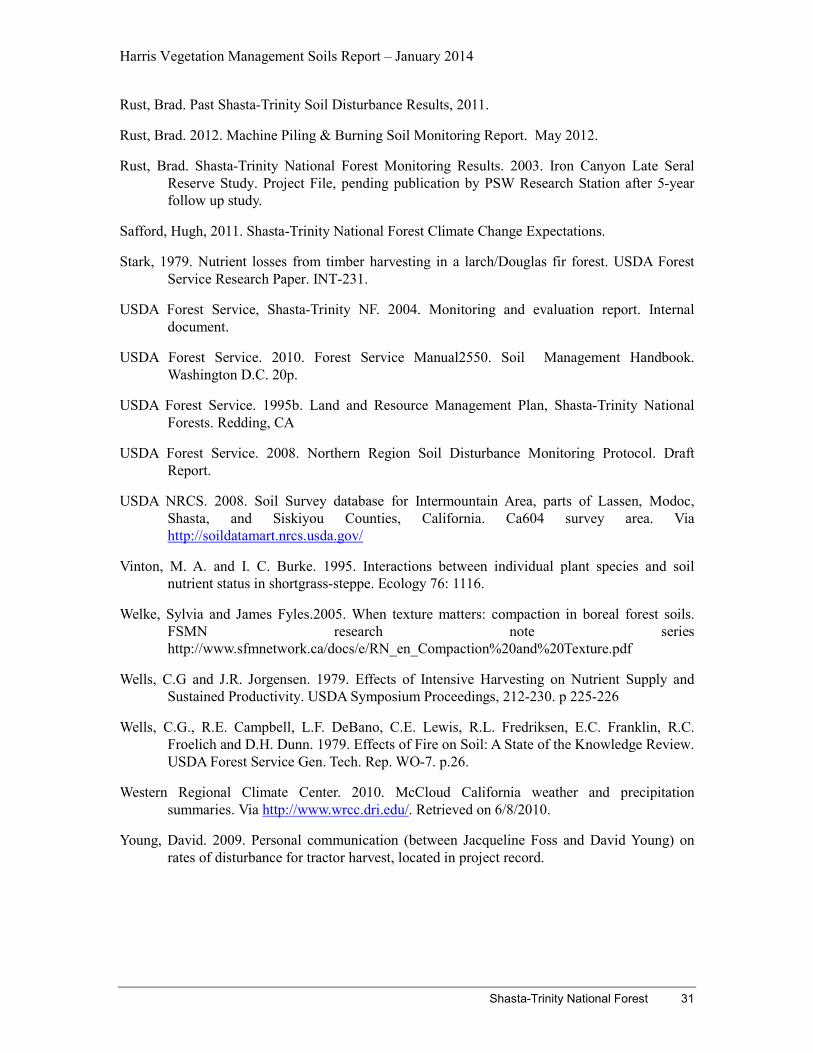
Harris Vegetation Management Soils Report – January 2014
Shasta-Trinity National Forest 31
Rust, Brad. Past Shasta-Trinity Soil Disturbance Results, 2011.
Rust, Brad. 2012. Machine Piling & Burning Soil Monitoring Report. May 2012.
Rust, Brad. Shasta-Trinity National Forest Monitoring Results. 2003. Iron Canyon Late Seral Reserve Study. Project File, pending publication by PSW Research Station after 5-year follow up study.
Safford, Hugh, 2011. Shasta-Trinity National Forest Climate Change Expectations.
Stark, 1979. Nutrient losses from timber harvesting in a larch/Douglas fir forest. USDA Forest Service Research Paper. INT-231.
USDA Forest Service, Shasta-Trinity NF. 2004. Monitoring and evaluation report. Internal document.
USDA Forest Service. 2010. Forest Service Manual2550. Soil Management Handbook. Washington D.C. 20p.
USDA Forest Service. 1995b. Land and Resource Management Plan, Shasta-Trinity National Forests. Redding, CA
USDA Forest Service. 2008. Northern Region Soil Disturbance Monitoring Protocol. Draft Report.
USDA NRCS. 2008. Soil Survey database for Intermountain Area, parts of Lassen, Modoc, Shasta, and Siskiyou Counties, California. Ca604 survey area. Via http://soildatamart.nrcs.usda.gov/
Vinton, M. A. and I. C. Burke. 1995. Interactions between individual plant species and soil nutrient status in shortgrass-steppe. Ecology 76: 1116.
Welke, Sylvia and James Fyles.2005. When texture matters: compaction in boreal forest soils. FSMN research note series http://www.sfmnetwork.ca/docs/e/RN_en_Compaction%20and%20Texture.pdf
Wells, C.G and J.R. Jorgensen. 1979. Effects of Intensive Harvesting on Nutrient Supply and Sustained Productivity. USDA Symposium Proceedings, 212-230. p 225-226
Wells, C.G., R.E. Campbell, L.F. DeBano, C.E. Lewis, R.L. Fredriksen, E.C. Franklin, R.C. Froelich and D.H. Dunn. 1979. Effects of Fire on Soil: A State of the Knowledge Review. USDA Forest Service Gen. Tech. Rep. WO-7. p.26.
Western Regional Climate Center. 2010. McCloud California weather and precipitation summaries. Via http://www.wrcc.dri.edu/. Retrieved on 6/8/2010.
Young, David. 2009. Personal communication (between Jacqueline Foss and David Young) on rates of disturbance for tractor harvest, located in project record.
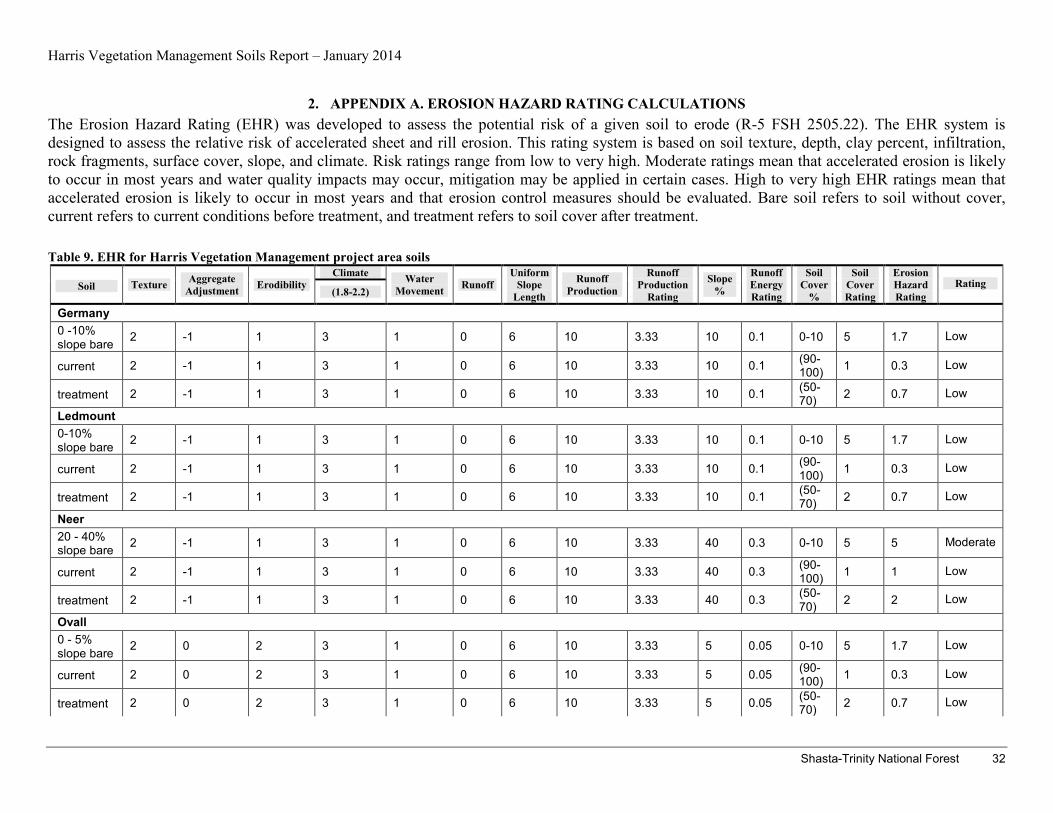
Harris Vegetation Management Soils Report – January 2014
Shasta-Trinity National Forest 32
2. APPENDIX A. EROSION HAZARD RATING CALCULATIONS The Erosion Hazard Rating (EHR) was developed to assess the potential risk of a given soil to erode (R-5 FSH 2505.22). The EHR system is designed to assess the relative risk of accelerated sheet and rill erosion. This rating system is based on soil texture, depth, clay percent, infiltration, rock fragments, surface cover, slope, and climate. Risk ratings range from low to very high. Moderate ratings mean that accelerated erosion is likely to occur in most years and water quality impacts may occur, mitigation may be applied in certain cases. High to very high EHR ratings mean that accelerated erosion is likely to occur in most years and that erosion control measures should be evaluated. Bare soil refers to soil without cover, current refers to current conditions before treatment, and treatment refers to soil cover after treatment.
Table 9. EHR for Harris Vegetation Management project area soils
Soil Texture Aggregate Adjustment Erodibility
Climate Water Movement Runoff
Uniform Slope
Length
Runoff Production
Runoff Production
Rating
Slope %
Runoff Energy Rating
Soil Cover
%
Soil Cover Rating
Erosion Hazard Rating
Rating (1.8-2.2)
Germany 0 -10% slope bare 2 -1 1 3 1 0 6 10 3.33 10 0.1 0-10 5 1.7 Low
current 2 -1 1 3 1 0 6 10 3.33 10 0.1 (90-100) 1 0.3 Low
treatment 2 -1 1 3 1 0 6 10 3.33 10 0.1 (50-70) 2 0.7 Low
Ledmount 0-10% slope bare 2 -1 1 3 1 0 6 10 3.33 10 0.1 0-10 5 1.7 Low
current 2 -1 1 3 1 0 6 10 3.33 10 0.1 (90-100) 1 0.3 Low
treatment 2 -1 1 3 1 0 6 10 3.33 10 0.1 (50-70) 2 0.7 Low
Neer 20 - 40% slope bare 2 -1 1 3 1 0 6 10 3.33 40 0.3 0-10 5 5 Moderate
current 2 -1 1 3 1 0 6 10 3.33 40 0.3 (90-100) 1 1 Low
treatment 2 -1 1 3 1 0 6 10 3.33 40 0.3 (50-70) 2 2 Low
Ovall 0 - 5% slope bare 2 0 2 3 1 0 6 10 3.33 5 0.05 0-10 5 1.7 Low
current 2 0 2 3 1 0 6 10 3.33 5 0.05 (90-100) 1 0.3 Low
treatment 2 0 2 3 1 0 6 10 3.33 5 0.05 (50-70) 2 0.7 Low
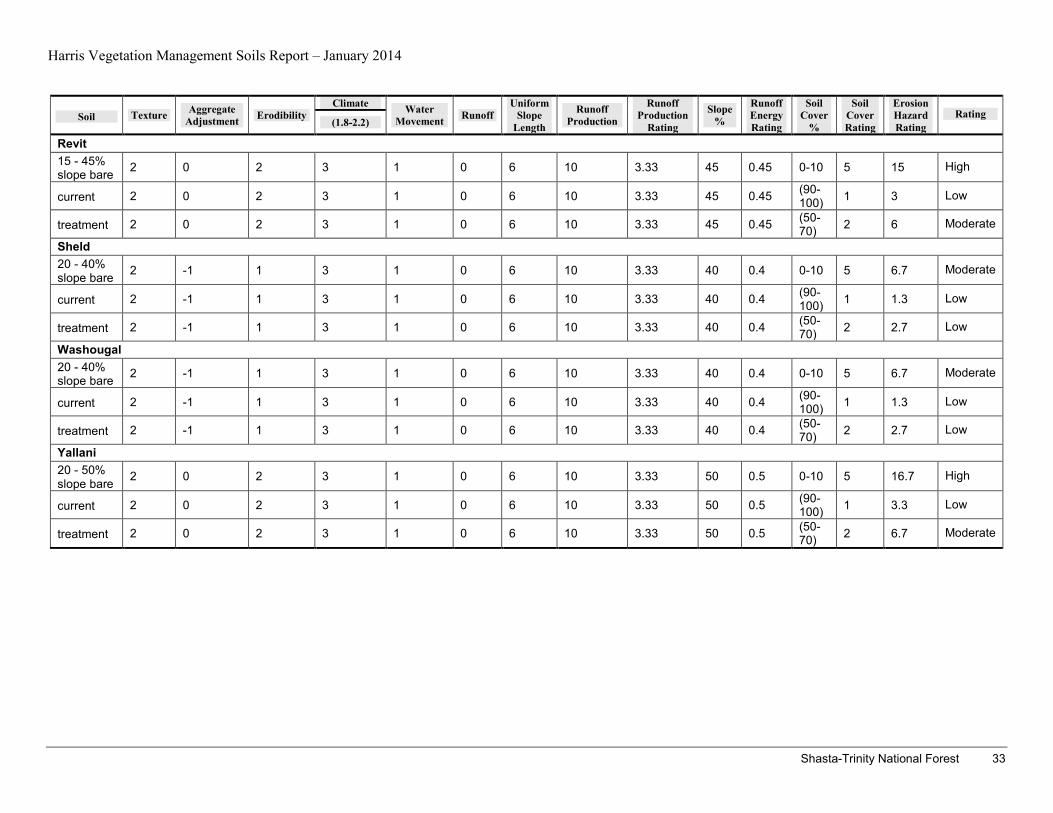
Harris Vegetation Management Soils Report – January 2014
Shasta-Trinity National Forest 33
Soil Texture Aggregate Adjustment Erodibility
Climate Water Movement Runoff
Uniform Slope
Length
Runoff Production
Runoff Production
Rating
Slope %
Runoff Energy Rating
Soil Cover
%
Soil Cover Rating
Erosion Hazard Rating
Rating (1.8-2.2)
Revit 15 - 45% slope bare 2 0 2 3 1 0 6 10 3.33 45 0.45 0-10 5 15 High
current 2 0 2 3 1 0 6 10 3.33 45 0.45 (90-100) 1 3 Low
treatment 2 0 2 3 1 0 6 10 3.33 45 0.45 (50-70) 2 6 Moderate
Sheld 20 - 40% slope bare 2 -1 1 3 1 0 6 10 3.33 40 0.4 0-10 5 6.7 Moderate
current 2 -1 1 3 1 0 6 10 3.33 40 0.4 (90-100) 1 1.3 Low
treatment 2 -1 1 3 1 0 6 10 3.33 40 0.4 (50-70) 2 2.7 Low
Washougal 20 - 40% slope bare 2 -1 1 3 1 0 6 10 3.33 40 0.4 0-10 5 6.7 Moderate
current 2 -1 1 3 1 0 6 10 3.33 40 0.4 (90-100) 1 1.3 Low
treatment 2 -1 1 3 1 0 6 10 3.33 40 0.4 (50-70) 2 2.7 Low
Yallani 20 - 50% slope bare 2 0 2 3 1 0 6 10 3.33 50 0.5 0-10 5 16.7 High
current 2 0 2 3 1 0 6 10 3.33 50 0.5 (90-100) 1 3.3 Low
treatment 2 0 2 3 1 0 6 10 3.33 50 0.5 (50-70) 2 6.7 Moderate
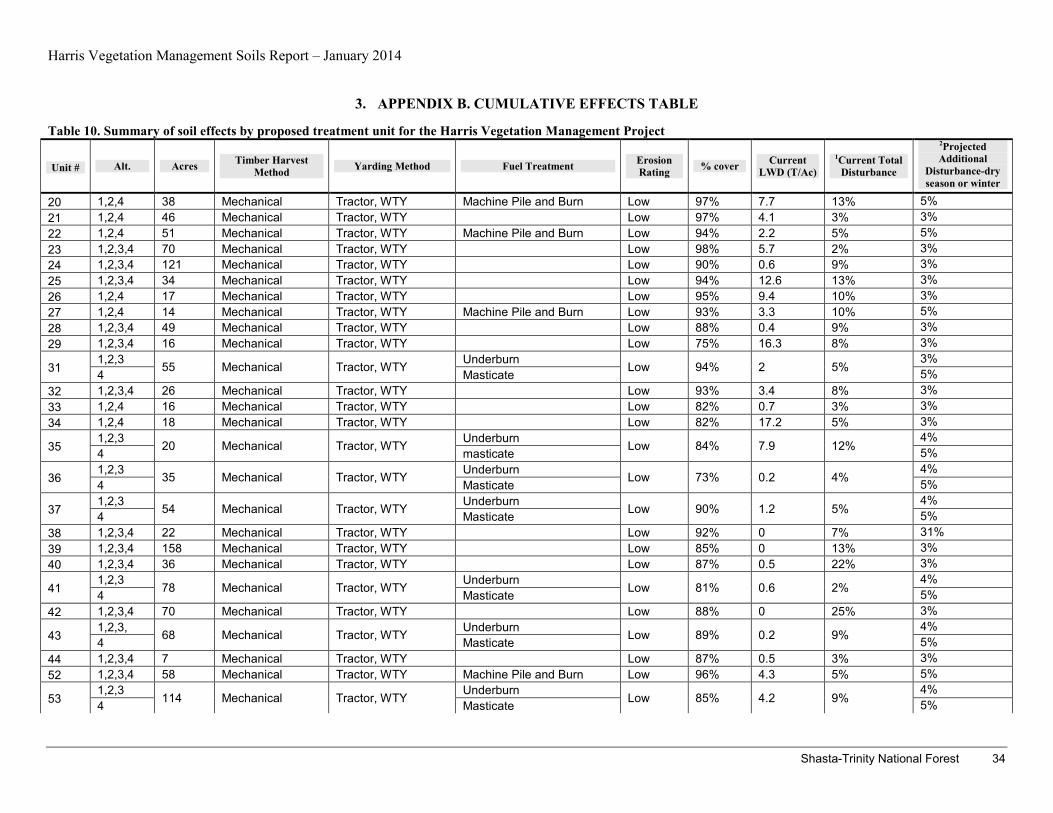
Harris Vegetation Management Soils Report – January 2014
Shasta-Trinity National Forest 34
3. APPENDIX B. CUMULATIVE EFFECTS TABLE
Table 10. Summary of soil effects by proposed treatment unit for the Harris Vegetation Management Project
Unit # Alt. Acres Timber Harvest Method Yarding Method Fuel Treatment Erosion
Rating % cover Current LWD (T/Ac)
1Current Total Disturbance
2Projected Additional
Disturbance-dry season or winter
20 1,2,4 38 Mechanical Tractor, WTY Machine Pile and Burn Low 97% 7.7 13% 5% 21 1,2,4 46 Mechanical Tractor, WTY Low 97% 4.1 3% 3% 22 1,2,4 51 Mechanical Tractor, WTY Machine Pile and Burn Low 94% 2.2 5% 5% 23 1,2,3,4 70 Mechanical Tractor, WTY Low 98% 5.7 2% 3% 24 1,2,3,4 121 Mechanical Tractor, WTY Low 90% 0.6 9% 3% 25 1,2,3,4 34 Mechanical Tractor, WTY Low 94% 12.6 13% 3% 26 1,2,4 17 Mechanical Tractor, WTY Low 95% 9.4 10% 3% 27 1,2,4 14 Mechanical Tractor, WTY Machine Pile and Burn Low 93% 3.3 10% 5% 28 1,2,3,4 49 Mechanical Tractor, WTY Low 88% 0.4 9% 3% 29 1,2,3,4 16 Mechanical Tractor, WTY Low 75% 16.3 8% 3%
31 1,2,3 55 Mechanical Tractor, WTY Underburn Low 94% 2 5%
3% 4 Masticate 5%
32 1,2,3,4 26 Mechanical Tractor, WTY Low 93% 3.4 8% 3% 33 1,2,4 16 Mechanical Tractor, WTY Low 82% 0.7 3% 3% 34 1,2,4 18 Mechanical Tractor, WTY Low 82% 17.2 5% 3%
35 1,2,3 20 Mechanical Tractor, WTY Underburn Low 84% 7.9 12%
4% 4 masticate 5%
36 1,2,3 35 Mechanical Tractor, WTY Underburn Low 73% 0.2 4%
4% 4 Masticate 5%
37 1,2,3 54 Mechanical Tractor, WTY Underburn Low 90% 1.2 5%
4% 4 Masticate 5%
38 1,2,3,4 22 Mechanical Tractor, WTY Low 92% 0 7% 31% 39 1,2,3,4 158 Mechanical Tractor, WTY Low 85% 0 13% 3% 40 1,2,3,4 36 Mechanical Tractor, WTY Low 87% 0.5 22% 3%
41 1,2,3
78 Mechanical Tractor, WTY Underburn
Low 81% 0.6 2% 4%
4 Masticate 5% 42 1,2,3,4 70 Mechanical Tractor, WTY Low 88% 0 25% 3%
43 1,2,3, 68 Mechanical Tractor, WTY Underburn Low 89% 0.2 9%
4% 4 Masticate 5%
44 1,2,3,4 7 Mechanical Tractor, WTY Low 87% 0.5 3% 3% 52 1,2,3,4 58 Mechanical Tractor, WTY Machine Pile and Burn Low 96% 4.3 5% 5%
53 1,2,3
114 Mechanical Tractor, WTY Underburn
Low 85% 4.2 9% 4%
4 Masticate 5%
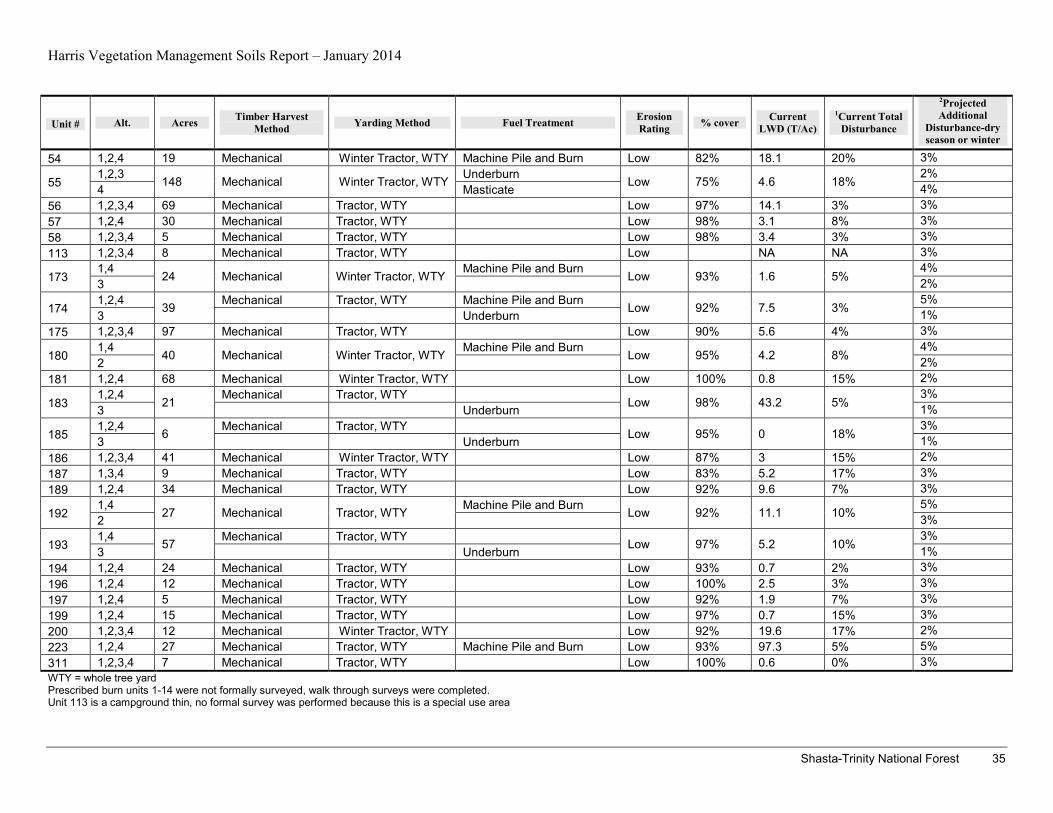
Harris Vegetation Management Soils Report – January 2014
Shasta-Trinity National Forest 35
Unit # Alt. Acres Timber Harvest Method Yarding Method Fuel Treatment Erosion
Rating % cover Current LWD (T/Ac)
1Current Total Disturbance
2Projected Additional
Disturbance-dry season or winter
54 1,2,4 19 Mechanical Winter Tractor, WTY Machine Pile and Burn Low 82% 18.1 20% 3%
55 1,2,3 148 Mechanical Winter Tractor, WTY Underburn Low 75% 4.6 18%
2% 4 Masticate 4%
56 1,2,3,4 69 Mechanical Tractor, WTY Low 97% 14.1 3% 3% 57 1,2,4 30 Mechanical Tractor, WTY Low 98% 3.1 8% 3% 58 1,2,3,4 5 Mechanical Tractor, WTY Low 98% 3.4 3% 3% 113 1,2,3,4 8 Mechanical Tractor, WTY Low NA NA 3%
173 1,4
24 Mechanical Winter Tractor, WTY Machine Pile and Burn
Low 93% 1.6 5% 4%
3 2%
174 1,2,4 39 Mechanical Tractor, WTY Machine Pile and Burn Low 92% 7.5 3%
5% 3 Underburn 1%
175 1,2,3,4 97 Mechanical Tractor, WTY Low 90% 5.6 4% 3%
180 1,4
40 Mechanical Winter Tractor, WTY Machine Pile and Burn
Low 95% 4.2 8% 4%
2 2% 181 1,2,4 68 Mechanical Winter Tractor, WTY Low 100% 0.8 15% 2%
183 1,2,4
21 Mechanical Tractor, WTY
Low 98% 43.2 5% 3%
3 Underburn 1%
185 1,2,4 6 Mechanical Tractor, WTY Low 95% 0 18%
3% 3 Underburn 1%
186 1,2,3,4 41 Mechanical Winter Tractor, WTY Low 87% 3 15% 2% 187 1,3,4 9 Mechanical Tractor, WTY Low 83% 5.2 17% 3% 189 1,2,4 34 Mechanical Tractor, WTY Low 92% 9.6 7% 3%
192 1,4 27 Mechanical Tractor, WTY Machine Pile and Burn Low 92% 11.1 10%
5% 2 3%
193 1,4 57 Mechanical Tractor, WTY Low 97% 5.2 10%
3% 3 Underburn 1%
194 1,2,4 24 Mechanical Tractor, WTY Low 93% 0.7 2% 3% 196 1,2,4 12 Mechanical Tractor, WTY Low 100% 2.5 3% 3% 197 1,2,4 5 Mechanical Tractor, WTY Low 92% 1.9 7% 3% 199 1,2,4 15 Mechanical Tractor, WTY Low 97% 0.7 15% 3% 200 1,2,3,4 12 Mechanical Winter Tractor, WTY Low 92% 19.6 17% 2% 223 1,2,4 27 Mechanical Tractor, WTY Machine Pile and Burn Low 93% 97.3 5% 5% 311 1,2,3,4 7 Mechanical Tractor, WTY Low 100% 0.6 0% 3% WTY = whole tree yard Prescribed burn units 1-14 were not formally surveyed, walk through surveys were completed. Unit 113 is a campground thin, no formal survey was performed because this is a special use area
Harris Vegetation Management Soils Report – January 2014
Shasta-Trinity National Forest 36
1 Total soil disturbance is not the same as detrimental soil disturbance. Total soil disturbance includes low and moderate levels of disturbance along with detrimental soil disturbance (see definition of detrimental soil disturbance on page 3 of soils report). Total disturbance can be detrimental if SQS thresholds are exceeded on greater than 15% of the area. For levels of detrimental soil disturbance see page 10 Table 3. 2 Projected additional disturbance for dry and winter operations ranges from 2 to 5 percent. This is disturbance and not necessarily detrimental so long as the SQS are not exceeded on greater than 15% of the area. For whole-tree mechanical harvesting is 1 to 3%, machine pile or masticate is 1 to 2% increase, and underburning is 1%.
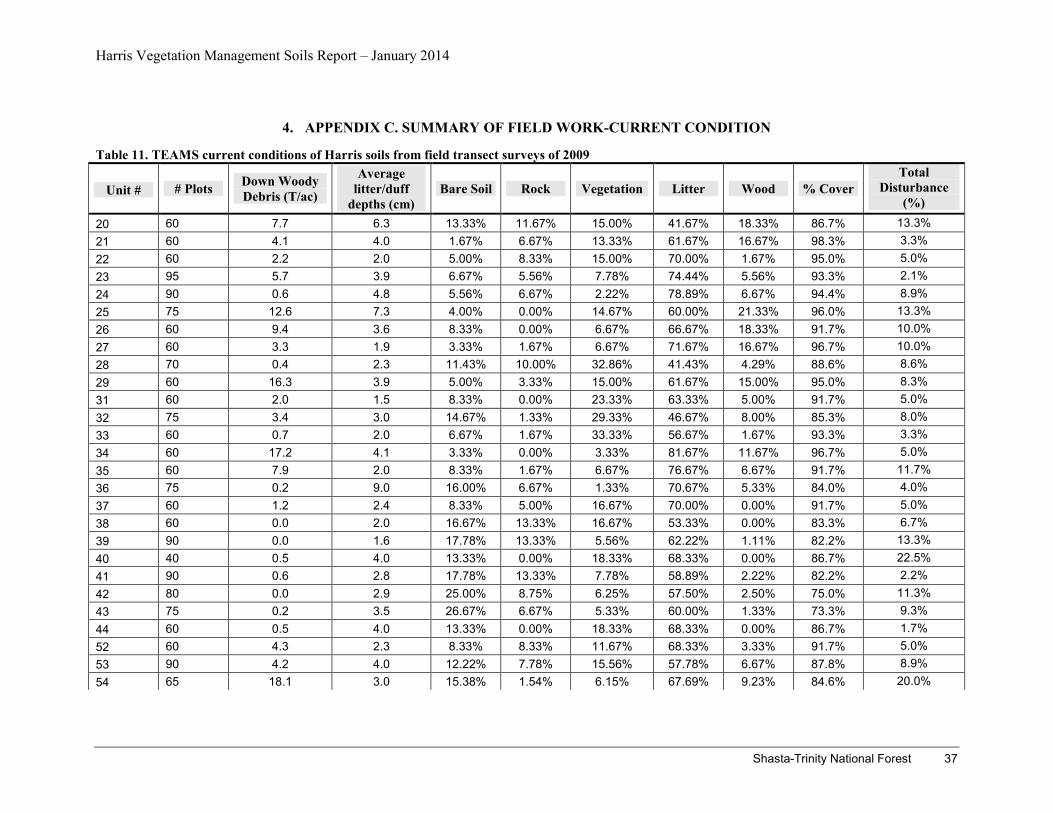
Harris Vegetation Management Soils Report – January 2014
Shasta-Trinity National Forest 37
4. APPENDIX C. SUMMARY OF FIELD WORK-CURRENT CONDITION
Table 11. TEAMS current conditions of Harris soils from field transect surveys of 2009
Unit # # Plots Down Woody Debris (T/ac)
Average litter/duff
depths (cm) Bare Soil Rock Vegetation Litter Wood % Cover
Total Disturbance
(%) 20 60 7.7 6.3 13.33% 11.67% 15.00% 41.67% 18.33% 86.7% 13.3% 21 60 4.1 4.0 1.67% 6.67% 13.33% 61.67% 16.67% 98.3% 3.3% 22 60 2.2 2.0 5.00% 8.33% 15.00% 70.00% 1.67% 95.0% 5.0% 23 95 5.7 3.9 6.67% 5.56% 7.78% 74.44% 5.56% 93.3% 2.1% 24 90 0.6 4.8 5.56% 6.67% 2.22% 78.89% 6.67% 94.4% 8.9% 25 75 12.6 7.3 4.00% 0.00% 14.67% 60.00% 21.33% 96.0% 13.3% 26 60 9.4 3.6 8.33% 0.00% 6.67% 66.67% 18.33% 91.7% 10.0% 27 60 3.3 1.9 3.33% 1.67% 6.67% 71.67% 16.67% 96.7% 10.0% 28 70 0.4 2.3 11.43% 10.00% 32.86% 41.43% 4.29% 88.6% 8.6% 29 60 16.3 3.9 5.00% 3.33% 15.00% 61.67% 15.00% 95.0% 8.3% 31 60 2.0 1.5 8.33% 0.00% 23.33% 63.33% 5.00% 91.7% 5.0% 32 75 3.4 3.0 14.67% 1.33% 29.33% 46.67% 8.00% 85.3% 8.0% 33 60 0.7 2.0 6.67% 1.67% 33.33% 56.67% 1.67% 93.3% 3.3% 34 60 17.2 4.1 3.33% 0.00% 3.33% 81.67% 11.67% 96.7% 5.0% 35 60 7.9 2.0 8.33% 1.67% 6.67% 76.67% 6.67% 91.7% 11.7% 36 75 0.2 9.0 16.00% 6.67% 1.33% 70.67% 5.33% 84.0% 4.0% 37 60 1.2 2.4 8.33% 5.00% 16.67% 70.00% 0.00% 91.7% 5.0% 38 60 0.0 2.0 16.67% 13.33% 16.67% 53.33% 0.00% 83.3% 6.7% 39 90 0.0 1.6 17.78% 13.33% 5.56% 62.22% 1.11% 82.2% 13.3% 40 40 0.5 4.0 13.33% 0.00% 18.33% 68.33% 0.00% 86.7% 22.5% 41 90 0.6 2.8 17.78% 13.33% 7.78% 58.89% 2.22% 82.2% 2.2% 42 80 0.0 2.9 25.00% 8.75% 6.25% 57.50% 2.50% 75.0% 11.3% 43 75 0.2 3.5 26.67% 6.67% 5.33% 60.00% 1.33% 73.3% 9.3% 44 60 0.5 4.0 13.33% 0.00% 18.33% 68.33% 0.00% 86.7% 1.7% 52 60 4.3 2.3 8.33% 8.33% 11.67% 68.33% 3.33% 91.7% 5.0% 53 90 4.2 4.0 12.22% 7.78% 15.56% 57.78% 6.67% 87.8% 8.9% 54 65 18.1 3.0 15.38% 1.54% 6.15% 67.69% 9.23% 84.6% 20.0%

Harris Vegetation Management Soils Report – January 2014
Shasta-Trinity National Forest 38
Unit # # Plots Down Woody Debris (T/ac)
Average litter/duff
depths (cm) Bare Soil Rock Vegetation Litter Wood % Cover
Total Disturbance
(%) 55 90 4.6 2.4 18.89% 2.22% 28.89% 45.56% 4.44% 81.1% 17.8% 56 60 14.1 5.0 0.00% 1.67% 10.00% 73.33% 15.00% 100.0% 3.3% 57 60 3.1 1.0 6.67% 0.00% 18.33% 66.67% 8.33% 93.3% 8.3% 58 30 3.4 2.5 0.00% 0.00% 6.67% 86.67% 6.67% 100.0% 3.3% 173 60 1.6 8.0 3.33% 0.00% 1.67% 83.33% 11.67% 96.7% 5.0% 174 60 7.5 4.0 1.67% 3.33% 6.67% 85.00% 3.33% 98.3% 3.3% 175 90 5.6 2.8 6.67% 0.00% 12.22% 68.89% 12.22% 93.3% 4.4% 180 60 4.2 3.8 5.00% 1.67% 8.33% 68.33% 16.67% 95.0% 8.3% 181 60 0.8 5.0 10.00% 0.00% 16.67% 70.00% 3.33% 90.0% 15.0% 183 60 43.2 8.5 1.67% 5.00% 13.33% 63.33% 16.67% 98.3% 5.0% 185 53 0.0 2.0 18.52% 3.70% 12.96% 64.81% 0.00% 81.5% 17.5% 186 60 3.0 1.1 25.00% 0.00% 1.67% 73.33% 0.00% 75.0% 15.0% 187 60 5.2 4.7 6.00% 10.00% 0.00% 76.00% 8.00% 94.0% 16.7% 189 60 9.6 3.8 3.33% 3.33% 6.67% 85.00% 1.67% 96.7% 6.7% 192 60 11.1 3.7 5.00% 5.00% 11.67% 65.00% 13.33% 95.0% 10.0% 193 60 5.2 3.5 6.67% 1.67% 16.67% 71.67% 3.33% 93.3% 10.0% 194 60 0.7 2.0 5.00% 5.00% 33.33% 53.33% 3.33% 95.0% 1.7% 196 60 2.5 2.0 10.00% 3.33% 40.00% 41.67% 5.00% 90.0% 3.3% 197 60 1.9 2.3 11.67% 0.00% 5.00% 70.00% 13.33% 88.3% 6.7% 199 60 0.7 1.5 1.67% 1.67% 18.33% 78.33% 0.00% 98.3% 15.0% 200 60 19.6 4.0 10.00% 1.67% 8.33% 58.33% 21.67% 90.0% 16.7% 223 60 97.7 13.3 3.33% 0.00% 10.00% 36.67% 50.00% 96.7% 5.0% 311 30 0.6 5.3 0.00% 10.00% 13.33% 66.67% 10.00% 100.0% 0.0% No soils data collected for units 1-14, prescribed burn units, these units were observed but no data was taken Unit 113 - Campground Thin-No Soils Data
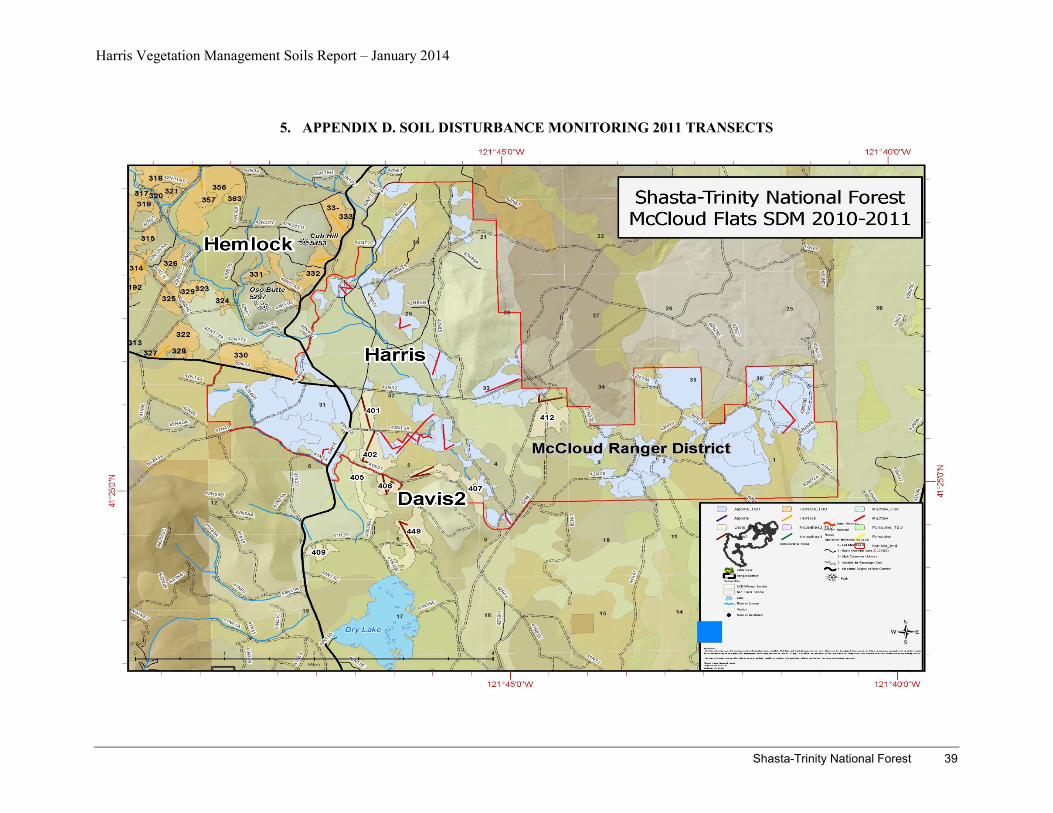
Harris Vegetation Management Soils Report – January 2014
Shasta-Trinity National Forest 39
5. APPENDIX D. SOIL DISTURBANCE MONITORING 2011 TRANSECTS
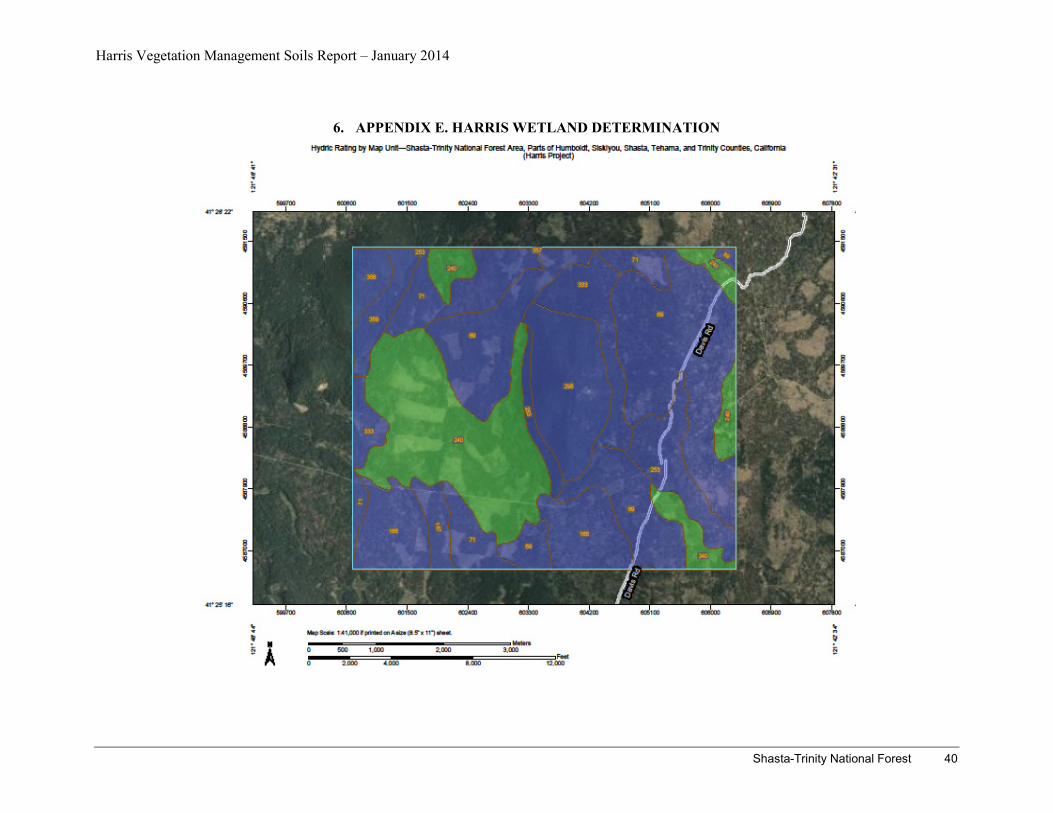
Harris Vegetation Management Soils Report – January 2014
Shasta-Trinity National Forest 40
6. APPENDIX E. HARRIS WETLAND DETERMINATION
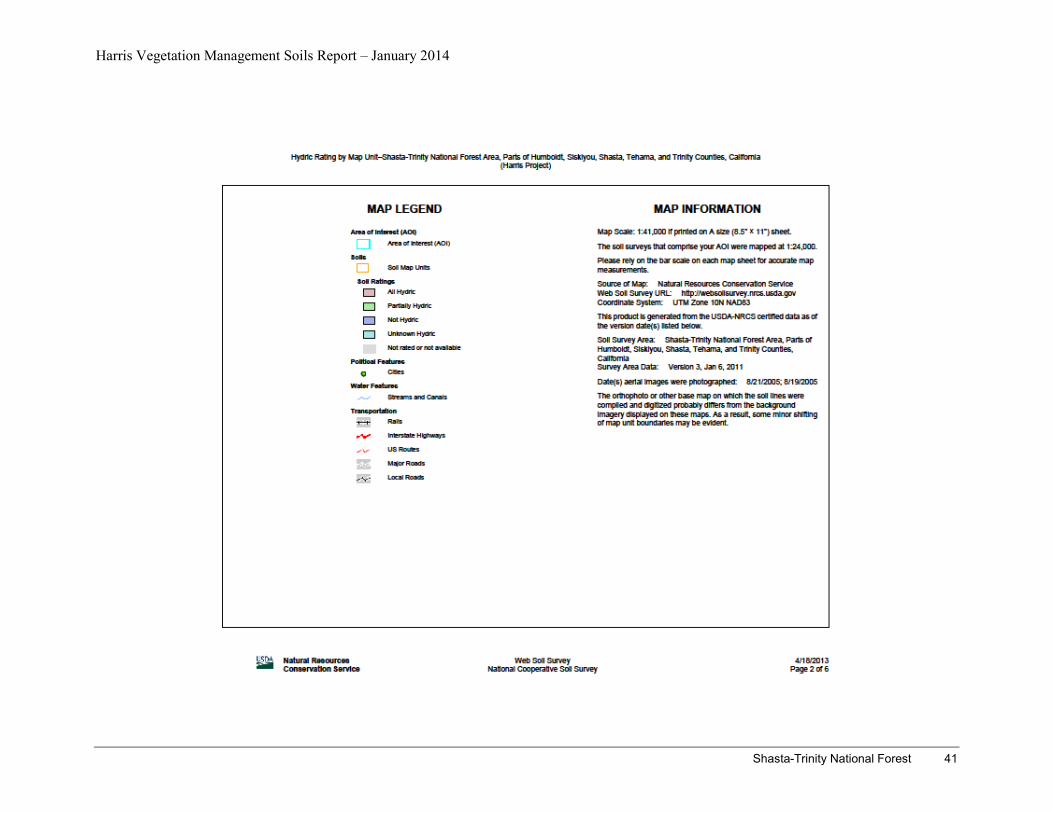
Harris Vegetation Management Soils Report – January 2014
Shasta-Trinity National Forest 41
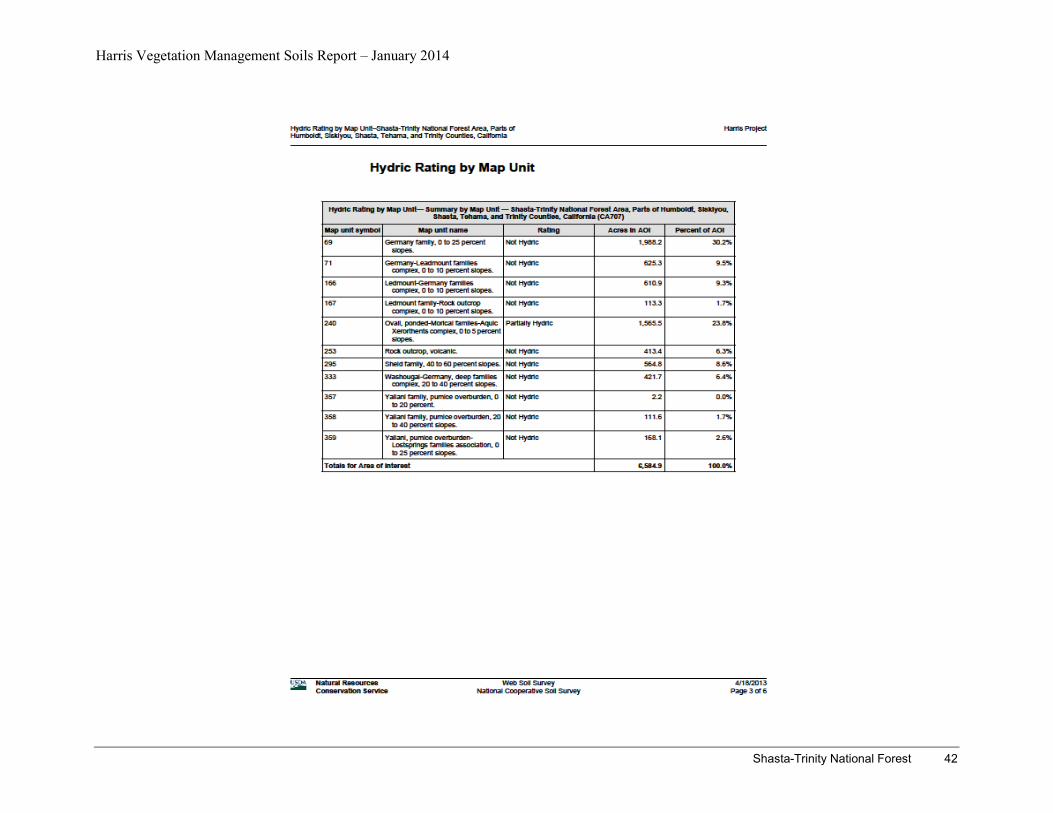
Harris Vegetation Management Soils Report – January 2014
Shasta-Trinity National Forest 42
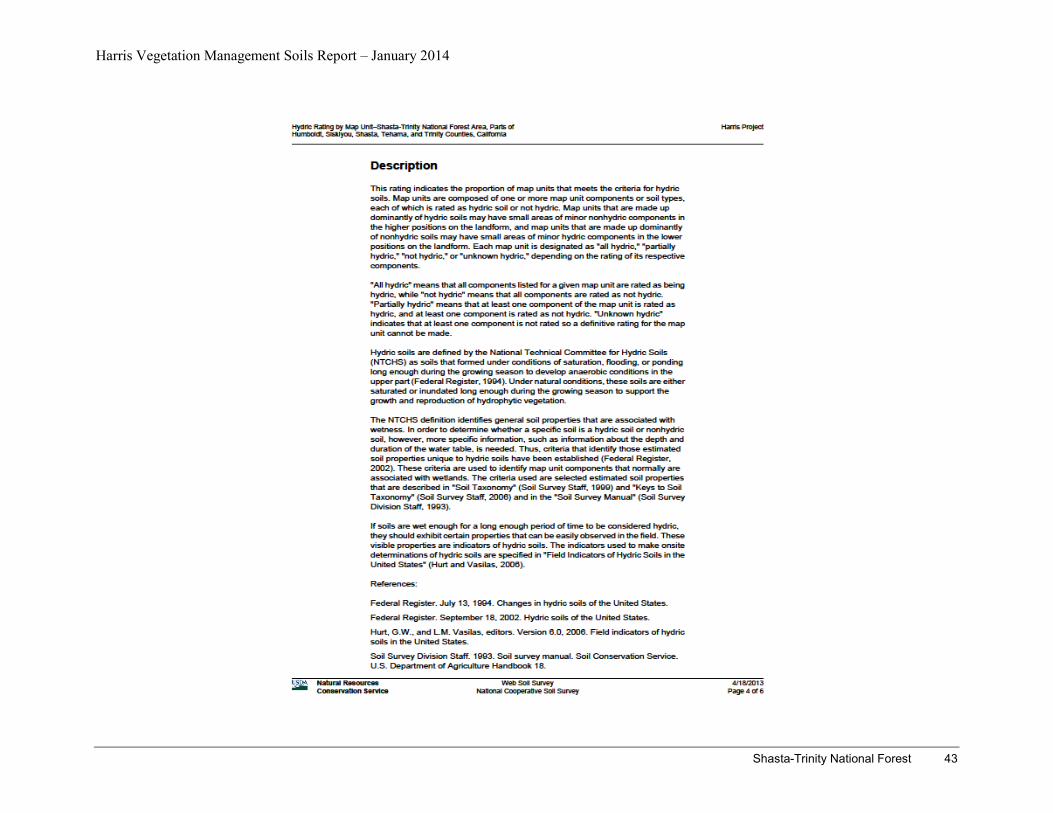
Harris Vegetation Management Soils Report – January 2014
Shasta-Trinity National Forest 43
Harris Vegetation Management Soils Report – January 2014
Shasta-Trinity National Forest 44
7. APPENDIX F. CUMULATIVE EFFECTS WORKSHEET
7.1.1.1 Resource: Soils Cumulative Effects Review - Assumptions Past, present, and reasonably foreseeable future actions were considered, in order to assess accumulated impacts. According to the Council on Environmental Quality NEPA regulations, a “cumulative impact” is the impact on the environment which results from the incremental impact of the action when added to other past, present, and reasonably foreseeable future actions regardless of what agency (Federal or non-Federal) or person undertakes such actions (40 CFR 1508.7). Spatial and temporal boundaries are the two critical elements to consider when deciding which actions to include in a cumulative effects analysis. Spatial and temporal boundaries set the limits for selecting those actions that are most likely to contribute to a cumulative effect. The effects of those actions must overlap in space and time for there to be potential cumulative effects (FSH 1909.15 (15.2)). Therefore, relevant boundaries and projects assessed for cumulative effects vary by resource. Each resource cumulative effect area can be different and possibly larger or smaller. Cumulative effects are documented for the resource in the project specialist reports and are summarized in the Draft Supplemental Environmental Impact Statement.
This cumulative effects analysis does not attempt to quantify the effects of past human actions by adding up all prior actions on an action-by-action basis. There are several reasons for not taking this approach. First, a catalog and analysis of all past actions would be impractical to compile and unduly costly to obtain. Current conditions have been impacted by innumerable actions over the last century (and beyond), and trying to isolate the individual actions that continue to have residual impacts would be nearly impossible. Second, providing the details of past actions on an individual basis would not always be useful to predict the cumulative effects of the proposed action or alternatives. In fact, focusing on individual actions would be less accurate than looking at existing conditions, because there is limited information on the environmental impacts of individual past actions, and one cannot reasonably identify each and every action over the last century that has contributed to current conditions. The current environmental conditions reflect the aggregate impact of all prior human actions and natural events that have affected the environment and might contribute to cumulative effects and can be used as a proxy for the impacts of past actions.5
That said, a reasonable attempt to list potentially relevant past, present, and future actions within the Bear Creek and Medicine Lake/White Horse Flats watersheds (and small areas where wildlife boundaries extend outside the watershed boundary) (Harris Project general cumulative effects review area6) that surround the project was made. The interdisciplinary team reviewed 5 This approach is consistent with the Council on Environmental Quality June 24, 2005 memorandum regarding analysis of past actions. 6 Refer to EIS Appendix G for a spatial representation of this area. Each resource reviewed direct and indirect effects of the proposed action, in accordance with FSH 1909.15 (15.2), and determined relevant spatial and temporal boundaries for cumulative effects analysis. The longest temporal boundary in this review was 30 years. The largest spatial boundary in this review resulted in the two 5th field watersheds, Bear Creek and Medicine Lake/White Horse Flats. The wildlife cumulative effects buffer extended just beyond the Bear Creek 5th field watershed
Harris Vegetation Management Soils Report – January 2014
Shasta-Trinity National Forest 45
for activities that are contained within or intersect with the Harris Project general cumulative effects review area from the following sources: Forest Activities Tracking (FACTS) database for the Shasta-Trinity, Lassen, and Modoc national forests, CALFIRES’s timber harvesting status table (for THPs submitted to CALFIRE) and CALFIRE’s Forest Practice Geographical Information System timber harvest data in ERSI formats (for THPs approved, completed, etc.), the Schedule of Proposed Actions for the Shasta-Trinity, Lassen, and Modoc national forests, and forest personnel for past, present, ongoing and future activities. The information is is characterized in the Cumulative Effects Worksheet for this resource (in the project record) and summarized below. Readers are cautioned not to view the past project acre totals as accurate inventories of activity because many project activities overlap and are counted several times. For example, a 2000 acre project area with 5 activities could show as 10,000 acres.
Relevant Resource Indicator: soil properties and soil conditions that result in significant change or impairment of the productivity potential, hydrologic function, or buffering capacity of the soil. Temporal Boundary & rationale: For this analysis, the temporal context being considered is activities 5-10 years, but up to 20 years, into the future; 5-10 years is generally sufficient for soil recovery overall, with Germany soil type up to 20 years. Spatial Boundary & rationale: Area of Harris activity (Project Treatment Units). The analysis area or bounding area, for direct, indirect, and cumulative effects for the soil resource includes the proposed harvest units. This is the area that is expected to be directly impacted by any activities. The Harris Vegetation Management Project area is used to qualitatively discuss the past activities outside of proposed treatment units.
boundary. As such, activities were reviewed for data contained within or intersecting the largest boundary which is comprised of the Bear Creek and Medicine Lake/Whitehorse Flats 5th field watersheds combined with areas where wildlife boundaries extend outside the watershed boundary within the last 30 years. (There may be a slight overestimate of the amount of activity conducted because activities intersecting the boundary were used in addition to those contained completely within the boundary.
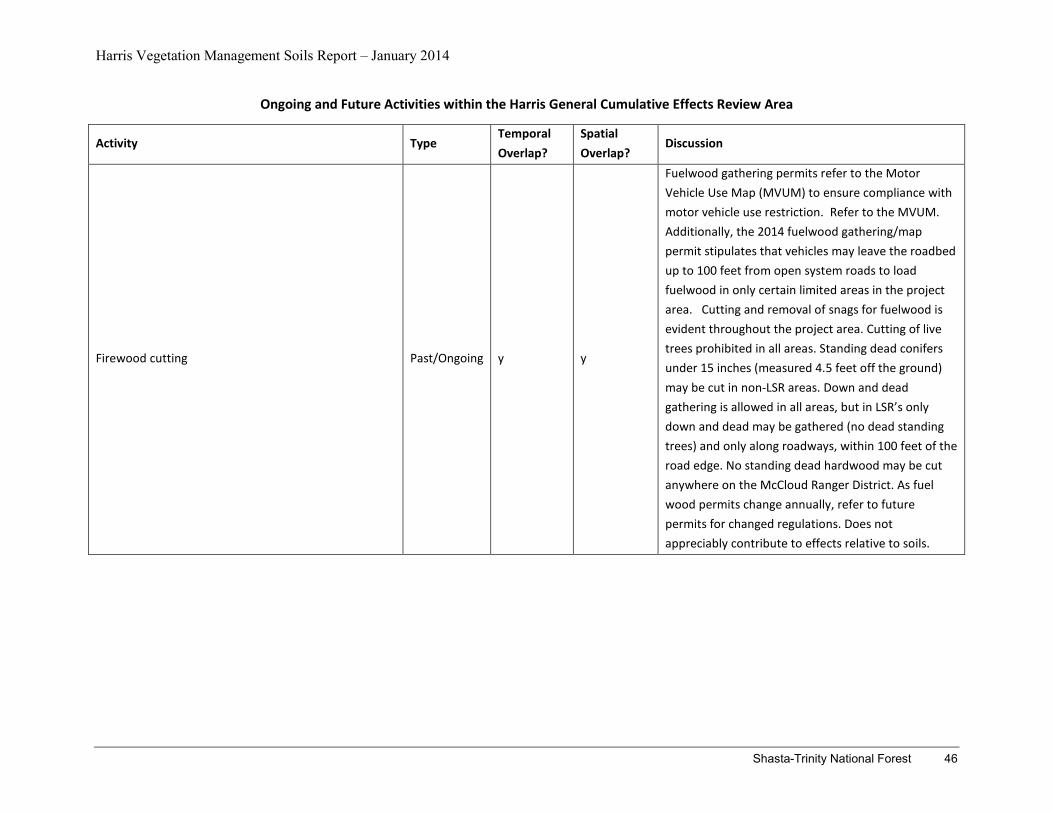
Harris Vegetation Management Soils Report – January 2014
Shasta-Trinity National Forest 46
Ongoing and Future Activities within the Harris General Cumulative Effects Review Area
Activity Type Temporal Overlap?
Spatial Overlap?
Discussion
Firewood cutting Past/Ongoing y y
Fuelwood gathering permits refer to the Motor Vehicle Use Map (MVUM) to ensure compliance with motor vehicle use restriction. Refer to the MVUM. Additionally, the 2014 fuelwood gathering/map permit stipulates that vehicles may leave the roadbed up to 100 feet from open system roads to load fuelwood in only certain limited areas in the project area. Cutting and removal of snags for fuelwood is evident throughout the project area. Cutting of live trees prohibited in all areas. Standing dead conifers under 15 inches (measured 4.5 feet off the ground) may be cut in non-LSR areas. Down and dead gathering is allowed in all areas, but in LSR’s only down and dead may be gathered (no dead standing trees) and only along roadways, within 100 feet of the road edge. No standing dead hardwood may be cut anywhere on the McCloud Ranger District. As fuel wood permits change annually, refer to future permits for changed regulations. Does not appreciably contribute to effects relative to soils.
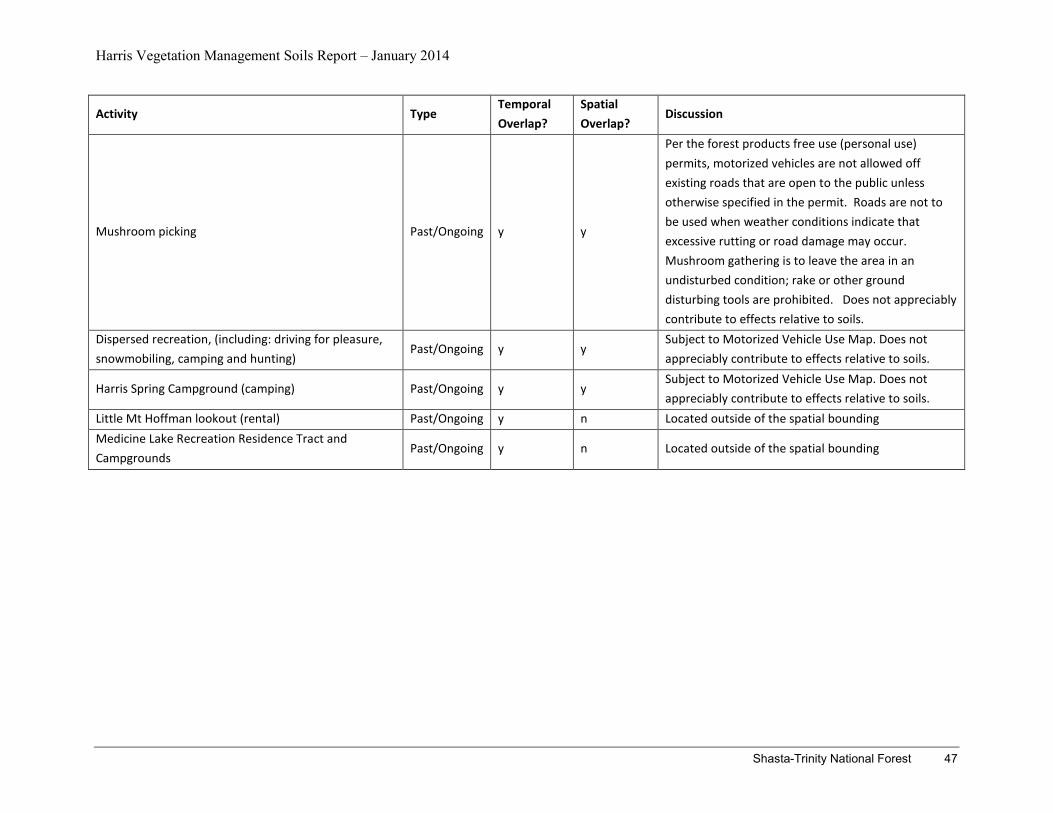
Harris Vegetation Management Soils Report – January 2014
Shasta-Trinity National Forest 47
Activity Type Temporal Overlap?
Spatial Overlap?
Discussion
Mushroom picking Past/Ongoing y y
Per the forest products free use (personal use) permits, motorized vehicles are not allowed off existing roads that are open to the public unless otherwise specified in the permit. Roads are not to be used when weather conditions indicate that excessive rutting or road damage may occur. Mushroom gathering is to leave the area in an undisturbed condition; rake or other ground disturbing tools are prohibited. Does not appreciably contribute to effects relative to soils.
Dispersed recreation, (including: driving for pleasure, snowmobiling, camping and hunting)
Past/Ongoing y y Subject to Motorized Vehicle Use Map. Does not appreciably contribute to effects relative to soils.
Harris Spring Campground (camping) Past/Ongoing y y Subject to Motorized Vehicle Use Map. Does not appreciably contribute to effects relative to soils.
Little Mt Hoffman lookout (rental) Past/Ongoing y n Located outside of the spatial bounding Medicine Lake Recreation Residence Tract and Campgrounds
Past/Ongoing y n Located outside of the spatial bounding
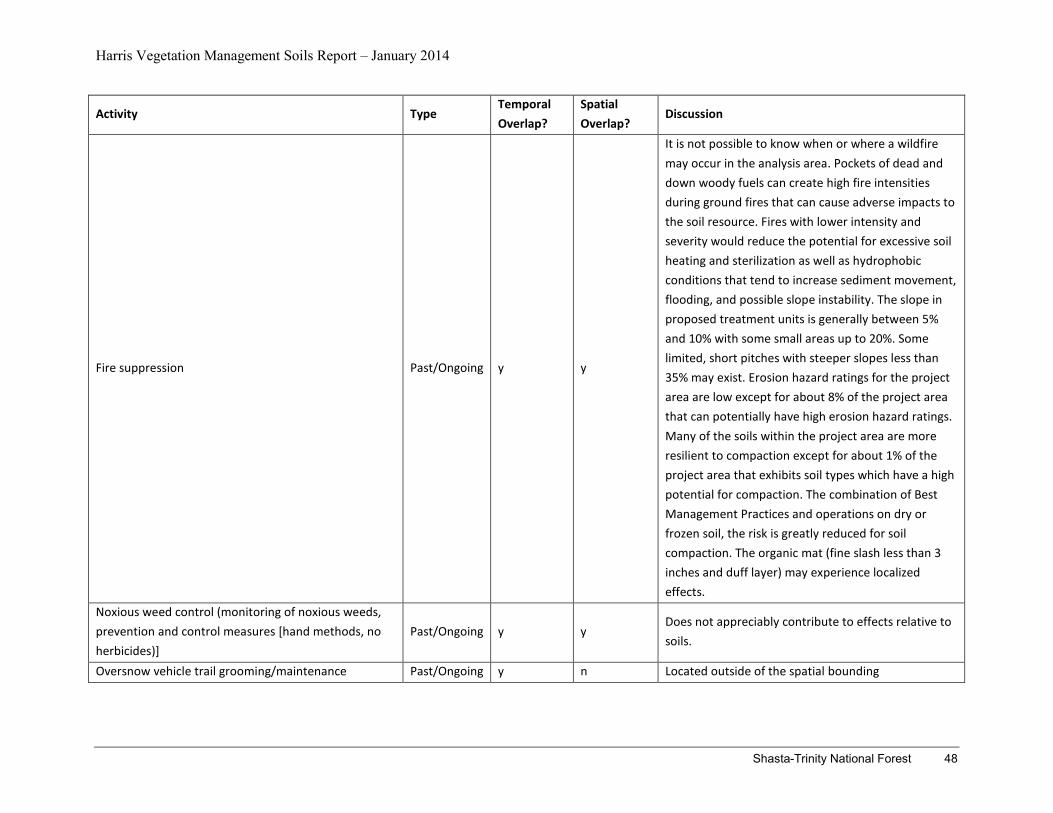
Harris Vegetation Management Soils Report – January 2014
Shasta-Trinity National Forest 48
Activity Type Temporal Overlap?
Spatial Overlap?
Discussion
Fire suppression Past/Ongoing y y
It is not possible to know when or where a wildfire may occur in the analysis area. Pockets of dead and down woody fuels can create high fire intensities during ground fires that can cause adverse impacts to the soil resource. Fires with lower intensity and severity would reduce the potential for excessive soil heating and sterilization as well as hydrophobic conditions that tend to increase sediment movement, flooding, and possible slope instability. The slope in proposed treatment units is generally between 5% and 10% with some small areas up to 20%. Some limited, short pitches with steeper slopes less than 35% may exist. Erosion hazard ratings for the project area are low except for about 8% of the project area that can potentially have high erosion hazard ratings. Many of the soils within the project area are more resilient to compaction except for about 1% of the project area that exhibits soil types which have a high potential for compaction. The combination of Best Management Practices and operations on dry or frozen soil, the risk is greatly reduced for soil compaction. The organic mat (fine slash less than 3 inches and duff layer) may experience localized effects.
Noxious weed control (monitoring of noxious weeds, prevention and control measures [hand methods, no herbicides)]
Past/Ongoing y y Does not appreciably contribute to effects relative to soils.
Oversnow vehicle trail grooming/maintenance Past/Ongoing y n Located outside of the spatial bounding
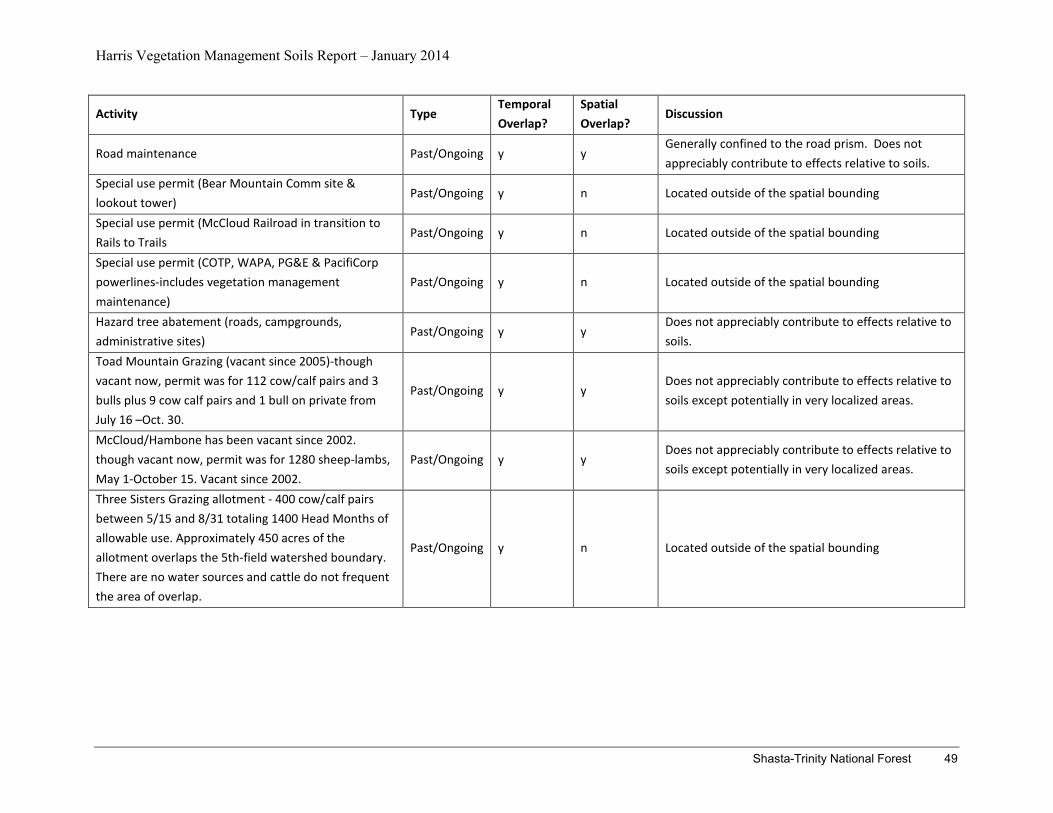
Harris Vegetation Management Soils Report – January 2014
Shasta-Trinity National Forest 49
Activity Type Temporal Overlap?
Spatial Overlap?
Discussion
Road maintenance Past/Ongoing y y Generally confined to the road prism. Does not appreciably contribute to effects relative to soils.
Special use permit (Bear Mountain Comm site & lookout tower)
Past/Ongoing y n Located outside of the spatial bounding
Special use permit (McCloud Railroad in transition to Rails to Trails
Past/Ongoing y n Located outside of the spatial bounding
Special use permit (COTP, WAPA, PG&E & PacifiCorp powerlines-includes vegetation management maintenance)
Past/Ongoing y n Located outside of the spatial bounding
Hazard tree abatement (roads, campgrounds, administrative sites)
Past/Ongoing y y Does not appreciably contribute to effects relative to soils.
Toad Mountain Grazing (vacant since 2005)-though vacant now, permit was for 112 cow/calf pairs and 3 bulls plus 9 cow calf pairs and 1 bull on private from July 16 –Oct. 30.
Past/Ongoing y y Does not appreciably contribute to effects relative to soils except potentially in very localized areas.
McCloud/Hambone has been vacant since 2002. though vacant now, permit was for 1280 sheep-lambs, May 1-October 15. Vacant since 2002.
Past/Ongoing y y Does not appreciably contribute to effects relative to soils except potentially in very localized areas.
Three Sisters Grazing allotment - 400 cow/calf pairs between 5/15 and 8/31 totaling 1400 Head Months of allowable use. Approximately 450 acres of the allotment overlaps the 5th-field watershed boundary. There are no water sources and cattle do not frequent the area of overlap.
Past/Ongoing y n Located outside of the spatial bounding
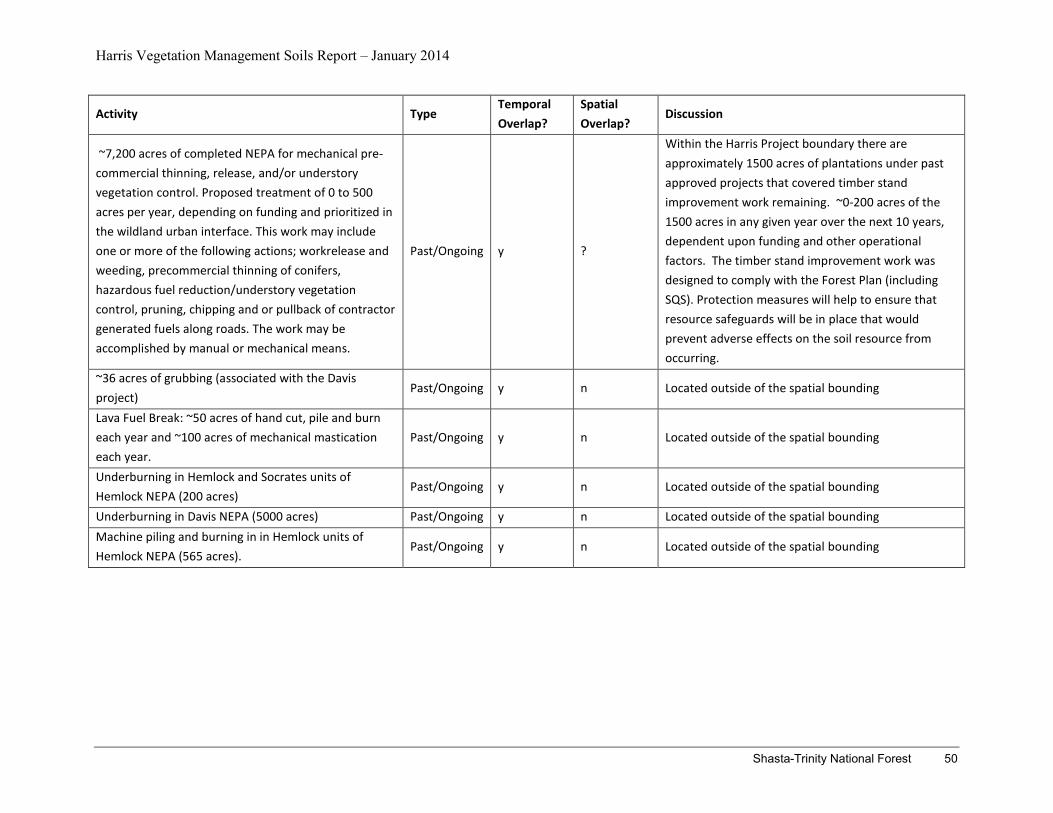
Harris Vegetation Management Soils Report – January 2014
Shasta-Trinity National Forest 50
Activity Type Temporal Overlap?
Spatial Overlap?
Discussion
~7,200 acres of completed NEPA for mechanical pre-commercial thinning, release, and/or understory vegetation control. Proposed treatment of 0 to 500 acres per year, depending on funding and prioritized in the wildland urban interface. This work may include one or more of the following actions; workrelease and weeding, precommercial thinning of conifers, hazardous fuel reduction/understory vegetation control, pruning, chipping and or pullback of contractor generated fuels along roads. The work may be accomplished by manual or mechanical means.
Past/Ongoing y ?
Within the Harris Project boundary there are approximately 1500 acres of plantations under past approved projects that covered timber stand improvement work remaining. ~0-200 acres of the 1500 acres in any given year over the next 10 years, dependent upon funding and other operational factors. The timber stand improvement work was designed to comply with the Forest Plan (including SQS). Protection measures will help to ensure that resource safeguards will be in place that would prevent adverse effects on the soil resource from occurring.
~36 acres of grubbing (associated with the Davis project)
Past/Ongoing y n Located outside of the spatial bounding
Lava Fuel Break: ~50 acres of hand cut, pile and burn each year and ~100 acres of mechanical mastication each year.
Past/Ongoing y n Located outside of the spatial bounding
Underburning in Hemlock and Socrates units of Hemlock NEPA (200 acres)
Past/Ongoing y n Located outside of the spatial bounding
Underburning in Davis NEPA (5000 acres) Past/Ongoing y n Located outside of the spatial bounding Machine piling and burning in in Hemlock units of Hemlock NEPA (565 acres).
Past/Ongoing y n Located outside of the spatial bounding
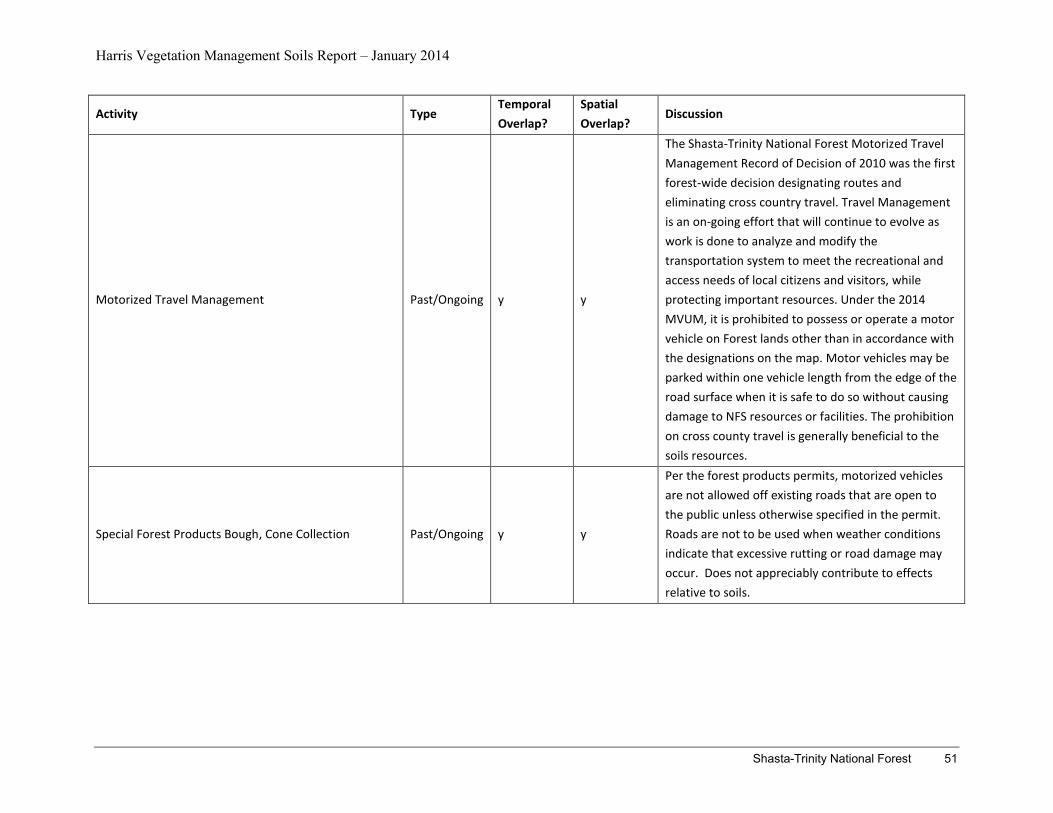
Harris Vegetation Management Soils Report – January 2014
Shasta-Trinity National Forest 51
Activity Type Temporal Overlap?
Spatial Overlap?
Discussion
Motorized Travel Management Past/Ongoing y y
The Shasta-Trinity National Forest Motorized Travel Management Record of Decision of 2010 was the first forest-wide decision designating routes and eliminating cross country travel. Travel Management is an on-going effort that will continue to evolve as work is done to analyze and modify the transportation system to meet the recreational and access needs of local citizens and visitors, while protecting important resources. Under the 2014 MVUM, it is prohibited to possess or operate a motor vehicle on Forest lands other than in accordance with the designations on the map. Motor vehicles may be parked within one vehicle length from the edge of the road surface when it is safe to do so without causing damage to NFS resources or facilities. The prohibition on cross county travel is generally beneficial to the soils resources.
Special Forest Products Bough, Cone Collection Past/Ongoing y y
Per the forest products permits, motorized vehicles are not allowed off existing roads that are open to the public unless otherwise specified in the permit. Roads are not to be used when weather conditions indicate that excessive rutting or road damage may occur. Does not appreciably contribute to effects relative to soils.
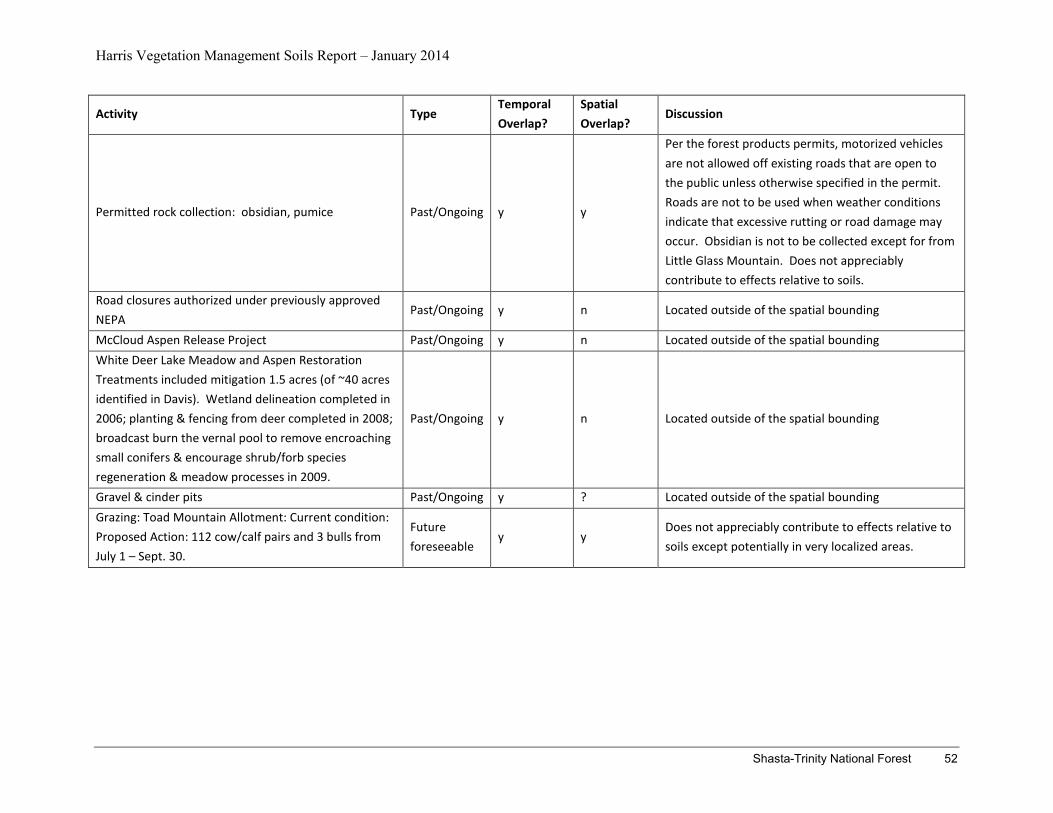
Harris Vegetation Management Soils Report – January 2014
Shasta-Trinity National Forest 52
Activity Type Temporal Overlap?
Spatial Overlap?
Discussion
Permitted rock collection: obsidian, pumice Past/Ongoing y y
Per the forest products permits, motorized vehicles are not allowed off existing roads that are open to the public unless otherwise specified in the permit. Roads are not to be used when weather conditions indicate that excessive rutting or road damage may occur. Obsidian is not to be collected except for from Little Glass Mountain. Does not appreciably contribute to effects relative to soils.
Road closures authorized under previously approved NEPA
Past/Ongoing y n Located outside of the spatial bounding
McCloud Aspen Release Project Past/Ongoing y n Located outside of the spatial bounding White Deer Lake Meadow and Aspen Restoration Treatments included mitigation 1.5 acres (of ~40 acres identified in Davis). Wetland delineation completed in 2006; planting & fencing from deer completed in 2008; broadcast burn the vernal pool to remove encroaching small conifers & encourage shrub/forb species regeneration & meadow processes in 2009.
Past/Ongoing y n Located outside of the spatial bounding
Gravel & cinder pits Past/Ongoing y ? Located outside of the spatial bounding Grazing: Toad Mountain Allotment: Current condition: Proposed Action: 112 cow/calf pairs and 3 bulls from July 1 – Sept. 30.
Future foreseeable
y y Does not appreciably contribute to effects relative to soils except potentially in very localized areas.
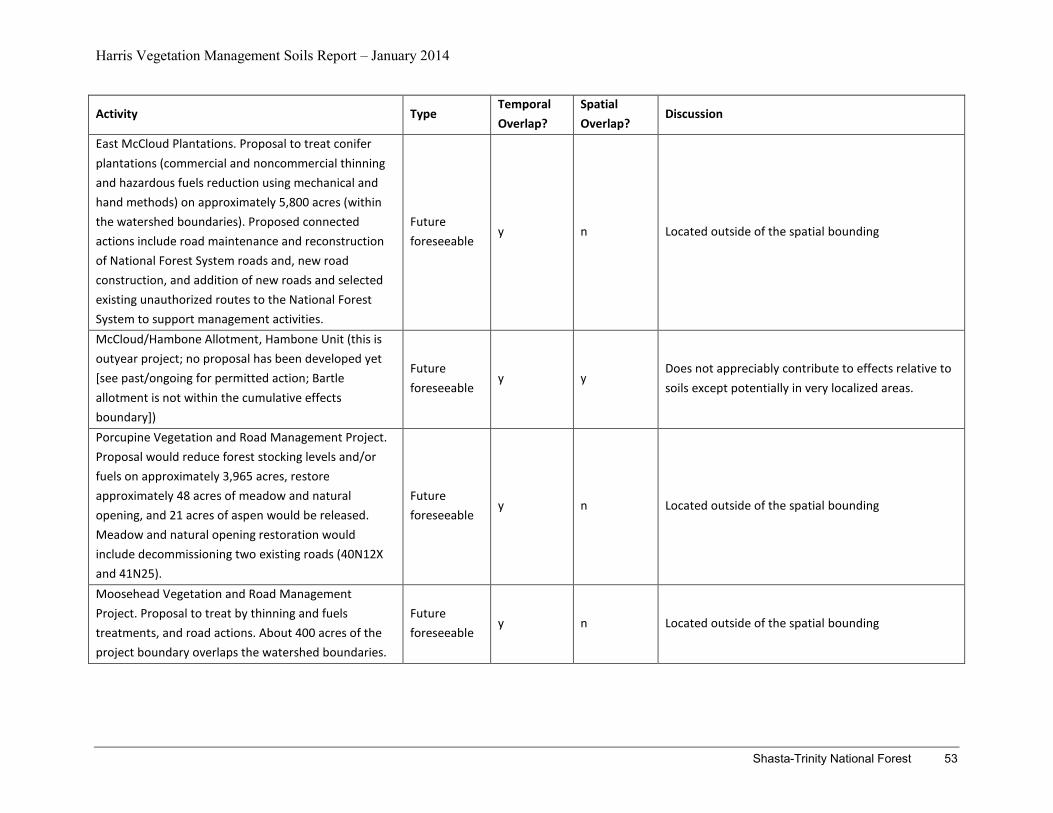
Harris Vegetation Management Soils Report – January 2014
Shasta-Trinity National Forest 53
Activity Type Temporal Overlap?
Spatial Overlap?
Discussion
East McCloud Plantations. Proposal to treat conifer plantations (commercial and noncommercial thinning and hazardous fuels reduction using mechanical and hand methods) on approximately 5,800 acres (within the watershed boundaries). Proposed connected actions include road maintenance and reconstruction of National Forest System roads and, new road construction, and addition of new roads and selected existing unauthorized routes to the National Forest System to support management activities.
Future foreseeable
y n Located outside of the spatial bounding
McCloud/Hambone Allotment, Hambone Unit (this is outyear project; no proposal has been developed yet [see past/ongoing for permitted action; Bartle allotment is not within the cumulative effects boundary])
Future foreseeable
y y Does not appreciably contribute to effects relative to soils except potentially in very localized areas.
Porcupine Vegetation and Road Management Project. Proposal would reduce forest stocking levels and/or fuels on approximately 3,965 acres, restore approximately 48 acres of meadow and natural opening, and 21 acres of aspen would be released. Meadow and natural opening restoration would include decommissioning two existing roads (40N12X and 41N25).
Future foreseeable
y n Located outside of the spatial bounding
Moosehead Vegetation and Road Management Project. Proposal to treat by thinning and fuels treatments, and road actions. About 400 acres of the project boundary overlaps the watershed boundaries.
Future foreseeable
y n Located outside of the spatial bounding
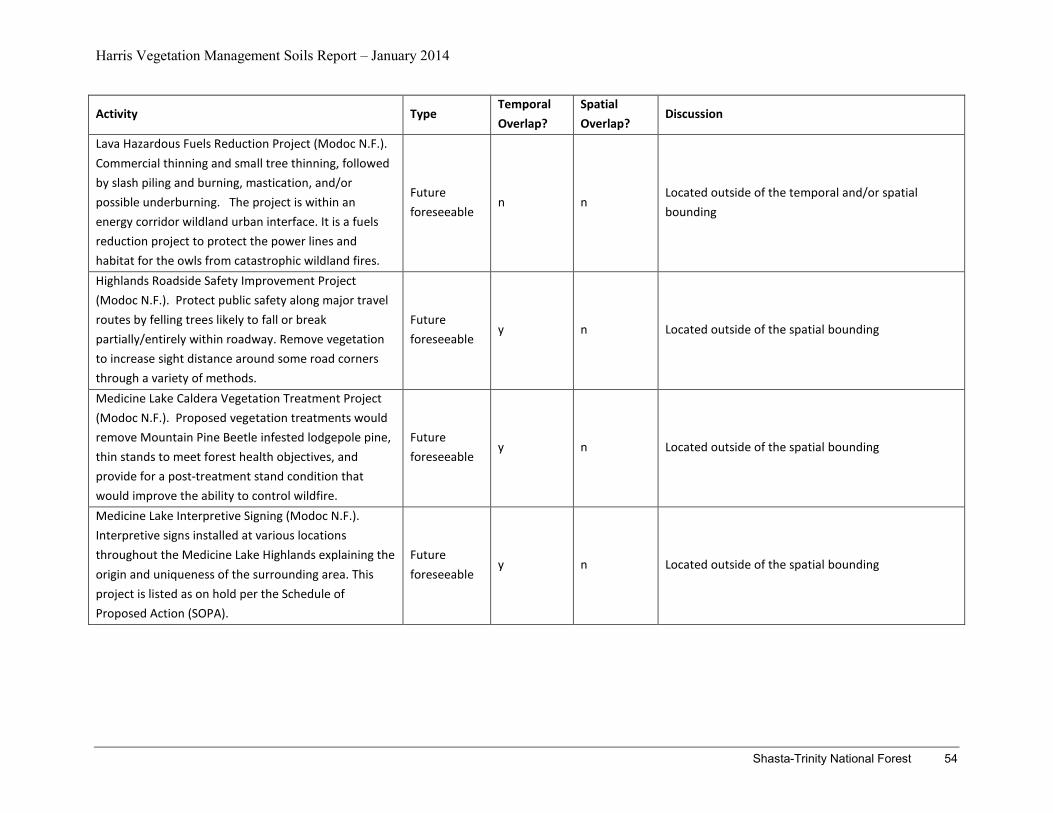
Harris Vegetation Management Soils Report – January 2014
Shasta-Trinity National Forest 54
Activity Type Temporal Overlap?
Spatial Overlap?
Discussion
Lava Hazardous Fuels Reduction Project (Modoc N.F.). Commercial thinning and small tree thinning, followed by slash piling and burning, mastication, and/or possible underburning. The project is within an energy corridor wildland urban interface. It is a fuels reduction project to protect the power lines and habitat for the owls from catastrophic wildland fires.
Future foreseeable
n n Located outside of the temporal and/or spatial bounding
Highlands Roadside Safety Improvement Project (Modoc N.F.). Protect public safety along major travel routes by felling trees likely to fall or break partially/entirely within roadway. Remove vegetation to increase sight distance around some road corners through a variety of methods.
Future foreseeable
y n Located outside of the spatial bounding
Medicine Lake Caldera Vegetation Treatment Project (Modoc N.F.). Proposed vegetation treatments would remove Mountain Pine Beetle infested lodgepole pine, thin stands to meet forest health objectives, and provide for a post-treatment stand condition that would improve the ability to control wildfire.
Future foreseeable
y n Located outside of the spatial bounding
Medicine Lake Interpretive Signing (Modoc N.F.). Interpretive signs installed at various locations throughout the Medicine Lake Highlands explaining the origin and uniqueness of the surrounding area. This project is listed as on hold per the Schedule of Proposed Action (SOPA).
Future foreseeable
y n Located outside of the spatial bounding
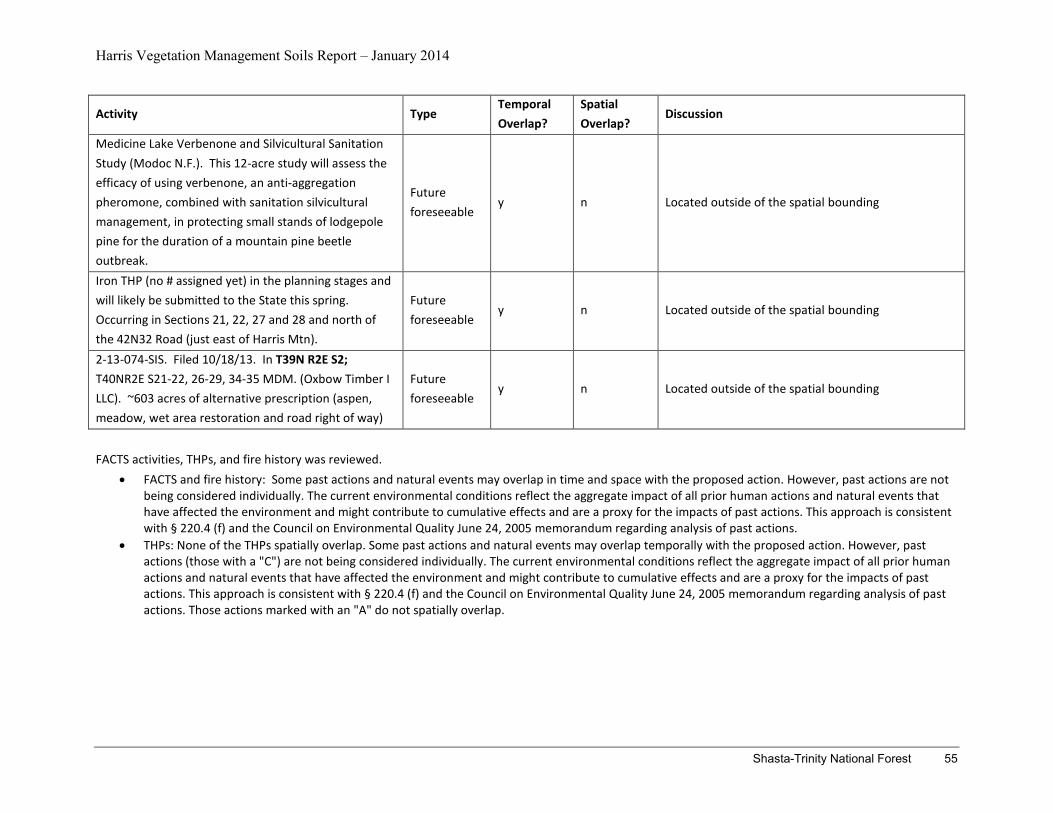
Harris Vegetation Management Soils Report – January 2014
Shasta-Trinity National Forest 55
Activity Type Temporal Overlap?
Spatial Overlap?
Discussion
Medicine Lake Verbenone and Silvicultural Sanitation Study (Modoc N.F.). This 12-acre study will assess the efficacy of using verbenone, an anti-aggregation pheromone, combined with sanitation silvicultural management, in protecting small stands of lodgepole pine for the duration of a mountain pine beetle outbreak.
Future foreseeable
y n Located outside of the spatial bounding
Iron THP (no # assigned yet) in the planning stages and will likely be submitted to the State this spring. Occurring in Sections 21, 22, 27 and 28 and north of the 42N32 Road (just east of Harris Mtn).
Future foreseeable
y n Located outside of the spatial bounding
2-13-074-SIS. Filed 10/18/13. In T39N R2E S2; T40NR2E S21-22, 26-29, 34-35 MDM. (Oxbow Timber I LLC). ~603 acres of alternative prescription (aspen, meadow, wet area restoration and road right of way)
Future foreseeable
y n Located outside of the spatial bounding
FACTS activities, THPs, and fire history was reviewed.
• FACTS and fire history: Some past actions and natural events may overlap in time and space with the proposed action. However, past actions are not being considered individually. The current environmental conditions reflect the aggregate impact of all prior human actions and natural events that have affected the environment and might contribute to cumulative effects and are a proxy for the impacts of past actions. This approach is consistent with § 220.4 (f) and the Council on Environmental Quality June 24, 2005 memorandum regarding analysis of past actions.
• THPs: None of the THPs spatially overlap. Some past actions and natural events may overlap temporally with the proposed action. However, past actions (those with a "C") are not being considered individually. The current environmental conditions reflect the aggregate impact of all prior human actions and natural events that have affected the environment and might contribute to cumulative effects and are a proxy for the impacts of past actions. This approach is consistent with § 220.4 (f) and the Council on Environmental Quality June 24, 2005 memorandum regarding analysis of past actions. Those actions marked with an "A" do not spatially overlap.


![Thunder Creek Basin, Skagit County [Washington]—Report ......Jerry Thorsen, Geologist Contributors Noel Wolff, Hydrologist/Soils Specialist Jim Ryan, Hydrologist Louis Halloin, Soil](https://img.pdfslide.us/doc/110x75/60332c9fb794df0e4976477b/thunder-creek-basin-skagit-county-washingtonareport-jerry-thorsen.jpg)