Embed Size (px)
Citation preview

Know how. Know now.
Range and Pasture Management - Soils
Jerry D. VoleskyRange / Forage Specialist
West Central Res. & Ext. Center
402 West State Farm Rd
North Platte, NE 69101
(308) 696-6710
[email protected] Ag. Ed. Soils Project - 2013

• Fertility, pH• Texture: water holding capacity, organic
matter• Residual herbage, litter (hydrological)• Soil microbes, fungi, invertebrates
(decomposers)• Compaction, water infiltration
Range-Pasture-Haylands: Key Soil Factors

Nebraska range sites in relation to one another and topographical position

Range condition
• Ecological rating based on current status relative to climax plant community.
• % score = Poor – Fair – Good – Excellent

Plant communities associated with grazing or abandoned farming on a sands range site
Ecological Site Description (ESD)• Standardized method for defining, delineating, and describing
grasslands.
• Distinctive kinds of land with specific physical characteristics.
• Recognized and described based on its unique characteristics and ability to produce and support a characteristic plant community.
• ESD contains more information – soil, physical, climate, and hydrologic features, plant communities and dynamics, production estimates, growth curves, animal communities, and interpretation for management.
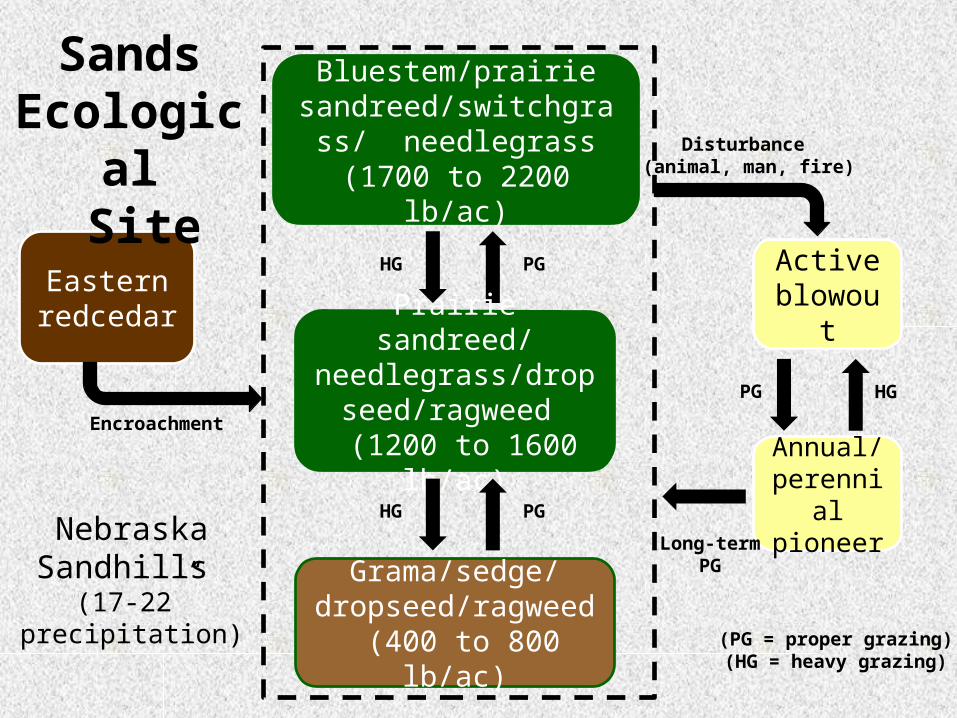
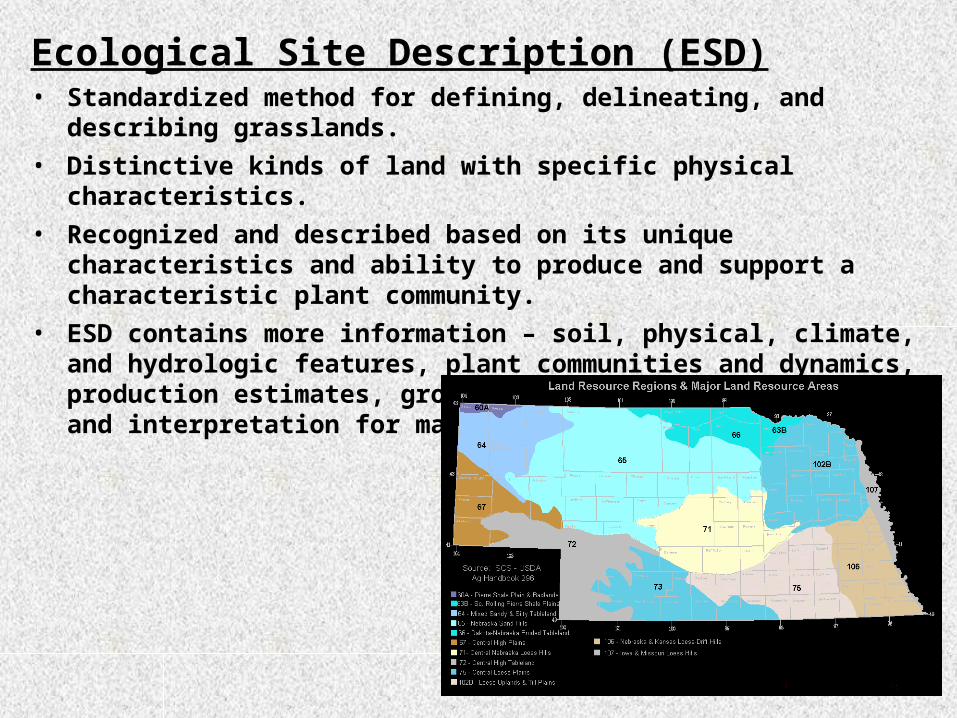
Bluestem/prairie sandreed/switchgrass/
needlegrass(1700 to 2200 lb/ac)
Eastern redcedar
SandsEcological
Site
Prairie sandreed/ needlegrass/dropseed/
ragweed (1200 to 1600 lb/ac)
Nebraska Sandhills (17-22” precipitation)
HG PG
Disturbance (animal, man, fire)
Grama/sedge/ dropseed/ragweed (400 to 800 lb/ac)
Active blowout
Annual/ perennial pioneer
HG PG
Encroachment
PG HG
Long-termPG
(PG = proper grazing)(HG = heavy grazing)

• Fertility, pH• Texture: water holding capacity, organic
matter• Residual herbage, litter (hydrological)• Soil microbes, fungi, invertebrates
(decomposers)• Compaction, water infiltration
Range-Pasture-Haylands: Key Soil Factors

Nitrogen recommendations (lb/acre)
Cool-season Warm-season
Nebraska Location Pasture Hayland Pasture Hayland
Southeast, east 80 - 120 100 - 150 60 - 90 75 - 100
East-central 50 - 80 60 - 90 40 – 75 50 - 80
West-central 40 - 60 50 - 75 25 - 50 40 - 60
Panhandle 20 - 40 30 - 60 20 - 40 30 - 50
Sandhills subirrigated meadow1 50 - 70 60 - 80 - - - -
1 Phosphorus (20 – 30 lb/ac) and sulfur (20 – 30 lb/ac) are often included.


Effect of nitrogen fertilization on irrigated smooth bromegrass and orchardgrass yield.1
0.00.51.01.52.02.53.03.54.04.55.0
Yie
ld (
T/a
cre
)
0 75 150 225 300
Nitrogen (lb/acre)
1 Three-year average (1970-72) from 4 harvests each year, Holt County.

Available water for different soil textures
Available water (in./ft.)
Soil Texture Range Typical
Coarse sand and gravel 0.3 – 0.6 0.5
Sand 0.5 – 0.8 0.6
Fine sand 0.7 – 1.1 1.0
Loamy sand 0.8 – 1.2 1.1
Loamy fine sand 0.9 – 1.3 1.2
Sandy loam 0.9 – 1.5 1.4

Available water for different soil textures
Available water (in./ft.)
Soil Texture Range Typical
Fine sandy loam 1.1 – 1.9 1.6
Loam 1.2 – 2.3 1.8
Silt loam 1.4 – 2.6 2.0
Silty clay loam 1.5 – 2.5 2.2
Clay loam 1.4 – 2.4 2.0
Clay 1.6 – 2.2 1.8

• 100 lb dry soil at 1.5 to 2.0 % organic matter can hold 35 - 45 lbs (4 to 5 gal.) water.
• 100 lb dry soil at 4 to 5% organic level can hold 165 to 195 lbs (20 to 24 gal.) water.
Organic matter and water holding capacity

I
II
Upland Sandhills range daily soil moisture content UNL Barta Brothers Ranch, 2012
Apr May Jun Jul Aug Sep Oct Nov
So
il m
ois
ture
(%
)
0
5
10
15
20 0 to 4 inches4 to 20 inches20 to 36 inches

I
II
Upland Sandhills range: daily soil moisture content(0 to 36") Barta Brothers Ranch, 2011 and 2012.
Apr May Jun Jul Aug Sep Oct Nov
So
il m
ois
ture
(%
)
0
5
10
15
20
2011
2012
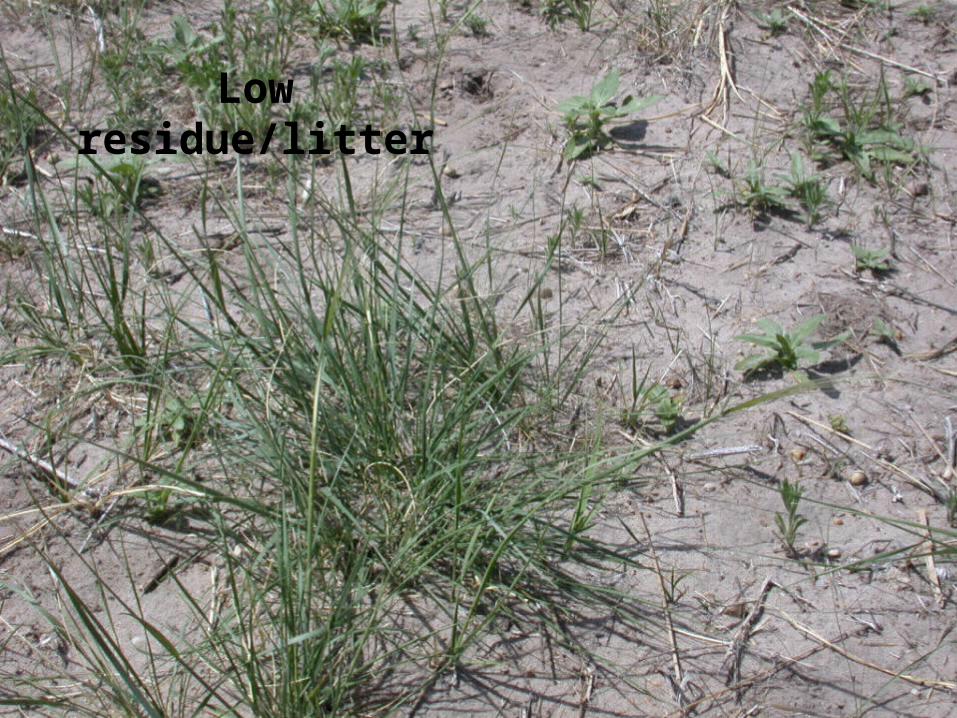
Low residue/litter

Excellent residue/litter

Elements of Good Grazing Management
1. Stocking rate
2. Timing of grazing (season of use)
3. Distribution
4. Kind/class of livestock

Stocking rate can be expressed by which of the following?
AUM
/acr
e
Cows/
sect
ion/
month
Acr
es/p
air/5
mon
ths
All
the
above
None
of the
abo
ve
0% 0% 0%0%0%
Quiz:
1. AUM/acre
2. Cows/section/month
3. Acres/pair/5 months
4. All the above
5. None of the above
Answer NowAnswer Now

Expressing stocking rate
Acres/ Acres/5AUM/acre AUD/acre year/AU months/AU
0.3 9 40 16.70.5 15 24 10.00.8 24 15 6.31.0 30 12 5.02.0 60 6 2.53.0 90 4 1.7

Grazing System: A specialization of grazing management which defines the periods of grazing and non-grazing.
A tool to achieve enterprise goals within a set of environmental, economic, resource, and management factors.
Regardless of grazing system, stocking rate is still the primary management factor.

All systems with multi-pasture rotations do provide management control of:
– Timing of grazing– Length of grazing period– Length of rest / non-use period– Stocking density – grazing pressure

With multiple pastures,
they allow us to: Manipulate grazing
distribution Control timing of
grazing (season of use) Control length of
grazing and rest Alter stocking density
Grazing Systems

Grazing Systems: History Pre- 1900: Continuous grazing
Early 1900’s: 2 to 5 pastures - - deferment or rest period important
1950’s: Voison (France) - Pasture rotations
1960-1970’s: Savory (South Africa) – Short duration grazing (SDG) (Holistic approach)
1980’s: Gerrish – Management intensive grazing (MIG)
2000’s: Ultra-high stock density grazing, mob grazing, regenerative grazing

Timing of Grazing
Pasture
East 1
East 2
East 3
East 4
North 1
North 2
North 3
North 4
South Ridge
Home Valley
Meadow
West Valley
West Hill
Bull Trap
Past. 15
Seasonal Distribution of Grazing
Jan Feb Mar Apr May Jun Jul Aug Sep Oct Nov Dec
Jan Feb Mar Apr May Jun Jul Aug Sep Oct Nov Dec

800
600
400
200
0Apr May Jun Jul Aug Sep Oct
Herbage (lb/ac)
Needleandthread
SandBluestem
Blue Grama
PrairieSandreed
LittleBluestem
(modified from Reece et al. 2007)
Growth of important Sandhills forage grasses

Growth of important western Nebraska forage grasses

Jun Jul Aug Oct
Mid-month, Five-day Grazing Periods
0
20
40
60
80
100
120
Energ
y R
eserv
es (
%)
Prairie SandreedPrairie Sandreed
62% 65%
83%
100%
Prairie Sandreed
62%
100%
83%
65%
From: Reece et al.

Prairie Sandreed: Root mass compared to ungrazed control
June
95%
84%
78%
77%
August
73%
57%
63%
11-20"
21-30"
31-40"
0-10"
Soil Depth
74%
62%
46%
50%
JuneAugust
93%
From: Reece et al.

The level and date of grazing beyond which preferred (key) plant species cannot recover before pastures are grazed in a subsequent year.
Overgrazing

• Heavily graze preferred (key) grass species during rapid growth windows in consecutive years.
• Combine grazing stress with drought stress.
How to Best Overgraze?

General Classification
of Grazing Systems

• Easiest to manage – only decide how many head for how long.
• May have less than desirable grazing distribution
• Risk of range damage in preferred areas.• Cattle performance is very good with
proper stocking rate.
Season-long Continuous
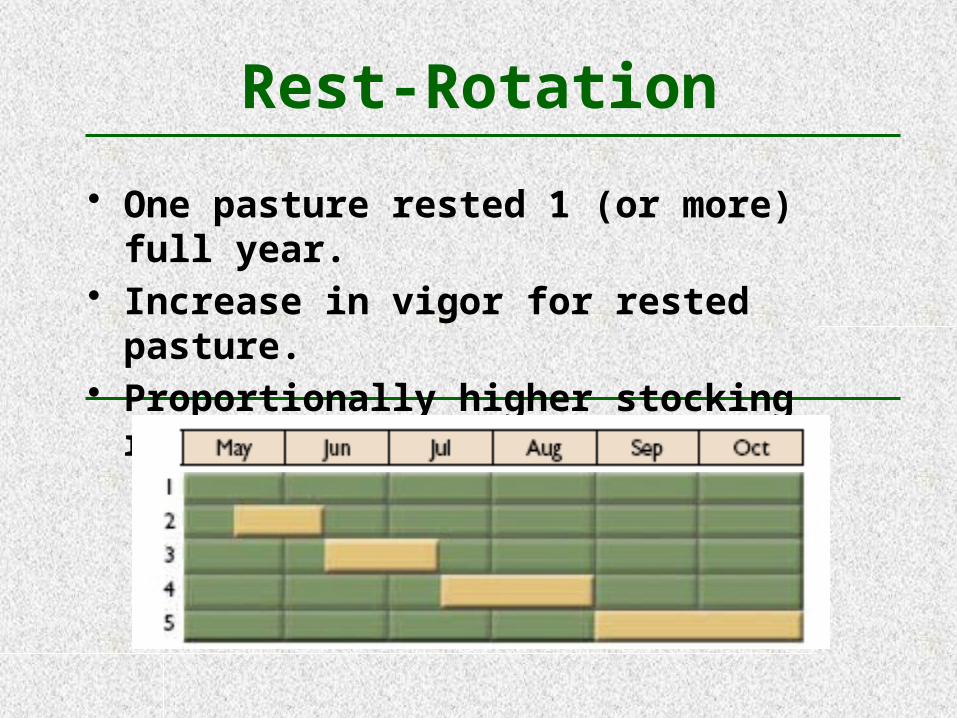
• One pasture rested 1 (or more) full year.• Increase in vigor for rested pasture.• Proportionally higher stocking rate on
other pastures.
Rest-Rotation

• Each pasture grazed 1 time per year.• Increase in vigor for late-spring and early
summer deferred pastures.• Well suited for range grasses that benefit
from seasonal rotation in grazing.
Deferred-Rotation

• Each pasture grazed 1 or more times/year.• Inputs for fence and water developments.• Plans can include significant flexibility
(use dates, stocking and grazing of specific pastures, etc.).
Intensively Managed(Short Duration)
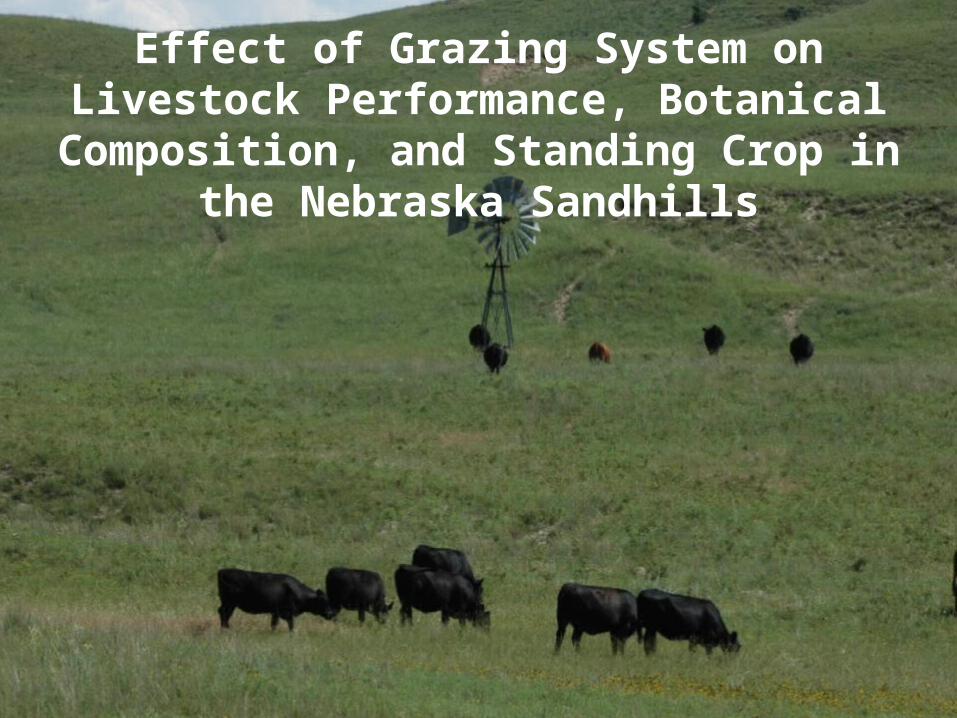
Effect of Grazing System on Livestock Performance, Botanical Composition, and Standing Crop in the Nebraska Sandhills

Grazing SystemsGrazing Season: May 15 – Oct 15Stocking rate: 0.75 AUM/acre, pairsYears: 1999-2008
• Deferred rotation– 4 pastures– 1 occupation/year
• Short duration grazing– 8 pastures– 3 occupations/year

Grazing Treatments
Pasture May June July August September October
1
2
3
4
5
6
7
8
Pasture May June July August September October
1
2
3
4
SDG
DR

2006 2007 20080
0.5
1
1.5
2
2.5
DRSDG
Av
era
ge
Da
ily
Ga
in (
lbs
)
Daily gain of spayed heifers in 4-pasture deferred-rotation (DR) and 8-pasture short duration grazing (SDG) systems.
No difference between grazing systems or years. (avg. 1.85 lb/d)

Total Herbage Standing Crop in mid-August
2000 2001 2002 2003 2004 2005 2006 2007 20080
500
1000
1500
2000
2500
DRSDG
Her
bag
e P
rod
ctio
n (
lbs/
ac)
*
*
* Significant difference between grazing systems (P < 0.1)

Conclusion - Grazing Systems
• Short duration grazing:– Did not have greater daily weight gains of
heifers than the DR grazing system– Did not increase the composition of high seral
stage grass species as well as a DR grazing system
– Did not produce greater amounts of standing crop than the DR grazing system

Conclusion - Grazing Systems
• SDG systems will not produce superior benefits to livestock and rangelands that are in good to excellent condition when compared to a DR system at recommended stocking rates in the Sandhills
• The multiple grazing periods of SDG do not provide the reported benefits on upland Sandhills range.
• Well suited for pasture with good water availability and longer growing seasons

Rotational Grazing on Sandhills Uplands
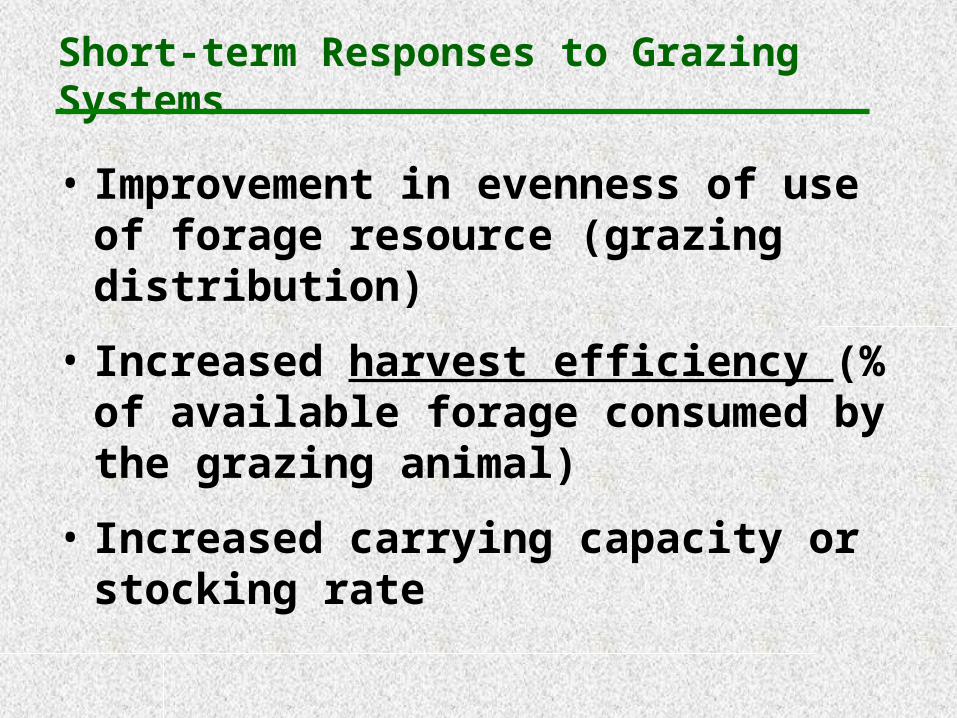
Short-term Responses to Grazing Systems
• Improvement in evenness of use of forage resource (grazing distribution)
• Increased harvest efficiency (% of available forage consumed by the grazing animal)
• Increased carrying capacity or stocking rate

Methods of Improving Grazing Distribution
- Fencing along Ecological Site Boundaries
- Placement of Livestock Water
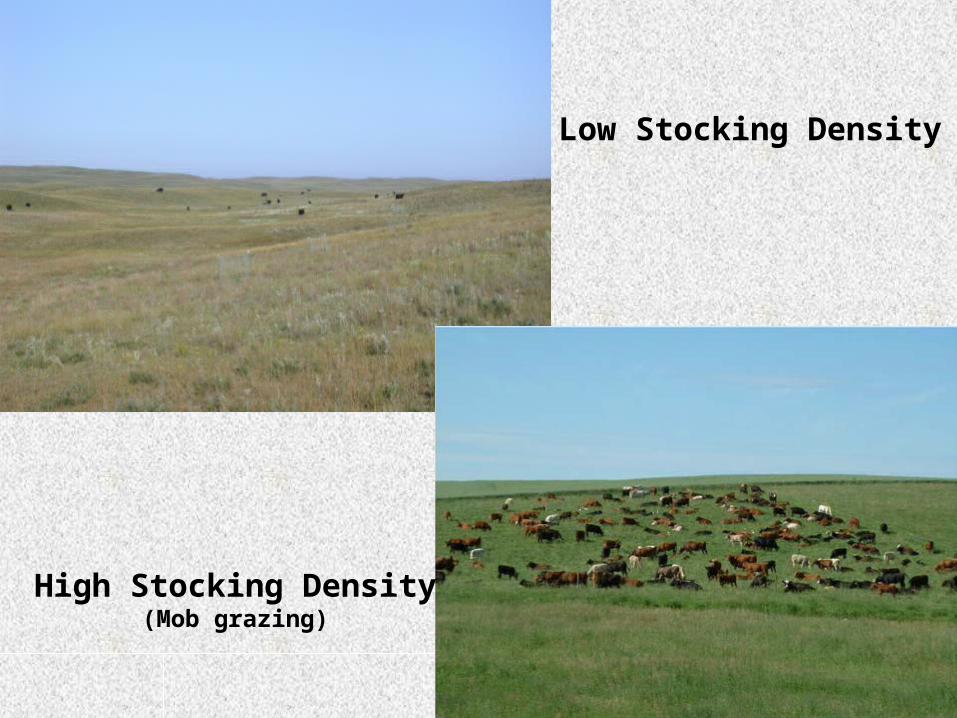
Low Stocking Density
High Stocking Density(Mob grazing)

(0.15 AU/ac)
Stocking Density

Upland Range Grazing Systems Study
Treatments
Stocking rate
(AUM/acre)
Stocking density
(AU/acre)
Grazing days/
season
Continuous grazing –moderate 0.75 0.15 150
Continuous grazing –heavy 1.13 0.23 150
4-pasture DR – moderate 0.75 0.60 37
4-pasture DR – heavy 1.13 0.90 37
50-pasture rotation – moderate 0.75 7.50 3
50-pasture rotation – heavy 1.13 11.25 3
Control (non-grazed) - - - - - -
DR = deferred-rotationHeavy stocking rate is 1.5X moderate stocking rate


Objectives - Measurements Plant community composition
Net primary production – above and below ground
Soil respiration and soil carbon properties
Grazing distribution

Residual Vegetation HeightGrazing System x Topographic Position
DT ID NS SS0
2
4
6
8
10
12
14
16Continuous 4-Pasture 50-Pasture
Topographic Position
Res
idu
al v
eget
atio
n h
eig
ht
(cm
)

Meadow Grazing Systems Study
Treatments
Stocking rate
(AUM/acre)
Stocking density
(AU/acre)
Grazing days/
season
4-pasture rotation (twice-over in 90 days) 3.3 0.60 22
4-pasture rotation (once in 60 days) 3.3 0.90 15
Mob grazing (120 paddocks) 3.3 200 0.5
Control (non-grazed) - - - - - -
Haying - - - - - -
- - - - - - - - - - - - - - - - - - - - - - - - 0.6 AU/acre = 600 lb/acre0.9 AU/acre = 900 lb/acre200 AU/acre = 200,000 lb/acre

Mob Grazing – Subirrigated Meadow200,000 lb beef/acre (200 AU/acre) (285 yearlings/acre)

• Animal performance• Species composition• Herbage production• Forage utilization• Harvest efficiency• Soil microbial
biomass• Soil carbon & nutrient
status• Litter decomposition• Root growth
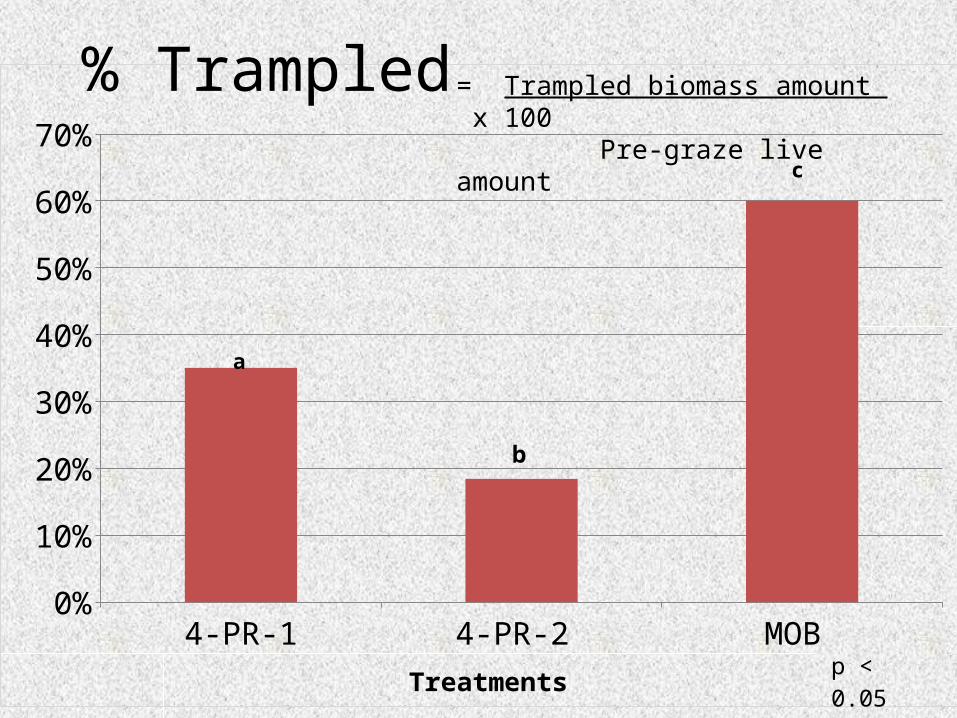
4-PR-1 4-PR-2 MOB 0%
10%
20%
30%
40%
50%
60%
70%
Treatments
b
p < 0.05
% Trampled
a
c
= Trampled biomass amount x 100 Pre-graze live amount

= Pre-graze live - (Post graze live + Trampled biomass) x 100 Pre-graze live
4-PR-1 4-PR-2 MOB 0%
10%
20%
30%
40%
50%
60%
Treatments
aa
b
p < 0.05
Harvest Efficiency

Thank You