Embed Size (px)
Citation preview

TEMPORAL AND SPATIAL TRENDS IN SEA TURTLE STRANDING AND NESTING IN VOLUSIA COUNTY, FLORIDA (1989-2012)
A PAPERSUBMITTED FOR SENIOR RESEARCH
FOR THE COLLEGE OF ARTS AND SCIENCESSTETSON UNIVERSITY
BY
Jennifer L. Cherry
IN PARTIAL FULFILLMENT OF THE REQUIREMENTSFOR THE DEGREES OF
BACHELOR OF SCIENCE AQUATIC AND MARINE BIOLOGY
AND
BACHELOR OF SCIENCE ENVIRONMENTAL SCIENCE AND GEOGRAPHY
ADVISOR
Dr. John Jett, Ph.D.
MAY 2015

Abstract
Temporal and spatial trends in sea turtle stranding and nesting in Volusia County, Florida (1989-2012)
Jennifer Cherry and Dr. John Jett (Stetson University, DeLand, Florida, USA)
As a conservation tool, stranding data can be a useful source of information on sea turtle
mortality trends and population dynamics. We investigated the relationships and predictors of
temporal and spatial trends in sea turtle stranding and nesting in Florida from 1989-2012. During
this period, a combined 30,462 sea turtles were documented as stranded (M=1,234.43/year;
SD=446.10) in Florida. Of these years, 2010 represented the highest number of strandings
(2,148), while the lowest numbers of strandings (566) were recorded in 1986. A strong positive
linear trend in total strandings over the years evaluated was established. Additionally, when
evaluated at the county-specific level, both the human population of Volusia County and the total
number of Florida strandings were significant predictors of strandings within the county,
although mean ocean temperature anomalies failed to predict strandings in either the state as a
whole or in Volusia County specifically. In Volusia County, total nestings and strandings were
dominated by Loggerhead (Caretta caretta) and Green Sea turtles (Chelonia mydas). Results of
the study generally demonstrate that while sea turtle strandings in Volusia County have risen
over the years evaluated, it appears that aggressive nest protection by the County has proven
successful in simultaneously increasing the number of nests.
Introduction
Sea turtles are marine reptiles that belong to the superfamily of Chelonioidea and inhabit
all of the worlds’ oceans except the Arctic. The seven living species of sea turtles include
flatback, green, hawksbill, Kemp’s ridley, leatherback, loggerhead and olive ridley (Karl et al.
1999). Marine turtle species play key roles in the ocean, beach, and dune ecosystems. For
1

example, while at sea, sea turtles act as grazers of sea grass agglomerations on the ocean floor
which helps to maintain healthy seagrass densities (Cousteau 2006). Without healthy sea grass
beds, many marine species would be depleted, potentially to the extent of being endangered,
threatened, or extinct (Karl et al. 1999). Marine organisms on lower trophic levels often rely
heavily on sea grass presence since these areas provide developmental and breeding grounds for
large groups of fish, shellfish, and crustaceans (Cousteau 2006).
Female sea turtles utilize beach and lower dune regions to nest and lay their eggs. On
average, a female will lay about 100 eggs and make between 3-7 nests during the summer
nesting season (Spotila 2004). However, beach and dune habitats are fragile ecosystems which
depend on vegetation as a means of protection from erosion and other potential problems.
Demonstrating the importance of these ecosystems to sea turtles, a typical 20-mile stretch of
beach on Florida’s east coast will contain about 150,000 pounds of buried eggs during one
nesting season (Cousteau 2006). Sea turtle nesting activities are considered important to the
growth and resiliency of dune vegetation by imparting nutrients to an otherwise nutrient-poor
environment (Hannan et al. 2007).
Over the past few decades the status of sea turtles and ocean health in general, has gained
the attention of the public, government agencies, and non-governmental agencies (Raustiala
1997; Wright and Mohanty 2006; Campbell 2007). The growing body of peer-reviewed literature
has equally reflected the increase in sea turtle research. Although sea turtles are generally well-
studied, management strategy has been hindered by limited knowledge related to turtle biology,
human-turtle interactions, turtle population status, and environmental threats (Bjorndal 1999;
Amorocho 2002). Confounding the limited knowledge, rapidly rising human populations near
coastal areas have resulted in negative impacts to the land-ocean interface. Additionally, ocean-
2

based anthropogenic activities such as crab trawling, fish harvesting, pleasure boating and other
have further challenged sea turtle survival (Green and Short 2003; Halpern et al. 2008; Waycott
et al. 2009). With the ecological integrity of many marine ecosystems under human-induced
pressure, and at least half of the oceans suffering from human-induced impacts (Halpern et al.
2008), there is an increasing need to better understand the challenges. This need is especially
important in coastal environments experiencing apparent degradation as a result of rising human
population.
Furthermore, climate change is of growing concern for both marine and coastal species. It
is believed that global mean ocean temperatures have increased approximately 0.7 degrees
Celsius (Hoegh- Guldberg et al. 2007). With the increasing atmospheric temperatures, about
80% of this heat will ultimately be absorbed by the oceans, which will begin to alter the chemical
composition of the water and alter foraging grounds and overall water quality for sea turtles
(Solomon et al. 2007). Temperature is of great importance to not only adult nesting sea turtles
due to varying onsets of reproduction and available foraging grounds, but also to clutch sex
ratios and overall nest success during incubation (Spotila 2004). Sea level rise accompanying a
warming climate also makes nesting beaches unavailable for sea turtles, especially in the low
lying areas and island beaches (Baker et al. 2006).
Owing to the challenges of degraded coastal environments, five of the seven species of
sea turtles are listed on the International Union for Conservation of Nature (IUCN) Red List of
Endangered Species as either "Endangered" or "Critically Endangered" (IUCN 2012). Globally,
the Kemp's ridley, hawksbill, and leatherback sea turtles are listed as "Critically Endangered,”
the loggerhead and green as "Endangered,” and the olive ridley as "Vulnerable.” Although recent
research suggests that sea turtle clutch sizes appear to be appropriate for each species; on
3

average, only about one out of the 100 plus eggs will actually survive until adulthood (Wright
2010). Like other marine species, marine turtles experience natural depredation from sharks,
raccoons, seagulls, and foxes, as well as a loss of nesting habitat due to coastal development, and
anthropogenic chemical and pathogenic contamination (Keller et al. 2006).
Sea turtle nesting habitat is often situated on prime, beach-front real estate. Because of
the financial value of the habitat, vertical seawall, sloping rock revetments, bulkheads, soil
retaining walls, and sandbags are often installed as a means of stabilizing beach areas.
Unfortunately these measures also impact sea ability to access the preferred nesting areas in the
upper regions of the beach and dune ecosystem. Given these limitations on available beach
nesting habitat, turtles are often forced to nest in the sub-optimal nesting regions causing the
nests to be more susceptible to tidal inundation and other nesting challenges (Mosier and
Witherington 2002). For example, research has shown that fewer sea turtles emerge onto beaches
with seawalls when compared to natural beaches. When nesting female sea turtles are startled
while on the ascent onto the nesting beach or is unable to find optimal or familiar nesting
grounds nesting females will often return to the ocean without depositing their eggs (referred to
as a false crawl). Increases in human populations near nesting habitat have corresponded with an
increase in the number of false crawls (Spotila 2004). Marine turtles rely heavily on near-shore
habitats for critical foraging and early development (Morreale and Standora 2005), and they may
be especially sensitive to alterations in these beach habitats due to their delayed maturation and
longevity compared to other species (NMFS 1998). Ten to fifty years after hatching (depending
on the species), adult sea turtles reach sexual maturity and are able to mate (Spotila 2004).
Like other man-made modifications to turtle nesting habitat, beach renourishment is a
process that is utilized along many coasts in the United States, especially in Florida to combat
4

beach erosion. In this process, sand is pumped, trucked, or deposited from various locations and
is deposited onto the beach to replace the sand that has naturally eroded away. Since the sand
usually deposited is often different in its composition from that of the native beach, overall turtle
nest-site location, digging behavior, incubation, temperature and moisture of the nests can be
impacted (Spotlia 2004).
Due to the many challenges faced by sea turtles, the Florida Sea Turtle Stranding and
Salvage Network (FSTSSN) were developed to classify stranding cases. A stranding is classified
as any dead sea turtle that is found floating or washed ashore. Strandings also include live turtles
that are found with potentially life-threatening problems such as being sick, injured, or
entangled. The location of the stranding when first reported appears in the database, yet this may
or may not have been the location at the time of death. Although a robust database, the FSTSSN
fails to include strandings of sea turtles that were not identified at the species level, strandings
where a latitude and longitude could not be determined, and strandings of captive-reared turtles.
Turtles that are known to be captured incidental to some activity (i.e., commercial fisheries,
research projects, power plant operations, etc.) are also excluded from the database. Sea Turtle
Stranding and Salvage Network observers include both professional sea turtle biologists and
volunteers with no prior data-collection training. As a condition of the Endangered Species Act,
individuals conducting work with the FSTSSN must first gain adequate experience in the
standardized data-collection methodology of the FSTSSN before being permitted to participate
(Foley et al. 2005).
Stranding data can be a useful supplementary source of information on mortality trends
and for helping to understand the health status of recovering marine populations (Kreuder et al.
2003). However, stranding data are often overlooked as a source of wildlife demographics
5

because of difficulty distinguishing the cause and source of the stranding (Caillouet et al. 1996).
First, not all turtles that die are discovered, reported, and documented by the FSTSSN, as at least
some dead turtles fail to wash ashore. Of those that do wash ashore, some may become hidden in
mangroves or other vegetation, while some that strand on the beaches may still go unreported.
Thus, data present for sea turtles only represents a subset of all deceased turtles and decreases or
increases in stranding numbers may not be due to decreases or increases in mortality rates. The
data may also reflect the fact that while turtles may strand on beaches adjacent to well-used, in-
water habitats, carcasses and debilitated turtles often drift, causing them to be reported as
strandings in areas where they do not normally occur (Fish and Wildlife Research Institute)
(FWRI) 2009).
In 1995, two concerned citizens of Volusia County, by the names of Reynolds and
Alexander filed suit on behalf of the loggerhead sea turtle, the prominent sea turtle species
nesting on Volusia County beaches because they felt as if the county was not using all resources
to protect this species. The lawsuit was entitled, Loggerhead Turtle v. County Council of Volusia
County, Florida, 896 F. Supp. 1170 (M.D. Fla. 1995). This lawsuit was one of the huge catalyze
movements for the conservation measures that are now utilized in Volusia County to protect the
sea turtle species that use our beaches. It allowed the county to realize that changes needed to be
made, thus resources and conservation measures have been implemented to better protect the sea
turtle species. For instance, solutions to the artificial lighting issues along the coasts were
developed. Businesses and homeowners can reduce the amount of artificial light that is visible
from nesting beaches to ultimately reduce the amount of light pollution affecting the sea turtles.
Lighting ordinances can be implemented that influence the lighting procedure on the coastlines.
Volusia County developed a Beach Lighting Management Plan and is working with oceanfront
6

property owners to reduce lighting problems along our beaches to reduce the amount of sea turtle
disorientations. The county has educated the public about Turtle Safe Lighting which consist of
the use of red lights, since a very narrow portion of visible light spectrum is emitted, thus less
intrusive to both adult sea turtles and hatchlings. Lighting issues are unfortunately not the only
obstacle sea turtles are faced with once they reach the shore, but this was one of the main focuses
of the issues involving the lawsuit.
In order for the Habitat Conservation Plan (HCP) in Volusia County to be successful,
several volunteer groups were organized to ensure that the lighting ordinances, beach driving,
and overall nest protection for the sea turtles are being followed appropriately. The Volusia
Turtle Patrol organized under Beth Libert and New Smyrna Turtle Trackers were both developed
under the Volusia County Environmental Management Department. These volunteer groups
perform daily sea turtle surveys, respond to sea turtle strandings, participate in the Washback
Watcher program, and ensure that lighting ordinances along the coastline are being followed,
along with beach driving regulations. During sea turtle nesting season, the beaches are not open
to public driving until every drivable mile has been inspected by specially trained and permitted
sea turtle monitoring teams. In the mornings the sea turtle survey groups scope out any deep ruts
or holes and report them appropriately and smooth them over, especially in the zones near
already nested locations. Leaving beach furniture and recreational equipment of any sort on the
beach is also illegal. Once again, the morning sea turtle survey group scopes out beach furniture
and tags it appropriately as a warning and if not removed by the next day it is confiscated. To
ensure that all of the residents and visitors of the coast are aware of the ordinances in place for
beach driving, beach furniture, and other perils that may affect sea turtles, the county disrupts
educational material appropriately.
7
Throughout the years the sea turtle species along the Volusia County coastlines have
been utilizing our beaches for nesting purposes. Over time, the perils that the sea turtles, both
nesting females and hatchlings experience have only increased and become more detrimental to
their overall survival as a species, solely because of the impacts from humans. With the constant
development along the coasts, increasing popularity of the convenient beach driving, and
presence of artificial lighting in illuminate the “prime” real estate properties, sea turtles have
become a species that enters the battlefield when attempting to fulfill their natural processes.
Essentially it has become humans’ responsibility to ensure that these perils are reduced or
eliminated to allow the original users of the land to not have to endure unnecessary obstacles.
The main purpose of this study was to analyze sea turtle stranding data to better
understand how stranding may be related to human population, Atlantic Ocean temperature
anomalies and nesting behavior in Volusia County, Florida. As the state’s human population has
grown consistently through time, it is logical that coastal counties where turtles nest have also
experienced population growth. Human population statistics for coastal counties were not
evaluated directly; instead, overall state and Volusia County population data, through time, was
used as a proxy for coastal county growth. Analyses include both an evaluation of overall and
species-specific stranding.
Our hypotheses were H1: Overall sea turtle stranding and nesting is related to human
population growth, H2: Species- specific sea turtle stranding is related to human population, H3:
Overall sea turtle stranding and nesting is related to temperature anomaly, H4: Species- specific
sea turtle stranding and nesting is related to temperature anomaly, H5: Overall sea turtle stranding
is related to nesting H6: Species- specific sea turtle stranding is related to nesting.
8

Methods
To evaluate how human population change over time influences sea turtle standings
along the coastal habitats in Volusia County, Florida, we analyzed FTSSN data. Data contained
in the stranding database included: sea turtle species, geographic location of the stranding site
(latitude and longitude), county location, month, day, and year of the stranding, carapace length,
carapace width, standing anomaly (falling under the category of caught on hook and line,
entangled in fishing line, apparent propeller wounds, probable boat strike, papilloma-like
growths noted, tar and / or oil on turtle, entangled in crab/lobster pot trap line, no apparent
anomalies (that may in any way explain why the turtle died), and the status of the sea turtle
(alive, freshly dead, moderately decomposed, severely decomposed, dried carcass, and skeletal
remains). Data contained within the FTSSN captures information in the state of Florida from
1989-2012. Data was organized by extracting variables associated with each year of the data
(1989-2012) from the ArcGIS attribute table and transferring into an Excel spreadsheet. Nesting
values for Volusia County were obtained from the Volusia County Environmental Management
Department for the nesting years of 1989-2012. These values were obtained from the daily sea
turtle surveys that took place during the sea turtle season of May 1st- October 31st. Additionally,
since one of our research questions was whether sea turtle stranding is a function of human
population growth, population data of Florida from the time frame of 1989-2012 was obtained
from the U.S. Census website with specific data obtained for Volusia County.
In Excel, “year” had its own worksheet where the corresponding information was
present: location found (county and latitude and longitude), the stranding anomaly and the year
in which the stranding occurred. Once the data was organized by year we determined how the
state’s and Volusia County human population has changed during the same year using data
9
obtained from the U.S. Census website. We then determined whether human population growth
functions as a predictor of total and species-specific sea turtle stranding. We used linear
regression to evaluate time (year) and calculated the percent change of strandings for year, and
we summarized the total number of strandings for each species, including a percent change
summary on a species-specific basis. The percentage of total strandings was calculated by taking
the Volusia County strandings and dividing it by the Florida strandings, then multiplying by 100
to receive a percentage for each individual year. Ocean temperature anomaly (East Coast of
Florida) was obtained from the National Oceanic and Atmospheric Administration (NOAA) -
Office of Satellite and Product Operations. Linear regression was employed to examine the
influence of Volusia County’s human population on species-specific and overall strandings and
the influence of temperature anomaly on overall and species-specific stranding. We obtained the
stranding data from the eastern coastal Florida counties of Volusia, Brevard, Indian River, St.
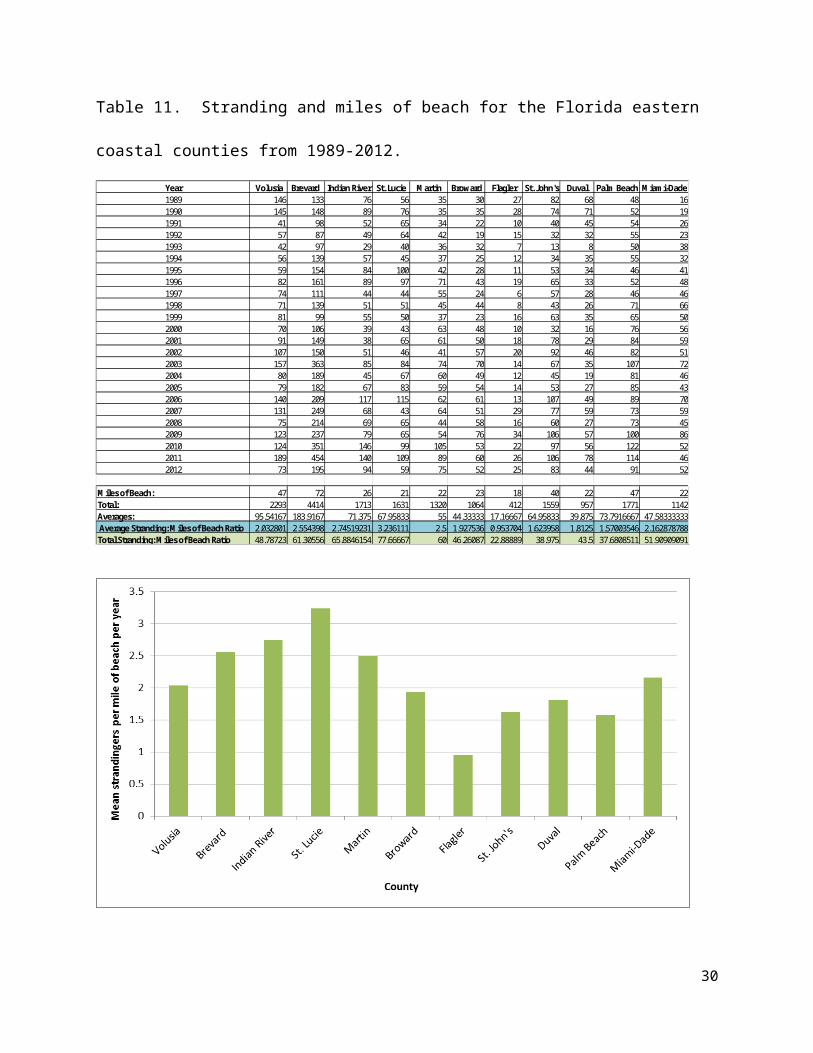
Lucie, Martin, Broward, Flagler, St. John's, Duval, Palm Beach, and Miami-Dade. We also
found the miles of beach in each of these stated counties. We standardized average stranding per
year per mile of beach for each of the counties (Table 11). The relationship between overall and
species-specific nesting and stranding was examined via Pearson r correlation. Additionally,
summary statistics and linear trend lines were used to summarize the total number of strandings
for each species.
Results
Overall Florida and Volusia County Sea Turtle Stranding
Based on stranding data from 1989-2012, a combined 30,462 sea turtles were
documented as stranded (M=1,234.43; SD=446.10) in Florida (Table 1). Of these years, 2010
represented the highest number of stranding (2,148), while the lowest numbers of stranding (566)
10

were recorded in 1986. The five highest yearly stranding totals have occurred since 2003, with
the two highest yearly stranding totals occurring in 2011 (2,052) and 2010 (2,148). The five
lowest yearly stranding totals occurred 1994 (753) and earlier, with the two lowest yearly
stranding occurring in 1993 (619) and 1986 (566). Figure 1 demonstrates a strong positive linear
trend in total stranding over the years evaluated (y=53.38 + 459.96; R2=.97).
Stranding data specific to Volusia County from 1989-2012 demonstrates that 2,174 sea
turtles were documented as stranded (M=90.58; SD=40.70) (Table 1). Of these years, the
highest numbers of strandings (185) were recorded in 2011, while the lowest numbers of
strandings were recorded in 2001 (21). Three of the five years demonstrating the highest yearly
strandings have occurred since 2003. Four of the five years demonstrating the lowest number of
yearly stranding totals have occurred in 1994 (55) and earlier, with the second lowest year for
stranding occurring in 1991 (41). Figure 1 shows a positive linear trend in total Volusia County
strandings over the years evaluated (y=1.87x+67.13; R2=.11).
Table 1. Represents the total sea turtle strandings for the state of Florida and Volusia County from 1989-2012. The higher percentages indicate a larger portion of strandings were taking place in Volusia County when looking at Florida as a whole for each year.
11

Year Florida Strandings Volusia County Strandings Percentage of Total Strandings1989 1114 145 13.021990 1054 145 13.761991 710 41 5.771992 695 57 8.21993 619 42 6.791994 753 55 7.31995 993 59 5.941996 1238 81 6.541997 933 74 7.931998 987 69 6.991999 953 81 8.52000 1186 70 5.92001 1359 21 1.552002 1284 107 8.332003 1792 142 7.922004 1163 77 6.622005 1541 80 5.192006 1901 130 6.842007 1522 129 8.482008 1289 73 5.662009 1713 120 7.012010 2148 122 5.682011 2052 185 9.022012 1463 69 4.72Total 30462 2174 N/AMean 1269.25 90.58333333 N/A
Figure 1. Total sea turtle strandings in Florida and Volusia County from 1989-2012. Dashed line represents stranding data for Volusia County; solid line represents the state of Florida. Linear trends are depicted as solid lines. Note that the y-axis on the right depicts the percentage of strandings in Volusia County relative to the entire state of Florida.
12

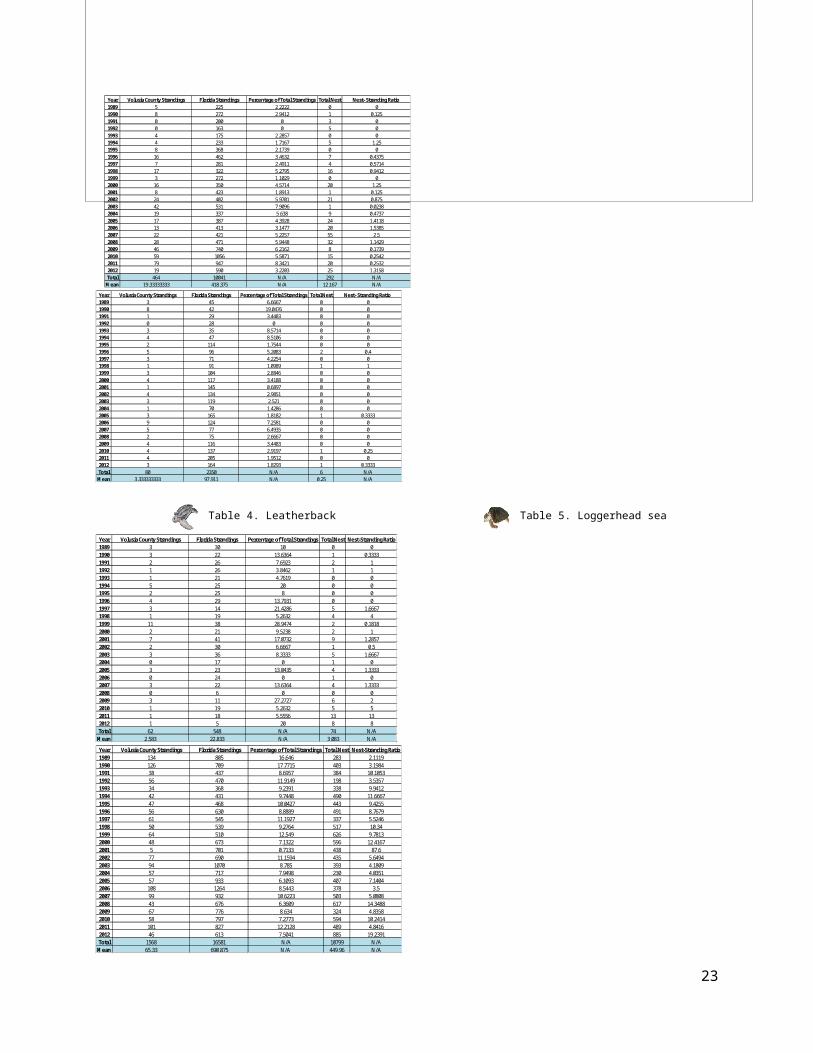
Volusia County species-specific sea turtle stranding and nesting
The total green sea turtle strandings and total nests for the state of Florida and Volusia
County from 1989-2012 is represented in (Table 2). Volusia County’s trend line of green sea
turtle strandings presented an R2 value of 0.5336, and the percentage of total strandings had an R
2 value of 0.4831 (Figure 2) compared to the Florida linear trend with an R2 value of 0.6108.
Kemp’s Ridley sea turtle total stranding and total nests for Volusia County, Florida from 1989-
2012 is represented by (Table 3). Volusia County’s linear trend presented an R2value of 0.0193,
and the percentage of total stranding had an R2 value of 0.1636 (Figure 3) compared to the
Florida linear trend with an R2value of 0.569. Leatherback sea turtle total stranding and total
nests for Volusia County, Florida from 1989-2012 is represented by (Table 4). Volusia County’s
linear trend presented an R2 value of 0.0507, and the percentage of total stranding had an R2
value of 0.0001 (Figure 4) compared to the Florida linear trend with an R2value of 0.1939.
Loggerhead sea turtle total stranding and total nests for Volusia County, Florida from 1989-2012
is represented by (Table 5). Volusia County’s linear trend of loggerhead sea turtle strandings
presented an R2 value of 0.006, and the percentage of total stranding had an R2 value of 0.2183
(Figure 5) compared to the Florida linear trend with an R2 value of 0.282.
13

Figure 2 (Leatherback); 3 (Kemp’s Ridley); 4 (Green); (Loggerhead) stranding and nesting in Volusia County, Florida 1989-2012.
Table 2-5. Represents the total Green sea turtle, Kemp’s Ridley, Leatherback, and Loggerhead strandings for the state of Florida and Volusia County from 1989-2012.
Year Volusia County Strandings Florida Strandings Percentage of Total Strandings Total Nest Nest- Stranding Ratio 1989 5 225 2.2222 0 01990 8 272 2.9412 1 0.1251991 0 200 0 3 01992 0 163 0 5 01993 4 175 2.2857 0 01994 4 233 1.7167 5 1.251995 8 368 2.1739 0 01996 16 462 3.4632 7 0.43751997 7 281 2.4911 4 0.57141998 17 322 5.2795 16 0.94121999 3 272 1.1029 0 02000 16 350 4.5714 20 1.252001 8 423 1.8913 1 0.1252002 24 402 5.9701 21 0.8752003 42 531 7.9096 1 0.02382004 19 337 5.638 9 0.47372005 17 387 4.3928 24 1.41182006 13 413 3.1477 20 1.53852007 22 421 5.2257 55 2.52008 28 471 5.9448 32 1.14292009 46 740 6.2162 8 0.17392010 59 1056 5.5871 15 0.25422011 79 947 8.3421 20 0.25322012 19 590 3.2203 25 1.3158Total 464 10041 N/A 292 N/A
Mean 19.33333333 418.375 N/A 12.167 N/A
Year Volusia County Strandings Florida Strandings Percentage of Total Strandings Total Nest Nest- Stranding Ratio 1989 3 45 6.6667 0 01990 8 42 19.0476 0 01991 1 29 3.4483 0 01992 0 28 0 0 01993 3 35 8.5714 0 01994 4 47 8.5106 0 01995 2 114 1.7544 0 01996 5 96 5.2083 2 0.41997 3 71 4.2254 0 01998 1 91 1.0989 1 11999 3 104 2.8846 0 02000 4 117 3.4188 0 02001 1 145 0.6897 0 02002 4 134 2.9851 0 02003 3 119 2.521 0 02004 1 70 1.4286 0 02005 3 165 1.8182 1 0.33332006 9 124 7.2581 0 02007 5 77 6.4935 0 02008 2 75 2.6667 0 02009 4 116 3.4483 0 02010 4 137 2.9197 1 0.252011 4 205 1.9512 0 02012 3 164 1.8293 1 0.3333Total 80 2350 N/A 6 N/AMean 3.333333333 97.911 N/A 0.25 N/A
Year Volusia County Strandings Florida Strandings Percentage of Total Strandings Total Nest Nest-Stranding Ratio1989 3 30 10 0 01990 3 22 13.6364 1 0.33331991 2 26 7.6923 2 11992 1 26 3.8462 1 11993 1 21 4.7619 0 01994 5 25 20 0 01995 2 25 8 0 01996 4 29 13.7931 0 01997 3 14 21.4286 5 1.66671998 1 19 5.2632 4 41999 11 38 28.9474 2 0.18182000 2 21 9.5238 2 12001 7 41 17.0732 9 1.28572002 2 30 6.6667 1 0.52003 3 36 8.3333 5 1.66672004 0 17 0 1 02005 3 23 13.0435 4 1.33332006 0 24 0 1 02007 3 22 13.6364 4 1.33332008 0 6 0 0 02009 3 11 27.2727 6 22010 1 19 5.2632 5 52011 1 18 5.5556 13 132012 1 5 20 8 8Total 62 548 N/A 74 N/A
Mean 2.583 22.833 N/A 3.083 N/A
Year Volusia County Strandings Florida Strandings Percentage of Total Strandings Total Nest Nest-Stranding Ratio1989 134 805 16.646 283 2.11191990 126 709 17.7715 403 3.19841991 38 437 8.6957 384 10.10531992 56 470 11.9149 198 3.53571993 34 368 9.2391 338 9.94121994 42 431 9.7448 490 11.66671995 47 468 10.0427 443 9.42551996 56 630 8.8889 491 8.76791997 61 545 11.1927 337 5.52461998 50 539 9.2764 517 10.341999 64 510 12.549 626 9.78132000 48 673 7.1322 596 12.41672001 5 701 0.7133 438 87.62002 77 690 11.1594 435 5.64942003 94 1070 8.785 393 4.18092004 57 717 7.9498 230 4.03512005 57 933 6.1093 407 7.14042006 108 1264 8.5443 378 3.52007 99 932 10.6223 503 5.08082008 43 676 6.3609 617 14.34882009 67 776 8.634 324 4.83582010 58 797 7.2773 594 10.24142011 101 827 12.2128 489 4.84162012 46 613 7.5041 885 19.2391Total 1568 16581 N/A 10799 N/A
Mean 65.33 690.875 N/A 449.96 N/A
14
Table 2. Green sea turtle Table 3. Kemp’s Ridley sea turtle
Table 4. Leatherback sea turtle Table 5. Loggerhead sea turtle

Sea Temperature Anomaly (East Coast): Stranding and Nesting Volusia County
The five highest yearly temperature anomalies have occurred since 2004; the two highest
yearly temperature anomalies occurred in 2005 (0.51 °C) and 2006 (0.49 °C). While temperature
anomalies from 1989-2012 were found to be significantly correlated with year (r=0.87; p<.000),
anomalies were insignificantly correlated with overall nesting in Volusia (r=0.39) and
insignificant correlation with overall stranding in Volusia county (r=0.30). Mean temperature
anomaly through time in Volusia County demonstrated a positive linear trend (y=0.02x+0.02;
R²=0.76).
Table 6. Mean temperature anomalies (°C) on the East Coast of Florida from 1989-2012.
Year Mean Temperature Anomaly for Year (deg C)1989 0.01281990 0.04881991 0.12881992 0.09281993 0.09381994 0.01981995 0.12951996 0.26151997 0.12351998 0.25631999 0.32332000 0.29932001 0.2352002 0.34682003 0.322004 0.46682005 0.50952006 0.49732007 0.46382008 0.43452009 0.2792010 0.43632011 0.46382012 0.3783
Mean 0.2759
15

Figure 6. Mean temperature anomaly (°C), total nesting, and total strandings in Volusia County from 1989-2012
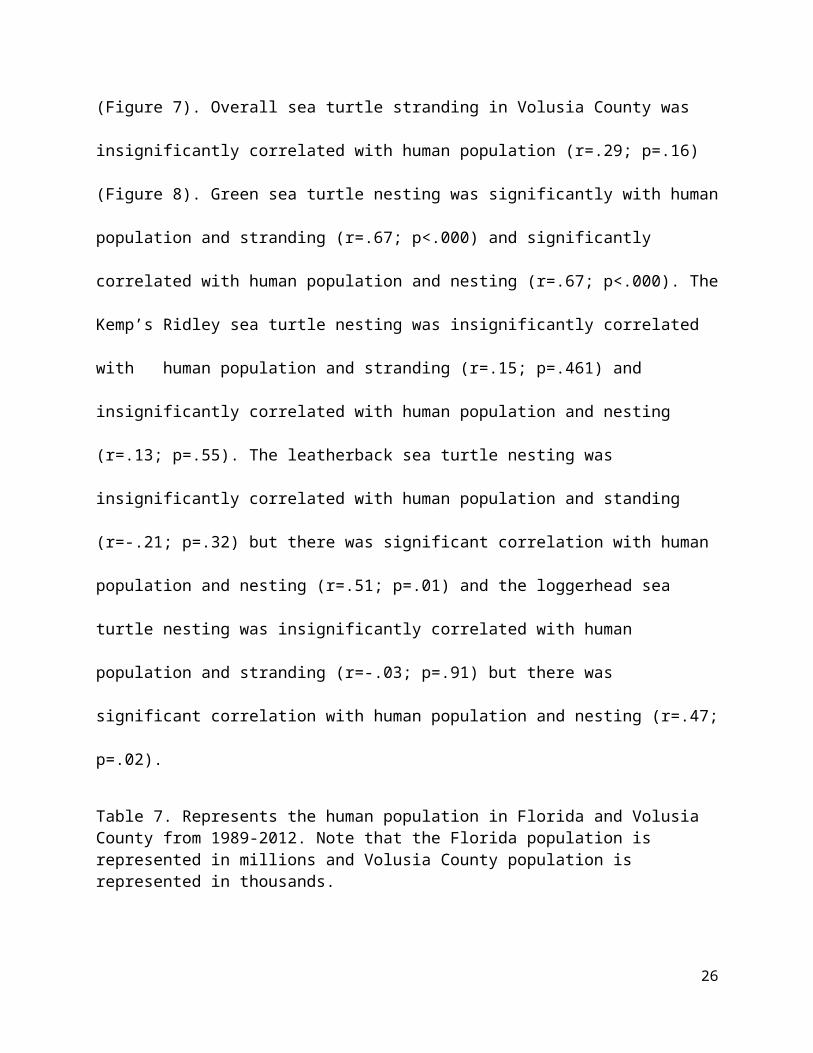
Human Population and Sea Turtle Stranding and Nesting Volusia County
Overall sea turtle nesting in Volusia County was significantly correlated with human
population (r=.45; p=.03) (Figure 7). Overall sea turtle stranding in Volusia County was
insignificantly correlated with human population (r=.29; p=.16) (Figure 8). Green sea turtle
nesting was significantly with human population and stranding (r=.67; p<.000) and significantly
correlated with human population and nesting (r=.67; p<.000). The Kemp’s Ridley sea turtle
nesting was insignificantly correlated with human population and stranding (r=.15; p=.461) and
insignificantly correlated with human population and nesting (r=.13; p=.55). The leatherback sea
turtle nesting was insignificantly correlated with human population and standing (r=-.21; p=.32)
but there was significant correlation with human population and nesting (r=.51; p=.01) and the
loggerhead sea turtle nesting was insignificantly correlated with human population and stranding
(r=-.03; p=.91) but there was significant correlation with human population and nesting (r=.47;
p=.02).
16

Table 7. Represents the human population in Florida and Volusia County from 1989-2012. Note that the Florida population is represented in millions and Volusia County population is represented in thousands.
Year Florida Human Population Volusia County Human Population1989 12,650,935 360,1711990 12,938,071 370,7371991 13,258,732 379,6431992 13,497,541 386,2301993 13,730,115 392,7261994 14,043,757 398,6781995 14,335,992 405,5181996 14,623,421 412,4861997 14,938,314 418,8951998 15,230,421 425,9781999 15,580,244 433,9792000 15,982,824 443,3432001 16,305,100 450,2542002 16,634,256 457,2412003 16,979,706 465,2402004 17,374,824 475,5422005 17,778,156 484,6152006 18,154,475 492,9692007 18,446,768 498,4802008 18,613,905 499,2732009 18,687,425 496,4562010 18,801,332 494,5932011 18,905,070 495,4002012 19,074,434 497,145
17

Figure 7-8 Human population in Volusia County, Florida and overall sea turtle nesting and nesting from 1989-2012
18
Figure 7
Figure 8

Average stranding per year per mile of beach: Eastern Florida County 1989-2012
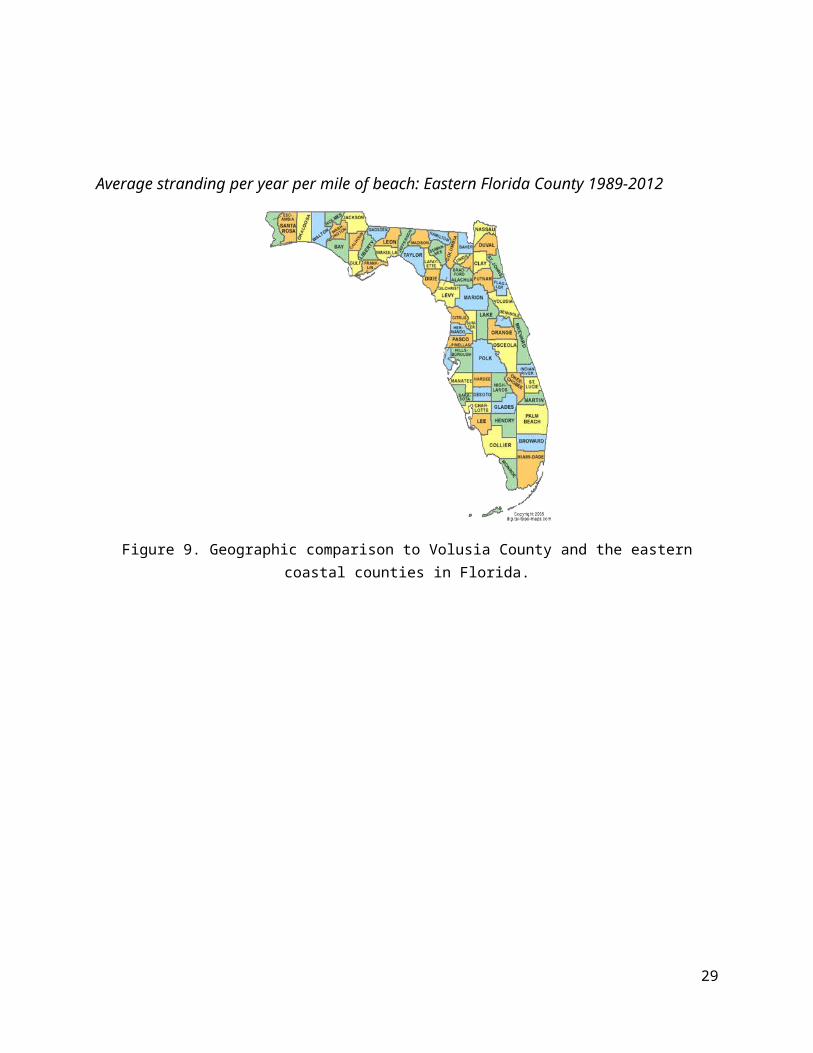
Figure 9. Geographic comparison to Volusia County and the eastern coastal counties in Florida.
19

Table 11. Stranding and miles of beach for the Florida eastern coastal counties from 1989-2012.
Year Volusia Brevard Indian River St. Lucie Martin Broward Flagler St. John's Duval Palm Beach Miami-Dade1989 146 133 76 56 35 30 27 82 68 48 161990 145 148 89 76 35 35 28 74 71 52 191991 41 98 52 65 34 22 10 40 45 54 261992 57 87 49 64 42 19 15 32 32 55 231993 42 97 29 40 36 32 7 13 8 50 381994 56 139 57 45 37 25 12 34 35 55 321995 59 154 84 100 42 28 11 53 34 46 411996 82 161 89 97 71 43 19 65 33 52 481997 74 111 44 44 55 24 6 57 28 46 461998 71 139 51 51 45 44 8 43 26 71 661999 81 99 55 50 37 23 16 63 35 65 502000 70 106 39 43 63 48 10 32 16 76 562001 91 149 38 65 61 50 18 78 29 84 592002 107 150 51 46 41 57 20 92 46 82 512003 157 363 85 84 74 70 14 67 35 107 722004 80 189 45 67 60 49 12 45 19 81 462005 79 182 67 83 59 54 14 53 27 85 432006 140 209 117 115 62 61 13 107 49 89 702007 131 249 68 43 64 51 29 77 59 73 592008 75 214 69 65 44 58 16 60 27 73 452009 123 237 79 65 54 76 34 106 57 100 862010 124 351 146 99 105 53 22 97 56 122 522011 189 454 140 109 89 60 26 106 78 114 462012 73 195 94 59 75 52 25 83 44 91 52
Miles of Beach: 47 72 26 21 22 23 18 40 22 47 22Total: 2293 4414 1713 1631 1320 1064 412 1559 957 1771 1142Averages: 95.54167 183.9167 71.375 67.95833 55 44.33333 17.16667 64.95833 39.875 73.7916667 47.58333333 Average Stranding: Miles of Beach Ratio 2.032801 2.554398 2.74519231 3.236111 2.5 1.927536 0.953704 1.623958 1.8125 1.57003546 2.162878788Total Stranding: Miles of Beach Ratio 48.78723 61.30556 65.8846154 77.66667 60 46.26087 22.88889 38.975 43.5 37.6808511 51.90909091
Figure 10. Standardized average stranding per mile of beach per year for the Florida eastern coastal counties from 1989-2012.
20

In order to compare the stranding activity that took place in Volusia County, Florida from
1989-2012, we analyzed the stranding activity that took place in other counties on the eastern
coast of Florida including: Brevard, Indian River, St. Lucie, Flagler, St. John’s, Duval, Palm
Beach, and Miami-Dade county. We were unable to gain access to the nesting values for these
counties. Based on the analyses, Volusia County ranks 6 out of 12 from the eastern coastal
counties in terms of strandings with about 2.01 strandings per mile of beach per year.
Individual analyses
Table 8. Summary of multiple regression analysis for variables predicting sea turtle stranding in Volusia County 1989-2012. Significant results are indicated by an asterisk.
Variable B SE B
GrNest 1.05 .61 .34
KempNest -19.89 11.97 -.26
LeathNest -.602 2.14 -.05
LogNest -.013 .05 -.05
VolPop -.001 .00 -1.07*
FlPop .006 .00 .115
MeanTempAnom 40.84 94.65 .163
TotFlStrand .127 .02 1.34**
*p<.05; **p<.01
21

Table 9. Summary of multiple regression analysis for predicting sea turtle nesting in Volusia County 1989-2012. Significant results are indicated by an asterisk.
Variable B SE B
GrStrand -.59 2.62 -.07
KempStrand 36.34 17.32 .49
LeathStrand 17.18 10.95 .27
LogStrand -2.40 1.22 -.48
VolPop -.02 .01 -7.04**
FlPop .01 .00 7.27**
MeanTempAnom 704.48 443.24 .74
TotFlStrand -.18 .17 -.51
**p<.01
Table 10. Summary of Pearson-r correlation results between variables associated with sea turtle stranding and nesting in Volusia County, Florida, 1989-2012.
22
Date VolPop VCTotNest VCTotStrnd MeanTempAn GrStrand GrNest KempStrand KempNest LeathStrand LeathNest LogStrand
Pearson Correlation .983**
Sig. (2-tailed) .000Pearson
Correlation .517** .450*
Sig. (2-tailed) .010 .027Pearson
Correlation.326 .297 -.028
Sig. (2-tailed) .120 .159 .896Pearson
Correlation .873** .916** .395 .307
Sig. (2-tailed) .000 .000 .056 .145Pearson
Correlation .730** .669** .236 .646** .571**
Sig. (2-tailed) .000 .000 .266 .001 .004Pearson
Correlation .636** .674** .487* .241 .684** .321
Sig. (2-tailed) .001 .000 .016 .256 .000 .126Pearson
Correlation.139 .158 .126 .586** .168 .154 .213
Sig. (2-tailed) .517 .461 .558 .003 .433 .474 .318Pearson
Correlation.162 .130 .378 -.083 .226 .117 .129 .039
Sig. (2-tailed) .450 .546 .069 .698 .288 .585 .549 .855Pearson
Correlation-.225 -.212 .106 -.165 -.216 -.285 -.330 -.023 -.050
Sig. (2-tailed) .290 .320 .622 .440 .311 .177 .115 .915 .815Pearson
Correlation .600** .515** .306 .274 .374 .635** .192 -.085 .061 .052
Sig. (2-tailed) .002 .010 .146 .195 .072 .001 .369 .694 .778 .809Pearson
Correlation-.024 -.026 -.205 .890** .050 .233 .128 .614** -.184 -.116 -.039
Sig. (2-tailed) .912 .903 .337 .000 .818 .273 .552 .001 .389 .590 .855Pearson
Correlation .470* .398 .997** -.057 .343 .204 .415* .115 .380 .140 .280 -.224
Sig. (2-tailed) .020 .054 .000 .792 .101 .339 .044 .594 .067 .514 .184 .292
Correlations
VolPop
VCTotNest
VCTotStrnd
MeanTempAn
GrStrand
GrNest
KempStrand
KempNest
LeathStrand
LeathNest
LogStrand
LogNest
Discussion
For H1: Overall sea turtle stranding and nesting is related to human population was
rejected for overall stranding and accepted for overall nesting, H2: Species- specific sea turtle
stranding is related to human population for green sea turtle stranding was accepted and for
nesting was rejected. For Kemp’s riddle sea turtle for both stranding and nesting was rejected.
For leatherback sea turtle stranding the hypothesis was rejected but accepted for nest. For
loggerhead sea turtle the hypothesis was rejected for stranding and accepted for nesting. For our
H3: Overall sea turtle stranding and nesting is related to temperature anomaly, stranding was
rejected and nesting was rejected. Four our H4: Species- specific sea turtle stranding and nesting
is related to temperature anomaly, the green sea turtle stranding was accepted and nesting was
rejected. For all other sea turtle species (leatherback, loggerhead, and Kemp’s ridley) it was
rejected. For our H5: Overall sea turtle stranding is related to nesting behavior was rejected and
23

for our H6: Species- specific sea turtle stranding is related to nesting behavior, the green sea
turtle and leatherback species was rejected and the Kemp’s ridley and loggerhead sea turtle
species were accepted.
Stranding data can be a useful supplementary source of information on mortality trends
and for helping understand the health status of the recovering marine populations (Kreuder et al.
2003). There have always been analyses of sea turtle stranding trends, but much of the stranding
data is overlooked as a source of demographic information on marine wildlife because of
problems with sample coverage and difficulty in identifying the primary cause of stranding
(Caillout et al. 1996). The data sets presented here are unique in that they cover a long time
period (>20 years), and the analyses presented in the current study demonstrate utility by
combining longitudinal stranding data with the temperature anomaly, human population, and
nesting activity. For example, using these various data types we found that overall sea turtle
stranding and nesting in Volusia County had positive linear trends; Positive linear trend in total
Volusia County strandings (y=1.87x+67.13; R²=.11) and a positive linear trend in total Volusia
County nesting over the years evaluated (y=11.31x+324.17; R²=.27). There is a steeper line seen
with nesting which in turn can imply that more nesting activity has taken place over time. Along
with the strandings, there are several caveats that must be considered such as there have been
more people and programs implemented to not only protect the sea turtle nests, but also to look
for stranded sea turtles. We found that sea temperature anomaly in relation to stranding and
nesting in Volusia County showed a significant correlation with year (r=.87; p<.000), thus over
time the ocean temperatures have continued to increase. There was insignificant correlation with
both stranding and nesting, which may eventually undermine sea turtle conservation efforts. For
human population and sea turtle stranding and nesting there is significant correlation with human
24

population and overall sea turtle nesting (p=.03) which may correlate with the increase in nest
protection measures put into place to combat the rise in human population growth . We expected
there to also be a significant correlation with human population and overall sea turtle stranding,
but instead we received p=.16. This could be associated with the notion that not all sea turtles
that strand are reported. Beaches that are generally densely populated are more likely to find and
document the stranded turtles compared to less dense areas and unpopulated areas, such as
islands.
There are a variety of reasons sea turtles may strand. For instance, they may strand for
reasons indicated in our dataset, (caught on hook and line, entangled in fishing line, apparent
propeller wounds, probable boat strike, papilloma-like growths noted, tar and / or oil on turtle,
entangled in crab/lobster pot trap line), yet without a understanding of the general trends of these
stranding factors, the relative risks to sea turtles imposed by the causative factor remains poorly
understood. According to Schwartz (2000), temporal fluctuations in sea surface temperature and
food supply may account for trends in loggerhead sea turtle stranding along the US northeast
Atlantic coast. Our study revealed that loggerhead sea turtle stranding in Volusia County was
strongly correlated with mean temperature anomaly (r=0.50) (Table 10). However, we also
determined that mean temperature anomaly was not correlated with overall nesting and stranding
in Volusia County. This is not to say that ocean temperature is not impacting the sea turtle
species. Since the ocean temperatures have been observed increasing over time there is potential
that over time Volusia County nesting sea turtles may have less available nesting beach due to
sea level rise and sex ratios of the nest will become even more female dominate on the Florida
beaches, eventually causing the species as a whole to reach a genetic crisis or even worse
extinction because of a disproportioned sex ratio. Foraging grounds used by these sea turtles may
25
become disrupted due to overall chemical composition, pH disturbances, increases of algal
blooms, and an overall disturbance in the available aquatic vegetation and organisms sea turtles
rely on for survival. Due to these factors, Volusia County may see less nesting activity and more
stranding cases on the beaches as time goes on due to the potential ecosystem disturbances due to
mean ocean temperature anomalies.
Sindermann (2006) reported that chemical contaminants and persistent organic pollutants
(POPs) such as pesticides, flame retardants and polychlorinated biphenyls make their way into
the coastal environments from industrial, agricultural, and urban sources. The Environmental
Protection Agency (2013) also suggests that Florida waters often contain high levels of “nutrient
pollution”, which can result in water quality impairment when algae blooms develop. Along
these lines, Komoroske et al. (2011) demonstrated that sea turtles exposed to pollutants present
in the coastal environment posed negative physiological effects, such as high levels of mercury
present in their blood levels, unnatural growths on the flesh and even disrupted hormone levels
and overall functionality, in sea turtle species and other marine species. Exposure to pollutants in
these coastal environments may contribute to a sea turtle being stranded, yet there is no clear
evidence linking specific stranding anomalies to exposure to such toxins or pollutants. Even
though our study did not specifically evaluate how pollutants influence stranding, background
knowledge from this research will be combined with stranding statistics through time to better
understand sea turtle stranding trends. Foley et al. (2005) revealed that there was a peak in
stranding of sea turtles with fishing gear- related (gillnets and hook-and-line) insults during the
summer months, potentially due to increased fishing activity during this time of year. This is
obviously partly a function of increase human population, yet our study revealed that only green
sea turtle had a high correlation with human population in Volusia County (r=0.669) (Table 10).
26

Kemp’s ridley, leatherback, and loggerhead sea turtles all had either medium to low associations
with human population. This is not to say though that human population does not impact these
species as a whole. These species may be found close to shore during times when fishing is not
so prevalent and therefore there is less potential of them interacting with humans. The turtles that
false crawl may repeatedly not be able to find adequate nesting sites or are simply bothered by
human presence so they adapted to these changes in human presence and moved away from the
Volusia County water altogether, thus are less likely to be impacted by this human presence.
Over the years the aggressive nest protection and overall species protection for sea turtles
under the Environmental Management Division in Volusia County has proven to be a useful tool
in conserving and protecting sea turtle species through the implementation of the Sea Turtle
Habitat Conservation Plan (HCP). For example, Volusia County adopted a lighting ordinance
and is actively working with oceanfront property owners to reduce artificial lighting problems
along our beaches to reduce false crawls and hatchling disorientations. Additionally, the county
has established a Washback Watcher program where permitted volunteers are trained to find and
rescue young sea turtles that wash ashore due to heavy winds and surf each August through
November. Our analysis demonstrated a positive linear trend in nesting. This linear trend might
be partly a function of more humans around to actually document and record the nests. Although
the number of nests have increased throughout the years evaluated (1989-2012), so too has
human population. With this, there need to be a continued push for more aggressive action to
continue the current nesting trend, in addition to more aggressive action to reduce strandings.
Not all of our original hypotheses were supported, but this project has revealed our
original purpose of understanding how stranding is related to human population, temperature
anomalies and nesting behavior in Volusia County, Florida even if there were not significant
27

relationships calculated. With this knowledge there is potential for further analyses to be
performed on specific regions where strandings are occurring to investigate the causes of these
and understand where target zones of conservation may be. With the help of federal, local, and
state organizations the attention towards imperiled species such as sea turtles can continue to be
heightened to reevaluated or create new conservation measures to ensure the safety of these
species and vital habitats.
Finally, several caveats and limitations must be considered within the context of the
study. First, strandings are documented where they are likely to be observed, such as a busy
beach or inlet. Increased human presence and awareness may result in an increase in the number
of stranding records for a particular area which may cause a skewing of data. In addition to the
occurrence of threats, strandings are driven not only by factors such as anthropogenic causes, but
also by sea turtle population sizes, surface currents, wind, tides, and overall decomposition rates
of a specific sea turtle species. For example, larger species would persist for a longer time period
once dead. These caveats would therefore suggest the need to consider the suitability of
stranding for evaluating the impacts of a particular threat, such as human population growth,
mean temperature anomaly, and nesting behavior (Hardy 2014). However, the recent positive
trend in sea temperature anomaly may eventually undermine sea turtle conservation efforts.
Sustained positive trend in human population and sea temperature anomaly will require greater
emphasis on sea turtle conservation into the future.
For future research it would be interesting to evaluate the size of the sea turtle that is
stranding through the carapace length and width to evaluate if the sea turtle is a hatchling,
juvenile, or adult. If hatchlings and juveniles are unable to reach reproductive age there
potentially may be disruptions in the overall sea turtle species population. Also, further analysis
28
on how the surrounding coastal counties compare to Volusia County through an analysis of
human population growth, stranding, and nesting values. In order to see what the sea turtles are
stranding from it would be interesting to evaluate the specific stranding anomalies and calculate
a percentage to show where management practices should be heightened or simply focused on.
Additionally, once the 2013-2015 data on both stranding and nesting for Volusia County
becomes available it would be interesting to add this data to the current study to see how this
information compares to the 1989-2012 data.
Acknowledgements
I thank the Stetson University Biology and Environmental Science Departments for
providing the opportunity to perform undergraduate research under the guidance of Dr. John Jett.
The Volusia County Environmental Management Sea Turtle and Shore Bird Program for
granting access to the sea turtle nesting and stranding data for Volusia County, Florida as well as
providing the opportunity to intern which aided in my overall understanding of sea turtle biology
and the species importance to the environment.
Literature Cited
Amorocho, D. F. 2002. Prioritising research-driven management and public participation in sea turtle conservation in colombia. Australian National University.
29
Baker JD, Littnan CL, Johnston DW. 2006. Potential effects of sea level rise on the terrestrial habitats of endangered and endemic megafauna in the Northwestern Hawaiian Islands. Endangered Species Res 2:21-30.
Bjorndal, K. A. 1999. Priorities for research in foraging habitats. Research and management techniques for the conservation of sea turtles. IUCN/SSC Marine Turtle Specialist Group Publication, 4, 12-14.
Caillouet, C.W., Jr., Shaver, D.J., Teas, W.G., Nance, J.N., Revera, D.B., and Cannon, A.C.1996. Relationship between sea turtle strandings and shrimp fishing effort in the northwestern Gulf of Mexico: 1986-1989 versus 1990-1993. Fishery Bulletin, 94:237-249.
Campbell, L.M. 2007. Local conservation practice and global discourse: a political ecology of sea turtle conservation. Annual Association American Geographers, 97:313-334.
Chaloupka, M., Work, T.M., Balazs, G., Murakawa, S., Morris, R. 2008. Cause specific temporal and spatial trends in green sea turtle strandings in the Hawaiian Archipelago (1982-2003). Marine Biology,154:887-898.
Cousteau, Fabien. 2006. Ocean. New York: DK Publishing., Print.
Florida Fish and Wildlife Commission- Fish and Wildlife Research Institute. (FWRI). 2009. Sea Turtle Strandings Florida.
Foley, A. M., Schroeder, B. A., Redlow, A. E., Fick-Child, K. J., and Teas, W. G. 2005. Fibropapillomatosis in stranded green turtles (Chelonia mydas) from the eastern United States (1980-98): trends and associations with environmental factors. Journal of Wildlife Diseases, 41(1), 29-41.
Green, E. P., and Short, F. T. 2003. World atlas of seagrasses. University of Californa Press, Berkeley, CA.
Halpern, B. S. 2008. The impact of marine reserves: do reserves work and does reserve size matter?. Ecological applications, 13, 117-137.
Hannan, L. B., Roth, J. D., Ehrhart, L. M., and Weishampel, J. F. 2007. Dune vegetation fertilization by nesting sea turtles. Ecology, 88(4), 1053-1058.
Hardy, Robert. 2014. Florida Fish and Wildlife Commission- Fish and Wildlife Research Institute. Sea Turtle Strandings Florida.
Hoegh-Guldberg, O., Mumby, P. J., Hooten, A. J., Steneck, R. S., Greenfield, P., Gomez, E., & Hatziolos, M. E. 2007. Coral reefs under rapid climate change and ocean acidification. science, 318(5857), 1737-1742.
30
Solomon, S., Qin, D., Manning, M., Chen, Z., Marquis, M., Averyt, K. B., & Miller, H. L. 2007. IPCC, 2007: Climate change 2007: The physical science basis. Contribution of Working Group I to the fourth assessment report of the Intergovernmental Panel on Climate Change.
IUCN. 2012. IUCN Red List of Threatened Species. Available: http://www.iucnredlist.org/. Accessed 14 February 2014.
Karl, S., Brian, W., Bowen, H. 1999. Evolutionary significant nnits versus geopolitical taxonomy: molecular systematics of an endangered sea turtle. Conservation Biology, 13 5: 990–999.
Keller, J.M., McClellan-Green, P.D., Kucklick J.R, Keil, D.E, Peden-Adams, M.M. 2006. Effects of organochlorine contaminants on loggerhead sea turtle immunity: comparison of a correlative field study in vitro exposure experiments. Environmental Health Perspectives, Vol. 114: 70-75.
Komoroske, L. M., Lewison, R. L., Seminoff, J. A., Deheyn, D. D., & Dutton, P. H. 2011. Pollutants and the health of green sea turtles resident to an urbanized estuary in San Diego, CA. Chemosphere, 84(5), 544-552.
Kreuder, C., Miller, M. A., Jessup, D. A., Lowenstine, L. J., Harris, M. D., Ames, J. A. and Mazet, J. A. K. 2003. Patterns of mortality in southern sea otters (Enhydra lutris nereis) from 1998-2001. Journal of Wildlife Diseases, 39(3), 495-509.
Morreale, S. J., and Standora, E. A. 2005. Western North Atlantic waters: crucial developmental habitat for Kemp's ridley and loggerhead sea turtles. Chelonian Conservation and Biology, 4(4), 872-882.
Mosier, A. E., & Witherington, B. E. 2002. Documented effects of coastal armoring structures on sea turtle nesting behavior. In Mosier, A., A. Foley, and B. Brost (compilers). Proceedings of the Twentieth Annual Symposium on Sea Turtle Biology and Conservation. NOAA Technical Memorandum NMFS-SEFSC-477 (pp. 304-306).
NMFS (National Marine Fisheries Service). 1998. Recovery plan for US Pacific populations of the east Pacific green turtle (Chelonia mydas). National Marine Fisheries Service, Silver Spring.
Raustiala, K. 1997. States, NGOs and International Environment Institutions. International Studies Quarterly, 41:719-740.
Schwartz, F. 2000. Body-organ weight relationships of stranded loggerhead sea turtles, Caretta caretta, with an examination of the effects of the environment causing their demise. The Journal of the Elisha Mitchell Scientific Society, 116, 86-90.
31

Sindermann, C. J. 2006. Coastal pollution: effects on living resources and humans. CRC Press.
Spotila, James R. 2004. Sea Turtles: A Complete Guide to Their Biology, Behavior, and Conservation. Baltimore: Johns Hopkins UP, Print.
Waycott, M., Duarte, C. M., Carruthers, T. J., Orth, R. J., Dennison, W. C., Olyarnik, S., Calladine, A., Fourqurean, J.W., Heck, K.L., Jr, Hughes, A.R., Kendrick, G.A., Kenworthy, W.J., Short, F.T., and Williams, S. L. 2009. Accelerating loss of seagrasses across the globe threatens coastal ecosystems. Proceedings of the National Academy of Sciences, 106(30), 12377-12381.
Wright, B., and Mohanty, B. 2006. Operation Kachhapa: an NGO initiative for sea turtle conservation in Orissa. Marine turtles of the Indian subcontinent. University Press, Hyderabad, 290-302.
Wright, Sara. 2010. “Hilton Head Island sees record sea turtle nesting season.” Bluffton Today.
Zapata, A. G., Varas, A., and Torroba, M. 1992. Seasonal variations in the immune system of lower vertebrates. Immunology today, 13(4), 142-147.
32