Embed Size (px)
Citation preview

Final Results Presentationfor 52 weeks ended 28 December 2014

Operating Model
Massmart is a high-volume, low-cost, omni-channel distributor of Food, Liquor, General
Merchandise and Home Improvement in sub-Saharan Africa
+ Africa’s second largest retailer / distributor
+ Market leader in General Merchandise and Home Improvement
+ Market leader in Liquor and Wholesale Food
+ 3rd largest in Liquor & Food (retail & wholesale)
+ Fastest growing Retail Food proposition Game in 2014
+ Highest sales densities in SA retail at R190m/store
+ Lowest Operating Costs as % of sales in SA retail at 16.2%
+ Great retail and wholesale brands and formats Makro, Game, DionWired, Builders, Jumbo
+ Deep, wide penetration across LSM 3-10 and Retail, Wholesale & Commercial customers
+ Owned by Walmart
Final Results Presentation February 2015 2

Retail Leadership team
Team has combined total of 54 years’ experience in Massmart operations
Robin Wright (59)BCom, CA (SA)
17 years with Massmart
Founder CCW Stores Chief
Executive Masscash Group
Food Executive
Chief Executive
Massdiscounters
Neville Dunn (46)Bcom CA(SA)
13 yearswith Massmart
Financial Manager The Hub
Financial Director Masscash
Operations Director Masscash
Chief Executive
Masscash Wholesale
Kevin Vyvyan-Day
(50)BCom, BAcc, CA (SA)
10 years with Massmart
Group Chief Executive
Officer UPD
Chief Executive Masswarehouse
Chief Executive
Cambridge Food
Doug Jones(42)BCom, PGDA CA (SA)
8 yearswith Massmart
Operations Financial Manager
SAB Ltd Softdrinks Division
Finance Director Makro
Commercial Director Makro
Chief Executive
Masswarehouse
Llewellyn Walters(51)BA (LLB)
6 yearswith Massmart
Divisional Managing Director
Super Group, African Operations
Chief Executive
Massbuild
Final Results Presentation February 2015 3

Consumer environment
+ Low economic growth, soft job creation,
unsettled labour market, high utility costs,
weak currency, and electricity disruptions.
Low consumer confidence
+ Constrained discretionary spending
with focus on exceptional value amongst
low- & middle-income customers
+ Steady demand amongst higher-income
customers in Builders and Makro
+ Wholesale affected by commodities’
deflation and dis-inflation across basket
+ Disruption in electricity supply impacts
negatively on foot traffic in shopping centers,
benefits our stand-alone stores?
Final Results Presentation February 2015 4
Tough but an improved second-half
-2
0
2
4
6
8
10
12
Jan 13 Apr 13 Jul 13 Oct 13 Jan 14 Apr 14 Jul 14 Oct 14
% G
row
th y
ea
r-o
n-y
ea
r
Nominal Sales
Real Sales

Performance highlights
+ Game SA had a good H2, growing profit. Game Africa declined from
weaker economies, new stores and currency devaluations (-R40m)
+ Game Retail Food growth continues, is now R3.2 billion. Positive
impact on General Merchandise sales
+ Great performances from Makro, Builders Warehouse and Builders
Express as they leverage skills, scale, SAP and supply chain. Profit
acceleration in H2
+ Margin recovery in Masscash Wholesale through focus on direct
distribution and larger stores
+ Market research confirms high consumer brand affiliation with
Cambridge Food. Great trading performance
+ Great performance by new Builders Warehouse, Maputo
+ Successful launch of Makro online in General Merchandise
and Liquor
Final Results Presentation February 2015 5
Scale, Growth and Innovation
Performance highlights at a glance
Great sales growth, good margin management and decent cost control in tough environment
Final Results Presentation February 2015 6
Rm
52 weeks
December 2014
(Reviewed)
% of
sales
52 weeks
December
2013
(Pro forma)
% of
sales
52 week
% growth
52 week
Comparable
% sales
growth
Estimated
% sales
inflation
Sales 78,173.2 70,790.7 10.4 7.5 4.8
Massdiscounters 17,955.2 16,294.2 10.2 4.8 3.1
Masswarehouse 21,554.8 19,271.7 11.8 10.7 5.5
Massbuild 10,822.8 9,441.3 14.6 9.1 5.9
Masscash 27,840.4 25,783.5 8.0 6.3 4.8
Trading profit before
interest and tax 2,061.7 2.6 1,994.4 2.8 3.4
Massdiscounters 180.7 1.0 326.9 2.0 (44.7)
Masswarehouse 1,044.3 4.8 939.5 4.9 11.2
Massbuild 537.6 5.0 467.6 5.0 15.0
Masscash 299.1 1.1 260.4 1.0 14.9

Did You Know?
Final Results Presentation February 2015 7
+ 98 private label brands generate sales of R7.2 billion across the Group
+ Our retail brands have the highest spontaneous awareness for household
appliances, electronics, outdoor & patio, home improvement
+ Load-shedding products comprise 1.5% of Builders Warehouse sales and grew
36% (generators, solar, gas, emergency lighting)
+ Game sells 1/3rd of all TVs sold in South Africa
+ Makro online had one million active visitors in 30 days to mid-December
+ Makro Liquor sold 108m cans / bottles beer, 43m cans cider and 5m bottles
whiskey

Financial Performance
Final Results Presentation February 2015 8
+ Three divisions had a strong performance with Game SA showing improved trading in
the second half of the year
+ Total sales growth increased to 10.4% (Dec 2013: 7.5% 52 weeks) and comparable
sales increased by 7.5% (Dec 2013: 3.8%)
+ Gross margin increased to 18.63% (Dec 2013: 18.44% 52 weeks)
+ Comparable expense growth of 7.1% is lower than comparable sales growth of 7.5%
+ Foreign exchange loss of R49.8m (Dec 2013: R67.8 m gain)
+ Operating profit before foreign exchange movements and interest increased by 4.3%
(Dec 2013: -0.3% 52 weeks)

Sales
Real comparable volume growth
Final Results Presentation February 2015 9
Rm
52 weeks
December
2014
(Reviewed)
52 weeks
December 2013
(Pro forma)
52 week
% growth
52 week
Comparable
% sales
growth
Estimated
% sales
inflation
Total 78,173.2 70,790.7 10.4 7.5 4.8
Massdiscounters 17,955.2 16,294.2 10.2 4.8 3.1
Masswarehouse 21,554.8 19,271.7 11.8 10.7 5.5
Massbuild 10,822.8 9,441.3 14.6 9.1 5.9
Masscash 27,840.4 25,783.5 8.0 6.3 4.8
91.9%
8.1%
S.A. Sales Rest of Africa Sales
+ Rest of Africa businesses’ sales growth:
Sales in ZAR grew by 16.2%
+ Higher inflation in General Merchandise
and Home Improvement
+ Wholesale business is experiencing deflation in some
Food commodities in 2015
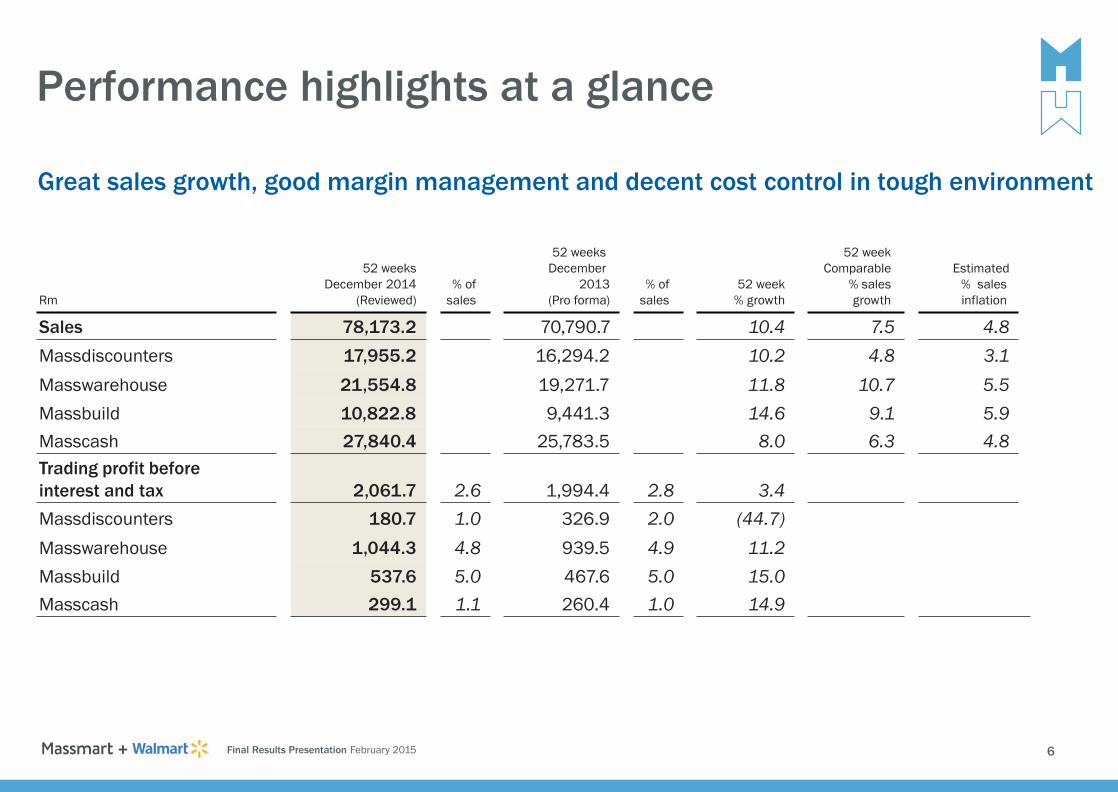
+ Operating profit before forex of R1,933.7m
+ A strong trading performance in Makro, Massbuild and Masscash Retail; offset by:
+ Greater Food contribution across the Group
+ A softer margin performance in Massdiscounters attributable to the overstock position
+ Prior year included insurance proceeds
+ Total increase of 14.0% / Comparable increase of 8.5%
+ Increase in staff (Full-Time Equivalents) of 8.3% to +/- 41,000 FTE’s
+ Total increase of 5.3% / Comparable increase of 3.6%
+ 3.9% increase of net new trading space to a total of 1,539,295m²
+ Electricity, rates and taxes increased by approximately 15%
+ Property acquisitions resulting in a reduction of occupancy costs
+ Depreciation growth of 15.8% is greater than sales growth of 10.4%
+ The opening of new stores, DC’s and the acquisition of key properties is driving the increase
+ Rate of increase should reduce significantly from 2015
+ Total increase of 12.6% / Comparable increase of 7.8%
+ Credit card commission increased by 15.5% - increased usage
+ Operating profit before forex of R2,015.9 million
+ Increase of 4.3%
Operating profit before forex and interest
Final Results Presentation February 2015 10
0.5 1.0 1.5 2.0 2.5 3.0 3.5
2013
Sales-related gross margin
Price-and-mix-related gross margin
Other income
Employment costs
Occupancy costs
Depreciation, Amortisation and
Impairment of Assets
Other operating costs
2014
Rbn

EBITDA
Final Results Presentation February 2015 11
Rm
52 weeks
December 2014
(Reviewed)
52 weeks
December 2013
(Pro forma)
52 week
% growth
Operating profit before foreign exchange
movements and interest2,015.9 1,933.7 4.3
Depreciation and amortisation 846.6 731.1 15.8
Impairment of assets 24.6 41.6
EBITDA before foreign exchange movements 2,887.1 2,706.4 6.7

Foreign Exchange Movements
Final Results Presentation February 2015 12
52 weeks
December 2014
(Reviewed)
52 weeks
December 2013
(Pro forma)
Massdiscounters (5.7) 82.4
Other (44.1) (14.6)
Total (loss)/gain (49.8) 67.8
+ Rand weakened by 12.7% against the USD
+ Ghanaian New Cedi and the Nigerian Naira devalued against the Rand

Inventories and Creditors
Final Results Presentation February 2015 13
December 2014
(Reviewed)
December 2013
(Audited)
Inventories (Rm) 11,228.8 10,115.5
Inventory Days 64 64
Trade Creditors (Rm) 14,841.5 13,702.4
Creditors’ Days 75 76
+ Good inventory management. Growth of 11.0% is marginally ahead of sales growth
+ New stores
+ Massdiscounters, while improving, remains overstocked
+ Trade Creditors increased by 8.3%
+ Creditors’ Days slightly tighter

+ Total Capex as a % of sales: 2.7% (Dec 2013: 3.3%)
+ Total Capex excl. business and property acq’s as a % of sales: 1.6% (Dec 2013: 1.8%)
Capital Expansion
Final Results Presentation February 2015 14
0
500
1 000
1 500
2 000
2 500
1.0%
1.5%
2.0%
2.5%
3.0%
3.5%
4.0%
Dec 2010 Dec 2011 Dec 2012 Dec 2013 Dec 2014
Rm
Ca
pe
x a
s a
% o
f sa
les
Investment to maintain operations Investment to expand operations
Property acquisitions Businesses acquired
Total capex as a % of sales Total capex as a % of sales excl business and property acq's

Capital Expansion
Sales split between owned and leased stores
Final Results Presentation February 2015 15
31% 27% 13%

Capital expansion
Final Results Presentation February 2015 16
Annualised benefit of property acquisitions over the last 2 years
Saving on lease payments: R210m
Less finance costs: R109m
Less
depreciation
costs:R36m
Net savings: R65m

Cash Flow Statement
Final Results Presentation February 2015 17
Rm
52 weeks
December 2014
(Reviewed)
53 weeks
December 2013
(Audited)
Operating cash before working capital movements 2,983.4 2,984.0
Working capital movements (295.1) 752.6
Cash generated by operations 2,688.3 3,736.6
Net interest and tax paid (1,028.7) (987.9)
Net investment to maintain operations (857.4) (780.2)
Free cash flow 802.2 1,968.5
Dividends paid (914.0) (913.4)
Investment to expand operations and
other net investing activities(1,289.1) (1,446.9)
Cash outflow before financing activities (1,400.9) (391.8)
+ The effect of week 53 in the prior and current year is approximately R500m in working capital

Forecast stores: Dec 2014 – Dec 2016
18
Dec 2014
Forecast new stores
Jan 2015 – Dec 2016 Dec 2016
Number of stores 392 63 455
Massdiscounters 153 19 172
Masswarehouse 19 1 20
Massbuild 100 20 120
Masscash 120 23 143
+ Massdiscounters: Game SA – 8; DionWired – 4; and Game Africa - 7 (Kenya 1, Mozambique 1, Nigeria 3 and Zambia 2)
+ Masswarehouse: Makro - 1
+ Massbuild: BWH SA - 4; BEX – 4; BTD – 1; BSS - 8; and BW Africa - 3 (Mozambique 1 and Zambia 2)
+ Masscash: Retail – 18; Wholesale SA – 2; and Wholesale Africa - 3 (Mozambique 2 and Zambia 1)
Forecast for 2015:+ 33 new stores resulting in an additional 6.3% net new trading space
% increase
Trading space (m2) 1,539,295 192,893 1,732,188 12.5
Massdiscounters 506,188 60,340 566,528 11.9
Masswarehouse 195,794 12,000 207,794 6.1
Massbuild 436,538 57,500 494,038 13.2
Masscash 400,775 63,053 463,828 15.7
Final Results Presentation February 2015

Strategic Priorities
Final Results Presentation February 2015 19
+ Improve Profitability
+ Grow Builders and Retail Food in South Africa
+ Grow into Africa
+ Grow Online

Improve Profitability
To improve Group profitability from a focus on Sales, Operating Margin and Expenses
+ Increase comparable stores’ sales
+ New customer groups – commercial, online, exports
+ New formats, format renewal
+ Increase Private Label penetration: currently 9.8% of sales, and highest in Builders at 18.7%
+ Reduce costs in value-chain
+ Increase property ownership: estimated future annual benefit of R65m
+ Reduce capital cost of new stores
+ But always prepared to invest profit into price, to drive sales / productivity loop
Final Results Presentation February 2015 20

Growing Game
Final Results Presentation February 2015 21
Subsequent Challenges
+ Demand & fulfillment software (JDA) poorly configured & operated
+ Inadequate store segmentation impacted merchandise range:
Rosebank to Ulundi
+ Initially difficult to attract suitable Food skills
+ Poor demand data history impacts Fresh wastage
+ Complexity of Fresh supply chain
+ Distracted the core General Merchandise team
Response:
+ Re-installed JDA in 2013/14
+ Supply chain & RDC skills
+ Revised store segmentation and
merchandise range
+ Hiring great skills. Suppliers’
support
+ Improving demand data history
+ Group Fresh supply chain
+ SAP point-of-sale
In 2009 began transforming Game from traditional GM discounter …
Growing Game
Final Results Presentation February 2015 22
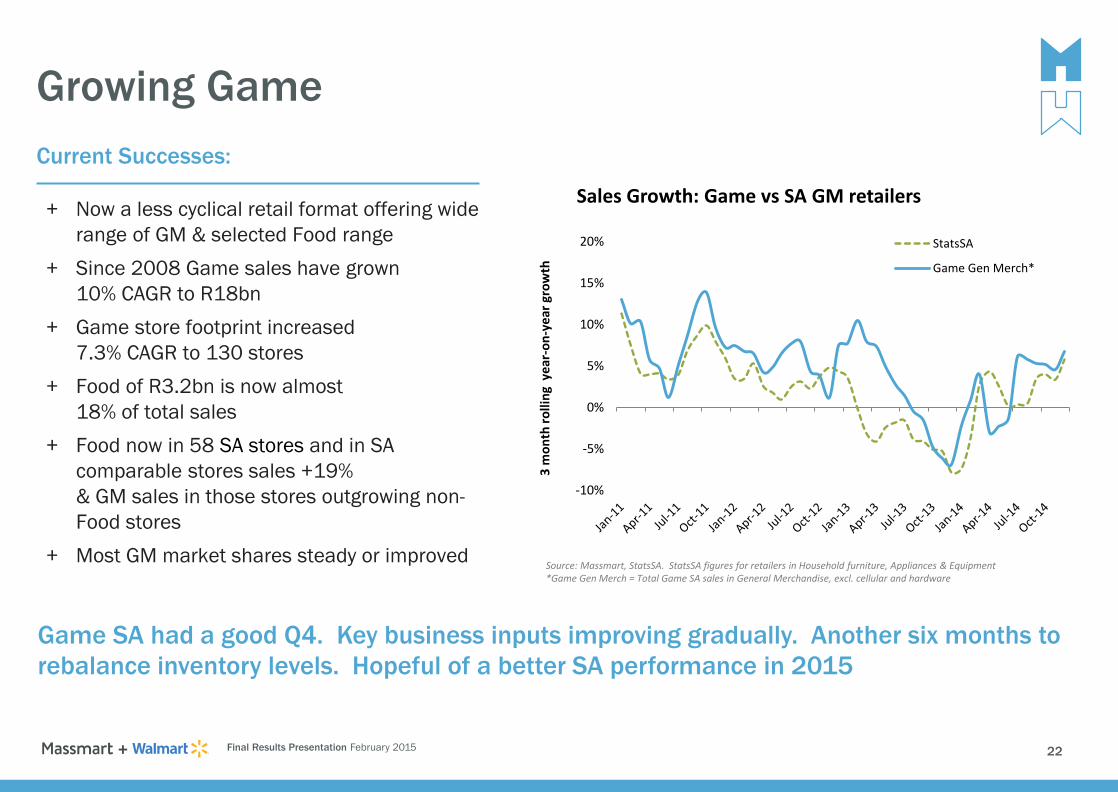
Current Successes:
+ Now a less cyclical retail format offering wide
range of GM & selected Food range
+ Since 2008 Game sales have grown
10% CAGR to R18bn
+ Game store footprint increased
7.3% CAGR to 130 stores
+ Food of R3.2bn is now almost
18% of total sales
+ Food now in 58 SA stores and in SA
comparable stores sales +19%
& GM sales in those stores outgrowing non-
Food stores
+ Most GM market shares steady or improved
-10%
-5%
0%
5%
10%
15%
20%
3 m
on
th r
olli
ng
yea
r-o
n-y
ear
gro
wth
Sales Growth: Game vs SA GM retailers
StatsSA
Game Gen Merch*
Source: Massmart, StatsSA. StatsSA figures for retailers in Household furniture, Appliances & Equipment *Game Gen Merch = Total Game SA sales in General Merchandise, excl. cellular and hardware
Game SA had a good Q4. Key business inputs improving gradually. Another six months to
rebalance inventory levels. Hopeful of a better SA performance in 2015

Grow Retail Food in SA
Current situation
Build a Retail Food proposition on the General Merchandise and Wholesale Food
platforms. To reduce cyclicality, counter potential decline in Wholesale, complement
our existing offerings and enter the under-penetrated lower-income arena
+ Retail Food sales from Rnil to R14.7bn since 2008
+ Trading through 132 stores in Makro, Game and Cambridge Food
+ Positive impact in Game and Makro, with increased traffic and new customers
+ Own private label in all three formats – Cambridge, Marketside, M-brand
+ Implemented full offering including dry groceries, bakery, butchery, fresh produce & prepared meals
+ Developing dedicated supply chain for Fresh, Meat & Bakery – either owned or 3rd party
+ Competitive pricing enabled through General Merchandise margins & lower operating expenses
+ Disrupted market equilibrium as suggested by competitor reaction, specifically aggressive enforcement
of lease exclusivities and keen pricing / promotions
Final Results Presentation February 2015 23

Grow Retail Food in SA
Key priorities
+ Complete Game Food roll-out and grow
national footprint of Cambridge Food
brand
+ Improve product offering & store operating
efficiencies
+ Develop and leverage specialist Group-
owned assets (e.g. Fruitspot) to service
Fresh, Bakery and Butchery proposition
+ Grow Food private labels
Final Results Presentation February 2015 24
Inhibitors
+ Lease exclusivities, dedicated supply & logistics,
cold chain infrastructure and specialist skills

Grow Builders’ formats in SA
Current Situation
+ Market leaders in SA with Builders
Warehouse & Builders Express. Few direct
format competitors
+ Pleased with early success of Superstore
+ Enabled by great skills & management, SAP
and national DC
+ Under-penetrated is some key metropolitan &
urban areas
Final Results Presentation February 2015 25
Inhibitors
+ Real estate, economic / housing cycle
Key priorities
+ Aggressively roll-out Warehouse & Express
stores
+ Grow Builders Superstore (8 stores in next two
years)

Grow into Africa
Current situation
To replicate South African market leadership and operating strengths in under-
serviced, high potential markets in sub-Saharan Africa, to increase geographic
market exposure for growth
+ 33 stores in 11 sub-Saharan non-South African countries generating sales of R6.4bn representing
8.1% of total sales
+ Average store sales of R192m p.a., almost x2 higher than that achieved by grocery retail peers
+ Game – first wave city expansion into 10 non-SA countries has resulted in good General
Merchandise market shares and an emerging Retail Food proposition
+ Builders Warehouse – second wave city expansion into two countries has resulted in excellent
sales and margin growth
+ Masscash Wholesale – over 10 years have opened / acquired stores in four countries. Sales of
R2.7bn
+ Continued learning from Valumart, Nigeria, launched in 2012. Have expanded the pilot to validate
logistics and distribution requirements
Final Results Presentation February 2015 26

Grow into Africa
Key priorities
+ Grow into selected cities & metros. Seven
Game stores planned for 2015-16
+ Grow Builders Warehouse presence in SADC
region. Three planned for 2015-16
+ Initiate a third wave through Cash & Carry or
Hybrid model, with Dry Groceries & limited GM.
Focus on major cities & towns in SADC. Three
planned for 2015-16
+ Total African space growth 2015-2016 of
approximately 45%
Final Results Presentation February 2015
Inhibitors
+ Securing land title, volatile currencies,
unpredictable customs & duty environments
TANZANIA
ZAMBIA
SOUTH AFRICA
LESOTHO SWAZILAND
NAMIBIA MOZAMBIQUE
MALAWI
NIGERIA
GHANA
UGANDA
359
4
3
1
1
1
1
3
2
5
1
11
BOTSWANA
27

Grow online
Current situation
To build a profitable omni-channel presence that is synergistic with Massmart
category market leadership and needs of customer base
+ DionWired online launched in 2012. Essential offering for hi-tech customer. Good online
retail learning experience for the Group. High basket size, now 2.3% of sales
+ Makro online launched April (General Merchandise) and October 2014 (Liquor). High basket size,
high proportion of click-&-collect, predominantly retail. New and existing customers
+ Trialing Makro convenience locker access, for later roll-out to SASOL service station forecourts
+ Shield online system and call-centre integrated with, and accessible to, Cash & Carry B2B customer
base
+ Access to skills & experience at ASDA online and walmart.com
Final Results Presentation February 2015 28
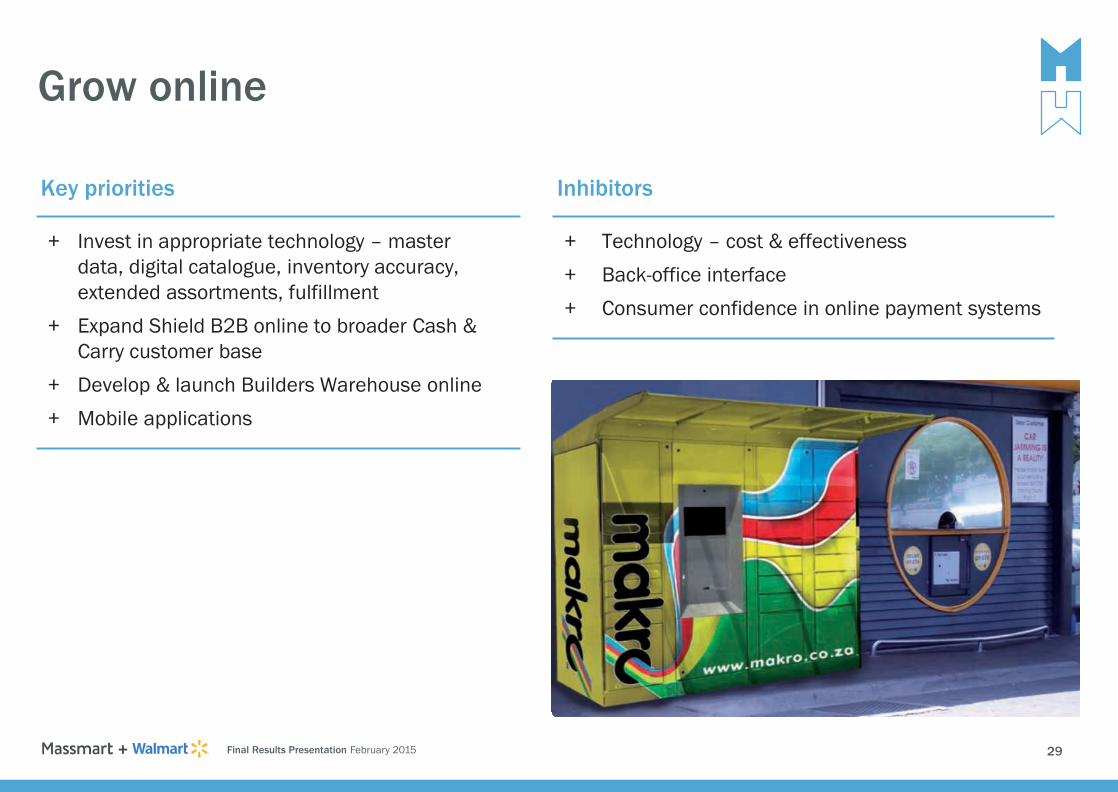
Grow online
Key priorities
+ Invest in appropriate technology – master
data, digital catalogue, inventory accuracy,
extended assortments, fulfillment
+ Expand Shield B2B online to broader Cash &
Carry customer base
+ Develop & launch Builders Warehouse online
+ Mobile applications
Final Results Presentation February 2015 29
Inhibitors
+ Technology – cost & effectiveness
+ Back-office interface
+ Consumer confidence in online payment systems

Prospects
Final Results Presentation February 2015 30
+ For the 8 weeks to 22 February 2015, total sales increased by 10.0%
+ Comparable sales increased by 7.9%
+ Continuation of sales trends seen in Q4 of 2014
+ South African consumer environment seems mildly positive, but
fragile. Need to watch oil price, taxes and interest rates
+ Mixed African economic prospects in short-term
Any reference to future financial performance included in this document has not been reviewed or reported on by the Group’s external auditors. The auditor’s report does not necessarily report on all of
the information contained in this announcement/financial results. Shareholders are therefore advised that in order to obtain a full understanding of the nature of the auditor’s engagement they should
obtain a copy of the auditor’s report together with the accompanying financial information from the issuer’s registered office.
Dedicated to adding value
For further details, go to
massmart.co.za/results2014

Additional Information
Final Results Presentation February 2015 32
+ Reviewed Consolidated Income Statement for 52 Weeks ended 28 December 2014
+ Tax Rate Reconciliation
+ Headline Earnings Reconciliation
+ Store Portfolio
+ Store Portfolio (including location of stores)
+ Forecast Stores (including location of stores)
+ Capex per category
+ Number of shares

Reviewed Consolidated Income Statement for the
52 Weeks ended 28 December 2014
Final Results Presentation February 2015 33
Rm
52 weeks
December 2014
(Reviewed)
52 weeks
December 2013
(Pro forma)
52 week
% growth
Revenue 78,319.0 71,035.3 10.3
Sales 78,173.2 70,790.7 10.4
Cost of sales (63,610.8) (57,733.8) (10.2)
Gross Profit 14,562.4 13,056.9 11.5
Other income 145.8 244.6 (40.4)
Depreciation and amortisation (846.6) (731.1) (15.8)
Impairment of assets (24.6) (41.6) 40.9
Employment costs (6,109.0) (5,357.5) (14.0)
Occupancy costs (2,678.8) (2,544.5) (5.3)
Other operating costs (3,033.3) (2,693.1) (12.6)
Operating profit before foreign exchange movements and interest 2,015.9 1,933.7 4.3
Foreign exchange (loss) / gain (49.8) 67.8
Operating profit before interest 1,966.1 2,001.5 (1.8)
Net finance costs (345.3) (249.8) (38.2)
Profit before taxation 1,620.8 1,751.7 (7.5)
Taxation (483.4) (512.6) 5.7
Profit for the year 1,137.4 1,239.1 (8.2)

Tax Rate Reconciliation
Final Results Presentation February 2015 34
%
52 weeks
December 2014
(Reviewed)
52 weeks
December2013
(Pro forma)
Standard tax rate 28.0 28.0
Non-taxable income and disallowed expenses 2.8 (2.0)
Allowances on lease premiums and improvements (0.4) (0.3)
Assessed loss not utilised 2.0 1.4
Other – including foreign tax adjustments (2.6) 2.2
Group tax rate 29.8 29.3

Headline Earnings Reconciliation
Final Results Presentation February 2015 35
Rm
52 weeks
December 2014
(Reviewed)
52 weeks
December 2013
(Pro forma)
52 week
% growth
Attributable earnings 1,079.8 1,180.0
Impairment of assets 24.6 41.6
Loss on disposal of tangible and intangible assets 1.4 11.9
Loss on disposal of business - 1.8
Tax effects on adjustments (0.3) (3.8)
Headline earnings 1,105.5 1,231.5 (10.2)
Foreign exchange loss/(gain) (taxed) 35.9 (48.8)
Headline earnings before foreign exchange (taxed) 1,141.4 1,182.7 (3.5)

Store Portfolio
36
December 2013 Opened Closed December 2014
Number of stores 376 28 -12 392
Massdiscounters 143 13 -3 153
Masswarehouse 19 - - 19
Massbuild 92 12 -4 100
Masscash 122 3 -5 120
Massdiscounters:
+ Opened 11 Game stores (one in Nigeria and one in Namibia) and two DionWired stores
+ Closed two Game stores and one DionWired store
Massbuild:
+ Opened three Builders Warehouse stores, four Builders Express stores, one Builders Trade
Depot store and four Superstores
+ Closed two Builders Warehouse stores and two Builders Express stores
Masscash:
+ Opened three and closed three Retail stores
+ Closed two Wholesale stores
Final Results Presentation February 2015

Store Portfolio including location of stores
Final Results Presentation February 2015 37
Massdiscounters Masswarehouse Massbuild Masscash Total
December 2013 143 19 92 122 376
Opened:
13 - 12 3 28
Game: 2 Africa
stores
Game: 9 SA stores
DionWired: 2 SA
stores
BWH: 1 Africa
store
BWH: 2 SA stores
BEX: 4 SA stores
BTD: 1 SA store
BSS: 4 SA stores
Retail: 3 SA stores
Closed
-3 - -4 -5 -12
Game: 2 SA stores
DionWired: 1 SA
store
BWH: 2 SA stores
BEX: 2 SA stores
Retail: 3 SA stores
Wholesale: 2 SA
stores
December 2014 153 19 100 120 392

Forecast stores including location of stores
Final Results Presentation February 201538
Massdiscounters Masswarehouse Massbuild Masscash Total
December 2014 153 19 100 120 392
Forecast SA openings 2015:
6 - 9 12 27
Game: 4
DionWired: 2
BWH: 3
BEX: 2
BTD: 1
BSS: 3
Retail: 10
Wholesale: 2
Forecast Africa openings 2015:
4 - 1 1 6
Game: Kenya 1;
Mozambique 1;
Nigeria 1; and
Zambia 1
BWH: Zambia 1Wholesale:
Mozambique 1
December 2015 163 19 110 133 425
Forecast SA openings 2016:
6 1 8 8 23
Game: 4
DionWired: 2Makro: 1
BWH: 1
BEX: 2
BSS: 5
Retail: 8
Forecast Africa openings 2016:
3 - 2 2 7
Game: Nigeria 2;
and Zambia 1
BWH: Zambia 1;
Mozambique 1
Wholesale: Zambia 1;
Mozambique 1
December 2016 172 20 120 143 455

Capex per category
Final Results Presentation February 2015 39
Rm
52 weeks
December 2014
(Reviewed)
52 weeks
December2013
(Pro forma)
Land and buildings/leasehold improvements 948.9 807.2
Vehicles 11.0 34.7
Fixtures, fittings, plant and equipment 341.7 427.7
Computer hardware 12.6 33.8
Computer software 7.9 1.5
Other - 1.9
Investment to expand operations 1,322.1 1,306.8
Land and buildings/leasehold improvements 104.8 47.7
Vehicles 92.1 43.4
Fixtures, fittings, plant and equipment 427.2 521.7
Computer hardware 108.1 70.9
Computer software 123.6 96.5
Other 1.6 -
Investment to maintain operations 857.4 780.2

Number of shares
Final Results Presentation February 2015 40
‘000
At December 2013 217,109
Shares issued 9
At December 2014 217,118
Weighted-average at December 2014 216,908
Diluted weighted-average at December 2014 219,055


![Final Results 2010 [Presentation slides] - Mitchells & Butlers › pdf › 2010 › results › final_results10_slides.… · Final Results 2010 [Presentation slides] Keywords: Final](https://img.pdfslide.us/doc/110x75/5f2878169df78139e52a7d4d/final-results-2010-presentation-slides-mitchells-butlers-a-pdf-a-2010.jpg)