Embed Size (px)
Citation preview

September 2003
Nippon Koei Co., Ltd. Institute of Energy Economics Japan
Final Report
Volume 8 Supporting Report
Renewable Energy
The Study on Introduction of Renewable Energies
in Rural Areas in Myanmar
Japan International Cooperation Agency (JICA) Ministry of Electric Power Myanma Electric Power Enterprise Union of Myanmar
M P N JR
03 – 101
No.

MYANMA ELECTRIC POWER ENTERPRISE MINISTRY OF ELECTRIC POWER
UNION OF MYANMAR
THE STUDY ON INTRODUCTION OF RENEWABLE ENERGIES IN RURAL AREAS IN MYANMAR
FINAL REPORT
VOLUME 8 SUPPORTING REPORT
RENEWABLE ENERGY
SEPTEMBER 2003
JAPAN INTERNATIONAL COOPERATION AGENCY
NIPPON KOEI CO., LTD. INSTITUTE OF ENERGY ECONOMICS, JAPAN

THE STUDY ON INTRODUCTION OF RENEWABLE ENERGIES IN RURAL AREAS IN MYANMAR
Final Report
List of Volumes
Vol. 1 Summary
Vol. 2 Main Report: Study Outlines
Vol. 3 Main Report: Guidelines for Rural Electrification
Vol. 4 Main Report: Manuals for Sustainable Small Hydros Part 4-1 O&M Manual – Small Hydros Part 4-2 Design Manual – Small Hydros Part 4-3 Design Manual – Village Hydros Part 4-4 Institutional and Financial Aspects
Vol. 5 Main Report: Development Plan of Priority Projects
Vol. 6 Supporting Report 1: Appendices to Manuals Part 6-1 Appendices to O&M Manual-Small Hydro Part 6-2 Appendices to Design Manual-Small Hydro Part 6-3 Appendices to Design Manual-Micro Hydro Part 6-4 Appendices - Institutional and Financial
Vol. 7 Supporting Report 2: Institutional/Socio-economics Part 7-1 Institutional Study Part 7-2 Economic and Financial Study Part 7-3 Social Survey
Vol. 8 Supporting Report 3: Renewable Energy Part 8-1 Biomass Power Part 8-2 Solar and Wind Power Part 8-3 Inspection Memos
Visual Guide for Planning Village RE Schemes, Myanma version (in separate volume)
Database for Rural Electrification using Renewable Energy Sources (on CD)

ABBREVIATIONS Organizations DEP, DOEP Department of Electric Power of MOEP DHP Department of Hydroelectric Power of MOEP GOM/SPDC Government of Myanmar/State Peace and Development
Council GOJ Government of Japan ID Irrigation Department of Myanmar IOE Institute of Economics of Myanmar ITC Irrigation Technology Centre, Irrigation Department JICA Japan International Cooperation Agency MADB Myanma Agricultural Development Bank MAPT Ministry of Agricultural Products and Trade MEC Myanmar Economic Commission MELC Myanma Electric Light Co-operative Society Ltd. MEPE Myanma Electric Power Enterprise MPBANRDA Ministry for Progress of Border Areas and National Races
and Development Affairs MOC Ministry of Cooperatives MOE Ministry of Energy MOEP Ministry of Electric Power MOST Ministry of Science and Technology MSTRD Myanma Scientific and Technological Research Department NCEA National Commission for Environmental Affairs NEDO New Energy & Industrial Technology Development
Organization, Japan SPICL Sein Pann Industrial Production Co-operative Limited USDA Union Solidarity and Development Association (an NGO) VEC Village Electrification Committee VPDC Village Peace and Development Council YIE Yangon Institute of Economics YIT Yangon Institute of Technology Government Administration Division/State
Township
Quarter
Village Tract
Village

Economics, Finance ATP Ability to Pay GDP Gross Domestic Product GRDP Gross Regional Domestic Product IRR Internal Rate of Return WTP Willingness to Pay
Unit kVA kilo Volt ampere kWh kilo-Watt-hour MWh Mega-Watt-hour (103 kWh) K Currency unit of Myanmar (Kyat) toe Tons of oil equivalent (107 kcal) US$, $ Currency unit of USA (US dollar) Yen Currency unit of Japan (Yen) Others BCS Battery Charging Station FS Feasibility Study HRD Human Resource Development IPP Independent Power Producer MP Master Plan NGO Non Governmental Organization OJT On-the-Job-Training O&M Operation and Maintenance R&D Research and Development RE Rural Electrification SHS Solar Home System
Exchange Rates US$ 1.00 = K500 = Yen 120 (May 2001) US$ 1.00 = K1,000 = Yen 120 (May 2003) unless otherwise specifically noted

THE STUDY ON INTRODUCTION OF RENEWABLE ENERGIES
IN RURAL AREAS IN MYANMAR
FINAL REPORT
Volume 8 Supporting Report
Renewable Energy
Part 8-1 Biomass Power
Part 8-2 Solar and Wind Power
Part 8-3 Inspection Memos

i
THE STUDY ON INTRODUCTION OF RENEWABLE ENERGIES IN RURAL AREAS IN MYANMAR
Final Report
Vol. 8 Supporting Report: Renewable Energy
Part 8-1 Biomass Power
TABLE OF CONTENTS
1 BIOMASS ENERGY ......................................................................................................1 1.1 Introduction ................................................................................................... 1 1.2 Power plants for a factory own use ............................................................... 2 1.3 Independent power plant ............................................................................... 3
2 APPLICATION AND ACTUAL CONDITIONS OF THE BIOMASS ENERGY TO POWER PLANT .....................................................................................................4 2.1 Wood Combustion Steam Engine.................................................................. 4 2.2 Steam Turbine Power Generation Unit (PGU) by Rice Husk Combustion... 5 2.3 Bagasse Combustion Steam Turbine Power Generation Unit (PGU) ........... 7 2.4 Biomass gasification engines......................................................................... 9
3 POSSIBILITY OF THE RURAL ELECTRIFICATION BY BIOMASS ENERGY APPLICATION.....................................................................................................16 3.1 Comparison of the Biomass Energy in Rural Electrification (RE) .............. 16 3.2 Biomass application for RE at rice mills/sawmills periphery ...................... 16 3.3 Biomass Gasification Power Generation at Rice Mills & Sawmills Periphery
..................................................................................................................... 18 3.3.1 Advantages and Disadvantages of Biomass Gasification engines 18 3.3.2 Technical Matters to be Considered .............................................. 19
4 SELECTION STANDARD AND THE PRIORITY FOR RE BY BIOMASS GASIFICATION ...................................................................................................22 4.1 Factors of RE site selection ......................................................................... 22 4.2 The Standards for the Priority of RE by Biomass Gasification PGU.......... 22
5 POWER GENERATION BY BIOGAS APPLICATION.........................................23 5.1 General Aspect............................................................................................. 23 5.2 Large Scale Biogas Plant............................................................................ 23 5.3 Small Scale Biogas Application .................................................................. 25
Reference .....................................................................................................................26

ii
LIST OF TABLES
Table 1 Power Plant for a Factory Use...............................................................................2 Table 2 Power Source of State Owned Sawmills ...............................................................4
Table 3 A list of Rice Mills Equipped With Husk Combustion PGU................................6
Table 4 The outline and its PGU of state owned sugar mills .............................................8
Table 5 The Product List of Rice Husk Gas Engine by MIC (Mar,2002).....................10
Table 6 Large Scale Rice Mills in Myanmar....................................................................12 Table 7 Number of Potential Power Generating Unit (PGU) by Size in State/Division..14
Table 8 Comparison of the biomass energy for RE .........................................................16
Table 9 Comparison of the Characteristics of Steam Turbine and Gasification Engine..17
Table 10 Composition of Rice Husk Charcoal and Ash...................................................20
Table 11 Volume and Heat Capacity of the Biogas Obtained from 1 ton of the Biomass24 Table 12 Heat Balance of Biogass....................................................................................24
LIST OF FIGURES
Figure 1 Required item for the electrification by biomass .................................................3
Figure 2 Timber production and wood-chips .....................................................................4

- 1 - Nippon Koei / IEEJ Volume 8 Renewable Energy
The Study on Introduction of Renewable Energiesin Rural Areas in MYANMAR
1 BIOMASS ENERGY
1.1 Introduction
The agricultural residues such as firewood, charcoal, rice husk, cob、 and stalks of maize etc., have been used as the fuel source in homes in Myanmar. There are many kinds of agricultural residues that are produced from the output and the process of farm products. Although the quantity of such agricultural residues is extremely large, usually the value of biomass is recognized rather low, since the moisture contents are high and the collection works are not easy. Wood chips, sawdust from sawmills, bagasse (squeezed waste material out of squeezed sugarcane) from sugar mills, and rice husk from rice mills are such biomass that can be utilized as energy sources. They are used in the kitchen and restaurants as the fuel at present.
Biomass generation using steam turbine and boiler unit is applied for most of governmental sugar mills and a part of rice mill. Rice husk harnesses the rice mills and bagasse powers the sugar mills. Reportedly, there exist 15 large-scale sugar mills and 13 rice mills that are powered by this kind of system owned by the Myanmar government and provide power from 200 kW up to 3,000 kW, though some units need to be repaired. Generally, the biomass steam turbine generation systems have such characteristics as follows;
The scale of the power generation by steam turbine units is big;
The fuel consumption is large; and
The construction cost is high.
Therefore it is most important to secure the installation cost and supply of the biomass as fuel. In this regard, it would be efficient that sugar mills use bagasse from sugar cane and rice mills use rice husk from paddy, so that less waste materials are produced. There are no examples of power generation unit of steam turbine by biomass combustion other than rice mills and sugar mills, because the collection of the material and its transportation is hard task that requires manpower and cost. Some sawmills installed low-pressure type steam boiler with steam engine for their sawing power using biomass of the wood chips and sawdust that produced from timber production. Howerver, most of the waste materials coming from sawmills are sold to nearby households and restaurants for cooking fuel.

- 2 - Nippon Koei / IEEJ Volume 8 Renewable Energy
The Study on Introduction of Renewable Energiesin Rural Areas in MYANMAR
Recently, a gasification system has been developed and practically used in Myanmar. It utilizes combustion gases produced from rice husk by dry distillation as a fuel of reciprocating engine and alternator after purification process of the gas to remove tar and dust. The system requires skilled operator for the process of the dry distillation and purification of the gas. Although some improvements are necessary for this system, this type of biomass-gasification power generation system would become the trump card for the promotion of rural electrification in Myanmar at this moment. The Fuel is available on site at cheap price and the construction cost is very low. Rice husk, sawdust and piece of wood, and other biomass materials can be used as long as they are easily collected in large amount for the fuel of biomass-gasification power generation unit.
Meanwhile, the research of generation technology by biomass application is prosperous to use it for the alternative energy sources of the fossil fuels such as coal and petroleum in the developed countries. The research contains steam boiler, gasification technique, and the strategy for a continuous supply of biomass energy. The prospect of the biomass energy utilization for power generation in Myanmar, blessed with plenty of water and solar energy, can be said to be bright, even some problems would be seen such as competition between forest and cultivating field or production among food and energy.
1.2 Power plants for a factory own use
The application of the power generation by the biomass energy can be summarized in the table below.
Table 1 Power Plant for a Factory Use
Factory Biomass Size of power plant Power generation method
300-1,000 kW Steam turbine Rice Mill Rice husk
20 kW-100 kW Gas engine Sugar Mill Bagasse 2,000-3,000 kW Steam turbine
200-500 kW Steam turbine Sawmill
Wood chips and sawdust 20kW-100 kW Gas engine
Maize factory Cobb and stalk 200-500 kW Steam turbine Note: The required size of power plant depends on a scale of the factory, amount of production, capacity of collection of raw materials, and the demand for the electric power of the factory. Generally the scale of sugar mills is large and that of rice mills is in various sizes. The electric power consumption in sawmills and maize mills are relatively small. For the power generation, generally steam turbines by biomass combustion are applied to power of factories themselves. Biomass gasification engine system is not popular at present but is promising in the future. When the ongoing gasification technology is improved,

- 3 - Nippon Koei / IEEJ Volume 8 Renewable Energy
The Study on Introduction of Renewable Energiesin Rural Areas in MYANMAR
generation by gas turbine would be also possible. The bagasse is inappropriate for the gasification system because it contains the moisture contents at more than 50% on the wet base.
If the factory is big enough, surplus of the electric power can be supplied to the National Grid.
Usually mechanical and electrical engineers are working in these factories. They can concurrently serve the post of the operation and maintenance works for the power generation unit.
1.3 Independent power plant
Recently some trials have been made to alternate coal to biomass such as wood chips in existing thermal power plants of coal combustion, and provide the power to national grid line in European countries. The alternation of diesel oil to biomass at independent small and middle scale power plants is studied in this section.
As for biomass fuel, the quantity and the available season is influenced by the harvesting and felling of the agriculture/forest products. It is important to check the relation of these factors as shown in the following chart.
Needs for the electrification ・Number of beneficiaries ・Demand of each household and their ability
to pay for the electricity tariff ・Hours of electric power supply (time/day)
Figure 1 Required item for the electrification by biomass
Biomass Size and management of the power plant
Type of biomass Organization for the management Available amount of biomass per year
System of generation and construction cost
Cost of the biomass (including transportation fee)
Funds for the construction
Available season/period (whole year or seasonal)
System for the operation and maintenance
- 4 - Nippon Koei / IEEJ Volume 8 Renewable Energy
The Study on Introduction of Renewable Energiesin Rural Areas in MYANMAR
2 APPLICATION AND ACTUAL CONDITIONS OF THE BIOMASS ENERGY TO POWER PLANT
2.1 Wood Combustion Steam Engine
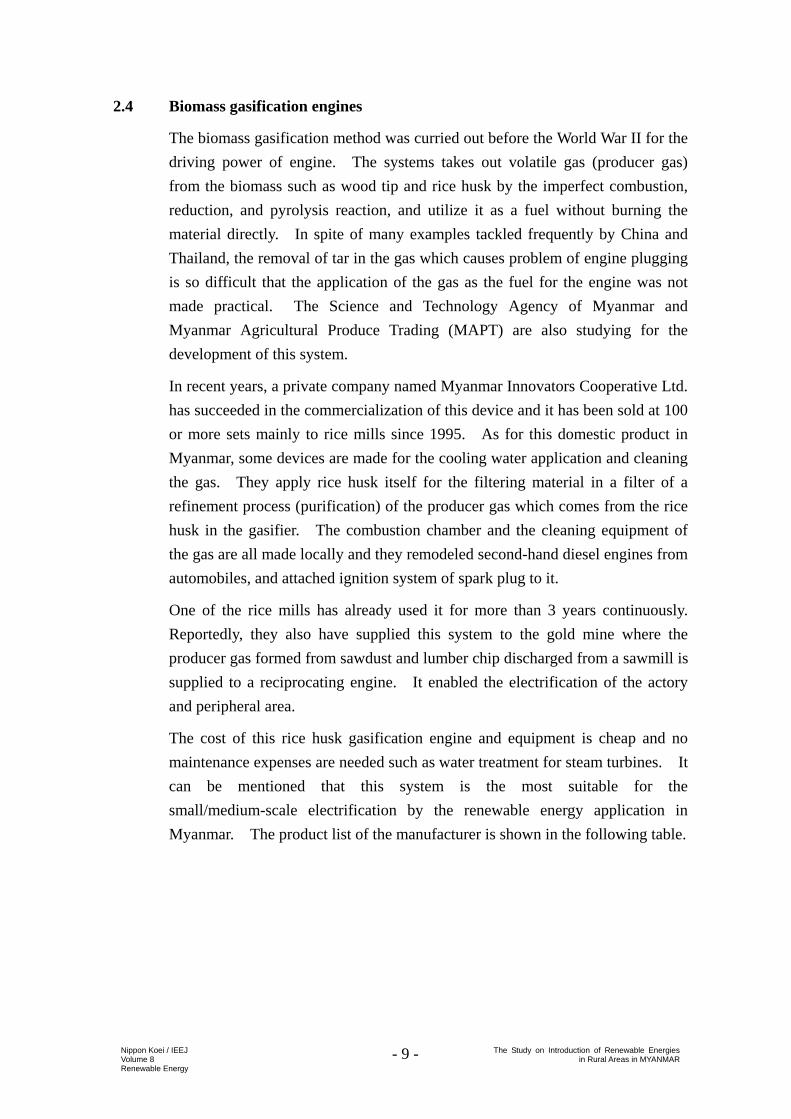
As for sawmills under the control of Ministry of Forestry, there are 85 plants in the whole country and the amount of production is 433,300 wood-ton per year (1 wood-ton is equivalent to 50 ft3). The biomass production in sawmills is shown in the following figure 2.
Table 2 Power Source of State Owned Sawmills
Power source Numbers Ratio Steam engine 11 13% Diesel engine 56 66%
MEPE electricity supply 18 21% Total 85 100%
Source: Myanmar Timber Enterprise, Ministry of Forestry. 1999
Figure 2 Timber production and wood-chips
Source: Myanmar Timber Enterprise, Ministry of Forestry. 1999
Assuming the amount of tree felling by private sawmills is the same as that of public sawmills, which the data was not available.
Amount of tree felling: 540,000 ton
To sawmills: 80%432,000 tons
Waste material from the felling: 20%108,000 tons (most of them are waste)
Timber: 70%, about 300,000 tonsfor construction materials
Remaining material: 20%, about 86,000 tonssupply to home/factory as firewood/charcoal
Sawdust: 10%, about 43,000 tonsSupply to home/factory as fuel

- 5 - Nippon Koei / IEEJ Volume 8 Renewable Energy
The Study on Introduction of Renewable Energiesin Rural Areas in MYANMAR
The gross weight of wood chips and sawdust will be:
(86,000 + 43,000) x 2 = 258,000 ton
The energy of this 258,000 ton of wood material would be equivalent to the heat energy of 1.29 billion kcal/year assuming the combustion energy of wood is 5,000 kcal/kg. This energy is equivalent to 129,000 tons of petroleum (TOE). The miscellaneous trees are felled as an integral part of forest control system in the mountainous area, other than the wood fuel supplied from sawmills.
If households in Myanmar stop using firewood, it would be possible to introduce steam turbine of wood combustion and/or wood gasification system for power generation. However, timber and charcoal will remain as the main source of fuel at homes in Myanmar for a moment.
2.2 Steam Turbine Power Generation Unit (PGU) by Rice Husk Combustion
1) Situation of the production and application of rice husk
Paddy production in Myanmar is 17.4 million ton (1997/98). As 20% of paddy weight is rice husk portion, the generation of husk is 3,480,000 tons/year. Based on the calorific value of rice husk of 3,000 kcal/kg, this amount is equal to 1,040,000 TOE. However, the actual amount of husk production that can be consumed as fuel is less than this figure.
Two types of rice mills exist in Myanmar. One is large-scale rice mills having special machines that remove rice husk from paddy prior to rice whitening process. Normally this type of medium or large-scale rice mills have a processing capacity at more than 1 ton/hour of paddy. The other type is a small-scale rice mills (capacity is around 0.5 ton/hour) where paddy is fed into a friction type chamber for rice whitening without any processes of removing husk. The latter type produces mixture of rice husk, rice bran, and small milled rice. The rice husk from the former one can be used as a fuel for combustion, but the mixture from the latter one is normally consumed as a feed of the poultry. Two to three units of this small-scale rice mills exist at each village for self-consumption of rice cultivating families. The estimated paddy amount being processed by medium and large-scale rice mills is 11,700,000 ton per year. Thus, rice husk that can be used as fuel will be 2,340,000 ton per year (equivalent to 700,000 TOE)
Most of medium and large-scale rice mills in Southeast Asian countries had equipped with husk combustion steam engine as a prime power source with intermediate axis drive method. However, rice millers are getting to replace

- 6 - Nippon Koei / IEEJ Volume 8 Renewable Energy
The Study on Introduction of Renewable Energiesin Rural Areas in MYANMAR
this kind of prime engine with electric motors or driving systems by diesel engines due to the superannuating and shortage of spare parts for steam boiler and steam engine. As the result, there are huge amount of rice husk left without being used, and the disposal of the husk remains problem as an industrial waste in some countries such as Thailand and Malaysia. But brick factories, spirits distilleries, restaurants, homes and etc. in Myanmar are still using rice husk as an important fuel source and rice husk is being traded on the commercial base. However, much amount of husk still in surplus in rice producing area such as Ayeyarwaddy division.
2) Situation of Rice Husk Combustion Power Generation Unit (PGU)
There are 13 power plants installed and 12 power plants are still powered by rice husk combution PGU among 67 number of state owned rice mills.
Table 3 A list of Rice Mills Equipped With Husk Combustion PGU
Milled rice Processed
Name of Rice Mill
Division/ State
Capacity
(ton/day)
99/00 00/01
Capacity of PGU (kW)
Construction year
Project Name
1 Ngapudaw Ayeyarwaddy 100 6,417 4,233 360 1987 ADB 2 Laputta Ayeyarwaddy 100 9,907 6,105 360 1987 ADB 3 Laputta Ayeyarwaddy 100 10,760 8,174 360 1987 ADB 4 Maubin Ayeyarwaddy 100 9,824 8,586 360 1987 ADB 5 Bogalay Ayeyarwaddy 75 6,068 5,263 200 1963 GER 6 Daedayee Ayeyarwaddy 100 9,827 6,664 360 1984 OECF 7 Daedayee Ayeyarwaddy 100 8,682 6,748 360 1987 ADB 8 Mawkyun Ayeyarwaddy 75 10,240 6,063 200 1964 GER 9 Kanaungtoe Yangon 150 18,952 12,568 *445 1985 OECF 10 Kwungyang Yangon 100 10,321 5,857 360 1986 ADB 11 Kawmhu Yangon 100 7,899 4,414 360 1986 ADB 12 Sittwe Rakhine 75 2,493 1,780 200 1965 GER 13 Sittwe Rakhine 75 3,207 729 200 1962 GER Total - - 1,250 114,597 77,184 4,125 - - Total of 67 rice mills owned by the state
4,438 358,534 251,926 - - -
Percentage of R/M equipped with husk PGU in 67 state rice mills
28% 32% 30%
Source: Myanma Agricultural Produce Trading, Ministry of Commerce
Note: * mark means out of order

- 7 - Nippon Koei / IEEJ Volume 8 Renewable Energy
The Study on Introduction of Renewable Energiesin Rural Areas in MYANMAR
2.3 Bagasse Combustion Steam Turbine Power Generation Unit (PGU)
1) Situation of Production and Application of Bagasse
Bagasse is a waste material of squeezed sugarcane produced in sugar mills. The weight is 25-29% of sugarcane. As its moisture contents is high as much as 50-55%, the combustion calorie is low. For the design purpose of bagasse combustion boiler, the heat value of 1,840 kcal/kg is normally applied.
The sugarcane production in Myanmar is about 4 million tons per year and the producing center is focusing on central part of Myanmar in Bago Division, Magwe Division, Mandalay District, and Shan State, and sugar mills are dotted in those area.
Myanma Sugarcane Enterprise (MSE) under Ministry of Agriculture & Irrigation owns 17 sugar mills from new one to old one (see the table in the next page ). Total processing capacity is 25,600 tons of sugarcane per day. Seven sugar mills newly constructed have not been operated at full stretch, but total processing amount by state own sugar mills would be around 2,500,000 tons, equivalent to 50% of total sugarcane produced in Myanmar (5,050,000 ton)
Among 17 state sugar mills, 15 sugar mills are equipped with power generating unit of baggase combustion steam turbine. Private sugar mills are dispersed in many places in Myanmar but most of those mills are of small-scale and they are using diesel engine for the power source. These small-scale sugar mills use bagasse as the heat source for steam formation of boiler or scalding in the process of sugar juice. There seems to be no private sugar mills equipped with steam turbine power plant by baggase combustion.
Large-scale sugar mills in Myanmar have processing capacity of 1,500-2,000 tons per day in average. This size is not enough big to have a role of small-scale power producing company (SPP) in addition to power his own plant as the cases n in Thailand and Philippines. In the future, were these sugar mills to be integrated to extra-large mill having capacity of 5,000-8,000 ton/ day, it would be possible to supply his surplus electricity to the national grid of MEPE though the limited operation period of 5 to 6 months per year as SPP. If other source of fuel supply should be secured than bagasse in the season without harvest, these sugar mills would be able to operate as SPP throughout a year. State-owned sugar mills are listed in the table below.

- 8 - Nippon Koei / IEEJ Volume 8 Renewable Energy
The Study on Introduction of Renewable Energiesin Rural Areas in MYANMAR
Table 4 The outline and its PGU of state owned sugar mills
Name of the factory
State/ Division
Capacity (Crushing capacity)
Bagasse combustion PGU
Start year
Remarks
1 Pyinmana No. 1 Mandalay 1,500 ton/day 2,000 kW 1957 Japan 2 Pyinmana No. 2 Mandalay 1,500 ton/day 2,000 kW 1984 Japan 3 Yedarshe Bago 1,500 ton/day 2,000 kW 1991 Japan 4 Zeyawady Bago 1,500 ton/day 2,000 kW 1986 Czecho 5 Kyauktaw Rakhine 300 ton/day None 1983 Netherlands 6 Shwenyaung Shan 300 ton/day None 1983 Netherlands 7 Bilin Mon 1,000 ton/day Indistinct 1966 China 8 Namti Kachin 1,000 ton/day Indistinct 1956 Netherlands 9 Pye Myayar Bago 2,000 ton/day 3,000 kW 1999 Thailand 10 Dahatkone Mandalay 1,500 ton/day 2,000 kW 1999 China 11 Taungzinaye Mandalay 1,500 ton/day 2,000 kW 1999 China 12 Duyingabo Magwe 2,000 ton/day 3,000 kW 1999 China 13 Paukkhaung Bago 2,000 ton/day 3,000 kW 1999 China 14 Okatwin Bago 2,000 ton/day 3,000 kW 1999 China 15 Myohla Bago 2,000 ton/day 3,000 kW 1999 China 16 Okkan Yangon 2,000 ton/day 3,000 kW 1999 China 17 Yoneseik Magwe 2,000 ton/day 3,000 kW 1999 China Total --- 25,600ton/day (33,000 kW)
Source: MSE
Note: ① The PGU capacity is from actual output. Each mill has the turbine generator of 2-3 units and
keeps 1 unit as a reserve unit. In Yedarshe Mill, there are 2 units of the steam turbine generator of
2,000 kW. Normally they operate the mill for 24 hours a day for 15 days and stop the operation
for 2 days for cleaning of sugarcane processing lines. At the resumption, the generator kept
reserve is used for the operation and the generators are used by turn. At Myohla Mill, 3 units of
1,500 kW PGU exist, 2 units are always operated, and 1 unit is kept waiting.
② The combustion energy of bagasse is insufficient in Pyinmana Mill and they have to utilize
wooden materials as fuel together with bagasse. In Yedarshe Mill, meanwhile, bagasse surplus is
used for a paper manufactory as raw materials. Some baggase is still remaining and is burnt in
the field outside of the mill, which causes an environmental problem in Yedarshe mill.
③ 8 units of newly established Chinese mills started operation in 1999 but many mechanical
problems have occurred. Therefore they cannot reach at its full operation and the maximum
power output and the power consumption are not shown except for the nominal/designed capacity.
- 9 - Nippon Koei / IEEJ Volume 8 Renewable Energy
The Study on Introduction of Renewable Energiesin Rural Areas in MYANMAR
2.4 Biomass gasification engines
The biomass gasification method was curried out before the World War II for the driving power of engine. The systems takes out volatile gas (producer gas) from the biomass such as wood tip and rice husk by the imperfect combustion, reduction, and pyrolysis reaction, and utilize it as a fuel without burning the material directly. In spite of many examples tackled frequently by China and Thailand, the removal of tar in the gas which causes problem of engine plugging is so difficult that the application of the gas as the fuel for the engine was not made practical. The Science and Technology Agency of Myanmar and Myanmar Agricultural Produce Trading (MAPT) are also studying for the development of this system.
In recent years, a private company named Myanmar Innovators Cooperative Ltd. has succeeded in the commercialization of this device and it has been sold at 100 or more sets mainly to rice mills since 1995. As for this domestic product in Myanmar, some devices are made for the cooling water application and cleaning the gas. They apply rice husk itself for the filtering material in a filter of a refinement process (purification) of the producer gas which comes from the rice husk in the gasifier. The combustion chamber and the cleaning equipment of the gas are all made locally and they remodeled second-hand diesel engines from automobiles, and attached ignition system of spark plug to it.
One of the rice mills has already used it for more than 3 years continuously. Reportedly, they also have supplied this system to the gold mine where the producer gas formed from sawdust and lumber chip discharged from a sawmill is supplied to a reciprocating engine. It enabled the electrification of the actory and peripheral area.
The cost of this rice husk gasification engine and equipment is cheap and no maintenance expenses are needed such as water treatment for steam turbines. It can be mentioned that this system is the most suitable for the small/medium-scale electrification by the renewable energy application in Myanmar. The product list of the manufacturer is shown in the following table.

- 10 - Nippon Koei / IEEJ Volume 8 Renewable Energy
The Study on Introduction of Renewable Energiesin Rural Areas in MYANMAR
Table 5 The Product List of Rice Husk Gas Engine by MIC (Mar,2002)
The source: Myanmar Innovators Cooperative Ltd.
Note: ①"Basket" is commonly used as a unit to measure the amount of rice husk. One basket
weighs about 5.2 kg.
② In the test data in Japan (Agriculture Mechanization Research Institute), to obtain the
power generation of 1kWh, it requires 3-5kg of rice husk but 2.0-2.2kg is indicated in
China.
③ It is necessary to scrutinize actual relation between the fuel consumption rate and power
generation of the unit in Myanmar.
As mentioned in chapter 2.2, the rice husk discharged from commercial rice mills is estimated at 2,340,000 tons per a year. 2,340,000 tons of rice husk is equal to 1,064 GWh, when 2.2 kg of rice husk is required to produce 1 kWh by the gasification engine tentatively. This corresponds to as much as 21% of MEPE’s total power generation of 5,020GWh in whole country in the fiscal year of 2000.
In addition, the gas volume discharged by the gasification of 1kg of rice husk is approximately 1m3. The combustion energy of this gas is 1,000 to1,300 kcal/m3 (gasification efficiency is 30-33%). On the other hand, the low calorific value of rice husk is generally set to be 3,000 kcal/kg for steam turbine power generation. It can be said that most difference of the calorific value between gasification (1,000-1,300kcal/kg) and combustion (3,000kcal/kg) remains in the ash of husk as fixated carbon. Agriculture Mechanization Research Institute of Japan had an experiment that makes tar contained in producer gas is collected, dried, combined with husk ash, and made into charcoal briquette. If this technology is to be spread in Myanmar, it will be possible to utilize the briquette as an important heat source for cooking in household and small commercial use.
Output Price
pRice Husk perOutput
(kw) (1,000Kyat)Numberof Baskets (kg/h) (kg/kWh)
RH-3 13.5 2,028 4 21 1.54RH-4 14.5 2,148 5 26 1.79RH-6 23 3,138 7 36 1.58RH-10 30 4,337 12 62 2.08RH-15 65 8,694 18 94 1.44RH-18 75 10,212 22 114 1.53RH-20 85 11,647 24 125 1.47
Consumption ofRice Husk Per Hour
Name ofthe Model

- 11 - Nippon Koei / IEEJ Volume 8 Renewable Energy
The Study on Introduction of Renewable Energiesin Rural Areas in MYANMAR
Also, it would be effective to some extent to decrease the amount of felled trees and prevent deforestation.
Following table shows the number of large scale rice mills in each state/division in Myanmar and the ability of power generation by producer gas engine generator using rice husk being discharged from these mills.

- 12 - Nippon Koei / IEEJ Volume 8 Renewable Energy
The Study on Introduction of Renewable Energies in Rural Areas in MYANMAR
Table 6 Large Scale Rice Mills in Myanmar
Upper: Private Sector (Source: Myanmar Rice Millers Association)Lower: State Enterprise Owned by MAPT. (Source: Myanmar Agricultural Produce Trading, MAPT)
No. Capa/24hrs 10< 11-15 16-20 21-25 26-30 31-35 36-40 41-45 46-50 51-55 56-60 61-70 71-75 76-100 100<State/Division
1 Ayeyarwaddy 0 228 175 87 53 12 14 22 16 5 8 0 0 1 2 623 6420 0 0 0 0 0 1 0 2 0 0 0 4 0 12 19
2 Bago 0 123 34 79 15 1 17 3 9 2 3 2 0 0 0 288 3030 0 0 1 0 0 2 0 3 0 0 0 4 0 5 15
3 Yangon 0 127 22 21 6 1 16 2 4 0 1 0 0 0 0 200 2120 0 0 0 0 0 1 0 1 0 0 0 2 0 8 12
4 Sagaing 2 20 37 49 6 0 0 0 1 0 0 0 0 0 0 115 1210 0 6 0 0 0 0 0 0 0 0 0 0 0 0 6
5 Mon 2 65 7 7 9 0 8 3 0 1 1 0 1 0 0 104 1040 0 0 0 0 0 0 0 0 0 0 0 0 0 0 0
6 Mandalay 4 58 5 8 4 0 3 0 0 0 0 0 0 0 0 82 820 0 0 0 0 0 0 0 0 0 0 0 0 0 0 0
7 Kachin 14 12 0 1 3 0 0 0 0 0 0 0 0 0 0 30 310 0 1 0 0 0 0 0 0 0 0 0 0 0 0 1
8 Magway 0 9 2 14 2 0 0 0 0 0 0 0 0 0 0 27 290 0 2 0 0 0 0 0 0 0 0 0 0 0 0 2
9 Tanintharyi 0 15 1 1 0 0 0 0 0 0 0 0 0 0 0 17 170 0 0 0 0 0 0 0 0 0 0 0 0 0 0 0
10 Rakhine 0 13 0 1 0 0 0 0 0 0 0 0 0 0 0 14 251 2 0 4 0 0 1 0 0 0 0 0 3 0 0 11
11 Kayar 0 2 3 2 0 0 0 0 0 0 0 0 0 0 0 7 80 0 1 0 0 0 0 0 0 0 0 0 0 0 0 1
12 Shan 5 0 0 0 0 0 0 0 0 0 0 0 0 0 0 5 50 0 0 0 0 0 0 0 0 0 0 0 0 0 0 0
Total ・Private 27 672 286 270 98 14 58 30 30 8 13 2 1 1 2 1512 1579Total ・State 1 2 10 5 0 0 5 0 6 0 0 0 13 0 25 67TOTAL 28 674 296 275 98 14 63 30 36 8 13 2 14 1 27 1579
Total

- 13 - Nippon Koei / IEEJ Volume 8 Renewable Energy
The Study on Introduction of Renewable Energies in Rural Areas in MYANMAR
Note: 1. The capacity of rice mill indicates the amount of white husk production per day, supposing continuous operation of 24 hour/day. 2. Data of private mills in each Division/State is derived from Cooperatives of Rice Mills. The liability of this data and the number of rice mills other than the
member of the cooperative is unclear. The amount of processed paddy and operation days per year of each mills are changing depending on year and place. 3. It is said that there are 20,000 rice mills for the self-consumption of farmers domestically. No husk discharged from them is used for fuel, as they are mixed
with rice bran and used for the feed of poultry. 4. Rice husk discharged from rice mills is not only used for the household fuel but also utilized widely for the fuel for the boiler of alcohol distillation, unglazed
pottery, brick factory, and so on. It is important to study the consumption of those factors in addition to the amount of available rice husk when husk is used for the resource of power generation.

- 14 - Nippon Koei / IEEJ Volume 8 Renewable Energy
The Study on Introduction of Renewable Energies in Rural Areas in MYANMAR
Table 7 Number of Potential Power Generating Unit (PGU) by Size in State/Division
No. Rice Mill Capacity 10< 11-15 16-20 21-25 26-30 31-35 36-40 41-45 46-50 51-55 56-60 61-70 71-75 76-100 100< TotalAv. Capacity 5 13 18 23 28 33 38 43 48 53 58 65 73 88 150
Size of PGU(kW) 10 20 30 40 50 60 65 70 80 90 100 110 120 150 2601 Ayeyarwaddy 0 228 175 87 53 12 15 22 18 5 8 0 4 1 14 6422 Bago 0 123 34 80 15 1 19 3 12 2 3 2 4 0 5 3033 Yangon 0 127 22 21 6 1 17 2 5 0 1 0 2 0 8 2124 Sagaing 2 20 43 49 6 0 0 0 1 0 0 0 0 0 0 1215 Mon 2 65 7 7 9 0 8 3 0 1 1 0 1 0 0 1046 Mandalay 4 58 5 8 4 0 3 0 0 0 0 0 0 0 0 827 Kachin 14 12 1 1 3 0 0 0 0 0 0 0 0 0 0 318 Magway 0 9 4 14 2 0 0 0 0 0 0 0 0 0 0 299 Tanintharyi 0 15 1 1 0 0 0 0 0 0 0 0 0 0 0 1710 Rakhine 1 15 0 5 0 0 1 0 0 0 0 0 3 0 0 2511 Kayar 0 2 4 2 0 0 0 0 0 0 0 0 0 0 0 812 Shan 5 0 0 0 0 0 0 0 0 0 0 0 0 0 0 5
TOTAL 28 674 296 275 98 14 63 30 36 8 13 2 14 1 27 1579
Calculation:Av. Capacity: Average Capacity of the Rice Mill in White Rice output per 24hours operation per day.
Milling Recovery (White rice amount from paddy) is 0.61 as per MAPT's standards. (Av. Capa ÷ 0.61) ÷ 24 hours x 0.2 Husk amount is approx. 20% of paddy weight
PGU capacity: 1 kWh requires 2.2kg of husk by Gas-Engine, thus husk amount ÷ 2.2kg/kWh = Electric power outputPlant Factor: 0.4. Therefor (PGU Capacity) ÷ 0.4 = Size of Power Plant
Example: 23 ton rice mill Paddy amount can be milled per day: 23 ÷ 0.61 = 38 ton/24hr (1.58 ton/hour)
Husk amount can be available per hour: 20% of paddy (1.58 x 0.2 = 0.316ton = 316kg)Electric power generation capacity: 2.2 kg of husk can generate 1 kWh ; 316 ÷ 2.2 = 143kWRice mill operation rate: 8hours/24hrs and 120days/365days ; 143kW x (8/24) x (120/365) = 16kWhPower factor is 0.4: Power Plant is ; 16 ÷ 0.4 = 40kW
Husk disposal per Hour:
- 15 - Nippon Koei / IEEJ Volume 8 Renewable Energy
The Study on Introduction of Renewable Energiesin Rural Areas in MYANMAR
The number of the rice mills by State/Division is derived from the List of Rice Mills in the table above. To assess the power output from rice husk, the following calculation is applied;
1) The processing capacity of the mills is presented as the amount of polished rice produced in 24 hour/day operation.
2) The amount of polished rice is converted into the amount of rice paddy, and the production of the rice husk is calculated. The yield rate of rice husk out of rice paddy is 0.61, the standard value used in MAPT.
3) The yield of rice husk is assumed from the amount of processed rice paddy per hour. 0.316 ton of rice husk is produced from the rice paddy processed at 1.58 ton per hour, where the ratio of the weight of the husk is 20 % of that of rice paddy.
4) The power generation from a rice husk gas engine is assumed that 1 kWh is generated from 2.2 kg of husk according to the information of MIC. (The study*1 shows the required rice husk for the generation of 1 kWh is about 5 kg. Considering this data can be applied to Myanmar, the power output is assumed about half of the assumption above. MIC have studied the actual output for the rice husk gas engine.
5) The calculation above does not contain the consumption of the power for the factory-own use. It is supposed that the rice mill utilize the half production of rice husk for the driving power of the mill during eight hours operation. The rest of the biomass is suggested to be consumed for the electrification of the village in the nighttime according to the demand and availability of rice husk. When the amount of rice husk is insufficient, it is necessary to collect rice husk from peripheral areas. It is important to study the demand of the village, milling capacity of the mill and the amount of production of husk, and the location of the rice mill.

- 16 - Nippon Koei / IEEJ Volume 8 Renewable Energy
The Study on Introduction of Renewable Energiesin Rural Areas in MYANMAR
3 POSSIBILITY OF THE RURAL ELECTRIFICATION BY BIOMASS ENERGY APPLICATION
3.1 Comparison of the Biomass Energy in Rural Electrification (RE) Regarding the electrification of rural area, rice husk is the most advantageous among biomass energies based on the present condition of Myanmar as shown in the following table. The application of wood chips and sawdust from the sawmills for the RE is also considerable in the near future.
Table 8 Comparison of the biomass energy for RE
Type of biomass
Availability (Low calorific value)
Application at present Possibility of the fuel for RE
Rice husk 2,340,000 tons (7 x 10¹² kcal)
Power source of rice mills (steam engine) Fuel for cooking stove in a home Fuel for other industries (alcohol brewery, brick factory, dairy products)
Large possibility in the area where rice husk is available.
Small possibility in the area where rice husk is insufficient, due to collection and transportation problems.
It is possible to supply electricity through a year, depending on the operation of rice mills.
Bagasse 1,300,000 tons (2.4 x10¹² kcal)
Fuel for a boiler of sugar mills (The surplus bagasse is used as a material of a pulp factory)
Most of the bagasse is self-consumed in the factory.
Bagasse is able to be supplied only for 5 to 6 months per year.
Application for RE is inappropriate.
Wood chips and Sawdust
258,000 tons (1.3 x10¹² kcal)
For the fuel at home /restaurants For other industries
The demand as the fuel for home is very high.
Possibility in the future is very high.
Others Fuel of farmhouses Collection of material and seasonal fluctuation would be problems
3.2 Biomass application for RE at rice mills/sawmills periphery
At present, as for application of biomass power generation in Myanmar, there are two kinds of the ongoing power generation systems, that is steam turbine method

- 17 - Nippon Koei / IEEJ Volume 8 Renewable Energy
The Study on Introduction of Renewable Energiesin Rural Areas in MYANMAR
by biomass combustion and engine-drive method by biomass gasification. The characteristics of those two methods can be compared as seen in the table below.
Table 9 Comparison of the Characteristics of Steam Turbine and Gasification Engine
Steam turbine Gasification engine Type of biomass
Rice husk Bagasse Rice husk Sawdust (Wood chips)
Power generation (kW)
360, 450 2,000-3,000 15-100 20
Operational condition
State owned 8 rice mills (MAPT) are under operation 10-12 hours operation per day, 200 days operation per year in average
State owned 15 sugar mills (MSE) are under operation 24 hours operation per day, 150 days operation per year in average. (Continuous operation for 15 days and 2 days for the maintenance)
Several private rice mills use PGU Introducing RE in Ayeyarwaddy and Kachin 5-6 hours power supply per day (details are not known)
1 site of the gold mine has this PGU. MIC installed two sets in Kachin and Shan State.
Characteris- tics
PGU is installed for the self-consumption of the rice mills independently. It is not used for RE except for the power supply to accommodations for the workers. Construction cost: US$3,000/kW in around
PGU is installed for the self-consumption of the sugar mills independently It is not used for RE except for the power supply to accommodations of workers. Construction cost: US$2,000/kW in around
Mainly used for the power source of rice mills. Recently it is introduced to RE. Operation & maintenance system need to be established. Construction cost: US$4-800/kW in around
The self-consumption power source for the gold mine. Wood materials as fuel seems to be cut in the periphery forest around the mine.

- 18 - Nippon Koei / IEEJ Volume 8 Renewable Energy
The Study on Introduction of Renewable Energiesin Rural Areas in MYANMAR
Advantage in RE
It is possible to provide the power to the national grid in addition to the self-use when a high efficiency PGU is introduced. Planning continuous operation is possible.
Same as the left column.
It is possible to introduce PGU in accordance with the needs and availability of biomass. Construction cost is low
Same as the left column
Problem in RE
Power supply for RE is not possible when the operation is paused.
Same as the left column
Fuel, operation engineers, and management group need to be secured. Construction funds need to be procured. Continuous power supply hours per day is limited.
Same as the left column.
3.3 Biomass Gasification Power Generation at Rice Mills & Sawmills Periphery 3.3.1 Advantages and Disadvantages of Biomass Gasification engines
(1) Advantages
Local Technology
Biomass gasification is the local technology and is manufactured domestically in Myanmar. The gasifier is fabricated by the local producer, which enables both installation and repair of the gasifier unit with lower cost and shorter time than the international traded products. On the other hand, as the engine is generally imported or obtained as second handed one, the parts of the engine for repair is sometimes difficult to obtain.
Locally available and renewable fuel
It utilizes local energy of waste materials that is produced from water, minerals from soil, and sun shine. Although the materials such as saw dust and rice husk is used as fuel in homes and industries, the price of the fuel is much less than fossil fuel and it saves foreign currency that is required for importing fossil fuel used for power generation.
Continuous operation
- 19 - Nippon Koei / IEEJ Volume 8 Renewable Energy
The Study on Introduction of Renewable Energiesin Rural Areas in MYANMAR
Operation is possible to be held continuously at maximum 20 hours/day, depend on the fuel availability and engine condition.
Low installment cost
The installment cost, 400-800 $/kW, is lower than other renewable sources of solar and wind. Different from solar and wind power, the cost would be lower than the maximum level for villagers that is managed to be prepared by themselves.
(2) Disadvantages Secure of the fuel
Fuel must be secured and managed in accordance with the consumption. Usually rice husk produced minimum before paddy harvest season. It requires a storage to prepare the annual consumption so that not to run out the rice husk in the shortage season.
Labor work and maintenance
The system has to be operated by a trained engineer. Regular removal of tar and clean of the system is necessary.
Ventilation
Producer gas contains much amount of carbon monoxide, which is hazardous to the health combining with haemoglobin and preventing oxygen absorption and distribution in the blood. Although there is little possibility that the gas could leak from the gasifier system, the operation house should be enough ventilated in case.
Transportation
Rice husk is bulky, for the specific weight is about 0.1 and the transportation of rice husk is costly and time consuming. The power house should be located to be near the place where the biomass is produced such as rice mill.
3.3.2 Technical Matters to be Considered
(1) Tar
The producer gas formed from gasifier contains tar, which causes the trouble of plugging the engine. Tar is very sticky and adhesive material consists of hydrocarbon compounds mainly heavier than benzene. This tar problem has been an obstacle of the development of biomass gasification technology.
Daily maintenance is necessary such as cleaning, removal of tar in the gas pipes and towers, and changing rice husk filters.
As for the study of tar removal, Termiska, Swedish company, has commercialized biomass gasification system with tar-cracking unit using dolomite. Tar cracker is set at 900 degree-C in the gasifier before the producer gas is induced into the cyclone for removing dust in Biomass Integrated Combined-cycle, circulation fluidised gasification system.
Dolomite is a mineral consists of carbonate and magnesium calcium, and it behaves as a catalyst in the reaction for the decomposition of tar. Catalytic tar removal is said to be one of the most efficient ways to clean the producer gas.
- 20 - Nippon Koei / IEEJ Volume 8 Renewable Energy
The Study on Introduction of Renewable Energiesin Rural Areas in MYANMAR
The other way for removing tar is to inject moisture and air of high temperature (400-1000 degree-C) in the reformer and decompose the tar into CO and H2
*4. This system requires rather complicated equipment and higher installation cost.
In Japan, they have developed the dry system of the gasification, which does not discharge wastewater in consideration of the environmental problem. The tar mixed in the gas is removed by the combination of cyclone and water spray system to the outside of the gas pipes and husk filters.
The technology that produces ash-briquette, mixing the ash with the tar, separated from the gas had been achieved. If this ash-briquette is supplied in stable as the cooking fuel to households, it would have some contribution to the prevention of the deforestation being caused by the collecting the wood materials by households.
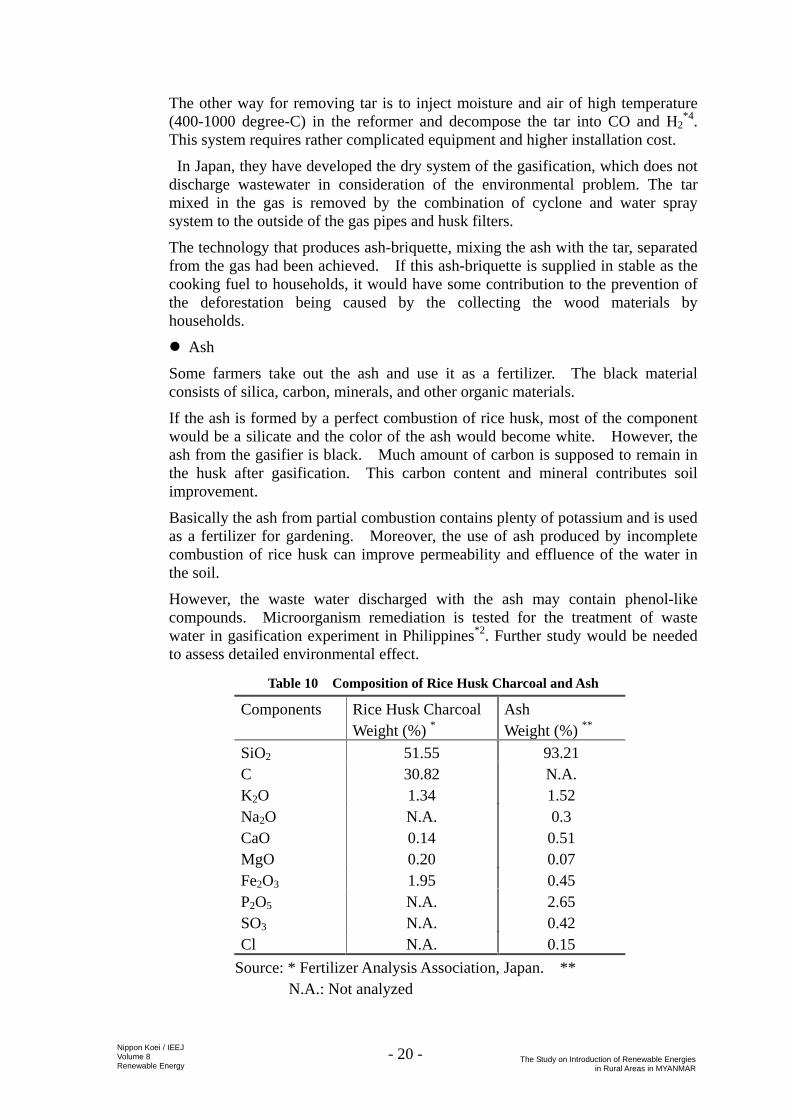
Ash
Some farmers take out the ash and use it as a fertilizer. The black material consists of silica, carbon, minerals, and other organic materials.
If the ash is formed by a perfect combustion of rice husk, most of the component would be a silicate and the color of the ash would become white. However, the ash from the gasifier is black. Much amount of carbon is supposed to remain in the husk after gasification. This carbon content and mineral contributes soil improvement.
Basically the ash from partial combustion contains plenty of potassium and is used as a fertilizer for gardening. Moreover, the use of ash produced by incomplete combustion of rice husk can improve permeability and effluence of the water in the soil.
However, the waste water discharged with the ash may contain phenol-like compounds. Microorganism remediation is tested for the treatment of waste water in gasification experiment in Philippines*2. Further study would be needed to assess detailed environmental effect.
Table 10 Composition of Rice Husk Charcoal and Ash
Components Rice Husk Charcoal Weight (%) *
Ash Weight (%) **
SiO2 51.55 93.21 C 30.82 N.A. K2O 1.34 1.52 Na2O N.A. 0.3 CaO 0.14 0.51 MgO 0.20 0.07 Fe2O3 1.95 0.45 P2O5 N.A. 2.65 SO3 N.A. 0.42 Cl N.A. 0.15
Source: * Fertilizer Analysis Association, Japan. ** N.A.: Not analyzed

- 21 - Nippon Koei / IEEJ Volume 8 Renewable Energy
The Study on Introduction of Renewable Energiesin Rural Areas in MYANMAR
Spear parts
The power generation system of biomass gasification made in Myanmar uses second-handed diesel engine that was procured in a market in Yangon city. It is suggested that an organization should be set up for the supply of the spare parts of second hand engines.
Consumption of biomass
The rice husk is widely used as the power sources of rice mills, the heat source for alcohol brewery, brick factory, and for the cooking fuel of homes in surrounding areas. Accordingly, it is necessary to check the consumption of the rice husk that has been required in addition to the location of the rice mills in detail, when the construction of rice husk gasification power plant is planned. However, if the rice mill uses an old fashioned smoke-cube boiler and a steam engine of which heat efficiency is very low and consumes a lot of husk, it is possible to utilize husk from this rice mill for RE by exchanging the smoke-cube boiler to the gasification engine.
Technology improvement for the large scale generation
It will be necessary to improve and enlarge the existing local gasification system. The study of the high voltage system such as 6 kV transmission line from the powerhouse of gasifier to the site will be needed. Furthermore, it may be necessary that the technical test of the synchronous power generation of the plural power stations with biomass gasification engine be examined.

- 22 - Nippon Koei / IEEJ Volume 8 Renewable Energy
The Study on Introduction of Renewable Energiesin Rural Areas in MYANMAR
4 SELECTION STANDARD AND THE PRIORITY FOR RE BY BIOMASS GASIFICATION
4.1 Factors of RE site selection For planning and executing biomass gasification PGU by an organization for electrification such as village electrification committee, following factors must be considered and clarified.
(1) Strong Willingness to the Electrification.
This is the most important factor in terms of sustainability. Building up an electrification committee, operation, maintenance, funding, collection of tariff, etc.., are all dependent on this issue.
(2) Willingness to Pay for the Electricity
It is important for villagers to have the willingness and ability to pay for both installation cost and monthly tariff for maintenance. The initial cost per household would be 50$ to 150$, depend on the size and number of the household of beneficially.
(3) Size of the Village
It is preferable that the number of the household of the village should be more than 200, otherwise the allocation of capital cost per a household become large. Generally, the larger number of households participate and the more concentrated they live, the smaller the amount of the allocation for each household would be.
(4) Secure of the Fuel
Biomass resources for generation must be secured continuously throughout the year. There should be rice mills or sawmills beside the powerhouse and the output of agricultural residuals such as rice husk and wood materials are available from them. They have to secure the biomass of daily consumption, annual consumption, and place and building for storage.
(5) Human Resource
The operation/maintenance engineer(s) of the biomass gasification PGU must be selected from the target village. Line engineer, tariff collector, and accountant would also be necessary. Cooperation of rice mill/saw mill owner is important.
4.2 The Standards for the Priority of RE by Biomass Gasification PGU
Considering the factors discussed in chapter 4.1, the following would be the standard for the site selection of the village electrification.
(1) Governmental development priority area or the area of JICA development plan
(2) Areas that high cost efficiency is expected
(3) Influence on the adjacent areas is expected to be large, for example, along the main road.
(4) Effects of the economic development by RE is expected such as an introduction of the agro-industries

- 23 - Nippon Koei / IEEJ Volume 8 Renewable Energy
The Study on Introduction of Renewable Energiesin Rural Areas in MYANMAR
5 POWER GENERATION BY BIOGAS APPLICATION
5.1 General Aspect Generally the gas produced from biomass by a microbial process of anaerobic fermentation process (methane fermentation) is called “biogas”. It is different from producer gas formed from the pyrolysis of biomass gasification. Biogas is used as a fuel for heating, cooking, and generating electricity. Biogas introduction as a fuel for the cooking is advanced in China and India and large plants are installed in Europe, especially in Germany. It can be applied for broad variety of generation, from a few kW to a scale of MW. Power generation plants using biogas and refueling facilities for the gas engine are also under operation by a large-scale facility of methane production in the world. In Europe, on the other hand, the introduction of the fermentation facilities is being promoted for the processing of organic disposals and the excreta of livestock for the prevention of global worming in recent years. It is said that a lot of plants of large scale power generation use biogas, produced from excreta of livestock, agricultural residues, commercial kitchen garbage, home kitchen refuse and etc. In Germany, the segregated disposal is performed thoroughly, which enables large-scale biogass power plant using excrete of milk caw, agricultural residuals, commercial and domestic raw materials. There are more than 1,000 units of biogass power plants installed in Germany by the year of 2,000.
This gas is made of 50 to 70% of methane gas, which is a main combustible component. The rest mainly consists of carbon dioxide, small component of ammonia, hydrogen, nitrogen, oxygen, and hydrogen sulfide at 6-8%. This gas has calorific value at 5,500 to 6,500 kcal/m3, which corresponds to the half of city-provided gas or 1/4 of propane gas. Biogas fermentation is held in a strict anaerobic (oxygen free) condition and produced in an airtight fermenting tank with biomass such as excrement of livestock and human being, agricultural residues, kitchen garbage, waste from beer industry, etc., inside it. The produced methane gas is stored in a gas holder and is consumed for cooking, hot water supply, and heating.
The advantages of biogas is low NOx is exhausted from the engine using biogas after combustion. It was about 1/3 that of natural gas when it is used as a fuel of engine. Biogas contains H2S, which causes erosion of pipe and equipment and would be a source of SOx. H2S can be removed by absorption of iron oxide.
5.2 Large Scale Biogas Plant
One example for large-scale biogas plant consists of 2 units of each 630 kW, total 1,260 kW, and 1,700 kW hot water supply system. It is operated by 2 units of 3,300 m3 fermentation tank, processing 13,000 tons of organic industrial wastes, 15,000 tons of classified raw garbage, tons of and 57,000 tons of agricultural residues per year. The component of the biogas and its amount is variable depending on the type of biomass source and the condition of fermentation such as temperature and time. The production of biogas fluctuates widely by the type of organic source. Also, in order to maintain the biogas production constant every day, the residue and other processed materials is treated appropriately, the

- 24 - Nippon Koei / IEEJ Volume 8 Renewable Energy
The Study on Introduction of Renewable Energiesin Rural Areas in MYANMAR
biomass is supplied continuously, and the temperature control and stirring in the tank is operated properly.
The average production of the biogas obtained from 1 ton of biomass material is shown in the table below.
Table 11 Volume and Heat Capacity of the Biogas Obtained from 1 ton of the Biomass
Type of the material
Organic composition
Amount of produced biogas (unit: m3/ton)
Heat value (unit: 103 kcal)
Amount of kerosene conversion (unit: liter)
Home food residues
Carbohydrate, protein, lipid
150-240 900-161 101-161
Drain sludge Carbohydrate, protein, lipid
17-22 102-132 11-15
Margarine Vegetable oil 90%
800-1,000 4,800-6,000 539-674
Fish oil Lipid 30-50% 350-600 2,100-3,600 235-404 Livestock residue Carbohydrate,
protein, lipid 50-70 300-420 33-47
Note: Heat capacity conversion, the heat capacity of biogas as 6,000kcal/Nm3 is used.
The heat balance of the above Germany case is be calculated as follows.
Table 12 Heat Balance of Biogass
Biomass Processing amount/year
Processing amount/day
Gas Production/day
Calorific value/day
Industrial waste (organic nature)
13,000 ton 35.6 ton 3,560 Nm3 21.36x10⁶ kcal
Collected raw garbage
15,000 ton 41.1 ton 4,110 Nm3 24.66 x10⁶ kcal
Agricultural residue
57,000 ton 156.2 ton 15,600 Nm3 93.72 x10⁶ kcal
Total 85,000 ton 232.9 ton 23,290 Nm3 139.7 x10⁶ kcal Note: The amount of gas generation is calculated as 100 Nm3/ton.
1) Yearly discharged biomass: 85,000 ton, the average is 232.9 ton/day
2) Output:
Power generation: 630kW x 2 units = 1,260 kW x 860 kcal/kW = 1,083,600 kcal/24hrs = 26.0 x 10⁶kcal
Hot water supply: 1,700kW x 860kcal/kW = 1,462,000 kcal/24hr
= 35.1 x 10⁶ kcal

- 25 - Nippon Koei / IEEJ Volume 8 Renewable Energy
The Study on Introduction of Renewable Energiesin Rural Areas in MYANMAR
Total: 61.1 x 10⁶ kcal/24hr 3) Heat efficiency: output ÷ calorific value
= 61.1 x 10⁶ kcal/24hr ÷139.7 x10⁶ kcal x 100
= 43.7% In order to construct biogas combustion power plant in rural areas in Myanmar, the collection of biological scrapped material is necessary to curry out constantly with a regular amount every day. Same as the case of biomass combustion power plant, for the introduction of biogas generation device and combustion power plant, it is necessary to investigate the available quantity of biological materials and its gasification plan in such areas. It would be easier if there are large scale hog raising facility, poultry farming, or cow farming. However, the utilizing system of the organic disposals may be commercialized first as the solution plan of the raw garbage processing of Yangon or Mandalay cities in Myanmar.
5.3 Small Scale Biogas Application The advantages of small scale application are as follows;
1) Easy construction and low installation cost;
2) Easy maintenance and operation as there is no moving machinery;
3) Heat loss is low as it is a closed system;
4) Fermentation is held around 20℃, and no temperature control is necessary.
In Myanmar the mean temperature is rather high, which is advantage for biogas production as the bacteria is more active in higher temperature and the production of the biogas is increased. However, generally, the component of the methane fermented in the high temperature become less than that of low temperature. The amount and ingredient of the input of material may need to be adjusted.
This system is also suitable for household use who have ability of preparing the materials and costs. For village electrification, the collection of raw materials would be difficult.

- 26 - Nippon Koei / IEEJ Volume 8 Renewable Energy
The Study on Introduction of Renewable Energiesin Rural Areas in MYANMAR
Reference
1. Studies on the Development of a Rice Husk Gasification and Utilization System, Hironoshin Takao, Toshizo Bam, Kotaro Kubota, 1990, Technical Report of the Institute of Agrivultural Machinery No.25
2. Project Report, "Wood-Waste/Agri-Waste Gasification for Power Generation Project" Mar. 2002, Engineering Advancement Association of Japan, Industrial Technology Development Institute, Philippine
3. "Efficient Power Generation from Wood Gasification", Ichen -3h5 Conference paper, Michel Morris and Lars Waldheim, TPS Termiska
4. "Small Scale Gasification and Power Generation from Solid Wastes", Kunio Yoshikawa, 2001 International Joint Power Generation Conference

THE STUDY ON INTRODUCTION OF RENEWABLE ENERGIES
IN RURAL AREAS IN MYANMAR
FINAL REPORT
Volume 8 Supporting Report
Renewable Energy
Part 8-1 Biomass Power
Part 8-2 Solar and Wind Power
Part 8-3 Inspection Memos

i
THE STUDY ON INTRODUCTION OF RENEWABLE ENERGIES IN RURAL AREAS IN MYANMAR
Final Report
Vol. 8 Supporting Report: Renewable Energy
Part 8-2 Solar and Wind Power
TABLE OF CONTENTS
CHAPTER1 INTRODUCTION......................................................................................... 1
CHAPTER 2 SOLAR AND WIND POWER GENERATION IN MYANMAR ............... 3 2.1 System of Battery Charge Station.................................................................. 3 2.2 Battery Recycle Shop (BRS) ......................................................................... 4 2.3 Solar Power.................................................................................................... 7
2.3.1 Solar Irradiation Potential ...............................................................7 2.3.2 Experience Records of Photovoltaic Generation Projects in
Myanmar.........................................................................................12 2.4 Wind Power ................................................................................................. 17
2.4.1 Potential Map................................................................................17 2.4.2 Application of Wind Power Generation System...........................22 2.4.3 Mean Wind Velocity and Capacity of Wind Power Generator .....22 2.4.4 Examples of Actual Implementation.............................................23
CHAPTER 3 PROSPECTS OF SOLAR/WIND BCS ...................................................... 26 3.1 Features of Rural Electrification by BCS.................................................... 26 3.2 Solar/Wind BCS .......................................................................................... 27
3.2.1 Advantages of Solar/Wind BCS ...................................................27 3.2.2 Technical Issues of Solar/Wind BCS............................................29
3.3 SHS and BCS, and Renovation of Charging Method of BCS..................... 30 3.3.1 Brief Explanation about SHS and BCS ..........................................30 3.3.2 Issues about Serial Connection of Batteries in BCS.....................32 3.3.3 Recommendation for Parallel Connection of batteries in BCS ....33
CHAPTER 4 PROPOSED STRATEGY FOR USING SOLAR/WIND BCS .................. 35 4.1 Future Prospects of Solar and Wind Energy................................................ 35
4.1.1 Dissemination Base of PV and Wind Power Generation System in Myanmar.........................................................................................35
4.1.2 Systems with Dissemination Possibility .......................................36 4.1.3 Production Rate of PV Module and Transition of Price ...............37

-ii-
4.1.4 BCS Cost Estimation in 2010..............................................................38 4.2 Application to Small Villages in Remote and Hardly Accessible Areas ..... 40
4.2.1 Issues and Countermeasures for Rural Electrification by PV and Wind Power Generation .................................................................40
4.2.2 Dissemination and Promotion of Remote Electrification by PV- or Wind-Power Generation System ....................................................42
4.3 Technical Support ........................................................................................ 44 4.3.1 Planning Stage ..............................................................................45 4.3.2 Introduction Stage...........................................................................45 4.3.3 Operation and Maintenance Stage ................................................46
CHAPTER 5 CRITERIA FOR SELECTION AND PRIORITIZATION OF RENEWABLE ENERGY PROJECTS ................................................................. 47 5.1 Criteria of Electrification by Adopting Solar or Wind BCS........................ 47 5.2 Criteria for Selection of Appropriate Areas or Locations to be electrified by
using Solar- or Wind-BCS........................................................................... 47
CHAPTER 6 TECHNICAL STANDARDS ..................................................................... 50 6.1 Technical Data to be Collected for Basic Planning ..................................... 50
6.1.1 Method of Sizing PV Capacity of BCS System ...........................50 6.1.2 Method of selecting Wind Turbine Power Generator for BCS
System ............................................................................................59 6.2 Environmental Impact Assessment.............................................................. 63
6.2.1 Issues .............................................................................................63 6.2.2 Counter measures ...........................................................................63
CHAPTER 7 PROPOSED RE PROJECTS WITH SOLAR/WIND BCS ........................ 65

-iii-
LIST OF TABLES
Table 1 Site Reconnaissance .............................................................................................. 2
Table 2 Myanmar Solar Data Cited in Published Documents............................................ 7
Table 3 Monthly Average Irradiation Record for the Period 1961-1980........................... 8
Table 4 Monthly Mean Irradiation Record in Myanmar .................................................. 10
Table 5 Pilot Projects Executed in Myanmar ................................................................... 12
Table 6 NEDO’s Cooperation Project on Renewable Energy with Myanmar Government Organizations......................................................................................................... 13
Table 7 List of PV Implementation in Myanmar ............................................................. 15
Table 8 Yearly Mean Wind Speed in Myanmar............................................................... 18
Table 9 Sample Calculation of Numbers of Wind Turbines based on Daily Mean Wind Velocity ................................................................................................................. 23
Table 10 Particulars of the Batteries Currently Distributing in Myanmar ....................... 28
Table 11 Power Output and Operational Hours Depending on PV Capacity .................. 32
Table 12 PV Production and Decrement of PV Cell Unit Cost........................................ 37
Table 13 Standard Unit Price/kW of the Field Test Project System for Public and Industrial Applications .......................................................................................... 38
Table 14 Standard Unit Price/kW of the Field Test Project System for Public and Industrial Applications-1 ....................................................................................... 39
Table 15 Standard Unit Price/kW of the Field Test Project System for Public and Industrial Applications-2 ....................................................................................... 39
Table 16 Estimation of kW-Unit Cost in Myanmar in 2010 ............................................ 40
Table 17 Selection Criteria of Solar/Wind BCS Schemes ............................................... 49
Table 18 Scale of Village and Estimation of Power Demand .......................................... 52
Table 19 Worksheet-1: Calculation of Power Demand (1) .............................................. 54
Table 20 Worksheet 2: Calculation of Power Demand (2) .............................................. 55
Table 21 Worksheet 3: Calculation of Power Demand (3) .............................................. 56
Table 22 Calculation Sheet of PV Capacity for BCS....................................................... 57

-iv-
Table 23 Offsets for Solar Latitude .................................................................................. 58
Table 24 Inclined Surface Global Insolation Calculated for Typical Locations in Myanmar................................................................................................................ 59
Table 25 Examples of Estimated Power Output from Small Wind Turbine .................... 60
Table 26 Calculation of Wind Power Generator for BCS................................................ 62
Table 27 PV and Wind Power Generation Systems Requested Through Reconnaissance.. ................................................................................................................. 66
LIST OF FIGURES
Figure 1 Typical Battery Charging Station ........................................................................ 5
Figure 2 Primitive, Simplified Method of Battery Reproduction with Recycled Materials. ................................................................................................................... 6
Figure 3 Yearly Mean Irradiation in Myanmar ................................................................ 11
Figure 4 Yearly Mean Wind Speed in Myanmar (DOMH 1994-2000) ........................... 19
Figure 5 Yearly Mean Wind Speed in Myanmar (Wind Study Report)........................... 20
Figure 6 Yearly Mean Wind Speed in Myanmar (Meteonorm) ....................................... 21
Figure 7 Multi-blade Type Wind Power Generator under Development......................... 25
Figure 8 Configuration of SHS......................................................................................... 31
Figure 9 Image of BCS..................................................................................................... 32
Figure 10 Serial Connection and Charging Voltage......................................................... 33
Figure 11 Configuration of Unit BCS ................................................................................. 34

-1- Nippon Koei / IEEJ Volume 8 Renewable Energy
The Study on Introduction of Renewable Energiesin Rural Areas in Myanmar
CHAPTER1 INTRODUCTION
Both of photovoltaic (PV) and wind power generation system are considered as one of the major options for remote area electrification respectively. However, as the processes of remote area electrification may be completely different among target countries or regions, the details on their background about the variation of current economical conditions have to be sufficiently investigated and analyzed prior to decide the way of electrification.
The reconnaissance was conducted in limited areas in the study. The actual conditions of the rural areas were investigated from the point of possibilities of electrification with PV or wind energy. It lead us easy to recognize that the current system of battery charge station (hereinafter, BCS) for small electronic utensils such as lighting has been prevailing widely not only in non-electrified areas but also in electrified ones.
On the one hand, there exists a social system of BCS where batteries are charged by the grid power for lighting in the electrified regions and those charged by diesel engine generators in non-electrified regions, though this is small number. There also exists an additional social system of battery recycle shop (BRS), of which function is to recycle innumerable numbers of expired batteries, and to reproduce and put them into the domestic market. It captures our attention that combined systems of those two have been widely prevailed in Myanmar.
The current conditions of the rural areas in Myanmar would be summarized as follows:
1. Almost all rural villages form a type of concentrated colonies;
2. The battery could be an extremely effective way as a small-scale power supply for lighting or other small power demand of electric utensils; and
3. Bad conditions of roads make it impossible even for local residents to get access to such isolated areas. Especially during a rainy season there may happen entire disruptions of commuter service among villages in the remote areas. Generally speaking, the transportation of fuel to such regions may be extremely disadvantageous.

-2- Nippon Koei / IEEJ Volume 8 Renewable Energy
The Study on Introduction of Renewable Energiesin Rural Areas in Myanmar
The PV or wind powered BCS which basically requires no supply of energy other than renewable energy will become effective in the electrification of isolated areas in Myanmar very much. Therefore, the current BCS is focused by JICA Study Team through the reconnaissance. There would be no question that these systems of BCS and BRS will jointly play more important role to the local electrification in Myanmar in the future. Moreover, the way of the application of BCS system for the new and local electrification business will occupy an important position for PV and wind power generation systems.
Table 1 Site Reconnaissance
Survey No Stage No Duration Locations of Reconnaissance
1st Stage 2/12-16 Bago, Mandalay, Sagain
2nd Stage 2/26-3/1 Rahkinne(Thantwe, Taung-gok)
Survey-1
3rd Stage 3/9-14 Kachin(Mitkyina, Putao)
4th Stage 5/18-20 Ayeyarwady(Pathein, Chaung Tha)
5th Stage 5/27-31 Sagain(Monywa), Magwey(Potta)
Survey-2
6th Stage 6/4-6 Kachin(Putao, Machambau)
Survey-3 No Site Reconnaissance

-3- Nippon Koei / IEEJ Volume 8 Renewable Energy
The Study on Introduction of Renewable Energiesin Rural Areas in Myanmar
CHAPTER 2 SOLAR AND WIND POWER GENERATION IN MYANMAR
2.1 System of Battery Charge Station
Because the electric power demand and supply circumstances in Myanmar have been stringent due to the chronic electric power shortage, MEPE limits the supply of electric power, for example three hours a day, by operating diesel power stations and (small) hydro power plants in most of local cities except very small number of large cities such as Yangon or Mandalay. Moreover, there may be some risks of damages in electric or electronic appliances due to frequent and large fluctuations of voltage even when the grid power is supplied. Not only lighting tools but also radio-cassettes or televisions, etc., are commonly used in spite of a poor power supply.
These tendencies for using electrical appliances are accelerated by using indigenous batteries in every area, whether it is electrified by the grid or not. In a word, batteries are charged at nearby battery charge stations (BCS), and considerably used widely as so-called "mobile power suppliers" in Myanmar. This BCS system has deeply taken root in the Myanmar society as one of the most simple electrification systems. The BCS system has been practically approved in the background of the Myanmar society, "the people’s hope for electrification could not be realized easily".
The features of current BCS is as follows:
Capacity of battery: 12V and 5-30 Ah;
Price of new purchase: around US$3 or K1500; and
Battery charge fee: US$0.03-0.1 or K15-50.
As for the power source of charging batteries, the grid power supply is mainly used in the regions where it is available. In regional cities, however, diesel generators (DG) are usually operated for charging along with the grid power due to a limited power supply such as three hours a day. In the regional areas, isolated DG is the only way of charging batteries.
The usages of batteries are completely different in user's financial condition. Their applications are extend from 3 W bulb or fluorescent lamps of 6-8W to radio-cassettes and televisions supported with inverter sets. The capacity of the batteries varies according to the type of electric appliances. The batteries bigger

-4- Nippon Koei / IEEJ Volume 8 Renewable Energy
The Study on Introduction of Renewable Energiesin Rural Areas in Myanmar
than 12V and 50Ah classes are normally applied for TVs, and some of wealthy families have been enjoying TVs for long time by two or more batteries in their homes.
2.2 Battery Recycle Shop (BRS)
In the background of the BCS system spread widely in Myanmar, the existence of the BRS system helped the development and dissemination of BCS widely in this country. The BRS can supply recycled batteries for customers easily at a reasonable cost. In this respect, it can be said that the BCS system has developed together with the BRS system, and that the relation between them would be just the same as the one between two wheels of a car.
Usually not a few BCS owners run BRS too, but constant supply of new batteries into the market indicates that the number of BRSs is a smaller than that of BCSs. According to the example of the town area in Taung Gok Township in Rakhine State investigated in the Study, there are 12 numbers of BCSs, and eight of them were running BRSs. This shows that there exist so many BRSs of which presence is essential to the dissemination of the BCS in Myanmar.
As in Myanmar, most of relatively small batteries used for lighting and radio-cassettes can be reproduced. Almost all materials are to be used for renewal, and only used electrolyte liquid is to be thrown away.
On the other hand, lager size car-batteries (12V and 75Ah or more) are mainly used to supply power for TV sets. Several electrodes manufacturing companies in Yangon and other cities buy used electrodes from BRSs and supply renewed plates for battery reproduction in Myanmar market again. Other materials such as lead electrode heads are to be renewed at local BRSs, and to be used again as battery parts. The containers are washed. Lead material such as electrode heads is dissolved after cleaning, and cast into the electrode heads again.
It does not seem that a uniform quality could be obtained in renewed products because all works other than the electrode reproduction are done by a home industry system, and some improvements of quality are necessary.

-5- Nippon Koei / IEEJ Volume 8 Renewable Energy
The Study on Introduction of Renewable Energiesin Rural Areas in Myanmar
Figure 1 Typical Battery Charging Station
Typical BCS Powered by MEPE Grid in Bago
Battery Charger
Many Batteries Charged in Serial Connection
Business of Transporting Charged Batteries to Customers
Typical BCS Powered by Diesel Generator
Parallel connection should be adopted to avoid damage (deterioration) to batteries in good conditions.

-6- Nippon Koei / IEEJ Volume 8 Renewable Energy
The Study on Introduction of Renewable Energiesin Rural Areas in Myanmar
Figure 2 Primitive, Simplified Method of Battery Reproduction with Recycled
Materials
A Newly Recycled Battery
Piled-up Battery-Electrodes Reproduced by national companies in Yangon
Stocked Raw Materials of Lead Lead Bars for Connecting Electrodes
Electrodes Heads from Recycled Lead
Recycled Battery

-7- Nippon Koei / IEEJ Volume 8 Renewable Energy
The Study on Introduction of Renewable Energiesin Rural Areas in Myanmar
2.3 Solar Power
2.3.1 Solar Irradiation Potential
(1) Data of Solar Irradiation and Sunshine
Myanmar is located in the southeast of the Asian continent, and there are two seasons, the rainy season (April to October) and the dry season (November to March), but solar irradiation is rich all year round. Especially, because of long continuation of fine days in the central dry zone (CDZ), the solar energy could be abundantly applicable in CDZ. However, solar irradiation data is so limited in Myanmar that only the "sunshine-hour data" collected and arranged by Department of Meteorology and Hydrology (DOMH) can be applicable at present.
There are some of joint researches concerning PV and wind Power generation, undertook by New Energy and Industrial Technology Development Organization (NEDO Japan) and Myanmar Governmental Agencies in the past several yeas. NEDO data output could be applicable together with the original DOMH data. Table 2 shows the meteorological data about solar irradiation and sunshine-hour.
Table 2 Myanmar Solar Data Cited in Published Documents
Location Insolation Energy Sunshine Hour Data Source Applicability of Potential Energy
51973.8 Terra Wh/year
Myanmar Government Home Page
Surrounding area of Yangon
More than 20MJ/m2/day
1999/NEDO Research Report*/1
Myitkyina 362Cal/cm2/day (Daily Mean)
2291h/year 1996/NEDO Research Report FS Report*/2
Yangon 395Cal/cm2/day (Daily Mean)
2372h/year -ditto-
*/1 “Research on Meshed-Presumption of Renewable Energy in Myanmar as a Typical Country in Southeast Asia”, 1999/NEDO
*/2 “Feasibility Study on New Energy Introduction in Asian Villages”, 1996/NEDO
(2) Global Solar Irradiation processed from the data of DOMH
There are very few data of solar irradiation in Myanmar. The Myanmar global irradiation is estimated by using its sunshine-hour data (Ver.1994-2000), newly obtained from DOMH in this study, along with the former data (Ver.1961-1980) currently referred in some study reports. When converting, the global solar irradiation was calculated by using the conversion formulae shown in the Yearly Research Report in 1991 by NEDO and Japan Weather Association. The result is
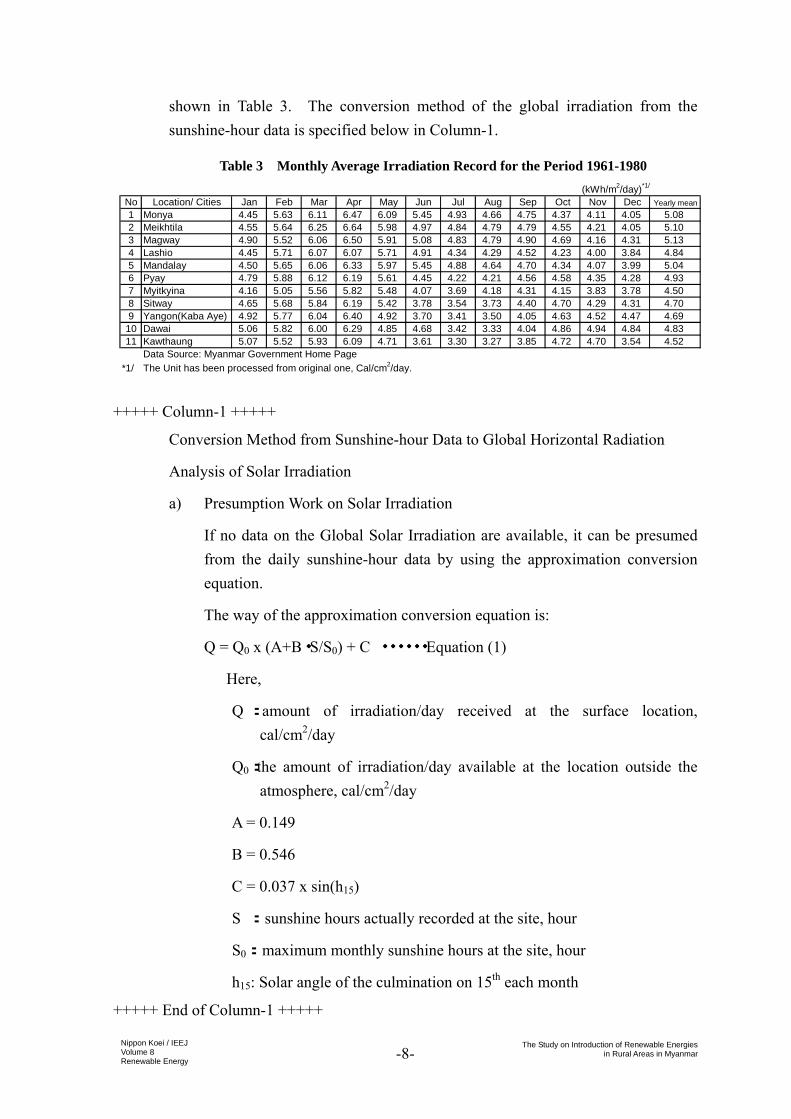
-8- Nippon Koei / IEEJ Volume 8 Renewable Energy
The Study on Introduction of Renewable Energiesin Rural Areas in Myanmar
shown in Table 3. The conversion method of the global irradiation from the sunshine-hour data is specified below in Column-1.
Table 3 Monthly Average Irradiation Record for the Period 1961-1980
+++++ Column-1 +++++
Conversion Method from Sunshine-hour Data to Global Horizontal Radiation
Analysis of Solar Irradiation
a) Presumption Work on Solar Irradiation
If no data on the Global Solar Irradiation are available, it can be presumed from the daily sunshine-hour data by using the approximation conversion equation.
The way of the approximation conversion equation is:
Q = Q0 x (A+B・S/S0) + C ・・・・・・Equation (1)
Here,
Q : amount of irradiation/day received at the surface location, cal/cm2/day
Q0:the amount of irradiation/day available at the location outside the atmosphere, cal/cm2/day
A = 0.149
B = 0.546
C = 0.037 x sin(h15)
S : sunshine hours actually recorded at the site, hour
S0: maximum monthly sunshine hours at the site, hour
h15: Solar angle of the culmination on 15th each month
+++++ End of Column-1 +++++
(kWh/m2/day)*1/
No Location/ Cities Jan Feb Mar Apr May Jun Jul Aug Sep Oct Nov Dec Yearly mean1 Monya 4.45 5.63 6.11 6.47 6.09 5.45 4.93 4.66 4.75 4.37 4.11 4.05 5.082 Meikhtila 4.55 5.64 6.25 6.64 5.98 4.97 4.84 4.79 4.79 4.55 4.21 4.05 5.103 Magway 4.90 5.52 6.06 6.50 5.91 5.08 4.83 4.79 4.90 4.69 4.16 4.31 5.134 Lashio 4.45 5.71 6.07 6.07 5.71 4.91 4.34 4.29 4.52 4.23 4.00 3.84 4.845 Mandalay 4.50 5.65 6.06 6.33 5.97 5.45 4.88 4.64 4.70 4.34 4.07 3.99 5.046 Pyay 4.79 5.88 6.12 6.19 5.61 4.45 4.22 4.21 4.56 4.58 4.35 4.28 4.937 Myitkyina 4.16 5.05 5.56 5.82 5.48 4.07 3.69 4.18 4.31 4.15 3.83 3.78 4.508 Sitway 4.65 5.68 5.84 6.19 5.42 3.78 3.54 3.73 4.40 4.70 4.29 4.31 4.709 Yangon(Kaba Aye) 4.92 5.77 6.04 6.40 4.92 3.70 3.41 3.50 4.05 4.63 4.52 4.47 4.69
10 Dawai 5.06 5.82 6.00 6.29 4.85 4.68 3.42 3.33 4.04 4.86 4.94 4.84 4.8311 Kawthaung 5.07 5.52 5.93 6.09 4.71 3.61 3.30 3.27 3.85 4.72 4.70 3.54 4.52
Data Source: Myanmar Government Home Page*1/ The Unit has been processed from original one, Cal/cm2/day.

-9- Nippon Koei / IEEJ Volume 8 Renewable Energy
The Study on Introduction of Renewable Energiesin Rural Areas in Myanmar
(3) Global Solar Irradiation Data Issued by Private Organizations
During the reconnaissance, following two data were obtained. Private database were compared to them for reference with above mentioned DOMH data. In some of these private data, solar irradiation data and wind data in Myanmar were found. Private data bases available at present are as follows:
METEONORM (Version 4.0); and
Siemens Solar.
And typical data collected through the reconnaissance are shown in Table 4 and Figure 3.

-10- Nippon Koei / IEEJ Volume 8 Renewable Energy
The Study on Introduction of Renewable Energiesin Rural Areas in Myanmar
Table 4 Monthly Mean Irradiation Record in Myanmar
(Unit:kWh/m2/day)
Jan Feb Mar Apr May Jun Jul Aug Sep Oct Nov Dec Ave.[ Kachin State ]
PUTAO DOMH*1/
- - - - - - - - - - - -
Mekong PV Seminar*2/
4.16 5.1 5.37 5.57 5.31 3.81 3.46 3.45 3.5 3.73 4.18 3.85 4.29
Meteonorm*3/ 3.35 4.04 4.42 5.23 5.03 4.53 4.06 4.19 3.77 3.55 3.67 3.32 4.1
MYITKYINA DOMH (1994-2000) 4.46 4.69 5.05 5.6 5.27 3.77 3.25 3.63 3.89 4.3 4.23 4.24 4.35Mekong PV Seminar 4.16 5.05 5.56 5.82 5.48 4.07 3.69 4.18 4.31 4.15 3.83 3.78 4.51Meteonorm 4.03 4.82 5.23 5.87 5.61 4.93 4.48 4.48 4.33 4.16 4.3 4.06 4.69
[ Sagaing Division ]MONYWA DOMH - - - - - - - - - - - -
Mekong PV Seminar 4.45 5.62 6.1 6.46 6.09 5.45 4.93 4.66 4.74 4.37 4.1 4.04 5.08Meteonorm 4.39 5.21 5.68 6.23 6.19 5.37 4.71 4.65 4.77 4.74 4.73 4.45 5.09
[ Shan State ]LASHIO DOMH (1994-1998) 4.51 5.05 5.08 5.24 5.59 3.75 3.42 2.95 3.83 3.91 3.6 3.78 4.23
Mekong PV Seminar 4.45 5.71 6.07 6.07 5.71 4.91 4.34 4.29 4.52 4.23 4 3.84 4.85Meteonorm 4.48 5.14 5.52 5.93 5.84 5.33 5.16 4.42 4.67 4.55 4.53 4.48 5.01
[ Mandalay Division ]MANDALAY DOMH (1994-1998) 4.88 5.27 5.5 6 5.91 5.33 4.18 3.92 4.45 4.74 4.5 4.25 4.91
Mekong PV Seminar 4.5 5.65 6.06 6.33 5.97 5.45 4.88 4.64 4.7 4.34 4.07 3.99 5.05Meteonorm 4.52 5.21 5.61 6.1 6.06 5.4 5.06 4.48 4.77 4.74 4.7 4.55 5.1
JMH*4/
5.57 6.2 7.22 7.66 6.24 3.97 4.68 4.7 5.42 5.43 5.22 4.83 5.6
MEIKTILA DOMH (1994-1998) 4.75 4.98 5.71 6.27 5.94 5.23 4.59 4.23 4.11 4.77 4.3 4.41 4.94Mekong PV Seminar - - - - - - - - - - - -Meteonorm 4.55 5.25 5.61 6.03 6 5.43 5.23 4.42 4.77 4.77 4.67 4.58 5.11
[ Chin State ]HAKHA DOMH (1994-2000) 4.57 4.98 5.3 5.96 5.09 3.63 2.91 2.86 3.21 3.74 3.79 4.09 4.18
Mekong PV Seminar - - - - - - - - - - - -Meteonorm 4.35 5.18 5.68 6.3 6.23 5.37 4.58 4.68 4.77 4.74 4.77 4.42 5.09
[ Rakhine State ]SITTWE DOMH - - - - - - - - - - - -
Mekong PV Seminar 4.65 5.68 5.84 6.19 5.42 3.78 3.54 3.73 4.4 4.7 4.29 4.31 4.71Meteonorm 4.35 5.18 5.68 6.3 6.23 5.37 4.58 4.68 4.77 4.77 4.77 4.39 5.09
[ Kayah State ]LOIKAW DOMH (1999-2000) 5.12 5.23 5.57 6.14 4.33 3.79 3.75 3.86 3.91 4.24 4.47 4.77 4.6
Mekong PV Seminar 5.11 6.38 6.68 6.81 5.83 5.52 5.57 5.25 5.18 4.92 4.93 4.69 5.57Meteonorm 4.68 5.29 5.58 5.87 5.87 5.5 5.61 4.26 4.77 4.77 4.6 4.71 5.13
[ Bago Div. ]PYAY DOMH - - - - - - - - - - - -
Mekong PV Seminar 4.79 5.88 6.11 6.18 5.6 4.45 4.22 4.21 4.56 4.58 4.35 4.28 4.93Meteonorm 4.58 5.25 5.61 6.03 6 5.47 5.26 4.42 4.8 4.77 4.67 4.61 5.12
[ Yangon Div. ]KABE AYE DOMH (1994-1998) 5.32 5.68 5.94 6.43 4.97 3.46 3.25 3.11 3.72 4.64 4.69 5.08 4.69
Mekong PV Seminar 4.92 5.77 6.04 6.4 4.92 3.7 3.41 3.5 4.05 4.63 4.52 4.47 4.69Meteonorm 4.68 5.25 5.58 5.83 5.81 5.43 5.55 4.29 4.73 4.71 4.57 4.71 5.09JMH 5.54 6.4 7.33 7.75 6.72 5.36 5.26 4.89 5.46 4.77 5.08 5.03 5.8
[ Ayeyanwady Div. ]PATHEIN DOMH (1994-1997) 5.71 6.14 6.36 6.97 5.26 3.73 3.72 3.51 4.06 4.75 4.86 5.32 5.03
Mekong PV Seminar - - - - - - - - - - - -Meteonorm 4.65 5.25 5.61 5.9 5.87 5.43 5.42 4.35 4.73 4.71 4.6 4.68 5.1JMH 5.38 6.16 7.29 7.76 7.12 5.98 6.13 5.6 5.47 4.91 5.06 4.92 5.98
[ Mon State ]MAWLAMYINE DOMH (2000) 5.25 5.21 5.51 4.76 3.57 - - - - - - 4.86
Mekong PV Seminar - - - - - - - - - - - -Meteonorm 4.68 5.21 5.58 5.83 5.74 5.37 5.52 4.32 4.7 4.68 4.57 4.71 5.08
[ Taninthayi State. ]DAWEI DOMH - - - - - - - - - - - -
Mekong PV Seminar 5.06 5.82 6.02 6.29 4.85 4.68 3.42 3.33 4.04 4.86 4.94 4.84 4.85Meteonorm 4.58 4.96 5.65 5.63 5.29 4.87 4.87 4.58 4.27 4.19 4.47 4.74 4.84
KAWTHOUNG DOMH - - - - - - - - - - - -Mekong PV Seminar 5.07 5.52 5.93 6.09 4.71 3.61 3.3 3.27 3.85 4.72 4.7 4.58 4.61Meteonorm 4.65 5.07 5.55 5.47 5.06 4.8 4.77 4.68 4.47 4.32 4.37 4.45 4.8
Data Source *1/: DOMH (1994-1997)*2/: Mekong PV Seminar*3/: Meteonorm, Switzerland*4/: JMH
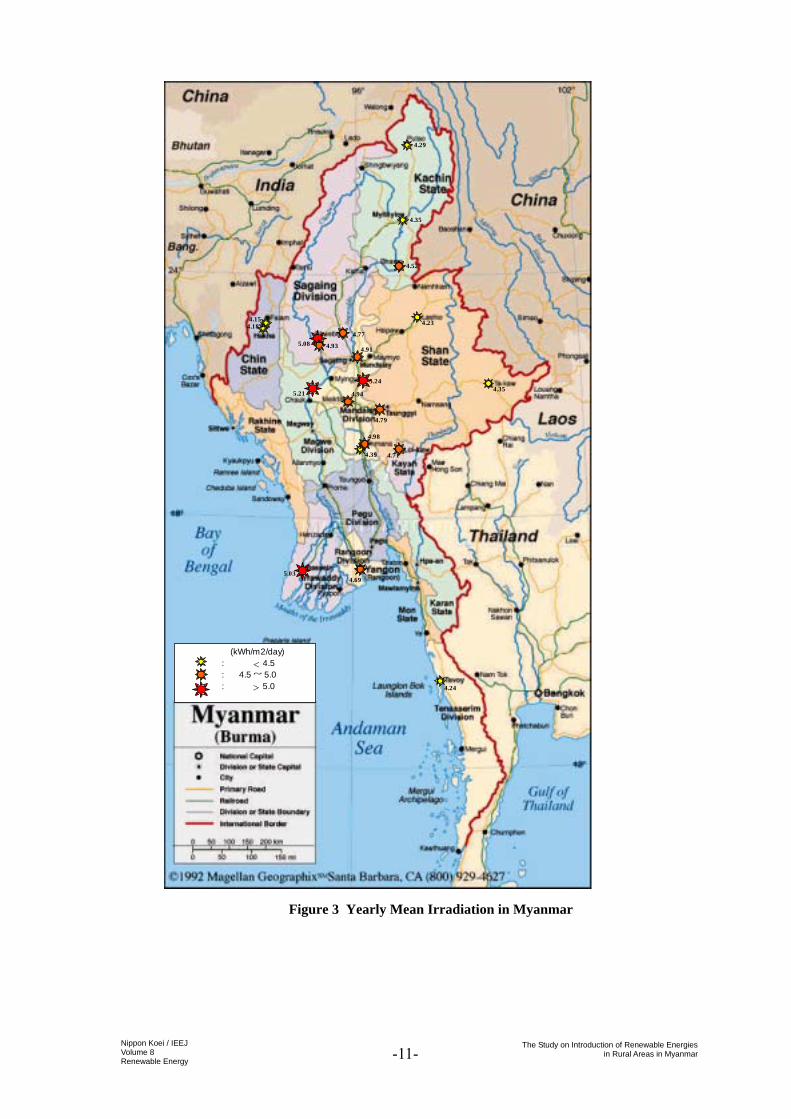
-11- Nippon Koei / IEEJ Volume 8 Renewable Energy
The Study on Introduction of Renewable Energiesin Rural Areas in Myanmar
Figure 3 Yearly Mean Irradiation in Myanmar
4.29
4.35
4.52
4.775.08
4.23
4.35
4.79
4.91
5.21 4.94
4.39
4.98
5.24
4.93
4.184.15
4.71
4.695.03
4.24
(kWh/m2/day) : < 4.5 : 4.5 ~ 5.0 : > 5.0

-12- Nippon Koei / IEEJ Volume 8 Renewable Energy
The Study on Introduction of Renewable Energiesin Rural Areas in Myanmar
2.3.2 Experience Records of Photovoltaic Generation Projects in Myanmar
A high priority has been given to apply PV systems for remote area electrification in Myanmar, as the electrification by PV is based upon renewable energy that effect little on environment. Recently, Myanmar government has been working positively on joint research development in the field of PV systems with NEDO.
Table 5 shows the pilot PV projects undertaken by international organizations so far, and Table 6 is about feasibility study projects and joint research projects on PV systems by NEDO.
Table 5 Pilot Projects Executed in Myanmar
Project/ Program
Donor Project Details
Implementation Site Year
1 Technical Cooperation among Developing Countries
Royal Thai Energy Industry Development ESCAP
Kwayma Village, Tharkyta Tsp. near Yangon
2 The Solar Battery Charging Community Enterprise
Yoma Bank Project-ENSIGN*/1 EPD of MOE*/2
BCS*/3 Pale Village (Thongwa Tsp.)
1997
*/1 Energy Services and Income-Generating Opportunities for the Poor */2 Energy Planning Department of Ministry of Energy */3 Battery Charge Station by PV System

-13- Nippon Koei / IEEJ Volume 8 Renewable Energy
The Study on Introduction of Renewable Energiesin Rural Areas in Myanmar
Table 6 NEDO’s Cooperation Project on Renewable Energy with Myanmar
Government Organizations
Project/ Program Counterparts/ Organizations involved
Project Details Implementation Site Year
1 Feasibility Study on New Energy Introduction in Asian Villages
1) MEPE FS on RE Source in Myanmar, etc.
1995 -1996
2 PV Power Generation Joint Research FS in Myanmar
MEPE FS on a Hybrid System among PV, Wind Turbine and Gen-set
Wind Monitoring Station: Nyaung Weather Station Kantagyi Village
1997 -1998
3 Research on Meshed-Presumption of Renewable Energy in Myanmar as a Typical Country in Southeast Asia
DOMH MEPE
Analysis of Solar and Wind Energy in Myanmar
Monitoring Station: Yangon Tharawwady Pathein
1998 -1999
4 Experimental Study on Grid System with PV Power Generation System
MEPE DOMH
Actual Study by using a Hybrid System among PV-Wind-DG
Observation Points: 5 Study Site: Chaungtha Tsp.
1998 -2004 (Scheduled)
However, number of PV systems implemented for actual use seems to be smaller than other developing countries, though it is impossible to compare accurately without concrete data on PV implementation collected officially in Myanmar. Through the reconnaissance, some of PV implementation lists shown in Table 7 have been made for the seven states and districts of Kachin, Sagain, Bago, Magway, Mandalay, Rakhine, and Ayeyawady under cooperation with Renewable Energy Association Myanmar (REAM), one of NGOs in Myanmar.
The PV system implementation data could not cover all even for the investigated districts and states. The features are as follows;
A) Types of PV systems were not so many. There are a lot of vaccine storage systems and PV systems for pumping water;
B) Most of PV Systems were implemented as a part of assistances by foreign organizations such as UNDP, UNICEF or foreign NGOs;
C) One set of BCS powered by PV was installed in 2000 as a contribution by a domestic volunteer;
D) The Solar home systems (SHS) are used in relatively well-off houses, whose number may be limited;

-14- Nippon Koei / IEEJ Volume 8 Renewable Energy
The Study on Introduction of Renewable Energiesin Rural Areas in Myanmar
E) Not a few lighting systems have been operated in monasteries in rural villages as one of the expanded application systems from the SHS, most of which were donated by villagers;
F) There are a lot of PV powered pumping systems for supplying potable water in CDZ; and
G) One of special cases, there is a solar powered pump supplying water from a near-by pond to a water purification system for the city hospital use.

-15- Nippon Koei / IEEJ Volume 8 Renewable Energy
The Study on Introduction of Renewable Energiesin Rural Areas in Myanmar
Table 7 List of PV Implementation in Myanmar
KACHIN STATE Site locality Capacity
District/ Township/ Town, Village (W) Donor Organization Myitkyinar Tsp./ Myitkyinar 450 Vaccine Refrigerator 1996 UNDP MOH
Bamaw Tsp./ Bamaw 450 Vaccine Refrigerator 1996 UNDP MOH Putar-o Tsp./ Putar-o 450 Vaccine Refrigerator 1996 UNDP MOH
Winemaw Tsp./ Winemaw 450 Vaccine Refrigerator 1996 UNDP MOH Naungmon Tsp./ Naungmon 450 Vaccine Refrigerator 1996 UNDP MOH Phar-kent Tsp./ Phar-kent 450 Vaccine Refrigerator 1996 UNDP MOH
-Ditto- 640 SHS 1997 Private Individuals Moenyin Tsp./ Moenyin 450 Vaccine Refrigerator 1996 UNDP MOH Moekung Tsp./ Moekung 450 Vaccine Refrigerator 1996 UNDP MOH
Machanbaw Tsp./ Machanbaw 450 Vaccine Refrigerator 1996 UNDP MOH Suprabon Tsp./ Suprabon 450 Vaccine Refrigerator 1996 UNDP MOH
Mansi Tsp./ Mansi 450 Vaccine Refrigerator 1996 UNDP MOH
Year ofEstablishment
Project Status (As of March 1, 2001)
CodeUsage
Sagain DivisionSite locality Capacity
District/ Township/ Town, Village (W) Donor Organization Sagaing Tsp./Kyaukse villagee 11133 Pumping 1998 UNDP MOA
Sagaingg Tsp./Yonepin-Kan village 896 Pumping 1998 UNDP MOAChaung-U Tsp./Ahmyint village 900 Vaccine Refrigerator 1989 UNDP MOH
Myaung Tsp./Lema village 1500 Pumping 1989 UNDP Village communityMonywa Tsp./Monywa 1113 Pumping 1989 UNDP MOA
Myinmu Tsp./Hti-saung village 1113 Pumping 1989 UNDP MOAAyar-taw Tsp./Inkyin-hla village 896 Pumping 1989 UNDP MOAButalin Tso./ Tharyo-gone village 896 Pumping 1989 UNDP MOA
Shwebo Tsp./ Mabay village 896 Pumping 1989 UNDP MOAPokoke-ku Tsp./ Magyipin-pu village 896 Pumping 1989 UNDP MOA
Remote railway stations 2120 Radio Telephone 1975 Govarnment MOAThe whole area average 6 SHS 1989 Private Individual
Year ofEstablishment
(As of March 1, 2001)Project Status
Code Usage
Bago DivisionSite locality Capacity
District/ Township/ Town, Village (W) Donor Organization Natalin Township 132W SHS 1996 Private Individual
Thanut-pin Township 150W SHS 1995 Private IndividualTaungu Township 1410W SHS 1997 Private IndividualTaungu Township 150W SHS 1997 Private MonasteryTaungu Township 100W Radio Telephone 1998 Private Individual
Year ofEstablishment
(As of March 1, 2001)Project Status
Code Usage
Magway DivisionSite locality Capacity
District/ Township/ Town, Village (W) Donor Organization Magway Tsp./ Daung-nay village 896 Pumping 1998 UNDP MOAMagway Tsp./ Kyarpyac-in village 896 Pumping 1998 UNDP MOAMyothit Tsp./ Manaw-kone village 896 Pumping 1989 UNDP MOA
Mageway Tsp./ Kungshar-taw 500 Pumping 1989 UNDP Village communityTaungdwin-gyi Tsp./ Pyint-pyu village 1113 Pumping 1989 UNDP MOA
Myaing Tsp./ Thar-tut village 1113 Pumping 1989 UNDP MOAYasa-kyo tsp./ Nipasataw village 1113 Pumping 1989 UNDP MOA
Minbu Tsp./ Konethar village 1113 Pumping 1989 UNDP MOASinpaung-we Tsp./ Chaung gouto village 1113 Pumping 1989 UNDP MOAPakoke-ku Tsp./ Magyinpinppu village 1113 Pumping 1898 UNDP MOA
Remote railwaay stations 1060 Radio Telephone 1975 Government MOAThe whole area average 9 SHS 1989 Private Individual
WATSAN Project 2688 Pumping 1999 UNDP Village community
(As of March 1, 2001)
Code Usage Year of
EstablishmentProject Status
Mandalay DivisionSite locality Capacity
District/ Township/ Town, Village (W) Donor Organization Madayar Tsp./ Nathar-myaing village 1113 Pumping 1998 AMDA MOHKyaukese Tsp./ Kha-o-gyi village 1113 Pumping 1989 UNDP MOA
Meiktilar Tsp./ Meiktilat 1200 Pumping 1999 MIS MOHMeiktilar Tsp./ Kwet-nge village 1113 Pumping 1989 UNDP MOA
Meiktilar Tsp./ Chaungma-gyi village 318 Lighting 1999 Government MOAMeiktilar Tsp./ Than-gone village 896 Pumping 1989 UNDP MOA
Meiktilar Tsp./ Maizali-gone village 1113 Pumping 1989 UNDP MOATharsi Tsp./Kyatee village 896 Pumping 1989 UNDP MOA
Pyawbwe Tsp./ Yalegwe vilage 400 BCS 1989 JAPAN MO ReligiousMahling Tsp./ Magyipin-pu village 896 Pumping 1989 UNDP MOA
Mahling Tsp./ Sai-doe village 896 Pumping 1989 UNDP MOAMahling Tsp./ Yae-atekyin village 896 Pumping 1989 UNDP MOAYwan-dwin Tsp./ Palawa village 896 Pumping 1989 UNDP MOA
Remote ralway stations 2120 Radio Telephone 1975 Government MORThe whole area average 12 SHS 1989 Private IndividualMogoke Tsp./ Mogoke 1500 Telecom Station 1999 Government MOPT
(As of March 1, 2001)
Code Usage Year of
EstablishmentProject Status

-16- Nippon Koei / IEEJ Volume 8 Renewable Energy
The Study on Introduction of Renewable Energiesin Rural Areas in Myanmar
Ayeyawady DivisionSite locality Capacity
District/ Township/ Town, Village (W) Donor Organization Bogalay Tsp. 2560 BCS 1997 UNDP MOF
Remote railway stations 530 Radio Telephone 1975 Government MORThe whole area average 3 SHS 1989 Private Individual
Pthein Tsp./ Chaung-thar 384 Research 2001 NEDO MEPETownship health centre 4452 Vaccine Refrigerator 1990 UNDP MOH
(As of March 1, 2001)
Code Usage Year of
EstablishmentProject Status
RAKHINE STATE Site locality Capacity
District/ Township/ Town, Village (W) Donor Organization Sittwe Tsp./ Sittwe 640 SHS 1996 Private Individual
Kyaukphyu Tsp./ Kyaukphyu 450 Vaccine Refrigerator 1996 UNDP MOH -Ditto- 22 SHS 1995 Private Individual
Taungoke Tsp./ Taungoke 360 Vaccine Refrigerator 1996 UNDP MOH Myauk-oo Tsp./ Myauk-oo 450 Vaccine Refrigerator 1996 UNDP MOH
Kyauk-taw Tsp./ Kyauk-taw 450 Vaccine Refrigerator 1996 UNDP MOH -Ditto- 172 Water pump & light 1997 Private Monastery
Mye-pone Tsp./ Mye-pone 450 Vaccine Refrigerator 1996 UNDP MOH Buthi-daung Tsp./ Buthi-daung 450 Vaccine Refrigerator 1996 UNDP MOH
-Ditto- 384 Vaccine Refrigerator 1999 UNDP MOL&H -Ditto- 192 Refrigerator 1997 UNDP UN, Office
Maung-taw Tsp./ Maung-taw 450 Vaccine Refrigerator 1996 UNDP MOH -Ditto- 384 Vaccine Refrigerator 1999 UNDP MOL&H -Ditto- 192 Refrigerator 1996 UNDP UN, Office
Pauk-taw Tsp./ Pauktaw 450 Vaccine Refrigerator 1996 UNDP MOH Thandwe Tsp./ Thandwe 450 Vaccine Refrigerator 1996 UNDP MOH
Gwa Tsp./ Gwa 450 Vaccine Refrigerator 1996 UNDP MOH Yathe-taung Tsp./ Yathe-taung 450 Vaccine Refrigerator 1996 UNDP MOH
Min-bya Tsp./ Min-bya 450 Vaccine Refrigerator 1996 UNDP MOH Ponnar-gyun Tsp./ Ponar-gyun 450 Vaccine Refrigerator 1996 UNDP MOH
Man-aung Tsp./ Man-aung 450 Vaccine Refrigerator 1996 UNDP MOH
(As of March 1, 2001)
CodeProject Status Year of
establishmentUsage

-17- Nippon Koei / IEEJ Volume 8 Renewable Energy
The Study on Introduction of Renewable Energiesin Rural Areas in Myanmar
2.4 Wind Power
2.4.1 Potential Map
Myanmar has a coastline extended up to 2,832 km in length, and has such tendencies that southwest monsoon blows for nine months along the coastal zone. For another three months, northeast monsoon blows. In Myanmar, the utilization of wind energy is still at the only primitive stage, though her wind potential energy is so huge as up to 365.1 TWh/year (Source: Myanmar government/website).
Any kinds of assessment, however, introducing wind power generator could not directly be applied in Myanmar at present, because detailed area-based wind data have never been collected so far. Still, following four data are only applicable as reference:
Data W-1: A Study of Wind Speed in Myanmar (Recorded Period, 1964-1980), DOMH;
Data W-2: ditto newly acquired DOMH (Recorded Period, 1994-2000);
Data W-3: NEDO/Meteorological Association; and
Data W-4: METEONORM (Switzerland).
Inferred from these data, the average of wind velocity is very low as a whole in Myanmar, and the favorable points with high average wind velocity all over a year are not found. In the both States of Chin and Shan, however, there extend the mountainous areas supposed to be suitable for the wind power generation with high yearly mean wind velocity exceeding 4 m/s (Data W-3).
Moreover, along the western coastal area, especially in Sittwe, a capital city in the northern part of Rakhine State, the average monthly wind velocity shows almost 3 m/s or more (Data W-1, W-2, and W-3), and it seems that there is a possibility of wind power generation also in these regions. In addition, the average yearly wind velocity shows about 3 m/s in the surrounding central area in Nyaung Oo (Mandalay Division) (Data W-1), and this region is also presumed to be an applicable area for the wind power generation.
It was confirmed that there are some of local wind-favored areas through the reconnaissance in addition to above-mentioned regions, which could be specified as suitable places for the wind power generation from the collected data above. It seems that there are many locally wind-favored sites in all over Myanmar. To pile up these data of the locally wind-favored areas would also be necessary for future implementation of wind power generators.

-18- Nippon Koei / IEEJ Volume 8 Renewable Energy
The Study on Introduction of Renewable Energiesin Rural Areas in Myanmar
The typical wind data collected through the reconnaissance are listed in the following Table 8 and Figure 4, 5, and 6.
Table 8 Yearly Mean Wind Speed in Myanmar
(Unit: kWh/m2/day)
State/Division Location Data Source Jan Feb Mar Apr May Jun Jul Aug Sep Oct Nov Dec Ave.
[ Kachin State ]PUTAO DOMH (1996-1999)*1/ 0.22 0.45 0.45 0.67 0.89 0.00 0.45 0.45 0.45 0.15 0.15 0.60 0.41
Wind Study Report*2/ - - - - - - - - - - - - -Meteonorm*3/ 1.60 2.00 2.10 2.00 1.80 1.70 1.70 1.40 1.20 1.20 1.30 1.30 1.61
MYITKYINA DOMH (1994-1998) 0.59 0.88 1.13 1.10 0.80 0.87 0.62 0.57 0.46 0.53 0.57 0.62 0.73Wind Study Report (1966-1980) 0.87 1.14 1.42 1.58 1.23 0.98 1.14 0.98 0.87 0.80 0.88 0.88 1.06Meteonorm 1.60 1.90 2.00 1.90 1.70 1.70 1.70 1.40 1.20 1.20 1.20 1.30 1.57
[ Sagaing Division ]MONYWA DOMH (1994-1998) 1.41 1.44 1.34 1.41 1.52 1.73 1.54 1.07 1.05 1.06 1.41 1.35 1.36
Wind Study Report (1966-1980) 0.76 0.71 0.97 0.91 1.10 1.45 1.49 1.18 0.74 0.65 0.69 0.59 0.94Meteonorm 0.60 0.70 0.90 1.20 1.10 0.90 0.90 0.80 0.60 0.60 0.60 0.50 0.78
[ Shan State ]LASHIO DOMH (1994-1998) 1.17 1.38 1.17 1.31 0.80 0.89 1.08 0.63 0.54 0.17 0.21 0.46 0.82
Wind Study Report (1965-1980) 0.88 1.22 1.45 1.54 1.49 1.63 1.60 1.26 1.01 0.82 0.67 0.70 1.19Meteonorm 1.40 1.70 1.80 1.80 1.60 1.70 1.70 1.40 1.10 1.10 1.10 1.20 1.47
[ Mandalay Division ]MANDALAY DOMH (1994-1998) 0.34 0.62 1.16 1.29 1.70 1.87 2.08 1.30 0.70 0.39 0.25 0.22 0.99
Wind Study Report (1968-1980) 0.93 1.23 1.72 1.89 2.14 2.78 2.91 2.29 1.67 1.22 1.01 0.85 1.72Meteonorm 0.50 0.70 0.90 1.20 1.10 0.90 0.90 0.80 0.60 0.60 0.50 0.50 0.77
MEIKTILA DOMH (1994-2000) 0.86 1.03 1.51 1.81 2.27 3.28 3.42 2.33 1.39 0.70 0.81 0.87 1.69Wind Study Report (1965-1980) 0.65 0.80 1.16 1.72 2.46 3.30 2.65 2.46 1.37 0.74 0.66 0.63 1.55Meteonorm 0.40 0.50 0.70 1.00 0.90 0.70 0.70 0.60 0.40 0.40 0.40 0.30 0.58
[ Chin State ]HAKHA DOMH (1994-1998) 1.63 2.26 2.91 1.94 2.41 1.97 2.27 1.76 1.12 1.10 1.00 1.09 1.79
Wind Study Report (1966-1980) - - - - - - - - - - - - -
Meteonorm 1.10 1.20 1.50 1.80 2.00 1.70 1.50 1.40 1.30 1.00 1.00 1.00 1.38[ Magway Div. ]
MAGWAY DOMH (1994-1998) 0.61 0.56 0.71 0.62 0.79 0.97 0.90 0.85 0.80 0.59 0.61 0.71 0.73Wind Study Report - - - - - - - - - - - - -Meteonorm 0.50 0.60 0.80 1.10 1.00 0.80 0.80 0.70 0.60 0.50 0.50 0.40 0.69
[ Rakhine State ]SITTWE DOMH (1994-1998) 2.85 2.66 2.80 2.95 3.46 3.66 4.00 3.22 3.00 2.40 2.87 2.51 3.03
Wind Study Report (1965-1980) 1.96 2.45 2.65 2.65 2.82 3.37 3.35 2.86 2.47 2.06 1.77 1.73 2.51Meteonorm 0.90 1.00 1.40 1.80 1.90 1.50 1.30 1.30 1.20 0.90 1.00 0.90 1.26
[ Kayah State ]LOIKAW DOMH (1994-1998) - - - - - - - - - - - - -
Wind Study Report (1968-1977) 0.82 0.53 0.88 0.99 1.08 1.18 1.04 0.97 0.88 0.71 0.67 0.63 0.87Meteonorm 0.40 0.50 0.70 1.00 0.90 0.70 0.70 0.60 0.40 0.40 0.40 0.30 0.58
[ Bago Div. ]PYAY DOMH (1994-1998) 0.41 0.35 0.41 0.33 1.31 0.46 0.40 0.43 0.33 0.30 0.37 0.38 0.46
Wind Study Report (1964-1977) 1.09 1.13 1.30 1.65 1.74 1.40 1.37 1.22 1.02 0.92 1.25 1.39 1.29Meteonorm 0.50 0.70 0.90 1.30 1.10 0.90 0.90 0.80 0.60 0.60 0.60 0.50 0.78
[ Yangon Div. ]KABE AYE DOMH (1994-1998) 1.06 1.12 1.09 1.18 1.31 1.34 1.33 1.06 1.07 1.05 1.28 1.28 1.18
Wind Study Report (1968-1980) 1.18 1.43 1.65 1.91 1.70 1.50 1.65 1.55 1.22 1.18 1.17 1.29 1.45Meteonorm 0.70 0.90 1.20 1.50 1.20 1.00 1.10 1.00 0.70 0.70 0.70 0.70 0.95
[ Ayeyanwady Div. ]PATHEIN DOMH (1994-1998) 0.97 1.19 1.30 1.58 1.39 1.01 0.97 0.78 0.72 0.72 1.35 1.18 1.10
Wind Study Report (1964-1980) 1.12 1.34 1.68 1.54 1.50 1.31 1.05 1.01 0.86 0.90 1.06 1.05 1.20Meteonorm 0.70 0.90 1.30 1.60 1.30 1.10 1.20 1.10 0.80 0.70 0.70 0.70 1.01
[ Kayin State ]HPA-AN DOMH (1994-1998) 0.88 0.97 0.99 1.20 1.04 1.06 1.36 1.13 1.04 1.05 0.97 0.81 1.04
Wind Study Report (1964-1972, 1976-1979) 1.10 1.16 1.59 1.81 1.76 1.91 1.78 1.51 1.46 1.19 0.97 1.10 1.45Meteonorm 0.80 1.00 1.30 1.60 1.30 1.10 1.20 1.20 0.80 0.70 0.80 0.80 1.05
[ Mon State ]MAWLAMYINE DOMH (1994-1998) 1.11 1.03 1.12 0.96 0.92 0.93 1.09 0.84 0.80 0.89 1.30 1.55 1.04
Wind Study Report (1964-1980) 1.58 1.70 1.85 2.04 1.99 2.10 2.11 1.94 1.68 1.46 1.94 1.89 1.86Meteonorm 1.00 1.30 1.80 2.20 1.70 1.50 1.60 1.50 1.10 1.00 1.10 1.10 1.41
[ Taninthayi State. ]DAWEI DOMH (1994-2000) 0.19 0.54 0.45 0.49 0.45 0.34 0.46 0.44 0.33 0.31 0.52 0.29 0.40
Wind Study Report (1965-1980) 1.01 0.97 1.06 0.99 1.15 1.12 1.05 1.15 0.89 0.85 1.05 1.26 1.05Meteonorm 1.20 1.40 1.70 1.80 1.70 1.80 1.80 1.80 1.40 1.10 1.50 1.50 1.56
KAWTHOUNG DOMH (1994-2000) 0.80 0.80 0.58 0.51 0.63 0.82 1.20 1.11 0.75 0.52 0.64 1.37 0.81
Wind Study Report (1964-1980) 1.74 1.54 1.47 1.36 1.40 1.64 1.51 1.53 1.19 0.89 1.41 1.86 1.46Meteonorm 1.70 1.60 1.50 1.40 1.40 1.80 1.60 1.70 1.40 1.00 1.40 1.80 1.53
Data Source *1/: DOMH(1994-2000) *2/ :DOMH, Wind Study Report(1964-1980)*3/ :Metronomrm, Swizerland

-19- Nippon Koei / IEEJ Volume 8 Renewable Energy
The Study on Introduction of Renewable Energiesin Rural Areas in Myanmar
Figure 4 Yearly Mean Wind Speed in Myanmar (DOMH 1994-2000)
0.47
0.73
0.93
0.82
0.28
1.24
0.99
1.86
1.69
1.36
1.79
0.40
1.181.10
0.40
0.73
0.85
0.82
0.73
0.413.03
1.03
0.38
1.63
0.46
0.56
1.04
1.04
0.72
0.81
: v < 1.5 : 1.5 ≦ v < 2.5 : v > 2.5 (m/s)

-20- Nippon Koei / IEEJ Volume 8 Renewable Energy
The Study on Introduction of Renewable Energiesin Rural Areas in Myanmar
Figure 5 Yearly Mean Wind Speed in Myanmar (Wind Study Report)
1.06
0.89
1.19
0.53
1.46
1.72
2.611.55
0.94
1.451.20
1.05
1.392.51
1.06
1.29
1.45
1.86
1.46
1.46
0.58
2.10
1.21
1.51
0.87
1.25
0.52
2.88
0.69
2.53
: v < 1.5 : 1.5 ≦ v < 2.5 : v > 2.5 (m/s)

-21- Nippon Koei / IEEJ Volume 8 Renewable Energy
The Study on Introduction of Renewable Energiesin Rural Areas in Myanmar
Figure 6 Yearly Mean Wind Speed in Myanmar (Meteonorm)
1.55
1.57
1.42
1.47
0.92
0.68
0.77
0.70
0.58
0.78
1.38
1.01
0.951.01
1.56
1.06
0.75
0.69
0.69
0.711.26
0.80
0.80
1.63
0.78
0.94
1.05
1.41
2.06
1.53
: v < 1.5 : 1.5 ≦ v < 2.5 : v > 2.5 (m/s)
1.61
1.48
1.33
0.83
0.58
1.52
0.58
0.68

-22- Nippon Koei / IEEJ Volume 8 Renewable Energy
The Study on Introduction of Renewable Energiesin Rural Areas in Myanmar
2.4.2 Application of Wind Power Generation System
As a general trend, the size of wind power generation system has been increasing. And even the model machines exceeding 1,000 kW as rated capacity have been developed. Many the introductions of the large-scale wind power generation systems would be realized through an enterprise of IPP (Independent Power Producer), which commercially forms a grid connection with an existing grid line. This trial should be definitely backed up with detailed, concrete data of wind conditions. However, the introduction of the large-scale wind power generation system into Myanmar is impossible at this moment because there is no detailed wind data, and because there are no stable power grid lines in the western coastal zone so far.
In this condition, the introduction of a wind power generation set in Myanmar has to be started by applying a small-scale system with BCS at local wind-favored spots. The development procedures shall be as follows:
First of all, select locations favored in strong wind by interviewing local people nationwide. And then, select some of candidate sites to install the instrument for acquisition of one-or-two year’s data of wind velocity. Analyzing the data, a plan is to be prepared to implement a wind powered BCS system onto a wind-favored site if some of locations have a yearly mean velocity exceeding 4 m/s.
Moreover, if the monthly mean wind velocity in rainy season from April to October is bigger than 3 m/s, a hybrid system with PV and wind-power generators could be one option due to compensation of natural potential each other.
2.4.3 Mean Wind Velocity and Capacity of Wind Power Generator
The formula of the wind energy is given as follows.
P = (1/2)・ρ・A・V3
Here,
P : Wind energy
ρ: Air density (kg/m3)
A : Area of receiving air of wind turbine blade(m2)
V : Wind velocity (m/s)
And the wind energy per unit area is called as "wind energy density" and expressed as follows.
P0 = (1/2)・ρ・V3

-23- Nippon Koei / IEEJ Volume 8 Renewable Energy
The Study on Introduction of Renewable Energiesin Rural Areas in Myanmar
Air density (ρ) changes by temperature and atmospheric pressure, and 1.225 kg/m3 is used in the standard condition (1 atmospheric pressure and 15℃).
The wind energy is proportional to the wind receiving area, which corresponds to the cube root of the wind velocity. In a word, when the wind velocity doubles, the power output will be eight times. The power output is greatly depended upon the wind velocity itself.
Table 9 shows calculation examples of the relationship between numbers of wind turbine generators and wind mean velocity, when the energy by a wind turbine is supplied to each sample power demand with rated capacity of 3 kW.
Table 9 Sample Calculation of Numbers of Wind Turbines based on Daily Mean Wind
Velocity
Daily Mean Wind Velocity (m/s)
2.7 3.1 3.6 4.0 4.5 4.9 5.4 5.8 6.3 6.7 7.2
Rated Capacity of Machine, 76 kWh/d
41 sets 23 14 10 8 6 5 4 4 3 3
Ditto, 38.4 kWh/d 21 sets 12 8 5 4 3 3 2 2 2 2 Ditto, 20 kWh/d 11 sets 6 4 3 2 1 1 1 1 1 1
As shown in the above table, eleven sets of rated 3 kW wind power generators would be required to supply the power for the demand at 20 kWh/day when daily mean wind velocity is 2.7 m/s. On the other hand, one set of the same capacity would do for it if the daily mean wind velocity exceeds 4.9 m/s, which implies how important it is to select wind-favored locations.
Therefore, it is important for a plan of a power generation system (unit machine, rated capacity, kW) to assess the numbers and other fundamental factors by analyzing wind-related data collected at the intended location prior to actual introduction of wind turbine generators.
2.4.4 Examples of Actual Implementation
In Myanmar, examples of implementation or operation of wind turbine generators at present are very few. And only one set has been confirmed in the mountainous region of Shan State through the reconnaissance. It was implemented by Karamosia Foundation (Aug. 2000, Japan) as one of cooperation projects by NGO. This is a small BCS powered by a hybrid system of the small wind turbine and the solar panel.
However, the development of wind turbine generators has been undertaken by a few indigenous manufacturers in Myanmar, which can be considered that the trial of wind power development has just been started.
The development projects confirmed through the reconnaissance are as follows:

-24- Nippon Koei / IEEJ Volume 8 Renewable Energy
The Study on Introduction of Renewable Energiesin Rural Areas in Myanmar
1) Myanmar Science and Technological Research Development (MSTRD) and Department of Physics at Yangon University have jointly undertaken the research and development work concerning utilization of wind energy.
2) One company of REAM member named “Ambient Resources Mover Co., Ltd.” has been doing a demonstration test on a multi-bladed wind turbine set at a site on the fringe of Yangon City since October, 2000. A multi-bladed wind turbine generator has a general property, which can generate electric power even under the very low wind velocity, but the cut-in velocity of their test machine set is 3.1m/s (7 mph), which will have to be more improved. However, it is so much appreciated that they have strong intention to launch their remodeled wind turbines, based on the actual data in another one year.
In addition, NEDO has undertaken a series of projects, technical development study and international joint research, shown in Table 6 for the wind power generation technology development with Myanmar government. These study and research projects were started from "Feasibility Study on New Energy Introduction in Asian Villages" continues to the current project, "Feasibility Study on Grid Connection System with PV Power Generation System (1998-2004, scheduled)". These are going to give a lot of applicable data in the near future.
The project of "Feasibility Study on Grid Connection System with PV Power Generation System" was started in 1998, and is scheduled to extend for seven years long. It is still under the study of application of a stable system by using a dummy load and the hybrid power source with PV, wind and DG on the supply side. Prior to this stage, NEDO installed a unit for measuring the wind and solar data at several locations around central and southern regions. A several tens of kW wind power generators will be implemented in this project in total.

-25- Nippon Koei / IEEJ Volume 8 Renewable Energy
The Study on Introduction of Renewable Energiesin Rural Areas in Myanmar
Figure 7 Multi-blade Type Wind Power Generator under Development

-26- Nippon Koei / IEEJ Volume 8 Renewable Energy
The Study on Introduction of Renewable Energiesin Rural Areas in Myanmar
CHAPTER 3 PROSPECTS OF SOLAR/WIND BCS
3.1 Features of Rural Electrification by BCS
It can be said that people settle the BCS system in order to obtain minimum electricity in Myanmar, where unfortunately the electricity supply service has not been improved for a long time. The BCS has been commercialized with the establishment of an excellent system of the BRS where the batteries are used as energy storage containers that can be recycled easily. They have made progress of one of the most important systems for the Myanmar society.
Table 10 shows the market prices of the batteries currently distributed in Myanmar based on types, brand-new or recycled, and charging cost etc., all of which were checked through the reconnaissance.
Followings are prevailing features of the BCSs used where the MEPE's grid power is not applicable:
1) Cheapness and readiness: The electric power demand for the minimum
electricity use such as lighting and radio-cassettes can be supplied relative cheaply in the region where the electricity from MEPE grid is not available.
2) Increasing power demand: Installation capacity is dependent on the interval of charging and procurement of new batteries or recycled batteries based on customers’ financial conditions
3) Sustainability based on self-responsibility: All of the procurement and payment are to be done on the commercial basis based on self-responsibility.
4) Small installation of BCS: The power for BCS can be supplied very simply with small equipment such as DG set and chargers, which will require only small capital investment. In this case, it is possible to choose a power source depended on the availability and regional conditions such as single power supply from MEPE grid or both supply of MEPE and private power line.
5) Applicability of near-by BRS: It is necessary that there is a commercial base BRS in the neighborhood, and that the recycled electrode plates can be commercially supplied. If not, the BRS has to be annexed to the BCS.

-27- Nippon Koei / IEEJ Volume 8 Renewable Energy
The Study on Introduction of Renewable Energiesin Rural Areas in Myanmar
3.2 Solar/Wind BCS
3.2.1 Advantages of Solar/Wind BCS
Though PV and wind power generation systems have advantages respectively as a power generation unit, the common advantages to the both are as follows;
1) No need of fuel supply: Because of using renewable energy such as sun shine and wind power, any supply of fuel is not necessary;
2) Maintenance free: Small-scale generator powered by a PV system or a wind-turbine system is basically maintenance-free though regular small maintenance is necessary such as cleaning.
3) Easy implementation with small weight and good portability: The light weight and good portability make it simple and easy to implement both of the systems even at remote and isolated areas, where other kinds of power generation systems are not applicable from a financial point of view due to small demand and hard accessibilities as is the case in hydro power generators.
4) Commercialized existence of BCS and BRS: The utilization of techniques concerning the battery required for solar or wind BCS is so popular in Myanmar. The problems to introduce solar or wind BCS are how to maintain the batteries, in general. There seem to be no problems in Myanmar in the way of using batteries due to management skills in maintenance and recycling batteries.
Here, a small-scale system of the rated capacity of 10 kW or less is targeted as an assumption of the comparison for BCS installation.

-28- Nippon Koei / IEEJ Volume 8 Renewable Energy
The Study on Introduction of Renewable Energiesin Rural Areas in Myanmar
Table 10 Particulars of the Batteries Currently Distributing in Myanmar Plate Type Capacity
Calculated Battery Cost
Place & Date, Check conducted at/on
Code
Recyclable or Non-R
Volt Plates Ah Brand-new
Recycled
Charging Cost
Location Date
Usage & others
101 2 1000 Ayar-Taw 27/05/01 111 6 9 25 Kyauktaga 12/02/01 112 6 9 1300 20 Meiktilar 15/02/01 113 6 S (15) 700 Myint-Nge 27/05/01 Manufacture 114 6 L (20) 1250 Myint-Nge 27/05/01 Manufacture 115 6 2000 12 Ayar-Taw 27/05/01 116 6 50 Machan-Baw 04/06/01 121 8 9 40 Kyauktaga 12/02/01 122 8 9 1800 35 Meiktilar 15/02/01 123 8 S*3 (15) 1000 Myint-Nge 27/05/01 Manufacture 124 8 L(B) (20) 2100 Myint-Nge 27/05/01 Manufacture 125 8 L(W) (20) 1900 Myint-Nge 27/05/01 Manufacture 126 8 2700 15 Ayar-Taw 27/05/01 127 8 60 Machan-Baw 04/06/01 128 8 60 Putao Dist 06/06/01 131 12 9 2100 40 Bago 12/02/01 132 12 9 (20) 3000 Myint-Nge 27/05/01 Manufacture 133 12 20 75 Kyauktaga 12/02/01 134 12 11 1500*1/ 30 Pyinmana 13/02/01 Radio
Cassette 135 12 11 (30) 4000 Myint-Nge 27/05/01 Manufacture 136 12 13 2100 40 Bago 12/02/01 137 12 13 (35) 6000 Myint-Nge 27/05/01 Manufacture 138 12 (35) 4000 Ayar-Taw 27/05/01 139 12 20-60 Ayar-Taw 27/05/01 140 12 70 Machan-Baw 04/06/01 MEPE’s Q 141 12 70 Putao Dist 06/06/01 151
Recyclable
For 6-8V Batteries 10 Thit-Taung Vil 29/05/01 UNDP*2 201 12 70 3700*1 70 Pyinmana 13/02/01 Video 202 12 120 100 Bago 12/02/01 203 12 150 100 Bago 12/02/01 204
Non- Recyclable
12 150 4000*1 70 Pyinmana 13/02/01 TV 301 Recyclab
le 2 15 250 9000 Myint-Nge 27/05/01 Manufacture
Source: Data collected by JICA Study Team *1 These Prices are a bit old, about several yeas ago. *2 Provided by UNDP/WATSAN Project in 1998. *3 L: Large, S: Small, (B): Black, (W): White

-29- Nippon Koei / IEEJ Volume 8 Renewable Energy
The Study on Introduction of Renewable Energiesin Rural Areas in Myanmar
3.2.2 Technical Issues of Solar/Wind BCS
(1) The Development of the BCS Project Combined with the PV and Wind Data Collection
Solar/wind data on their installation sites should be provided in advance to introduce PV or wind turbine systems. In Myanmar basically only weather records collected at local meteorological stations are available. They can offer weather data and wind velocity and direction data, but very few for irradiation data. Localized data at planning sites will be necessary for planning especially for wind power systems. It needs time and financial supports to launch the due projects of collecting detailed PV and wind data in the future. Therefore, at the introduction stage of PV or wind power generation, small-scale model projects supplying power to BCSs or pumping systems should be promoted simultaneously collecting PV or wind data instead of promoting a project only for collection of meteorological data. The followings are some of ideas for projects based on the Grassroots schemes financed by Embassy of Japan.
0) For arrangement of PV database
A compact units to be annexed to BCS in operation. As the PV cell generates power in proportion to solar radiation, the inclined daily insolation or irradiation could be measured by daily power generation with checking current and voltage data on a DC line. The checking intervals are to be every five minutes or every ten minutes, and the value will be recorded in a special recording media. And the collected data is to be saved once every two or three months.
1) For arrangement of wind database:
The projects of collecting wind data have to be curried out only for the purpose to implement wind power generators in the future. Therefore, it is very important to confirm the positive result that the wind data is highly available for a wind power generation at a candidate site on the site selection stage. Acquisition of wind data would be possible in operating BCS powered by wind turbine generators as is the case in PV systems, but it is not much recommended. The wind turbine generator has a different character from PV. As it has a certain speed range such as cut-in, rated and cutout speed, the relation between power output and wind velocity is not corresponding. Therefore, it is highly advisable that wind velocity should be measured by a special tool at the project site in case that priority is given to data collection of wind velocity.

-30- Nippon Koei / IEEJ Volume 8 Renewable Energy
The Study on Introduction of Renewable Energiesin Rural Areas in Myanmar
However, it is possible to introduce a small-scale wind turbine generator as a trial even if there is no particular correspondence, and to collect the wind data while supplying limited BCS functions. It is necessary to sample data very simple only to collect wind velocity just the same as irradiation data of PV.
In any cases, the following actions would be required when analyzing the compiled data:
To add further installation of wind turbine generators in case if favorable wind velocity is obtained;
To add further installation of PV systems if complementary relationship between PV and wind power are found; and
To move the total facility to another sites for further data collection in case that no favorable data is collected.
(2) Issues Concerning Battery
The existence of battery recycle system with BCS currently prevailing in Myanmar can be highly evaluated. However, it is necessary to standardize the specifications of the battery recycling techniques and the method of recycling battery components in the BRS. It will be necessary to build up trustful relations between customers and business promotion activities of BCS. It is difficult to tell whether a battery is charged enough or not, because the electric energy conserved in a battery cannot be seen. Over-discharging of battery is a problem. Customers use batteries at their own judge and they use batteries until electricity is completely consumed, which makes battery life short. Such many issues turned out in the present BCS and BRS through the reconnaissance.
The countermeasures for them would be an introduction of a daily management system about battery charging and a battery test unit to check battery characteristics on charging and discharging. The former is to be solved at the stage of battery maintenance, and the latter requires introduction of an automatic battery tester.
3.3 SHS and BCS, and Renovation of Charging Method of BCS
3.3.1 Brief Explanation about SHS and BCS
(1) Solar Home System
In the strict sense, a solar home system (SHS) is a domestic PV system, of which capacity would vary from a small system to power a lighting unit to larger utensils supplying enough power to all the requirements as being used in a grid-connected

-31- Nippon Koei / IEEJ Volume 8 Renewable Energy
The Study on Introduction of Renewable Energiesin Rural Areas in Myanmar
home. As a general rule, however, it means a tiny, stand-alone power generation system with 12 V direct-current (DC) used in non-electrified areas, which use PV panels to electrify small rural homes.
A typical SHS consists of a PV array with batteries, a charge controller, wirings, fluorescent lights, and outlets for other appliances as shown in Figure 8. The capacity of SHS has to be decided dependent on what kind of electric appliances he wants to use and his ability of payment for not only the SHS but also for its sustainable operation.
Figure 8 Configuration of SHS
PV Array
Battery Bank DC Power to SHS
Lamp
Radio

-32- Nippon Koei / IEEJ Volume 8 Renewable Energy
The Study on Introduction of Renewable Energiesin Rural Areas in Myanmar
Table 11 Power Output and Operational Hours Depending on PV Capacity
Size of Power Output (kWh/day) Operation Hours (Hours) Capacity of PV Panel
Dry Season
Mean Rainy Season
Lamp (20W)
Radio Cassette (5W)
Others
50W 95 80 65 1set x 3 1set x 1 100W 190 160 130 1set x 5 1set x 5 200W 380 320 260 2sets x 5 1set x 10 (TV) 300W 570 480 390 3sets x 5 1set x 10 TV Note: This Table is calculated based on the Irradiation Data at Myityina (DOMH).
(1) Battery Charging System
A PV-powered BCS can provide a cost-effective electrification in remote areas. The BCS is one of the most reliable PV systems on account that it requires only a PV array and a battery controller but no stationary batteries as furnished in a SHS. Batteries are normally privately owned. Customers bring batteries to BCSs to have their batteries charged when discharged. In short, batteries in the BCS system will act just as mobile energy containers.
Figure 9 Image of BCS
3.3.2 Issues about Serial Connection of Batteries in BCS
It is very popular, in Myanmar, that batteries are serially connected when charged in grid-connected BCSs. However, this is by no means good for charge batteries. In the BCS all of batteries are to have different conditions of left life expectancy, charging impedance, state of energy remainder, and capacity. When charged in
Charger
Battery User
Load Discharger
BatteryPortion of BCS
Battery as Mobile Energy Container
Unit BCS
BatteryUnit BCS
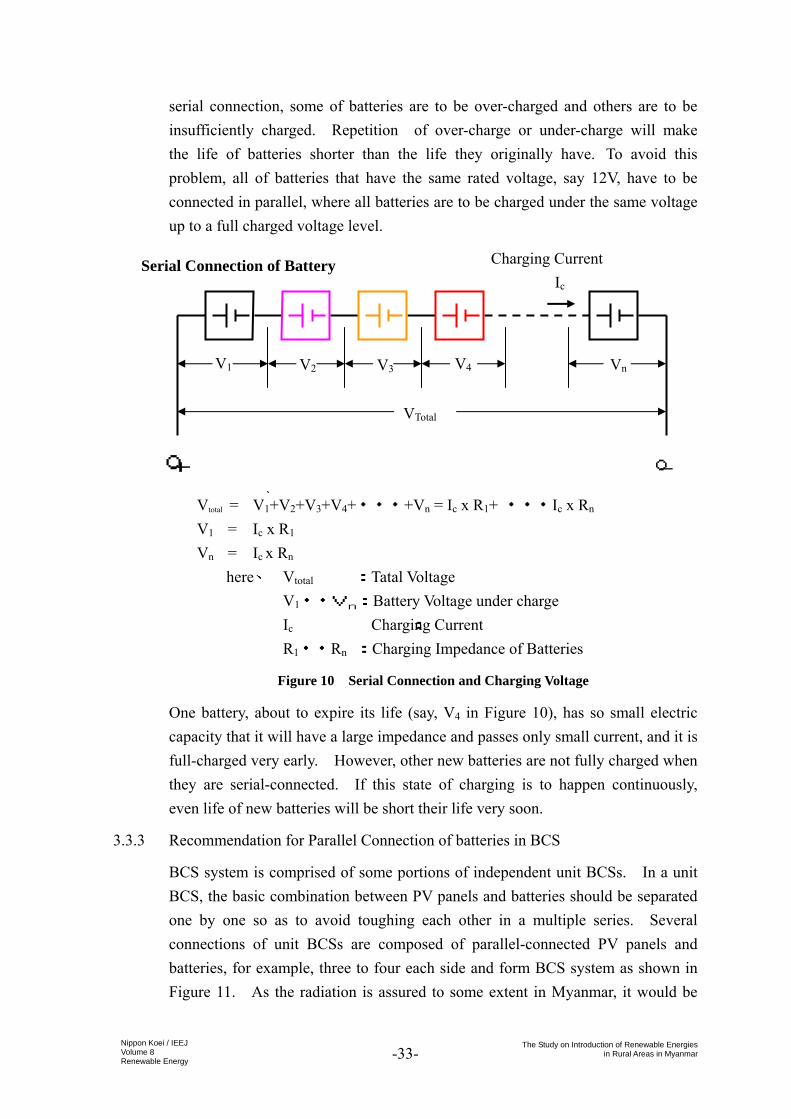
-33- Nippon Koei / IEEJ Volume 8 Renewable Energy
The Study on Introduction of Renewable Energiesin Rural Areas in Myanmar
serial connection, some of batteries are to be over-charged and others are to be insufficiently charged. Repetition of over-charge or under-charge will make the life of batteries shorter than the life they originally have. To avoid this problem, all of batteries that have the same rated voltage, say 12V, have to be connected in parallel, where all batteries are to be charged under the same voltage up to a full charged voltage level.
Serial Connection of Battery
Vtotal = V1+V2+V3+V4+・・・+Vn = Ic x R1+ ・・・Ic x Rn V1 = Ic x R1 Vn = Ic x Rn here、 Vtotal :Tatal Voltage V1・・Vn:Battery Voltage under charge Ic :Charging Current R1・・Rn :Charging Impedance of Batteries
Figure 10 Serial Connection and Charging Voltage
One battery, about to expire its life (say, V4 in Figure 10), has so small electric capacity that it will have a large impedance and passes only small current, and it is full-charged very early. However, other new batteries are not fully charged when they are serial-connected. If this state of charging is to happen continuously, even life of new batteries will be short their life very soon.
3.3.3 Recommendation for Parallel Connection of batteries in BCS
BCS system is comprised of some portions of independent unit BCSs. In a unit BCS, the basic combination between PV panels and batteries should be separated one by one so as to avoid toughing each other in a multiple series. Several connections of unit BCSs are composed of parallel-connected PV panels and batteries, for example, three to four each side and form BCS system as shown in Figure 11. As the radiation is assured to some extent in Myanmar, it would be
○-
Vn V4V3V2 V1
VTotal
○+
Charging Current Ic

-34- Nippon Koei / IEEJ Volume 8 Renewable Energy
The Study on Introduction of Renewable Energiesin Rural Areas in Myanmar
effective to install a BCS in the region even where there is no meteorological data such as irradiation, and collect data during operation. The method could be applicable to a SHS as well. It is important to connect each battery in parallel to keep line voltage at 12 V DC for charging 12 V batteries.
Figure 11 Configuration of Unit BCS
Charger Controller
V1
V2
V3
V4
Batteries
BD
Unit Array of PV Panels

-35- Nippon Koei / IEEJ Volume 8 Renewable Energy
The Study on Introduction of Renewable Energiesin Rural Areas in Myanmar
CHAPTER 4 PROPOSED STRATEGY FOR USING SOLAR/WIND BCS
4.1 Future Prospects of Solar and Wind Energy
4.1.1 Dissemination Base of PV and Wind Power Generation System in Myanmar
The possibility of remote electrification by PV systems can be enormous, as its power generation system is applicable to various usages of not only BCSs but also requirements from the demand side. In a word, the usage is multifarious. As a matter of fact, many types of PV systems were confirmed through the reconnaissance, and some of which were strongly requested to promote the PV or wind system by residents at the time of our interviewing with them. Details are shown in Chapter 7. Some of them have an advantage to apply other renewable energy sources suck as rice husk than PV or wind turbine generator.
The major weak points in PV and wind power generation systems are as follows;
1. An energy storage device should be furnished into a power generation system for stable use of electricity because of time difference between power generation and its utilization;
2. The power output is always unstable due to the difference among day and night, weather conditions, seasons and so on. The output fluctuates to some extent even under the same weather conditions.
To cover these weak points, the batteries should be introduced into the PV or the wind power generation systems as the only way of energy storage.
Among components comprising the PV or the wind power generation systems, the life of PV panels (20-30 years or more) and small wind turbine generators (ten years or more) are relatively long, while the life of batteries are very short compared with other power components. It might be about 1,000 cycles for batteries of highest quality under practical use, and about 300 cycles or less for car batteries. It is no exaggeration to say that the PV and wind popularization is depends on by the presence of expensive batteries, because the life of low-graded batteries will be expired within a few years or so even if they have been well maintained.

-36- Nippon Koei / IEEJ Volume 8 Renewable Energy
The Study on Introduction of Renewable Energiesin Rural Areas in Myanmar
4.1.2 Systems with Dissemination Possibility
(1) SHS
Actual use of SHSs, which have already started to be used among wealthy families in Myanmar, will be sure to become very popular even in far isolated areas from now on. It could be said that PV systems will play a one-man show to power SHSs, but it is said, of course, that the wind power generators would also be applicable in windy areas as stand-alone systems or hybrid systems with PV.
(2) PV and wind pump requires no batteries
PV and wind pumping systems become the most effective among the usages powered by PV or wind turbine power generation systems as described above, because they have reservoir portion within the systems themselves instead of storage batteries. This means the pumping systems require no batteries as energy storage, as long as water storage tanks are involved in the systems.
(3) BCS as a system without batteries
Since a customer buys batteries and has to maintain them by himself, it may be said that a BCS system requires no batteries in it, depending on the perspective. Furthermore, this shows that there is neither inconvenience nor damages for the maintenance of BCS system. Therefore, similar to the absence of storage batteries between the BCS and the pump systems, it seems to be one of the most effective means for electrification on the suitable ways.
(4) Grid connection systems
It is difficult that both of PV or wind power generation have a major position as a power generation system. As mentioned in Chapter 4.1.1, the most efficient usage of PV or wind power generation is to connect grid system. Though it may be too early to think a grid connection system acceptable right now in Myanmar, mini or micro hydro power generators could possibly make one of the applicable options. The grid connection system uses its huge power supply capacity for huge demand instead of energy storage devices. Accordingly, almost all the electric power generated by capricious power generators such as PV or wind power generation systems, affected greatly by changeable weather, can be used efficiently. Anyway, the expensive cost fixed by the current power generation system will become considerably

-37- Nippon Koei / IEEJ Volume 8 Renewable Energy
The Study on Introduction of Renewable Energiesin Rural Areas in Myanmar
reasonable by the time when these renewal energy power generators are applied to the grid system in Myanmar.
4.1.3 Production Rate of PV Module and Transition of Price
The demand for a worldwide PV has been expanding rapidly since 1996, which decrease PV price greatly along with it. As shown in Table 12, comparing 1997, 1983, and 1990, the prices have been depreciated to 26.5% and 81.5% respectively. According to the estimation by Ministry of International Trade and Industry (former MITI, at present Ministry of Economy, Trade and Industry, Japan), the prices in 2005 and 2010 will be decreased down to 21.5% and 15.4% respectively against the basic price in 1990. Their estimation foretells that the PV cost will be 1,170 $/kW (140,000 yen/kW) in 2005, and 840 $/kW (100,000 yen/kW) in 2010 on the condition that the yearly production rate is 100 MW.
Table 12 PV Production and Decrement of PV Cell Unit Cost
In this background, MITI started the scheme of the field test project in Japan for the dissemination and promotion of the PV power generation business. The outline of this project is as follows. “Upon introducing the renewable energy power generation systems such as PV and wind power into industrial use or into home use, all of renewable power generation systems are to be connected with commercial power grid lines so as to make the best of the power output from renewable power generators”. For this purpose MITI launched two kinds of promotion systems backed up with subsidy in 1992 and 1994. The PV power generation business in Japan has tremendously expanded through these business developments. This subsidiary system brought about competition and standardization into the business, which has made all the cost of PV components including installment cost lower and lower (Table 13).
Item Nation Unit 1983 1985 1990 1993 1995 1996 1997 1998 1999*/4 2000*/4 2005 2010
Japan MW 16.70 17.40 21.20 35.00 49.00 80.00 128.60Others MW 43.39 62.20 67.40 90.80 104.20 127.00 149.20 - -World MW 60.09 79.60 88.60 125.80 153.20 207.00 277.80 - -Japan USD 16667 10000 5416.7 5000 4416.7 1166.7 833.3Japan k¥/kW 2,000 1,200 650 600 530 140 100
*/1 Source: PV News February, 2000*/2 Source: MITI, December, 1999 First New Energy Session of General Energy Investigation Committees*/3 Unit Cost estimated with assumed production rate of 100MW/Year*/4 Source: PV News, February and March, 2000
PV Cell Production*/1
Unit Cost of PV Cell*/2
100*/3

-38- Nippon Koei / IEEJ Volume 8 Renewable Energy
The Study on Introduction of Renewable Energiesin Rural Areas in Myanmar
Table 13 Standard Unit Price/kW of the Field Test Project System for Public and
Industrial Applications
4.1.4 BCS Cost Estimation in 2010
The cost estimation for PV components after ten years could be calculated by those two data mentioned above.
(1) Calculation Condition
1) The major preconditions are based on the current state of Myanmar. Therefore, neither an inflation rate nor other economic fluctuation factors are put into the preconditions.
2) Almost all PV systems, irrespective of home or industry use, it is the grid connection systems that currently being installed on large scale in Japan. And the batteries are not included in the current system of BCS in Myanmar, which seems to have a common point to the grid connection system in Japan.
3) It is necessary to pile up cost of yearly reduction by technology transfer and improvement.
4) In calculating the price of PV, the standard calculation value, 100,000 yen, fixed by MITI (Japan) as a yearly production basis of 100 MW is adopted. As the calculation value has already been cleared enough because of the output more than 116.5 MW in 2000 of Japan. The calculation conditions will be improved better in the near future.
5) The cost reduction rates of the components other than PV are assumed to be about 80% of PV. Therefore, the ratio of the PV prices will fall compared with the one in 1998, and other units or elements will increase vice versa.
6) Myanmar CIF (certificate, insurance, and freight) price of the PV panel adopts standard cost calculation. The proportion of this price in the whole
Item 600 14.2% 600 16.1% 600 18.5% 580 25.5% 466 28.0% 506 37.6% 537 45.9%
PV Pannel 998 23.7% 900 24.1% 750 23.1% 558 24.6% 479 28.8% 284 21.1% 193 16.5%
Inverter 642 15.2% 420 11.3% 370 11.4% 246 10.8% 141 8.5% 129 9.6% 101 8.6%
Other Equipment 642 15.2% 420 11.3% 370 11.4% 246 10.8% 141 8.5% 129 9.6% 101 8.6%
Construction Cost 1337 31.7% 1390 37.3% 1150 35.5% 641 28.2% 437 26.3% 296 22.0% 237 20.3%
Total 4219 100.0% 3730 100.1% 3240 99.9% 2271 99.9% 1664 100.1% 1344 99.9% 1169 99.9%Source: Material for a Lecture of NEDO Promotion Department
1996 1997 19981992 1993 1994 1995

-39- Nippon Koei / IEEJ Volume 8 Renewable Energy
The Study on Introduction of Renewable Energiesin Rural Areas in Myanmar
is decided by referring to mass-produced data of Japan. The cost ratio of all other components is defined, and a cost of each component is calculated.
Table 14 Standard Unit Price/kW of the Field Test Project System for Public and
Industrial Applications-1
Table 15 Standard Unit Price/kW of the Field Test Project System for Public and
Industrial Applications-2
(2) Calculation procedures
1) PV Panel
The data of MITI is adopted as a cost of the PV panel. The contingency rate is assumed to be 30%, which should be added to the Japanese unit price, 100 kyen/kW. (kyen = 1000yen). Then Japanese unit price :130 kyen/kW.
CIF-Yangon expenditure: 40%
Price ratio in PV system configuration: 40%
2) Controller
Experiences will be acquired through projects such as "Grass-root Project" etc. by 2010. Moreover, the production of controllers has already arrived at the stage of the indigenous production in Myanmar.
Price ratio in PV system configuration: 40%
3) Other Equipment
(Unit:1000USD)
ItemPV Pannel 5.0 16.8% 5.0 18.1% 5.0 20.8% 4.8 28.4% 3.9 30.7% 4.2 41.2% 4.5 50.6%
Inverter 8.3 27.9% 7.5 27.2% 6.3 26.3% 4.7 27.8% 4.0 31.5% 2.4 23.5% 1.6 18.0%
Other Equipment 5.4 18.1% 3.5 12.7% 3.1 12.9% 2.1 12.4% 1.2 9.4% 1.1 10.8% 0.8 9.0%
Construction Cost 11.1 37.2% 11.6 42.0% 9.6 40.0% 5.3 31.4% 3.6 28.3% 2.5 24.5% 2.0 22.5%
Total 29.8 100.0% 27.6 100.0% 24.0 100.0% 16.9 100.0% 12.7 99.9% 10.2 100.0% 8.9 100.1%
Source: Material for a Lecture of NEDO Promotion Department(The Japan Electrical Manufactures' Association, 2000/2/10)
1992 1993 1994 1995 1996 1997 1998
(Unit:1000¥)
ItemPV Pannel 600 16.8% 600 18.1% 600 20.9% 580 28.6% 466 30.6% 506 41.6% 537 50.3%
Inverter 998 27.9% 900 27.2% 750 26.1% 558 27.6% 479 31.5% 284 23.4% 193 18.1%
Other Equipment 642 17.9% 420 12.7% 370 12.9% 246 12.1% 141 9.3% 129 10.6% 101 9.5%
Construction Cost 1337 37.4% 1390 42.0% 1150 40.1% 641 31.7% 437 28.7% 296 24.4% 237 22.2%
Total 3577 100.0% 3310 100.0% 2870 100.0% 2025 100.0% 1523 100.1% 1215 100.0% 1068 100.1%
Source: Material for a Lecture of NEDO Promotion Department(The Japan Electrical Manufactures' Association, 2000/2/10)
1992 1993 1994 1995 1996 1997 1998

-40- Nippon Koei / IEEJ Volume 8 Renewable Energy
The Study on Introduction of Renewable Energiesin Rural Areas in Myanmar
Most materials are procured from Myanmar-made goods, though foreign products such as a special cable, small electronic units, etc., might be procured.
Price ratio in PV system configuration:5%
4) Construction
Weight is low though there exist uncertain factors such as difficulty of transportation, but the disadvantage of the road condition is very low as a whole.
Price ratio in PV system configuration: 15%
The kW-based unit price of the PV panels in 2010 is shown in Table 16, assumed from the conditions above.
Table 16 Estimation of kW-Unit Cost in Myanmar in 2010
The unit cost of BCS is estimated around US$3,800 in 2010, and thus around US$19,000 for 5 kW-BCS and around US$11,400 for 3kW-BCS.
4.2 Application to Small Villages in Remote and Hardly Accessible Areas
4.2.1 Issues and Countermeasures for Rural Electrification by PV and Wind Power Generation
The promotion of the remote area electrification in Myanmar seems to be difficult. Especially, the electrification in the far remote area with inconvenient traffic access is very difficult where PV or wind turbine generators are the only way to electrify. In this chapter, some of the countermeasures are presented against issues supposed to encounter when introducing PV or wind turbine generators in these remote areas.
(1) Data of Energy and Weather Condition
Item U-Price Contin Japn in 2010 Myanmar in 2010 Myanmar in 2010
Unit & % kYen/kW gency kYen/kW % kYen/kW % USD/kW %PV Pannel 100 1.3 130 30% 182.0 40% 1,517 40%Controller 130 30% 182.0 40% 1,517 40%Other Equipment 65 15% 22.8 5% 190 5%Construction Cost 108.3 25% 68.3 15% 569 15%Total 433.3 100% 455.1 100% 3,793 100%

-41- Nippon Koei / IEEJ Volume 8 Renewable Energy
The Study on Introduction of Renewable Energiesin Rural Areas in Myanmar
At the planning stage, it becomes very important to check whether sufficient energy of solar radiation or wind could be obtained so as to supply enough power to the demand in the proposed area. These energy sources are indigenous to the natural conditions in the region. The data for the analysis is not, to our regret, enough.
The sunshine-hour data could be used in place of the irradiation data to some extent. Because the whole land of Myanmar is blessed with relatively good sunshine, introduction of PV systems seems be no problem. However, some of countermeasures should be taken against the low irradiation days in a rainy season. The insolation data during the rainy season, June to September, is as low as 3-4 kWh/m2/day, and it is almost half as much as dry season (4-6 kWh/m2/day) in some regions as shown in Table 3. Followings are the countermeasures:
1) Upon designing, the value, 3 kWh/m2/day, is applied for the capacity calculation of solar insolation;
2) The selection of a hybrid system with wind turbine generators should be considered for the windy area with strong wind during rainy seasons.
(2) Establishment of BCS System as a Total System
The system of BCS has to be installed based on the two points. That is, the best charging of batteries and best usage of them. These two aspects become a prerequisite for using batteries in the best condition. In case of future introduction of BCSs, installation of charge controllers is needed for BCS side and the discharge controllers is needed for the consumers’ sides. Especially, the same problems in regard to charging and discharging often occur in SHSs. The introduction of necessary devices into the systems would become an important point of maintenance of the BCSs.
(3) Stable Acquisition of Good-qualified Batteries
The batteries occupy the most important part in the BCS system. It is not an exaggeration to say that the batteries play a crucial part for sustainability of the BCS system. Stable supply of inexpensive batteries is very important in order to disseminate the BCS system. The present BRS system seems to be a precondition of the BCS system dissemination, taking into consideration of current state of Myanmar. In such areas that BCS will be implemented in the future, a traffic infrastructure seems to be so poor that parts and materials for a

-42- Nippon Koei / IEEJ Volume 8 Renewable Energy
The Study on Introduction of Renewable Energiesin Rural Areas in Myanmar
BRS could not be transported for several months due to a long rainy season. Following measures have to be taken;
Setting up a BRS system as an annex to a BCS is necessary;
Upon introducing a BCS, certain amount of parts and materials for a BRS system should be provided in the region where a traffic infrastructure is not enough;
Establishment of training method on the technology about battery recycle and material reproduction;
Regulation of examination about battery quality verification should be established in capacity calculation method; and
Environment measures for battery reproduction should be established.
(4) Standardization of Battery
It is necessary to specify the voltage for at least 12V class of batteries in the BCS system, which would be a basic specification for the purpose of keeping batteries in better conditions upon charging and discharging with proper controllers. Battery charging mixing with different voltage specification is likely to be performed very much in current ways of battery usage in Myanmar. Therefore, some restrictions such as raising the charging price might be needed to prevent from mixing batteries other than the specified voltage. Moreover, it is necessary to set up the management system of charging batteries. It is needed to record their history, say, date of initial installment, numbers of battery charge, water refill, etc.
4.2.2 Dissemination and Promotion of Remote Electrification by PV- or Wind-Power Generation System
(1) Dissemination Procedure of Wind Power Generation
Upon introduction of wind power generators, wind velocity data have to be checked in advance, as described already. 3.5-4m/s might be at least necessary as the monthly average wind velocity. However, it would be better to start some of small-scale, practical projects, through which wind velocity data could be collected in many locations for future provisions of the wind data as much as possible. Only the accumulation of these preliminary projects could enable Myanmar to start actual introduction of wind power generators.
-43- Nippon Koei / IEEJ Volume 8 Renewable Energy
The Study on Introduction of Renewable Energiesin Rural Areas in Myanmar
Followings are the due procedures:
Extract regions favored in high wind velocity
Planning of preliminary small-scale projects
Establishing some of installation of system for recording wind power generated as an annex
Small-scale, practical systems for community center
Rated output: 1-3 kW
Project execution
2- years operation, data collection, and analysis
Promotion of actual projects by evaluating collected data
What is important here is to verify the 2 years’ actual operation data collected from BCSs, and to decide weather the location is favored with wind energy for implementation of wind power generators in the future.
It is, in addition, necessary to make a complete plan of a wind power generation system when it is supposed to be effective, and to promote the project implementation. On the contrary, in case of disadvantaged wind conditions for the wind power generation, it is also necessary to verify possibilities with a hybrid system with PV or a PV mono system. It is necessary to transfer the small-scale system to another site when supposed not to be applicable in all respects.
It seems that only such a scheme of projects that has a flexibility have to be used for disseminating the wind power generation system in Myanmar.
(2) Dissemination Procedure of PV-powered BCS
The dissemination procedure of PV-powered systems can be made simpler than that of wind systems. Good wind conditions would be the top priority for an introduction of wind power generators. On the contrary, PV system would be simpler because almost all area in Myanmar is blessed with solar radiation value of 3 kWh/m2/day except for particular areas. An introduction of PV systems can be planned only by confirming consecutive no-sun-days and rainy days, usually taken as 3 to 4 days, which would be hard to be fixed.

-44- Nippon Koei / IEEJ Volume 8 Renewable Energy
The Study on Introduction of Renewable Energiesin Rural Areas in Myanmar
Upon introduction of a PV-powered BCS, it would be important to adopt a special set of compact equipments to record data, which enable engineers to infer solar radiation values. Of course, this solar-powered BCS is actually to supply power to a battery charge section or to a dummy load in case of excess power generated like wind-powered BCS. The system has a function as follows;
Acquisition of PV-generated power by measuring primary voltage and current every one minute
Collection of accumulated data once every one or two months
Analysis of collected data
These compiled data can complement DOMH data. Followings are the procedures:
Analysis of collected data of candidate projects among locations in remote area with relatively high irradiation
Sample Project Plan
Selection from each state
Practical installation
Measurement of irradiation data
Project Execution, Data Sampling, and Analysis
2 years operation
Data analysis
Project Trial `Period and Number of Trial Projects
10 sets/year
Target region:Kachin, Chin, Magwe, Mandalay, Rakhine, etc.
4.3 Technical Support
Upon starting projects of PV wind BCSs, it is very important to evaluate efforts by the Myanmar Government and Myanmar NGOs for disseminating BCSs powered by renewable energies. As subsidiary projects to support their independent endeavors for RE promotion, some of foreign assistance projects

-45- Nippon Koei / IEEJ Volume 8 Renewable Energy
The Study on Introduction of Renewable Energiesin Rural Areas in Myanmar
such as Japan Grassroots Grant or other schemes for environment should be offered.
The problem solution and the standardization according to introducing BCSs in Myanmar will be started one by one, and this attempt will lead establishment of organizations for introduction very shortly. Necessary components are basically supplied other than consumers’ personal appliances such as batteries and lamps, though assistance items would vary depended on project schemes. All functions necessary for their own operation and maintenance management by residents have to be included as an electrification system. Technical support will be needed for an introduction stage and a subsequent stage of operation. Next chapter shows problems expected and the assistance requested, including schemes of short-term dispatch specialists.
4.3.1 Planning Stage
A planning stage can be crucial to forecast the issues in due course of encounter at every stage of future implementation of the BCSs and the countermeasures and organizations to cope with the issues. The outline of technical support is shown as follows.
System design: Calculation of system capacity and design of specification
Estimation of budget: Collection of cost estimates based on brief specifications
Documentation of whole plan of maintenance: Maintenance management manuals and BRS technological standards
Preparation of application form: Detailed forms about implementation and maintenance management provided by a village electrification committee.
4.3.2 Introduction Stage
It is necessary to arrange, examine the information gathered along with the procurement of the system equipment, and provide the detailed instruction manual for construction based on them. The management over progress for implementation is needed as follows;
Preparation and check of specifications for construction
Preparation of technical manuals for the BRS and engineer who train users
To undertake inspection and to provide instruction for start-up operation

-46- Nippon Koei / IEEJ Volume 8 Renewable Energy
The Study on Introduction of Renewable Energiesin Rural Areas in Myanmar
Preparation of maintenance management
Preparation of BCS users’ regulations
4.3.3 Operation and Maintenance Stage
The detailed operation data including maintenance will be very important for the future promotion of BCSs, as there exists few experience about PV-powered BCSs so far.
Registration of customers and batteries: Checking batteries (12V class) and numbering
History management of battery
Individual check by customers: Use of a discharge controller and life of apparatus, etc.
Stable acquisition of recycling parts or materials for a BRS

-47- Nippon Koei / IEEJ Volume 8 Renewable Energy
The Study on Introduction of Renewable Energiesin Rural Areas in Myanmar
CHAPTER 5 CRITERIA FOR SELECTION AND PRIORITIZATION OF RENEWABLE ENERGY PROJECTS
5.1 Criteria of Electrification by Adopting Solar or Wind BCS
The decision-making procedures to electrify remote villages with renewable energy equipment is as follows:
(1) Villagers' Wilingness for Electrification
First of all for village electrification, there exists a strong desire of "Using electricity" among villagers.
(2) No plan to extend a grid line to a targeted village so far and in the future
(3) Examination of resources of electrification
There are not a few variations for remote electrification such as biomass, wind and PV power generation systems other than micro or mini hydro power generation. The selection of systems has to be decided by checking size of electrification, financial conditions, difficulty of implementation and so on.
As a whole, a bigger priority could be given to hydro or rice husk power generation systems due to their relatively bigger output and cheaper cost. And, therefore, only in case of difficulty in implementation, neither potential for hydropower nor rice husk, possibility of PV or wind power generation should be examined.
(4) No existence of power generation by other power units
Such villages that some part have been locally electrified with private-own line supplied by DG or micro hydro generators and indirectly electrified with the BCS+BRS systems have to be excluded from the targeted villages.
5.2 Criteria for Selection of Appropriate Areas or Locations to be electrified by using Solar- or Wind-BCS
(1) Rural Electrification Strategy
The rural electrification business to be promoted as a national policy in the future aims at "full-scaled electrification" that supply power for 24 hours. The next electrification strategy would be set for an electrification target using each renewable energy source in accordance with this target.

-48- Nippon Koei / IEEJ Volume 8 Renewable Energy
The Study on Introduction of Renewable Energiesin Rural Areas in Myanmar
Hydropower potential region: In a region with hydro potential, remote electrification should be prompted by a small or micro hydro power generation in order to supply power for 24 hours.
Rice field region: As short or mid-term electrification measures until future coverage with a power grid around the village areas, a "semi-scaled electrification" should to be promoted so as to supply power for five to twenty hours a day with rice husk power generators.
Mountainous region: "Simple electrification" by micro or pico hydro power generators and PV or wind powered BCS to should be promoted in mountainous regions without rice field
(2) Rural electrification strategy
Depended on the remote electrification strategy shown in the preceding clause, the targeted area where PV or wind BCS is applied is limited at present, but many of areas are actually suitable for PV-or Wind BCS.
In general, the regions with abundant hydro potential, rice husk or sawdust would have priorities of hydropower generation or gas engine power generation.
In the region without potential of biomass gas or hydropower generation, PV BCSs could be applied and, especially in the wind-favored locations wind BCSs could be applicable.
Because PV or wind generation will be used in BCS, the selection of village scale will be less than 100 households, and a BCS should be annexed with a BRS.
(3) Standard for Selection of Rural Electrification Project
Electrification with PV BCSs should be selected among small villages with no other alternative energy resources than solar energy from the viewpoint that there is nationwide radiation potential. Moreover, a wind PV hybrid system would be applicable for the area with good wind potential. The selection standard is shown in Table 17.

-49- Nippon Koei / IEEJ Volume 8 Renewable Energy
The Study on Introduction of Renewable Energiesin Rural Areas in Myanmar
Table 17 Selection Criteria of Solar/Wind BCS Schemes
No. Parameters Criteria for Selection(Qualification) 1 Possibility of extension of distribution
lines from Grid L>1km
2 Existence of rice-mills or sawmills nearby Not existing nearby except for small scale ones which cannot meet fuel requirement of Biomass Gas Engine
3 Existence of adequate hydro potential nearby
Not exists.
4 Accessibility to the target villages(road driving hours from Yangon, Mandalay, or other large urban centers nearby in the rainy season)
T>3 hrs or road not passable in the rainy season
5 Number of households (N) in target one village
N<approximately 100 households
Source: JICA Study Team

-50- Nippon Koei / IEEJ Volume 8 Renewable Energy
The Study on Introduction of Renewable Energiesin Rural Areas in Myanmar
CHAPTER 6 TECHNICAL STANDARDS
6.1 Technical Data to be Collected for Basic Planning
6.1.1 Method of Sizing PV Capacity of BCS System
(1) Preconditions for Calculation
Village facilities and load assumptions are shown in Table 18.
The future increment factor of 25% on power demand to be taken into the plan.
A battery recycling shop to be established as one of the complementl facilities to a BCS.
The facility of a BCS to be operated along to the regulation manuals,
(2) Conditions of calculation of PV capacity
No of households: 200, 150 and 100, respectively
Interval of battery charging: Once every 4 days
Margin factor for the system capacity: 1.25
Here, the margin factor includes:
Increment factor on power demand: 15%
Power provide for public facilities other than primary school, community center etc: 5%
Margin for unknown factors from no data of weather conditions: 5%
Output capacity of PV array: 2 kWh/m2/day
Battery capacity for calculation: 20 to 50Ah as a mean capacity
Battery DOD (depth of discharge): 70%
Efficiency factors of PV systems;
Charge-discharge efficiency of lead–acid battery: 0.83
Degradation factor of recyclable batteries compared with normal lead-acid batteries: 0.85
Circuit Loss: 0.138(= (1.5V/12V) x 1.1)

-51- Nippon Koei / IEEJ Volume 8 Renewable Energy
The Study on Introduction of Renewable Energiesin Rural Areas in Myanmar
Specification of PV Panel
Energy conversion efficiency: 13.5%
Area of PV panel: 0.4m2
PV output: 54 Wp
Degradation factor with temperature rise on the PV panel: Δt = 45 to 50℃ from a standard temperature, 25℃
Other loss factor: 10%
(3) Calculation Method
Required Power Generation, Pq [kWh/day]
Pq = M x Pd /( K3 x K4 x K5)
Here, Pd: Power demand, [kWh/day]
M: Margin factor for the future miss-much, 1.25
K3: Battery charge-discharge efficiency for recycling battery, 0.83, and here 0.85 to be taken into calculation as a degradation factor by using recyclable batteries
K4: Energy transmission efficiency on DC including controllers,
(1- loss factor)=0.87
K5: Efficiency of controller, here included in K4
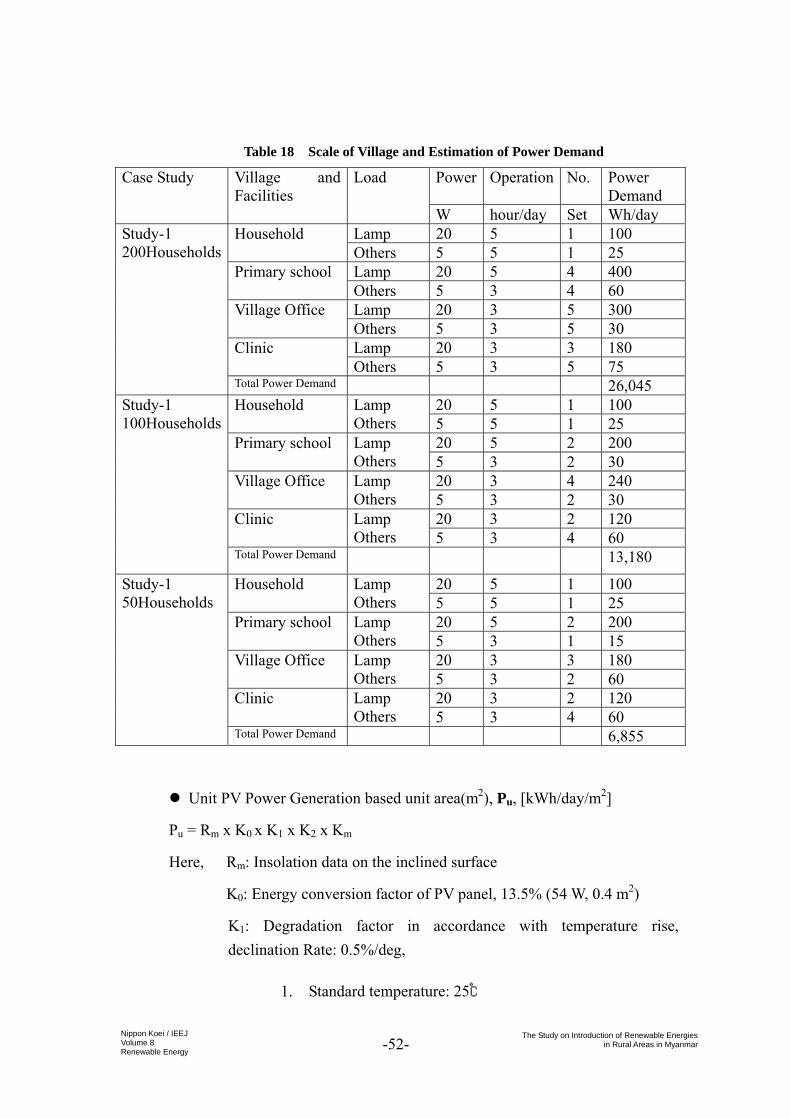
-52- Nippon Koei / IEEJ Volume 8 Renewable Energy
The Study on Introduction of Renewable Energiesin Rural Areas in Myanmar
Table 18 Scale of Village and Estimation of Power Demand
Power Operation No. Power Demand
Case Study Village and Facilities
Load
W hour/day Set Wh/day Lamp 20 5 1 100 Household Others 5 5 1 25 Lamp 20 5 4 400 Primary school Others 5 3 4 60 Lamp 20 3 5 300 Village Office Others 5 3 5 30 Lamp 20 3 3 180 Clinic Others 5 3 5 75
Study-1 200Households
Total Power Demand 26,045 20 5 1 100 Household Lamp
Others 5 5 1 25 20 5 2 200 Primary school Lamp
Others 5 3 2 30 20 3 4 240 Village Office Lamp
Others 5 3 2 30 20 3 2 120 Clinic Lamp
Others 5 3 4 60
Study-1 100Households
Total Power Demand 13,180
20 5 1 100 Household Lamp Others 5 5 1 25
20 5 2 200 Primary school Lamp Others 5 3 1 15
20 3 3 180 Village Office Lamp Others 5 3 2 60
20 3 2 120 Clinic Lamp Others 5 3 4 60
Study-1 50Households
Total Power Demand 6,855
Unit PV Power Generation based unit area(m2), Pu, [kWh/day/m2]
Pu = Rm x K0 x K1 x K2 x Km
Here, Rm: Insolation data on the inclined surface
K0: Energy conversion factor of PV panel, 13.5% (54 W, 0.4 m2)
K1: Degradation factor in accordance with temperature rise, declination Rate: 0.5%/deg,
1. Standard temperature: 25℃

-53- Nippon Koei / IEEJ Volume 8 Renewable Energy
The Study on Introduction of Renewable Energiesin Rural Areas in Myanmar
2. K1=1- 0.005 x (T-28), T = 60℃, K1 = 0.84
K2: Factor of dirt on a PV panel, 0.9
Km: Miscellaneous factors, 0.9, or to be calculated with concrete evaluation.
(2) Required PV Array Area, S [m2] S = Pq / Pu
(3) Required PV Capacity, C [kW] C = Cu x S / Su /1000
Here, Cu: Capacity a PV Panel, 54 W/set
Su: Area of a PV Panel, 0.4 m2/set
Then,
C = 54 x Pq / Pu / Su /1000
The results of sizing calculations for the sample systems are shown in Table 19 to Table 22.

-54- Nippon Koei / IEEJ Volume 8 Renewable Energy
The Study on Introduction of Renewable Energies in Rural Areas in Myanmar
Table 19 Worksheet-1: Calculation of Power Demand (1)
Worksheet 1: Daily Energy RequirementFill out this worksheet to estimate Power Demand. Date:Name: No of family menbers:
Utensils Type Power Number Voltage Daily Use Daily Energy Use When, provided Otherswatts V hours watt-hour
A B C D AXBXD1 Lamp2 Lamp3 Lamp4 Radio567
Total Appliaces No: 0 Total Power Use: 0 Wh/day(E)
2. Calculation of Battery CapacityTotal Power Use:(E)= 0 Wh/day Note for Input:Battery Voltaga: V= 12 Volt Data Input ColumnCharging Interval: 4 days Automatic CalculationCalculation=(E)XVX4/0.7): 0 AhChoose from here: 10, 20, 30, 50AhYour Battery Capacity: Ah X Cells
Note-1: In the Column"When, provided", please mark, "within one year:",1, and " In the future": F.Note-2: If nothing particular, please select appliances based on 12V, which is highly recommended, and ecnomical.

-55- Nippon Koei / IEEJ Volume 8 Renewable Energy
The Study on Introduction of Renewable Energies in Rural Areas in Myanmar
Table 20 Worksheet 2: Calculation of Power Demand (2)
Worksheet 2: Daily Energy Requirement1. CalculationPower Demand Date Name of Personel in charge:Name of Public Facilitiy:
Utensils Type Power Number Voltage Daily Use When, provided Otherswatts V hours
A B C D AXBXD1 Lamp2 Lamp3 Lamp4 Radio56789
10Total Appliaces No: 0 Total Power Use: 0 Wh/day
(E)2. Calculation of Battery Capacity
Total Power Use:(E)= 0 Wh/dayBattery Voltaga: V= 12 VoltCharging Interval: 4 daysCalculation=(E)X4/V/0.7): 0 AhChoose from here: 10, 20, 30, 50 AhYour Battery Capacity: Ah X Cells
Note-1: In the Column"When, provided", please mark, "within one year:",1, and " In the future": F.Note-2: If nothing particular, please select appliances based on 12V, which is highly recommended, and ecnomical.
Daily Energy Usewatt-hour

-56- Nippon Koei / IEEJ Volume 8 Renewable Energy
The Study on Introduction of Renewable Energies in Rural Areas in Myanmar
Table 21 Worksheet 3: Calculation of Power Demand (3)
Worksheet 3: Planning Sheet for Village Electrification
Village Name Township:Total No of Household State:Rate of ElectrificationNo. Name Power Demand Classfication of Volatage
within 1Year Future 12V 8V Others Notes and Memo for CalculationWh/day Wh/day
12345
Total for Housholds Use:
Primary SchoolVillage OfficeClinicOthers
Total for Public facilities Use:
Grand Total of Power Demand for Village 0 kWh/day
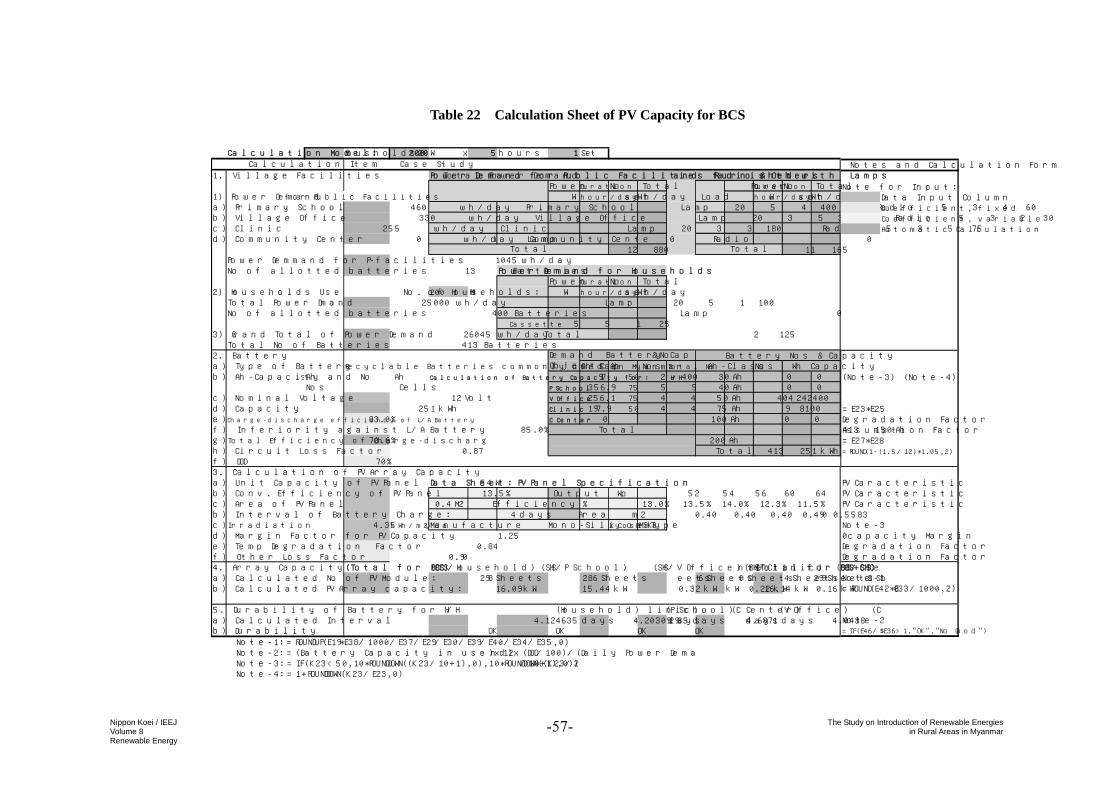
-57- Nippon Koei / IEEJ Volume 8 Renewable Energy
The Study on Introduction of Renewable Energies in Rural Areas in Myanmar
Table 22 Calculation Sheet of PV Capacity for BCS
Calculation Model: 200 Housholds 20 W x 5 hours 1 Set
1. Village Facilities Total Power Demand and Radio & OthersPower Duration No Total Power Duration No Total
1) Power Demand for Public Facilities W hour/day setWh/day W hour/day setWh/daya) Primary School 460 wh/day Primary School Lamp 20 5 4 400 Radio 5 3 4 60b) Village Office 330 wh/day Village Office Lamp 20 3 5 300 Radio 5 3 2 30c) Clinic 255 wh/day Clinic Lamp 20 3 3 180 Radio 5 3 5 75d) Community Center 0 wh/day Community Center Lamp 0 Radio 0
12 880 11 165Power Demmand for P-facilities 1045 wh/dayNo of allotted batteries 13 Batteries Power Demand for Households
Power Duration No Total2) Households Use No. of Households: 200 HH W hour/day setWh/day
Total Power Dmand 25000 wh/day Lamp 20 5 1 100No of allotted batteries 400 Batteries Lamp 0
Cassette 5 5 1 253) Grand Total of Power Demand 26045 wh/day 2 125
Total No of Batteries 413 Batteries2. Batterya) Type of Battery Recyclable Batteries commonly used in Myanmar Ah Cap.Ah Nos Total No Nos Wh Capacityb) Ah-Capacity and NosAh Ah Calculation of Battery Capacity for: H/H 97 50 2 400 30 Ah 0 0
Nos Cells P School 356.9 75 5 5 40 Ah 0 0c) Nominal Voltage 12 Volt V Office 256.1 75 4 4 50 Ah 404 242400d) Capacity 251 kWh Clinic 197.9 50 4 4 75 Ah 9 8100e) Charge-discharge efficiency of L/A Battery 83.0% C Center 0 100 Ah 0 0f) Inferiority against L/A Battery 85.0% 413 150 Ahg) Total Efficiency of Charge-discharge 70.6% 200 Ahh) Circuit Loss Factor 0.87 413 251 kWhf) DOD 70%3. Calculation of PV Array Capacitya) Unit Capacity of PV Panel 54 W Data Sheet: PV Panel Specificationb) Conv. Efficiency of PV Panel 13.5% Output Wp 52 54 56 60 64c) Area of PV Panel 0.4 M2 Efficiency % 13.0% 13.5% 14.0% 12.3% 11.5%b) Interval of Battery Charge: 4 days Area m2 0.40 0.40 0.40 0.490 0.5583c) Irradiation 4.35 kWh/m2/dayManufacture Mono-Silicon Type Kyosera MSKd) Margin Factor for PV Capacity 1.25e) Temp Degradation Factor 0.84f) Other Loss Factor 0.904. Array Capacity (Total for BCS) (BCS/Household) (SHS/P School) (SHS/V Office) (SHS/Clinic) (SHS/C Center (Total for BCS+SHS)a) Calculated No of PV Module: 298 Sheets 286 Sheets 6 Sheets 4 Sheets 3 Sheets 0 Sheets 299 Sheetsb) Calculated PV Array capacity: 16.09 kW 15.44 kW 0.32 kW 0.22 kW 0.16 kW 0 kW 16.14 kW
5. Durability of Battery for H/H (Household) (P School) (V Office) (Clinic) (C Center)a) Calculated Interval 4.124635 days 4.203092935 days 4.6871 days 4.0438 days daysb) Durability OK OK OK OK
Note-1: =ROUNDUP(E19*E38/1000/E37/E29/E30/E39/E40/E34/E35,0)Note-2: =(Battery Capacity in use)x12x(DOD/100)/(Daily Power Demand)Note-3: =IF(K23<50,10*ROUNDDOWN((K23/10+1),0),10*ROUNDDOWN((K23/2/10+1),0))Note-4: =1+ROUNDDOWN(K23/E23,0)
Total
Total
Load
TotalTotal
Battery Cap & No Battery Nos & Capacity
Calculation Item
DemandObjects Ah-Class
Case StudyPower Demand for Public Facilities furnished with Lamps
Total
Note for Input:Data Input ColumnCoefficient, fixed
Coefficient, variableAutomatic Calculation
(Note-3) (Note-4)
=E23*E25Degradation FactorAssumption Factor=E27*E28=ROUND(1-(1.5/12)*1.05,2)
PV CaracteristicPV CaracteristicPV Caracteristic
Note-30capacity MarginDegradation FactorDegradation Factor
Note-1=ROUND(E42*E33/1000,2)
Note-2=IF(E46/$E36>1,"OK","No Good")
Notes and Calculation Form

-58- Nippon Koei / IEEJ Volume 8 Renewable Energy
The Study on Introduction of Renewable Energies in Rural Areas in Myanmar
+++++ Column-2 +++++ Calculation of Insolation of an inclined surface, Rm [kWh/m2/day]
1) Insolation of an Inclined Surface and Global Horizontal Insolation:
Daily total energy received is more important than the instantaneous solar irradiance at a site. In most cases, a solar array tends to be tilted to an angle close to the geographical angle of latitude of the site in order to maximize the solar energy received. As the insolation data collected by weather stations are normally the Horizontal Global Insolation (HGI), it is necessary to convert the HGI to the Inclined-surface Insolation for making a plan of a PV system.
2) Conversion Equation:
Rm = Rhm X {cos(θl +θm –θo) / cos(θl +θm)}
Here,
Rm : Inclined-surface insolation、kWh/m2/day
Rhm: HGI、kWh/m2/day
θ l: Solar latitude at an implementation site. If it is on the southern hemisphere, each figure changes positive to negative, and negative to positive ones.
θm: Correction of solar latitude as shown in Table 23. If it is on the southern hemisphere, each figure changes from positive to negative, and from negative to positive.
θo: Set angle of PV array
3) Offsets for Solar Latitude:
Table 23 Offsets for Solar Latitude
Month 1 2 3 4 5 6 θm,deg. 21.2 12.9 2.4 –9.5 –18.7 –23.3 Month 7 8 9 10 11 12 θm,deg. –21.7 –14.3 –3.9 8.2 18.3 23.2
(Note) On the southern hemisphere, each figure has to be changed from positive to negative, and negative to positive.
4) Decision of set angle of PV array: If there exist seasonal or temporal fluctuations in the power demand, detailed calculations have to be performed so as to supply sufficient energy for the maximum power demand, and to decide an optimum design fixing the set-angle of a PV array and a PV capacity. As a general rule, an angle of

-59- Nippon Koei / IEEJ Volume 8 Renewable Energy
The Study on Introduction of Renewable Energies in Rural Areas in Myanmar
inclination of PV arrays should be synchronized with the latitude. And the minimum angle of inclination have to be fixed at 10 degree so that leaves or other subjects contaminated on the array surface could easily be removed away by rain or wind.
5) Following Table 24 is the results of calculating Rm at typical locations such as Yangon, Mandalay and so on.
Table 24 Inclined Surface Global Insolation Calculated for Typical Locations in Myanmar
6.1.2 Method of selecting Wind Turbine Power Generator for BCS System
(1) Procedure of Planning Wind Power Generation
The decision of capacity and the selection of the model of a wind power generation system, which differs from that of PV, are a little troublesome. For the wind power generation, the wind data must be obtained, while the radiation data are not always requested because of the general presence of solar radiation, 2 kWh/m2/day as a minimum value. The "wind" could never be counted on, and it blows off and on repeatedly. So often there is no wind for many days. A basic procedure of planning the wind power generation system is as follows.
Acquisition of wind data: It is no exaggeration that the success of wind power generation relies on favorable wind conditions. It requires more than 4 m/s as a monthly mean wind velocity for implementation of the power generation system with a wind turbine.
Aiming step-by-step configuration: At the stage where the wind data could not be applicable enough, it is also important to count daily experiences. Therefore, the site where the wind condition is regarded relatively good-favored is selected and a
Latitude Rhm Yearly Mean Month
(Deg) kWh/M2/d Solar Altitude Offset Jan Feb Mar Apr May Jun Jul Aug Sep Oct Nov Dec25.37 4.51 4.16 5.05 5.56 5.82 5.48 4.07 3.69 4.18 4.31 4.15 3.83 3.78
4.83 4.86 5.67 5.98 6.02 5.51 4.03 3.68 4.26 4.54 4.57 4.41 4.4722.93 4.85 4.45 5.71 6.07 6.07 5.71 4.91 4.34 4.29 4.52 4.23 4.00 3.84
5.14 5.13 6.34 6.48 6.23 5.70 4.83 4.29 4.34 4.72 4.61 4.55 4.4821.97 5.05 4.50 5.65 6.06 6.33 5.97 5.45 4.88 4.64 4.70 4.34 4.07 3.99
5.33 5.16 6.25 6.44 6.48 5.94 5.35 4.81 4.68 4.89 4.71 4.61 4.6320.87 5.11 4.55 5.64 6.25 6.64 5.98 4.97 4.84 4.79 4.79 4.55 4.21 4.05
5.37 5.19 6.21 6.62 6.77 5.93 4.86 4.75 4.81 4.97 4.92 4.74 4.6716.77 4.69 4.92 5.77 6.04 6.40 4.92 3.70 3.41 3.50 4.05 4.63 4.52 4.47
4.90 5.51 6.25 6.31 6.44 4.82 3.57 3.31 3.47 4.15 4.93 5.00 5.0514.08 4.84 5.06 5.82 6.00 6.29 4.85 4.68 3.42 3.33 4.04 4.86 4.94 4.84
5.01 5.60 6.25 6.22 6.28 4.71 4.48 3.29 3.28 4.10 5.13 5.41 5.41
Preconditions for Calculation of Rm
a) Solar altitude Offset 21.2 12.9 2.4 -9.5 -18.7 -23.3 -21.7 -14.3 -3.9 8.2 18.3 23.2b) Inclination of setting PV Panels: 10 deg
Upper Colum: Rmh and Lower Colum: RmName ofLocation
Myitkyna
Lashio
Mandalay
Meikhtila
Kaba Aye
Dawai

-60- Nippon Koei / IEEJ Volume 8 Renewable Energy
The Study on Introduction of Renewable Energies in Rural Areas in Myanmar
test plant is to be implemented so that the wind data may be collected for about a year or so. The collected data would be of a great help to consider its possibility and to decide its capacity.
Selection of wind power generation model: A small wind turbine of the ratings about 2-5 kW would be recommended as a test machine without exception. Upon selection of a machine, it is necessary to be taken into consideration about the model accompanied with detailed characteristics such as the relation between the power output and the monthly mean wind velocity.
Electricity use: The generated power is mostly supplied to the BCS, where recyclable batteries are charged and used in an ordinary village.
(2) Calculation
Prerequisite for calculation: The village composition and the load condition are the same conditions as the PV-BCS. (Refer to Chapter 6.1.1)
Wisper3000 (Iwanaka Electric Machine Factory, Sgamihara, Japan) is shown as an example of wind turbine generators. In this example, related data of each model such as the relationship between monthly mean wind velocity and power generation for every machine type is shown in Table 25.
Table 25 Examples of Estimated Power Output from Small Wind Turbine
(3) Calculation Method
Required Power Generation, Pq [kWh/day]
Pq = M x Pd /( K3 x K4 x K5)
Here, Pd: Power Demand, [kWh/day]
M: Margin factor for the future miss-much, 1.25
K3: Battery charge-discharge efficiency for recycling battery, 0.83, and here 0.85 to be taken into calculation as an inferiority factor by using recyclable batteries
(Unit: kWh/Month)
2.7m/s 3.1m/s 3.6m/s 4.0m/s 4.5m/s 4.9m/s 5.4m/s 5.8m/s 6.3m/s 6.7m/s 7.2m/s1. 11 20 32 47 63 82 102 122 143 164 1832. 11 20 32 47 65 86 109 134 160 187 2143. 19 34 54 78 105 136 156 204 238 273 3054. 18 34 54 79 108 143 181 223 265 312 3575. 56 102 162 233 316 408 507 611 715 818 9166. 54 100 161 236 325 428 543 668 800 936 1070
Data Source: Iwanaka Denki Seisakusyo, Sagamihara city, Japan
Whisper 3000Whisper H4500
Whisper 600Whisper H900Whisper 1000
Whisper H1500
NoType of Wind Turbine Monthly Mean Wind Velocity

-61- Nippon Koei / IEEJ Volume 8 Renewable Energy
The Study on Introduction of Renewable Energies in Rural Areas in Myanmar
K4: Energy transmission efficiency on DC including controllers,
(1 - loss factor)=0.87
K5: Efficiency of controller, here included in K4
Decision of sizing the wind power generator and its numbers
To choose a W-TG (Wind turbine generator), whose rated capacity is bigger than 2 kW.
To calculate numbers of W-TG for every month by using:
N = Pd x Dm/Ot
Where, N: Numbers of W-TG, [sets]
Pd: Power demand, [kWh/day]
Dm: days/month, (31, 30 or 28)
Ot: Mean, monthly, minimum power output of W-TG
To chose the Maximum numbers of Wind Turbine Generators
(4) Results of Sizing Calculations for the Sample Systems
The results of the sizing calculation for the sample systems are shown in Table 26.

-62- Nippon Koei / IEEJ Volume 8 Renewable Energy
The Study on Introduction of Renewable Energies in Rural Areas in Myanmar
Table 26 Calculation of Wind Power Generator for BCS
Calculattion Model: 50 Househol 20W X 5hours X 1Set
1. Village Facilities Power, W Hour No. Wh/day Power, W Hour No. Wh/day Power, W Hour No. Wh/day Power, W
Lamp 20 5 1 100 Lamp 20 5 2 200 Lamp 20 3 3 180 Lamp 201) Primary School 3 0 0 0 02) Village Office Radio 5 5 1 25 Radio 5 3 1 15 Radio 5 3 2 30 Radio 53) Clinic Others 0 Others 0 Others 0 Others
Total * * 2 125 Total * * 3 215 Total * * 5 210 Total *4) No. of Household 505) Net Power Demmand for Public Facilities 6855 Wh/day2. Batterya) Type of Battery Recyclable Batteries commonly used in Myanmar
b) Ah-Capacity and Nos Ah 20 Ah 30 30 30c) Nos 5 Cells Note-1 8 7 6d) Nominal Voltage 12 Volt 12 Volt 12 Volt 12 Volte) Battery Bank Capacityfor Each 240 Wh 5 Cells 1200 360 Wh X 8 Cells 2880 360 Wh X 7 Cells 2520 360 Wh Xf) Charge-discharge efficiency of L/A Battery 83%g) Inferiority against L/A Battery 85%h) Total Efficiency of Charge-discharge 71%i) Circuit Loss Factor 0.87j) Interval of Battery Charge: 4 daysk) DOD 70%d) Margin Factor for PV Capacity 1.25l) Calculated Capacity of Battery 6647.9 Ah3. BCS Specificationa)5. Durability of Batterya) Calculated Interval 4.12464 days Note-2b) Durability OK6. Total PV Capacity Battery Sizinga) No. of Household 50 H/H 180 Ah 279.297 50 Ah 77.5826b) Total Batteries used in theVillage 271 Sets 100 Ah 155.165 30 Ah 46.5496c) Present Net Power Demand 1330 Ah/day Note-3 0 25 Ah 38.7913d) Grand Total Wind Capacity as a village 20.0 kWh/day Note-4 0 15 Ah 23.2748
Note-1: =ROUNDUP(I9*E22/E16/E20/E21/E23/E14,0)Note-2: =(Battery Capacity in use)x12x(DOD/100)/(Daily Power Demand)Note-3: =ROUNDUP(E11*E24/E16/E20/E21/E23,0)Note-4 =ROUNDUP(E11*E24/E20/E21/E23,0)
Table Wind Power Generator
1) Type of Wind PG Whisper 3000 (IWANAKA, Japan)2) Monthly Mean W.V. 2.7m/s 3.1m/s 3.6m/s 4.0m/s 4.5m/s 4.9m/s 5.4m/s 5.8m/s 6.3m/s 6.7m/s 7.2m/s3) Monthly Power Output kWh/Month 56 102 162 233 316 408 507 611 715 818 916
4. Calculation of Wind PGSa) Calculated Power Demand 600 kWh/Monthb) Calc of W/T PG 10.7 5.9 3.7 2.6 1.9 1.5 1.2 1 0.8 0.7 0.7c) Nos of W/T PG Set 11 6 4 3 2 2 2 1 1 1 1
Monthly Mean Wind Velocity 2.7m/s 3.1m/s 3.6m/s 4.0m/s 4.5m/s 4.9m/s 5.4m/s 5.8m/s 6.3m/s 6.7m/s 7.2m/s1 Sets
2 Sets3Sets 3Sets
4Sets
6Sets6Sets
9Sets
11Sets12Sets
Calculation Item FFor Households For Primary School For Village OfficePower, W Hour No. Wh/day
Lamp 20 3 2 1200
Radio 5 3 4 60Others 0Total * * 6 180
306
12 Volt360 Wh X 6 Cells 2160
For Clinic

-63- The Study on Introduction of Renewable Energies
in Rural Areas in MyanmarNippon Koei / IEEJ Volume 8 Renewable Energy
6.2 Environmental Impact Assessment
It could be said, as often referred, that the current BCS+BRS system in Myanmar has been established as one of the social systems so far in the market. This system has an outstanding merit that it delivers electric power that can be installed in the worst conditions for power generation to as many consumers as possible. Nevertheless, it is true that in the current system there would be some points for an efficient distribution of the generated power.
6.2.1 Issues
(1) Shortening of Battery Life by Over-charge and Over-discharge
Overcharge operation in battery-charge: Batteries are likely not to be charged with charge controllers but to be judged the completion of charge by a sense of the temperature on batteries with touching hand, among which there existed very hot batteries almost untouchable. Almost all batteries are considered to be over-charged. In the hearing at around thirty sites of the reconnaissance, no BCSs are equipped with battery-charge controllers.
Over-discharge operation in using: Every time, the batteries are usually discharged to the bottom until no power would come out.
Deterioration of battery quality due to using tube well water to refill: Almost all consumers are to refill river or tube well water into their batteries instead of qualified refilling water. The tube well water seems to be inadequate for refilling because frequently it contains colloid materials. In some places, even seawater is filled into the batteries.
(2) Water Treatment Method for Waste Battery Electrolyte from BRS
Though a present BRS system has a profile of small effect on environment that most materials are to be recycled, major part of electrolytes are abandoned to the surrounding.
It turned out through the reconnaissance that the waste battery electrolyte is abandoned onto soil or into rivers, but only small portion is used to clean a lavatory.
6.2.2 Countermeasures
In a sense, it is a fact there are favorable aspects that no other countries have in the BCS system in Myanmar might. That is, there are a lot of developing countries that directly dispose used batteries any treatment. On the contrary, Myanmar has an outstanding point that almost all materials are recycled in the BRS system. To make this merit more effective is important for its sustainability.

-64- The Study on Introduction of Renewable Energies
in Rural Areas in MyanmarNippon Koei / IEEJ Volume 8 Renewable Energy
(1) Elongation of battery life
Major ways to expand battery life are to avoid triggers for shorten the battery life such as over-charge and over-discharge, to keep its water level constant to avoid exposure of battery-electrodes to the air, and to refill pure water into the battery when the water level reaches the lower permissible zone. The followings are the major maintenance requested for the battery.
Measures against over-discharge: "electrical discharge" in the BCS happens while the battery is used at each home. Batteries are likely to be used in a wrong way without discharge controller at the consumer side, which have to be avoided definitely. It is necessary to let the consumers understand that the usage of the battery without discharge-controller is not pay to consumers themselves.
Measures against overcharge: Because of an issue limited on the BCS side, the function to avoid overcharge should be essentially provided in the introduced facilities. There are many methods to charge batteries without overcharge. In brief, never connect batteries in series, but in parallel. It is suggested to overcharge intentionally about 4 times of a year regularly. By this, battery plates will be refreshed that gives them some possibilities to extend their life.
Treatment of battery electrolyte: Electrolyte is the solution of sulfuric acid. The treatment has to be taken care because it shows a strong acidity. Therefore, it is necessary to process neutralization for its disposal, though it could be used to clean lavatories. Trials have to be done to find out simple ways to treat it by using surrounding materials such as alkali soil or lime. This can to be handed to researchers at universities or institutes in Myanmar.
Acquisition of purified water: The purified water is used to fill up water to batteries, and is relatively expensive in daily life. It is possible to have so-called distilled water with a tiny combination unit of soil, sunshine, and solar-power fans. The easiest way is to apply rainfall water, if it is a remote area that have no air pollution. in the mountainous area. Battery supplement water should be checked if it is applicable through analysis of the collected water upon introduction of a BCS. For large scale factory of water refine, ion exchange resin by the combined system of soil and active carbon may do for it.

-65- The Study on Introduction of Renewable Energies
in Rural Areas in MyanmarNippon Koei / IEEJ Volume 8 Renewable Energy
CHAPTER 7 PROPOSED RE PROJECTS WITH SOLAR/WIND BCS
As stated so far, the existence of many kinds of PV systems was confirmed through the reconnaissance, and some of which were strongly requested for prompt introduction of a PV or a wind system by residents at the time of interviewing. Though all of them are not always applicable to PV or Wind power generation systems, the requested projects are shown in Table 27.
Two proposals, project sheet SW-01 and project sheet SH-02 was formulated (See Volume 5 Appendix-A) and extended by REAM by selecting most possible projects from the list shown in Table 27.

-66- The Study on Introduction of Renewable Energies
in Rural Areas in MyanmarNippon Koei / IEEJ Volume 8 Renewable Energy
Table 27 PV and Wind Power Generation Systems Requested Through
Reconnaissance
RE Source Grid1 Kachin1a Putao Dote-tan/Putao 304 1808 School/AV Room PV+Grid O 23kWh/d1b Machanbaw Kaungmu-lon 262 1572 BCS PV+W X 18kWh/d with data log system
Taran-dum 150 600 BCS PV X 9kWh/d with data log system2 Sagaing2a Ayar- taw Ingyin- kan 102 615 BCS PV X 5.4kWh/d with data log system2b Myaung Pwa-saw 320 1728 Domastic water PV X 7.2kWh/d with data log system2c Sagaing Yone-pin-kan 155 467 BCS PV X 5.4kWh/d with data log system2d Kyaukse 406 3490 BCS W X 10kWh/d with data log system3 Yangon3a Thanlyin Kayinseik 215 1075 BCS PV X 9kWh/d with data log system3b Hlegu Ohne-gone 135 617 BCS PV X 5.4kWh/d with data log system4 Mandalay4a Kyaukse Kya-o-gyi 98 578 BCS PV X 5.4kWh/d with data log system4b Nyaung-U Thitaung 350 1620 BCS PV X 9kWh/d with data log system4c Myae-ne-lay 140 760 BCS W X 10kWh/d with data log system4d Ma Hling Yae-htwet 270 1600 BCS PV X 7.5kWh/d4e Ma-gyi-kone 80 454 BCS PV X 5.4kWh/d4f Thone-taung 336 1830 BCS PV+W X 15kWh/d with data log system4g Kyaukpadaung Than-pin 101 670 BCS PV X 9kWh/d4h Sin-zin 178 1068 BCS W X 10kWh/d with data log system5 Magway5a Pokoku Pokoku Child hospital PV+Grid O 36kWh/d5b Yasakyo Pakangyi BCS PV+W X 9kWh/d5c Yasakyo Pakangyi Community center PV+W X 18kWh/d with data log system5d Kine-ma-gyi 556 3330 BCS W X 10kWh/d with data log system5e Ahlae-thaung 622 3725 BCS W X 10kWh/d with data log system5f Thar-si 512 4554 BCS W X 10kWh/d with data log system5g Magwe Tegyi-gone 121 1232 BCS PV X 5.4kWh/d with data log system5h Ywarthit-kyi 385 1995 BCS PV X 9kWh/d5i Salin Myaukchaung-pyu 160 1012 BCS PV X 7.5kWh/d5j Min Bu Kone-thar 178 1210 BCS W X 10kWh/d with data log system6 Rakine6a Thandwe Maungshwe-lay 360 1620 BCS PV+W X 15kWh/d with data log system6b Taung-goke Nuaung-tang 860 3825 BCS PV+Grid O 18kWh/d6c Yathaetaung Kanyin-chaung 125 588 BCS W X 10kWh/d with data log system7 Ayeyawady7a Ngaputaw Zegaing 680 4080 BCS PV+W X 18kWh/d with data log system7b Bogalay Kadone 1200 6250 BCS PV+W X 36kWh/d with data log system
8 Chin8a Tunzun Hane-zan 187 1112 BCS PV+W X 15kWh/d with data log system
8b Han-kin 13 72 BCS PV X 2kWh/d8c Mwar-pee 185 1075 BCS PV X 7.5kWh/d8d Twee-mwe 150 850 BCS PV X 7.5kWh/d with data log system8e Sel-bone 90 630 BCS PV X 5.4kWh/d8f Lane-htoke 30 400 BCS PV X 3.5kWh/d8g Hi-kyin 240 1488 BCS PV+W X 15kWh/d with data log system
8h Zam-pee 108 837 BCS PV X 5.4kWh/d8i Darl-khine 105 260 BCS PV X 5.4kWh/d8j Kyar-o-lin 34 190 BCS PV X 3.5kWh/d
8k Kan-saung 80 528 BCS PV X 5.4kWh/d8k Tetain Saung-zan 170 1380 BCS W X 10kWh/d with data log system
Bago9a Kawa Welpa-tan 430 2900 BCS PV+W X 15kWh/d with data log system
Mon10a Chaung-sone Ywar-lut 720 4250 BCS PV+W X 19kWh/d with data log system
No State Township Village Name Capacity OthersPower Source
Households Population Usage

THE STUDY ON INTRODUCTION OF RENEWABLE ENERGIES
IN RURAL AREAS IN MYANMAR
FINAL REPORT
Volume 8 Supporting Report
Renewable Energy
Part 8-1 Biomass Power
Part 8-2 Solar and Wind Power
Part 8-3 Inspection Memos

THE STUDY ON INTRODUCTION OF RENEWABLE ENERGIES IN RURAL AREAS IN MYANMAR
Final Report
Vol. 8 Supporting Report: Renewable Energy
Part 8-3 Inspection Memos
TABLE OF CONTENTS
Inspection Memo 1 Monitoring of Zi Chaung Hydropower Station............................................................ 1 1.1 Findings of the Monitoring .................................................................................................... 1 1.2 Monitoring Data................................................................................................................... 12
1.2.1 Energy Output ........................................................................................................... 12 1.2.2 Financial Condition................................................................................................... 13 1.2.3 Diesel Generation in Kalaymyo Township ............................................................... 14 1.2.4 Zi Chaung Accident Record ...................................................................................... 15
Inspection Memo 2 Inspection of Nam Khan Kha Small Hydropower Station in Moe Gaung, Kachin.... 18 2.1 Township Information.......................................................................................................... 18 2.2 General Information of Nam Khan Kha Power Station ....................................................... 18 2.3 Particular Information of Nam Khan Kha Power Station .................................................... 22 2.4 Issues ................................................................................................................................... 24
Inspection Memo 3 Inspection of Hopin Small Hydropower Station in Hopin, Kachin ........................... 25 3.1 Township Information.......................................................................................................... 25 3.2 General Information of Hopin Power Station ...................................................................... 25 3.3 Particular Information of Hopin Power Station ................................................................... 31 3.4 Issues ................................................................................................................................... 32 3.5 Plates of Equipment ............................................................................................................. 33
Inspection Memo 4 Inspection of Zi Chaung Power Station during De-Watering .................................. 35 4.1 Topographic Mapping of Intake Area .................................................................................. 35 4.2 Lecture on Topographic Survey........................................................................................... 35 4.3 Discharge Measurement Along Headrace Channel.............................................................. 36 4.4 Inspection of Headrace Channel .......................................................................................... 36 4.5 Sand Flushing Tests ............................................................................................................. 44
4.5.1 Testing of Flute Type Flushing Head (stationary, to be fixed to floor) ..................... 44 4.5.2 Testing of Saxophone Type Flushing Head (movable, to be operated from on raft). 46
Inspection Memo 5 Memo on Interviews/Field Surveys in Villages for Rural Electrification..................50

- 1 - Nippon Koei / IEEJ Volume 8 Renewable Energy
The Study on Introduction of Renewable Energiesin Rural Areas in MYANMAR
Protection work of intake by gabion
Inspection Memo 1 Monitoring of Zi Chaung Hydropower Station
1.1 Findings of the Monitoring
No. Issues Possible Countermeasures
1. Intake Complex
Forebay of Intake Dam has been filled with sediment up to the dam crest level. The sediment mainly consists of pebble stone and sand with less silt. Some of these sediments intruded into Headrace Channel as seen in the riverside chammber of the Desander attached to the Regulating Pond.
To provide protection work upstream of the Intake to guide the sediment flow around the intake toward the dam overflow crest.
2. The river flow is rushing into the Intake with forming a critical depth at the inlet, therefore, the sedimentation level in front of the Intake is relatively low due to scouring by high velocity flow there and carrying the sediments into the Headrace Channel.
Flow

- 2 - Nippon Koei / IEEJ Volume 8 Renewable Energy
The Study on Introduction of Renewable Energiesin Rural Areas in MYANMAR
Flow at intake gate, trees clogged in the opening on the right side
Intake gates viewed from upstream
3. The right hand part of the Intake Trashracks was washed off by the high velocity flow with drift woods and the water pressure caused by leaves trapped and adhered to the Trashracks. The structural strength of fixing the Trashracks to the concrete support may not have been sufficient.
To provide a skimmer wall with the inlet opening below the water surface to protect the Trashracks and the Gate from attack of flowing debris during a flood.
Skimmer wall at inlet

- 3 - Nippon Koei / IEEJ Volume 8 Renewable Energy
The Study on Introduction of Renewable Energiesin Rural Areas in MYANMAR
It was recorded in the Operation Log Book of the Zi Chaung Power Station that the power generation was stopped from 23:00 on 19.9.2002 to 08:00 on 20.9.2002 and from 12:00 on 20.9.2002 to 20:00 on 20.9.2002 due to clogging of rocks and sediments at the Intake Gates of the Intake Weir.
The trashrack above might have been washed down at this occasion. This need another detailed hearing to the operators.
To repair and re-install the Trashracks as illustrated below:
4. Intake Gates are being clogged partially with flowing debris because a part of the Trashracks has been damaged and removed. As shown on the pictures, the partial removal of the Trashracks is causing the turbulence of the flow around the Intake and accelerating the flow velocity. The higher velocity flow would carry more sediments into the Intake and Headrace Channel.
The countermeasures above will apply.
5. The Side Spillway is provided downstream of the Intake Gates to overflow excess water from the Channel back to the river. But it can’t function properly because the velocity in the Channel is too high and turbulent.
To carry out the hydraulic analysis for the flow characteristics of the waterway to clarify the water surface profile, overflow from the Side Spillways, sand flushing, sedimentation, and water hammer in penstock based on the completion drawings.
To provide a properly designed concrete sill on the channel floor at the downstream section of the Side Spillway so as to create a more stable flow
Trashracks to be repaired

- 4 - Nippon Koei / IEEJ Volume 8 Renewable Energy
The Study on Introduction of Renewable Energiesin Rural Areas in MYANMAR
It is likely that the above flow conditions are caused mainly by a significant drop in the head from Intake to Side Spillway, which energy are being dissipated as turbulent flow above.
conditions with low velocity, and to take only the design discharge into the downstream Headrace Channel without excessive flow, sediments and debris. Heightening of the Channel walls would be required at the Side Spillway section and nearby. To check the water surface profile, it is required to make leveling survey of the top of side walls and to measure the water depth and height of side walls at the same leveling points.
6. Open Channel
The flow in the channel is of sub-critical state, but the velocity is relatively high, probably more than 2 m/s, because of steep channel slope.
To carry out leveling survey of the Channel for confirmation of the water surface profile, discharge capacity, and necessary heightening works of the side walls around the excess water spillway in particular.
7. Debris from slope failure on the mountain side of the Headrace Channel and leaves are likely to enter the Channel where no cover is provided.
To periodically inspect the Waterway System from the Intake down to Power House to find any sign of slope failure.
To execute slope protection works if found necessary after the inspection.
To provide cover to the open channel section where judged required.
To periodically clean inside the Channel and cut grass along the Channel.
Skimmer Wall Trashracks
Concrete Sill

- 5 - Nippon Koei / IEEJ Volume 8 Renewable Energy
The Study on Introduction of Renewable Energiesin Rural Areas in MYANMAR
8. Desander
The riverside chamber, in particular, of the Desander at the entrance to Regulating Pond was heavily deposited with sediment of particle size up to about 2 cm.
Sedimentation in the river side chamber.
Sediment particles.
To periodically flush sediment of the Desander based on the findings of Periodical Waterway Inspection.
To prepare a maintenance manual for sand-flushing based on the sediment characteristics and flushing flow capacity.
To study and test on the applicability of Siphon to sand-flushing without stopping power generation.

- 6 - Nippon Koei / IEEJ Volume 8 Renewable Energy
The Study on Introduction of Renewable Energiesin Rural Areas in MYANMAR
Little flow in the river side chamber
9. Regulating Pond
The present layout of Approach Channel to Penstock is likely to carry sediments, passing through the Desander without depositing there, directly to the inlet of the Penstock pipe.
Significant sedimentation of sand and silt was observed in the Regulating Pond, suggesting some of the sediments have been discharged through turbine.
The sand-flushing above of the Desander will reduce the sediment transport to the Regulating Pond.
To remove the sediment deposited in the Regulating Pond.
To prepare a maintenance manual for such removal works.
10. Drain valve of the Regulating Pond cannot be operated and sediments have to be removed manually.
To study and test on the applicability of Siphon to sand-flushing without stopping power generation and without emptying the Regulating Pond.
11. Water level gauge needs to be installed for facilitating the peak-power generation during a dry season utilizing the capacity of the Regulating Pond as designed. The peak power generation will reinforce
To install a water level gauge.
To monitor and record the water level of the Regulating Pond daily.

- 7 - Nippon Koei / IEEJ Volume 8 Renewable Energy
The Study on Introduction of Renewable Energiesin Rural Areas in MYANMAR
the power output of Zi Chaung in the dry season.
12. Zi Chaung Power Station has been shut down for 124 times and 545 hours in the past one year (Dec. 2001-Nov. 2002).
During the past one year, Unit 2 governor caused shutdown for 39 times and 199 hours. The 11 kV line incidents took place for 38 times and 147 hours. Lowering in the water level of Regulating Pond also caused station shutdown. Such station shutdown occurred not only in the dry season but also in the rainy season. It was reported due to clogging of rocks and sediments at the Intake Gate.
Comprehensive review and countermeasures are required to substantially improve the operating conditions. Among these would be:
To provide sediment-guide walls, skimmer walls, trashracks, and sill in the Channel as discussed in Item Nos. 1, 3, and 5 above.
To rehabilitate generating equipment including governors
To inspect the 11 kV lines and cut down tree branches below the lines and grass around guy-wires.
13. Most of the meters in the power station did not show correct value but presented conflicting figure to each other, e.g., kW meters and kWh meters for Units 1 and 2 do not match with meters for total.
To calibrate, adjust, or replace meters.

- 8 - Nippon Koei / IEEJ Volume 8 Renewable Energy
The Study on Introduction of Renewable Energiesin Rural Areas in MYANMAR
14. Governors need repairing and adjustment.
Crosshead broken and tentatively managed with wire
Load limiter set at 35% of guidevane opening
To replace with spare crosshead.
15. Casing have been heavily rusted and there are many points of water leakage from the guidevane seats.
To check thickness of the casing plate, and replace the casing if judged necessary.
To close the holes with bolts if applicable.
The leakage from above the gate-ring arm is temporarily closed with wood. In case of loosing off of the closing wood, the jet of water leakage would directly affect the generator. The urgent and substantial repairing is needed.
The leakage from the two guidevane seats at the lower part were discharging significant water. The urgent repairing is essentially required.

- 10 - Nippon Koei / IEEJ Volume 8 Renewable Energy
The Study on Introduction of Renewable Energiesin Rural Areas in MYANMAR
failure on one side would affect the operation of the other side.
(4) Operators are not well trained to keep the generators in good conditions and need intensive capacity building and training.
18. Each diesel generator incurs technical issues as represented below:
Skoda 608: Governor is out of order. Manufactured and installed in 1986.
Skoda 860: Manufactured in 1981 and installed in Kalaymyo in 1992 by shifting from the other place. Four bearing seats out of seven got cracked and need repairing. These cracks suggest Skoda 860 is at the time of replacement.
Caterpillar 320: Manufactured in 1995 and installed in 1996. Engine and turbo-charger got overheated and radiator need direct application of cooling water also from outside.

- 11 - Nippon Koei / IEEJ Volume 8 Renewable Energy
The Study on Introduction of Renewable Energiesin Rural Areas in MYANMAR
19. In the last one year from Dec. 2002 to Nov. 2002, a total of 4,140 MWh was generated. Of the total Zi Chaung hydro generated 3,740 MWh or 90 % while three diesel generators 400 MWh or 10 %. The plant factor of Zi Chaung hydro was 0.34 or 430 kW in the average power output.
During the same period, a total energy of 3,590 MWh was sold and Kyat 11.5 million was received. The distribution losses amounted to 550 MWh or 13.3 %. The unit revenue was K3.21/kWh.
The annual expense was Kyat 15.7 million, that exceeded the annual revenue above by Kyat 4.2 million. The unit production cost was K4.37 per kWh sold.
Of the annual expense, diesel fuel (37,200 gallon) amounted to Kyat 9.8 million or 62 %. The unit fuel cost of diesel generators was Kyat 24.5, which was 7.6 times the average unit revenue. If the market price of HSD at Kyat 2,000/gallon is applied, the unit fuel cost of the diesel generators would be about Kyat 200/kWh.
To maximize the generation output of Zi Chaung through minimizing the station shutdown. Also the spill out from the waterway and Regulating Pond should be minimized by supplying to a wider area in Kalaymyo city if parallel operation of diesel generators is realized.
Even before depreciation costs of the generators of both hydro and diesel, the unit production cost at Kyat K4.37/kWh was higher than the unit revenue at K3.21/kWh. The power tariff needs thorough review and revision.

- 12 - Nippon Koei / IEEJ Volume 8 Renewable Energy
The Study on Introduction of Renewable Energiesin Rural Areas in MYANMAR
1.2 Monitoring Data
1.2.1 Energy Output
Average energy output per day is shown below. Hours of accidental power cut were excluded to calculate the average value to see the actual output. The energy output becomes low from March to June, when the river flow recedes and only turbine Unit 2 is operated.
Monthly energy output from 1996 to 2002 is shown in the table below. The seasonal fluctuation may be due to the low river flow in the dry season. Also shutdown of generating equipment affected the energy outputs.
Figure Average Daily Energy Output in Zi Chaung
02000400060008000
10000120001400016000
Dec-
01Ja
n-02
Feb-
02M
ar-0
2Ap
r-02
May
-02
Jun-
02Ju
l-02
Aug-
02Se
p-02
Oct-0
2No
v-02
kWh
1996 1997 1998 1999 2000 2001 2002January 361,020 523,050 482,460 461,387 609,307 394,780 February 427,680 404,217 244,695 393,277 506,002 384,870 March 281,584 279,015 240,933 309,540 368,750 333,070 April 231,231 282,975 232,650 262,350 491,571 303,350 May 232,115 226,050 276,245 219,450 338,400 192,768 June 269,115 334,950 379,945 254,400 228,000 224,345 July 440,335 480,456 480,480 260,400 379,730 280,431 August 150,000 456,274 516,450 510,000 324,120 389,225 319,679 September 192,000 459,360 455,812 528,000 409,365 418,700 307,320 October 50,866 371,810 526,680 557,535 478,995 371,910 253,370 November 105,391 425,700 501,600 534,435 460,350 363,611 323,465 December 284,497 468,600 507,754 494,505 528,660 419,100 TOTAL 782,754 4,424,824 5,039,009 4,961,883 4,362,294 4,884,306 3,317,448 Month Ave. 156,551 368,735 419,917 413,490 363,525 407,026 301,586
Monthly Energy Generated at Zi Chaung Hydro-Electric Power (1996-2002)(unit : kWh)
YearMonth

- 13 - Nippon Koei / IEEJ Volume 8 Renewable Energy
The Study on Introduction of Renewable Energiesin Rural Areas in MYANMAR
Monthly peak power is shown below:
1.2.2 Financial Condition
Zi Chaung expense in each month and revenue are shown in the table below.
No. Date Peak Power (kW) 1 Nov, 2001 810 kW (21:00hrs, 1.11.01 Thursday)2 December, 2001 800 kW (07:00hrs, 22.12.01, Saturday)3 January, 2002 800 kW (07:00hrs, 7.1.02, Monday)4 February, 2002 820 kW (19:00hrs, 4.2.02, Monday)5 March, 2002 720 kW (19:00hrs, 6.3.02, Wednesday)6 April, 2002 500 kW (09:00hrs, 27.4.02, Saturday)7 May, 2002 500 kW (09:00hrs, 14.5.02, Tuesday)8 June, 2002 780 kW (21:00hrs, 26.6.02, Wednesday)9 July, 2002 890 kW (20:00hrs, 28.7.02, Sunday)
10 August, 2002 900 kW (20:00hr, 7.8.02, Wednesday)11 September, 2002 820 kW (19:00 hr,7.9.02, Saturday)12 October, 2002 900 kW ( 19:00 Hr,19.10.02, Saturday)13 November, 2002 850 kW (20:00 Hr, 9.11.02, Saturday)
NOTE: Reading on kw meter for line 2
Monthly Peak PowerFrom November 2001 To November 2002
Employee HSD Repairing Cost Total(Kyats) (Kyats) (Kyats) (Kyats)
1 December, 01 237,506 925,775 - 1,163,281
2 January, 02 239,464 852,975 - 1,092,439
3 February, 02 227,376 852,975 - 1,080,351
4 March, 02 246,602 852,975 1,900,091 2,999,668
5 April, 02 236,216 854,575 - 1,090,791
6 May, 02 238,420 854,575 1,151,290 2,244,285
7 June, 02 246,540 854,575 - 1,101,115
8 July, 02 222,501 854,575 - 1,077,076
9 August, 02 226,115 854,575 - 1,080,690
10 September, 02 235,410 676,425 105,091 1,016,926
11 October, 02 221,926 676,425 - 898,351
12 November, 02 218,720 672,070 - 890,790 TOTAL 3,035,509 9,782,495 3,156,472 15,735,763
NOTE: HSD means High Speed Diesel Oil
No. Month
Monthly Expense (from Dec. 2001 to Nov. 2002)

- 14 - Nippon Koei / IEEJ Volume 8 Renewable Energy
The Study on Introduction of Renewable Energiesin Rural Areas in MYANMAR
1.2.3 Diesel Generation in Kalaymyo Township
Below shows energy output from diesel generator and fuel consumption which effects large portion of financial condition.
Nos. of Energy Sold Revenue Unit RevenueConsumer (kWh) (Kyat) (Kyat/kWh)
1 December, 01 1,972 403,180 1,003,243 2.49
2 January, 02 1,982 378,422 1,075,423 2.84
3 February, 02 1,964 356,092 1,015,466 2.85
4 March, 02 1,962 319,105 761,531 2.39
5 April, 02 1,992 283,666 648,545 2.29
6 May, 02 1,997 186,837 693,523 3.71
7 June, 02 2,005 221,184 815,850 3.69
8 July, 02 2,035 273,263 1,093,750 4.00
9 August, 02 2,004 302,071 1,122,096 3.71
10 September, 02 1,013 298,380 1,069,544 3.58
11 October, 02 2,044 256,632 1,069,315 4.17
12 November, 02 2,066 312,903 1,174,277 3.752,066 3.21
Energy Sold and Operating Revenue
TOTAL 3,591,735 11,542,563
No. Month
EnergyOutput(kWh)
Diesel(gallon)
kWh/gallon
EnergyOutput(kWh)
Diesel(gallon)
kWh/gallon
EnergyOutput(kWh)
Diesel(gallon)
kWh/gallon
Dec-01 22,860 2,181 10.481 21,580 1,707 12.642
Jan-02 24,040 2,313 10.393 17,068 1,377 12.395
Feb-02 26,840 2,634 10.190 - - -
Mar-02 28,760 2,913 9.873 6,166 523 11.790
Apr-02 22,520 2,270 9.921 - - -
May-02 20,040 2,030 9.872 - - -
Jun-02 13,240 1,389 9.532 15,907 1,402 11.346
Jul-02 10,260 1,111 9.235 22,846 1,929 11.843
Aug-02 60 87 0.690 - - - 27,259 2,131 12.792
Sep-02 12,300 1,465 8.396 - - - 23,910 1,928 12.401
Oct-02 23,040 2,110 10.919 - - - 21,614 1,811 11.935
Nov-02 - - 20,680 2,319 8.918 19,169 1,619 11.840
Source: U Kyee Nyo, MEPE Kalaymyo
14,427 (10.898)
Energy Output and Fuel Consumption of Diesel Generators (Dec. 2001-Nov. 2002)
189,240 19,160 (8.841) 175,519 TOTAL(Average) 35,400 3,662 (9.658)
Month860kVA 608 kVA 320 kVA

- 15 - Nippon Koei / IEEJ Volume 8 Renewable Energy
The Study on Introduction of Renewable Energiesin Rural Areas in MYANMAR
1.2.4 Zi Chaung Accident Record
Power cut by accident or maintenance is listed in the table below.
According to the records above, Unit 2 governor caused unit shutdown for 199 hours and 39 times in a year. The 11 kV line incidents took place for 147 hour and 38 times. Lowering in the water level of Regulating Pond also caused station shutdown. It is recorded that such station shutdown occurred not only in the dry season but also in the rainy season. It was reported due to clogging of rocks and sediments at the Intake Gate.
Nov-01 320 14.11.01 215 14.11.01
Dec-02 320 19.11.01 219 11.12.01
Jan-02 320 23.12.01 222 26.12.01
Feb-02 300 20.1.02 -
Mar-02 260 27.2.02 190 10.3.02
Apr-02 240 21.3.02 -
May-02 260 4.5.02 -
Jun-02 240 18.5.02 197 29.5.02
Jul-02 240 22.6.02 219 14.7.02
Aug-02 60 8.8.02 - 220 14.8.02
Sep-02 330 15.9.02 - 219 31.8.02
Oct-02 330 1.10.02 - 212 20.9.02
Nov-02 - 240 26.10.02 200 23.10.02Source: U Kyee Nyo (306411), MEPE, Kalaymyo
Date RemarksPeak
Power(kW)
PeakPower(kW)
PeakPower(kW)
Month Date Date
Monthly Peak Power Generated by Three Diesel Engines in Kalaymyo(from November 2001 to November 2002)
860kVA 608kVA 320 KVA
In February, April, March 2002, 320kVAis repaired for bush and engine oil sealfrom turbo charger was not good.
608 kVA is repaired for grinding andpolishing for No.3 crank shaft fromAugust to October 2002.
860kVA is repaired about liner and pistonring 6 sets within July and August 2002 atMandalay.
860 kVA is repaired again because ofsome cracks at main bearing at November2002.

- 16 - Nippon Koei / IEEJ Volume 8 Renewable Energy
The Study on Introduction of Renewable Energiesin Rural Areas in MYANMAR
The detailed information of the causes is shown in below table.
No. Causenos. of
power cuthours of
power cut Monthnos. of
power cuthours of
power cutby Accident Dec.2001 3 5
1 Governor frequency error (No.2) 39 199 Jan. 2002 10 232 11 kVA line drop 38 147 Feb. 6 133 Low water level 14 79 Mar. 12 1004 frequency trouble 3 44 Apr. 8 42
5Low air pressure of governor(No.2) 2 18 May. 12 42
6 Crack in turbine body (No.1) 2 9 Jun. 13 287 Transformer related accident 2 4 Jul. 17 778 Other accident 2 6 Aug. 13 66
by Maintenance Sep. 17 1159 11 kVA line maintenance 5 13 Oct. 2 2
10 Carbon brush change 5 7 Nov. 11 3211 Other maintenance 2 2 TOTAL 124 54512 No record 10 17
TOTAL 124 545
Power Cut in Zi Chaung PS in Dec 2001-Nov 2002 Monthly Power Cut

- 17 - Nippon Koei / IEEJ Volume 8 Renewable Energy
The Study on Introduction of Renewable Energiesin Rural Areas in MYANMAR
No. Date from tostophours Detail No. Date from to
stophours Detail
1 23.12.2001 15:00 16:00 1 11 kVA line drop 65 06.07 9:00 11:00 2 11 kVA line maintenance2 27.12.2001 15:00 17:00 2 Governor (No.2) frequency error 66 07.07 6:00 9:00 3 Governor (No.2) frequency error3 29.12.2001 10:00 12:00 2 Governor (No.2) frequency error 67 16:00 17:00 1 Governor (No.2) frequency error
Dec total 3 times 5 hours 68 08.07 3:00 4:00 1 11 kVA line drop4 08.01.2002 20:00 21:00 1 Governor (No.2) frequency error 69 09.07 0:00 7:00 8 11 kVA line drop5 11.01 13:00 15:00 2 Excitation cable connection loose 70 10.07 21:00 8:00+1 11 Low water level6 13.01 6:00 7:00 1 Governor (No.2) frequency error 71 13.07 13:00 17:00 4 11 kVA line maintenance7 8:00 10:00 8 Governor (No.2) frequency error 72 20:00 10:00+1 14 Governor (No.2) frequency error8 18.01 11:00 13:00 2 Governor (No.2) frequency error 73 14.07 19:00 9:00+1 14 Governor (No.2) frequency error9 15:00 16:00 1 Governor (No.2) frequency error 74 17.07 15:00 17:00 2 Governor (No.2) frequency error
10 20.01 13:00 15:00 2 11 kVA line drop 75 18.07 10:00 13:00 3 11 kVA line drop11 17:00 18:00 1 11 kVA line drop 76 19.07 15:00 16:00 1 11 kVA line drop12 26.01 15:00 19:00 4 Cable connection of energy meter 77 22.07 22:00 0:00 2 11 kVA line drop13 27.01 12:00 13:00 1 11 kVA line drop 78 23.07 8:00 10:00 2 Governor (No.2) frequency error
Jan. total 10 times 23 hours 79 11:00 13:00 2 11 kVA line drop14 02.02 9:00 10:00 1 Governor (No.2) frequency error 80 24.07 17:00 20:00 3 Carbon brush change (No.1)15 03.02 7:00 11:00 4 Governor (No.2) frequency error 81 25.07 4:00 8:00 4 no record16 04.02 13:00 16:00 3 Low water level Jul. total 17 times 77 hours17 08.02 7:00 8:00 1 Governor (No.2) frequency error 82 02.08 5:00 11:00 6 11 kVA line drop18 14.02 19:00 20:00 1 Low water level 83 05.08 8:00 10:00 2 11 kVA line maintenance19 21.02 24:00 3:00+1 3 Governor (No.2) frequency error 84 14.08 11:00 14:00 3 Crack in turbine body (No.1)
Feb. total 6 times 13 hours 85 16:00 18:00 2 11 kVA line drop20 07.03 12:00 13:00 1 11 kVA line drop 86 21:00 22:00 1 no record21 09.03 22:00 23:00 1 Low water level 87 15.08 2:00 13:00 11 Low water level22 11.03 12:00 13:00 1 11 kVA line drop 88 16.08 4:00 14:00 10 Cirquit breaker parts change23 13.03 21:00 23:00 2 Low water level 89 18:00 20:00 2 no record24 18.03 8:00 17:00+2 58 Governor (No.2) frequency error 90 18.08 23:00 14:00 16 11 kVA line drop25 20:00 21:00 1 Governor (No.2) frequency error 91 19.08 22:00 05:00+1 7 Governor (No.2) frequency error26 21.03 6:00 13:00 7 Low water level 92 20.08 12:00 15:00 3 Low water level27 25.03 3:00 8:00 5 11 kVA line drop 93 23.08 17:00 18:00 1 Excitation cable maintenance (No.1)28 12:00 14:00 2 11 kVA line drop 94 29.08 1:00 3:00 2 Low air pressure of governor (No.2)29 27.03 20:00 12:00+1 16 11 kVA line drop Aug. total 13 times 66 hours
30 28.03 20:00 21:00 1 11 kVA line drop 95 01.09 23:00 24:00+1 26Governor maintenance of pipe cleaning(No.1)
31 29.03 7:00 12:00 5 Governor (No.2) frequency error 96 02.09 19:00 21:00 2 Governor (No.2) frequency errorMar. total 12 times 100 hours 97 03.09 17:00 19:00 2 11 kVA line drop (target relay)
32 02.04 18:00 20:00 2Transformer alley break down inKalaymyo MEPE 98 05.09 1:00 3:00 2 Excitation cable cleaning (No.1)
33 04.04 20:00 21:00 1 Governor (No.2) frequency error 99 13:00 14:00 1 11 kVA line drop34 06.04 10:00 11:00 1 Carbon brush change (No.2) 100 15:00 21:00+1 31 11 kVA line drop35 08.04 18:00 10:00+1 16 Low governor air pressure (No.2) 101 07.09 10:00 12:00 2 11 kVA line drop36 10.04 15:00 16:00 1 Governor (No.2) frequency error 102 08.09 7:00 10:00 3 Governor (No.2) frequency error37 13.04 9:00 12:00 3 11 kVA line maintenance in 103 09.09 12:00 13:00+1 13 Governor (No.2) frequency error38 18.04 0:00 10:00 10 Low water level 104 12.09 11:00 17:00 6 Crack in turbine body (No.1)39 30.04 9:00 17:00 8 11 kVA line drop 105 13.09 15:00 18:00 3 no record
Apr. total 8 times 42 hours 106 14.09 5:00 8:00 3 no record
40 01.05 7:00 13:00 6 11 kVA line drop 107 19.09 23:00 8:00+1 9Low water level, rocks stuffed in intakewair
41 15:00 18:00 3 Low water level 108 20.09 12:00 20:00 8Low water level, rocks stuffed in intakewair
42 13.05 12:00 13:00 1 Low water level 109 21.09 10:00 11:00 1 no record43 14.05 23:00 8:00+1 9 Governor (No.2) frequency error 110 24.09 8:00 10:00 2 11 kVA line drop44 16.05 23:00 8:00+1 9 Low water level 111 27.09 20:00 21:00 1 11 kVA line drop45 17.05 7:00 11:00 4 Governor (No.2) frequency error 112 Sep. total 17 times 115 hours46 20.05 18:00 19:00 1 11 kVA line drop 113 27.10 11:00 12:00 1 Carbon brush change in No.2 turbine47 21.05 11:00 12:00 1 11 kVA line drop 114 16:00 17:00 1 Carbon brush change in No.2 turbine
48 22.05 14:00 16:00 2Transformer connection replace inKalaymyo 115 Oct. total 2 times 2 hours
49 23.05 18:00 20:00 2 11 kVA line drop 116 06.11 16:00 18:00 2 11 kVA line drop50 24.05 13:00 15:00 3 11 kVA line drop 117 11.11 12:00 17:00 5 Governor (No.2) frequency error51 27.05 18:00 19:00 1 11 kVA line drop 118 13.11 16:00 18:00 2 Governor (No.2) frequency error
May. total 12 times 42 hours 119 14.11 14:00 20:00 6 Governor (No.2) oil pump change52 04.06 17:00 18:00 1 Governor (No.2) frequency error 120 17.11 6:00 7:00 1 Governor (No.2) frequency error53 05.06 16:00 19:00 3 11 kVA line drop 121 10:00 11:00 1 Gorvenor (No.2) open limit rope break
Record of Accidental and Maintenance Power Cut in Dec 2001 - Nov 2002Record of Station Shutdown in Dec 2001-Nov 2002
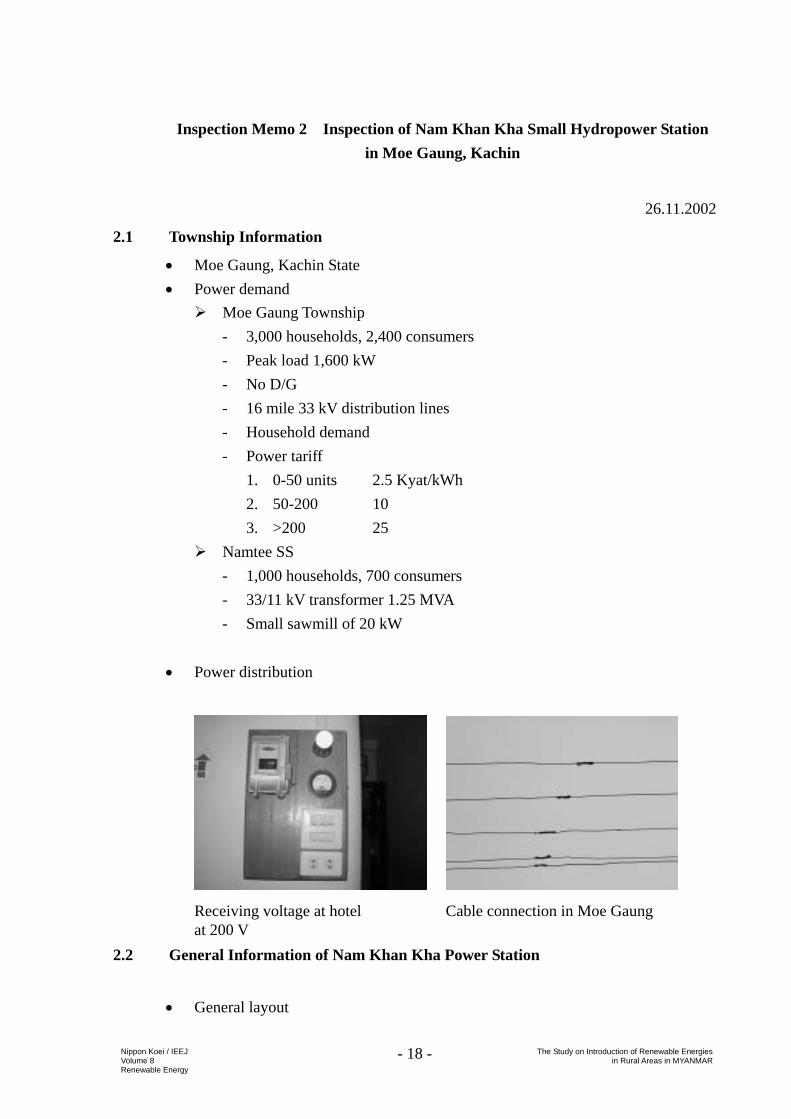
- 18 - Nippon Koei / IEEJ Volume 8 Renewable Energy
The Study on Introduction of Renewable Energiesin Rural Areas in MYANMAR
Inspection Memo 2 Inspection of Nam Khan Kha Small Hydropower Station in Moe Gaung, Kachin
26.11.2002
2.1 Township Information
• Moe Gaung, Kachin State • Power demand
Moe Gaung Township - 3,000 households, 2,400 consumers - Peak load 1,600 kW - No D/G - 16 mile 33 kV distribution lines - Household demand - Power tariff
1. 0-50 units 2.5 Kyat/kWh 2. 50-200 10 3. >200 25
Namtee SS - 1,000 households, 700 consumers - 33/11 kV transformer 1.25 MVA - Small sawmill of 20 kW
• Power distribution
Receiving voltage at hotel Cable connection in Moe Gaung at 200 V
2.2 General Information of Nam Khan Kha Power Station
• General layout

- 19 - Nippon Koei / IEEJ Volume 8 Renewable Energy
The Study on Introduction of Renewable Energiesin Rural Areas in MYANMAR
Nam Khan Kha Powerhouse Upstream view of the Nam Khan Kha
Location : 22 km from Mogaung, 30 km west of Myitkyina, Kachin State
Commissioning : Sep. 1996 Output : 1,250 kW x 4 units = 5,000 kW Head : 128 m Discharge : Q = 5.3 m3/sec Penstock : D1.52m x L335m, D1.30m x L31m Turbine : Francis type with horizontal shaft, made in China Transmission line : 33 kV line to Mogaung via Nam Ti for power supply to
3,000 h.h.
Pondage Pondage and approach channel
De-silting basin De-silting basin

- 20 - Nippon Koei / IEEJ Volume 8 Renewable Energy
The Study on Introduction of Renewable Energiesin Rural Areas in MYANMAR
• Generating equipment There are no other generators in the grid. 1,250 kW x 4 units = 5,000 kW Horizontal axis Francis Commissioned in September 1996 Penstock D5’ x L1,130’ and D4.25’ x L103’ = 1,203’ in total Hd = 420’ Q = 47.5 cusec/turbine Generator output is 11 kV and is sent to Namtee and Moegaung by 33 kV
line. Penstock presented black color. One penstock feeds four turbines. Nam Khan Kha Namtee SS Moegaung SS by 33 kV line Operators 34 including ones at power station, 16 persons per shift x 2 shifts 24 hour generation in the 7 months from June to December 3 hour peak operation in the 5 months from January to May.
Generator floor Single line diagram
Control of thiristor Damaged board of Thyristor controller

- 21 - Nippon Koei / IEEJ Volume 8 Renewable Energy
The Study on Introduction of Renewable Energiesin Rural Areas in MYANMAR
Damaged board of Thyristor controller
Inlet valve, locked at full open Inlet valve removed for maintenance position
Hydraulic for valve operation
Cooling pipe that broke and watered Burnt coils replaced by operators stator coil with spare coils

- 22 - Nippon Koei / IEEJ Volume 8 Renewable Energy
The Study on Introduction of Renewable Energiesin Rural Areas in MYANMAR
Plates of the equipments
2.3 Particular Information of Nam Khan Kha Power Station
• Conditions of generating units Two units (Nos. 1 and 2) were ready for operation both on 10 March 2001
and 26 November 2002. Inlet valve of No. 4 unit was removed at the two inspections above. Turbine casing was significantly rusted when inspected on 10 March 2001
and was repainted on 26 November 2002. The governor of only No. 3 unit was in operational condition while the
Synchronous Generator
Type : SFW1250-6/1430 No. 65-1
Output : 1,250 kW Phase : 3 Winding : Y
Voltage : 11,000 V Current : 82 A
Rotation : 1000 rpm Frequency : 50 Hz
Raway Speed : 1900 rpm Power Factor :
0.8
Excitation Voltage : 52.9 V, Current : 273 A
Excitation System : SCR
Tech Conditions : 6B7894-87
Weight : 12365 kg
Power Transformer
Type : S10-3150/33VA Standard : DB831-91
Capacity: 3150 kVA Phase : 3
Type of Cooling : Onan Service Condition : outdoor
Connection Symbol : YN.oll H V winding L V winding Impedance
Voltage Tappin
g Positio
n V A V A
1 34650 2 33825 3 33000 55.1 11000 165.3 6.86 4 32175 5 31530
LL 200 AC 85/Ll75AC35 S/N : 1164
Untanking mass : 4550 kg, Mass of oil : 2325 kg
Total mass : 8695 kg
Symbol of the product 1TB/710/427.1
Year: 1995 06
Feiling Type Automatic Governor
Type : YDT-600 No. 95-054
Rated Oil Pressure : 2.5 MPa
Pressure Oil Pot Volume : 180 L
Work Capacity : 6600 Nm
Date : 1995 06
天津市水電控制設各所
Tianjing City Hydroelectric Control
Equipment Works
Break Panel
No. 033
Type ZM-01 220 V 117 kg
Air Pressure : 0.7 MPa
Temp : 100 ℃
Date : 1995 10
中国雲南玉渓麦欣電器開関場
Yuxi Machine Electric Switch Factory
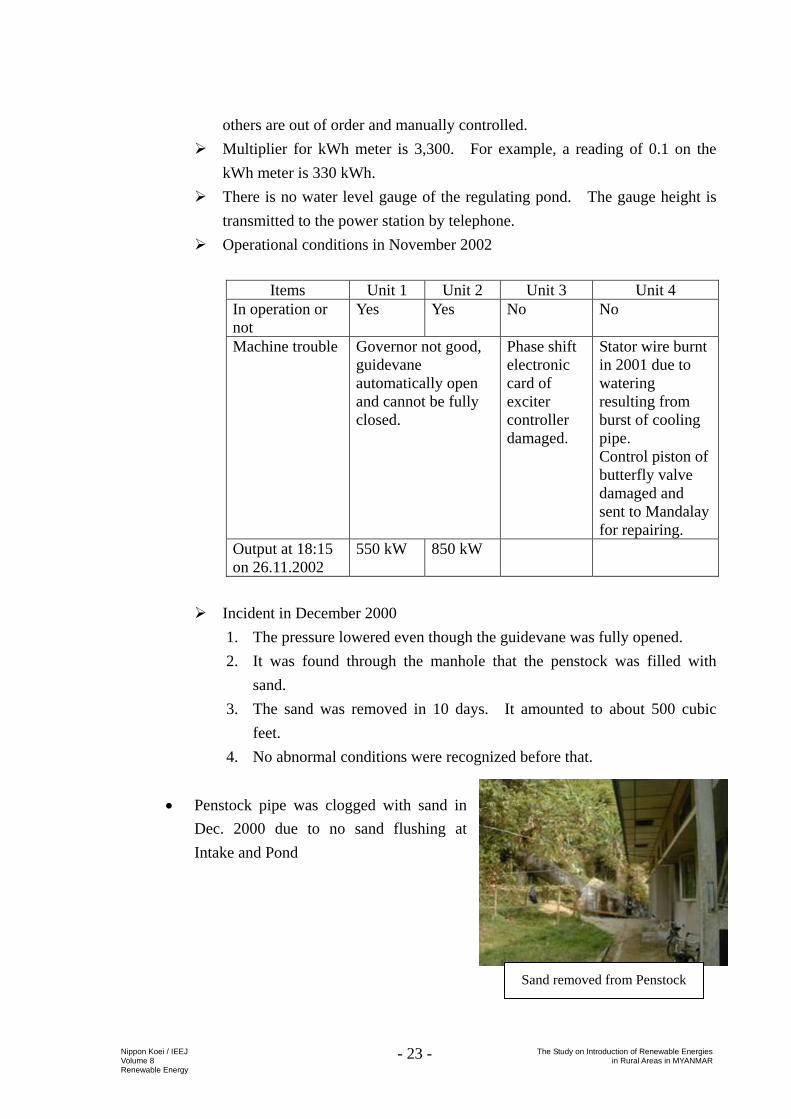
- 23 - Nippon Koei / IEEJ Volume 8 Renewable Energy
The Study on Introduction of Renewable Energiesin Rural Areas in MYANMAR
others are out of order and manually controlled. Multiplier for kWh meter is 3,300. For example, a reading of 0.1 on the
kWh meter is 330 kWh. There is no water level gauge of the regulating pond. The gauge height is
transmitted to the power station by telephone. Operational conditions in November 2002
Items Unit 1 Unit 2 Unit 3 Unit 4
In operation or not
Yes Yes No No
Machine trouble Governor not good, guidevane automatically open and cannot be fully closed.
Phase shift electronic card of exciter controller damaged.
Stator wire burnt in 2001 due to watering resulting from burst of cooling pipe. Control piston of butterfly valve damaged and sent to Mandalay for repairing.
Output at 18:15 on 26.11.2002
550 kW 850 kW
Incident in December 2000
1. The pressure lowered even though the guidevane was fully opened. 2. It was found through the manhole that the penstock was filled with
sand. 3. The sand was removed in 10 days. It amounted to about 500 cubic
feet. 4. No abnormal conditions were recognized before that.
• Penstock pipe was clogged with sand in
Dec. 2000 due to no sand flushing at Intake and Pond
Sand removed from Penstock

- 24 - Nippon Koei / IEEJ Volume 8 Renewable Energy
The Study on Introduction of Renewable Energiesin Rural Areas in MYANMAR
2.4 Issues
• Waterway Complex De-silting basin is provided at the downstream end of the headrace channel,
but it appears that the velocity in the basin is not low enough to settle sand and silt included in the flow. In addition, the flow including sand is being conveyed through the approach channel directly to the inlet of penstock, since the approach channel and the pondage is separated by the concrete wall. Accordingly, sand/silt is likely to enter the penstock when sand trap is not made efficiently in the de-silting basin. To improve this situation, the following measures are recommended: 1) Hydraulic analysis is to be carried out to clarify the flow conditions such
as water surface profile, velocity, and sand-settling function based on the completion drawings.
2) Structural renovations may be required to minimize the sand inflow at the intake, and to settle the sand included in the flow at the de-silting basin according to the flow characteristics.
3) Periodical sand flushing operation both at the intake and the de-silting basin is essential to minimize the sand/silt inflow into the penstock, for which the maintenance and operation manual should be prepared properly and the training of operational staff is required. The completion drawings as well as O&M manual needs to be provided at the site office.
Water level gauge at the pondage is indispensable for peak power operation in a dry season to utilize the storage as efficiently as possible.
• Generating equipment and transmission lines
Nam Khan Kha Power Station with 5,000 kW is operated as an isolated power system to supply the electricity to Moe Gaung Township only with the electricity demand of 1,600 kW. While the electric power is insufficient in Myitkyina, the capital of Kachin State, the load shedding is inevitable until the completion of Mali and Nam Tabet Power Stations. Myitkyina grid system including Nam Khan Kha Power Station will contribute not only to the stable power supply to this area, but also to the fuel saving for the diesel generators operated in Myitkyina.